Differential Gene Expression in the Activation and Maturation of Human Monocytes
8
Differential Gene Expression in the Activation and Maturation of Human Monocytes 1 Ana Rouzaut, Natalia Lo ´pez-Moratalla, and Carlos de Miguel 2 Departamento de Bioquı ´mica y Biologı´a Molecular, Universidad de Navarra, Apartado Postal 177, 31080 Pamplona, Spain Differential-display or RNA fingerprint was applied to identify genes differentially expressed in monocyte maturation induced by an immunomodulating peptide on human peripheral blood mononuclear cells. Two unknown sequences (06c22 and 06c71) and p21 protein (cyclin dependent kinase inhibitor) were repressed, and three genes activated: Cathepsin D, DRP2 (dihy- dropirimidinase related protein 2), and gp91phox (91- kDa subunit of citochrome b 558 ). Phenotype of evolving monocytes was analyzed by flow cytometry and mRNA level of identified genes determined by reverse tran- scription-PCR. The expression pattern of identified genes seemed to correlate with different monocyte subsets, monocyte-derived cells, and expected func- tional changes. After peptide addition, immature monocytes were initially activated, increasing the ex- pression of CD25, CD69, and HLA-DR markers. This was accompanied by repression of p21 and the two unknown sequences, along with the simultaneous ac- tivation of Cathepsin D and DRP2. Later, the differen- tiation marker CD16 rose, and gp91phox gene expres- sion activated. Further maturation led certain mono- cytes to express marker CD23 and gp91phox expression to reach a maximum, while Cathepsin D and DRP2 dropped to preactivation levels. Results re- flect part of the evolution of immature monocytes to- ward macrophages and monocyte-derived dendritic cell precursors. © 2000 Academic Press Key Words: differential display; human monocytes; cathepsin D; DRP2; gp91phox; p21. Human peripheral blood monocytes (MO) 3 present a wide heterogeneity (1). The existence of two well defined subsets has been detected by the analysis of surface markers; the majority of MO exhibit strong CD14 expres- sion and are CD16-negative cells (CD14 21 CD16 2 ), whereas the more mature CD14 1 CD16 1 small MO are less abundant and express high levels of HLA-II mole- cules, thus possibly becoming potent antigen-presenting cells (APC) (2). MO have been described as precursors of macrophages (MF) and MO-derived dendritic cells (MDDC), and all cell types retain the ability to convert to the other during the maturation and differentiation pro- cess (3). A type of dendritic cell (DC) can arise from the differentiation of MO (4) or by the proliferation of progen- itors of haematopoietic precursors (5) when cultured in the presence of appropriate cytokines. DC play an impor- tant role in the control of immunity, and progenitors of two types of DC have been identified, both coexpressing high levels of HLA class II molecules (6): the MDDC, linked to the MO lineage and involved in the initiation of immune humoral responses, and the Langerhans cell type of DC that might be participating in cellular re- sponses. Changes in the maturation process of MO have been related to the development of several autoimmune disorders (7, 8) and DC have been involved in some of them, such as rheumatoid arthritis (9). DCs, possibly the most important APC, have been subjected to studies an- alyzing specific gene expression with the idea of defining their function (10). The present work is focused on MO maturation and changes in gene expression associated with that pro- cess. We have previously described that certain pep- 1 This work was supported by Comision Interministerial de Cien- cia y Tecnologı ´a (CICYT), Spain, Grant SAF 97-0233, and “Funda- cio ´n Echebano,” Spain. 2 To whom correspondence should be addressed. Fax: 34 948 425649. E-mail: [email protected]. 3 Abbreviations used: MO, monocyte; APC, antigen presenting cell; MF, macrophage; MDDC, monocyte-derived dendritic cells; DC, den- dritic cells; PBMC, peripheral blood mononuclear cells; iNOS, induc- ible NO synthase; RT, reverse transcription; DRP2, dihydropirimidi- nase-related protein 2; FITC, fluorescein isothiocyanate; PE, phyco- erythrin; SSCP, single strand conformation polymorphism; OD, optical density; LPS, lipopolysaccharide; IL, interleukin; IFN, inter- feron; TNF, tumor necrosis factor; GM-CSF, granulocyte macro- phage-colony stimulating factor. 0003-9861/00 $35.00 153 Copyright © 2000 by Academic Press All rights of reproduction in any form reserved. Archives of Biochemistry and Biophysics Vol. 374, No. 2, February 15, pp. 153–160, 2000 doi:10.1006/abbi.1999.1587, available online at http://www.idealibrary.com on
Transcript of Differential Gene Expression in the Activation and Maturation of Human Monocytes

Archives of Biochemistry and BiophysicsVol. 374, No. 2, February 15, pp. 153–160, 2000doi:10.1006/abbi.1999.1587, available online at http://www.idealibrary.com on
Differential Gene Expression in the Activation andMaturation of Human Monocytes1
Ana Rouzaut, Natalia Lopez-Moratalla, and Carlos de Miguel2
Departamento de Bioquımica y Biologıa Molecular, Universidad de Navarra, Apartado Postal 177,31080 Pamplona, Spain
w
Differential-display or RNA fingerprint was appliedto identify genes differentially expressed in monocytematuration induced by an immunomodulating peptideon human peripheral blood mononuclear cells. Twounknown sequences (06c22 and 06c71) and p21 protein(cyclin dependent kinase inhibitor) were repressed,and three genes activated: Cathepsin D, DRP2 (dihy-dropirimidinase related protein 2), and gp91phox (91-kDa subunit of citochrome b558). Phenotype of evolvingmonocytes was analyzed by flow cytometry and mRNAlevel of identified genes determined by reverse tran-scription-PCR. The expression pattern of identifiedgenes seemed to correlate with different monocytesubsets, monocyte-derived cells, and expected func-tional changes. After peptide addition, immaturemonocytes were initially activated, increasing the ex-pression of CD25, CD69, and HLA-DR markers. Thiswas accompanied by repression of p21 and the twounknown sequences, along with the simultaneous ac-tivation of Cathepsin D and DRP2. Later, the differen-tiation marker CD16 rose, and gp91phox gene expres-sion activated. Further maturation led certain mono-cytes to express marker CD23 and gp91phoxexpression to reach a maximum, while Cathepsin Dand DRP2 dropped to preactivation levels. Results re-flect part of the evolution of immature monocytes to-ward macrophages and monocyte-derived dendriticcell precursors. © 2000 Academic Press
Key Words: differential display; human monocytes;cathepsin D; DRP2; gp91phox; p21.
1 This work was supported by Comision Interministerial de Cien-cia y Tecnologıa (CICYT), Spain, Grant SAF 97-0233, and “Funda-cion Echebano,” Spain.
2
To whom correspondence should be addressed. Fax: 34 948425649. E-mail: [email protected].0003-9861/00 $35.00Copyright © 2000 by Academic PressAll rights of reproduction in any form reserved.
Human peripheral blood monocytes (MO)3 present awide heterogeneity (1). The existence of two well definedsubsets has been detected by the analysis of surfacemarkers; the majority of MO exhibit strong CD14 expres-sion and are CD16-negative cells (CD1421CD162),
hereas the more mature CD141CD161 small MO areless abundant and express high levels of HLA-II mole-cules, thus possibly becoming potent antigen-presentingcells (APC) (2). MO have been described as precursors ofmacrophages (MF) and MO-derived dendritic cells(MDDC), and all cell types retain the ability to convert tothe other during the maturation and differentiation pro-cess (3). A type of dendritic cell (DC) can arise from thedifferentiation of MO (4) or by the proliferation of progen-itors of haematopoietic precursors (5) when cultured inthe presence of appropriate cytokines. DC play an impor-tant role in the control of immunity, and progenitors oftwo types of DC have been identified, both coexpressinghigh levels of HLA class II molecules (6): the MDDC,linked to the MO lineage and involved in the initiation ofimmune humoral responses, and the Langerhans celltype of DC that might be participating in cellular re-sponses. Changes in the maturation process of MO havebeen related to the development of several autoimmunedisorders (7, 8) and DC have been involved in some ofthem, such as rheumatoid arthritis (9). DCs, possibly themost important APC, have been subjected to studies an-alyzing specific gene expression with the idea of definingtheir function (10).
The present work is focused on MO maturation andchanges in gene expression associated with that pro-cess. We have previously described that certain pep-
3 Abbreviations used: MO, monocyte; APC, antigen presenting cell;MF, macrophage; MDDC, monocyte-derived dendritic cells; DC, den-dritic cells; PBMC, peripheral blood mononuclear cells; iNOS, induc-ible NO synthase; RT, reverse transcription; DRP2, dihydropirimidi-nase-related protein 2; FITC, fluorescein isothiocyanate; PE, phyco-erythrin; SSCP, single strand conformation polymorphism; OD,optical density; LPS, lipopolysaccharide; IL, interleukin; IFN, inter-
feron; TNF, tumor necrosis factor; GM-CSF, granulocyte macro-phage-colony stimulating factor.153

mp
(t
t
154 ROUZAUT, LOPEZ-MORATALLA, AND DE MIGUEL
tides, sharing a common structural motif (11–13), in-duce MO activation and differentiation when added toperipheral blood mononuclear cells (PBMC). They areknown to promote the secretion of monokynes, expres-sion of inducible NO synthase (iNOS), (14) and theappearance of a DNase activity associated with gran-ules on mature MO (15). Synthetic peptide Pa (NVL-GAPKKLNESQAV), used in this work, belongs to thisgroup of compounds. It has been shown to interact withthe membranes of MO, starting a phosphoinositidesignaling pathway (16). Furthermore, repeated stimu-lation of cultured PBMC from healthy donors with thispeptide, induces an evolution of the basal MO popula-tion toward subsets similar to those found in freshblood obtained from patients with autoimmune disor-ders, such as Graves’ disease (17) or multiple sclerosis(18). Taking advantage of this system to induce in vitrodifferentiation of MO, we applied to these cells thetechnique called differential display RT-PCR (19) orRNA fingerprint (20), with the idea of identifying genesactivated or repressed during the process, thus possi-bly playing some role in the evolution of MO. At thesame time we monitored phenotypical changes in thecourse of the differentiation, measuring specific surfacemarkers (CD14, CD25, CD69, CD16, and CD23) andHLA-DR expression levels. Data support that therewas a consistent relationship between the phenotype ofthe cells and the expression level of the genes identifiedby RNA fingerprint, p21 protein (cyclin dependent ki-nase inhibitor), Cathepsin D, dihydropirimidinase-re-lated protein 2 (DRP2), gp91phox (91-kDa subunit ofcytochrome b558), as well as two other unknown genes.
The development of specific functions requires regu-lated expression of lineage-specific and ubiquitousgenes; therefore, the molecular characterization of ac-tivation and maturation of MO will undoubtedly con-tribute to a better understanding of immunity mecha-nisms and particularly of how some autoimmune re-sponses are produced.
MATERIALS AND METHODS
Cell culture. PBMC, obtained from healthy donors (21), wereincubated at a concentration of 1 3 106 cells per ml in RPMI-1640
edium supplemented with 10% fetal calf serum, 2 mM L-glutamine,enicillin (100 IU/ml), and streptomycin (100 mg/ml) in a 5% CO2
humidified (95%) atmosphere at 37°C. After 24 h half of the cellswere stimulated by addition of peptide Pa (30 mg per 106 cells) froma solution (30 mg/ml) in a complete medium. A second addition wasperformed 24 h later, and after 5 days of culture nonadherent cellswere removed with the supernatant followed by three washes withPBS. Adherent cells consisting mainly of MO were carefully de-tached by gentle friction, collected by centrifugation, and resus-pended directly in a cell lysis solution to extract the RNA to be usedin the RNA fingerprint technique.
Differential gene expression in the 5 days of culture was followed
by RT-PCR. Isolated PBMC were divided into six samples, incu-bated, and processed to isolate RNA from adherent cells as indicatedau
above. The basal state was determined in cells which had beenprocessed for 4 h. Remaining cells received the first Pa addition after24 h, and a second sample was analyzed 4 h later. The remainingfour samples received a second addition of Pa after 48 h, and a thirdsample was obtained 4 h later. The last three samples were pro-cessed from that moment at 24-h intervals. The phenotypic evolutionof MO was measured by flow cytometry in six parallel samples,where all PBMC were collected and resuspended in PBS containing0.1% sodium azide at a density of 107 cells/ml.
Flow cytometry analysis. Aliquots of 5 3 105 cells from eachsample were incubated in the dark at 4°C for 30 min with monoclonalantibodies from Becton and Dickinson labeled with FITC or PE:anti-CD14 (Leu-M3)–FITC, anti-CD25 (anti-IL-2R)–PE, anti-CD69(Leu-23)–PE, anti-CD16 (Leu-11a)–PE, anti-CD23 (Leu-20)–PE, oranti-HLA-DR–PE. Cells were washed twice with cold PBS contain-ing 0.1% sodium azide, fixed with 1% paraformaldehyde and storedin the dark at 4°C until analysis. Fixed cells (20,000 per sample)were analyzed by two-color flow cytometry with a Becton DickinsonFAC-Scan flow cytometer, and MO were gated according to theirlight scattering properties. Isotype antibodies of irrelevant specific-ity were used as negative control. Specific fluorescence intensityrepresents the difference between the mean channel of the specificantibody and the mean channel of the negative control antibodyexpressed on a logarithmic scale. The percentage of positive cells wascalculated from specific and nonspecific staining.
RNA fingerprint. Total RNA was extracted using the “Total RNAisolation kit” from Biotecx Laboratories, following the instructions,and treated with RNase-free DNase by standard methods (22). ForcDNA synthesis, 2 mg of RNA were heated at 70°C for 3 min, chilledon ice for 2 min, and then incubated at 42°C for 1 h after adding 10U of RNAsin, 1 mM deoxynucleoside triphosphates, 200 U of MMLVreverse transcriptase (Gibco BRL), 100 pmol of random hexamers asprimers, and 4 ml of 53 reverse transcriptase buffer (125 mM Tris–HCl, pH 8.5, 15 mM MgCl2, 325 mM KCl) to give a final volume of 20ml. After incubation the reaction was heat inactivated at 75°C for 5min and cDNA frozen at 220°C until use.
All PCR reactions were carried out in 0.2-ml thin wall tubes withan OmniGene thermal cycler (Hybaid). For random PCR reactionswe used primers included in the Delta RNA fingerprint kit (Clon-tech), which shared a common 16-base sequence at the 59 end (59-ATTAACCCTCACTAAA-) and differed in their last nine 39 nucleo-tides: p5 (-GATCTGACTG-39), p6 (-TGCTGGGTG-39), p7 (-TGCTG-TATG-39), p8 (-TGGAGCTGG-39), p9 (-TGTGGCAGG-39), p10-GCACCGTCC-39). Each reaction was performed in duplicate usingwo dilutions of each cDNA (1:10 and 1:40) in a final volume of 20 ml
containing 1 ml of the cDNA dilution, 2 ml of 103 PCR buffer (100mM Tris–HCl, pH 9.0, 500 mM KCl, 20 mM MgCl2, 1% Triton X-100),50 mM deoxynucleoside triphosphates, 20 pmol of each primer whentwo were used, or 40 pmol if only one was included, and 1 ml of theenzyme mix Advantage Klen Taq Polymerase Mix (Clontech).[a-33P]dATP (1000–3000 Ci/mmol) was also added (50 nM) as radio-active label. Reactions were started with 5 min at 95°C followed bythree low specificity cycles: denaturation (95°C for 2 min), annealing(40°C for 5 min), and extension (68°C for 5 min); and then 22 highspecificity cycles: denaturation (95°C for 1 min), annealing (60°C for1 min), and extension (68°C for 2 min); and finishing with a singleincubation at 68°C for 7 min.
PCR products were resolved in a regular sequencing gel loading 4ml of a (1:1) dilution previously denatured by heating at 95°C for 2min. Gels were vacuum dried at 80°C onto 3MM Whatman paperwithout fixing and exposed to Kodak-X-Omat AR films. Bands se-lected as being differential were cut off and incubated at 95°C for 5min in 40 ml of sterile water to elute the DNA, which was transferredo a clean tube and stored frozen at 220°C until use. Each band was
nalyzed by an SSCP gel after reamplification with the same primerssed in the original reaction, as described by Mathieu-Daude et al.
pdwp
aoDpp
TcSb(wi
pfie
aap
e
n
mslspt
tw
155DIFFERENTIAL GENE EXPRESSION IN HUMAN MONOCYTES
(23). The reamplification reaction was performed in 20 ml containing5 ml of the eluted DNA, 2 ml of 103 PCR buffer (100 mM Tris–HCl,
H 9.0, 500 mM KCl, 20 mM MgCl2, 1% Triton X-100), 200 mMeoxynucleoside triphosphates, 20 pmol of each primer when twoere used, or 40 pmol if only one was included, and 1 unit of DNAolymerase from Thermus brockianus “Dynazyme” (Finnzymes).
[a-33P]dATP (1000–3000 Ci/mmol) was also added (50 nM) as radio-active label. Reactions were started at 95°C for 5 min followed by 20cycles: denaturation (95°C for 1 min), annealing (60°C for 1 min), andextension (72°C for 2 min), ending with a single incubation at 72°Cfor 7 min. Then 10 ml of a (1:20) dilution was loaded in an SSCP gelfter heating for 2 min at 95°C. Gels were dried in a vacuum at 80°Cnto 3MM Whatman paper and exposed to Kodak-X-Omat AR films.NA from bands selected as truly differential was eluted and ream-lified as described above, except that no isotope was added and eachroduct was extracted from agarose gels for cloning.Sequencing analysis. PCR products were cloned into pMOSBlue
-vector (Amersham) and sequenced in an automatic laser fluores-ent apparatus with the Autoread sequencing kit from Pharmacia.equences obtained were compared with those in available data-ases (EMBL, GeneBank, and DDJB) using the algorithm BLASTBasic Local Alignment Search Tool). Search for open reading framesas carried out with the program GeneWorks 2.4 from Intelligenet-
cs.Expression analysis by RT-PCR. Pairs of specific primers were
repared for each of the genes to be studied with sequences derivedrom those obtained previously (Table I). RNA was extracted asndicated above and cDNA was also synthesized, as explained above,xcept that 1 mg of RNA was used. Serial dilutions (1:10 to 1:1000) of
each cDNA sample were prepared, and PCR carried out from eachdilution to select conditions for the amplification to proceed exponen-tially before the plateau is reached; thus there should be a linearrelationship between the quantity of mRNA in the original samplesand the final PCR product (24). A fragment of b-actin mRNA wasmplified in each sample, as an internal normalization standard;nd exponential phase conditions were also determined for this am-lification. All reactions were carried out with 1 ml of each cDNA
dilution and 20 pmol of each specific primer, using the same mixturesas those used in reamplifications made from the SSCP gels. After aninitial 5-min period at 95°C, 30 cycles of denaturation (95°C for 30 s),
TA
Specific Primers Used for th
Gene Sequence
Cathepsin D (s) 59-GCTGGGAGGCAAAGGCCathepsin D (a) 59-ACAGTGGGCGGGCGAGp21 (s) 59-GGGGGCATCATCAAAAAp21 (a) 59-ACTGAAGGGAAAGGACAgp91phox (s) 59-GTAATGAGGAAGAAGGAgp91phox (a) 59-GAAACAATAAACAGAGCDRP2 (s) 59-AGAAGGCTGTAGGAAAGDRP2 (a) 59-AAAAGGAAGGAAGAAAG06c22 (s) 59-GTCCATCTCCAAGTGAA06c22 (a) 59-AGCAACCCAACCAGACA06c22 (s1) 59-TGTAGCCCCAAAGAACC06c22 (a1) 59-GGAGAGCAGCAACCCAA06c71 (s) 59-CTTCACAGTGGGATACA06c71 (a) 59-AAAGCAGGGATAAGAAC
Note. s, sense; a, antisense; T a, annealing temperature. For 06c22
annealing (T a for 45 s), and extension (72°C for 45 s) were performed,ending with a single incubation at 72°C for 5 min. The annealing s
temperature (T a) for each reaction (Table I) was determined from thestimated primers Tm (25). Reactions were loaded on 1% agarose gels
containing 1 mg/ml ethidium bromide and gels were photographedafter electrophoresis. The optical density (OD) of each band wasregistered by densitometric scanning substracting background froman equivalent empty area of the gel picture. The relative amount ofeach mRNA was estimated as the OD value obtained in the selectedexponential phase conditions divided by the OD value obtained forthe b-actin mRNA in the same sample determined also under expo-
ential phase conditions (24).
RESULTS
Identification of Differentially Expressed Genes byRNA Fingerprint
Four PBMC cultures from healthy donors were pre-pared and RNA extracted from isolated MO of the foursamples mixed in an attempt to overcome variabilityamong different individuals. After reverse transcrip-tion four random PCR reactions were performed induplicate from each cDNA preparation. One reactionwas carried out with a single primer (p6), while com-binations of two primers were used for the others:(p5–p6), (p7–p8), and (p9–p10). After analysis of thecorresponding autoradiographs, 36 differential bandswere identified, 18 from stimulated and 18 from controlcells (Fig. 1A). Since each band from an RNA finger-print gel frequently contains more than one product,we analyzed all 36 bands by reamplification and SSCPgels according to Mathieu-Daude et al. (23). This
ethod resolves each band in its components andhows which one is really differentially expressed. Fol-owing the criteria of these authors only 12 bands wereelected. They gave 20 PCR products, since, as ex-ected, some of the bands rendered more than one inhe SSCP gel (Fig. 1B). After cloning, sequencing and
I
mplification of Each Gene
T a (°C) Product (bp)
A-39-39 63 327T-39G-39 59 347A-39
G-39 56 558C-39GTC-39 60 781
C-39-39 59 471CAA-39AGA-39 61 148A-39C-39 56 338
o different pairs were used.
BLE
e A
TACTGCTAGGACTGAAA
AAGCCCCCAATA
earch for homologies in the available databases, it
ttH
156 ROUZAUT, LOPEZ-MORATALLA, AND DE MIGUEL
turned out that five clones were identical to knownsequences, nine were partially homologous (50–90%)to sequences present in the databases, and six showedno homology with anything previously known. Cloneswith unknown sequences not showing an open readingframe were discarded. Clones containing repetitive se-quences were also discarded due to the difficulties inconfirming the results by RT-PCR. Clones too short todesign good specific primers for RT-PCR confirmationwere discarded, except when corresponding to a knowngene, because, if that was the case, primers could bederived from the published sequence. Six clones werefinally selected. Three showed differential expressionin the stimulated cells and thus correspond to genesactivated by the addition of Pa: Cathepsin D, DRP2,and gp91phox. The other three were differentially ex-pressed in control cells and thus correspond to genesrepressed by the addition of Pa: two of them wereunknown sequences (referred to as 06c22 and 06c71),and the third one corresponded to the p21 protein
FIG. 1. (A) Example of an RNA fingerprint gel. C, control; P, Pastimulated. Arrows indicate bands that were cut out and reamplifiedfor further SSCP gel analysis. Equivalent regions in the reciprocaladjacent lanes (asterisks) were also cut out and reamplified forcomparison in the SSCP gel. (B) Example of an SSCP gel. P, ream-plification of a band isolated from a Pa stimulated sample; C, ream-plification of the reciprocal adjacent region from the control sample.Arrows indicate bands cut out and reamplified for cloning and fur-ther characterization.
(cyclin dependent kinase inhibitor).Cb
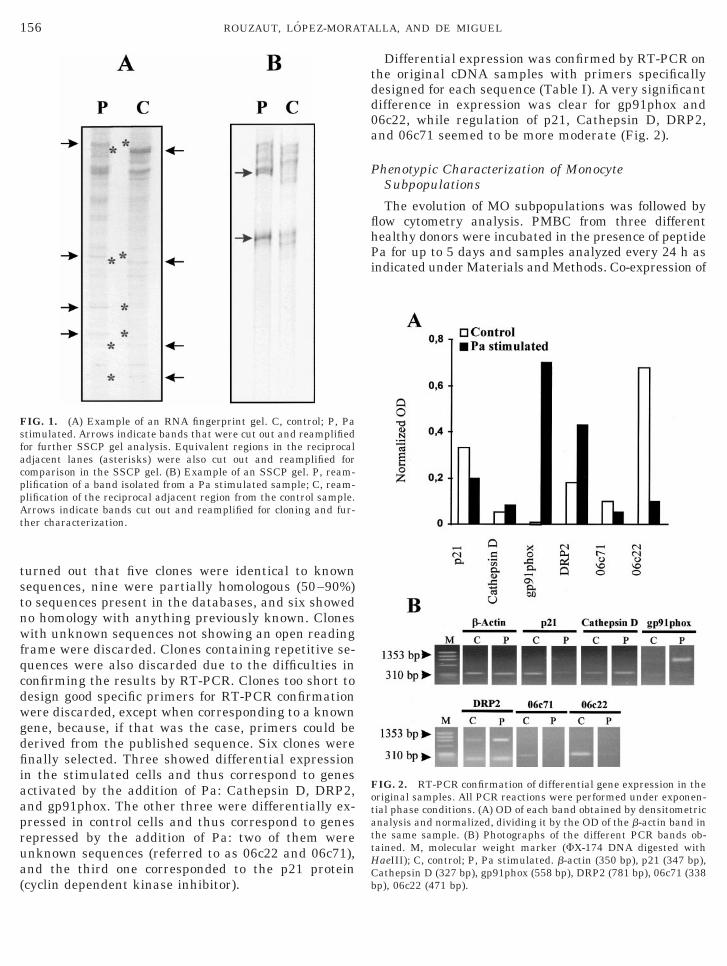
Differential expression was confirmed by RT-PCR onthe original cDNA samples with primers specificallydesigned for each sequence (Table I). A very significantdifference in expression was clear for gp91phox and06c22, while regulation of p21, Cathepsin D, DRP2,and 06c71 seemed to be more moderate (Fig. 2).
Phenotypic Characterization of MonocyteSubpopulations
The evolution of MO subpopulations was followed byflow cytometry analysis. PMBC from three differenthealthy donors were incubated in the presence of peptidePa for up to 5 days and samples analyzed every 24 h asindicated under Materials and Methods. Co-expression of
FIG. 2. RT-PCR confirmation of differential gene expression in theoriginal samples. All PCR reactions were performed under exponen-tial phase conditions. (A) OD of each band obtained by densitometricanalysis and normalized, dividing it by the OD of the b-actin band inhe same sample. (B) Photographs of the different PCR bands ob-ained. M, molecular weight marker (FX-174 DNA digested withaeIII); C, control; P, Pa stimulated. b-actin (350 bp), p21 (347 bp),
athepsin D (327 bp), gp91phox (558 bp), DRP2 (781 bp), 06c71 (338p), 06c22 (471 bp).
pdC
D
fi
eIcfttwtb
tira
157DIFFERENTIAL GENE EXPRESSION IN HUMAN MONOCYTES
CD14 (LPS receptor) together with CD25 (IL-2 receptor),CD69 (signal transducing receptor), CD16 (FcgRIII, low-affinity IgG receptor), CD23 (FceRIII, low-affinity IgEreceptor), or HLA-DR was measured using two-color im-munofluorescence analysis. The proportion of MO (CD14expressing cells) coexpressing each different marker withhigh or low intensity reflected the different subpopula-tions present. Samples were gathered into four differentgroups (A to D) according to their phenotype, which inturn was indicative of the maturation state of the MO.Figures 3A, 3B, 3C, and 3D summarize the results show-ing the percentage of the different MO subsets coexpress-ing HLA-DR, CD25, CD69, CD16, or CD23 in each groupof samples.
The predominant population in the basal nonacti-vated state A (Fig. 3A) expressed a high level of CD14and approximately 50% of CD1421 MO wasCD1421DR1 coexpressing a low level of CD25 andCD69. The number of MO coexpressing CD16 was verylow and those coexpressing CD23 were almost unde-tectable. After incubation in the presence of peptide Pa,five samples, obtained on the second or third day ofculture (state B), presented a phenotype correspondingto activated MO (Fig. 3B). In this case, the predomi-nant subset was CD1421DR21 and the number of cellsexpressing a high level of CD25 and CD69 increased,making the most abundant subsets those with pheno-types CD1421DR21CD2521 and CD1421DR21CD6921. Incontrast, CD16 was present at a low level (CD161), andonly a few CD1421 cells expressed CD23 at a high level(CD2321). In more advanced states of evolution, in-duced by peptide Pa (state C, corresponding to samplestaken after 2–4 days of incubation, and state D, corre-sponding to samples taken after 3–5 days), an increasein the proportion of small MO, expressing low levels ofCD14 and coexpressing CD16, was observed. ThisCD141 subset as well as the large CD1421 MO coex-
ressed a high level of HLA-DR. In state C, the pre-ominant subset was CD1421DR21CD2521CD6921-D161/2CD231/2. However, in state D a considerable
change in MO phenotype took place. In that state largemature MF CD1421DR21CD251CD691CD1621/1CD2321/1
constituted 70–80% of all MO, and the remaining 20–30% were CD141DR21CD161 MDDC precursors, whichdid not express CD25, CD69, or CD23. In summary,the incubation of PBMC, in the presence of Pa, inducedthe evolution of immature MO through an activatedstate toward mature CD1421DR21 MF and CD141/2
DR21 MDDC.
ifferential Gene Expression during the Evolution ofMonocytes
Expression level of the six genes identified by RNA
ngerprinting was analyzed by RT-PCR at different rstages of the 5-day culture on MO obtained from par-allel samples of those used to measure the differentsurface markers. Figure 3 also shows the results ob-tained for the four phenotypic groups described above.In basal state A (Fig. 3A), only the cell cycle inhibitorp21 and the unknown genes 06c71 and 06c22 weresignificantly expressed. These results confirmed thefact that these genes were identified as repressed by Paaddition in the original RNA fingerprint experiment.In the activated state B, these three genes were in factstrongly repressed, while an important induction ofCathepsin D and DRP2 expression (Fig. 3B) also tookplace. This induction was maintained as the cellsreached a more differentiated state (C), where expres-sion of gp91phox was obvious for the first time (Fig.3C). In the final state D, gp91phox level reached itsmaximum, being the only gene with relevant expres-sion, since at this stage Cathepsin D and DRP2 mRNAlevels sharply dropped (Fig. 3D). Thus it was possibleto see how samples of each group, exhibiting a charac-teristic phenotype, had in turn a different expressionlevel for each mRNA.
DISCUSSION
Genes Upregulated in Monocyte Maturation
Cathepsin D is a lysosomal acid protease present inhuman MO (26) and its expression increases uponstimulation with LPS, IFNg (27), and differentiatingagents such as retinoic acid and calcitriol in HL-60cells (28). This enzyme has been related to a variety offunctions, such as protein degradation (29–31), thegeneration of antigenic epitopes by proteolysis of morecomplex molecules (32), and a proteolytic contributionto apoptosis (27). The monocytic enzyme has been in-volved in the pathologic process of active cryoglobuline-mia and associated nephritis via secretion of procathe-psin D in tissues (33) and it has been suggested thatthe inhibition of these proteolytic enzymes in MF mayxacerbate immunosuppression in AIDS patients (34).t seems conceivable that after MO activation, genesoding for processing proteases with a wide range ofunctions, such as Cathepsin D, become activated. Inhis work we found an activation of the expression ofhe Cathepsin D gene after stimulation of PBMC cellsith peptide Pa. This activation was maintained until
he final stages of the differentiation process, when itecame downregulated to pretreatment levels (Fig. 3).DRP2 was initially found in brain and later in other
issues (35), but its function is not well characterized,n spite of being almost identical (98%) to the collapsinesponse mediator protein CRMP-62 (36). Collapsin ismember of the semaphorin family implicated in neu-
onal development, and CRMP-62 stabilizes a complex

158 ROUZAUT, LOPEZ-MORATALLA, AND DE MIGUEL

Sp
B
159DIFFERENTIAL GENE EXPRESSION IN HUMAN MONOCYTES
formed by the collapsin receptor and a G protein, uponcollapsin binding. That triggers a signaling pathway,which causes reorientation of axonal cone growth (37–39). Our results (Fig. 3) show that the DRP2 genefollowed a regulation pattern similar to Cathepsin D,with a low expression on nonstimulated MO (state A).It also increased after activation with the addition ofPa (state B) and kept intense values for some time(state C), probably due to a repeated stimulation by asecond addition of peptide Pa, all this before falling tothe initial level at the end of the process (state D). Wethink that this is the first report describing the pres-ence of DRP2 in cells of the immune system. If weconsider the fact that a molecule called CD100, belong-ing to the semaphorin receptor family, has been re-cently identified in lymphocytes (40), it could be sug-gested that in MO, DRP2 could act as a mediator alonga similar pathway, responding to signals, such as pep-tide Pa, that induce differentiation.
Protein gp91phox, a subunit of cytochrome b558, couldbe related to the production of reactive oxygen andnitrogen intermediates, and mutations in this geneseem to be associated with MF failure to produce anoxidative response in patients with chronic granuloma-tosis disease (41). In this work we observed thatgp91phox expression was activated in MO at the end ofthe maturation process induced by peptide Pa, whencells presented markers associated with cytotoxic prop-erties, such as CD16 and CD23 (Fig. 3). The gp91phoxinduction by Pa, as here reported, is consistent withthe immunomodulating properties already describedfor this peptide, such as the release of TNFa and IFNg(13, 42), since it has been described that gp91phoxexpression is induced in cultured MO by stimulationwith both cytokines (43, 44). The cytotoxic activity (14)and iNOS expression (18) on CD16 positive maturecells induced by Pa also agree with the enhancedgp91phox expression. Finally, it is interesting to notethat Pa does not induce a release of IL-4 (13, 42), sinceit has been described that human MO cultured withGM-CSF and IL-4 differentiate to DCs without super-oxide-generating ability. The low level of cytochromeb558, especially the large subunit, brought about byIL-4, might be precisely what is responsible for the lowsuperoxide-generating ability (45). All these observa-tions taken together suggest that gp91phox may be
FIG. 3. Phenotypic evolution of the MO and RT-PCR analysis of gamples were divided into four groups (A to D) according to their phercentages (6SD) of the different MO subsets (S, small MO; L, larg
of the normalized OD for each band obtained by densitometric analyb-actin band in the same sample. All PCR reactions were performed ua representative PCR product of each gene in each group. M, molecu
2, gp91phox (558 bp); 3, DRP2 (781 bp); 4, Cathepsin D (327 bp); 5, 06c, C, and D.
taken as a marker of almost fully differentiated cyto-toxic MO/MF.
Genes Repressed during Monocyte Maturation
The p21 gene is involved in cell cycle regulationand codes a cyclin dependent kinase inhibitor(CDKI) that blocks the cell cycle in the G1 phase (46).It also inhibits DNA replication, after DNA damage,during the S phase, through its interaction with theproliferative cell nuclear antigen (PCNA) (47). Thestrong repression of p21 after incubation of cells withPa (Fig. 3) indicated the withdrawal of a barrier forcell proliferation, which in turn may be part of theresponse to the stimulation. The high p21 level instate A also indicated a nonproliferative situationappropriate to a resting nonactivated population. Re-pression occurred from early activation (state B) andwas maintained during the whole process, perhapsas part of the release of the cell cycle necessary topermit cell proliferation. The two unknown se-quences (06c71, 06c22) likewise suffered a strongnegative regulation in the process; therefore, eithertheir repression was necessary for maturation ofMO, or their ceasing off occurred in the course ofdifferentiation. The functional significance of the ex-pression of the two unknown sequences in the basalstate A is still unknown. Since they were clearlyrepressed when cells became activated, their repres-sion must be either an important step in or a conse-quence of the activation process. Work on the char-acterization of both genes is now in progress in ourlaboratory.
In summary, we describe differential expression pat-terns for several genes in the course of MO maturationin culture. Whether these differences represent a causeor an effect of the maturation process remains an openquestion, but the variations detected seem consistentwith the phenotypic evolution of MO populations. In arecent study we have reported the differential andreciprocal expression of Arginase II and inducible ni-tric oxide synthase in the same MO maturation processdescribed here, and have shown that there is a corre-lation between mRNA levels and the different states ofmaturation (48).
expression in the 5 days culture after stimulation with peptide Pa.typic characterization. Graphic I in each panel represents the meanO; T, total MO). Graphic II in each panel represent the mean (6SD). Normalization was done dividing each OD value by the OD of theer exponential phase conditions. Photograph III in each panel showsweight marker (FX-174 DNA digested with HaeIII); 1, p21 (347 bp);
eneenoe Msisnd
lar
71 (338 bp); 6, 06c22 (148 bp). n 5 3 for group A; n 5 5 for groups
2
2
2
23
3
3
3
3
3
3
33
3
4
4
4
4
4
4
4
4
4
160 ROUZAUT, LOPEZ-MORATALLA, AND DE MIGUEL
ACKNOWLEDGMENTS
The skillful technical assistance of Mercedes Preciado is gratefullyacknowledged. A. Rouzaut was recipient of a fellowship from Gobi-erno de Navarra, Spain.
REFERENCES
1. van Furth, R. (1982) Immunobiology 161, 178–185.2. Passlick, B., Flieger, D., and Ziegler-Heitbrock, H. W. L. (1989)
Blood 74, 2527–2534.3. Palucka, K. A., Taquet, N., Sanchez-Chapuis, F., and Gluckman,
J. C. (1998) J. Immunol. 160, 4587–4595.4. Zhou, L. J., and Tedder T. F. (1996) Proc. Natl. Acad. Sci. USA
93, 2588–2592.5. Caux, C., Massacrier, C., Vanbervliet, B., Dubois, B., Durand, I.,
Cella, M., Lanzavecchia, A., and Banchereau, J. (1997) Blood 90,1458–1470.
6. Banchereau, J., and Steinman, R. M. (1998) Nature 392, 245–252.
7. Porrini, A. M., and Reder, A. T. (1994) Cell. Immunol. 157,428–438.
8. Jimenez-Lopez, A., Olmos-Martınez, J. M., Garcıa-Palomo, J. D.,De Dios-Martın, B., Pedraz-Garcıa, M. J., and Lorente-Toledano,F. (1982) Allergol. Immunopathol. Madrid 10, 353–359.
9. Thomas, R., and Lipsky, P. E. (1996) Arthritis Rheum 39, 183–190.
10. Marland, G., Hartgers, F. C., Veltkamp, R., Konigswieser, M. F.,Gorman, D., McClanahan, T., Figdor, C. G., and Adema, G. J.(1997) Adv. Exp. Med. Biol. 417, 443–448.
11. Lopez-Moratalla, N., Lopez-Zabalza, M. J., Subira, M. L., Bor-ras-Cuesta, F., Perez Mediavilla, L. A., and Santiago, E. (1994)Biochim. Biophys. Acta 1221, 153–158.
12. Lopez-Moratalla, N., Calonge, M. M., Lopez-Zabalza, M. J.,Perez-Mediavilla, L. A., Subira, M. L., and Santiago, E. (1995)Biochim. Biophys. Acta 1265, 181–188.
13. Lopez-Moratalla, N., Ruiz, E., Lopez-Zabalza, M. J., and San-tiago, E. (1996) Biochim. Biophys. Acta 1317, 183–191.
14. Perez-Mediavilla, L. A., Lopez-Zabalza, M. J., Calonge, M., Mon-tuenga, L., Lopez-Moratalla, N., and Santiago, E. (1995) FEBSLett. 357, 121–124.
15. Pıo, R., Lopez-Zabalza, M. J., Rouzaut, A., Santiago, E., andLopez-Moratalla, N. (1998) Nitric Oxide 2, 165–173.
16. Lopez-Zabalza, M. J., Martınez-Lausın, S., Bengoechea-Alonso,M. T., Lopez-Moratalla, N., Gonzalez, A., and Santiago, E. (1997)Arch. Biochem. Biophys. 338, 136–142.
17. Gonzalez, A., Calleja, A., Santiago, E., de Miguel, C., Lopez-Zabalza, M. J., and Lopez-Moratalla, N. (1998) Int. J. Mol. Med.1, 95–103.
18. Lopez-Moratalla, N., Gonzalez, A., Aymerich, M., Lopez-Zabalza,M. J., Pıo, R., de Castro, P., and Santiago, E. (1997) Nitric Oxide1, 95–104.
19. Liang, P., and Pardee, A. B. (1992) Science 257, 967–971.20. Welsh, J., Chada, K., Dalal, S. S., Cheng, R., Ralph, D., and
McClelland, M. (1992) Nucleic Acids Res. 20, 4965–4970.21. Boyum, A. (1983) Scand. J. Immunol. 17, 429–436.22. Sambrook, J., Fritsch, E. F., and Maniatis, T. (1989) Molecular
Cloning: A Laboratory Manual, Cold Spring Harbor LaboratoryPress, Cold Spring Harbor, NY.
23. Mathieu Daude, F., Cheng, R., Welsh, J., and McClelland, M.(1996) Nucleic Acids Res. 24, 1504–1507.
24. Murphy, L. D., Herzog, C. E., Rudick, J. B., Fojo, A. T., andBates, S. E. (1990) Biochemistry 29, 10351–10356.
25. Itakura, K., Rossi, J. J., and Wallace, R. B. (1984) Annu. Rev.Biochem. 53, 323–356.
6. Bever, C. T. Jr., Morgan, K. D., and Whitaker, J. N. (1989)Inflammation 13, 309–316.
7. Deiss, L. P., Galinka, H., Berissi, H., Cohen, O., and Kimchi, A.(1996) EMBO J. 15, 3861–3870.
8. Atkins, K. B., and Troen, B. R. (1995) Cell Growth Differ. 6,871–877.
9. Schwartz, M. K. (1995) Clin. Chim. Acta 237, 67–78.0. Simon, D. I., Xu, H., and Vaughan, D. E. (1995) Biochim. Bio-
phys. Acta 1268, 143–151.1. Simon, D. I., Ezratty, A. M., and Loscalzo, J. (1994) Biochemistry
33, 6555–6563.2. Chapman, H. A., Riese, R. J., and Shi, G. P. (1997) Annu. Rev.
Physiol. 59, 63–88.3. Roccatello, D., Isidoro, C., Mazzucco, G., Mesiti, A., Quattroc-
chio, G., Amore, A., Molino, A., Coppo, R., Sena, L. M., andPiccoli, G. (1993) Kidney Int. 43, 1150–1155.
4. Bugelski, P. J., Kaplan, J. M., Hart, T. K., Miller, J., Laydon,J. T., Lee, J. C., Dreyer, G. B., and Kirsh, R. (1992) AIDS Res.Hum. Retroviruses 8, 1951–1958.
5. Hamajima, N., Matsuda, K., Sakata, S., Tamaki, N., Sasaki, M.,and Nonaka, M. (1996) Gene 180, 157–163.
6. Goshima, Y., Nakamura, F., Strittmatter, P., and Strittmatter,S. M. (1995) Nature 376, 509–514.
7. Kolodkin, A. L. (1996) Trends Neurosci. 19, 507–513.8. Goshima, Y., Kawakami, T., Hori, H., Sugiyama, Y., Takasawa,
S., Hashimoto, Y., Kagoshima-Maezono, M., Takenaka, T., Misu,Y., and Strittmatter, S. M. (1997) J. Neurobiol. 33, 316–328.
9. Gaetano, C., Matsuo, T., and Thiele, C. J. (1997) J. Biol. Chem.272, 12195–12201.
0. Hall, K. T., Boumsell, L., Schultze, J. L., Boussiotis, V. A.,Dorfman, D. M., Cardoso, A. A., Bensussan, A., Nadler, L. M.,and Freeman, G. J. (1996) Proc. Natl. Acad. Sci. USA 93, 11780–11785.
1. Dinauer, M. C., and Orkin, S. H. (1988) Immunodefic. Rev. 1,55–69.
2. Lopez-Moratalla, N., Migliaccio, M., Lopez-Zabalza, M. J., Perez-Mediavilla, L. A., and Santiago, E. (1994) Biochem. Biophys. Res.Commun. 205, 2008–2012.
3. Newburger, P. E., Dai, Q., and Whitney, C. (1991). J. Biol. Chem.266, 16171–16177.
4. Luo, W., and Skalnik, D. G. (1996) J. Biol. Chem. 271, 23445–23451.
5. Yu, D., Imajoh-Ohmi, S., Akagawa, K., and Kanegasaki, S.(1996) J. Biochem. Tokyo 119, 23–28.
6. Harper, J. W., Adami, G. R., Wei, N., Keyomarsi, K., and Elledge,S. J. (1993) Cell 75, 805–816.
7. Li, R., Waga, S., Hannon, G. J., Beach, D., and Stillman, B.(1994) Nature 371, 534–537.
8. Rouzaut, A., Subira, M. L., De Miguel, C., Domingo-de-Miguel,
E., Gonzalez, A., Santiago, E., and Lopez-Moratalla, N. (1999)Biochim. Biophys. Acta 1451, 319–333.