Differential Calculus - Tecnológico de Monterrey
39
-
Upload
khangminh22 -
Category
Documents
-
view
1 -
download
0
Transcript of Differential Calculus - Tecnológico de Monterrey


Table of Contents Publishing House About the author
Concept Map About this eBook Chapter 1. Functions and their graphs
1.1 Function concept 1.2 Linear functions 1.3 Quadratic functions 1.4 Rational functions 1.5 Trigonometric functions 1.6 Exponential functions 1.7 Logarithmic functions 1.8 Step functions 1.9 Absolute value functions
Chapter 1. Conclusion Chapter 1. Activities Chapter 1. Resources Chapter 2. Algebra in functions
2.1 Basic operations 2.2 Composition of functions
Chapter 2. Conclusion Chapter 2. Activities Chapter 2. Resources Chapter 3. Limits, continuity and their properties
3.1 Definition of limit 3.2 Properties of the limits of a function 3.3 Limits to infinity and infinite limits 3.4 Continuity
Chapter 3. Conclusion Chapter 3. Activities Chapter 3. Resources Chapter 4. Differentiation
4.1 Rate of change and the tangent 4.2 Definition of the derivative of a function 4.3 General derivative rules 4.4 High-order derivatives 4.5 The product and quotient rule
4.6 The chain rule
4.7 Derivatives of trigonometric functions 4.8 Derivatives of exponential and logarithmic functions 4.9 Implicit differentiation
Chapter 4. Conclusion Chapter 4. Activities Chapter 4. Resources Chapter 5. Properties of curves

5.1 Stationary points 5.2 Turning points by the 1st derivative test 5.3 Turning points by the 2nd derivative test 5.4 Curve sketching
Chapter 5. Conclusion Chapter 5. Activities Chapter 5. Resources Chapter 6. Optimization
6.1 Solving method for optimization problems 6.2 Geometry 6.3 Economy
Chapter 6. Conclusion Chapter 6. Activities Chapter 6. Resources Glossary

Publishing House
DIFFERENTIAL CALCULUS
-
MARÍA TERESA HUERTA ESPINO
-
D.R. © Instituto Tecnológico y de Estudios Superiores de Monterrey, México 2013.
Tecnológico de Monterrey presents its first collection of eTextbooks for high school,undergraduate and graduate programs. In each work, our authors combine knowledge and skills,using diverse technologies that support learning. This collection’s main objective I to disseminatethe knowledge and didactic experience of Tecnológico de Monterrey’s faculty through theinnovative use of technology. Moreover, it aims to contribute to the development of a publishingmodel that creatively incorporates the multiple possibilities that digital technologies offer into theeBook format. Tecnológico de Monterrey’s new Digital Publishing House strengthens theinstitution’s entrepreneurial spirit and commitment to technological and educational innovation, thusenhancing students learning.
www.ebookstec.com

About the author
Professor at Tecnológico de Monterrey, Preparatoria Esmeralda del Campus Estado de Méxicosince 2006. She obtained an electronics and communications engineering degree at this sameinstitution. During two years she was part of the TI staff at Daimler-Chrysler, where she workedplanning, maintaining and supporting structural networks in the whole continent.
She obtained a Master in Mechatronics by the FH Ravensburg Weingarten University atGermany, where she worked as an investigation assistant in the Steinbeis TransferZentrum –Weingarten. She collaborated by designing and building corrosion- proof equipment for theMercedes Benz.
She has participated at British Columbia’s summer program for professors in Canada, Colegiode St. George´s math workshop in Argentina and at UDEM’s Physics workshop in Monterrey,México.
She also redesigned the Math and TI courses; coordinate the quality improvement process ofthe multimedia virtual modality. Developed workbooks for Math I, II and III focused in Tecnológico deMonterrey’s high school study programs.
In 2011 she performed as head coach for students’ group “Tec Balam”, who participated at“FIRST Robotics Competition” in Toronto, winning the “Rookie All-Star Award” that celebrates therookie team exemplifying a young but strong partnership effort. Later, this team won the “RookieInspiration Award”, which celebrates a rookie team’s outstanding success in advancing respect andappreciation for engineering, at Saint Louis World Championship.
Nowadays she is part of a project for mobile learning; she develops resources and activities thatsupport the teaching-learning experience with mobile devices.

Concept Map

About this eBook
The main intention of this eBook is to assist student in learning process, throughout the use ofadditional resources and better comprehension of real life applications of Calculus.
The proposed activities aim at promoting and consolidating the use of technical communicationskills and proper mathematical notations.
An auto evaluation section is provided at the end of each chapter, to check whether topic wasproperly understood; that is after going through the explanations and detailed procedures ofvarious problems. It is also important to recall that each chapter contains the sections shown on theFigure 0.1.
The use of Problem-Based Learning methodology helps the student to learn the fundamentalconcepts and rules of differential calculus using an easy mathematical terminology. Some theoremsmay be explained by the use of technological resources that shows how mathematics is a tool forexploring our world.

Chapter 1. Functions and their graphs
In order to explain a specific mathematical behavior, one quantity is described in terms ofanother. To represent this, we can use ordered pairs. These related quantities could berepresented by a function.
In this chapter, we recall the proper use of the function’s notation, domain and range, sketching,transformations and function combinations.
BASIC SKILLS
Practice some of your math skills through the next activity. You can evaluate your skills withthe answer sheet.
Basic skills 1
Basic skills 1 - Answer sheet
GETTING INTO
Introductory activity to the topics on this chapter:
Getting into 1
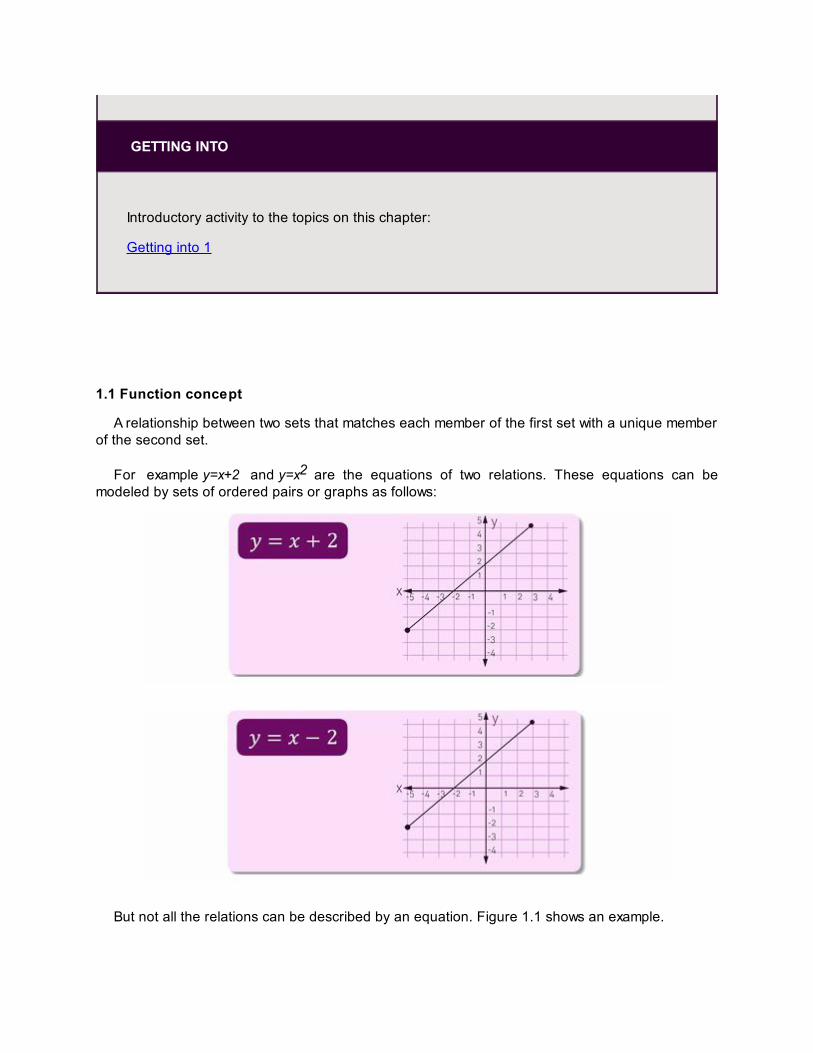
1.1 Function concept
A relationship between two sets that matches each member of the first set with a unique memberof the second set.
For example y=x+2 and y=x2 are the equations of two relations. These equations can bemodeled by sets of ordered pairs or graphs as follows:
But not all the relations can be described by an equation. Figure 1.1 shows an example.

BASIC SKILLS
Function Machine
A funny game for you to practice discovering the function that is used to get a result givena certain input.
The Wolfram Functions Site
This site will let you know a wide variety of functions from the elementary ones to thepolynomials, and even more advanced. In this website you will also find a section to plotfunctions.
1.1.1 Algebraic Test

If a relation is given as an equation, verify that for each x-value, there is one and only onecorresponding y-value. If this is true, the equation is a function, as illustrated in the followingfigures:
1.1.2 Geometric Test
This is also known as “Vertical Line Test”. If a vertical line is drawn on the graph of the relation:
» Is a function if it intersects the graph no more than once.
» Is not a function if one line intersects the graph more than once.

Remember:
» The domain is the set of all x-coordinates of the ordered pairs of a relation.
» The range is the set of all y-coordinates of a relation.
Math functions

Short video with an example on determining if a relation represents a function.
Relations and Functions Problems
A set of 63 problems of relations and functions.
Domain and Range of a Function
Four examples on how to obtain the domain and range of functions.
Domain, Range and Codomain
An article that explains the concept of domain, range and codomain.
Math Functions, Relations, Domain & Range
An article that explains the concepts of function, relation, domain and range. It includessome exercises and interactive examples.
Domain and Range
This video shows an example of stating the domain and range of a relation.
Function Grapher and Calculator
Here you will find a Grapher and Calculator that will help you to plot functions.
What is a function
You will find what is a function.
1.2 Linear functions
An equation is called linear equation if it has no operations other than addition, subtraction, andmultiplication of a variable by a constant. The variable must not be multiplied together or appearin a denominator. Also, a linear equation does not have variables with exponents different thanone. As its name indicates, the graph of a linear equation is a line.
Examples:

Any linear equation can be written in standard form, Ax+By+C=0, where A,B and C area integerswith 1 as a greatest common factor.
The intercept form of a linear equation, x/a+y/b=1, states a as the x-intercept and b as they-intercept.

LINKS
An interactive tutorial on Linear Functions
Linear function Machine
1.2.1 Slope
The slope of a line is a measure of its steepness. Every straight line that is not vertical cuts they-axis at a single point. The y-coordinate of this point is called the y- intercept of the line.
These interceptions depend on the slope.
Given two points passing through (x1,y1) and (x2,y2), we can calculate the slope by:

Additional to this, remember that:

LINKS
Linear function
A tool for you to graph linear functions of the form f(x)=ax+b.
1.2.2 Real-World solved example
The table 1.2.2 shows the approximate percent of students who sent applications to two collegesin various years since 1995.

Step 1. Make a scatter plot and a line of fit, and describe the correlation.
Step 2. Use two ordered pairs to write a predictive equation.
Using (3,18) and (15,13):
Slope:
Using the point-slope form, y−y1=m(x−x1); we get the following equation:
Step 3. Predict the percent of students who will send applications to two colleges in 2020.
Given x as the number of years since 1995 and y the percent of students, we find that:

1.3 Quadratic functions
The graph of a quadratic function is called a parabola. All parabolas have an axis ofsymmetry, a vertex, and a y-intercept. Some parabolas open up, and others open down.
For vertical parabolas, the y-coordinate of the vertex is the maximum value or the minimumvalue of the function. These values represent the greatest or lowest possible value the functioncan reach.

The domain of a quadratic function will always be all real numbers. The range will either be allreal numbers less than or equal to the maximum value or all real numbers greater than or equal tothe minimum value.
LINKS
An interesting intro video to Quadratic Functions.
Quadratic Function Intro Video
A tutorial on quadratic function.
Quadratic Function (General form)
1.3.1 Transformations with quadratic functions
Quadratic equations can be written in vertex form:
y=a(x-h)2+k
Where the vertex of the graph of the equation is at (h,k) and the axis of symmetry is the linex=h.

• The value of kdetermines the graph’s vertical translation.
• The value of h determines the graph’s horizontal translation.
• The value of a determines the direction of opening of the graph and the shape of theparabola.

LINKS
The Product of two Linear Functions Gives a Quadratic Function
An interactive tutorial on quadratic functions from linear functions
Quadratic Function Explorer
A tool that will help you explore the graph of a quadratic function of the form
y=ax2+bx+c

1.4 Rational functions
A rational function has an equation of the form
where a(x)and b(x)are polynomial functions and b(x)≠0
Some graphs of rational functions have breaks in continuity. A break in continuity may appearas:
A rational function has at most one horizontal asymptote:
Case 1: If the degree of a(x) is greater than the degree of b(x), there is no horizontal asymptote.
Case 2: If the degree of a(x) is less than the degree of b(x), the horizontal asymptote is the liney=0.
Case 3: If the degree of a(x) equals the degree of b(x), the horizontal asymptote is the line
Examples
Case 1:

Case 2:
Case 3:


An applet you can use to explore rational functions with slant asymptotes.
Rational Functions with two Vertical Asymptotes
An applet you can use to explore rational functions with two vertical asymptotes.
Rational Functions - Dynamic Visualization
A tool that will let you explore the visualization of a rational function.
1.5 Trigonometric functions
The graphs of sine , cosine and tangent functions have repeating patterns, called cycles. Thehorizontal length of each cycle is its period. For the sine and cosine functions, the period is 2πradians or 360°. For the tangent function, the period is π radians or 180°. For sine and cosinefunctions half the difference between the maximum and minimum value is called the amplitude ofthe graph.


1.5.1 Translations of trigonometric graphs
The graphs of the functions y=αsinb(θ-h)+k, y=αcosb(θ-h)+k, and y=α tanb(θ−h)+k are affectedby changing the values of a,b,h, and k.
To graph a trigonometric function, follow the next steps:
• Determine the vertical shift, and graph the midline.
• Determine the amplitude, if it exists. Use dashed lines to indicate the maximum and minimumvalues of the function.
• Determine the period of the function, and graph the appropriate function.
• Determine the phase shift, and translate the graph accordingly.
1.6 Exponential functions
An equation of the form y=a∙bx, whereb>0, and b ≠ 1is called an exponential function. Thedomain of an exponential function is the set of all real numbers. There are two types ofexponential functions:
Exponential growth, where b>1, and

Exponential decay, where 0<b<1.
The same transformations that have been performed on previously parent functions can beapplied to the graphs of exponential functions.
LINKS
Exponential function
A tutorial on exponential functions
Exponential function
A tutorial on exponential functions with graphics.
A complete lesson from the MIT Open
A complete lesson from the MIT Open Course Ware that explains the concept of theexponential function.

1.7 Logarithmic functions
In general, the inverse of y = bx is x = by, where b is the base and y is referred to as thelogarithm of x. This relationship is usually written as y=logbx, where b>0 andb≠1.
The graph of f(x) =logb x is continuous, one-to-one , and has a domain of all positive realnumbers. The y-axis is a vertical asymptote of the graph.
» Logarithms with a base of 10 are called common logarithms.
» Logarithms with a base of e are called natural logarithms.
LINKS
Logarithm function
An interactive tutorial on logarithmic functions.
Logarithm function
A tutorial on logarithmic functions, it includes graphing, many examples and problems foryou to practice.
Domain and Range of Logarithmic Function
A set of examples on finding the domain and range of logarithmic functions.
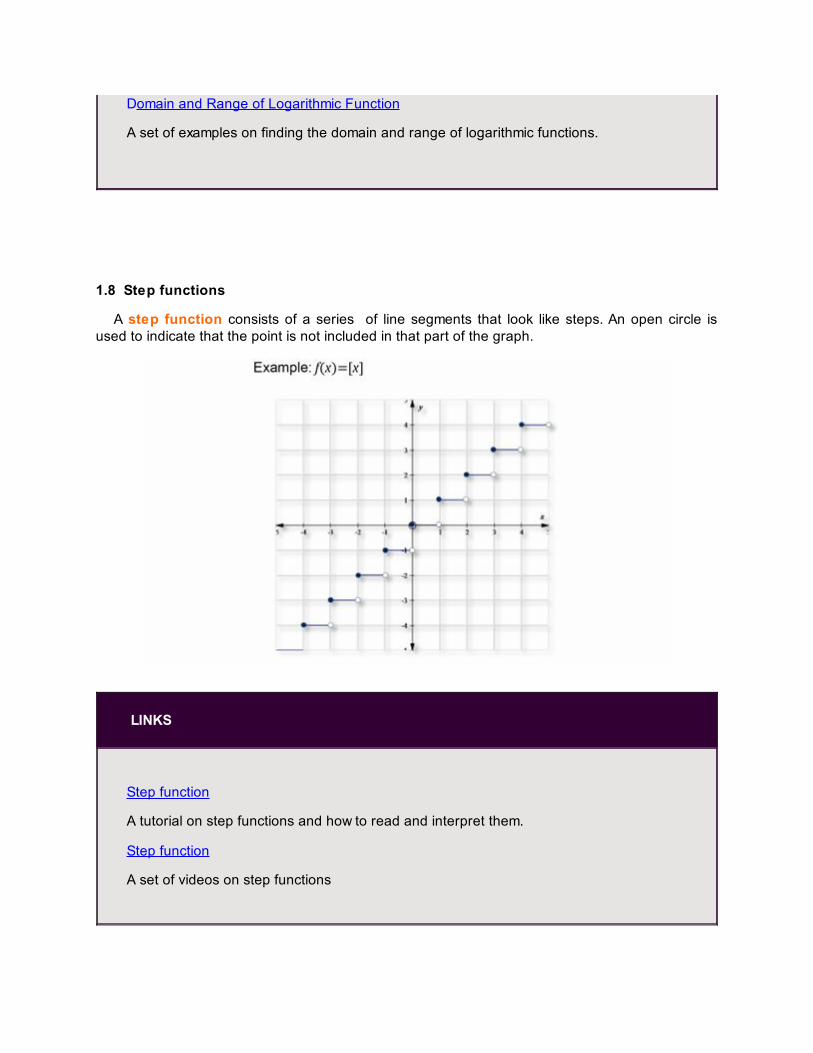
1.8 Step functions
A step function consists of a series of line segments that look like steps. An open circle isused to indicate that the point is not included in that part of the graph.
LINKS
Step function
A tutorial on step functions and how to read and interpret them.
Step function
A set of videos on step functions

1.9 Absolute value functions
An absolute value function is shaped like a V and is made up of portions of two lines.
LINKS
Absolute value function
A tutorial on Absolute Value Functions, it includes an applet to show the graphic of afunction of the formf(x)=ax2+bx+c
Graphing Absolute Value Functions
A tutorial on how to graph absolutevalue functions.
Review the activities at the end of this chapter

Chapter 1. Conclusion

Chapter 1. Activities
Activities
» Activity 1
» Vocabulary 1
» Basic Skills 1
» Getting into 1
» Activity 1. Functions
» Activity 2. Domain and range
» Activity 4. Linear equations
» Activity 5. Writing and graphing linear equations
» Activity 6. Real World problems
» Activity 7. Graphing quadratic functions
» Activity 8. Graphs of quadratic functions
» Activity 9. Graph with no horizontal asymptote
» Activity 10. Oblique asymptote
» Activity 11. Readiness Skills
» Activity 12. Trigonometric functions
» Activity 13. Exponential functions
» Activity 14. Logarithmic functions
» Activity 15. Step and absolute value functions
» On hands 1
Answer Sheets (upon availability)
» Basic Skills 1
» Activity 1. Functions
» Activity 2. Domain and range
» Activity 4. Linear equations
» Activity 5. Writing and graphing linear equations
» Activity 6. Real World problems

» Activity 7. Graphing quadratic functions
» Activity 8. Graphs of quadratic functions
» Activity 9. Graph with no horizontal asymptote
» Activity 10. Oblique asymptote
» Activity 11. Readiness Skills
» Activity 12. Trigonometric functions
» Activity 13. Exponential functions
» Activity 14. Logarithmic functions
» Activity 15. Step and absolute value functions
» On hands 1

Chapter 1. Resources
» The Exponential FunctionA complete lesson from the MIT Open Course Ware that explains the concept of theexponential function.
» Graphical Function ExplorerA function graphing tool to plot up to three functions on the same set of axes.
» Functions A funny game for you to practice discovering the function that is used to get a result given acertain input.
» Finding the Domain and Range of a FunctionAn applet that will let you understand how to find domain and range of functions with graphics.
» Rational Functions with Slant AsymptotesAn applet you can use to explore rational functions with slant asymptotes.
» Rational Functions with two Vertical AsymptotesAn applet you can use to explore rational functions with two vertical asymptotes.
» Domain, Range and CodomainAn article that explains the concept of domain, range and codomain.
» Domain and RangeAn article that explains the concepts of function, relation, domain and range. It includes someexercises and interactive examples.
» What is a Function An article that explains what a function is, it includes many examples that will let youunderstand all the concepts and characteristics of functions.
» Linear Function ExplorerAn easy-to-use applet that will let you explore the graph of a linear function of the form y=ax+b.
» Logarithmic FunctionAn interactive tutorial on logarithmic functions.
» Quadratic Function Intro VideoAn interesting intro video to Quadratic Functions.
» Linear function MachineAn interactive tutorial on Linear Functions.
» The Product of two Linear Functions Gives a QuadraticAn interactive tutorial on quadratic functions from linear functions.

» A Real Life Application of Rational FunctionsAn opportunity for you to apply your knowledge on Rational Functions into a real life problem.
» Rational Functions in the Real World - Lens SculptorsAnother real life problem to be solved using rational functions.
» Applications of Exponential FunctionsApplications and examples of exponential functions in real life.
» Domain and Range of Logarithmic FunctionA set of examples on finding the domain and range of logarithmic functions.
» Step FunctionA set of videos on step functions.
» Linear Functions ProblemsA set of 25 problems on Linear Functions.
» Rational Functions ProblemsA set of 35 problems on Rational Functions.
» Exponential Functions ProblemsA set of 37 problems on Exponential Functions.
» Quadratic Functions ProblemsA set of 39 problems on Quadratic Functions.
» Relations and Functions ProblemsA set of 63 problems of relations and functions.
» Linear FunctionA tool for you to graph linear functions of the form f(x)=ax +b.
» Quadratic Function ExplorerA tool that will help you explore the graph of a quadratic function of the form y = ax2 + bx + c
» Rational Fusnctions - Dynamic VisualizationA tool that will let you explore the visualization of a rational function.
» Absolute Value FunctionsA tutorial on Absolute Value Functions, it includes an applet to show the graphic of a functionof the form f(x) = ax2 + bx + c
» Exponential FunctionA tutorial on exponential functions.
» Exponential FunctionA tutorial on exponential functions with graphics.

» Graphing Absolute Value FunctionsA tutorial on how to graph absolute value functions.
» Graphing Quadratic FunctionsA tutorial on how to graph quadratic functions.
» Logarithmic FunctionA tutorial on logarithmic functions, it includes graphing, many examples and problems for youto practice.
» Rational FunctionA tutorial on Rational Functions. It includes some exercises.
» Step FunctionA tutorial on step functions and how to read and interpret them.
» Quadratic Function (General Form)A tutorial on quadratic function.
» Applications of Exponential Functions Five real life problems to be solved using exponential functions.
» Domain and Range of a FunctionFour examples on how to obtain the domain and range of functions.
» CalculatorHere you will find a Grapher and Calculator that will help you to plot functions.
» Parent FunctionsShort presentation that shows the graphics of different kinds of Parent Functions.
» Math FunctionsShort video with an example on determining if a relation represents a function.
» Functions vs. RelationsThis article explains how to determine if a relation is a function.
» Domain & RangeThis video shows an example of stating the domain and range of a relation.
» The Wolfram Functions Site This site will let you know a wide variety of functions from the elementary ones to thepolynomials, and even more advanced. In this website you will also find a section to plotfunctions.