Glucocorticoid receptor mRNA in Alzheimer's diseased hippocampus
Upload
independentCategory
view
0download
0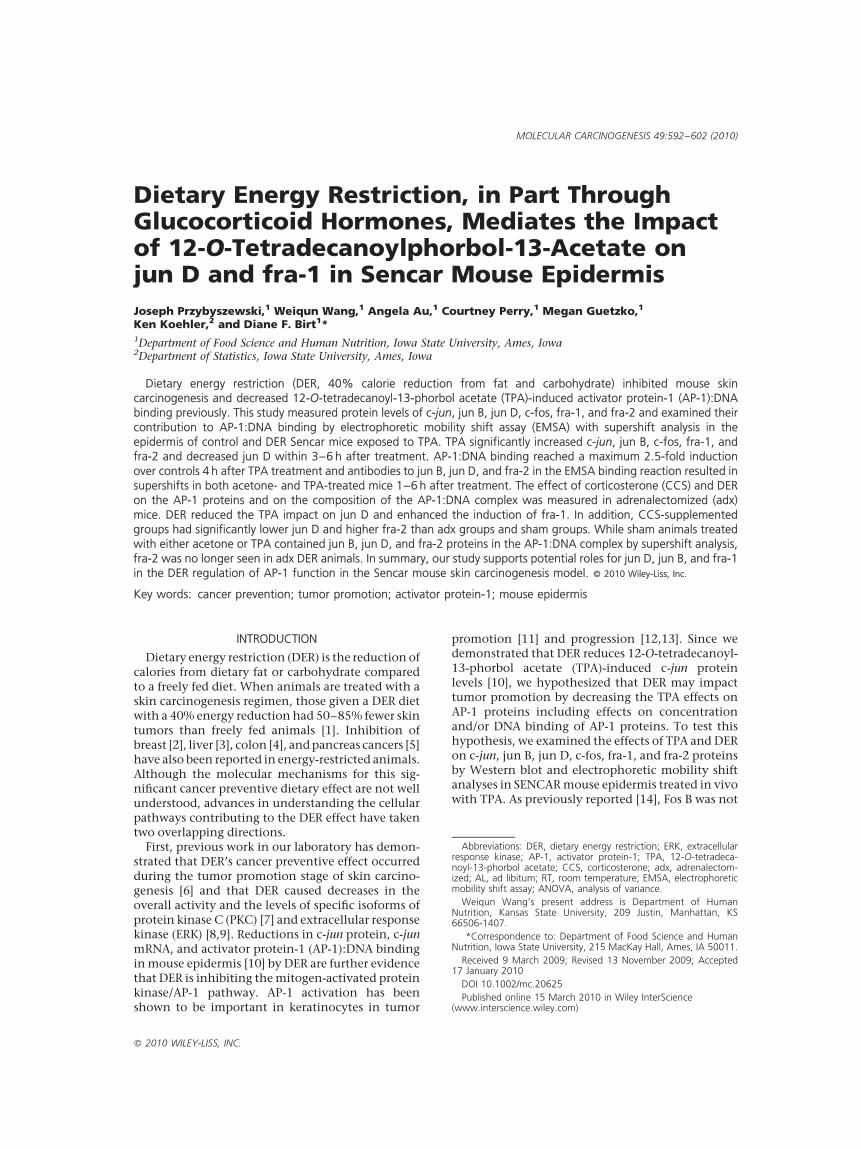
Dietary Energy Restriction, in Part ThroughGlucocorticoid Hormones, Mediates the Impactof 12-O-Tetradecanoylphorbol-13-Acetate onjun D and fra-1 in Sencar Mouse Epidermis
Joseph Przybyszewski,1 Weiqun Wang,1 Angela Au,1 Courtney Perry,1 Megan Guetzko,1
Ken Koehler,2 and Diane F. Birt1*1Department of Food Science and Human Nutrition, Iowa State University, Ames, Iowa2Department of Statistics, Iowa State University, Ames, Iowa
Dietary energy restriction (DER, 40% calorie reduction from fat and carbohydrate) inhibited mouse skincarcinogenesis and decreased 12-O-tetradecanoyl-13-phorbol acetate (TPA)-induced activator protein-1 (AP-1):DNAbinding previously. This study measured protein levels of c-jun, jun B, jun D, c-fos, fra-1, and fra-2 and examined their
contribution to AP-1:DNA binding by electrophoretic mobility shift assay (EMSA) with supershift analysis in theepidermis of control and DER Sencar mice exposed to TPA. TPA significantly increased c-jun, jun B, c-fos, fra-1, andfra-2 and decreased jun D within 3–6 h after treatment. AP-1:DNA binding reached a maximum 2.5-fold induction
over controls 4 h after TPA treatment and antibodies to jun B, jun D, and fra-2 in the EMSA binding reaction resulted insupershifts in both acetone- and TPA-treated mice 1–6 h after treatment. The effect of corticosterone (CCS) and DERon the AP-1 proteins and on the composition of the AP-1:DNA complex was measured in adrenalectomized (adx)
mice. DER reduced the TPA impact on jun D and enhanced the induction of fra-1. In addition, CCS-supplementedgroups had significantly lower jun D and higher fra-2 than adx groups and sham groups. While sham animals treatedwith either acetone or TPA contained jun B, jun D, and fra-2 proteins in the AP-1:DNA complex by supershift analysis,
fra-2 was no longer seen in adx DER animals. In summary, our study supports potential roles for jun D, jun B, and fra-1in the DER regulation of AP-1 function in the Sencar mouse skin carcinogenesis model. � 2010 Wiley-Liss, Inc.
Key words: cancer prevention; tumor promotion; activator protein-1; mouse epidermis
INTRODUCTION
Dietary energy restriction (DER) is the reduction ofcalories from dietary fat or carbohydrate comparedto a freely fed diet. When animals are treated with askin carcinogenesis regimen, those given a DER dietwith a 40% energy reduction had 50–85% fewer skintumors than freely fed animals [1]. Inhibition ofbreast [2], liver [3], colon [4], and pancreas cancers [5]have also been reported in energy-restricted animals.Although the molecular mechanisms for this sig-nificant cancer preventive dietary effect are not wellunderstood, advances in understanding the cellularpathways contributing to the DER effect have takentwo overlapping directions.
First, previous work in our laboratory has demon-strated that DER’s cancer preventive effect occurredduring the tumor promotion stage of skin carcino-genesis [6] and that DER caused decreases in theoverall activity and the levels of specific isoforms ofprotein kinase C (PKC) [7] and extracellular responsekinase (ERK) [8,9]. Reductions in c-jun protein, c-junmRNA, and activator protein-1 (AP-1):DNA bindingin mouse epidermis [10] by DER are further evidencethat DER is inhibiting the mitogen-activated proteinkinase/AP-1 pathway. AP-1 activation has beenshown to be important in keratinocytes in tumor
promotion [11] and progression [12,13]. Since wedemonstrated that DER reduces 12-O-tetradecanoyl-13-phorbol acetate (TPA)-induced c-jun proteinlevels [10], we hypothesized that DER may impacttumor promotion by decreasing the TPA effects onAP-1 proteins including effects on concentrationand/or DNA binding of AP-1 proteins. To test thishypothesis, we examined the effects of TPA and DERon c-jun, jun B, jun D, c-fos, fra-1, and fra-2 proteinsby Western blot and electrophoretic mobility shiftanalyses in SENCAR mouse epidermis treated in vivowith TPA. As previously reported [14], Fos B was not
MOLECULAR CARCINOGENESIS 49:592–602 (2010)
� 2010 WILEY-LISS, INC.
Abbreviations: DER, dietary energy restriction; ERK, extracellularresponse kinase; AP-1, activator protein-1; TPA, 12-O-tetradeca-noyl-13-phorbol acetate; CCS, corticosterone; adx, adrenalectom-ized; AL, ad libitum; RT, room temperature; EMSA, electrophoreticmobility shift assay; ANOVA, analysis of variance.
Weiqun Wang’s present address is Department of HumanNutrition, Kansas State University, 209 Justin, Manhattan, KS66506-1407.
*Correspondence to: Department of Food Science and HumanNutrition, Iowa State University, 215 MacKay Hall, Ames, IA 50011.
Received 9 March 2009; Revised 13 November 2009; Accepted17 January 2010
DOI 10.1002/mc.20625
Published online 15 March 2010 in Wiley InterScience(www.interscience.wiley.com)

detectable in mouse epidermis by Western blotanalysis.
Second, animal studies have shown that theadrenal glands are important for the inhibition ofTPA-induced papilloma formation by food restric-tion in Sencar [15] and CD-1 mice [16]. Since it iswell-known that glucocorticoid hormones arepotent inhibitors of skin carcinogenesis [17] andtumorigenesis [18], it is not surprising that DER wasassociated with increased levels of glucocorticoidhormones [19] including corticosterone (CCS) [20].However, because DER decreased signaling down theAP-1 pathway through PKC, ERK and AP-1:DNAbinding [7,9,10] without apparent effects on gluco-corticoid receptor (GR) levels or activities [20], thisstudy investigated the effect of glucocorticoid hor-mones on AP-1 constituent proteins in adrenalec-tomized (adx) and CCS-supplemented adx mice fed aDER or ad libitum (AL) diet. We thus furtherhypothesized that adrenalectomy should reversethe attenuating effects of DER on TPA-inducedalterations in concentration, and/or DNA bindingof AP-1 constituent proteins and that supplementa-tion of CCS to adx mice restores the attenuatingeffect of DER on the TPA-induced increase inconcentrations and DNA binding of AP-1 proteins.
In summary, we hypothesized that (1) DER wouldinhibit TPA-induced changes in the concentrationand/or DNA binding of AP-1 proteins, (2) adrenalec-tomy would reverse the effect of DER on the TPA-induced changes in concentration and/or DNAbinding of AP-1 proteins, and (3) CCS supplementa-tion of adrenalectomized mice would restore theeffect of DER on the TPA-induced changes inconcentrations and/or DNA binding of AP-1 pro-teins.
Using in vivo TPA treatment to stimulate potentialearly events in cancer promotion in epidermal cellsand DER and glucocorticoid hormone manipulationto prevent, inhibit or interfere with these effects, thisis the first report using DER to identify the potentialpositive and negative transactivator functions of AP-1 constituents in the Sencar mouse skin carcino-genesis model. Our data suggest a potential role forjun D as a negative transactivator and that jun B andfra-1 are important in the regulation of AP-1 functionin the Sencar mouse skin carcinogenesis model. Ashypothesized, DER reversed the TPA effects on jun Dexpression but, unexpectedly, enhanced the TPAeffects on fra-1.
MATERIALS AND METHODS
Animals and Diet
Female SENCAR mice, aged 6–8 wk, were pur-chased from NIH facilities in Frederick, MD. Themice were housed in a humidity- and temperature-controlled room on a 12-h light/dark cycle andallowed 1 wk to adjust to their environment before
surgery. Modified AIN-93 and 40% energy restricteddiet pellets were obtained from Harlan TekladPremier Laboratory Diets (Madison, WI, #TD99433and #TD99467, respectively), stored at �208C andwere used within 6 mo. Diet composition was aspreviously reported [20]. For the time course study,the shaved dorsal skins of the mice were treated with3.2 nmol TPA in 200 mL acetone or with 200 mLacetone alone at 1, 3, 4, 6, 12, 18, and 24 h prior tokilling by cervical dislocation. For the DER study,mice were given control or 40% DER diets for 10–12 wk and then treated with 3.2 nmol TPA in 200 mLacetone or with 200 mL acetone alone 4 h prior tokilling. All experiments were approved by theInstitutional Animal Care and Use Committee atIowa State University.
Adrenalectomy
Surgeries on shaved mice were performed between7:00 a.m. and 9:00 a.m. The mice were intraperito-neally injected with pentobarbital, 75 mg/kg,approximately 20 min prior to surgery. The anesthe-tized mice were swabbed with 70% ethanol and thedorsal skin was cut and fascia opened to reveal thekidney. The adrenal glands and surrounding fattytissue were removed and the fascia was sutured withgut pliabilized nylon and collagen sutures (Ethicon,Inc., Somerville, NJ) and the wound closed withwound clips. In sham animals, these same proce-dures were followed except that the adrenal glandswere exposed and disrupted but left intact. Immedi-ately after surgeries, adrenalectomized mice weregiven saline (0.9%) in an ethanol vehicle (0.6%) or60 mg/mL CCS in drinking water to mimic theincrease in CCS reported in DER mice [7]. One weekafter surgeries, animals were given 20% energyrestricted diets for 1 week and then 40% DER dietsfor the remainder of the study (10–12 wk).
Western Blot Analysis
Whole cell lysates were prepared from mouseepidermis as previously described [20] except thatthe depilation step with Nair1 was omitted and theprotein content of each lysate was determined by thebicinchoninic acid (BCA) protein assay kit (Sigma, St.Louis, MO). Equal amounts of 25 or 100 mg of wholecell mouse epidermal proteins were combined withequal volumes of 2� sample buffer (20 mM sodiummonophosphate, 4% SDS, 20% glycerol, 10% B-mercaptoethanol, 200 mM dithiothreitol, 0.02%bromophenol blue), boiled for 5 min and electro-phoresed on a 10% polyacrylamide–SDS minigel.Proteins were transferred to a PVDF membrane(Biorad Laboratories, Hercules, CA) in 25 mM Tris,192 mM glycine, 15% methanol for 2–3 h. Themembrane was blocked with 5–7% non-fat dry milkin TBST (20 mM Tris, 137 mM sodium chloride,0.05% Tween-20) for 1–3 h at room temperature(RT) followed by a 1-h incubation in 1:200 dilution of
AP-1 ALTERATIONS IN RESPONSE TO TPA AND DER 593
Molecular Carcinogenesis

the primary goat polyclonal antibody obtained fromSanta Cruz Biotechnology (Santa Cruz, CA) at RT.After 4�5 min TBST washes, the membrane wasincubated in a 1:1000 dilution of anti-goatHRP secondary antibody (Santa Cruz Biotechnology)for 1 h at RT, washed 4� 5 min with TBST anddetected with ECL plus detection kit (AmershamBiosciences Corp., Piscataway, NJ). Banding patternswere imaged on a Molecular Dynamics Phosphor-Imager1 (Sunnyvale, CA) in chemiluminescencemode and quantitated using ImageQuant1 software.Band intensities were in the linear range of detectionby the phosphoimager. Band identification for eachantibody was according to the positive controls fromthe manufacturer.
Electrophoretic Mobility Supershift Analysis
Epidermal cell nuclear proteins were extractedfrom mouse dorsal skins as previously described [10]and quantitated using a Coomassie1 Plus proteinassay reagent kit (Pierce Biotechnology, Rockford,IL). The AP-1 consensus sequence: 50-CGC TTG ATGAGT CAG CCG GAA-30; 30-GCG AAC TAC TCA GTCGGC CTT-50 (Promega, Madison, WI) was end-labeled with 32P-ATP (7000 Ci/mmol, MP Biomed-icals, Costa Mesa, CA) using T4 polynucleotidekinase (Promega) according to the manufacturer’sinstructions including the removal of 32P-ATP bySephadex G25 spin columns (Roche, Indianapolis,IN). Procedures for the electrophoretic mobility shiftanalysis of the timing of TPA-induced AP-1:DNAbinding were as previously reported [10]. Supershiftelectrophoretic mobility shift assay (EMSA) of thecomposition of AP-1 constituent proteins in the AP-1:DNA complex in nuclear proteins of TPA treatedand DER mice used the same procedure with a minoraddition. Briefly, for the binding reaction, approx-imately 100 000–200 000 cpm of 32P-radiolabeledAP-1 consensus sequence and 0.5mg poly(dI–dC)(Amersham Biosciences Corp.) were incubated with15 mg nuclear protein at RT for 10 min followed byincubation with 400 ng antibody (Santa Cruz Bio-technology) to each of the AP-1 constituent proteinsfor an additional 30 min. This binding reaction wasloaded onto a prerun 5% polyacrylamide gel, electro-phoresed and the resulting gel was dried at 858C for45min using a gel dryer (Biorad Laboratories). The driedgel was exposed to a phosphorscreen (MolecularDynamics, Sunnyvale, CA ) overnight prior to imagingthe banding pattern with a Molecular DynamicsPhosphorImager1 (CA) in phosphor mode and quanti-tating the radioactivity using ImageQuant1 software.
Statistics
For EMSA results, the logarithm of the radio-activity of the shifted band was analyzed for differ-ences between groups using analysis of variance(ANOVA), as the logarithm of the values were
more nearly normally distributed, and differencesbetween means were tested by t-test of the leastsquares means. For Western results of the time courseexperiment, the logarithm of the normalized relativechemiluminescence of the protein band for the timepoints were analyzed for difference from the ace-tone-treated control group using ANOVA followedby Dunnett’s Multiple Comparison Test on Graph-Pad Prism Software (San Diego, CA). For Westernresults of the DER experiment, the logarithm (base10) of the normalized relative chemiluminescence ofthe protein band for the time points were analyzedby 3-way ANOVA using the GLM procedure withtreatment, diet and surgery as factors and Tukey–Kramer t-tests on SAS software. Significant changesin body weight over time were determined by singlefactor ANOVA followed by Dunnett’s posttest usingGraphPad Prism software comparing body weightsbetween experimental groups at each age during DERfeeding.
RESULTS
Timing of TPA Effects on AP-1:DNA Binding
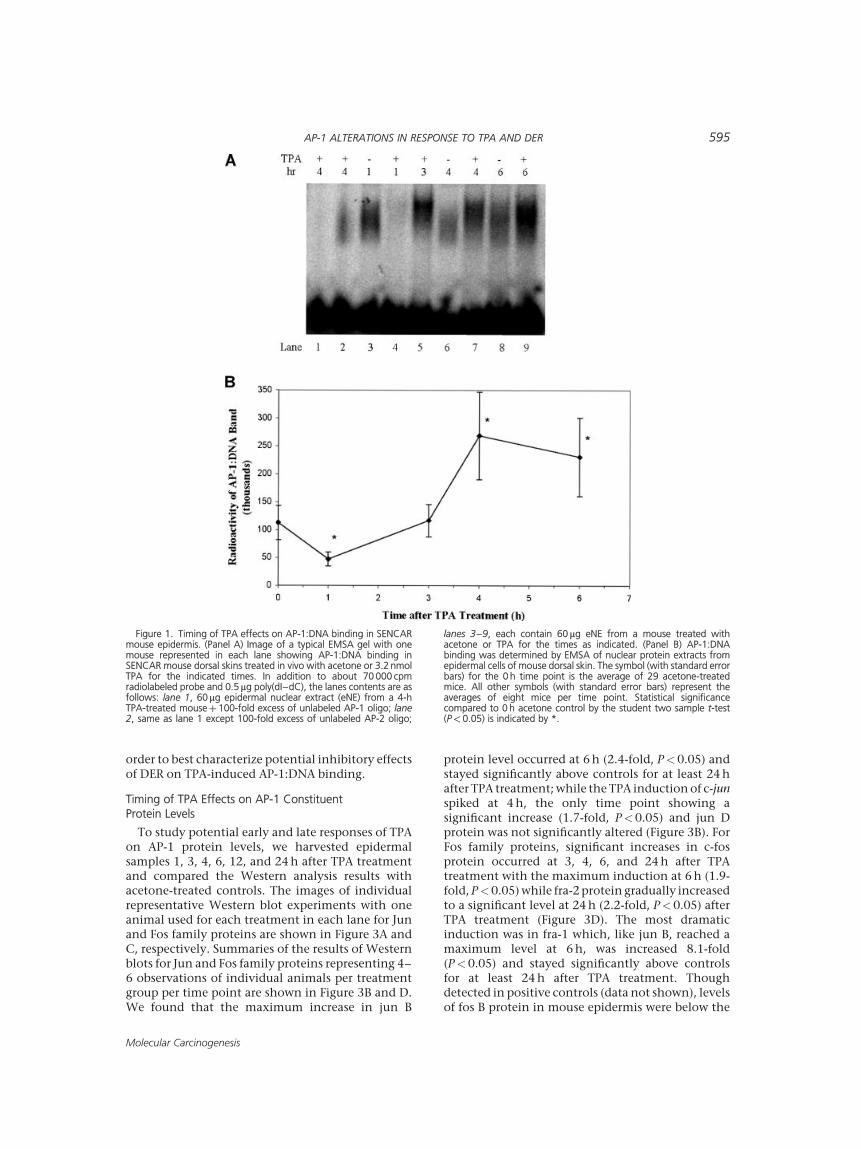
To determine the time after treatment thatresulted in the highest induction of AP-1:DNAbinding by TPA and select an appropriate time forthe DER study, we first studied the binding of AP-1 toits consensus DNA sequence as measured by EMSA 1,3, 4, and 6 h after treatment of SENCAR mouse dorsalskin with a tumor promoting dose of TPA. The imageof a representative EMSA experiment with oneanimal used for each treatment in each lanecontaining the AP-1:DNA binding reaction is shownin Figure 1A. A summary of the EMSA results for AP-1:DNA binding representing n¼8 observations pertreatment group per time point is shown in Figure1B. We observed that the induction of AP-1:DNAbinding reached a maximum 4 h after TPA treatment(2.5-fold increase over acetone control, P< 0.05) andwas still significantly increased at 6 h. Surprisingly,we demonstrated that AP-1:DNA binding was sig-nificantly decreased to one-half that of the controlsat 1 h after TPA treatment (P<0.05). In a parallelstudy, supershift EMSA analysis showed that anti-bodies to jun D and jun B resulted in a supershiftedAP-1:DNA band in all of the six acetone-treated andfive TPA-treated animals (3-h post-TPA: n¼3; 1-hpost-TPA: n¼2) examined (see Figure 2 for resultsfrom one mouse). The presence of jun D and jun Bproteins in the AP-1:DNA complex was seen in bothacetone- and TPA-treated mouse samples at all timepoints measured. Fra-2 shifts occurred in two of twoacetone-treated and one of the three TPA-treatedsamples while Fra-1 was not detected by supershift inacetone- or TPA-treated samples.
Based on the results of the AP-1:DNA binding timecourse study, we selected 4 h after TPA treatment forcollection of skin samples from the DER study in
594 PRZYBYSZEWSKI ET AL.
Molecular Carcinogenesis
order to best characterize potential inhibitory effectsof DER on TPA-induced AP-1:DNA binding.
Timing of TPA Effects on AP-1 ConstituentProtein Levels
To study potential early and late responses of TPAon AP-1 protein levels, we harvested epidermalsamples 1, 3, 4, 6, 12, and 24 h after TPA treatmentand compared the Western analysis results withacetone-treated controls. The images of individualrepresentative Western blot experiments with oneanimal used for each treatment in each lane for Junand Fos family proteins are shown in Figure 3A andC, respectively. Summaries of the results of Westernblots for Jun and Fos family proteins representing 4–6 observations of individual animals per treatmentgroup per time point are shown in Figure 3B and D.We found that the maximum increase in jun B
protein level occurred at 6 h (2.4-fold, P< 0.05) andstayed significantly above controls for at least 24 hafter TPA treatment; while the TPA induction of c-junspiked at 4 h, the only time point showing asignificant increase (1.7-fold, P<0.05) and jun Dprotein was not significantly altered (Figure 3B). ForFos family proteins, significant increases in c-fosprotein occurred at 3, 4, 6, and 24 h after TPAtreatment with the maximum induction at 6 h (1.9-fold, P<0.05) while fra-2 protein gradually increasedto a significant level at 24 h (2.2-fold, P< 0.05) afterTPA treatment (Figure 3D). The most dramaticinduction was in fra-1 which, like jun B, reached amaximum level at 6 h, was increased 8.1-fold(P< 0.05) and stayed significantly above controlsfor at least 24 h after TPA treatment. Thoughdetected in positive controls (data not shown), levelsof fos B protein in mouse epidermis were below the
Figure 1. Timing of TPA effects on AP-1:DNA binding in SENCARmouse epidermis. (Panel A) Image of a typical EMSA gel with onemouse represented in each lane showing AP-1:DNA binding inSENCAR mouse dorsal skins treated in vivo with acetone or 3.2 nmolTPA for the indicated times. In addition to about 70 000 cpmradiolabeled probe and 0.5mg poly(dI–dC), the lanes contents are asfollows: lane 1, 60mg epidermal nuclear extract (eNE) from a 4-hTPA-treated mouseþ 100-fold excess of unlabeled AP-1 oligo; lane2, same as lane 1 except 100-fold excess of unlabeled AP-2 oligo;
lanes 3–9, each contain 60 mg eNE from a mouse treated withacetone or TPA for the times as indicated. (Panel B) AP-1:DNAbinding was determined by EMSA of nuclear protein extracts fromepidermal cells of mouse dorsal skin. The symbol (with standard errorbars) for the 0 h time point is the average of 29 acetone-treatedmice. All other symbols (with standard error bars) represent theaverages of eight mice per time point. Statistical significancecompared to 0 h acetone control by the student two sample t-test(P< 0.05) is indicated by *.
AP-1 ALTERATIONS IN RESPONSE TO TPA AND DER 595
Molecular Carcinogenesis
limits of Western analysis detection as reportedpreviously by others [14].
Effects of DER on Body Weights
Body weights for freely fed and DER mice over15 wk of feeding are shown in Figure 4. At the end ofthe 10 wk on their respective diets, freely fed mice ineither sham or adx groups gained an average of 3–4%of their body weight while freely fed adx/CCS-supplemented mice lost 8% of their body weightcompared to their starting weight at 11 wk of age.Diets with a 40% reduction in calories from fat andcarbohydrate relative to freely fed animals resulted in9%, 0%, and 20% losses of body weight in sham, adx,and adx/CCS groups, respectively, compared to their11-wk-old starting weight. Following the start of theDER diet, weight loss in DER animals continued for4 wk, then their body weights remained constant forthe remainder of the experiment showing at most11%, 14%, and 20% weight losses over the course ofthe experiment for sham, adx and adx/CCS groups,respectively. Single factor ANOVA comparisons ofbody weight between the experimental groupsshowed a significant weight loss beginning at age13 wk for all DER groups compared to freely fedanimals (P<0.05). In addition, DER/adx/CCS miceweighed significantly less than DER/adx and DER/sham animals (P< 0.05). There were no significantdifferences in body weight among freely fed groupsor between DER/sham versus DER/adx animals.
Effects of DER and CCS on AP-1 Protein Levels
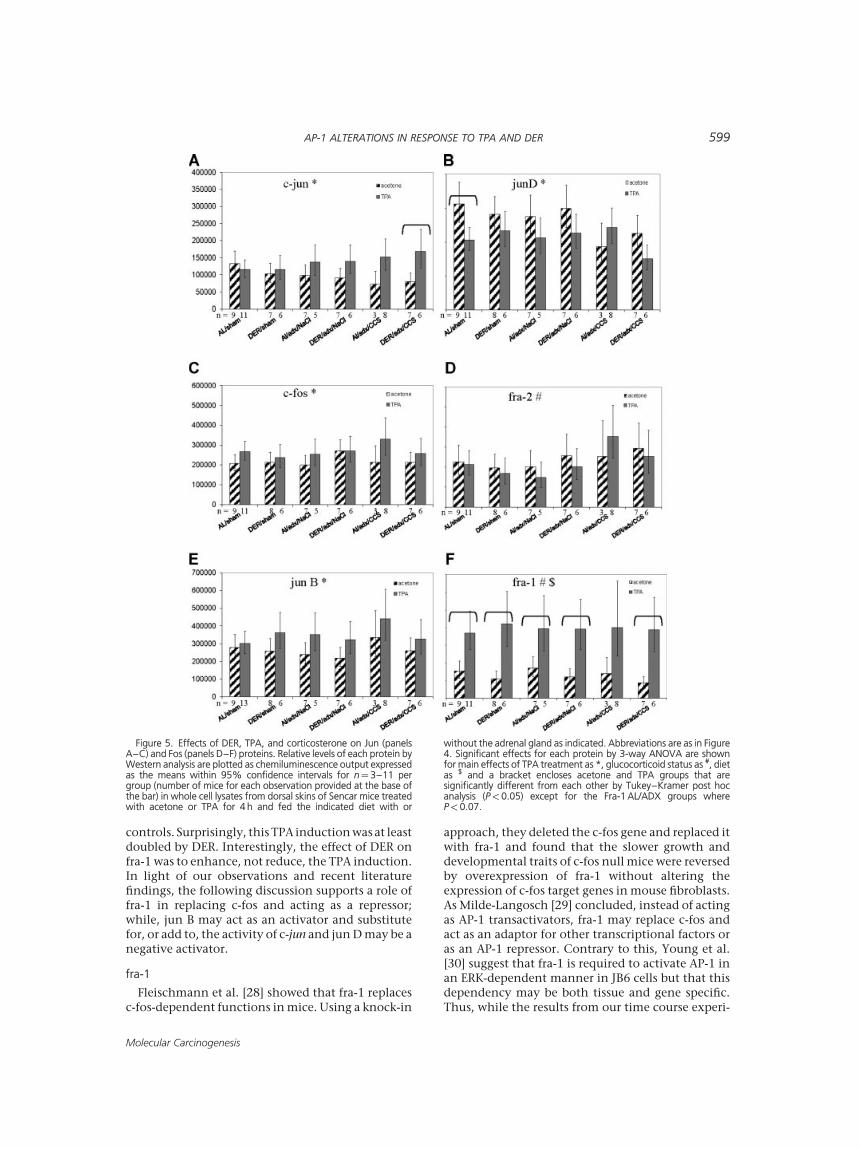
The effects of TPA, DER, adrenalectomy, and CCSon the protein levels of individual AP-1 constituentproteins are summarized in Figure 5 and the results ofANOVA analysis are provided in Table 1. Using 3-wayANOVA on log transformed data, treatment effects
(acetone vs. TPA) were significant for c-jun(P<0.0001), jun B (P¼0.0006), jun D (P¼0.0009),c-fos (P¼0.0007), and fra-1 (P<0.0001). For each ofthese proteins except jun D, the mean value of allTPA-treated groups was higher than the acetonemean. ANOVA for jun D revealed a significant threeway interaction (P¼0.0204) and individual Tukey–Kramer post hoc t-test analyses showed that themean jun D value of the AL/sham/TPA group wassignificantly lower than that of AL/sham/acetone(P¼0.047) accounting for the noted three-wayinteraction. This significant TPA reduction was lostin DER/sham animals. Individual Tukey–Kramerpost hoc t-tests showed that the mean fra-1 value inthe TPA-treated group was significantly higher thanthat observed in the corresponding acetone-treatedcontrol group (P<0.05, except AL/adx/CCS:P¼0.219, AL/adx/NaCl: P¼0.069). In addition,DER not only enhanced the effect of TPA on fra-1but also increased the significance of the acetoneversus TPA comparison for all DER groups as shownin Table 2. Notably, much of this enhancement wasdue to the reduced fra-1 concentration in the acetonetreated DER mouse skin. An interaction between TPAtreatment and diet was observed in fra-1 (P¼0.064,Table 1) and is accounted for by this differential TPAeffect in the AL and DER groups. Differences byANOVA due to glucocorticoid status (sham, adx,CCS) were found in jun D (P¼0.008) and fra-2(P¼0.026) (Table 1). While mean jun D values ofCCS-supplemented groups were significantly lowerthan adx groups (P¼0.02) and sham groups(P¼0.009) by 3-way ANOVA, mean fra-2 values ofCCS-supplemented groups were significantly higherthan adx groups (P¼0.04) and sham groups(P¼0.03). An interaction between treatment andhormone was noted for c-jun (P¼0.002, Table 1) andindividual t-tests showed that the mean c-jun valuefor DER/CCS/TPA was significantly higher than themean of DER/CCS/acetone (P¼0.043) accountingfor this interaction.
Effects of DER on Constituents of the AP-1:DNA Complex
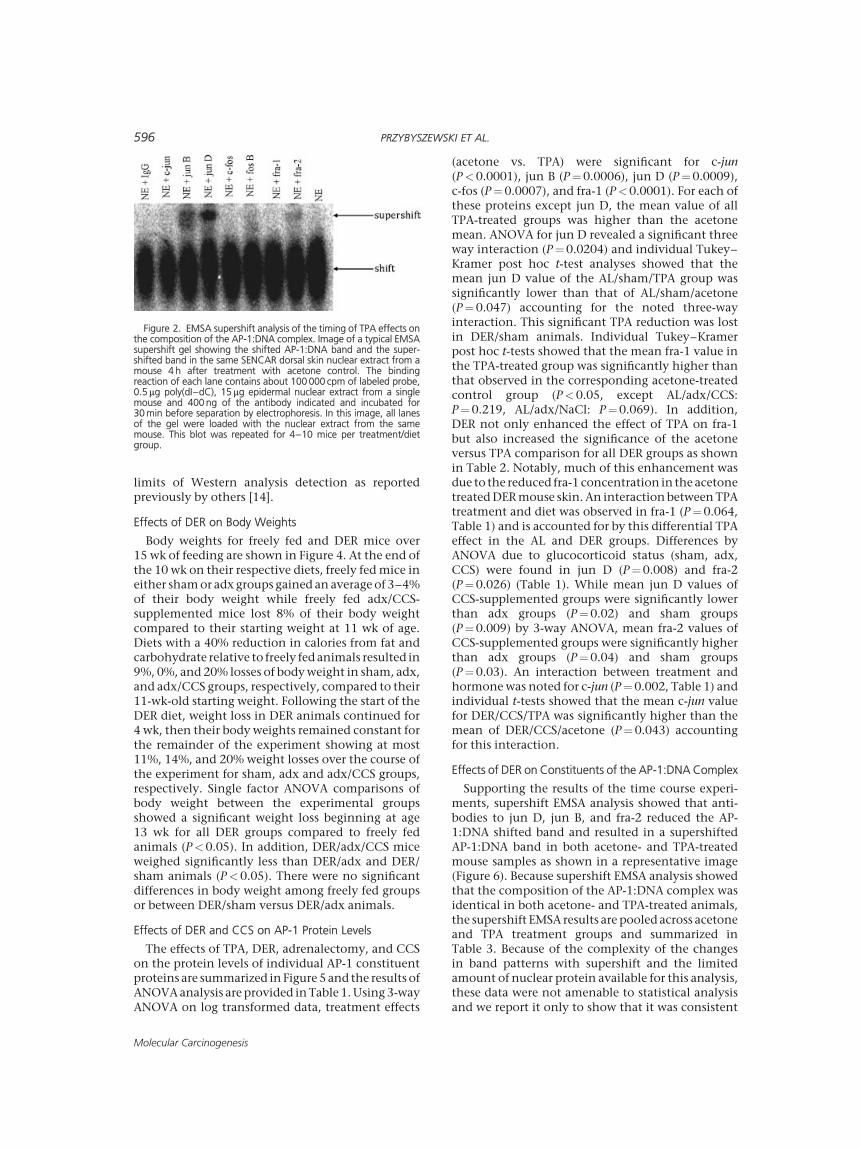
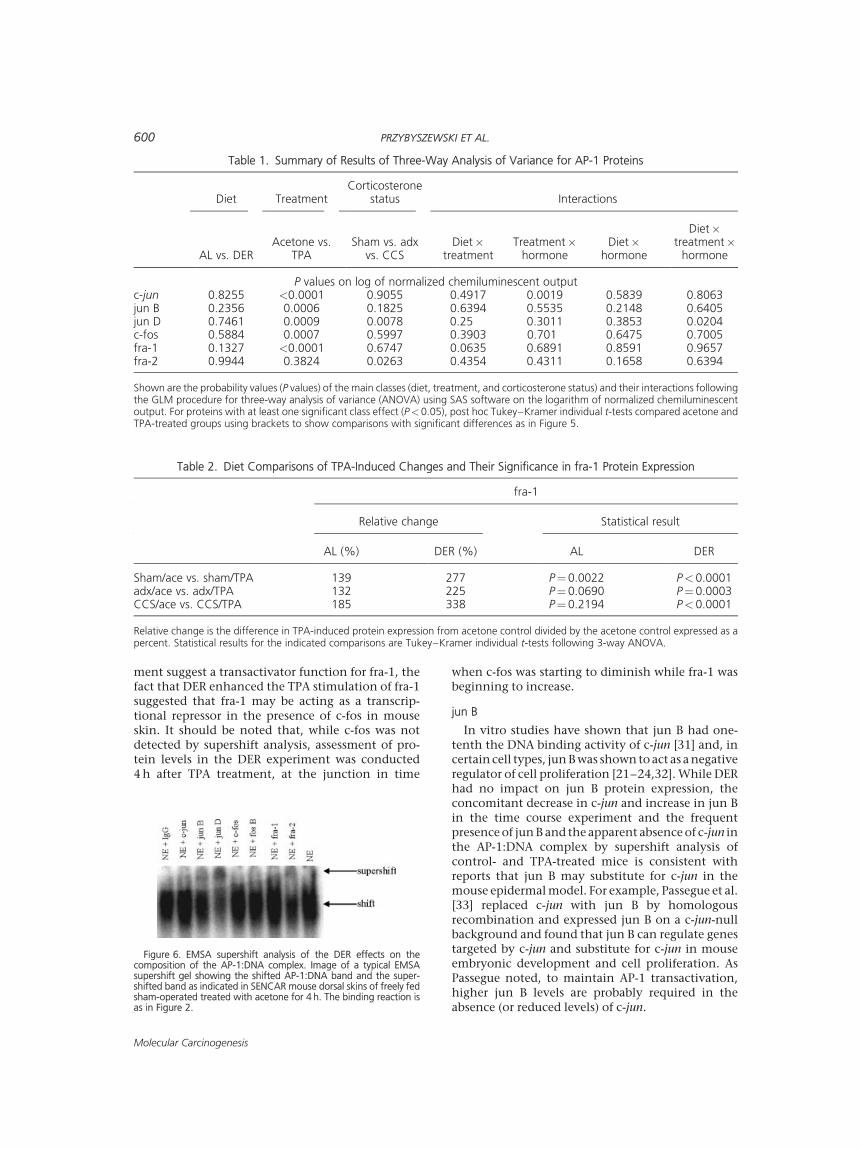
Supporting the results of the time course experi-ments, supershift EMSA analysis showed that anti-bodies to jun D, jun B, and fra-2 reduced the AP-1:DNA shifted band and resulted in a supershiftedAP-1:DNA band in both acetone- and TPA-treatedmouse samples as shown in a representative image(Figure 6). Because supershift EMSA analysis showedthat the composition of the AP-1:DNA complex wasidentical in both acetone- and TPA-treated animals,the supershift EMSA results are pooled across acetoneand TPA treatment groups and summarized inTable 3. Because of the complexity of the changesin band patterns with supershift and the limitedamount of nuclear protein available for this analysis,these data were not amenable to statistical analysisand we report it only to show that it was consistent
Figure 2. EMSA supershift analysis of the timing of TPA effects onthe composition of the AP-1:DNA complex. Image of a typical EMSAsupershift gel showing the shifted AP-1:DNA band and the super-shifted band in the same SENCAR dorsal skin nuclear extract from amouse 4 h after treatment with acetone control. The bindingreaction of each lane contains about 100 000 cpm of labeled probe,0.5 mg poly(dI–dC), 15 mg epidermal nuclear extract from a singlemouse and 400 ng of the antibody indicated and incubated for30 min before separation by electrophoresis. In this image, all lanesof the gel were loaded with the nuclear extract from the samemouse. This blot was repeated for 4–10 mice per treatment/dietgroup.
596 PRZYBYSZEWSKI ET AL.
Molecular Carcinogenesis

with our time course results. However, we observedthat while sham animals treated with either acetoneor TPA contained jun B, jun D, and fra-2 proteins inthe AP-1:DNA complex by supershift analysis, fra-2was no longer seen in adx DER animals (n¼7). Whennuclear protein extracts from DER/adx/CCS animalswere pooled to obtain enough for one supershiftEMSA analysis no shifted bands were observed.
DISCUSSION
We hypothesized that DER would inhibit TPA-induced changes in the concentration and/or DNA
binding of AP-1 proteins, that adrenalectomy wouldreverse the effect of DER on the TPA-induced changesand that CCS supplementation of adrenalectomizedmice would restore the effect of DER on the TPA-induced changes. While treatment with TPA, as amain effect tested using 3-way ANOVA, causedsignificant overall changes in all but fra-2 of the AP-1 constituent proteins, we found that only jun D andfra-1 levels were significantly altered by TPA in theAL/sham group. This TPA effect was reversed by DERfor the jun D protein but enhanced for the fra-1protein. For jun D, adrenalectomy did not com-
Figure 3. The timing of TPA effects on Jun (panels A and B) andFos proteins (panels C and D). Examples of Western immunoblotimages for c-jun, jun B, and jun D proteins (panel A) and c-fos, fra-1,and fra-2 proteins (panel C) where the first lane (PC) contains thepositive control provided by the manufacturer and other lanes eachcontain 100 mg SENCAR epidermal whole cell lysate from one mouseexposed to TPA or acetone for the times as indicated. (Panels B andD) Relative amounts of each protein are plotted as chemiluminescent
response against time where the symbols represent the means (�SE)for n¼6 mice per group and the zero time point is the mean of the 0,4, 24-h acetone treatments (n¼12). Time points that aresignificantly different from acetone-treated controls using ANOVAfollowed by Dunnett’s Multiple Comparison Test on log transformeddata (P< 0.05) are as indicated in the legend using different symbols(*, $, #) for each protein. The arrow identifies the jun B band used forquantitation.
AP-1 ALTERATIONS IN RESPONSE TO TPA AND DER 597
Molecular Carcinogenesis

pletely reverse the effect of DER to the significantTPA effect seen in the AL/sham group, nor did CCSsupplementation completely restore the DER effecton TPA-induced changes to that of the DER/shamgroup (see Figure 5). For fra-1, adrenalectomy did notsignificantly alter the TPA-induction in the DERgroup; however, CCS supplementation enhancedthe TPA induction over the DER sham group (seeTable 2).
TPA-induced alterations in AP-1:DNA binding andAP-1 constituent protein levels have been reported ina number of cell culture transformation modelsystems and in cells from knock-in and knock-outmouse models (see Refs. [21–24] for reviews).Evidence from cultured cell models suggests thatdifferences in the abundance and composition of AP-1:DNA complexes may play a role in transformation[25,26]. Using the Sencar mouse skin carcinogenesisanimal model, our study expands the understandingof the transactivator functions of AP-1 proteins inresponse to a tumor promoter (TPA), a tumorinhibitor (DER) and adrenal gland hormones (asmediators of DER effects) by measuring protein levelsand DNA binding of AP-1. Our rationale for omittingDMBA treatment is based on previous findings in ourlab [8] that activities of ERK-1 and ERK-2 (upstreamkinases in the AP-1 pathway) were unaffected by avariety of regimens of treatment with DMBA fol-lowed by TPA. Limited by the inability to measurephosphorylated AP-1 proteins, we attempted toimmunoprecipitate phosphorylated AP-1 proteinsbut were unsuccessful due to the small size of themouse skin samples. However, our EMSA findings are
similar to those in cell culture systems. While c-junand c-fos are typically considered strong AP-1 trans-activators [22], our Western immunoblot results onthe timing of TPA effects on AP-1 proteins showed arelatively weak, early, and transient activation of c-jun and c-fos in mouse skin. Supershift EMSA analysisprovided no evidence that these proteins were foundin the AP-1:DNA complex of either control- or TPA-treated mice. Our observations are consistent with anearlier report where c-jun and c-fos supershifts werenot observed with a TPA-induced AP-1:DNA com-plex from ICR mouse skin [27]. These authors,however, observed a diminished AP-1:DNA complexas evidence of the presence of these constituentproteins in the complex. In the present study, jun Band fra-1 showed a strong, long-lasting activation byTPA. In fact, 6 h after TPA treatment, while the levelsof c-jun and c-fos proteins were starting to decrease,jun B and fra-1 were reaching their peak induction.Thus, jun B and fra-1 may be considered potentialstrong transactivators based on the relative magni-tude of their protein induction (>2-fold increase) byTPA in the time course experiments and c-jun and c-fos as potential modest transactivators (>50%increase). Of these, only c-jun, jun B, and fra-1showed TPA-induced increases of at least 50% overcontrols 4 h after TPA treatment in the time courseexperiment. While we hypothesized that TPA induc-tion of these proteins would be significantlydecreased by DER, we found no significant diet effectfor any protein by 3-way ANOVA. As predicted fromthe TPA time course experiment, TPA significantlyincreased fra-1 protein levels compared to acetone
Figure 4. Effects of dietary energy restriction, adrenalectomy, and corticosterone supplementation on Sencarmouse body weights. Values are mean (�standard error) of the body weight for n¼ 6–21 mice per group. Analysisby one-way ANOVA showed significant differences between DER groups compared to freely fed animals starting2 wk after beginning the DER diet (P< 0.05). In addition, Dunnett’s posttest performed on DER mouse groups at21 wk of age showed that DER/adx/CCS mice had a significantly different mean body weight from DER/adx andDER/sham animals (P< 0.05). adx, adrenalectomized; AL, ad libitum fed; CCS, corticosterone supplemented; DER,40% dietary energy restricted; sham, sham operated control.
598 PRZYBYSZEWSKI ET AL.
Molecular Carcinogenesis
controls. Surprisingly, this TPA induction was at leastdoubled by DER. Interestingly, the effect of DER onfra-1 was to enhance, not reduce, the TPA induction.In light of our observations and recent literaturefindings, the following discussion supports a role offra-1 in replacing c-fos and acting as a repressor;while, jun B may act as an activator and substitutefor, or add to, the activity of c-jun and jun D may be anegative activator.
fra-1
Fleischmann et al. [28] showed that fra-1 replacesc-fos-dependent functions in mice. Using a knock-in
approach, they deleted the c-fos gene and replaced itwith fra-1 and found that the slower growth anddevelopmental traits of c-fos null mice were reversedby overexpression of fra-1 without altering theexpression of c-fos target genes in mouse fibroblasts.As Milde-Langosch [29] concluded, instead of actingas AP-1 transactivators, fra-1 may replace c-fos andact as an adaptor for other transcriptional factors oras an AP-1 repressor. Contrary to this, Young et al.[30] suggest that fra-1 is required to activate AP-1 inan ERK-dependent manner in JB6 cells but that thisdependency may be both tissue and gene specific.Thus, while the results from our time course experi-
Figure 5. Effects of DER, TPA, and corticosterone on Jun (panelsA–C) and Fos (panels D–F) proteins. Relative levels of each protein byWestern analysis are plotted as chemiluminescence output expressedas the means within 95% confidence intervals for n¼ 3–11 pergroup (number of mice for each observation provided at the base ofthe bar) in whole cell lysates from dorsal skins of Sencar mice treatedwith acetone or TPA for 4 h and fed the indicated diet with or
without the adrenal gland as indicated. Abbreviations are as in Figure4. Significant effects for each protein by 3-way ANOVA are shownfor main effects of TPA treatment as *, glucocorticoid status as #, dietas $ and a bracket encloses acetone and TPA groups that aresignificantly different from each other by Tukey–Kramer post hocanalysis (P< 0.05) except for the Fra-1 AL/ADX groups whereP< 0.07.
AP-1 ALTERATIONS IN RESPONSE TO TPA AND DER 599
Molecular Carcinogenesis
ment suggest a transactivator function for fra-1, thefact that DER enhanced the TPA stimulation of fra-1suggested that fra-1 may be acting as a transcrip-tional repressor in the presence of c-fos in mouseskin. It should be noted that, while c-fos was notdetected by supershift analysis, assessment of pro-tein levels in the DER experiment was conducted4 h after TPA treatment, at the junction in time
when c-fos was starting to diminish while fra-1 wasbeginning to increase.
jun B
In vitro studies have shown that jun B had one-tenth the DNA binding activity of c-jun [31] and, incertain cell types, jun B was shown to act as a negativeregulator of cell proliferation [21–24,32]. While DERhad no impact on jun B protein expression, theconcomitant decrease in c-jun and increase in jun Bin the time course experiment and the frequentpresence of jun B and the apparent absence of c-jun inthe AP-1:DNA complex by supershift analysis ofcontrol- and TPA-treated mice is consistent withreports that jun B may substitute for c-jun in themouse epidermal model. For example, Passegue et al.[33] replaced c-jun with jun B by homologousrecombination and expressed jun B on a c-jun-nullbackground and found that jun B can regulate genestargeted by c-jun and substitute for c-jun in mouseembryonic development and cell proliferation. AsPassegue noted, to maintain AP-1 transactivation,higher jun B levels are probably required in theabsence (or reduced levels) of c-jun.
Table 1. Summary of Results of Three-Way Analysis of Variance for AP-1 Proteins
Diet TreatmentCorticosterone
status Interactions
AL vs. DERAcetone vs.
TPASham vs. adx
vs. CCSDiet�
treatmentTreatment�
hormoneDiet�
hormone
Diet�treatment�
hormone
P values on log of normalized chemiluminescent outputc-jun 0.8255 <0.0001 0.9055 0.4917 0.0019 0.5839 0.8063jun B 0.2356 0.0006 0.1825 0.6394 0.5535 0.2148 0.6405jun D 0.7461 0.0009 0.0078 0.25 0.3011 0.3853 0.0204c-fos 0.5884 0.0007 0.5997 0.3903 0.701 0.6475 0.7005fra-1 0.1327 <0.0001 0.6747 0.0635 0.6891 0.8591 0.9657fra-2 0.9944 0.3824 0.0263 0.4354 0.4311 0.1658 0.6394
Shown are the probability values (P values) of the main classes (diet, treatment, and corticosterone status) and their interactions followingthe GLM procedure for three-way analysis of variance (ANOVA) using SAS software on the logarithm of normalized chemiluminescentoutput. For proteins with at least one significant class effect (P<0.05), post hoc Tukey–Kramer individual t-tests compared acetone andTPA-treated groups using brackets to show comparisons with significant differences as in Figure 5.
Table 2. Diet Comparisons of TPA-Induced Changes and Their Significance in fra-1 Protein Expression
fra-1
Relative change Statistical result
AL (%) DER (%) AL DER
Sham/ace vs. sham/TPA 139 277 P¼ 0.0022 P< 0.0001adx/ace vs. adx/TPA 132 225 P¼ 0.0690 P¼ 0.0003CCS/ace vs. CCS/TPA 185 338 P¼ 0.2194 P< 0.0001
Relative change is the difference in TPA-induced protein expression from acetone control divided by the acetone control expressed as apercent. Statistical results for the indicated comparisons are Tukey–Kramer individual t-tests following 3-way ANOVA.
Figure 6. EMSA supershift analysis of the DER effects on thecomposition of the AP-1:DNA complex. Image of a typical EMSAsupershift gel showing the shifted AP-1:DNA band and the super-shifted band as indicated in SENCAR mouse dorsal skins of freely fedsham-operated treated with acetone for 4 h. The binding reaction isas in Figure 2.
600 PRZYBYSZEWSKI ET AL.
Molecular Carcinogenesis

jun D
Although the marginal 17% reduction in jun D, 6 hafter TPA, in the time course experiment was notsignificant; the DER experiment showed a significant34% decrease in jun D protein levels by TPA in AL/sham animals. As we hypothesized, DER reversed thisreduction in jun D by TPA in sham animals from a34% reduction by TPA in AL animals (individualTukey–Kramer t-test, P¼ 0.047) to a 15% reductionin DER animals (P¼0.97) relative to acetone con-trols. These results suggest that glucocorticoidhormones may be important in the DER effect onjun D. While the diet experiment showed a signifi-cant TPA-induced reduction of jun D protein levels,Zhao et al. [34] showed that jun D protein levels wereincreased 24 h after TPA treatment in skin of DMBA-initiated MnSOD transgenic and non-transgenicmice. However, as in our finding, Zhoa showed thatjun D demonstrated a clear supershift in the AP-1complex. Like Zhoa, our results suggest a major rolefor jun D in early stages of TPA-induced AP-1activation. Also, as we hypothesized, DER reversedthe TPA effects on jun D through a mechanism thatwas partially mediated by CCS.
In conclusion, our results support roles for fra-1 inthe presence of c-fos; and jun D in suppressingdownstream TPA induced events and jun B as atransactivator adding to the activity of c-jun in DERmodulation of mouse skin carcinogenesis. We alsoshowed that DER reversed the impact of TPA on jun Dand enhanced the effect of TPA on fra-1 and thatthese DER effects were partially mediated throughglucocorticoid hormones in Sencar mouse epider-mis. These observations may relate to our priorfinding that DER abolished TPA-induced AP-1 luci-ferase mRNA expression in an AP-1 reporter trans-genic luciferase mouse model [35] and further
support the importance of DER in inhibiting AP-1transactivation of AP-1 targets. Our results highlightthe complexity of regulation of AP-1 activity throughprocesses involving the amount of AP-1 constituentproteins and composition of AP-1:DNA complexes. Itis notable that the DER mice in these experimentshad reduced body weights compared to controls, butthey were not strikingly low weights, they were in ahealthy underfed state.
ACKNOWLEDGMENTS
This study was supported by the National Instituteof Health Grant R01 CA77451-01, American Insti-tute for Cancer Research Grants 97B039, 95B126-REV, United States Department of Agriculture,Nutrition and Wellness Research Center and by theIowa Agriculture and Home Economics ExperimentStation Hatch Act and State of Iowa funds.
REFERENCES
1. Birt DF, Pinch HJ, Barnett T, Phan A, Dimitroff K. Inhibition ofskin tumor promotion by restriction of fat and carbohydratecalories in SENCAR mice. Cancer Res 1993;53:27–31.
2. Thompson HJ, Zhu Z, Jiang W. Dietary energy restriction inbreast cancer prevention. J Mammary Gland Biol Neoplasia2003;8:133–142.
3. Kritchevsky D. Caloric restriction and experimental carcino-genesis. Adv Exp Med Biol 1992;322:131–141.
4. Kritchevsky D. Colorectal cancer: The role of dietary fat andcaloric restriction. Mutat Res 1993;290:63–70.
5. Nair SC, Toshkov IA, Yaktine AL, Barnett TD, Chaney WG,Birt DF. Dietary energy restriction-induced modulation ofprotein kinase C zeta isozyme in the hamster pancreas. MolCarcinog 1995;14:10–15.
6. Birt DF, Pelling JC, White LT, Dimitroff K, Barnett T. Influenceof diet and calorie restriction on the initiation and promotionof skin carcinogenesis in the SENCAR mouse model. CancerRes 1991;51:1851–1854.
7. Birt DF, Duysen E, Wang W, Yaktine A. Corticosteronesupplementation reduced selective protein kinase C isoform
Table 3. Composition of AP-1:DNA Complex From Supershift Analysis
Group n value
Number of mice with protein in complex/total mice tested
jun B jun D fra-2 fra-1 c-fos fos B c-jun
AL/sham/acet n¼ 4 3/4 4/4 4/4 0/4 0/4 0/4 0/4AL/sham/TPA n¼ 6 5/6 6/6 4/6 0/6 0/6 0/6 0/6AL/adx/acet n¼ 4 2/4 4/4 1/4 0/4 0/4 0/4 0/4AL/adx/TPA n¼ 4 4/4 4/4 3/4 0/4 0/4 0/4 0/4AL/adx/CCS/acet n¼ 2 1/2 2/2 1/2 1/2 2/2 0/2 0/2AL/adx/CCS/TPA n¼ 2 1/2 2/2 1/2 2/2 0/2 0/2 0/2DER/sham/acet n¼ 2 2/2 2/2 2/2 0/2 0/2 2/2 0/2DER/sham/TPA n¼ 2 2/2 2/2 1/2 0/2 0/2 2/2 0/2DER/adx/acet n¼ 4 2/4 4/4 0/4 2/4 0/4 0/4 0/4DER/adx/TPA n¼ 3 3/3 2/3 0/3 0/3 0/3 0/3 0/3DER/adx/CCS/acet n¼ 0DER/adx/CCS/TPA n¼ 1 0/1 1/1 0/1 0/1 0/1 0/1 0/1
Supershift EMSA results for each protein indicating (the number of animals containing a supershifted band for a particular protein/thetotal number of animals tested).
AP-1 ALTERATIONS IN RESPONSE TO TPA AND DER 601
Molecular Carcinogenesis

expression in the epidermis of adrenalectomized mice.Cancer Epidemiol Biomarkers Prev 2001;10:679–685.
8. Liu Y, Wang W, Hawley J, Birt DF. Adrenalectomy abrogatesreduction of 12-O-tetradecanoylphorbol-13-acetate-inducedextracellular signal-regulated protein kinase activity in theepidermis of dietary energy-restricted SENCAR mice: Impli-cations of glucocorticoid hormone. Cancer Epidemiol Bio-markers Prev 2002;11:299–304.
9. Liu Y, Duysen E, Yaktine AL, Au A, Wang W, Birt DF. Dietaryenergy restriction inhibits ERK but not JNK or p38 activity inthe epidermis of SENCAR mice. Carcinogenesis 2001;22:607–612.
10. Przybyszewski J, Yaktine AL, Duysen E, et al. Inhibition ofphorbol ester-induced AP-1-DNA binding, c-Jun protein andc-jun mRNA by dietary energy restriction is reversed byadrenalectomy in SENCAR mouse epidermis. Carcinogenesis2001;22:1421–1427.
11. Dong Z, Cmarik JL, Wendel EJ, Colburn NH. Differentialtransformation efficiency but not AP-1 induction underanchorage-dependent and -independent conditions. Carci-nogenesis 1994;15:1001–1004.
12. Li JJ, Rhim JS, Schlegel R, Vousden KH, Colburn NH.Expression of dominant negative Jun inhibits elevated AP-1and NF-kappaB transactivation and suppresses anchorageindependent growth of HPV immortalized human keratino-cytes. Oncogene 1998;16:2711–2721.
13. Dong Z, Crawford HC, Lavrovsky V, et al. A dominantnegative mutant of jun blocking 12-O-tetradecanoylphor-bol-13-acetate-induced invasion in mouse keratinocytes.Mol Carcinog 1997;19:204–212.
14. Angel P, Szabowski A, Schorpp-Kistner M. Function andregulation of AP-1 subunits in skin physiology and pathology.Oncogene 2001;20:2413–2423.
15. Stewart JW, Koehler K, Jackson W, et al. Prevention of mouseskin tumor promotion by dietary energy restriction requiresan intact adrenal gland and glucocorticoid supplementationrestores inhibition. Carcinogenesis 2005;26:1077–1084.
16. Pashko LL, Schwartz AG. Reversal of food restriction-inducedinhibition of mouse skin tumor promotion by adrenalectomy.Carcinogenesis 1992;13:1925–1928.
17. Belman S, Troll W. The inhibition of croton oil-promotedmouse skin tumorigenesis by steroid hormones. Cancer Res1972;32:450–454.
18. Slaga TJ, Lichti U, Hennings H, Elgjo K, Yuspa SH. Effects oftumor promoters and steroidal anti-inflammatory agents onskin of newborn mice in vivo and in vitro. J Natl Cancer Inst1978;60:425–431.
19. Armario A, Montero JL, Jolin T. Chronic food restriction andthe circadian rhythms of pituitary-adrenal hormones, growthhormone and thyroid-stimulating hormone. Ann Nutr Metab1987;31:81–87.
20. Yaktine AL, Vaughn R, Blackwood D, Duysen E, Birt DF.Dietary energy restriction in the SENCAR mouse: Elevation of
glucocorticoid hormone levels but no change in distributionof glucocorticoid receptor in epidermal cells. Mol Carcinog1998;21:62–69.
21. Shaulian E, Karin M. AP-1 as a regulator of cell life and death.Nat Cell Biol 2002;4:E131–E136.
22. Hess J, Angel P, Schorpp-Kistner M. AP-1 subunits: Quarreland harmony among siblings. J Cell Sci 2004;117:5965–5973.
23. Mechta-Grigoriou F, Gerald D, Yaniv M. The mammalian Junproteins: Redundancy and specificity. Oncogene 2001;20:2378–2389.
24. Jochum W, Passegue E, Wagner EF. AP-1 in mouse develop-ment and tumorigenesis. Oncogene 2001;20:2401–2412.
25. Bernstein LR, Colburn NH. AP1/jun function is differentiallyinduced in promotion-sensitive and resistant JB6 cells.Science 1989;244:566–569.
26. Bernstein LR, Walker SE. Tumor promotion resistant cells aredeficient in AP-1 DNA binding, JunD DNA binding and JunDexpression and form different AP-1-DNA complexes thanpromotion sensitive cells. Biochim Biophys Acta 1999;1489:263–280.
27. Chun K-S, Kim S-H, Yong-SangSong Y-S, Surh Y-J. Celecoxibinhibits phorbol ester-induced expression of COX-2 andactivation of AP-1 and p38 MAP kinase in mouse skin.Carcinogenesis 2004;25:713–722.
28. Fleischmann A, Hafezi F, Elliott C, Reme CE, Ruther U,Wagner EF. Fra-1 replaces c-Fos-dependent functions inmice. Genes Dev 2000;14:2695–2700.
29. Milde-Langosch K. The Fos family of transcription factors andtheir role in tumourigenesis. Eur J Cancer 2005;41:2449–2461.
30. Young MR, Nair R, Bucheimer N, et al. Transactivation of Fra-1 and consequent activation of AP-1 occur extracellularsignal-regulated kinase dependently. Mol Cell Biol 2002;22:587–598.
31. Deng T, Karin M. JunB differs from c-Jun in its DNA-bindingand dimerization domains, and represses c-Jun by formationof inactive heterodimers. Genes Dev 1993;7:479–490.
32. Shaulian E, Karin M. AP-1 in cell proliferation and survival.Oncogene 2001;20:2390–2400.
33. Passegue E, Jochum W, Behrens A, Ricci R, Wagner EF. JunBcan substitute for Jun in mouse development and cellproliferation. Nat Genet 2002;30:158–166.
34. Zhao Y, Xue Y, Oberley TD, et al. Overexpression ofmanganese superoxide dismutase suppresses tumor forma-tion by modulation of activator protein-1 signaling in amultistage skin carcinogenesis model. Cancer Res 2001;61:6082–6088.
35. Birt DF, Przybyszewski J, Wang W, Stewart J, Liu Y.Identification of molecular targets for dietary energyrestriction prevention of skin carcinogenesis: An ideacultivated by Edward Bresnick. J Cell Biochem 2004;91:258–264.
602 PRZYBYSZEWSKI ET AL.
Molecular Carcinogenesis
Copyright © 2022 FDOKUMEN