Dietary Characteristics of Eastern James Bay Cree Women
6
1 Centre for Indigenous Peoples’ Nutrition and Environment, and School of Dietetics and Human Nutrition, Macdonald Campus of McGill University, 21 111 Lakeshore Road, Ste. Anne de Bellevue, Quebec H9X 3V9, Canada; [email protected] © The Arctic Institute of North America ARCTIC VOL. 52, NO. 2 (JUNE 1999) P. 182 – 187 Dietary Characteristics of Eastern James Bay Cree Women TREENA DELORMIER 1 and HARRIET V. KUHNLEIN 1 (Received 10 June 1997; accepted in revised form 29 October 1998) ABSTRACT. Food use and nutrient intake were studied with Cree women of Wemindji and Eastmain, Quebec. During summer 1994 and winter 1995, 24-hour recalls and food frequency questionnaires were collected from 219 women of three age groups (20 – 40; 41 – 60; >60 years). While reported energy intakes were somewhat low, 94% of the women exceeded 2/3 of the recommended nutrient intake (RNI) for protein, and 80% exceeded 2/3 of the RNI for iron. However, 44% of the women reported calcium intakes of less than 1/2 the RNI. Mean total fat intake reported by young and middle adults was greater than 30% of total energy. Primary sources of fat were market food, indicating that education efforts targeting fat intake should emphasize market food choices. Species and amounts of traditional food consumed varied by season. The percentage of elders who consumed traditional food was significantly higher (p < 0.001, χ 2 = 29, Mantel-Haenzel) than those of traditional food users in the middle and younger age groups. Dietary data for the James Bay Cree, which were lacking prior to this research, are important resources for those working in health and wellness with this population group and other aboriginal groups that use traditional food. Key words: Eastern James Bay Cree, nutrient intake, food use, traditional food, Subarctic, indigenous people RÉSUMÉ. On a étudié l’utilisation de la nourriture et l’apport nutritif chez des femmes cris de Wemindji et de Eastmain au Québec. Durant l’été de 1994 et l’hiver de 1995, on a recueilli des rappels de 24 heures sur les aliments et des questionnaires portant sur la fréquence de consommation de certains aliments auprès de 219 femmes appartenant à trois groupes d’âge (20 à 40, 41 à 60 et > 60 ans). Alors que les apports en énergie mentionnés étaient plutôt bas, 94 p. cent des femmes dépassaient les deux tiers de l’apport nutritionnel recommandé (ANR) en protéines, et 80 p. cent dépassaient les deux tiers de l’ANR en fer. Cependant, 44 p. cent des femmes ont déclaré des apports de calcium inférieurs à la moitié de l’ANR. La moyenne de l’apport total en gras rapporté par les jeunes adultes et les adultes d’âge moyen était supérieure à 30 p. cent de l’énergie totale. Les principales sources de gras étaient les aliments provenant du marché, ce qui révèle que les efforts en vue d’éduquer les consommateurs sur l’apport en gras devraient insister sur les choix qui s’offrent dans les aliments disponibles au marché. Les espèces et les quantités d’aliments traditionnels consommés variaient avec les saisons. Le pourcentage d’anciens qui consommaient la nourriture traditionnelle était sensiblement supérieur (p < 0,001, χ 2 = 29, Mantel-Haenszel) à celui des utilisateurs d’aliments traditionnels situés dans le groupe des jeunes adultes et celui des adultes d’âge moyen. Les données alimentaires pour les Cris de la Baie James, inexistantes avant ces recherches, constituent d’importantes ressources pour les personnes travaillant en santé et mieux-être avec ce groupe de population et d’autres groupes autochtones qui utilisent des aliments traditionnels. Mots clés: Cri de la Baie James orientale, apport nutritionnel, utilisation de la nourriture, aliments traditionnels, Subarctique, peuple autochtone Traduit pour la revue Arctic par Nésida Loyer. INTRODUCTION The Eastern James Bay Cree have experienced relatively recent changes in lifestyle due to sociocultural, political, and environmental factors. These changes have affected diet, traditional food use, and nutrition. The extent to which diet has changed has scarcely been examined; how- ever, the role of diet in observed patterns of health and disease has been recognized (Thouez et al., 1989; Young, 1994). Of particular concern are the decreased use of traditional food by children and the younger genera- tion, changes in patterns of fish consumption arising from public health efforts related to methylmercury contamination, and increased prevalence of chronic conditions such as obesity, diabetes, and cardiovascu- lar disease. Central to these issues are questions about the current diet and food consumption patterns of the Cree. Traditionally the diet consisted of fish, large and small game, a variety of waterfowl, and plant food from the local environment (Schaefer, 1977). Today the diet includes both these traditional food items and market foods. All communities have access to at least one grocery store. Hunting and trapping is still a way of life for at least 1/3 of the population, and more are involved with hunting and trapping on a part-time basis. Traditional food holds a
Transcript of Dietary Characteristics of Eastern James Bay Cree Women

1 Centre for Indigenous Peoples’ Nutrition and Environment, and School of Dietetics and Human Nutrition, Macdonald Campus ofMcGill University, 21 111 Lakeshore Road, Ste. Anne de Bellevue, Quebec H9X 3V9, Canada; [email protected]
© The Arctic Institute of North America
ARCTIC
VOL. 52, NO. 2 (JUNE 1999) P. 182–187
Dietary Characteristics of Eastern James Bay Cree WomenTREENA DELORMIER1 and HARRIET V. KUHNLEIN1
(Received 10 June 1997; accepted in revised form 29 October 1998)
ABSTRACT. Food use and nutrient intake were studied with Cree women of Wemindji and Eastmain, Quebec. During summer1994 and winter 1995, 24-hour recalls and food frequency questionnaires were collected from 219 women of three age groups(20 –40; 41 –60; >60 years). While reported energy intakes were somewhat low, 94% of the women exceeded 2/3 of therecommended nutrient intake (RNI) for protein, and 80% exceeded 2/3 of the RNI for iron. However, 44% of the women reportedcalcium intakes of less than 1/2 the RNI. Mean total fat intake reported by young and middle adults was greater than 30% of totalenergy. Primary sources of fat were market food, indicating that education efforts targeting fat intake should emphasize marketfood choices. Species and amounts of traditional food consumed varied by season. The percentage of elders who consumedtraditional food was significantly higher (p < 0.001, χ2 = 29, Mantel-Haenzel) than those of traditional food users in the middleand younger age groups. Dietary data for the James Bay Cree, which were lacking prior to this research, are important resourcesfor those working in health and wellness with this population group and other aboriginal groups that use traditional food.
Key words: Eastern James Bay Cree, nutrient intake, food use, traditional food, Subarctic, indigenous people
RÉSUMÉ. On a étudié l’utilisation de la nourriture et l’apport nutritif chez des femmes cris de Wemindji et de Eastmain au Québec.Durant l’été de 1994 et l’hiver de 1995, on a recueilli des rappels de 24 heures sur les aliments et des questionnaires portant surla fréquence de consommation de certains aliments auprès de 219 femmes appartenant à trois groupes d’âge (20 à 40, 41 à 60 et> 60 ans). Alors que les apports en énergie mentionnés étaient plutôt bas, 94 p. cent des femmes dépassaient les deux tiers del’apport nutritionnel recommandé (ANR) en protéines, et 80 p. cent dépassaient les deux tiers de l’ANR en fer. Cependant, 44 p.cent des femmes ont déclaré des apports de calcium inférieurs à la moitié de l’ANR. La moyenne de l’apport total en gras rapportépar les jeunes adultes et les adultes d’âge moyen était supérieure à 30 p. cent de l’énergie totale. Les principales sources de grasétaient les aliments provenant du marché, ce qui révèle que les efforts en vue d’éduquer les consommateurs sur l’apport en grasdevraient insister sur les choix qui s’offrent dans les aliments disponibles au marché. Les espèces et les quantités d’alimentstraditionnels consommés variaient avec les saisons. Le pourcentage d’anciens qui consommaient la nourriture traditionnelle étaitsensiblement supérieur (p < 0,001, χ2 = 29, Mantel-Haenszel) à celui des utilisateurs d’aliments traditionnels situés dans le groupedes jeunes adultes et celui des adultes d’âge moyen. Les données alimentaires pour les Cris de la Baie James, inexistantes avantces recherches, constituent d’importantes ressources pour les personnes travaillant en santé et mieux-être avec ce groupe depopulation et d’autres groupes autochtones qui utilisent des aliments traditionnels.
Mots clés: Cri de la Baie James orientale, apport nutritionnel, utilisation de la nourriture, aliments traditionnels, Subarctique,peuple autochtone
Traduit pour la revue Arctic par Nésida Loyer.
INTRODUCTION
The Eastern James Bay Cree have experienced relativelyrecent changes in lifestyle due to sociocultural, political,and environmental factors. These changes have affecteddiet, traditional food use, and nutrition. The extent towhich diet has changed has scarcely been examined; how-ever, the role of diet in observed patterns of health anddisease has been recognized (Thouez et al., 1989; Young,1994). Of particular concern are the decreased use oftraditional food by children and the younger genera-tion, changes in patterns of fish consumption arisingfrom public health efforts related to methylmercury
contamination, and increased prevalence of chronicconditions such as obesity, diabetes, and cardiovascu-lar disease. Central to these issues are questions aboutthe current diet and food consumption patterns of theCree.
Traditionally the diet consisted of fish, large and smallgame, a variety of waterfowl, and plant food from the localenvironment (Schaefer, 1977). Today the diet includesboth these traditional food items and market foods. Allcommunities have access to at least one grocery store.Hunting and trapping is still a way of life for at least 1/3 ofthe population, and more are involved with hunting andtrapping on a part-time basis. Traditional food holds a

strong cultural identity for the Cree. This is reflected in allaspects of its use from hunting and trapping to foodsharing, feasts, and food preparation (Delormier, 1993).
Some researchers have examined the potential nutrientcontent of the diet through inventory and harvest studies(Farkas and Berkes, 1978; James Bay Northern QuebecNative Harvesting Research Committee, 1982). However,few have examined dietary intake (Bernard and Lavallée,1993; Bernard et al., 1995) and none have examined factorsthat influence the use of traditional food.
The present dietary research examined nutrient intakeand traditional food use among three generations of adultwomen from two Cree communities during one summerand one winter season.
METHODS
Approval for the research proposal was obtained fromthe Human Ethics Review Committee of Macdonald Cam-pus, McGill University. To meet these requirements, aresearch agreement was signed between those responsiblefor the research and the communities involved in theresearch, through a band council representative. Eachparticipant signed an informed consent form before takingpart in the interviews.
Preliminary work carried out in the communities usedqualitative methods: key-informant interviewing, focusgroups, and participant observation. This community in-put ensured that the design and objectives of the studywere relevant to the communities’ food use.
Adult women from Wemindji and elder women fromEastmain were randomly selected from registers for healthand social services to participate in the study. Of the 219women interviewed, 89 were 20 – 40 years old; 82 were40 – 60 years old; and 48 were more than 60 years old. Thewomen from Eastmain, a community that shares similarcharacteristics with Wemindji, were included to increasethe number of elders. Of the total who were invited toparticipate, fewer than 10% refused. Women were asked toparticipate because of the significant role they play inselecting and preparing food for the family. Women’snutritional needs are difficult to meet because the need forcertain nutrients (e.g., iron) changes as women age, and sodo their energy requirements.
Data collection periods (July 1994 and January 1995)reflected two seasons and were selected on the advice ofcommunity members to demonstrate seasonal differencesin food use.
The dietary interview consisted of a 24-hour recall andquestionnaires on traditional food frequency and dietarychange. The 24-hour recall required the individual to statethe types and quantity of all foods and beverages taken inthe previous 24-hour period. Food portion sizes wereestimated using a bowl, a cup, and household measuringcups and spoons. The questionnaire asked individuals torecall the frequency with which they ate listed traditional
TABLE 1. Mean daily energy and nutrient intake (Mean ± SD) byage group and season (data from 24-hour recall interviews).
Nutrient 20 – 40 Years 41 – 60 Years Over 60 Years(n = 89) (n = 82) (n = 48)
Energy, kcal 1897 ± 763 1730 ± 713 1312 ± 654Carbohydrate, g 200 ± 085 154 ± 073 110 ± 066Protein, g 94 ± 056 110 ± 061 108 ± 063Fat, g 80 ± 042 73 ± 038 47 ± 034Iron, mg 16 ± 010 17 ± 011 13 ± 008Calcium, mg 482 ± 289 520 ± 367 390 ± 315
food items. The food frequency questionnaire, developedfrom interviews and observations in the communities andvalidated with community members in focus groups, listed29 species of wildlife, each with 2 to 11 edible parts. Afinal portion of the interview was composed of open-endedquestions investigating the changing diet. Communitymembers fluent in the Cree language (the first language inthese communities) conducted the interviews. Interview-ers were trained in dietary interviewing techniques by oneof the investigators (TD). This method has been usedsuccessfully in other Canadian aboriginal dietary studies(Wein et al., 1991, 1993; Campbell et al., 1994b; Kuhnlein,1995; Kuhnlein et al., 1995).
For nutrient analysis of the Cree diet, we used publisheddata on the composition of traditional foods. For importantCree foods not described in published sources, we deter-mined the nutrient content and added that information tothe traditional food database. Market food items wereanalyzed using the University of California, Berkeley minilist (Murphy, 1989), which was considered appropriate formarket food used by the Cree. The traditional food data-base was merged with the market food database to com-plete the diet analysis.
The food codes and weights of food items from the 24-hour recall and the food frequency information were en-tered into the Epi-Info software (Dean et al., 1994). Allstatistical analysis was performed using PC-SAS statisti-cal software (SAS Institute Inc., 1989).
RESULTS
Table 1 shows the mean daily energy and nutrient intakeby age group, calculated from the recall data. Energyintakes appear to be low, particularly for the over 60 agegroup. Evaluation of the adequacy of reported nutrientintakes is shown in Figure 1. Comparison of individualintakes of nutrients to recommended nutrient intakesshowed that more than 50% of the women had energyintakes greater than 2/3 the RNI.
Nutrient Intake
We evaluated individual intakes of nutrients for whichRNIs exist, using the same method used to evaluate energy
DIET OF JAMES BAY CREE WOMEN • 183

184 • T. DELORMIER and H.V. KUHNLEIN
FIG. 1. Percentage of recalls in Recommended Nutrient Intake (RNI) categories(n = 219, 24-hour recalls). RNI categories from Health and Welfare Canada(1990).
TABLE 2. Top 20 sources of fat, from all 24-hour recalls.
Winter1 1995 (n = 87) Summer2 1994 (n = 132)
Rank Food % of total Food % of totalfat intake fat intake
1 french fries 9.6 Canada goose 14.32 margarine 6.8 lard 6.53 bannock 6.6 margarine 5.84 eggs 6.1 french fries 5.45 ground beef, regular 5.9 eggs 5.46 beef, 30% fat 5.7 bannock 5.17 chicken 4.5 ground beef, regular 4.98 frankfurters, lunch meat 4.4 chicken 4.19 macaroni and cheese 4.3 whitefish, smoked 3.810 lard 3.7 canola oil 3.311 Canada goose 3.4 frankfurters, lunch meat 3.312 canola oil 3.3 goose grease 2.713 pork chop, pork, lean 2.6 pork chop, pork, lean 2.314 milk 2% 2.6 milk 2% 2.315 bacon 2.5 whitefish 2.216 bread, white, enriched 2.5 bread, white, enriched 1.917 potatoes 1.6 salad dressing, mayo-type 1.718 salad dressing, mayo-type 1.6 potatoes 1.619 butter 1.6 butter 1.620 pizza, frozen, mix, cheese 1.5 corned beef, canned 1.4
1 Winter 1995: mid-January to mid-February2 Summer 1994: July
TABLE 3. Mean percent of fat (Mean ± SD) from market andtraditional food sources in the diet of 132 women who reported bothfood sources.
Source and Season 20 – 40 years 40 – 60 years Over 60 years
Winter 1995: n = 10 n = 21 n = 14Market source 80 ± 17 82 ± 14 78 ± 17Traditional source 20 ± 17 18 ± 14 22 ± 17
Summer 1994: n = 24 n = 38 n = 25Market source 64 ± 20 63 ± 27 47 ± 28Traditional source 36 ± 20 37 ± 27 53 ± 28
intakes. For protein, we found that 94% of women reportedintakes greater than 2/3 of the RNI, while only 2% reportedintakes of less than 1/2 of the RNI. For iron, 80% of womenreported intakes greater than 2/3 of the RNI, and 63%reported intakes that exceeded the RNI. For calcium, 44%of reported intakes fell below 1/2 of the RNI levels, and40% were above 2/3 of the RNI. For carbohydrate, noRNIs exist; however, it is recommended for the generalCanadian population to obtain 55% of energy from carbo-hydrate (Health and Welfare Canada, 1990). In our study,the mean percentage of energy from carbohydrate reportedwas 43 ± 11% for the youngest age group, 37 ± 13% for themiddle group, and 35 ± 15% for the eldest group.
Dietary Fat Intake
It was of interest to look specifically at fat intake andsources of fat in the diet. Anecdotal evidence suggestedthat some Cree were consuming too much fat. The meanpercentage of fat as total energy was 37 ± 9%, 37 ± 9%, and30 ± 11% of total energy for young, middle, and elderwomen, respectively.
Examining the food sources of fat revealed that veryfew traditional foods are important sources of total fat(Table 2). In the winter (January 1995), the top 20 sourcesof fat included only one traditional food, Canada goose,which provided 3.4% of total fat. The top source of fat wasFrench fries (9.6% of total fat). In the summer (July 1994),Canada goose was the most important source of fat, fur-nishing 14.3% of total fat. Ranked sources of fat werecalculated by adding total fat from individual food itemsreported by all women and expressing the sum as a per-centage of total fat reported by all women.
Dietary Fat Intake from Traditional Food and MarketFood
The following analyses used data from women whoreported using both traditional and market food on 24-hourrecalls. The mean percentage of fat from market food was
higher in the winter season for all age groups, approxi-mately 20% higher for young and middle adults, and 30%higher for elders (Table 3). The women obtained a greaterproportion of their fat intake from traditional foods insummer than in winter. In the summer, when more tradi-tional food was consumed, the elder adult women obtainedabout 1/2 of their total fat from traditional sources. For theyoung adults and middle adults, traditional foods providedonly about 1/3 of total dietary fat.
Seasonal Use of Traditional Food
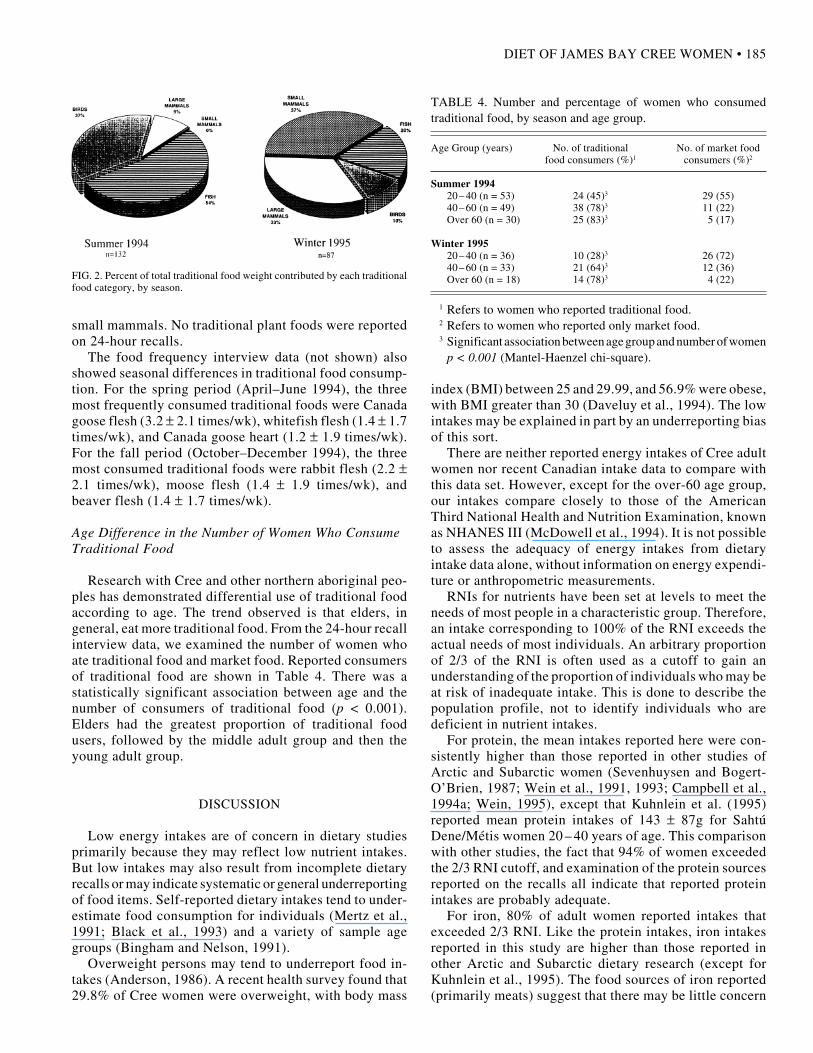
Figure 2 shows seasonal differences in the amounts ofeach food consumed, from the 24-hour recall data. Eachspecies was categorized as fish, bird, small mammal, orlarge mammal. For each category, the weights of all foodspecies were totalled. These totals were used to calculatethe portion of total traditional food weight represented byeach category. The summer diet emphasized fish and birdspecies, while the winter diet included more large and
DIET OF JAMES BAY CREE WOMEN • 185
FIG. 2. Percent of total traditional food weight contributed by each traditionalfood category, by season.
small mammals. No traditional plant foods were reportedon 24-hour recalls.
The food frequency interview data (not shown) alsoshowed seasonal differences in traditional food consump-tion. For the spring period (April–June 1994), the threemost frequently consumed traditional foods were Canadagoose flesh (3.2 ± 2.1 times/wk), whitefish flesh (1.4 ± 1.7times/wk), and Canada goose heart (1.2 ± 1.9 times/wk).For the fall period (October–December 1994), the threemost consumed traditional foods were rabbit flesh (2.2 ±2.1 times/wk), moose flesh (1.4 ± 1.9 times/wk), andbeaver flesh (1.4 ± 1.7 times/wk).
Age Difference in the Number of Women Who ConsumeTraditional Food
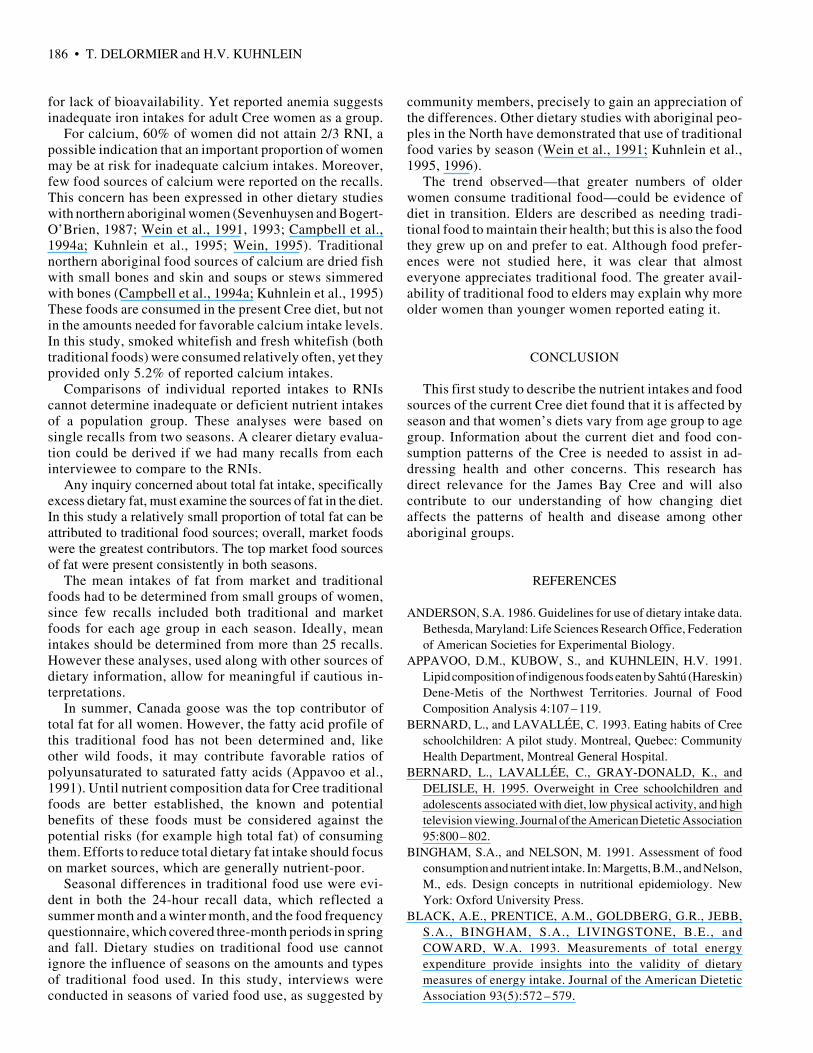
Research with Cree and other northern aboriginal peo-ples has demonstrated differential use of traditional foodaccording to age. The trend observed is that elders, ingeneral, eat more traditional food. From the 24-hour recallinterview data, we examined the number of women whoate traditional food and market food. Reported consumersof traditional food are shown in Table 4. There was astatistically significant association between age and thenumber of consumers of traditional food (p < 0.001).Elders had the greatest proportion of traditional foodusers, followed by the middle adult group and then theyoung adult group.
DISCUSSION
Low energy intakes are of concern in dietary studiesprimarily because they may reflect low nutrient intakes.But low intakes may also result from incomplete dietaryrecalls or may indicate systematic or general underreportingof food items. Self-reported dietary intakes tend to under-estimate food consumption for individuals (Mertz et al.,1991; Black et al., 1993) and a variety of sample agegroups (Bingham and Nelson, 1991).
Overweight persons may tend to underreport food in-takes (Anderson, 1986). A recent health survey found that29.8% of Cree women were overweight, with body mass
TABLE 4. Number and percentage of women who consumedtraditional food, by season and age group.
Age Group (years) No. of traditional No. of market foodfood consumers (%)1 consumers (%)2
Summer 199420 – 40 (n = 53) 24 (45)3 29 (55)40 – 60 (n = 49) 38 (78)3 11 (22)Over 60 (n = 30) 25 (83)3 05 (17)
Winter 199520 – 40 (n = 36) 10 (28)3 26 (72)40 – 60 (n = 33) 21 (64)3 12 (36)Over 60 (n = 18) 14 (78)3 04 (22)
1 Refers to women who reported traditional food.2 Refers to women who reported only market food.3 Significant association between age group and number of women
p < 0.001 (Mantel-Haenzel chi-square).
index (BMI) between 25 and 29.99, and 56.9% were obese,with BMI greater than 30 (Daveluy et al., 1994). The lowintakes may be explained in part by an underreporting biasof this sort.
There are neither reported energy intakes of Cree adultwomen nor recent Canadian intake data to compare withthis data set. However, except for the over-60 age group,our intakes compare closely to those of the AmericanThird National Health and Nutrition Examination, knownas NHANES III (McDowell et al., 1994). It is not possibleto assess the adequacy of energy intakes from dietaryintake data alone, without information on energy expendi-ture or anthropometric measurements.
RNIs for nutrients have been set at levels to meet theneeds of most people in a characteristic group. Therefore,an intake corresponding to 100% of the RNI exceeds theactual needs of most individuals. An arbitrary proportionof 2/3 of the RNI is often used as a cutoff to gain anunderstanding of the proportion of individuals who may beat risk of inadequate intake. This is done to describe thepopulation profile, not to identify individuals who aredeficient in nutrient intakes.
For protein, the mean intakes reported here were con-sistently higher than those reported in other studies ofArctic and Subarctic women (Sevenhuysen and Bogert-O’Brien, 1987; Wein et al., 1991, 1993; Campbell et al.,1994a; Wein, 1995), except that Kuhnlein et al. (1995)reported mean protein intakes of 143 ± 87g for SahtúDene/Métis women 20 – 40 years of age. This comparisonwith other studies, the fact that 94% of women exceededthe 2/3 RNI cutoff, and examination of the protein sourcesreported on the recalls all indicate that reported proteinintakes are probably adequate.
For iron, 80% of adult women reported intakes thatexceeded 2/3 RNI. Like the protein intakes, iron intakesreported in this study are higher than those reported inother Arctic and Subarctic dietary research (except forKuhnlein et al., 1995). The food sources of iron reported(primarily meats) suggest that there may be little concern
186 • T. DELORMIER and H.V. KUHNLEIN
for lack of bioavailability. Yet reported anemia suggestsinadequate iron intakes for adult Cree women as a group.
For calcium, 60% of women did not attain 2/3 RNI, apossible indication that an important proportion of womenmay be at risk for inadequate calcium intakes. Moreover,few food sources of calcium were reported on the recalls.This concern has been expressed in other dietary studieswith northern aboriginal women (Sevenhuysen and Bogert-O’Brien, 1987; Wein et al., 1991, 1993; Campbell et al.,1994a; Kuhnlein et al., 1995; Wein, 1995). Traditionalnorthern aboriginal food sources of calcium are dried fishwith small bones and skin and soups or stews simmeredwith bones (Campbell et al., 1994a; Kuhnlein et al., 1995)These foods are consumed in the present Cree diet, but notin the amounts needed for favorable calcium intake levels.In this study, smoked whitefish and fresh whitefish (bothtraditional foods) were consumed relatively often, yet theyprovided only 5.2% of reported calcium intakes.
Comparisons of individual reported intakes to RNIscannot determine inadequate or deficient nutrient intakesof a population group. These analyses were based onsingle recalls from two seasons. A clearer dietary evalua-tion could be derived if we had many recalls from eachinterviewee to compare to the RNIs.
Any inquiry concerned about total fat intake, specificallyexcess dietary fat, must examine the sources of fat in the diet.In this study a relatively small proportion of total fat can beattributed to traditional food sources; overall, market foodswere the greatest contributors. The top market food sourcesof fat were present consistently in both seasons.
The mean intakes of fat from market and traditionalfoods had to be determined from small groups of women,since few recalls included both traditional and marketfoods for each age group in each season. Ideally, meanintakes should be determined from more than 25 recalls.However these analyses, used along with other sources ofdietary information, allow for meaningful if cautious in-terpretations.
In summer, Canada goose was the top contributor oftotal fat for all women. However, the fatty acid profile ofthis traditional food has not been determined and, likeother wild foods, it may contribute favorable ratios ofpolyunsaturated to saturated fatty acids (Appavoo et al.,1991). Until nutrient composition data for Cree traditionalfoods are better established, the known and potentialbenefits of these foods must be considered against thepotential risks (for example high total fat) of consumingthem. Efforts to reduce total dietary fat intake should focuson market sources, which are generally nutrient-poor.
Seasonal differences in traditional food use were evi-dent in both the 24-hour recall data, which reflected asummer month and a winter month, and the food frequencyquestionnaire, which covered three-month periods in springand fall. Dietary studies on traditional food use cannotignore the influence of seasons on the amounts and typesof traditional food used. In this study, interviews wereconducted in seasons of varied food use, as suggested by
community members, precisely to gain an appreciation ofthe differences. Other dietary studies with aboriginal peo-ples in the North have demonstrated that use of traditionalfood varies by season (Wein et al., 1991; Kuhnlein et al.,1995, 1996).
The trend observed—that greater numbers of olderwomen consume traditional food—could be evidence ofdiet in transition. Elders are described as needing tradi-tional food to maintain their health; but this is also the foodthey grew up on and prefer to eat. Although food prefer-ences were not studied here, it was clear that almosteveryone appreciates traditional food. The greater avail-ability of traditional food to elders may explain why moreolder women than younger women reported eating it.
CONCLUSION
This first study to describe the nutrient intakes and foodsources of the current Cree diet found that it is affected byseason and that women’s diets vary from age group to agegroup. Information about the current diet and food con-sumption patterns of the Cree is needed to assist in ad-dressing health and other concerns. This research hasdirect relevance for the James Bay Cree and will alsocontribute to our understanding of how changing dietaffects the patterns of health and disease among otheraboriginal groups.
REFERENCES
ANDERSON, S.A. 1986. Guidelines for use of dietary intake data.Bethesda, Maryland: Life Sciences Research Office, Federationof American Societies for Experimental Biology.
APPAVOO, D.M., KUBOW, S., and KUHNLEIN, H.V. 1991.Lipid composition of indigenous foods eaten by Sahtú (Hareskin)Dene-Metis of the Northwest Territories. Journal of FoodComposition Analysis 4:107 – 119.
BERNARD, L., and LAVALLÉE, C. 1993. Eating habits of Creeschoolchildren: A pilot study. Montreal, Quebec: CommunityHealth Department, Montreal General Hospital.
BERNARD, L., LAVALLÉE, C., GRAY-DONALD, K., andDELISLE, H. 1995. Overweight in Cree schoolchildren andadolescents associated with diet, low physical activity, and hightelevision viewing. Journal of the American Dietetic Association95:800 –802.
BINGHAM, S.A., and NELSON, M. 1991. Assessment of foodconsumption and nutrient intake. In: Margetts, B.M., and Nelson,M., eds. Design concepts in nutritional epidemiology. NewYork: Oxford University Press.
BLACK, A.E., PRENTICE, A.M., GOLDBERG, G.R., JEBB,S.A., BINGHAM, S.A., LIVINGSTONE, B.E., andCOWARD, W.A. 1993. Measurements of total energyexpenditure provide insights into the validity of dietarymeasures of energy intake. Journal of the American DieteticAssociation 93(5):572 – 579.
DIET OF JAMES BAY CREE WOMEN • 187
CAMPBELL, M. L., DIAMANT, R.M.F., MACPHERSON, B.D.,GRUNAU, M., and HALLADAY, J. 1994a. Energy and nutrientintakes of men (56 –74 years) and women (16 –74) in threenorthern Manitoba Cree communities. Journal of the CanadianDietetic Association 55(4):167 –174.
CAMPBELL, M.L., DIAMANT, R., MARGARET, G., andHALLADAY, J. 1994b. Surveys in Aboriginal communities:Methodological considerations. Canadian Home EconomicsJournal 44(3):118 –122.
DAVELUY, C., LAVALLEÉ, C., CLARKSON, M., andROBINSON, E. 1994. A health profile of the Cree: Report of theSanté Québec Health Survey of the James Bay Cree 1991.Ministère de la Santé et des Services Sociaux, Government ofQuebec.
DEAN, A.G., DEAN, J.A., COULOMBIER, D., BRENDEL, K.A.,SMITH, D.C., BURTON, A.H., DICKER, R.C., SULLIVAN,K., FAGAN, R.F., and ARNER, T.G. 1994. Epi-Info, Version 6:A word-processing, database, and statistics program forepidemiology on microcomputers. Atlanta, Georgia: Centersfor Disease Control and Prevention.
DELORMIER, T. 1993. Traditional food of the James Bay Cree:Observations from Chisasibi and Mistissini for summer 1992.Unpubl. report. Available at the Centre for Indigenous Peoples’Nutrition and Environment, Macdonald Campus of McGillUniversity, 21111 Lakeshore Road, Ste. Anne de Bellevue,Quebec H9X 3V9, Canada.
FARKAS, C.S., and BERKES, F. 1978. Eastern James Bay CreeIndians: Changing patterns of wild food use and nutrition.Ecology of Food and Nutrition 7:155 –172.
GIBSON, R.S. 1990. Principles of nutritional assessment. NewYork: Oxford University Press.
HEALTH AND WELFARE CANADA. 1990. Nutritionrecommendations: The report of the Scientific ReviewCommittee. Ottawa: Minister of Supply and Services Canada.
JAMES BAY AND NORTHERN QUEBEC NATIVEHARVESTING RESEARCH COMMITTEE. 1982. The wealthof the land: Wildlife harvests by the James Bay Cree, 1972 –73to 1978 – 79. Quebec City: James Bay and Northern QuebecNative Harvesting Research Committee.
KUHNLEIN, H.V. 1995. Benefits and risks of traditional food forIndigenous Peoples: Focus on dietary intakes of Arctic men.Canadian Journal of Physiology and Pharmacology 73:765–771.
KUHNLEIN, H.V., RECEVEUR, O., MORRISON, N.E.,APPAVOO, D.M., SOUEIDA, R., and PIERROT, P. 1995.Dietary nutrients of Sahtú Dene/Métis vary by food source,season and age. Ecology of Food and Nutrition 34:183 –195.
KUHNLEIN, H.V., SOUEIDA, R., and RECEVEUR, O. 1996.Dietary nutrient profiles of Canadian Baffin Island Inuit differby food source, season, and age. Journal of the AmericanDietetic Association 92:2:155 –162.
McDOWELL, M.A., BRIEFEL, R.R., ALAIMO, K., BISCHOF,A., CAUGHMAN, C.R., CARROLL, M.D., LORIA, C.M., andJOHNSON, C.L. 1994. Energy and macronutrient intakes ofpersons ages 2 months and over in the United States: ThirdNational Health and Nutrition Examination Survey, phase 1,1988-91. Advance Data 255:1 –25.
MERTZ, W., TSUI, J.C., JUDD, J.T., REISER, S., HALLFRISCH,J., MORRIS, E.R., STEELE, P.D., and LASHLEY, E. 1991.What are people really eating? The relation between energyintake derived from estimated diet records and intake determinedto maintain body weight. American Journal of Clinical Nutrition54:291 – 295.
MURPHY, S.P., and GROSS, K.R. 1989. The UCB MiniList DietAnalysis System. MS-DOS Version User’s Guide (RevisedJune 1987). Berkeley, California: The Regents of the Universityof California.
SAS INSTITUTE INC. 1989. Statistical Analysis Systems forPersonal Computers, Version 6.03. SAS/STAT Guide forPersonal Computers. 6th ed. Cary, North Carolina: SAS InstituteInc.
SCHAEFER, O. 1977. Changing dietary patterns in the CanadianNorth: Health, social and economic consequences. Journal ofthe Canadian Dietetic Association 38(1):17 –25.
SEVENHUYSEN, P., and BOGERT-O’BRIEN, L.A. 1987. Nutrientintake of women and school children in northern ManitobaNative communities. Journal of the Canadian Dietetic Association48(2):89 –94.
THOUEZ, J.P., RANNOU, A., and FOGGIN, P. 1989. The otherface of development: Native population, health status andindicators of malnutrition – The case of the Cree and Inuit ofNorthern Quebec. Social Science and Medicine 29(8):965 –974.
WEIN, E.E. 1995. Nutrient intakes of First Nations peoples infour Yukon communities. Nutrition Research 15(8):1105 –1119.
WEIN, E.E., SABRY, J.H., and EVERS, F.T. 1991. Nutrientintakes of Native Canadians near Wood Buffalo NationalPark. Nutrition Research 11:5 – 13.
WEIN, E.E., GEE, M.I., and HAWRYSH, Z.J. 1993. Nutrientintakes of Native mothers and school children in northernAlberta. Journal of the Canadian Dietetic Association 54(1):42–47.
YOUNG, T.K. 1994. The health of Native Americans: Towards abiocultural epidemiology. New York: Oxford University Press.