Health Is Above Wealth Diet and Health Nutrition and Health ...
Upload
khangminh22Category
view
4download
0
Health and what affects itin the Cree Communitiesof Eeyou Istchee
A Compilation of Recent Statistics
July 2001
Compiled by: Brian Schnarch
for
Cree Board of Health and SocialServices of James Bay
And the
Public Health Module— CreeRegion of James Bay
Health and What Affects it in the Cree Communities of Eeyou Istchee. p. i
Acknowledgements
Elizabeth Robinson∗, Jill Torrie∆ and Robert Harris= provided direction, source materialsand extensive review. Kai-Lei Samchuckn entered data and revised the text. RobertChoinièrem also provided a detailed review.
The Cree Board of Health and Social Services of James Bay and the Ministère de laSanté et des Services sociaux du Gouvernement du Québec jointly provided thefinancing for this project and report through a research grant from the Public HealthResearch Grants Program (Quebec).
© All rights reservedCree Board of Health and Social Services of James BayChisasibi, Quebec JOM 1E0
ISBN: 0-9687017-9-5Legal deposit: 2nd trimester 2001National Library of CanadaBibliothèque Nationale du Québec
∗ Public Health Physician, Public Health Module- Cree Region of James Bay∆ Research Officer, Public Health Module- Cree Region of James Bay= Coordinator of Public Health, Cree Board of Health and Social Services of James Bayn Tamarack Consultingm Public Health Department, Regional Board of Health and Social Services—Montreal Centre.

Health and What Affects it in the Cree Communities of Eeyou Istchee. p. ii
Table of Contents
Acknowledgements ____________________________________________________________ i
Map of Eeyou Istchee communities _______________________________________________ii
Map of Eeyou Istchee communities ______________________________________________ iii
List of tables_________________________________________________________________ iv
List of charts _______________________________________________________________ xiv
Introduction__________________________________________________________________ 1
1. General Determinants of Health___________________________________________ 31.1. Population and population growth _______________________________________ 41.2. Socio-demographic factors ___________________________________________ 251.3. Socio-economic factors ______________________________________________ 36
2. Specific determinants of health: behaviour, lifestyle, risk and protective factors __ 64
3. Health Services- Resources and Utilization _________________________________ 80
4. Health Status _________________________________________________________ 97
*
* Community icons from Grand Council of the Crees website (www.gcc.ca)
Health and What Affects it in the Cree Communities of Eeyou Istchee. p. iii
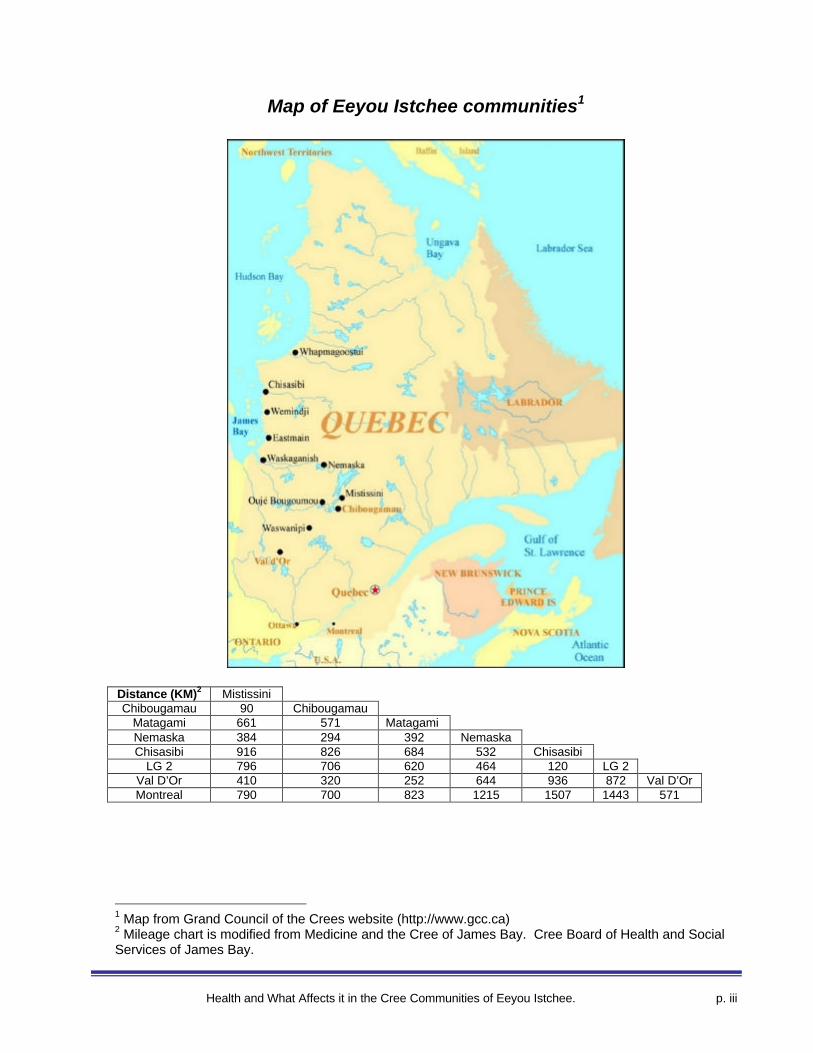
Map of Eeyou Istchee communities1
Distance (KM)2 MistissiniChibougamau 90 Chibougamau
Matagami 661 571 MatagamiNemaska 384 294 392 NemaskaChisasibi 916 826 684 532 Chisasibi
LG 2 796 706 620 464 120 LG 2Val D’Or 410 320 252 644 936 872 Val D’OrMontreal 790 700 823 1215 1507 1443 571
1 Map from Grand Council of the Crees website (http://www.gcc.ca)2 Mileage chart is modified from Medicine and the Cree of James Bay. Cree Board of Health and SocialServices of James Bay.
Health and What Affects it in the Cree Communities of Eeyou Istchee. p. iv
List of tables
Table 1.1.1: Estimated resident population, Cree and non-Cree (Institut National de laStatistique du QUEBEC, 1999) __________________________________________________ 7
Table 1.1.2: Resident population by age, comparison of sources (1996) __________________ 8
Table 1.1.3: Resident population by community; sources compared (1996) _______________ 9
Table 1.1.4: Cree resident beneficiary population by community and year, 1982-2000 (QuebecMinistry of Health and Social Services)___________________________________________ 10
Table 1.1.5: Percentage change in the Cree beneficiary population by community and period(Quebec Ministry of Health and Social Services) ___________________________________ 11
Table 1.1.6: Cree beneficiaries, community of affiliation vs. community of residence, July2000 (Quebec Ministry of Health and Social Services). ______________________________ 11
Table 1.1.7: Cree beneficiaries, by place of residence and period (Quebec Ministry of Healthand Social Services). __________________________________________________________ 12
Table 1.1.8 Registered Indian population residing in Eeyou Istchee, 1972-99 (Indian andNorthern Affairs)_____________________________________________________________ 13
Table 1.1.9: Cree beneficiaries of the James Bay Agreement by residence, 1999 (QuebecMinistry of Health and Social Services)___________________________________________ 14
Table 1.1.10: Cree beneficiaries of the James Bay Agreement by residence, 1999, females only(Quebec Ministry of Health and Social Services) ___________________________________ 15
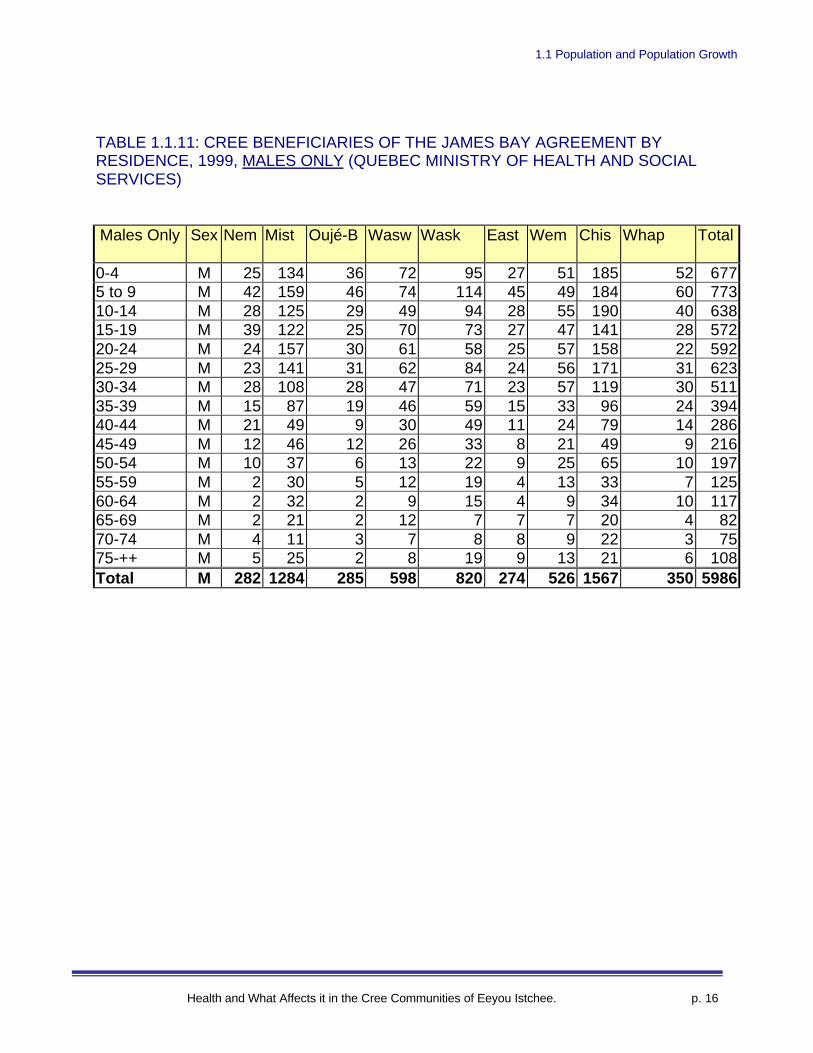
Table 1.1.11: Cree beneficiaries of the James Bay Agreement by residence, 1999, males only(Quebec Ministry of Health and Social Services) ___________________________________ 16
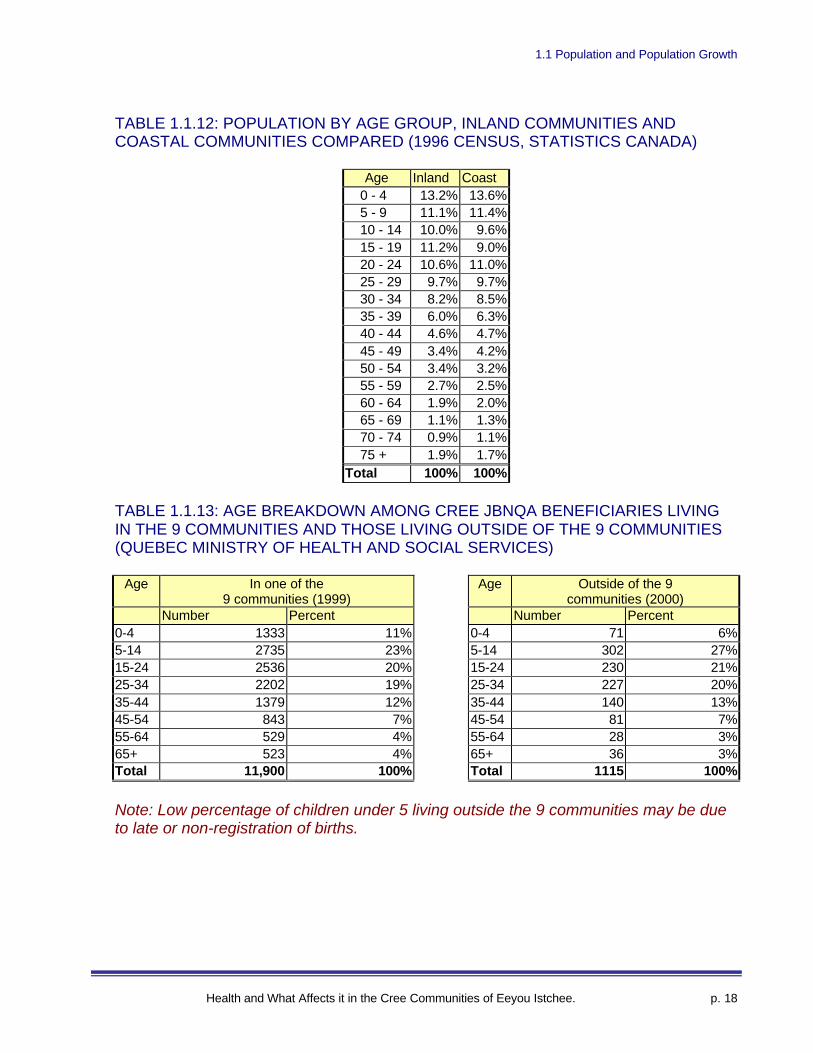
Table 1.1.12: Population by age group, inland communities and coastal communitiescompared (1996 Census, Statistics Canada) _______________________________________ 18
Table 1.1.13: Age breakdown among Cree JBNQA beneficiaries living in the 9 communitiesand those living outside of the 9 communities (Quebec Ministry of Health and SocialServices)____________________________________________________________________ 18
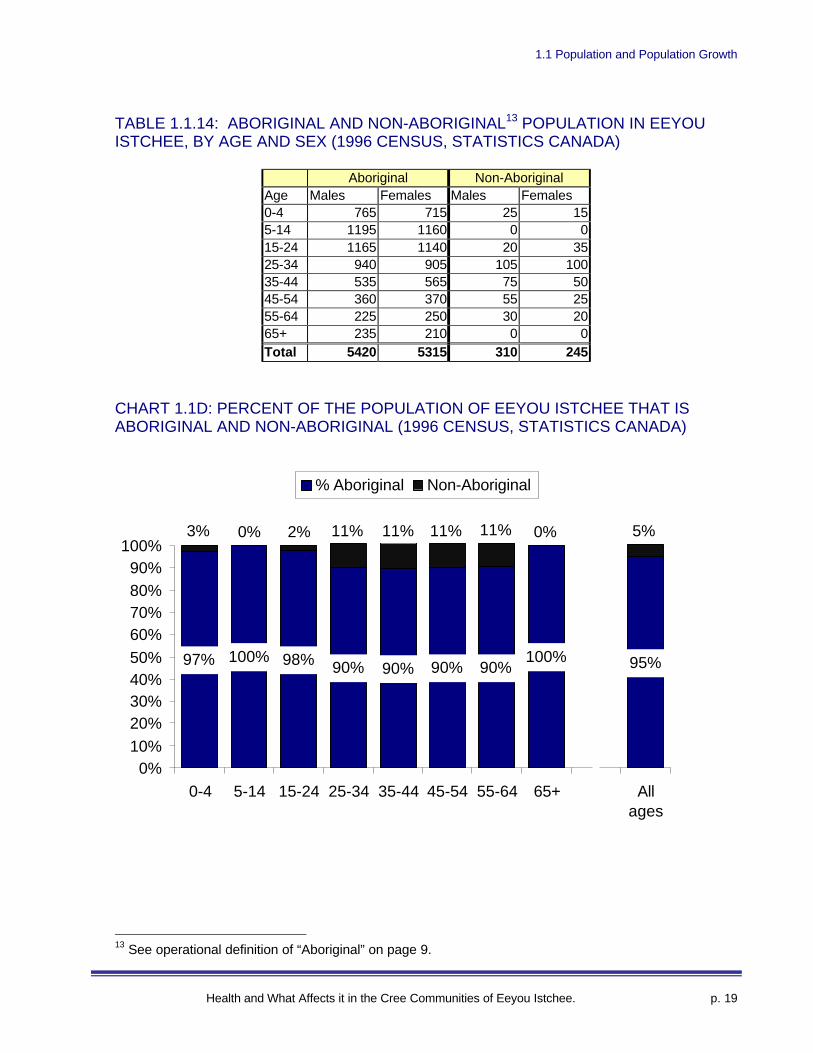
Table 1.1.14: Aboriginal and non-Aboriginal population in Eeyou Istchee, by age and sex(1996 Census, Statistics Canada) ________________________________________________ 19
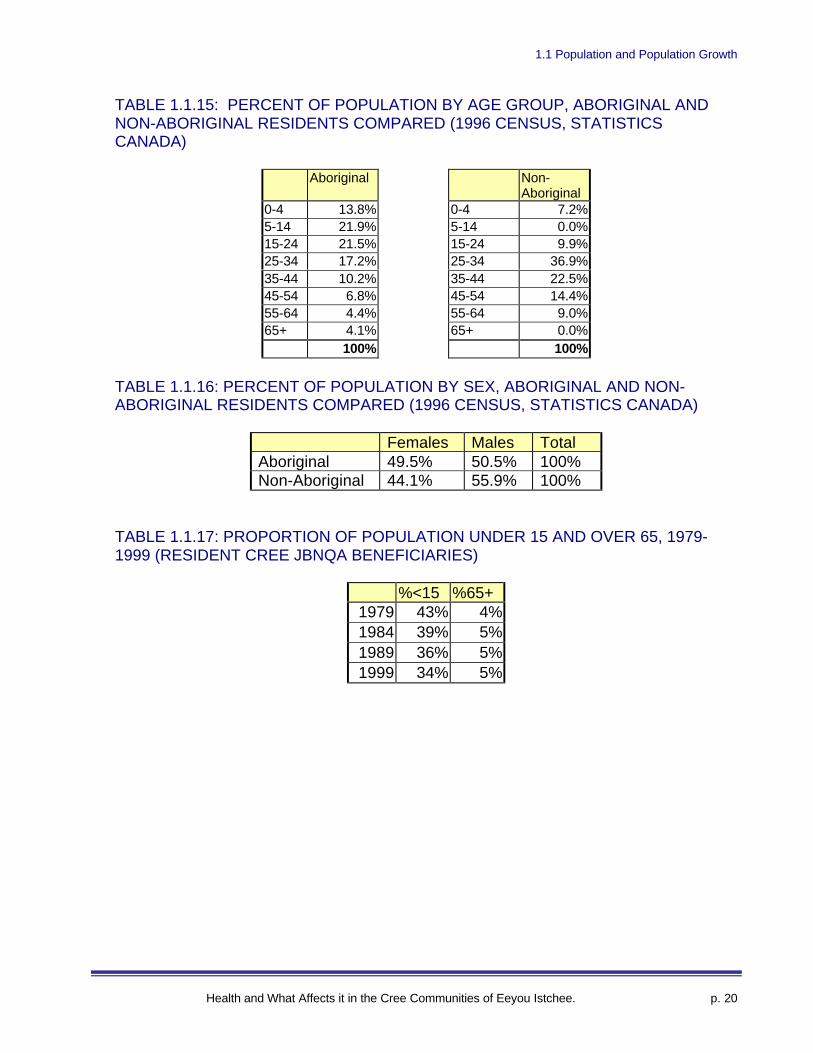
Table 1.1.15: Percent of population by age group, Aboriginal and non-Aboriginal residentscompared (1996 Census, Statistics Canada) _______________________________________ 19
Table 1.1.15: Percent of population by age group, Aboriginal and non-Aboriginal residentscompared (1996 Census, Statistics Canada) _______________________________________ 20
Table 1.1.16: Percent of population by sex, Aboriginal and non-Aboriginal residentscompared (1996 Census, Statistics Canada) _______________________________________ 20
Table 1.1.17: Proportion of population under 15 and over 65, 1979-1999 (Resident CreeJBNQA Beneficiaries)_________________________________________________________ 20
Health and What Affects it in the Cree Communities of Eeyou Istchee. p. v
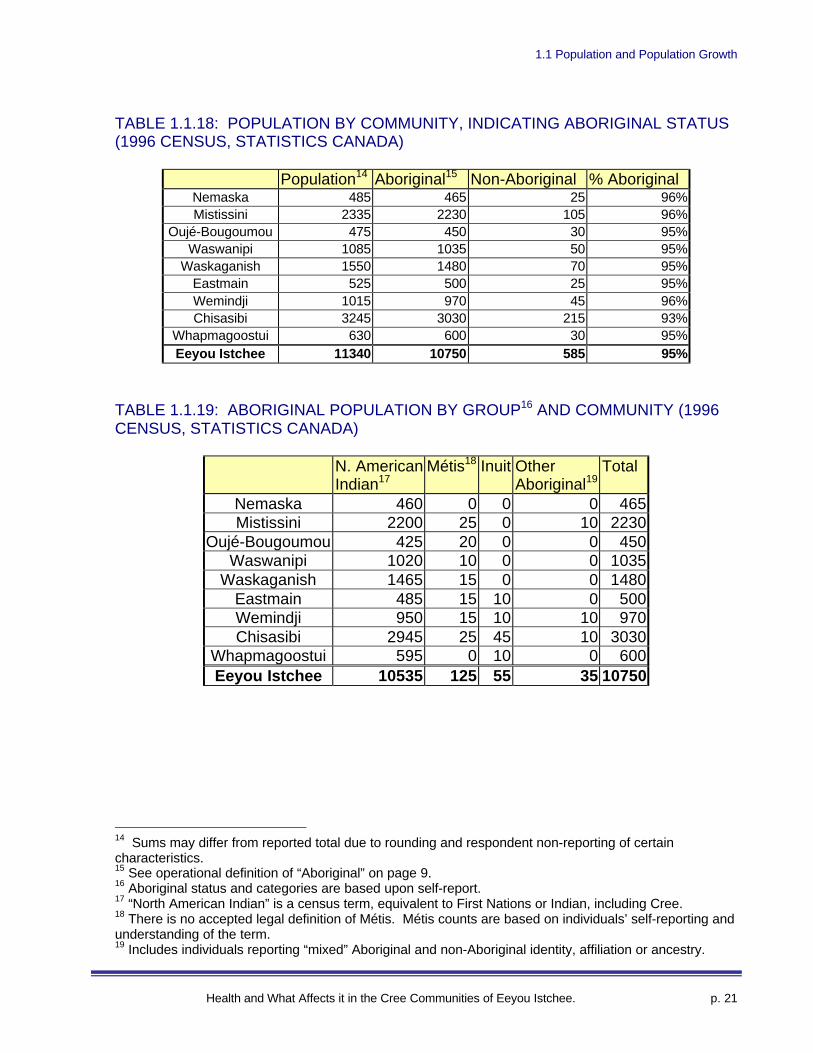
Table 1.1.18: Population by community, indicating Aboriginal status (1996 Census, StatisticsCanada) ____________________________________________________________________ 21
Table 1.1.19: Aboriginal population by group and community (1996 Census, StatisticsCanada) ____________________________________________________________________ 21
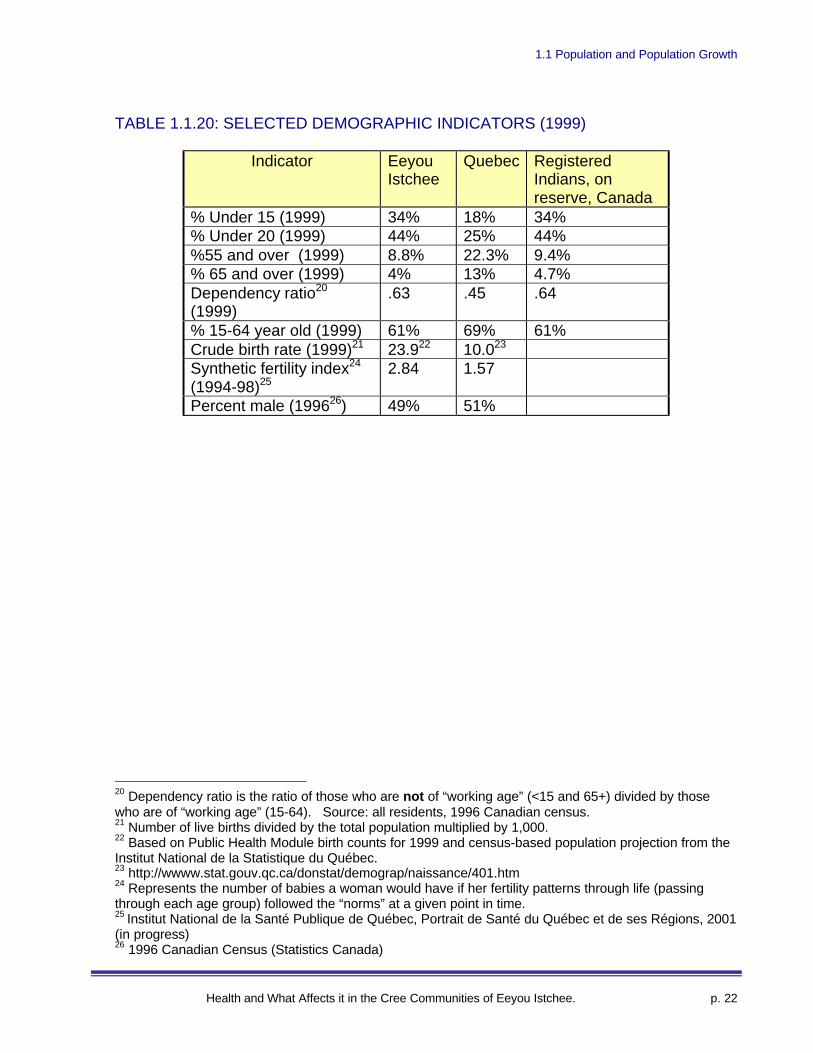
Table 1.1.20: Selected demographic indicators (1999) _______________________________ 22
Table 1.1.21: Number of births and crude birth rate by year, 1985-99 __________________ 23
Table 1.1.22: Number of births per year, sources compared, 1985-98 ___________________ 23
Table 1.2.1: Population 15 years and over by marital status, compared (1996 Census, StatisticsCanada) ____________________________________________________________________ 26
Table 1.2.2: Percent of families headed by single parents vs two-parents, compared (1996Census, Statistics Canada) _____________________________________________________ 27
Table 1.2.3: Percent of families headed by single parents vs two-parents, compared (1996Census, Statistics Canada) _____________________________________________________ 27
Table 1.2.4: Proportion of individuals 65 years and older living alone (1996 Census, StatisticsCanada) ____________________________________________________________________ 27
Table 1.2.5: Average number of persons, by family type and community (1996 Census,Statistics Canada) ____________________________________________________________ 28
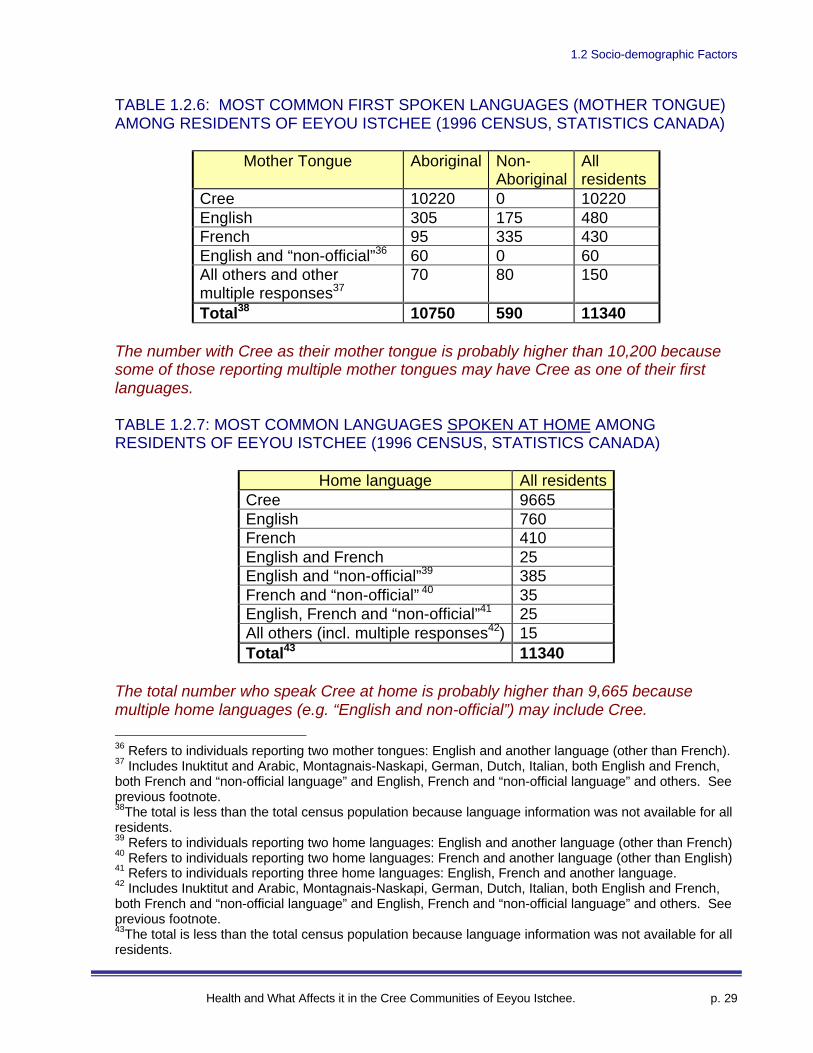
Table 1.2.6: Most common first spoken languages (mother tongue) among residents of EeyouIstchee (1996 Census, Statistics Canada)__________________________________________ 29
Table 1.2.7: Most common languages spoken at home among residents of Eeyou Istchee (1996Census, Statistics Canada) _____________________________________________________ 29
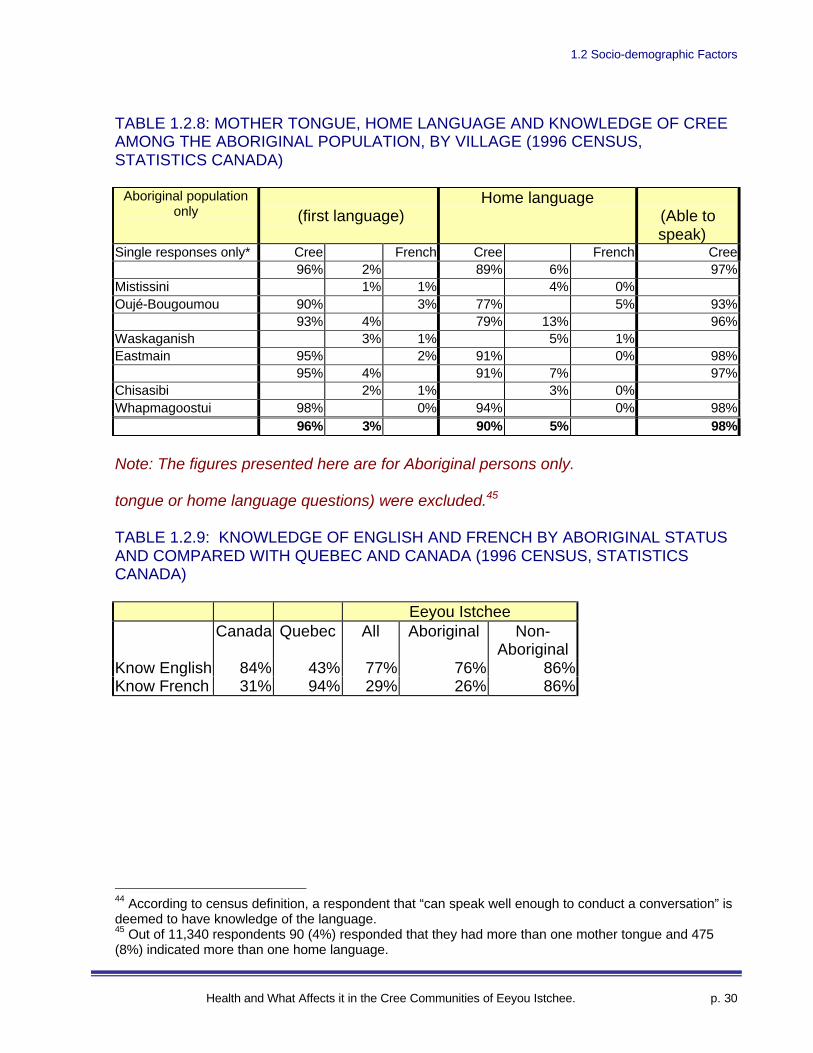
Table 1.2.8: Mother tongue, home language and knowledge of Cree among the Aboriginalpopulation, by village (1996 Census, Statistics Canada)______________________________ 30
Table 1.2.9: Knowledge of English and French by aboriginal status and compared withQuebec and Canada (1996 Census, Statistics Canada)_______________________________ 30
Table 1.2.10: Knowledge of English and French by community and compared with Quebecand Canada (1996 Census, Statistics Canada) _____________________________________ 31
Table 1.2.11: Knowledge of English and French by community and compared with Quebecand Canada (1996 Census, Statistics Canada) _____________________________________ 32
Table 1.2.12: Knowledge46 of English and French by age (1996 Census, Statistics Canada) 32
Table 1.2.13: Knowledge of English and French by period (1986 & 1996 Census, StatisticsCanada) ____________________________________________________________________ 33
Table 1.2.14: Proportion of residents that moved (changed residence) between 1991 and 1996(1996 Census, Statistics Canada) ________________________________________________ 34
Table 1.2.15: Number of people by moving status, year prior and 5 years prior to 1996 census(1996 Census, Statistics Canada) ________________________________________________ 34
Table 1.3.1: Highest level of schooling completed among those 15 years and over (1996Census, Stat+-istics Canada) ___________________________________________________ 38
Health and What Affects it in the Cree Communities of Eeyou Istchee. p. vi
Table 1.3.2: Level of education among those 15 years and over, by community (1996 Census,Statistics Canada) ____________________________________________________________ 38
Table 1.3.3: Proportion of persons 15 and over with less than 9 years of schooling, by period(Various years, Census, Statistics Canada) ________________________________________ 39
Table 1.3.4: Proportion of persons 15 and over with a university degree, by period (1986 &1996 Census, Statistics Canada)_________________________________________________ 39
Table 1.3.5: Level of education among those 15 years and over, by Aboriginal status (1996Census, Statistics Canada) _____________________________________________________ 39
Table 1.3.6: Number employed, unemployed and not in the labour force, 15 years and over, bycommunity (1996 Census, Statistics Canada) ______________________________________ 40
Table 1.3.7: Number employed, unemployed and not in the labour force, 20 to 64 years of age,by community (1996 Census, Statistics Canada) ____________________________________ 41
Table 1.3.8: Percent of those 20-64 years of age that were in the labour force, compared (1996Census, Statistics Canada) _____________________________________________________ 41
Table 1.3.9: unemployment rate and Employment-to-population ratio among those 15 yearsand over, by community (1996 Census, Statistics Canada)____________________________ 42
Table 1.3.10: Employment-to-population ratio and unemployment rate among those 20 to 64years of age, by community (1996 Census, Statistics Canada) _________________________ 43
Table 1.3.11: unemployment rate by age, compared (1996 Census, Statistics Canada) _____ 43
Table 1.3.12: Employment-to-population ratio by age and sex (1996 Census, StatisticsCanada) ____________________________________________________________________ 45
Table 1.3.13: Employment to population ratio among those 15 years and over, by period(Various years, Census, Statistics Canada) ________________________________________ 45
Table 1.3.14: Employment-to-population ratio, by age group and sex (1996 Census, StatisticsCanada) ____________________________________________________________________ 45
Table 1.3.15: Employment-to-population ratio and unemployment rate among those 20-64years of age, by sex, compared (1996 Census, Statistics Canada) ______________________ 46
Table 1.3.16: Employment-to-population ratio for those 25 years and over by sex andAboriginal status (1996 Census, Statistics Canada) _________________________________ 46
Table 1.3.17: Workers by type among those 15 years and over (1996 Census, StatisticsCanada) ____________________________________________________________________ 48
Table 1.3.18: Employment-to-population ratio among those 15 years and over by sex and bypresence of children at home (1996 Census, Statistics Canada)________________________ 49
Table 1.3.19: number of cree employed and unemployed by community, 1994 (Hawkins et al.).___________________________________________________________________________ 50
Table 1.3.20: Cree Labour force by community and source of income, 1994 (Hawkins et al.).___________________________________________________________________________ 51
Health and What Affects it in the Cree Communities of Eeyou Istchee. p. vii
Table 1.3.21: Income source of the employed Labour force in Cree region by community andsource of income (Hawkins et al.). _______________________________________________ 51
Table 1.3.22: enrolment in the Cree Hunters and Trappers Income Security Program, overtime (Cree Hunters and Trappers income Security Board, 2000)_______________________ 52
Table 1.3.23: average number of days compensated for harvesting by type of family, 1998-99(Cree Hunters and Trappers income Security Board, 2000)___________________________ 53
Table 1.3.24: Number of units by Level of Benefits paid, 1998-99 (Cree Hunters and Trappersincome Security Board, 2000)___________________________________________________ 53
Table 1.3.25: Hours of unpaid housework per week by sex, Quebec and Eeyou Istcheecompared (1996 Census, Statistics Canada) _______________________________________ 53
Table 1.3.26: Hours of unpaid childcare per week by sex, Quebec and Eeyou Istcheecompared (1996 Census, Statistics Canada) _______________________________________ 54
Table 1.3.27: Hours of unpaid care to seniors per week by sex, Quebec and Eeyou Istcheecompared (1996 Census, Statistics Canada) _______________________________________ 54
Table 1.3.28: Welfare rate, 2000 (Institut National de la santé publique) ________________ 54
Table 1.3.29: Average employment income in 1995 of those 15 years and over withemployment income by sex; Quebec and Eeyou Istchee compared (1996 Census, StatisticsCanada) ____________________________________________________________________ 55
Table 1.3.30: Average employment income in 1995 among those 15 and over with employmentincome in 1995, by sex and Aboriginal status (1996 Census, Statistics Canada) __________ 56
Table 1.3.31: Average and median total income in 1995 among those 15 and over by sex,Eeyou Istchee and Quebec compared (1996 Census, Statistics Canada) _________________ 56
Table 1.3.32: Average total income in 1995 among those 15 years and over, residing in EeyouIstchee, by Aboriginal status and sex (1996 Census, Statistics Canada) _________________ 57
Table 1.3.33: Proportion by total income among those 15 and over, by sex, Eeyou Istchee andQuebec compared (1996 Census, Statistics Canada)_________________________________ 58
Table 1.3.34: Proportion at “extremities” of total income ranges among those 15 and over, bycommunity (1996 Census, Statistics Canada) ______________________________________ 60
Table 1.3.35: Average total combined family income by family type and community (1996Census, Statistics Canada) _____________________________________________________ 60
Table 1.3.36: Northern Food Basket, 1996 (Indian and Northern Affairs, Canada) _______ 61
Table 1.3.37: Average number of persons per room, by community (1996 Census, StatisticsCanada) ____________________________________________________________________ 61
Table 1.3.38: Proportion of occupied dwellings with more than one person per room, bycommunity (1996 Census, Statistics Canada) ______________________________________ 62
Table 1.3.39: Proportion of occupied dwellings with more than one person per room in EeyouIstchee, 1986 and 1996 (1986 & 1996 Census, Statistics Canada) ______________________ 62
Health and What Affects it in the Cree Communities of Eeyou Istchee. p. viii
Table 1.3.40: Average number of occupants per housing unit, 1999 (Hawkins et al, Indian andnorthern affairs) _____________________________________________________________ 63
Table 2.1: Smoking status by age, 1991 (Santé Québec Health Survey) _________________ 66
Table 2.2: Number of cigarettes smoked per day among regular smokers over 15 years of age,by sex 1991 (Santé Québec Health Survey) ________________________________________ 67
Table 2.3: Number of cigarettes smoked per day among regular smokers, over 15 years of age,Cree 1991 and Quebec 1992-93 compared (Santé Québec Health Survey) _______________ 67
Table 2.4: Types of alcohol drinkers, 15 years and up, Eeyou Istchee 1991 and Quebec 1992-3compared (Santé Québec Health Survey) _________________________________________ 67
Table 2.5: Proportion of drinkers consuming five drinks or more per occasion, by age, 1991(Santé Québec Health Survey) __________________________________________________ 68
Table 2.6: Proportion of Cree drinkers consuming five drinks or more a day when they drink,by sub region, 1991 (Santé Québec Health Survey) _________________________________ 68
Table 2.7: Problems related to alcohol consumption in the 12 months preceding the survey bysex, 15 years and over, 1991 (Santé Québec Health Survey) __________________________ 69
Table 2.8: Proportion of at-risk drinkers according to the CAGE, ADI and modified ADIindices, by age and sex, 1991 (Santé Québec Health Survey)__________________________ 69
Table 2.9: Lifetime consumption of various types of drugs among those 15 and over by sex,1991 (Santé Québec Health Survey)______________________________________________ 70
Table 2.10: Drug consumption during the 12 months preceding the survey, by age and sex,1991(Santé Québec Health Survey) ______________________________________________ 70
Table 2.11: Prevalence of suicidal thoughts among those 15 and over during the 12 monthspreceding the survey, compared (Santé Québec Health Survey) _______________________ 70
Table 2.12: Physical activity level during daily activities, by sex, 1991 (Santé Québec HealthSurvey) _____________________________________________________________________ 71
Table 2.13: Measured body mass index (BMI) by age, 18 to 74 years, 1991 (Santé QuébecHealth Survey)_______________________________________________________________ 72
Table 2.14: Percentage with a body mass index of 30 or over, 193, 1989 and 1991, by sex(Public Health Module— Cree Region of James Bay) _______________________________ 72
Table 2.15: Measured body mass index (BMI) by sex, 18 to 74 years, 1991 (Santé QuébecHealth Survey)_______________________________________________________________ 72
Table 2.16: Proportion of women who had at least one PAP test (lifetime) by age, Cree 1991vs. Quebec 1992-93 (Santé Québec Health Survey)__________________________________ 73
Table 2.17: Proportion of women who had at least one PAP test in previous 2 years, Cree 1991vs. Quebec 1992-93 (Santé Québec Health Survey)__________________________________ 73
Table 2.18: Time elapsed since last cervical cancer (PAP) test by age group, 1991 (SantéQuébec Health Survey) ________________________________________________________ 73
Health and What Affects it in the Cree Communities of Eeyou Istchee. p. ix
Table 2.19: Proportion of women who performed at least one breast self-exam (lifetime), byage, Eeyou Istchee 1991 vs. Quebec 1992-93 (Santé Québec Health Survey) _____________ 73
Table 2.20: Proportion of women who had a breast exam by a professional (lifetime), by age,Eeyou Istchee 1991 vs. Quebec 1992-93 (Santé Québec Health Survey) _________________ 74
Table 2.21: Percent of births to mothers under 18 and under 20 years of age, regionscompared, 1997 (Quebec Ministry of Health and Social Services)______________________ 74
Table 2.22: Teenage fertility rate (INSPQ) ________________________________________ 74
Table 2.23: Percent of births in Eeyou Istchee to women under 18 and under 20 years of ageby year (Public Health Module— Cree Region of James Bay)_________________________ 75
Table 2.24: Percent of births to women under 20 years of age by community, 1985-98 (PublicHealth Module— Cree Region of James Bay)______________________________________ 75
Table 2.25: Percentage of low birth weight and macrosomic infants by mother’s age group,1985-1995 (Armstrong et al, 1998)_______________________________________________ 75
Table 2.26: Percent of newborns with low birth weight (<2,500 grams) by region, 1994-98(INSPQ)____________________________________________________________________ 76
Table 2.27: Percent of deliveries by caesarean section: deliveries by mothers from EeyouIstchee, 1986-87 and 1991-92 to 1998-99 (Quebec Ministry of Health and Social Services) _ 76
Table 2.28: Rate of certain obstetrical interventions performed during deliveries by mothersfrom Eeyou Istchee, 1986-87 and 1991-92 to 1994-95 (Quebec Ministry of Health and SocialServices)____________________________________________________________________ 76
Table 2.29: Rate of certain obstetrical interventions, 1994-95 compared (Quebec Ministry ofHealth and Social Services) ____________________________________________________ 77
Table 2.30: Percent of deliveries by Caesarean section compared, 1998-99 (Quebec Ministry ofHealth and Social Services) ____________________________________________________ 77
Table 2.31: Percent of births that were premature (<37 weeks gestation) by region, 1994-98(INSPQ)____________________________________________________________________ 77
Table 2.32: Prevalence of breastfeeding over time, 1988 and 1993 (Public Health Module—Cree Region of James Bay)_____________________________________________________ 78
Table 2.33: Proportion of children breastfed, 1999 (Cree Regional Authority, 1999)_______ 78
Table 3.1: Gross expenditures by sector 1997-98 (Quebec Ministry of Health and SocialServices)____________________________________________________________________ 83
Table 3.2: Total gross expenditures by year (Quebec Ministry of Health and Social Services)84
Table 3.3: Gross expenditures per capita compared (Quebec Ministry of Health and SocialServices)____________________________________________________________________ 84
Table 3.4: Actual net expenditures for client programs in the James-Bay-Cree Region, 1993-94 to 1997-98 (Quebec Ministry of Health and Social Services, 1999) __________________ 85
Table 3.5: number of beds in general and specialized care in eeyou istchee, 1991-1999(Quebec Ministry of Health and Social Services) ___________________________________ 86

Health and What Affects it in the Cree Communities of Eeyou Istchee. p. x
Table 3.6: Breakdown of authorized beds in private or public institutions, by category, March1999 (Quebec Ministry of Health and Social Services)_______________________________ 86
Table 3.7: Distribution of the network's workforce, by staff category, Northern Regions, 1997-98 (Quebec Ministry of Health and Social Services -SDI, DGI, DGPSE, 1999) ___________ 86
Table 3.8: Number of general practitioners and specialists per 1,000 people by principalregion of practice, 1998 (Quebec Ministry of Health and Social Services, 1999) __________ 87
Table 3.9: Number of general practioners and specialists (equivalent-to-full-time) per 1,000persons by category, October 1997-March 1998 (Quebec Ministry of Health and SocialServices, 1999)_______________________________________________________________ 87
Table 3.10: Number of nurses and equivalent to full time nurses employed by category, EeyouIstchee, 1998-99 (Quebec Ministry of Health and Social Services, November 2000) _______ 88
Table 3.11: Number of nurses and equivalent-to-full-time nurses employed, 1998-99 (derivedfrom Quebec Ministry of Health and Social Services, November 2000) _________________ 88
Table 3.12: Number of equivalent-to-full-time nurses employed per 1,000 persons, 1998-99(derived from Quebec Ministry of Health and Social Services, November 2000) __________ 89
Table 3.13: Region of hospitalization for residents of Eeyou Istchee, by period (short termphysical care only, excluding newborns) __________________________________________ 89
Table 3.14: Percent of hospitalizations occurring in resident’s own region, by period (shortterm physical care only, excluding newborns)______________________________________ 89
Table 3.15 Percent of hospitalizations in Nord-du-Québec region by patient’s region ofresidence and period (short term physical care only, excluding newborns)_______________ 90
Table 3.16: Births to residents of Eeyou Istchee by place of birth, 1999 (Public HealthModule— Cree Region of James Bay, 2000)_______________________________________ 90
Table 3.17: Selected indicators for short-term care by region of reporting institution, 1997-98(Quebec Ministry of Health and Social Services, 2000) ______________________________ 91
Table 3.18: Number of hospitalizations and average stay in active care centers by region ofresidence, 1989-90 and 1996-97 _________________________________________________ 91
Table 3.19: Number of stays for short-term hospitalizations in general and specialized careinstitutions by type of care and period, residents of Eeyou Istchee (Quebec Ministry of Healthand Social Services, 1999) _____________________________________________________ 92
Table 3.20: Number of stays for short-term hospitalizations in general and specialized careinstitutions by type of care and period, treatment in Eeyou Istchee (Quebec Ministry of Healthand Social Services, 1999) _____________________________________________________ 92
Table 3.21: Length of stay for short-term hospitalizations in general and specialized careinstitutions by type of care and period, residents of Eeyou Istchee (Quebec Ministry of Healthand Social Services, 1999) _____________________________________________________ 93
Table 3.22: Length of stay for short-term hospitalizations in general and specialized careinstitutions by type of care and period, treatment in Eeyou Istchee (Quebec Ministry of Healthand Social Services, 1999) _____________________________________________________ 93
Health and What Affects it in the Cree Communities of Eeyou Istchee. p. xi
Table 3.23: Average Length of stay (days) for short-term hospitalizations in general andspecialized care institutions by type of care and period, residents of Eeyou Istchee (QuebecMinistry of Health and Social Services, 1999)______________________________________ 94
Table 3.24: Average length of stay (days) for short-term hospitalizations in general andspecialized care institutions by type of care and period, treatment in Eeyou Istchee (QuebecMinistry of Health and Social Services, 1999)______________________________________ 94
Table 3.25: Average length of stay (days) for short-term hospitalizations in general andspecialized care institutions by region of residence, (Quebec Ministry of Health and SocialServices, 1999)_______________________________________________________________ 95
Table 3.26: Number of short term care hospitalizations (excluding newborns) per personHospitalized for 1992-93 and 1997-98 (Quebec Ministry of Health and Social Services, 1999)___________________________________________________________________________ 95
Table 3.27: Number of surgeries performed on residents of Eeyou Istchee, by type of surgeryand period (Quebec Ministry of Health and Social Services, 1999) _____________________ 95
Table 3.28: Age-adjusted rate of surgeries performed on residents of Eeyou Istchee, by type ofsurgery, compared (Quebec Ministry of Health and Social Services, 1999) ______________ 96
Table 4.1: Notifiable diseases (“MADOs”- Maladies à déclaration obligatoire), by year(Laboratoire de santé publique du Québec, central database) _________________________ 99
Table 4.2: Declared tuberculosis cases by age group, 1992-99 combined (Laboratoire de santépublique du Québec, central database) __________________________________________ 100
Table 4.3: Declared chlamydia cases by age and sex, 1997-1999 combined (Laboratoire desanté publique du Québec, central database)______________________________________ 100
Table 4.4: Number and rate of declared chlamydia cases, 1996-99 by community (Laboratoirede santé publique du Québec, central database) ___________________________________ 102
Table 4.5: declared cases of gonorrhea, 1995-99 combined (Laboratoire de santé publique duQuébec, central database)_____________________________________________________ 102
Table 4.6: Rate of declared gonorrhea cases, compared (Laboratoire de santé publique duQuébec, central database)_____________________________________________________ 103
Table 4.7: Percent of population reporting certain health problems, compared (Santé QuébecHealth Survey)______________________________________________________________ 103
Table 4.8: Rate (prevalence) of diagnosed diabetes, 1989, 1991 1997-2000 (Cree Board ofHealth and Social Services of James Bay, 2000)___________________________________ 103
Table 4.9: Number and rate (prevalence) of diagnosed diabetes cases by COMMUNITY (CreeBoard of Health and Social Services of James Bay, 2000) ___________________________ 104
Table 4.10: Number and rate of diagnosed diabetes cases by age (Cree Board of Health andSocial Services of James Bay, 2000) ____________________________________________ 104
Table 4.11: Blood sugar levels among diabetics (Cree Board of Health and Social Services ofJames Bay, 2000) ___________________________________________________________ 105
Health and What Affects it in the Cree Communities of Eeyou Istchee. p. xii
Table 4.12: Number and percent of diabetics diagnosed with diabetes-related damage, by typeof damage (Cree Board of Health and Social Services of James Bay, 2000)_____________ 105
Table 4.13: Declared cases of Cancer for residents of Eeyou Istchee, by sex and type, 1992-96(Tumour register, Quebec Ministry of Health and Social Services, 1999)_______________ 106
Table 4.14: Declared cases of Cancer for residents of Eeyou Istchee, by age group, 1992-96(Tumour register, Quebec Ministry of Health and Social Services, 1999)_______________ 106
Table 4.15: Life expectancy at birth, by region and sex compared (Quebec Ministry of Healthand Social Services, 1999) ____________________________________________________ 107
Table 4.16: Life expectancy at birth, by sex and period, various sources (Courteau, St-Pierre,Quebec Ministry of Health and Social Services) ___________________________________ 107
Table 4.17: Number of stillbirths by weeks of gestation 1994-98, compared (Institut Nationalde la Statistique du Québec) ___________________________________________________ 108
Table 4.18: Rate of stillbirths 1994-98, compared (Institut National de la Statistique duQuébec) ___________________________________________________________________ 109
Table 4.19: Number of infant deaths by age at death (days) 1994-98 (Institut National de laStatistique du Québec) _______________________________________________________ 109
Table 4.20: Rate of infant deaths by age at death (days) 1994-98, compared (Institut Nationalde la Statistique du Québec) ___________________________________________________ 109
Table 4.21: Rate of infant deaths by age at death and period (Cree Board of Health andSocial Services, Quebec Ministry of Health, Institut National de la Statistique du QUÉBEC)__________________________________________________________________________ 110
Table 4.22: Infant mortality rate, by period, comparison of sources (Robinson, Courteau,Quebec Ministry of Health and Social Services, St-Pierre, Choiniere, Institut National de laStatistique du Québec ) _______________________________________________________ 111
Table 4.23: Number of deaths by cause and year among residents of Eeyou Istchee, 1990-1997(Quebec Ministry of Health and Social Services, 1999) _____________________________ 112
Table 4.24: Number of person-years of life lost by cause of death, 1993-97 (Quebec Ministryof Health and Social Services) _________________________________________________ 113
Table 4.25: Number of deaths in Eeyou Istchee—Two sources compared, by year (Compiledby G. Bérubé, Public Health Module— Cree Region of James Bay) ___________________ 114
Table 4.26: Number of deaths in Eeyou Istchee —Two sources compared, 1993-97 (Compiledby G. Bérubé, Public Health Module— Cree Region of James Bay) ___________________ 114
Table 4.27: Documented suicide counts, comparison of sources (Public Health Module— CreeRegion of James Bay) ________________________________________________________ 115
Table 4.28: Age-adjusted mortality rates by cause compared, 1993-1997 (Quebec Ministry ofHealth and Social Services, 1999) ______________________________________________ 116
Table 4.29: Age-adjusted mortality rates for accidents, poisonings, and traumas by specificcause, by region 1995-97 (Quebec Ministry of Health and Social Services) _____________ 117
Health and What Affects it in the Cree Communities of Eeyou Istchee. p. xiii
Table 4.30: Age-adjusted mortality rates by cause, by sex, Eeyou Istchee and Quebeccompared 1993-97 (Quebec Ministry of Health and Social Services) __________________ 118
Table 4.31A: Number, length and average length of short-term hospitalizations following aninjury, by type and period (Quebec Ministry of Health and Social Services)_____________ 119
Table 4.31B: Variation in percent (1982-3 to 1997-8) of the number, length and averagelength of Short-term hospitalizations following an injury, by type (Quebec Ministry of Healthand Social Services) _________________________________________________________ 119
Table 4.32: Average length of short-term hospitalizations following an injury, by type andregion (Quebec Ministry of Health and Social Services) ____________________________ 120
Table 4.33: Hospitalizations for intentional and non-intentional injuries 1981-86 and 1986-91(Public Health Unit- James Bay Cree)___________________________________________ 121
Table 4.34: Rate of poisonings by region, 1995 (Quebec Ministry of Health and SocialServices)___________________________________________________________________ 121
Health and What Affects it in the Cree Communities of Eeyou Istchee. p. xiv
List of charts
Chart 1.1a: Population of Eeyou Istchee, 1966-1996 (Statistics Canada) _________________ 7
Chart 1.1b: Place of residence of Cree beneficiaries by community of affiliation, July 2000(Quebec Ministry of Health and Social Services) ___________________________________ 12
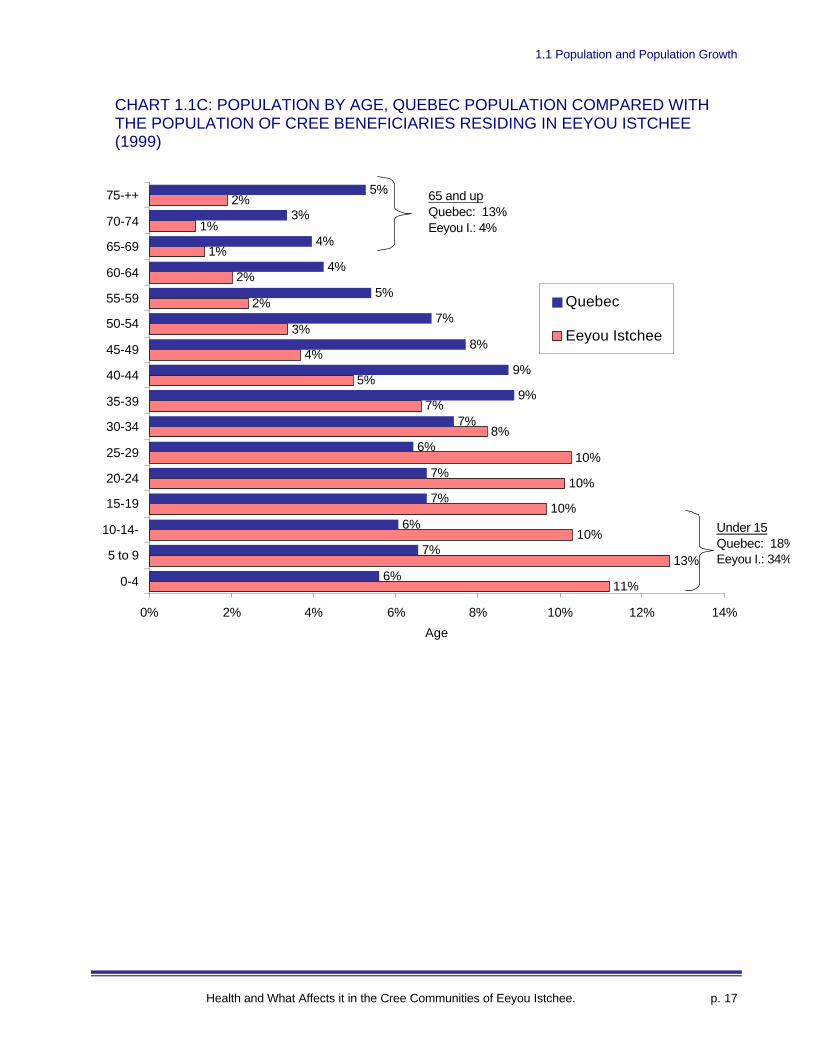
Chart 1.1c: Population by age, Quebec Population compared with the population of CreeBeneficiaries residing in Eeyou Istchee (1999) _____________________________________ 17
Chart 1.1d: Percent of the population of Eeyou Istchee that is Aboriginal and non-Aboriginal(1996 Census, Statistics Canada) ________________________________________________ 19
Chart 1.1e: Aboriginal population residing in the territory 1969-2027 (2000-2027 projected) 24
Chart 1.2a: Proportion that are married (including common-law) among those 15 years andover by community (1996 Census, Statistics Canada) ________________________________ 26
Chart 1.2b: Percent of population that speaks neither French nor English (1996 Census,Statistics Canada) ____________________________________________________________ 33
Chart 1.2c: Proportion of residents by moving status in 5 years prior to 1996 census (1996Census, Statistics Canada) _____________________________________________________ 35
Chart 1.2d: Percent of population who moved (any change of residence) in previous year(1996 Canadian Census, Statistics Canada) _______________________________________ 35
Chart 1.3a: Employment-to-population ratio by age, compared (1996 Census, StatisticsCanada) ____________________________________________________________________ 44
Chart 1.3b: Proportion of workers, 15 years and over that were employed full year, full time in1995, by sex; Quebec and Eeyou Istchee compared (1996 Census, Statistics Canada)______ 47
Chart 1.3c: Proportion of workers, 15 years and over, that were employed full year, full time in1995, by sex and community (1996 Census, Statistics Canada) ________________________ 48
Chart 1.3d: Workers by type and community among those 15 years and over (1996 Census,Statistics Canada) ____________________________________________________________ 49
Chart 1.3E: Average employment income in 1995 of those 15 years and over who worked fulltime full year, by sex and community (1996 Census, Statistics Canada) _________________ 55
Chart 1.3F: Average total income in 1995 among those 15 years and over, by sex andcommunity (1996 Census, Statistics Canada) ______________________________________ 57
Chart 1.3G: Proportion by total income among those 15 and over, by sex (1996 Census,Statistics Canada) ____________________________________________________________ 58
Chart 1.3H: Proportion by total income among those 15 and over, Eeyou Istchee and Quebeccompared (1996 Census, Statistics Canada) _______________________________________ 59
Chart 2a: Proportion of regular smokers by age and sex, Cree 1991 and Quebec 1992-93compared (Santé Québec Health Survey) _________________________________________ 66
Health and What Affects it in the Cree Communities of Eeyou Istchee. p. xv
Chart 2b: Proportion that are current drinkers, by age and sex, 1991 (Santé Québec HealthSurvey) _____________________________________________________________________ 68
Chart 2c: Individuals who are physically very active or moderately active during leisure time,by age and sex, 1991 (Santé Québec Health Survey)_________________________________ 71
Chart 4a: Rate of declared chlamydia cases by age, 1997-1999 combined (Laboratoire de santépublique du Québec, central database) __________________________________________ 101
Chart 4b: Number of diabetes cases by sex (Cree Board of Health and Social Services ofJames Bay, 2000) ___________________________________________________________ 105
Chart 4c: Life expectancy at birth, by region and sex, 1993-97 (Quebec Ministry of Health andSocial Services) _____________________________________________________________ 108
Health and What Affects it in the Cree Communities of Eeyou Istchee. p. 1
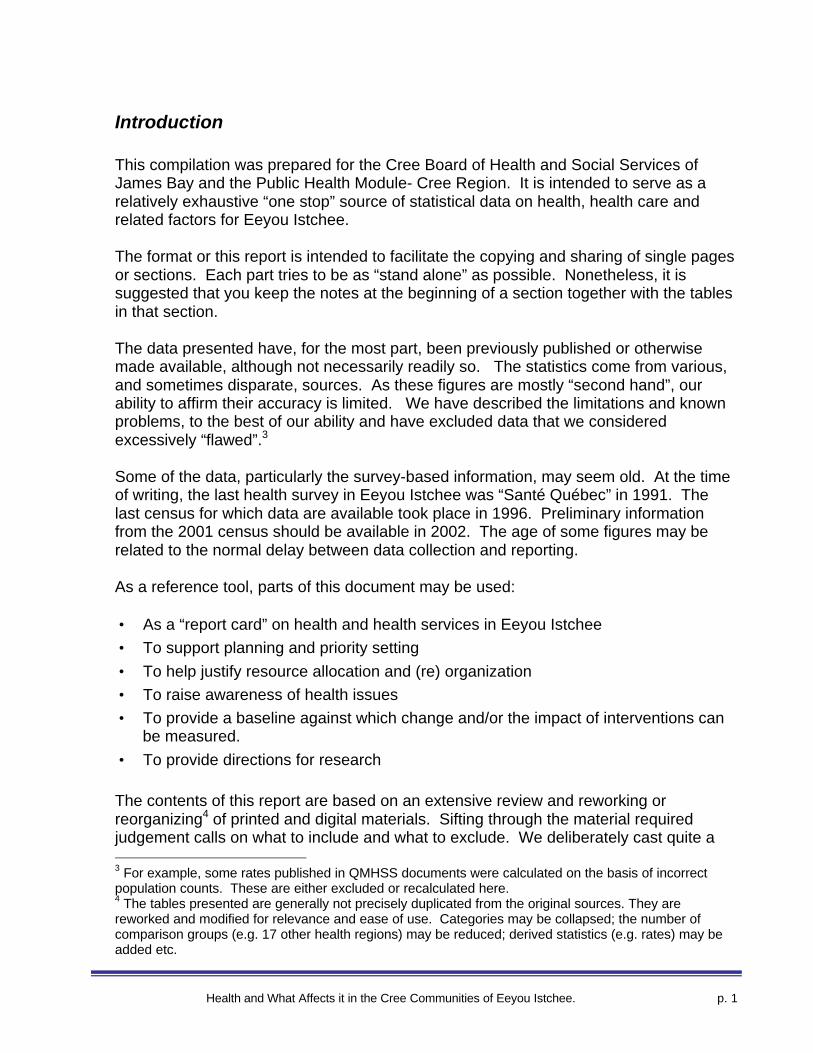
Introduction
This compilation was prepared for the Cree Board of Health and Social Services ofJames Bay and the Public Health Module- Cree Region. It is intended to serve as arelatively exhaustive “one stop” source of statistical data on health, health care andrelated factors for Eeyou Istchee.
The format or this report is intended to facilitate the copying and sharing of single pagesor sections. Each part tries to be as “stand alone” as possible. Nonetheless, it issuggested that you keep the notes at the beginning of a section together with the tablesin that section.
The data presented have, for the most part, been previously published or otherwisemade available, although not necessarily readily so. The statistics come from various,and sometimes disparate, sources. As these figures are mostly “second hand”, ourability to affirm their accuracy is limited. We have described the limitations and knownproblems, to the best of our ability and have excluded data that we consideredexcessively “flawed”.3
Some of the data, particularly the survey-based information, may seem old. At the timeof writing, the last health survey in Eeyou Istchee was “Santé Québec” in 1991. Thelast census for which data are available took place in 1996. Preliminary informationfrom the 2001 census should be available in 2002. The age of some figures may berelated to the normal delay between data collection and reporting.
As a reference tool, parts of this document may be used:
• As a “report card” on health and health services in Eeyou Istchee
• To support planning and priority setting
• To help justify resource allocation and (re) organization
• To raise awareness of health issues
• To provide a baseline against which change and/or the impact of interventions canbe measured.
• To provide directions for research
The contents of this report are based on an extensive review and reworking orreorganizing4 of printed and digital materials. Sifting through the material requiredjudgement calls on what to include and what to exclude. We deliberately cast quite a 3 For example, some rates published in QMHSS documents were calculated on the basis of incorrectpopulation counts. These are either excluded or recalculated here.4 The tables presented are generally not precisely duplicated from the original sources. They arereworked and modified for relevance and ease of use. Categories may be collapsed; the number ofcomparison groups (e.g. 17 other health regions) may be reduced; derived statistics (e.g. rates) may beadded etc.
Health and What Affects it in the Cree Communities of Eeyou Istchee. p. 2
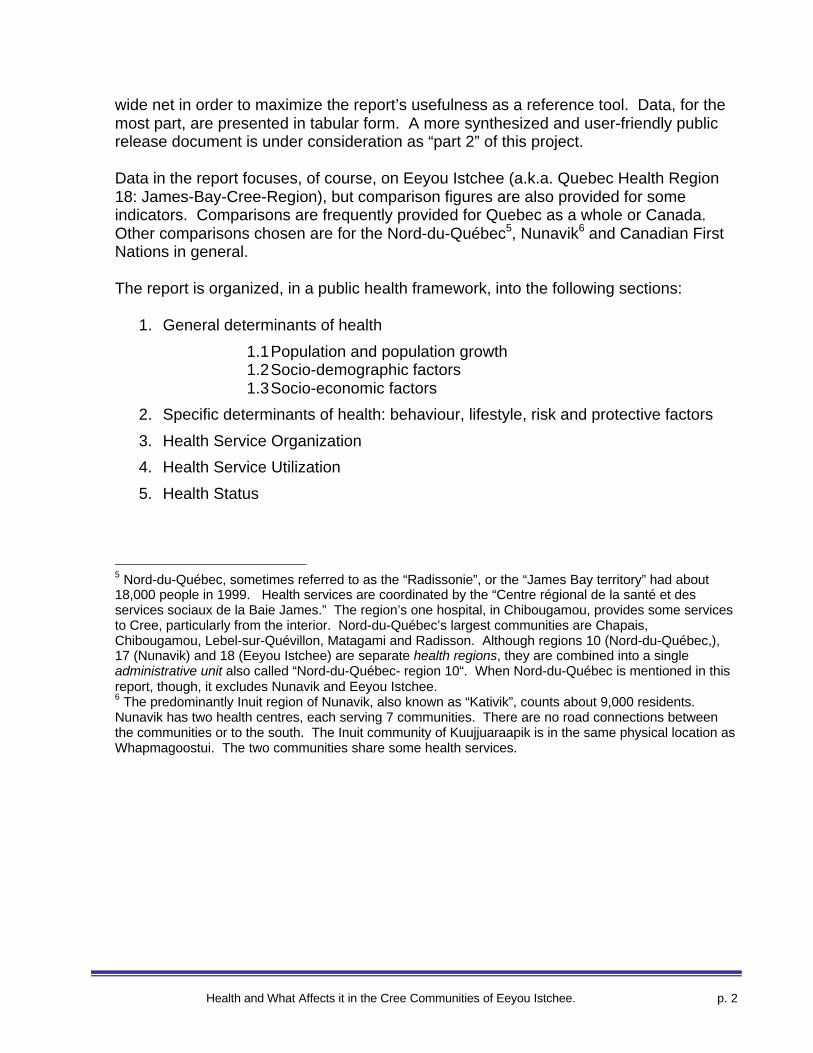
wide net in order to maximize the report’s usefulness as a reference tool. Data, for themost part, are presented in tabular form. A more synthesized and user-friendly publicrelease document is under consideration as “part 2” of this project.
Data in the report focuses, of course, on Eeyou Istchee (a.k.a. Quebec Health Region18: James-Bay-Cree-Region), but comparison figures are also provided for someindicators. Comparisons are frequently provided for Quebec as a whole or Canada.Other comparisons chosen are for the Nord-du-Québec5, Nunavik6 and Canadian FirstNations in general.
The report is organized, in a public health framework, into the following sections:
1. General determinants of health
1.1 Population and population growth1.2 Socio-demographic factors1.3 Socio-economic factors
2. Specific determinants of health: behaviour, lifestyle, risk and protective factors
3. Health Service Organization
4. Health Service Utilization
5. Health Status
5 Nord-du-Québec, sometimes referred to as the “Radissonie”, or the “James Bay territory” had about18,000 people in 1999. Health services are coordinated by the “Centre régional de la santé et desservices sociaux de la Baie James.” The region’s one hospital, in Chibougamou, provides some servicesto Cree, particularly from the interior. Nord-du-Québec’s largest communities are Chapais,Chibougamou, Lebel-sur-Quévillon, Matagami and Radisson. Although regions 10 (Nord-du-Québec,),17 (Nunavik) and 18 (Eeyou Istchee) are separate health regions, they are combined into a singleadministrative unit also called “Nord-du-Québec- region 10“. When Nord-du-Québec is mentioned in thisreport, though, it excludes Nunavik and Eeyou Istchee.6 The predominantly Inuit region of Nunavik, also known as “Kativik”, counts about 9,000 residents.Nunavik has two health centres, each serving 7 communities. There are no road connections betweenthe communities or to the south. The Inuit community of Kuujjuaraapik is in the same physical location asWhapmagoostui. The two communities share some health services.
Health and What Affects it in the Cree Communities of Eeyou Istchee. p. 3
1. General Determinants of Health
This section is divided into three subsections:
1.1 Population and population growth1.2 Socio-demographic factors1.3 Socio-economic factors
The first looks at basic demography, including historical and projected data. The typesof health problems experienced by a population are influenced by its age distribution.More generally, the size, age and growth rate of populations are important tounderstanding population needs and developing appropriate services.
The second part looks at family structure/size, language and population mobility relyingprimarily on data from the 1996 census. The indicators are more “cultural” in nature.They have some relationship with health but may be of particular relevance to thedevelopment of appropriate regional health care.
The third subsection provides socio-economic statistics. Issues such as education,employment, income and housing covered here are derived primarily from the Canadiancensus. They are well documented to be fundamental predictors of a wide range ofhealth outcomes.
1.1 Population and Population Growth
Health and What Affects it in the Cree Communities of Eeyou Istchee. p. 4
1.1. Population and population growth
Key points
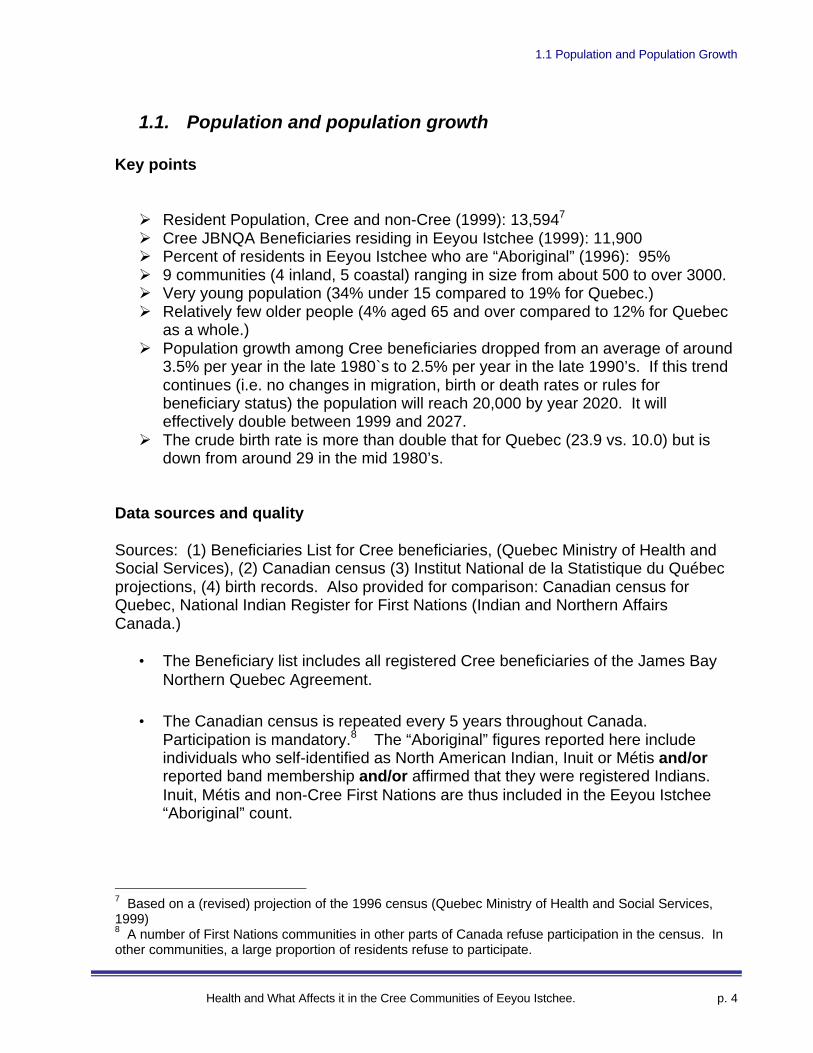
Ø Resident Population, Cree and non-Cree (1999): 13,5947
Ø Cree JBNQA Beneficiaries residing in Eeyou Istchee (1999): 11,900Ø Percent of residents in Eeyou Istchee who are “Aboriginal” (1996): 95%Ø 9 communities (4 inland, 5 coastal) ranging in size from about 500 to over 3000.Ø Very young population (34% under 15 compared to 19% for Quebec.)Ø Relatively few older people (4% aged 65 and over compared to 12% for Quebec
as a whole.)Ø Population growth among Cree beneficiaries dropped from an average of around
3.5% per year in the late 1980`s to 2.5% per year in the late 1990’s. If this trendcontinues (i.e. no changes in migration, birth or death rates or rules forbeneficiary status) the population will reach 20,000 by year 2020. It willeffectively double between 1999 and 2027.
Ø The crude birth rate is more than double that for Quebec (23.9 vs. 10.0) but isdown from around 29 in the mid 1980’s.
Data sources and quality
Sources: (1) Beneficiaries List for Cree beneficiaries, (Quebec Ministry of Health andSocial Services), (2) Canadian census (3) Institut National de la Statistique du Québecprojections, (4) birth records. Also provided for comparison: Canadian census forQuebec, National Indian Register for First Nations (Indian and Northern AffairsCanada.)
• The Beneficiary list includes all registered Cree beneficiaries of the James BayNorthern Quebec Agreement.
• The Canadian census is repeated every 5 years throughout Canada.Participation is mandatory.8 The “Aboriginal” figures reported here includeindividuals who self-identified as North American Indian, Inuit or Métis and/orreported band membership and/or affirmed that they were registered Indians.Inuit, Métis and non-Cree First Nations are thus included in the Eeyou Istchee“Aboriginal” count.
7 Based on a (revised) projection of the 1996 census (Quebec Ministry of Health and Social Services,1999)8 A number of First Nations communities in other parts of Canada refuse participation in the census. Inother communities, a large proportion of residents refuse to participate.

1.1 Population and Population Growth
Health and What Affects it in the Cree Communities of Eeyou Istchee. p. 5
• Indian and Northern Affairs, Canada maintains the Indian Register. Registeredor “Status” Indians are identified with a particular band. Oujé-Bougoumou hasnot been recognized as a band—the residents are affiliated with othercommunities.
• Due to differing methods and definitions, mixing of census-derived andbeneficiary list derived figures is not advised. For example, it may be misleadingto divide the beneficiary population by the total population in order to arrive at anestimate of the proportion that are beneficiaries. The nature of each source isdescribed in more detail in the following points.
• The beneficiary list and the Indian Register are administrative in nature, relyingon the ongoing registration of individual births, deaths and moves. Thecompleteness, quality and timeliness of the information depend on the vigilanceof those responsible for completing the appropriate forms and providing them tothe Ministry of Health in Quebec or to Indian Affairs.
• There appears to be some delay inherent in the registration of births and deaths.To illustrate this, consider that in 1996 the Canadian census reported that thoseunder 5 years of age made up 13.6% of the population while, in the same year,the beneficiary list only recorded 12.4% in this age group and the Indian Registershowed 11.9%. The census recorded that 3.8% of the population was 65 and upcompared with 4.5% according to the beneficiary list and 4.9% in the IndianRegister. [Table 1.12]
• The beneficiary list distinguishes place of residence from the community withwhich an individual is affiliated.
• Similarly, the Indian Register is able to identify individuals living “in their owncommunity” (i.e. on lands set aside for their band), living in othercommunities/reserves, living off-reserve etc.
• In Eeyou Istchee, the 1991 census is considered to have undercounted thepopulation by about 30%.
• In addition, published derived projections using the 1991 census significantlyunderestimated the population of Eeyou Istchee (Quebec Ministry of Health andSocial Services). At the request of the Public Health Module— Cree Region ofJames Bay and after release of the 1996 census figures, corrections (based inpart on beneficiary list data) were published in February 1998.
1.1 Population and Population Growth
Health and What Affects it in the Cree Communities of Eeyou Istchee. p. 6
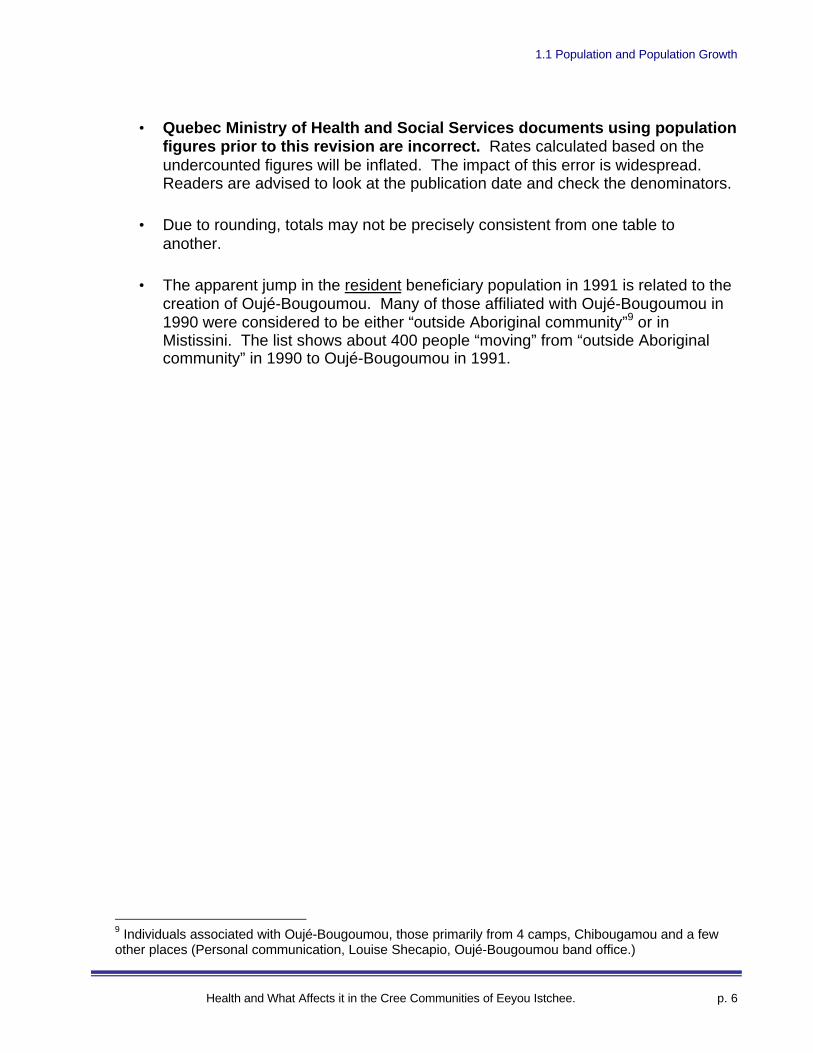
• Quebec Ministry of Health and Social Services documents using populationfigures prior to this revision are incorrect. Rates calculated based on theundercounted figures will be inflated. The impact of this error is widespread.Readers are advised to look at the publication date and check the denominators.
• Due to rounding, totals may not be precisely consistent from one table toanother.
• The apparent jump in the resident beneficiary population in 1991 is related to thecreation of Oujé-Bougoumou. Many of those affiliated with Oujé-Bougoumou in1990 were considered to be either “outside Aboriginal community”9 or inMistissini. The list shows about 400 people “moving” from “outside Aboriginalcommunity” in 1990 to Oujé-Bougoumou in 1991.
9 Individuals associated with Oujé-Bougoumou, those primarily from 4 camps, Chibougamou and a fewother places (Personal communication, Louise Shecapio, Oujé-Bougoumou band office.)
1.1 Population and Population Growth
Health and What Affects it in the Cree Communities of Eeyou Istchee. p. 7
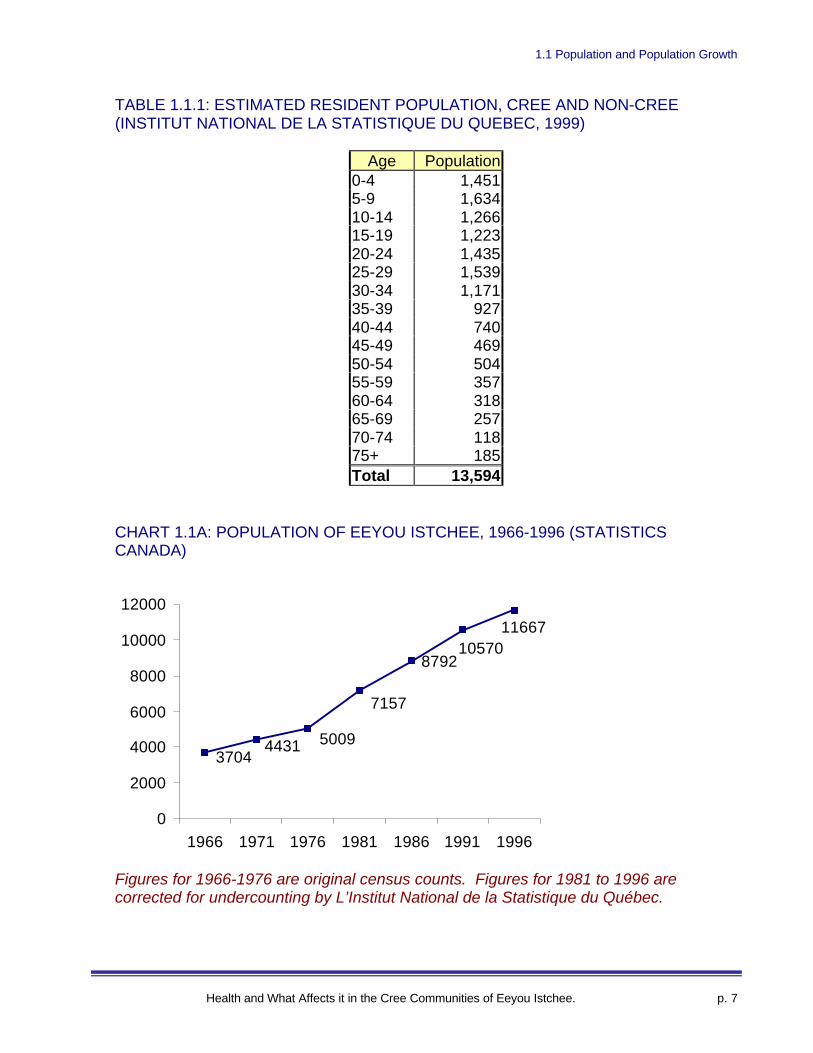
TABLE 1.1.1: ESTIMATED RESIDENT POPULATION, CREE AND NON-CREE(INSTITUT NATIONAL DE LA STATISTIQUE DU QUEBEC, 1999)
Age Population0-4 1,4515-9 1,63410-14 1,26615-19 1,22320-24 1,43525-29 1,53930-34 1,17135-39 92740-44 74045-49 46950-54 50455-59 35760-64 31865-69 25770-74 11875+ 185Total 13,594
CHART 1.1A: POPULATION OF EEYOU ISTCHEE, 1966-1996 (STATISTICSCANADA)
Figures for 1966-1976 are original census counts. Figures for 1981 to 1996 arecorrected for undercounting by L’Institut National de la Statistique du Québec.
8792
7157
500944313704
1166710570
0
2000
4000
6000
8000
10000
12000
1966 1971 1976 1981 1986 1991 1996
1.1 Population and Population Growth
Health and What Affects it in the Cree Communities of Eeyou Istchee. p. 8
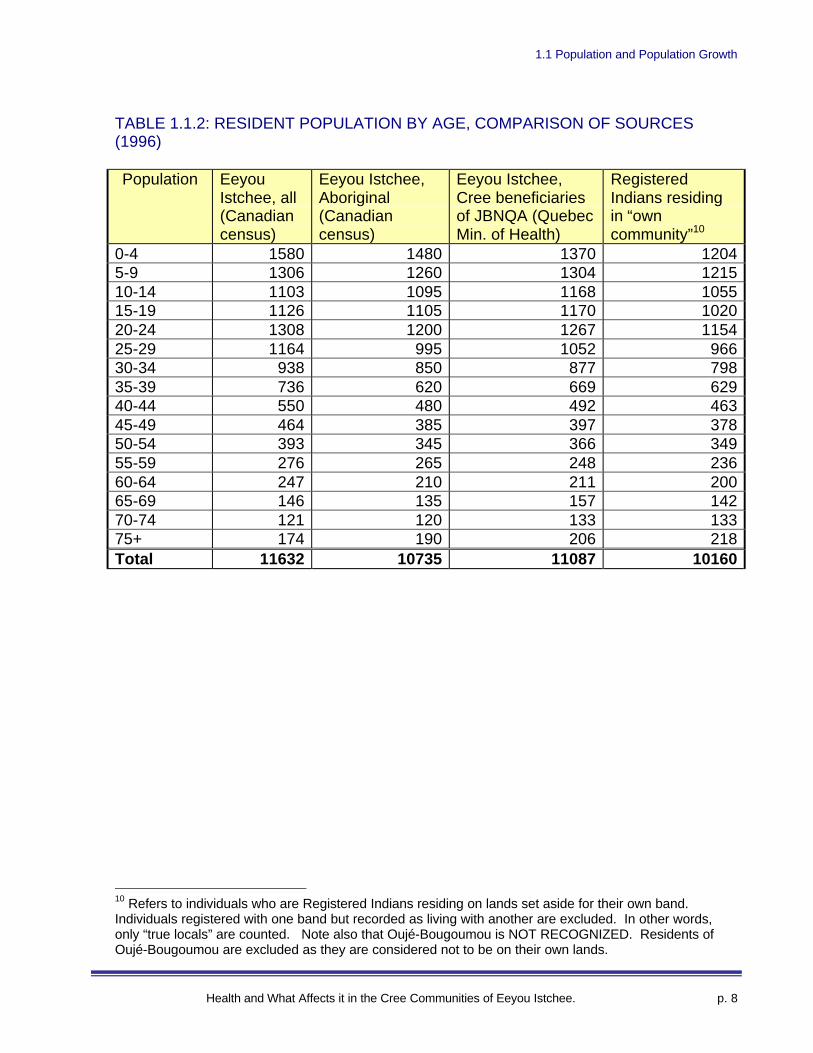
TABLE 1.1.2: RESIDENT POPULATION BY AGE, COMPARISON OF SOURCES(1996)
Population EeyouIstchee, all(Canadiancensus)
Eeyou Istchee,Aboriginal(Canadiancensus)
Eeyou Istchee,Cree beneficiariesof JBNQA (QuebecMin. of Health)
RegisteredIndians residingin “owncommunity”10
0-4 1580 1480 1370 12045-9 1306 1260 1304 121510-14 1103 1095 1168 105515-19 1126 1105 1170 102020-24 1308 1200 1267 115425-29 1164 995 1052 96630-34 938 850 877 79835-39 736 620 669 62940-44 550 480 492 46345-49 464 385 397 37850-54 393 345 366 34955-59 276 265 248 23660-64 247 210 211 20065-69 146 135 157 14270-74 121 120 133 13375+ 174 190 206 218Total 11632 10735 11087 10160
10 Refers to individuals who are Registered Indians residing on lands set aside for their own band.Individuals registered with one band but recorded as living with another are excluded. In other words,only “true locals” are counted. Note also that Oujé-Bougoumou is NOT RECOGNIZED. Residents ofOujé-Bougoumou are excluded as they are considered not to be on their own lands.
1.1 Population and Population Growth
Health and What Affects it in the Cree Communities of Eeyou Istchee. p. 9
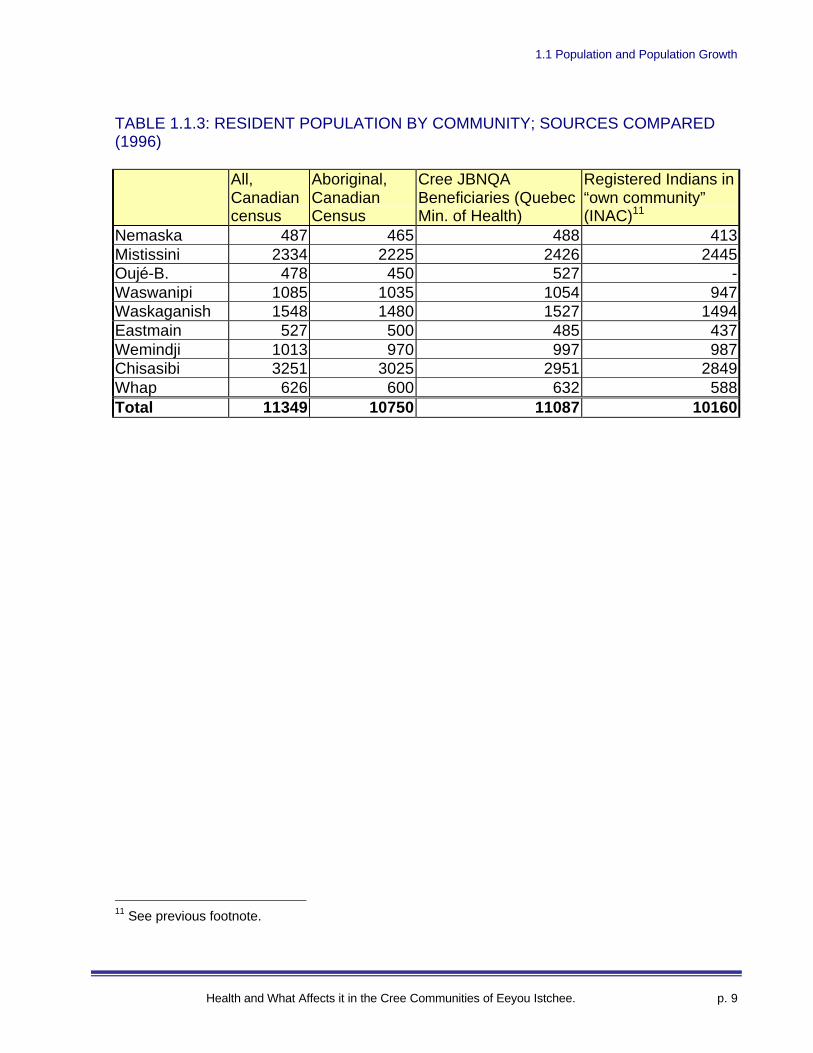
TABLE 1.1.3: RESIDENT POPULATION BY COMMUNITY; SOURCES COMPARED(1996)
All,Canadiancensus
Aboriginal,CanadianCensus
Cree JBNQABeneficiaries (QuebecMin. of Health)
Registered Indians in“own community”(INAC)11
Nemaska 487 465 488 413Mistissini 2334 2225 2426 2445Oujé-B. 478 450 527 -Waswanipi 1085 1035 1054 947Waskaganish 1548 1480 1527 1494Eastmain 527 500 485 437Wemindji 1013 970 997 987Chisasibi 3251 3025 2951 2849Whap 626 600 632 588Total 11349 10750 11087 10160
11 See previous footnote.
1.1 Population and Population Growth
Health and What Affects it in the Cree Communities of Eeyou Istchee. p. 10
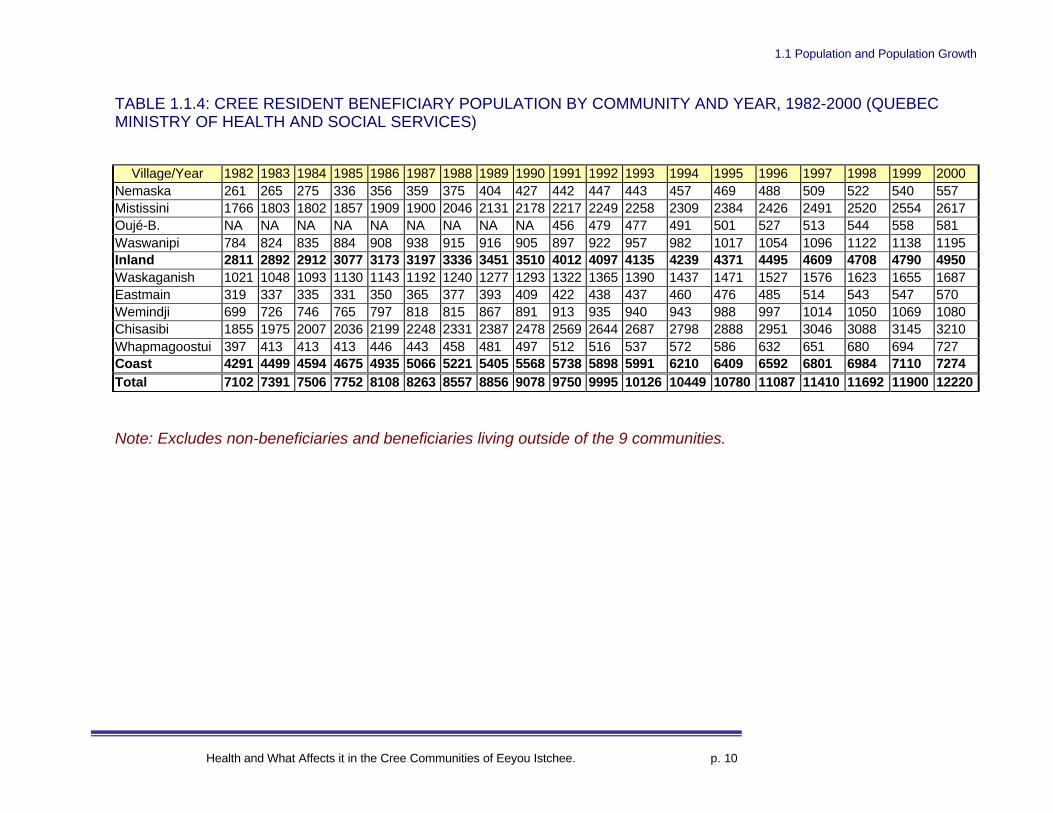
TABLE 1.1.4: CREE RESIDENT BENEFICIARY POPULATION BY COMMUNITY AND YEAR, 1982-2000 (QUEBECMINISTRY OF HEALTH AND SOCIAL SERVICES)
Village/Year 1982 1983 1984 1985 1986 1987 1988 1989 1990 1991 1992 1993 1994 1995 1996 1997 1998 1999 2000Nemaska 261 265 275 336 356 359 375 404 427 442 447 443 457 469 488 509 522 540 557Mistissini 1766 1803 1802 1857 1909 1900 2046 2131 2178 2217 2249 2258 2309 2384 2426 2491 2520 2554 2617Oujé-B. NA NA NA NA NA NA NA NA NA 456 479 477 491 501 527 513 544 558 581Waswanipi 784 824 835 884 908 938 915 916 905 897 922 957 982 1017 1054 1096 1122 1138 1195Inland 2811 2892 2912 3077 3173 3197 3336 3451 3510 4012 4097 4135 4239 4371 4495 4609 4708 4790 4950Waskaganish 1021 1048 1093 1130 1143 1192 1240 1277 1293 1322 1365 1390 1437 1471 1527 1576 1623 1655 1687Eastmain 319 337 335 331 350 365 377 393 409 422 438 437 460 476 485 514 543 547 570Wemindji 699 726 746 765 797 818 815 867 891 913 935 940 943 988 997 1014 1050 1069 1080Chisasibi 1855 1975 2007 2036 2199 2248 2331 2387 2478 2569 2644 2687 2798 2888 2951 3046 3088 3145 3210Whapmagoostui 397 413 413 413 446 443 458 481 497 512 516 537 572 586 632 651 680 694 727Coast 4291 4499 4594 4675 4935 5066 5221 5405 5568 5738 5898 5991 6210 6409 6592 6801 6984 7110 7274Total 7102 7391 7506 7752 8108 8263 8557 8856 9078 9750 9995 10126 10449 10780 11087 11410 11692 11900 12220
Note: Excludes non-beneficiaries and beneficiaries living outside of the 9 communities.
1.1 Population and Population Growth
Health and What Affects it in the Cree Communities of Eeyou Istchee. p. 11
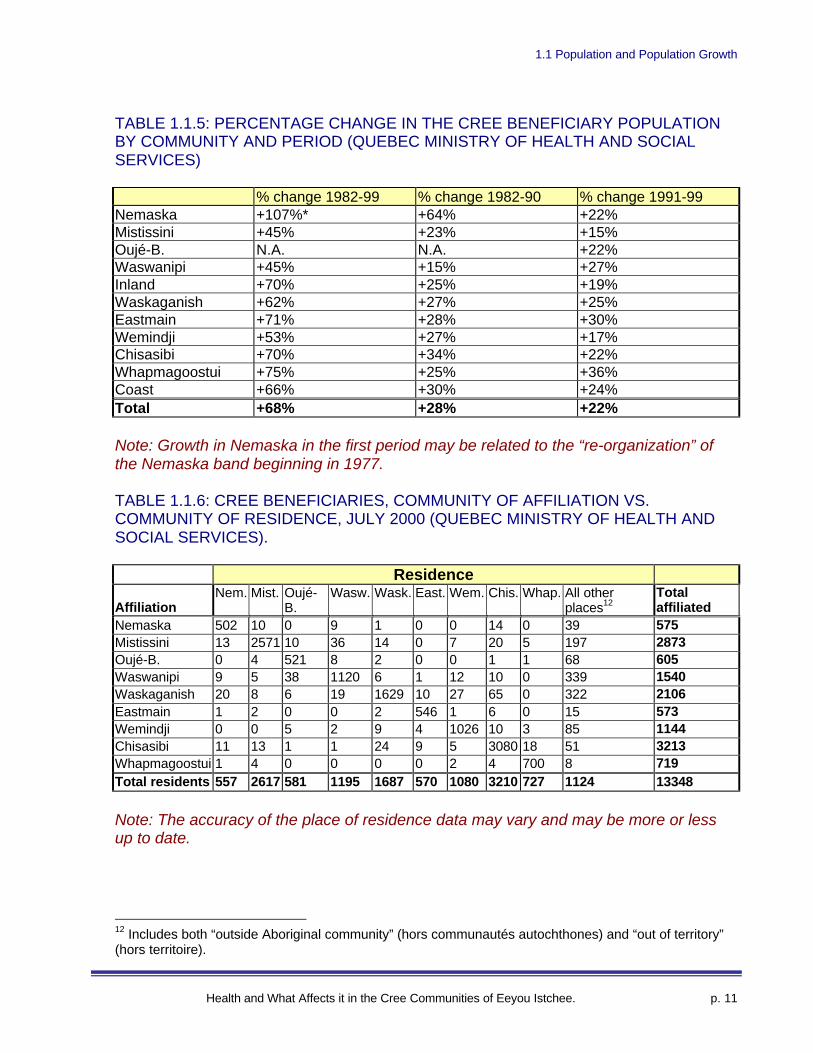
TABLE 1.1.5: PERCENTAGE CHANGE IN THE CREE BENEFICIARY POPULATIONBY COMMUNITY AND PERIOD (QUEBEC MINISTRY OF HEALTH AND SOCIALSERVICES)
% change 1982-99 % change 1982-90 % change 1991-99Nemaska +107%* +64% +22%Mistissini +45% +23% +15%Oujé-B. N.A. N.A. +22%Waswanipi +45% +15% +27%Inland +70% +25% +19%Waskaganish +62% +27% +25%Eastmain +71% +28% +30%Wemindji +53% +27% +17%Chisasibi +70% +34% +22%Whapmagoostui +75% +25% +36%Coast +66% +30% +24%Total +68% +28% +22%
Note: Growth in Nemaska in the first period may be related to the “re-organization” ofthe Nemaska band beginning in 1977.
TABLE 1.1.6: CREE BENEFICIARIES, COMMUNITY OF AFFILIATION VS.COMMUNITY OF RESIDENCE, JULY 2000 (QUEBEC MINISTRY OF HEALTH ANDSOCIAL SERVICES).
Residence
AffiliationNem. Mist. Oujé-
B.Wasw. Wask. East. Wem. Chis. Whap. All other
places12Totalaffiliated
Nemaska 502 10 0 9 1 0 0 14 0 39 575Mistissini 13 2571 10 36 14 0 7 20 5 197 2873Oujé-B. 0 4 521 8 2 0 0 1 1 68 605Waswanipi 9 5 38 1120 6 1 12 10 0 339 1540Waskaganish 20 8 6 19 1629 10 27 65 0 322 2106Eastmain 1 2 0 0 2 546 1 6 0 15 573Wemindji 0 0 5 2 9 4 1026 10 3 85 1144Chisasibi 11 13 1 1 24 9 5 3080 18 51 3213Whapmagoostui 1 4 0 0 0 0 2 4 700 8 719Total residents 557 2617 581 1195 1687 570 1080 3210 727 1124 13348
Note: The accuracy of the place of residence data may vary and may be more or lessup to date.
12 Includes both “outside Aboriginal community” (hors communautés autochthones) and “out of territory”(hors territoire).
1.1 Population and Population Growth
Health and What Affects it in the Cree Communities of Eeyou Istchee. p. 12
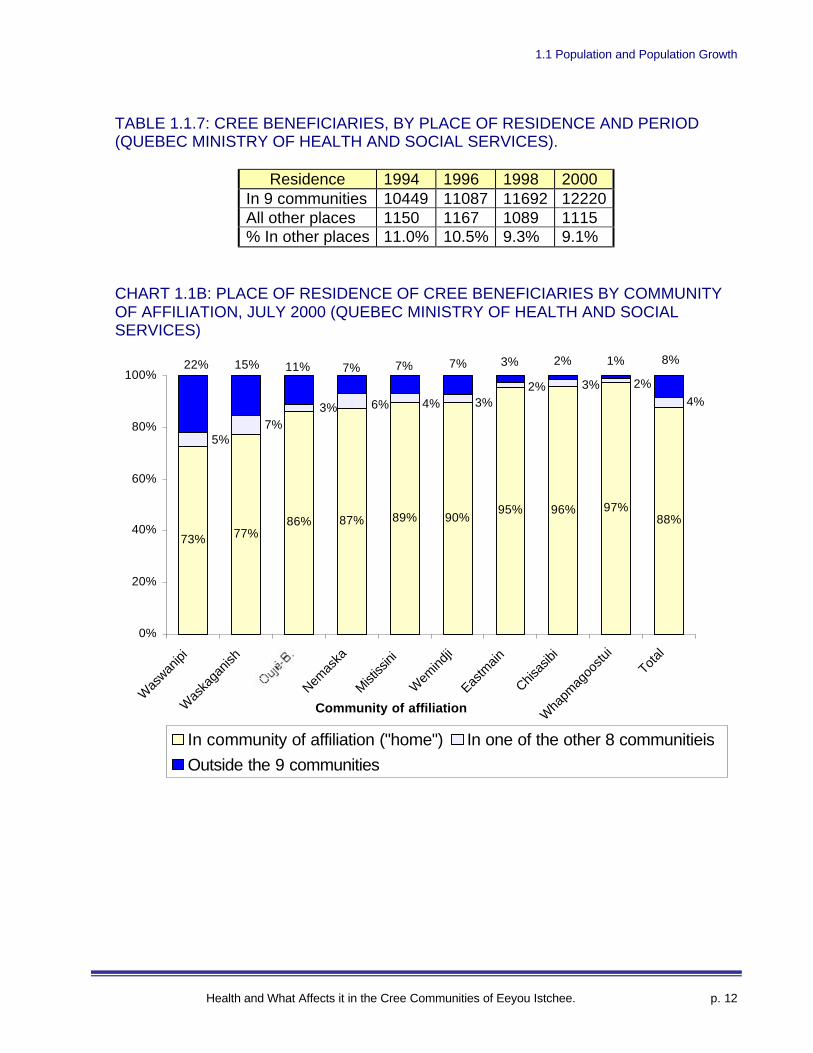
TABLE 1.1.7: CREE BENEFICIARIES, BY PLACE OF RESIDENCE AND PERIOD(QUEBEC MINISTRY OF HEALTH AND SOCIAL SERVICES).
Residence 1994 1996 1998 2000In 9 communities 10449 11087 11692 12220All other places 1150 1167 1089 1115% In other places 11.0% 10.5% 9.3% 9.1%
CHART 1.1B: PLACE OF RESIDENCE OF CREE BENEFICIARIES BY COMMUNITYOF AFFILIATION, JULY 2000 (QUEBEC MINISTRY OF HEALTH AND SOCIALSERVICES)
73% 77%86% 87% 89% 90%
95% 96% 97%88%
4%
5%7%
3%
2%
4%3%2%
3%6%
22% 15% 11% 7% 7% 7% 3% 2% 1% 8%
0%
20%
40%
60%
80%
100%
Was
wanipi
Was
kaga
nish
Nemas
ka
Mist
issini
Wem
indji
Eastm
ain
Chisas
ibi
Wha
pmag
oostu
i
Total
Community of affiliation
In community of affiliation ("home") In one of the other 8 communitieis
Outside the 9 communities
1.1 Population and Population Growth
Health and What Affects it in the Cree Communities of Eeyou Istchee. p. 13
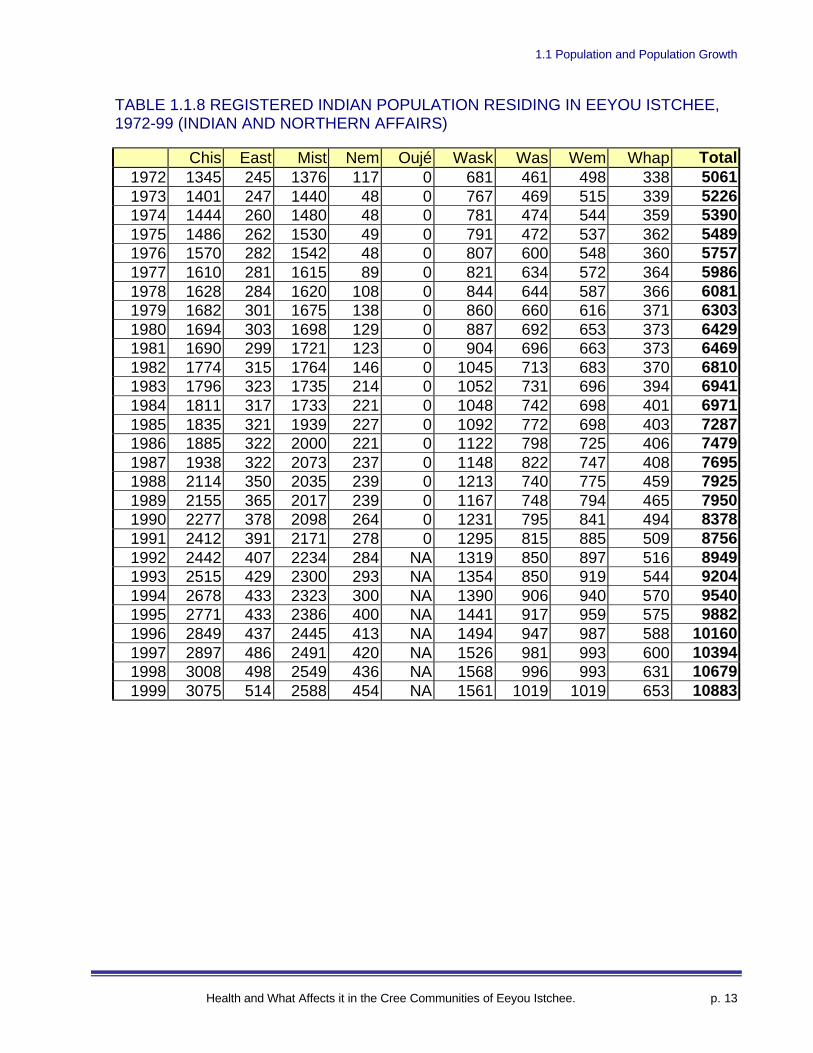
TABLE 1.1.8 REGISTERED INDIAN POPULATION RESIDING IN EEYOU ISTCHEE,1972-99 (INDIAN AND NORTHERN AFFAIRS)
Chis East Mist Nem Oujé Wask Was Wem Whap Total1972 1345 245 1376 117 0 681 461 498 338 50611973 1401 247 1440 48 0 767 469 515 339 52261974 1444 260 1480 48 0 781 474 544 359 53901975 1486 262 1530 49 0 791 472 537 362 54891976 1570 282 1542 48 0 807 600 548 360 57571977 1610 281 1615 89 0 821 634 572 364 59861978 1628 284 1620 108 0 844 644 587 366 60811979 1682 301 1675 138 0 860 660 616 371 63031980 1694 303 1698 129 0 887 692 653 373 64291981 1690 299 1721 123 0 904 696 663 373 64691982 1774 315 1764 146 0 1045 713 683 370 68101983 1796 323 1735 214 0 1052 731 696 394 69411984 1811 317 1733 221 0 1048 742 698 401 69711985 1835 321 1939 227 0 1092 772 698 403 72871986 1885 322 2000 221 0 1122 798 725 406 74791987 1938 322 2073 237 0 1148 822 747 408 76951988 2114 350 2035 239 0 1213 740 775 459 79251989 2155 365 2017 239 0 1167 748 794 465 79501990 2277 378 2098 264 0 1231 795 841 494 83781991 2412 391 2171 278 0 1295 815 885 509 87561992 2442 407 2234 284 NA 1319 850 897 516 89491993 2515 429 2300 293 NA 1354 850 919 544 92041994 2678 433 2323 300 NA 1390 906 940 570 95401995 2771 433 2386 400 NA 1441 917 959 575 98821996 2849 437 2445 413 NA 1494 947 987 588 101601997 2897 486 2491 420 NA 1526 981 993 600 103941998 3008 498 2549 436 NA 1568 996 993 631 106791999 3075 514 2588 454 NA 1561 1019 1019 653 10883
1.1 Population and Population Growth
Health and What Affects it in the Cree Communities of Eeyou Istchee. p. 14
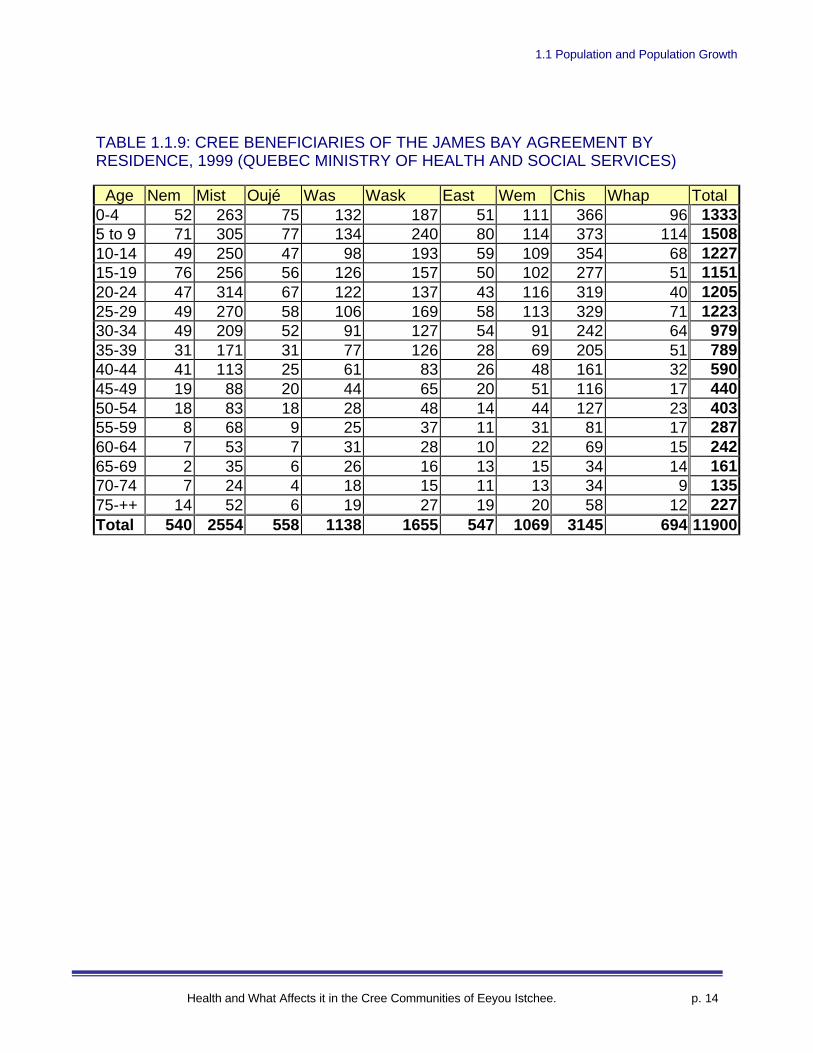
TABLE 1.1.9: CREE BENEFICIARIES OF THE JAMES BAY AGREEMENT BYRESIDENCE, 1999 (QUEBEC MINISTRY OF HEALTH AND SOCIAL SERVICES)
Age Nem Mist Oujé Was Wask East Wem Chis Whap Total0-4 52 263 75 132 187 51 111 366 96 13335 to 9 71 305 77 134 240 80 114 373 114 150810-14 49 250 47 98 193 59 109 354 68 122715-19 76 256 56 126 157 50 102 277 51 115120-24 47 314 67 122 137 43 116 319 40 120525-29 49 270 58 106 169 58 113 329 71 122330-34 49 209 52 91 127 54 91 242 64 97935-39 31 171 31 77 126 28 69 205 51 78940-44 41 113 25 61 83 26 48 161 32 59045-49 19 88 20 44 65 20 51 116 17 44050-54 18 83 18 28 48 14 44 127 23 40355-59 8 68 9 25 37 11 31 81 17 28760-64 7 53 7 31 28 10 22 69 15 24265-69 2 35 6 26 16 13 15 34 14 16170-74 7 24 4 18 15 11 13 34 9 13575-++ 14 52 6 19 27 19 20 58 12 227Total 540 2554 558 1138 1655 547 1069 3145 694 11900
1.1 Population and Population Growth
Health and What Affects it in the Cree Communities of Eeyou Istchee. p. 15
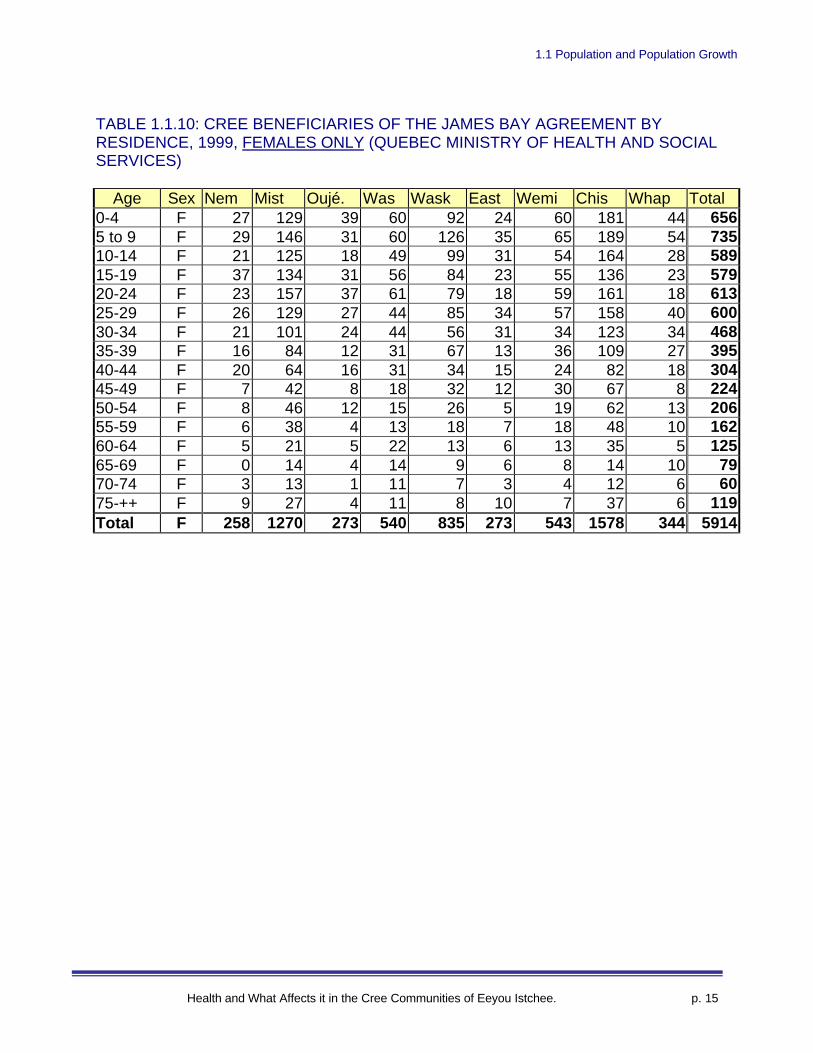
TABLE 1.1.10: CREE BENEFICIARIES OF THE JAMES BAY AGREEMENT BYRESIDENCE, 1999, FEMALES ONLY (QUEBEC MINISTRY OF HEALTH AND SOCIALSERVICES)
Age Sex Nem Mist Oujé. Was Wask East Wemi Chis Whap Total0-4 F 27 129 39 60 92 24 60 181 44 6565 to 9 F 29 146 31 60 126 35 65 189 54 73510-14 F 21 125 18 49 99 31 54 164 28 58915-19 F 37 134 31 56 84 23 55 136 23 57920-24 F 23 157 37 61 79 18 59 161 18 61325-29 F 26 129 27 44 85 34 57 158 40 60030-34 F 21 101 24 44 56 31 34 123 34 46835-39 F 16 84 12 31 67 13 36 109 27 39540-44 F 20 64 16 31 34 15 24 82 18 30445-49 F 7 42 8 18 32 12 30 67 8 22450-54 F 8 46 12 15 26 5 19 62 13 20655-59 F 6 38 4 13 18 7 18 48 10 16260-64 F 5 21 5 22 13 6 13 35 5 12565-69 F 0 14 4 14 9 6 8 14 10 7970-74 F 3 13 1 11 7 3 4 12 6 6075-++ F 9 27 4 11 8 10 7 37 6 119Total F 258 1270 273 540 835 273 543 1578 344 5914
1.1 Population and Population Growth
Health and What Affects it in the Cree Communities of Eeyou Istchee. p. 16
TABLE 1.1.11: CREE BENEFICIARIES OF THE JAMES BAY AGREEMENT BYRESIDENCE, 1999, MALES ONLY (QUEBEC MINISTRY OF HEALTH AND SOCIALSERVICES)
Males Only Sex Nem Mist Oujé-B Wasw Wask East Wem Chis Whap Total
0-4 M 25 134 36 72 95 27 51 185 52 6775 to 9 M 42 159 46 74 114 45 49 184 60 77310-14 M 28 125 29 49 94 28 55 190 40 63815-19 M 39 122 25 70 73 27 47 141 28 57220-24 M 24 157 30 61 58 25 57 158 22 59225-29 M 23 141 31 62 84 24 56 171 31 62330-34 M 28 108 28 47 71 23 57 119 30 51135-39 M 15 87 19 46 59 15 33 96 24 39440-44 M 21 49 9 30 49 11 24 79 14 28645-49 M 12 46 12 26 33 8 21 49 9 21650-54 M 10 37 6 13 22 9 25 65 10 19755-59 M 2 30 5 12 19 4 13 33 7 12560-64 M 2 32 2 9 15 4 9 34 10 11765-69 M 2 21 2 12 7 7 7 20 4 8270-74 M 4 11 3 7 8 8 9 22 3 7575-++ M 5 25 2 8 19 9 13 21 6 108Total M 282 1284 285 598 820 274 526 1567 350 5986
1.1 Population and Population Growth
Health and What Affects it in the Cree Communities of Eeyou Istchee. p. 17
CHART 1.1C: POPULATION BY AGE, QUEBEC POPULATION COMPARED WITHTHE POPULATION OF CREE BENEFICIARIES RESIDING IN EEYOU ISTCHEE(1999)
11%
13%
10%
10%
10%
10%
8%
7%
5%
4%
3%
2%
2%
1%
1%
2%
6%
7%
6%
7%
7%
6%
7%
9%
9%
8%
7%
5%
4%
4%
3%
5%
0% 2% 4% 6% 8% 10% 12% 14%
0-4
5 to 9
10-14-
15-19
20-24
25-29
30-34
35-39
40-44
45-49
50-54
55-59
60-64
65-69
70-74
75-++
Age
Quebec
Eeyou Istchee
Under 15Quebec: 18%Eeyou I.: 34%
65 and upQuebec: 13%Eeyou I.: 4%
1.1 Population and Population Growth
Health and What Affects it in the Cree Communities of Eeyou Istchee. p. 18
TABLE 1.1.12: POPULATION BY AGE GROUP, INLAND COMMUNITIES ANDCOASTAL COMMUNITIES COMPARED (1996 CENSUS, STATISTICS CANADA)
Age Inland Coast 0 - 4 13.2% 13.6% 5 - 9 11.1% 11.4% 10 - 14 10.0% 9.6% 15 - 19 11.2% 9.0% 20 - 24 10.6% 11.0% 25 - 29 9.7% 9.7% 30 - 34 8.2% 8.5% 35 - 39 6.0% 6.3% 40 - 44 4.6% 4.7% 45 - 49 3.4% 4.2% 50 - 54 3.4% 3.2% 55 - 59 2.7% 2.5% 60 - 64 1.9% 2.0% 65 - 69 1.1% 1.3% 70 - 74 0.9% 1.1% 75 + 1.9% 1.7%Total 100% 100%
TABLE 1.1.13: AGE BREAKDOWN AMONG CREE JBNQA BENEFICIARIES LIVINGIN THE 9 COMMUNITIES AND THOSE LIVING OUTSIDE OF THE 9 COMMUNITIES(QUEBEC MINISTRY OF HEALTH AND SOCIAL SERVICES)
Age In one of the9 communities (1999)
Age Outside of the 9communities (2000)
Number Percent Number Percent0-4 1333 11% 0-4 71 6%5-14 2735 23% 5-14 302 27%15-24 2536 20% 15-24 230 21%25-34 2202 19% 25-34 227 20%35-44 1379 12% 35-44 140 13%45-54 843 7% 45-54 81 7%55-64 529 4% 55-64 28 3%65+ 523 4% 65+ 36 3%Total 11,900 100% Total 1115 100%
Note: Low percentage of children under 5 living outside the 9 communities may be dueto late or non-registration of births.
1.1 Population and Population Growth
Health and What Affects it in the Cree Communities of Eeyou Istchee. p. 19
TABLE 1.1.14: ABORIGINAL AND NON-ABORIGINAL13 POPULATION IN EEYOUISTCHEE, BY AGE AND SEX (1996 CENSUS, STATISTICS CANADA)
Aboriginal Non-AboriginalAge Males Females Males Females0-4 765 715 25 155-14 1195 1160 0 015-24 1165 1140 20 3525-34 940 905 105 10035-44 535 565 75 5045-54 360 370 55 2555-64 225 250 30 2065+ 235 210 0 0Total 5420 5315 310 245
CHART 1.1D: PERCENT OF THE POPULATION OF EEYOU ISTCHEE THAT ISABORIGINAL AND NON-ABORIGINAL (1996 CENSUS, STATISTICS CANADA)
13 See operational definition of “Aboriginal” on page 9.
97% 100% 98% 90% 90% 90% 90%100% 95%
5%0%11%11%0%3% 11%11%2%
0%10%20%30%40%50%60%70%80%90%
100%
0-4 5-14 15-24 25-34 35-44 45-54 55-64 65+ Allages
% Aboriginal Non-Aboriginal
1.1 Population and Population Growth
Health and What Affects it in the Cree Communities of Eeyou Istchee. p. 20
TABLE 1.1.15: PERCENT OF POPULATION BY AGE GROUP, ABORIGINAL ANDNON-ABORIGINAL RESIDENTS COMPARED (1996 CENSUS, STATISTICSCANADA)
Aboriginal Non-Aboriginal
0-4 13.8% 0-4 7.2%5-14 21.9% 5-14 0.0%15-24 21.5% 15-24 9.9%25-34 17.2% 25-34 36.9%35-44 10.2% 35-44 22.5%45-54 6.8% 45-54 14.4%55-64 4.4% 55-64 9.0%65+ 4.1% 65+ 0.0%
100% 100%
TABLE 1.1.16: PERCENT OF POPULATION BY SEX, ABORIGINAL AND NON-ABORIGINAL RESIDENTS COMPARED (1996 CENSUS, STATISTICS CANADA)
Females Males TotalAboriginal 49.5% 50.5% 100%Non-Aboriginal 44.1% 55.9% 100%
TABLE 1.1.17: PROPORTION OF POPULATION UNDER 15 AND OVER 65, 1979-1999 (RESIDENT CREE JBNQA BENEFICIARIES)
%<15 %65+1979 43% 4%1984 39% 5%1989 36% 5%1999 34% 5%
1.1 Population and Population Growth
Health and What Affects it in the Cree Communities of Eeyou Istchee. p. 21
TABLE 1.1.18: POPULATION BY COMMUNITY, INDICATING ABORIGINAL STATUS(1996 CENSUS, STATISTICS CANADA)
Population14 Aboriginal15 Non-Aboriginal % AboriginalNemaska 485 465 25 96%Mistissini 2335 2230 105 96%
Oujé-Bougoumou 475 450 30 95%Waswanipi 1085 1035 50 95%
Waskaganish 1550 1480 70 95%Eastmain 525 500 25 95%Wemindji 1015 970 45 96%Chisasibi 3245 3030 215 93%
Whapmagoostui 630 600 30 95%Eeyou Istchee 11340 10750 585 95%
TABLE 1.1.19: ABORIGINAL POPULATION BY GROUP16 AND COMMUNITY (1996CENSUS, STATISTICS CANADA)
N. AmericanIndian17
Métis18 Inuit OtherAboriginal19
Total
Nemaska 460 0 0 0 465Mistissini 2200 25 0 10 2230
Oujé-Bougoumou 425 20 0 0 450Waswanipi 1020 10 0 0 1035
Waskaganish 1465 15 0 0 1480Eastmain 485 15 10 0 500Wemindji 950 15 10 10 970Chisasibi 2945 25 45 10 3030
Whapmagoostui 595 0 10 0 600Eeyou Istchee 10535 125 55 35 10750
14 Sums may differ from reported total due to rounding and respondent non-reporting of certaincharacteristics.15 See operational definition of “Aboriginal” on page 9.16 Aboriginal status and categories are based upon self-report.17 “North American Indian” is a census term, equivalent to First Nations or Indian, including Cree.18 There is no accepted legal definition of Métis. Métis counts are based on individuals’ self-reporting andunderstanding of the term.19 Includes individuals reporting “mixed” Aboriginal and non-Aboriginal identity, affiliation or ancestry.
1.1 Population and Population Growth
Health and What Affects it in the Cree Communities of Eeyou Istchee. p. 22
TABLE 1.1.20: SELECTED DEMOGRAPHIC INDICATORS (1999)
Indicator EeyouIstchee
Quebec RegisteredIndians, onreserve, Canada
% Under 15 (1999) 34% 18% 34%% Under 20 (1999) 44% 25% 44%%55 and over (1999) 8.8% 22.3% 9.4%% 65 and over (1999) 4% 13% 4.7%Dependency ratio20
(1999).63 .45 .64
% 15-64 year old (1999) 61% 69% 61%Crude birth rate (1999)21 23.922 10.023
Synthetic fertility index24
(1994-98)252.84 1.57
Percent male (199626) 49% 51%
20 Dependency ratio is the ratio of those who are not of “working age” (<15 and 65+) divided by thosewho are of “working age” (15-64). Source: all residents, 1996 Canadian census.21 Number of live births divided by the total population multiplied by 1,000.22 Based on Public Health Module birth counts for 1999 and census-based population projection from theInstitut National de la Statistique du Québec.23 http://wwww.stat.gouv.qc.ca/donstat/demograp/naissance/401.htm24 Represents the number of babies a woman would have if her fertility patterns through life (passingthrough each age group) followed the “norms” at a given point in time.25 Institut National de la Santé Publique de Québec, Portrait de Santé du Québec et de ses Régions, 2001(in progress)26 1996 Canadian Census (Statistics Canada)

1.1 Population and Population Growth
Health and What Affects it in the Cree Communities of Eeyou Istchee. p. 23
TABLE 1.1.21: NUMBER OF BIRTHS AND CRUDE BIRTH RATE BY YEAR, 1985-99
Births27 Crude birth rate28
1985 225 28.81986 237 28.91987 248 29.41988 256 29.31989 258 28.91990 284 31.01991 272 25.71992 312 29.11993 308 28.21994 330 29.81995 330 29.21996 303 26.01997 300 24.41998 315 24.31999 325 23.9
Note: The increase in the early 1990’s may be related to the creation of Oujé-Bougoumou.
TABLE 1.1.22: NUMBER OF BIRTHS PER YEAR, SOURCES COMPARED, 1985-98
Public HealthModule
INSPQ29
1985 225 2211986 237 2681987 248 2811988 256 2481989 258 2631990 284 2641991 272 2631992 312 3101993 308 3061994 330 3161995 330 3271996 303 2971997 300 2981998 315 301Total 3978 3963
27 Birth counts from the Public Health Module- Cree Region of James Bay.28 Calculated based on Cree beneficiary population total for 1985 to 1990 and using Institut National de laStatistique du Québec estimates for 1991 to 1999.29 Institut National de la Statistique du Québec.
1.1 Population and Population Growth
Health and What Affects it in the Cree Communities of Eeyou Istchee. p. 24
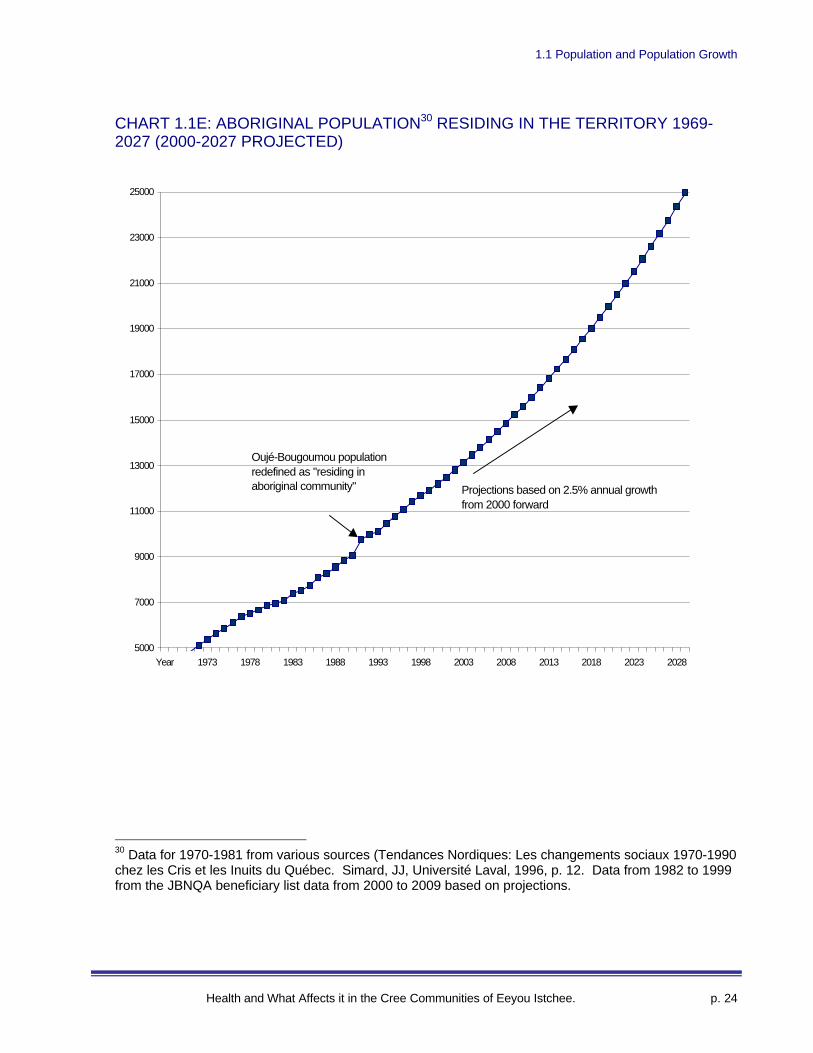
CHART 1.1E: ABORIGINAL POPULATION30 RESIDING IN THE TERRITORY 1969-2027 (2000-2027 PROJECTED)
5000
7000
9000
11000
13000
15000
17000
19000
21000
23000
25000
Year 1973 1978 1983 1988 1993 1998 2003 2008 2013 2018 2023 2028
Oujé-Bougoumou population redefined as "residing in aboriginal community" Projections based on 2.5% annual growth
from 2000 forward
30 Data for 1970-1981 from various sources (Tendances Nordiques: Les changements sociaux 1970-1990chez les Cris et les Inuits du Québec. Simard, JJ, Université Laval, 1996, p. 12. Data from 1982 to 1999from the JBNQA beneficiary list data from 2000 to 2009 based on projections.
1.2 Socio-demographic Factors
Health and What Affects it in the Cree Communities of Eeyou Istchee. p. 25
1.2. Socio-demographic factors
Key Points
Ø Of those 15 and over, 39% were never married (single) compared to 28% forQuebec as a whole.
Ø Single parents headed 17% of Eeyou Istchee families, compared to 24% forQuebec.
Ø The average family size, including parents, is 4.5 for two-parent families and 3.1in one-parent families.
Ø About 96% of Aboriginal residents have Cree as their mother tongue, 90% speakit at home and 98% are able to speak it.31
Ø English is spoken by 77% and French by 29%. 26% speak both and 20% speakneither.
Ø 39% of the population moved between 1991 and 1996. 72% of those (28% ofthe total population) moved within their community.
Data Sources and Quality
• All data in this section are from the census of the Canadian population, which isheld every 5 years throughout Canada.
• Most of the census data are from the spring of 1996 and some are from earliercensuses.
• All residents of Eeyou Istchee and other First Nations communities receive thecensus “long form” covering a range of questions.
• Census data is based on self-report questionnaires.• Prior to 1996, and in 1991 in particular, census totals for Eeyou Istchee are
considered to be undercounted. In 1991, the undercounting was on the order of30%. This raises questions about the validity of the data available for that year.Few figures from 1991 are presented here.
• Because of the way language questions are reported, figures on the number ofspeakers of Cree are based on those who provided “single responses” only.
31 Among those providing a single response only.
1.2 Socio-demographic Factors
Health and What Affects it in the Cree Communities of Eeyou Istchee. p. 26
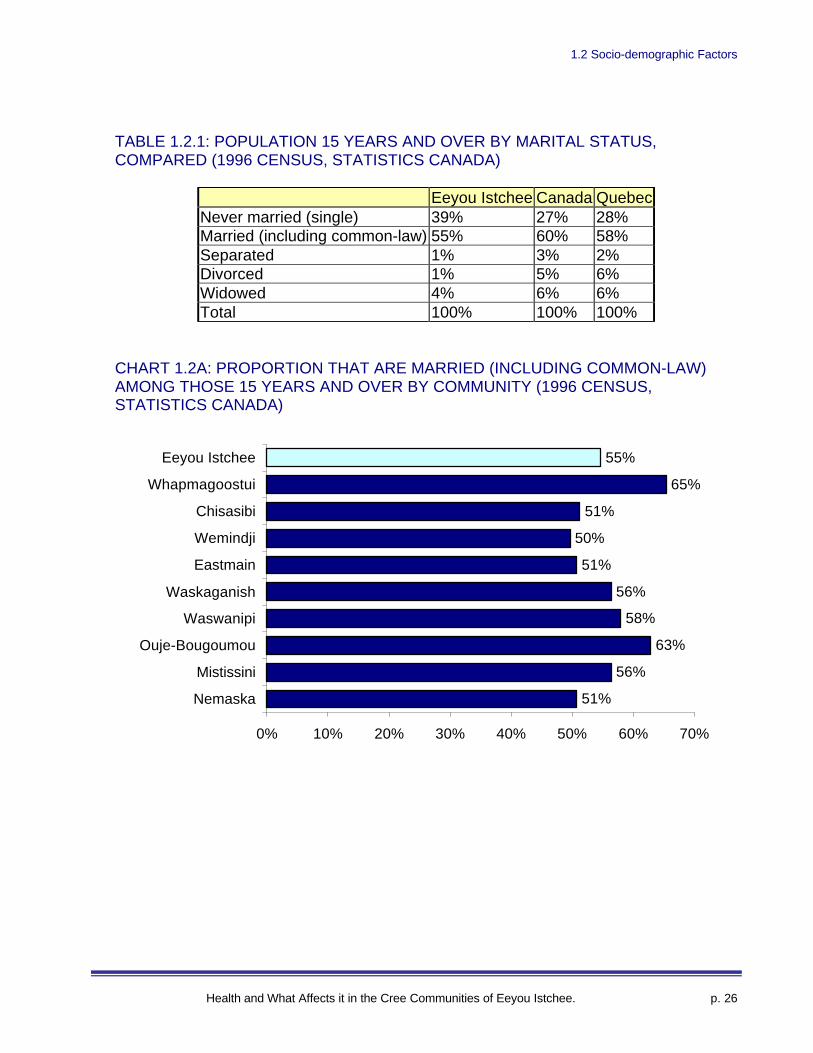
TABLE 1.2.1: POPULATION 15 YEARS AND OVER BY MARITAL STATUS,COMPARED (1996 CENSUS, STATISTICS CANADA)
Eeyou Istchee Canada QuebecNever married (single) 39% 27% 28%Married (including common-law) 55% 60% 58%Separated 1% 3% 2%Divorced 1% 5% 6%Widowed 4% 6% 6%Total 100% 100% 100%
CHART 1.2A: PROPORTION THAT ARE MARRIED (INCLUDING COMMON-LAW)AMONG THOSE 15 YEARS AND OVER BY COMMUNITY (1996 CENSUS,STATISTICS CANADA)
51%
56%
63%
58%
56%
51%
50%
51%
65%
55%
0% 10% 20% 30% 40% 50% 60% 70%
Nemaska
Mistissini
Ouje-Bougoumou
Waswanipi
Waskaganish
Eastmain
Wemindji
Chisasibi
Whapmagoostui
Eeyou Istchee
1.2 Socio-demographic Factors
Health and What Affects it in the Cree Communities of Eeyou Istchee. p. 27
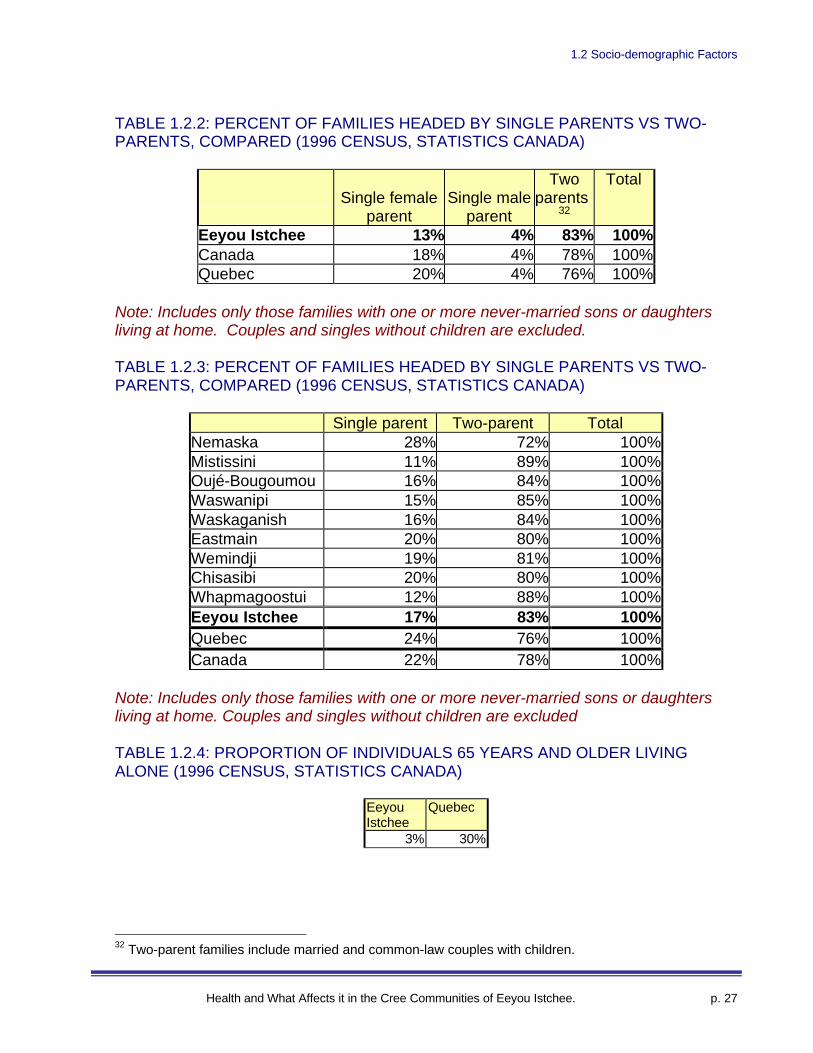
TABLE 1.2.2: PERCENT OF FAMILIES HEADED BY SINGLE PARENTS VS TWO-PARENTS, COMPARED (1996 CENSUS, STATISTICS CANADA)
Single femaleparent
Single maleparent
Twoparents
32
Total
Eeyou Istchee 13% 4% 83% 100%Canada 18% 4% 78% 100%Quebec 20% 4% 76% 100%
Note: Includes only those families with one or more never-married sons or daughtersliving at home. Couples and singles without children are excluded.
TABLE 1.2.3: PERCENT OF FAMILIES HEADED BY SINGLE PARENTS VS TWO-PARENTS, COMPARED (1996 CENSUS, STATISTICS CANADA)
Single parent Two-parent TotalNemaska 28% 72% 100%Mistissini 11% 89% 100%Oujé-Bougoumou 16% 84% 100%Waswanipi 15% 85% 100%Waskaganish 16% 84% 100%Eastmain 20% 80% 100%Wemindji 19% 81% 100%Chisasibi 20% 80% 100%Whapmagoostui 12% 88% 100%Eeyou Istchee 17% 83% 100%Quebec 24% 76% 100%Canada 22% 78% 100%
Note: Includes only those families with one or more never-married sons or daughtersliving at home. Couples and singles without children are excluded
TABLE 1.2.4: PROPORTION OF INDIVIDUALS 65 YEARS AND OLDER LIVINGALONE (1996 CENSUS, STATISTICS CANADA)
EeyouIstchee
Quebec
3% 30%
32 Two-parent families include married and common-law couples with children.
1.2 Socio-demographic Factors
Health and What Affects it in the Cree Communities of Eeyou Istchee. p. 28
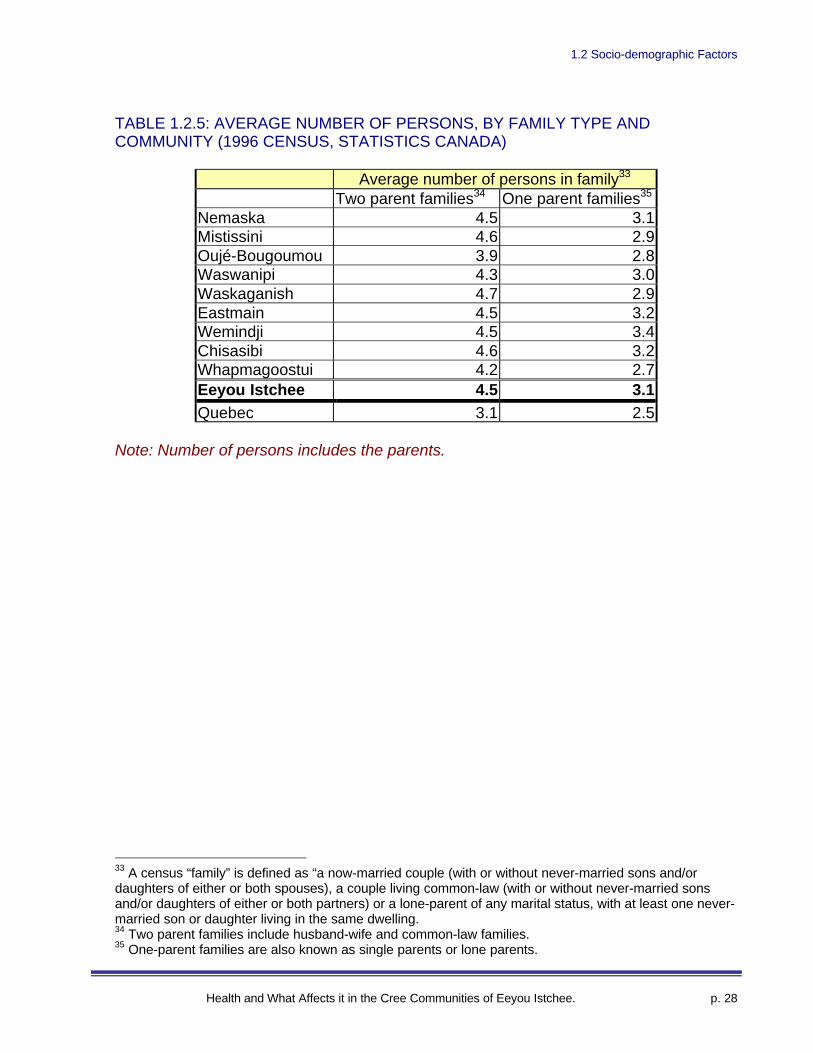
TABLE 1.2.5: AVERAGE NUMBER OF PERSONS, BY FAMILY TYPE ANDCOMMUNITY (1996 CENSUS, STATISTICS CANADA)
Average number of persons in family33
Two parent families34 One parent families35
Nemaska 4.5 3.1Mistissini 4.6 2.9Oujé-Bougoumou 3.9 2.8Waswanipi 4.3 3.0Waskaganish 4.7 2.9Eastmain 4.5 3.2Wemindji 4.5 3.4Chisasibi 4.6 3.2Whapmagoostui 4.2 2.7Eeyou Istchee 4.5 3.1Quebec 3.1 2.5
Note: Number of persons includes the parents.
33 A census “family” is defined as “a now-married couple (with or without never-married sons and/ordaughters of either or both spouses), a couple living common-law (with or without never-married sonsand/or daughters of either or both partners) or a lone-parent of any marital status, with at least one never-married son or daughter living in the same dwelling.34 Two parent families include husband-wife and common-law families.35 One-parent families are also known as single parents or lone parents.
1.2 Socio-demographic Factors
Health and What Affects it in the Cree Communities of Eeyou Istchee. p. 29
TABLE 1.2.6: MOST COMMON FIRST SPOKEN LANGUAGES (MOTHER TONGUE)AMONG RESIDENTS OF EEYOU ISTCHEE (1996 CENSUS, STATISTICS CANADA)
Mother Tongue Aboriginal Non-Aboriginal
Allresidents
Cree 10220 0 10220English 305 175 480French 95 335 430English and “non-official”36 60 0 60All others and othermultiple responses37
70 80 150
Total38 10750 590 11340
The number with Cree as their mother tongue is probably higher than 10,200 becausesome of those reporting multiple mother tongues may have Cree as one of their firstlanguages.
TABLE 1.2.7: MOST COMMON LANGUAGES SPOKEN AT HOME AMONGRESIDENTS OF EEYOU ISTCHEE (1996 CENSUS, STATISTICS CANADA)
Home language All residentsCree 9665English 760French 410English and French 25English and “non-official”39 385French and “non-official” 40 35English, French and “non-official”41 25All others (incl. multiple responses42) 15Total43 11340
The total number who speak Cree at home is probably higher than 9,665 becausemultiple home languages (e.g. “English and non-official”) may include Cree.
36 Refers to individuals reporting two mother tongues: English and another language (other than French).37 Includes Inuktitut and Arabic, Montagnais-Naskapi, German, Dutch, Italian, both English and French,both French and “non-official language” and English, French and “non-official language” and others. Seeprevious footnote.38The total is less than the total census population because language information was not available for allresidents.39 Refers to individuals reporting two home languages: English and another language (other than French)40 Refers to individuals reporting two home languages: French and another language (other than English)41 Refers to individuals reporting three home languages: English, French and another language.42 Includes Inuktitut and Arabic, Montagnais-Naskapi, German, Dutch, Italian, both English and French,both French and “non-official language” and English, French and “non-official language” and others. Seeprevious footnote.43The total is less than the total census population because language information was not available for allresidents.
1.2 Socio-demographic Factors
Health and What Affects it in the Cree Communities of Eeyou Istchee. p. 30
TABLE 1.2.8: MOTHER TONGUE, HOME LANGUAGE AND KNOWLEDGE OF CREEAMONG THE ABORIGINAL POPULATION, BY VILLAGE (1996 CENSUS,STATISTICS CANADA)
Aboriginal populationonly (first language)
Home language(Able tospeak)
Single responses only* Cree French Cree French Cree96% 2% 89% 6% 97%
Mistissini 1% 1% 4% 0%Oujé-Bougoumou 90% 3% 77% 5% 93%
93% 4% 79% 13% 96%Waskaganish 3% 1% 5% 1%Eastmain 95% 2% 91% 0% 98%
95% 4% 91% 7% 97%Chisasibi 2% 1% 3% 0%Whapmagoostui 98% 0% 94% 0% 98%
96% 3% 90% 5% 98%
Note: The figures presented here are for Aboriginal persons only.
tongue or home language questions) were excluded.45
TABLE 1.2.9: KNOWLEDGE OF ENGLISH AND FRENCH BY ABORIGINAL STATUSAND COMPARED WITH QUEBEC AND CANADA (1996 CENSUS, STATISTICSCANADA)
Eeyou IstcheeCanada Quebec All Aboriginal Non-
AboriginalKnow English 84% 43% 77% 76% 86%Know French 31% 94% 29% 26% 86%
44 According to census definition, a respondent that “can speak well enough to conduct a conversation” isdeemed to have knowledge of the language.45 Out of 11,340 respondents 90 (4%) responded that they had more than one mother tongue and 475(8%) indicated more than one home language.
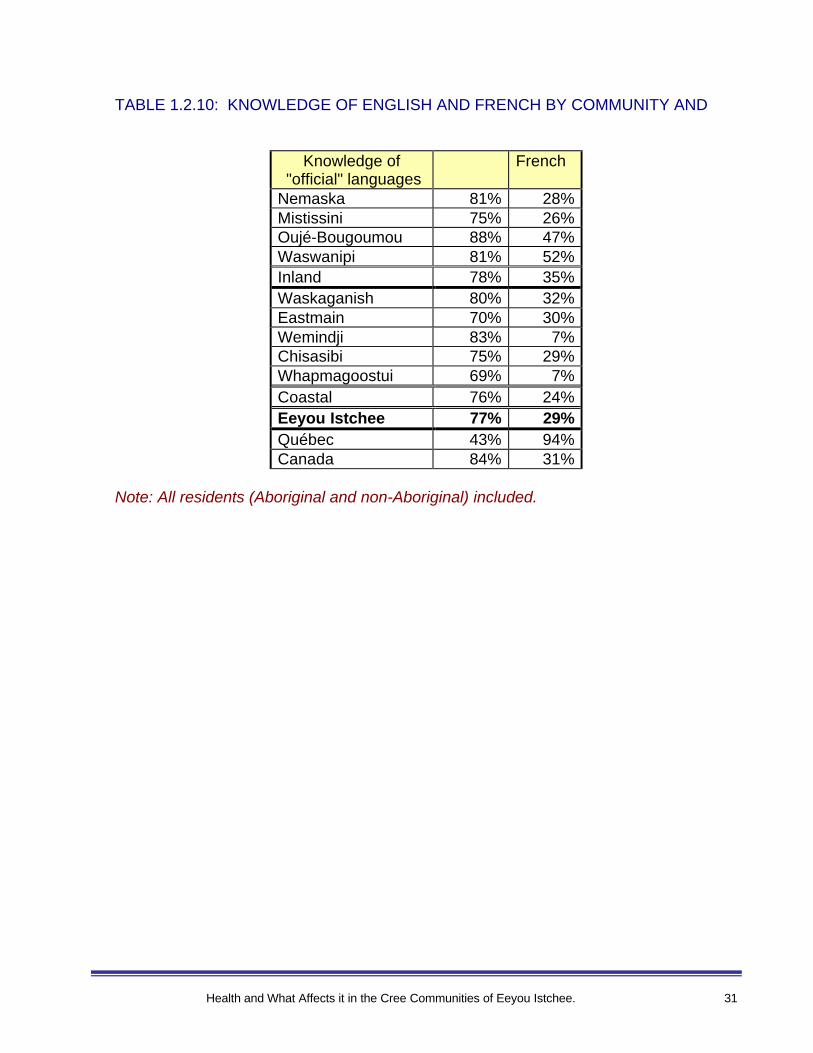
Health and What Affects it in the Cree Communities of Eeyou Istchee. 31
TABLE 1.2.10: KNOWLEDGE OF ENGLISH AND FRENCH BY COMMUNITY AND
Knowledge of "official" languages
French
Nemaska 81% 28%Mistissini 75% 26%Oujé-Bougoumou 88% 47%Waswanipi 81% 52%Inland 78% 35%Waskaganish 80% 32%Eastmain 70% 30%Wemindji 83% 7%Chisasibi 75% 29%Whapmagoostui 69% 7%Coastal 76% 24%Eeyou Istchee 77% 29%Québec 43% 94%Canada 84% 31%
Note: All residents (Aboriginal and non-Aboriginal) included.
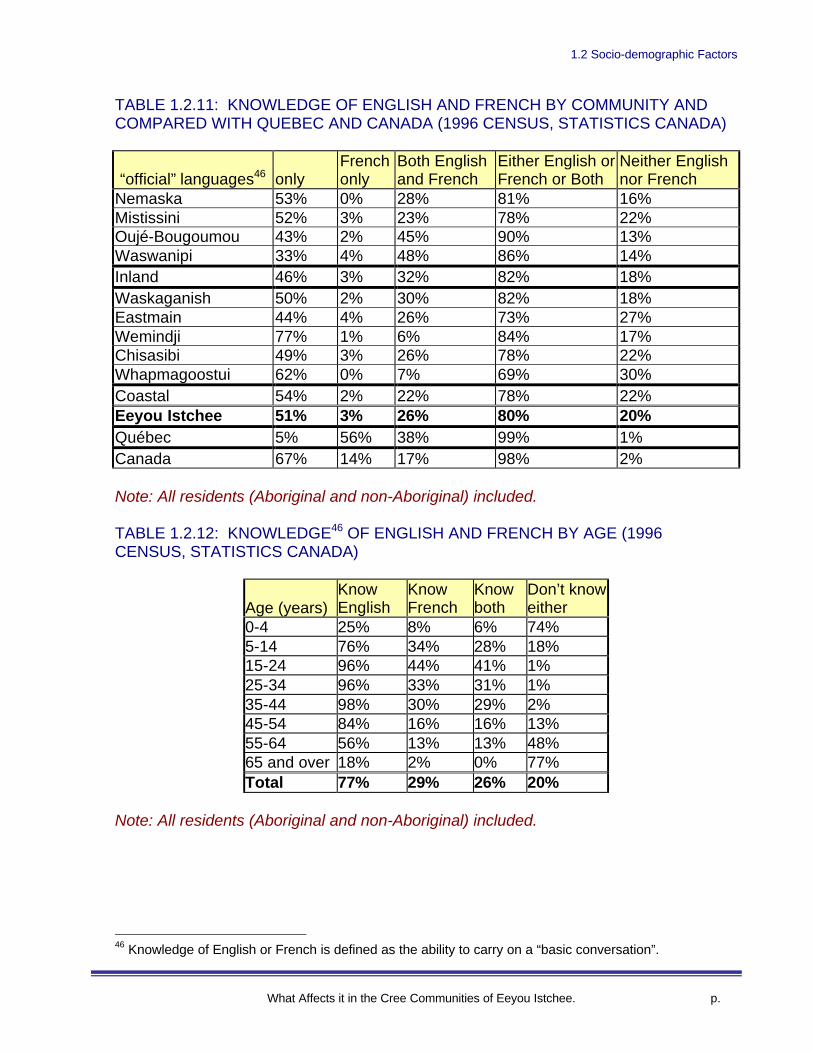
1.2 Socio-demographic Factors
What Affects it in the Cree Communities of Eeyou Istchee. p.
TABLE 1.2.11: KNOWLEDGE OF ENGLISH AND FRENCH BY COMMUNITY ANDCOMPARED WITH QUEBEC AND CANADA (1996 CENSUS, STATISTICS CANADA)
“official” languages46 onlyFrenchonly
Both Englishand French
Either English orFrench or Both
Neither Englishnor French
Nemaska 53% 0% 28% 81% 16%Mistissini 52% 3% 23% 78% 22%Oujé-Bougoumou 43% 2% 45% 90% 13%Waswanipi 33% 4% 48% 86% 14%Inland 46% 3% 32% 82% 18%Waskaganish 50% 2% 30% 82% 18%Eastmain 44% 4% 26% 73% 27%Wemindji 77% 1% 6% 84% 17%Chisasibi 49% 3% 26% 78% 22%Whapmagoostui 62% 0% 7% 69% 30%Coastal 54% 2% 22% 78% 22%Eeyou Istchee 51% 3% 26% 80% 20%Québec 5% 56% 38% 99% 1%Canada 67% 14% 17% 98% 2%
Note: All residents (Aboriginal and non-Aboriginal) included.
TABLE 1.2.12: KNOWLEDGE46 OF ENGLISH AND FRENCH BY AGE (1996CENSUS, STATISTICS CANADA)
Age (years)KnowEnglish
KnowFrench
Knowboth
Don’t knoweither
0-4 25% 8% 6% 74%5-14 76% 34% 28% 18%15-24 96% 44% 41% 1%25-34 96% 33% 31% 1%35-44 98% 30% 29% 2%45-54 84% 16% 16% 13%55-64 56% 13% 13% 48%65 and over 18% 2% 0% 77%Total 77% 29% 26% 20%
Note: All residents (Aboriginal and non-Aboriginal) included.
46 Knowledge of English or French is defined as the ability to carry on a “basic conversation”.
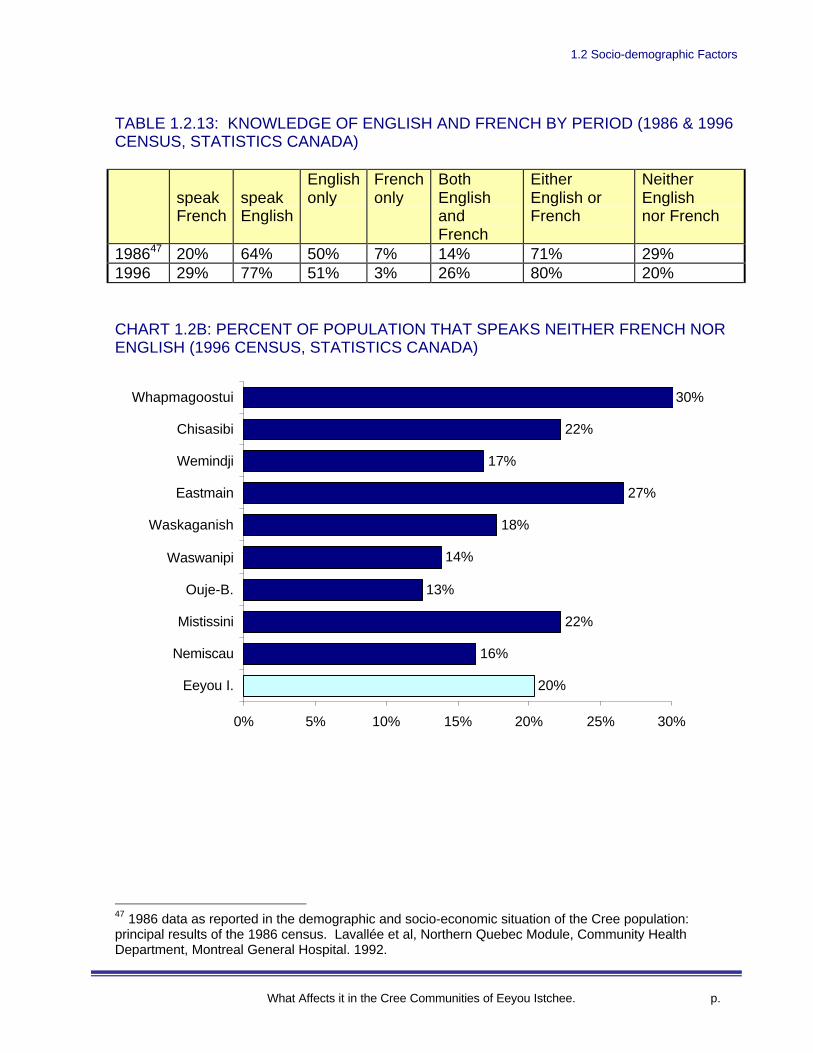
1.2 Socio-demographic Factors
What Affects it in the Cree Communities of Eeyou Istchee. p.
TABLE 1.2.13: KNOWLEDGE OF ENGLISH AND FRENCH BY PERIOD (1986 & 1996CENSUS, STATISTICS CANADA)
speakFrench
speakEnglish
Englishonly
Frenchonly
BothEnglishandFrench
EitherEnglish orFrench
NeitherEnglishnor French
198647 20% 64% 50% 7% 14% 71% 29%1996 29% 77% 51% 3% 26% 80% 20%
CHART 1.2B: PERCENT OF POPULATION THAT SPEAKS NEITHER FRENCH NORENGLISH (1996 CENSUS, STATISTICS CANADA)
47 1986 data as reported in the demographic and socio-economic situation of the Cree population:principal results of the 1986 census. Lavallée et al, Northern Quebec Module, Community HealthDepartment, Montreal General Hospital. 1992.
20%
16%
22%
13%
14%
18%
27%
17%
22%
30%
0% 5% 10% 15% 20% 25% 30%
Eeyou I.
Nemiscau
Mistissini
Ouje-B.
Waswanipi
Waskaganish
Eastmain
Wemindji
Chisasibi
Whapmagoostui

1.2 Socio-demographic Factors
Health and What Affects it in the Cree Communities of Eeyou Istchee. p. 34
TABLE 1.2.14: PROPORTION OF RESIDENTS THAT MOVED (CHANGEDRESIDENCE48) BETWEEN 1991 AND 1996 (1996 CENSUS, STATISTICS CANADA)
1996 Residents of Moved in 5 years prior to 1996Nemaska 30%Mistissini 39%
Oujé-Bougoumou 100%Waswanipi 52%
Waskaganish 38%Eastmain 26%Wemindji 29%Chisasibi 32%
Whapmagoostui 49%Eeyou Istchee 39%
Canada 43%
Note: Oujé-Bougoumou was created in 1991.
TABLE 1.2.15: NUMBER OF PEOPLE BY MOVING STATUS, YEAR PRIOR AND 5YEARS PRIOR TO 1996 CENSUS (1996 CENSUS, STATISTICS CANADA)
Did notmove
Moved withincommunity
Moved fromelsewhere in Quebec
Moved fromother province
Moved fromother country
Previous year 9475 1110 360 100 10Previous 5 years 5965 2700 915 205 30
48 Defined as “changed address”. In other words, moves within a community, moves betweencommunities and moves to all other places are counted.
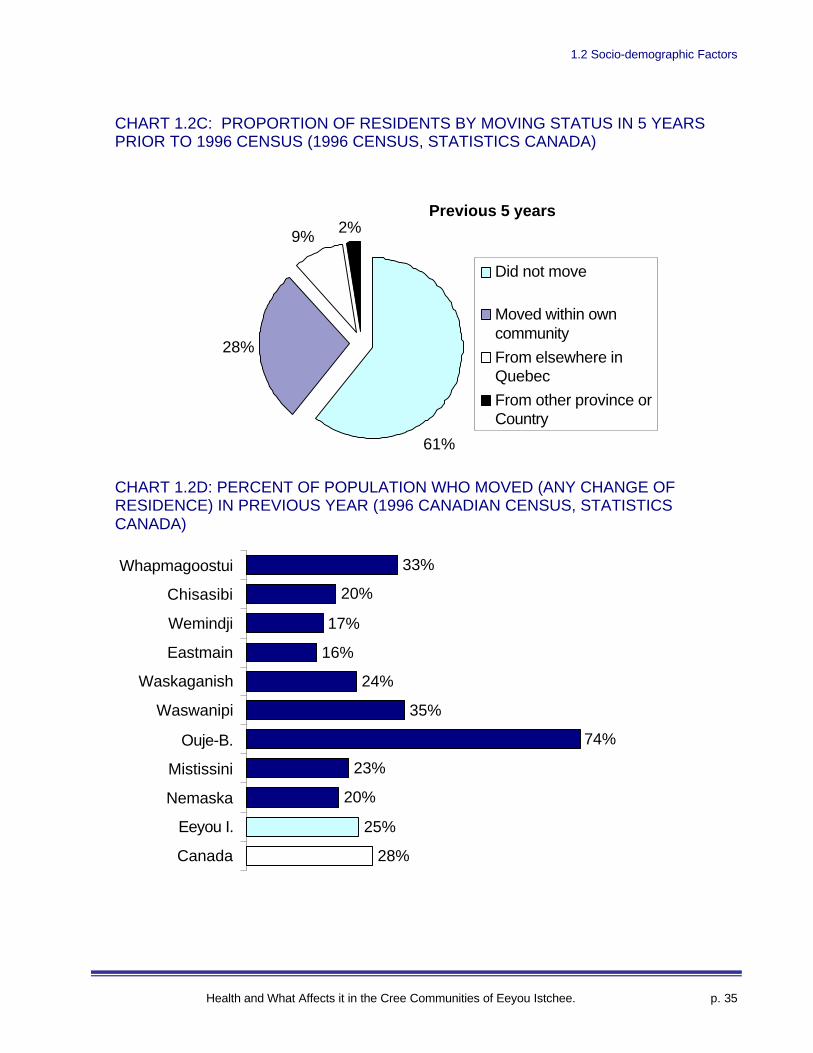
1.2 Socio-demographic Factors
Health and What Affects it in the Cree Communities of Eeyou Istchee. p. 35
CHART 1.2C: PROPORTION OF RESIDENTS BY MOVING STATUS IN 5 YEARSPRIOR TO 1996 CENSUS (1996 CENSUS, STATISTICS CANADA)
CHART 1.2D: PERCENT OF POPULATION WHO MOVED (ANY CHANGE OFRESIDENCE) IN PREVIOUS YEAR (1996 CANADIAN CENSUS, STATISTICSCANADA)
Previous 5 years
28%
9%2%
61%
Did not move
Moved within owncommunity
From elsewhere inQuebec
From other province orCountry
28%
25%
20%
23%
74%
35%
24%
16%
17%
20%
33%
Canada
Eeyou I.
Nemaska
Mistissini
Ouje-B.
Waswanipi
Waskaganish
Eastmain
Wemindji
Chisasibi
Whapmagoostui

1.3 Socio-economic Factors
Health and What Affects it in the Cree Communities of Eeyou Istchee. p. 36
1.3. Socio-economic factors
Key Points
Ø Of those 15 and up, 36% have completed high school vs. 65% for Quebec as awhole (1996)
Ø Of those 15 and over in Eeyou Istchee, 2% of the Aboriginal population has auniversity degree compared to 56% of the non-Aboriginal population. The figurefor Quebec as a whole is 12%.
Ø In 1981, 53% of those over 15 had less than a grade 9 education. By 1996, thefigure dropped to 35%.
Ø The unemployment rate among those 15 and up is 17% in Eeyou Istchee,compared with 12% for Quebec and 10% for Canada.
Ø Among people under 40, the unemployment rate among is about one and a halftimes that for Quebec as a whole, but among those 40 and over the rate inEeyou Istchee is lower.
Ø Among those employed in Eeyou Istchee, only 39% had full-year, full-time jobscompared with 51% among Quebecois in general.
Ø The welfare rate in Eeyou Istchee was 5.0%, compared with 9.6% for Quebec asa whole.
Ø Average total income among men in Eeyou Istchee is $21,578 (vs. $28,436 forQuebec) and $15,536 for women (vs. $17,836 for Quebec)
Ø The average total income for Aboriginals in Eeyou Istchee is less than half that ofnon-Aboriginals in the territory (Aboriginal men: $19,542, women: $14,131 vs.non-Aboriginal men: $45,071 and women: $36,012)
Ø The average number of persons per room is 0.8 compared to 0.4 for Quebec.Ø The proportion of occupied dwellings with more than one person per room is 24%
compared to 1% for Quebec
Data Sources and Quality
• Primarily census data. See notes in section 1.2
• Comparisons of income levels are difficult to compare directly with otherpopulations because:
o First Nations generally do not pay income tax when employed on reserve.o An important proportion of some households’ “incomes” may be non-
monetary in nature (e.g. hunting, fishing, sharing)o Costs of living in the North are higher.o The Cree Hunter and Trappers Income Security Program is a unique
program that does not fit cleanly within standard census definitions (seebelow).
• The “mixed economy” (combination of wage and land-based economies) that ischaracteristic of Eeyou Istchee makes comparisons of employment, welfareand income figures with other jurisdictions difficult to interpret. The
1.3 Socio-economic Factors
Health and What Affects it in the Cree Communities of Eeyou Istchee. p. 37
standard statistical indicators reflect only the wage and cash based aspect of theeconomy. The significant value of non-monetary inputs, such as subsistencehunting and fishing, is not clearly accounted for, nor are they measured instandardized ways.
• The Cree Hunter and Trappers Income Security Program (ISP) provided incometo 2687 people in 1998-99. There is no equivalent program elsewhere inCanada. It is a form of guaranteed annual income program. Those on theprogram are not eligible to receive welfare. Both husband and wife are classedas beneficiaries if each meets the program criteria. The existence of the programcomplicates comparisons with employment rates in other jurisdictions.
• To compare (un)employment rates derived from the census, it is crucial to knowwhether or not beneficiaries of the ISP were counted as “employed.”According to Statistics Canada officials49, a person who trapped or worked in thebush full-time should have been considered self-employed. They indicated thatmost of the men receiving ISP benefits self-identified as self-employed trappersand were therefore counted as self-employed. They said that women receivingISP benefits were often recorded as not employed, unless they indicated thatthey were “trappers”. The issue of ISP recipients were coded in the censusremains somewhat unclear. It is not possible to quantify the effect on StatisticsCanada’s employment figures.
• The employment-to-population figures, overall (for those 15 and up), appear atfirst glance close to those for Quebec as a whole, but there are some importantissues to consider in comparing the figures:
o Compared to Quebec, a greater proportion of employed persons work inpart-time jobs. This fact is reflected in the overall income figures.
o Compared to Eeyou Istchee, the relatively high proportion of people over65 in Quebec (many of whom are retired) tends to decrease theemployment figures for Quebec in terms. When those over 65 areremoved from the statistics, employment-to-population levels in EeyouIstchee are substantially lower than in Quebec.
o When non-Aboriginal persons are excluded, the Eeyou Istcheeemployment-to-population figures drop considerably.
o Some individuals receiving income from the ISP may be counted asemployed (see discussion, above.)
• A comparison of the unemployment rates for people aged 20-64 provides adifferent picture.
49 Source: Dominique Castonguay and Patricia Simon of Statistics Canada’s Quebec regional office,based on a telephone interview by Jill Torrie (Public Health Module- Cree Region of James Bay).
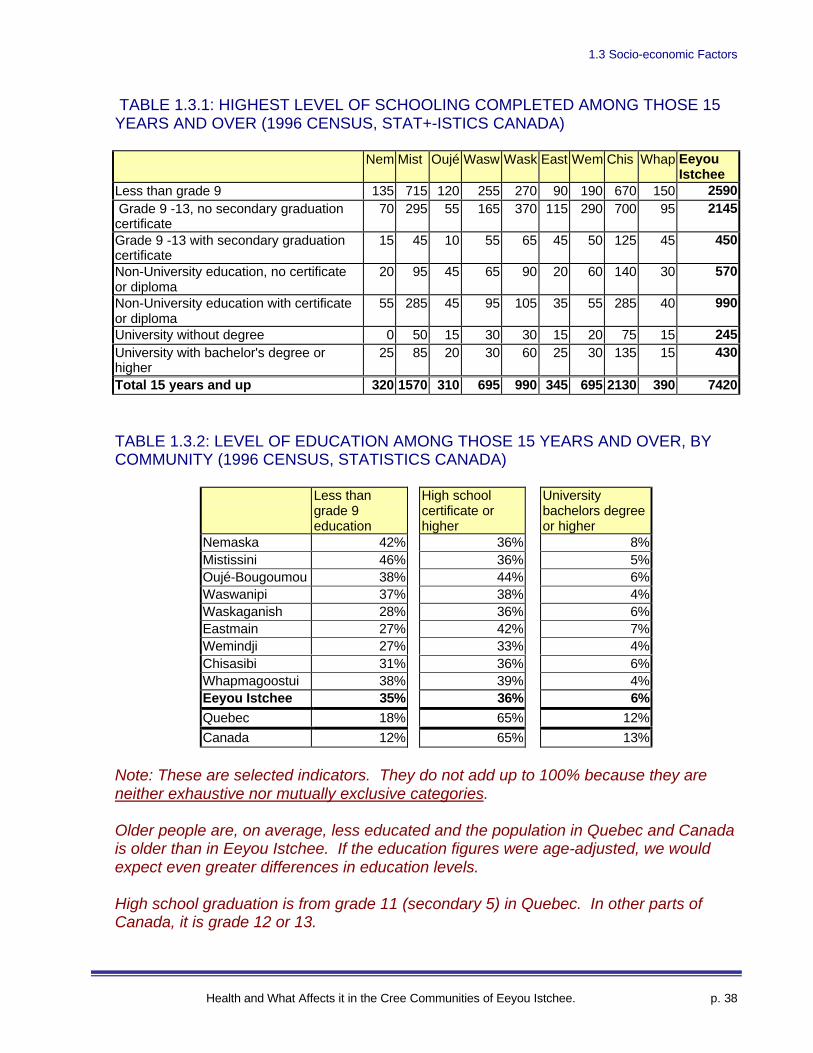
1.3 Socio-economic Factors
Health and What Affects it in the Cree Communities of Eeyou Istchee. p. 38
TABLE 1.3.1: HIGHEST LEVEL OF SCHOOLING COMPLETED AMONG THOSE 15YEARS AND OVER (1996 CENSUS, STAT+-ISTICS CANADA)
Nem Mist Oujé Wasw Wask East Wem Chis Whap EeyouIstchee
Less than grade 9 135 715 120 255 270 90 190 670 150 2590 Grade 9 -13, no secondary graduationcertificate
70 295 55 165 370 115 290 700 95 2145
Grade 9 -13 with secondary graduationcertificate
15 45 10 55 65 45 50 125 45 450
Non-University education, no certificateor diploma
20 95 45 65 90 20 60 140 30 570
Non-University education with certificateor diploma
55 285 45 95 105 35 55 285 40 990
University without degree 0 50 15 30 30 15 20 75 15 245University with bachelor's degree orhigher
25 85 20 30 60 25 30 135 15 430
Total 15 years and up 320 1570 310 695 990 345 695 2130 390 7420
TABLE 1.3.2: LEVEL OF EDUCATION AMONG THOSE 15 YEARS AND OVER, BYCOMMUNITY (1996 CENSUS, STATISTICS CANADA)
Less thangrade 9education
High schoolcertificate orhigher
Universitybachelors degreeor higher
Nemaska 42% 36% 8%Mistissini 46% 36% 5%Oujé-Bougoumou 38% 44% 6%Waswanipi 37% 38% 4%Waskaganish 28% 36% 6%Eastmain 27% 42% 7%Wemindji 27% 33% 4%Chisasibi 31% 36% 6%Whapmagoostui 38% 39% 4%Eeyou Istchee 35% 36% 6%Quebec 18% 65% 12%
Canada 12% 65% 13%
Note: These are selected indicators. They do not add up to 100% because they areneither exhaustive nor mutually exclusive categories.
Older people are, on average, less educated and the population in Quebec and Canadais older than in Eeyou Istchee. If the education figures were age-adjusted, we wouldexpect even greater differences in education levels.
High school graduation is from grade 11 (secondary 5) in Quebec. In other parts ofCanada, it is grade 12 or 13.
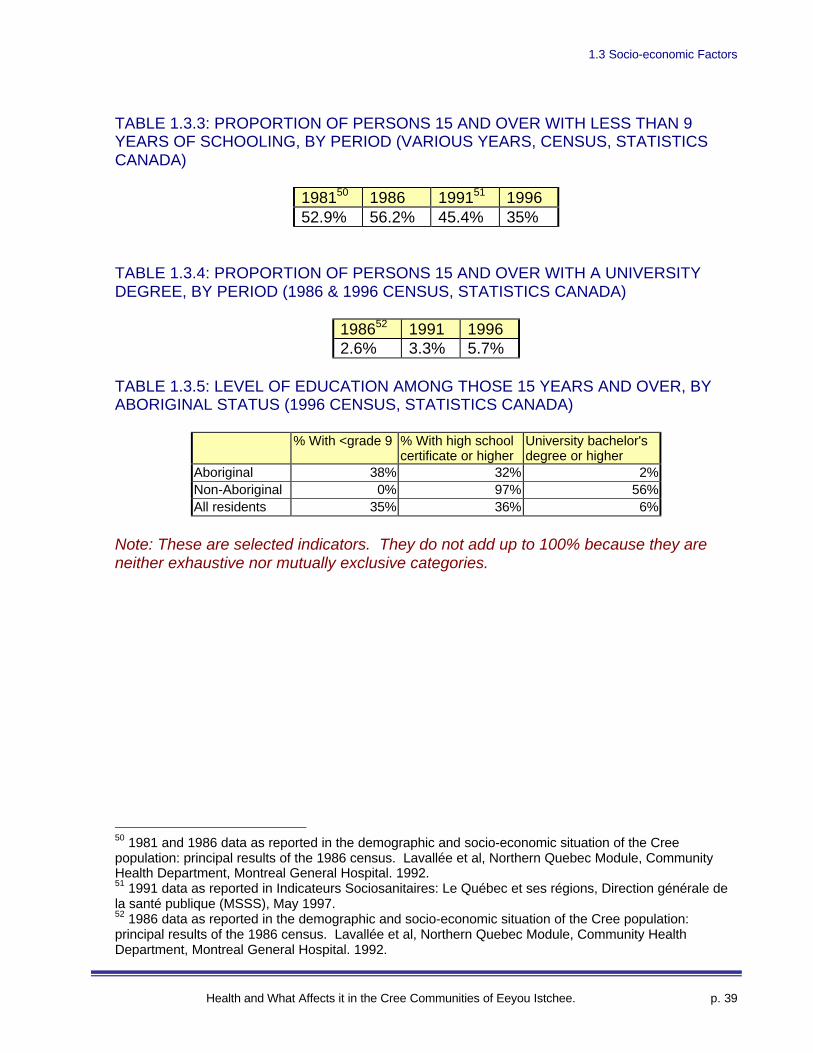
1.3 Socio-economic Factors
Health and What Affects it in the Cree Communities of Eeyou Istchee. p. 39
TABLE 1.3.3: PROPORTION OF PERSONS 15 AND OVER WITH LESS THAN 9YEARS OF SCHOOLING, BY PERIOD (VARIOUS YEARS, CENSUS, STATISTICSCANADA)
198150 1986 199151 199652.9% 56.2% 45.4% 35%
TABLE 1.3.4: PROPORTION OF PERSONS 15 AND OVER WITH A UNIVERSITYDEGREE, BY PERIOD (1986 & 1996 CENSUS, STATISTICS CANADA)
198652 1991 19962.6% 3.3% 5.7%
TABLE 1.3.5: LEVEL OF EDUCATION AMONG THOSE 15 YEARS AND OVER, BYABORIGINAL STATUS (1996 CENSUS, STATISTICS CANADA)
% With <grade 9 % With high schoolcertificate or higher
University bachelor'sdegree or higher
Aboriginal 38% 32% 2%Non-Aboriginal 0% 97% 56%All residents 35% 36% 6%
Note: These are selected indicators. They do not add up to 100% because they areneither exhaustive nor mutually exclusive categories.
50 1981 and 1986 data as reported in the demographic and socio-economic situation of the Creepopulation: principal results of the 1986 census. Lavallée et al, Northern Quebec Module, CommunityHealth Department, Montreal General Hospital. 1992.51 1991 data as reported in Indicateurs Sociosanitaires: Le Québec et ses régions, Direction générale dela santé publique (MSSS), May 1997.52 1986 data as reported in the demographic and socio-economic situation of the Cree population:principal results of the 1986 census. Lavallée et al, Northern Quebec Module, Community HealthDepartment, Montreal General Hospital. 1992.
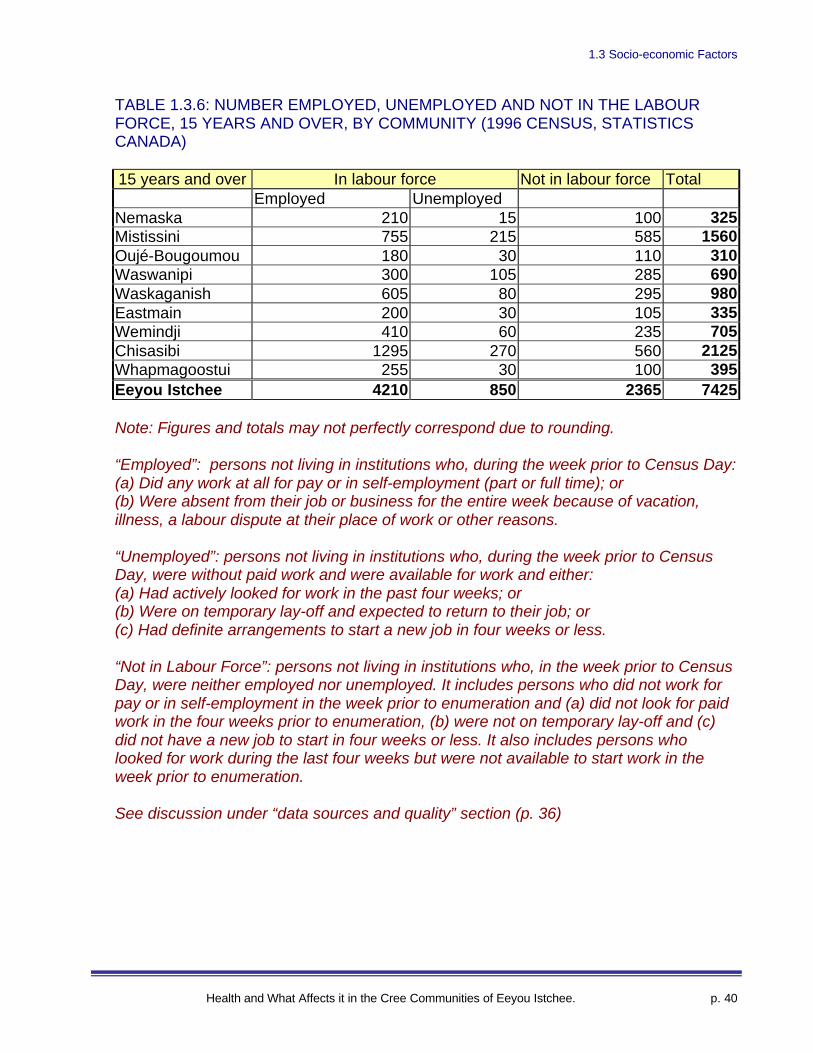
1.3 Socio-economic Factors
Health and What Affects it in the Cree Communities of Eeyou Istchee. p. 40
TABLE 1.3.6: NUMBER EMPLOYED, UNEMPLOYED AND NOT IN THE LABOURFORCE, 15 YEARS AND OVER, BY COMMUNITY (1996 CENSUS, STATISTICSCANADA)
15 years and over In labour force Not in labour force TotalEmployed Unemployed
Nemaska 210 15 100 325Mistissini 755 215 585 1560Oujé-Bougoumou 180 30 110 310Waswanipi 300 105 285 690Waskaganish 605 80 295 980Eastmain 200 30 105 335Wemindji 410 60 235 705Chisasibi 1295 270 560 2125Whapmagoostui 255 30 100 395Eeyou Istchee 4210 850 2365 7425
Note: Figures and totals may not perfectly correspond due to rounding.
“Employed”: persons not living in institutions who, during the week prior to Census Day:(a) Did any work at all for pay or in self-employment (part or full time); or(b) Were absent from their job or business for the entire week because of vacation,illness, a labour dispute at their place of work or other reasons.
“Unemployed”: persons not living in institutions who, during the week prior to CensusDay, were without paid work and were available for work and either:(a) Had actively looked for work in the past four weeks; or(b) Were on temporary lay-off and expected to return to their job; or(c) Had definite arrangements to start a new job in four weeks or less.
“Not in Labour Force”: persons not living in institutions who, in the week prior to CensusDay, were neither employed nor unemployed. It includes persons who did not work forpay or in self-employment in the week prior to enumeration and (a) did not look for paidwork in the four weeks prior to enumeration, (b) were not on temporary lay-off and (c)did not have a new job to start in four weeks or less. It also includes persons wholooked for work during the last four weeks but were not available to start work in theweek prior to enumeration.
See discussion under “data sources and quality” section (p. 36)
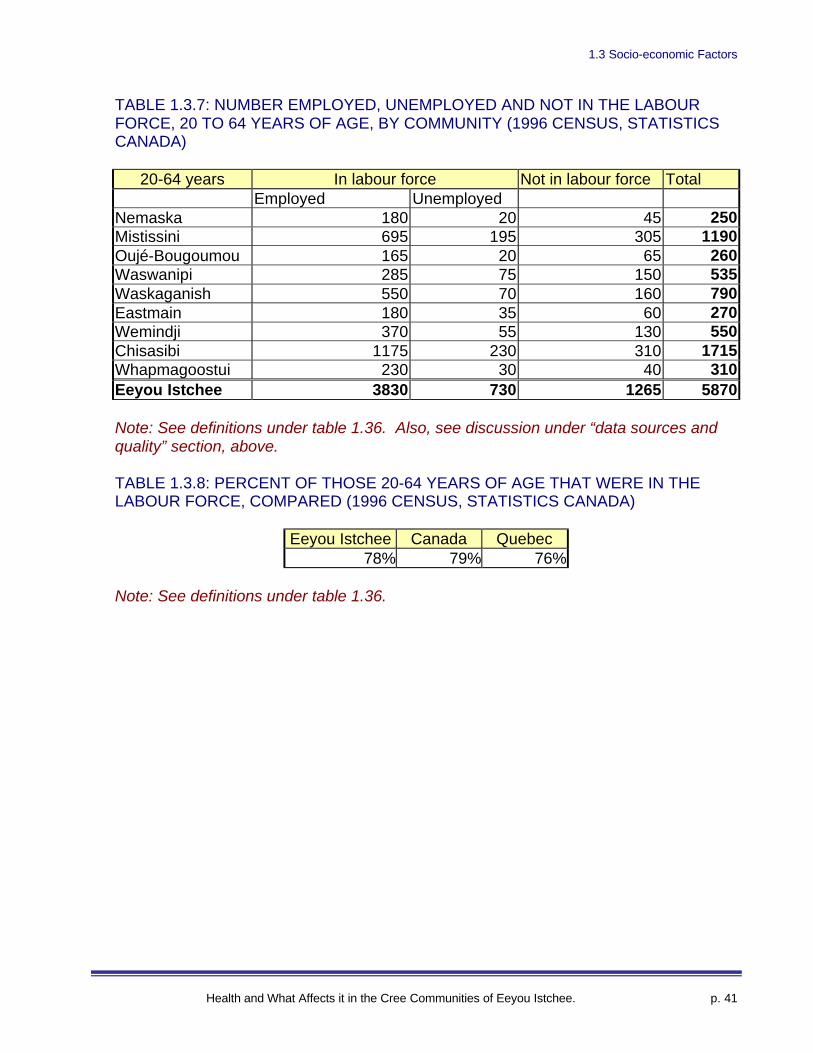
1.3 Socio-economic Factors
Health and What Affects it in the Cree Communities of Eeyou Istchee. p. 41
TABLE 1.3.7: NUMBER EMPLOYED, UNEMPLOYED AND NOT IN THE LABOURFORCE, 20 TO 64 YEARS OF AGE, BY COMMUNITY (1996 CENSUS, STATISTICSCANADA)
20-64 years In labour force Not in labour force TotalEmployed Unemployed
Nemaska 180 20 45 250Mistissini 695 195 305 1190Oujé-Bougoumou 165 20 65 260Waswanipi 285 75 150 535Waskaganish 550 70 160 790Eastmain 180 35 60 270Wemindji 370 55 130 550Chisasibi 1175 230 310 1715Whapmagoostui 230 30 40 310Eeyou Istchee 3830 730 1265 5870
Note: See definitions under table 1.36. Also, see discussion under “data sources andquality” section, above.
TABLE 1.3.8: PERCENT OF THOSE 20-64 YEARS OF AGE THAT WERE IN THELABOUR FORCE, COMPARED (1996 CENSUS, STATISTICS CANADA)
Eeyou Istchee Canada Quebec78% 79% 76%
Note: See definitions under table 1.36.
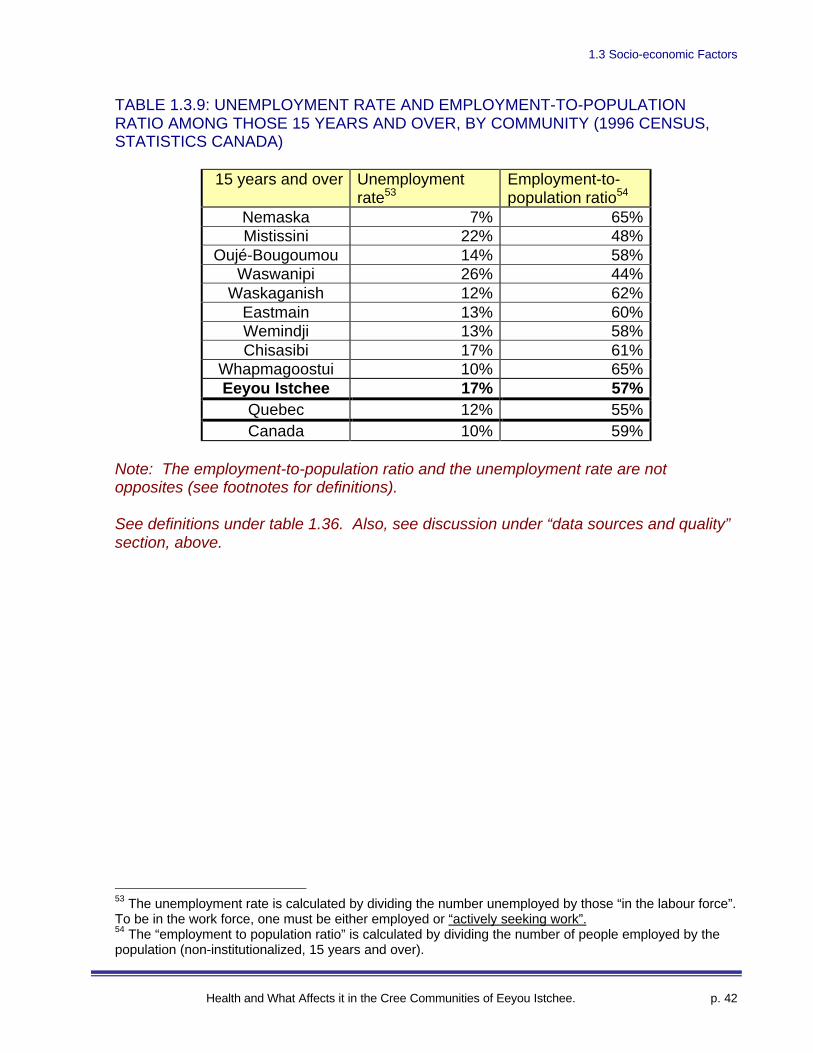
1.3 Socio-economic Factors
Health and What Affects it in the Cree Communities of Eeyou Istchee. p. 42
TABLE 1.3.9: UNEMPLOYMENT RATE AND EMPLOYMENT-TO-POPULATIONRATIO AMONG THOSE 15 YEARS AND OVER, BY COMMUNITY (1996 CENSUS,STATISTICS CANADA)
15 years and over Unemploymentrate53
Employment-to-population ratio54
Nemaska 7% 65%Mistissini 22% 48%
Oujé-Bougoumou 14% 58%Waswanipi 26% 44%
Waskaganish 12% 62%Eastmain 13% 60%Wemindji 13% 58%Chisasibi 17% 61%
Whapmagoostui 10% 65%Eeyou Istchee 17% 57%
Quebec 12% 55%Canada 10% 59%
Note: The employment-to-population ratio and the unemployment rate are notopposites (see footnotes for definitions).
See definitions under table 1.36. Also, see discussion under “data sources and quality”section, above.
53 The unemployment rate is calculated by dividing the number unemployed by those “in the labour force”.To be in the work force, one must be either employed or “actively seeking work”.54 The “employment to population ratio” is calculated by dividing the number of people employed by thepopulation (non-institutionalized, 15 years and over).
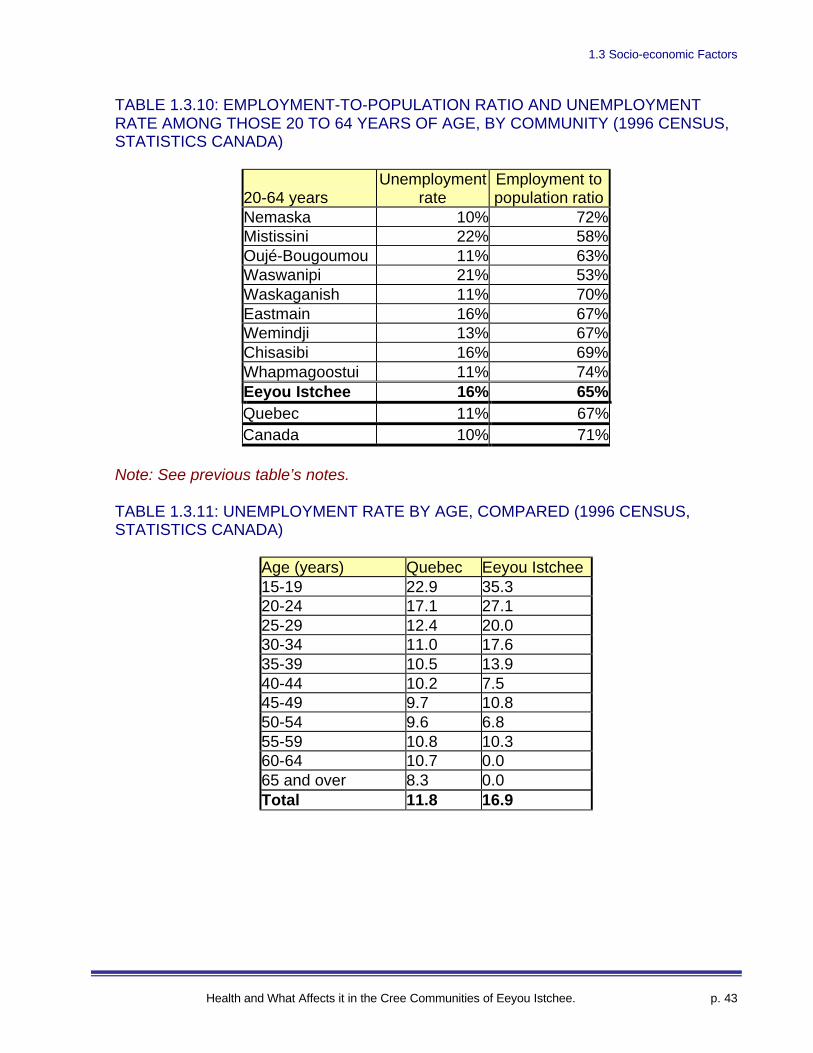
1.3 Socio-economic Factors
Health and What Affects it in the Cree Communities of Eeyou Istchee. p. 43
TABLE 1.3.10: EMPLOYMENT-TO-POPULATION RATIO AND UNEMPLOYMENTRATE AMONG THOSE 20 TO 64 YEARS OF AGE, BY COMMUNITY (1996 CENSUS,STATISTICS CANADA)
20-64 yearsUnemployment
rateEmployment topopulation ratio
Nemaska 10% 72%Mistissini 22% 58%Oujé-Bougoumou 11% 63%Waswanipi 21% 53%Waskaganish 11% 70%Eastmain 16% 67%Wemindji 13% 67%Chisasibi 16% 69%Whapmagoostui 11% 74%Eeyou Istchee 16% 65%Quebec 11% 67%Canada 10% 71%
Note: See previous table’s notes.
TABLE 1.3.11: UNEMPLOYMENT RATE BY AGE, COMPARED (1996 CENSUS,STATISTICS CANADA)
Age (years) Quebec Eeyou Istchee15-19 22.9 35.320-24 17.1 27.125-29 12.4 20.030-34 11.0 17.635-39 10.5 13.940-44 10.2 7.545-49 9.7 10.850-54 9.6 6.855-59 10.8 10.360-64 10.7 0.065 and over 8.3 0.0Total 11.8 16.9
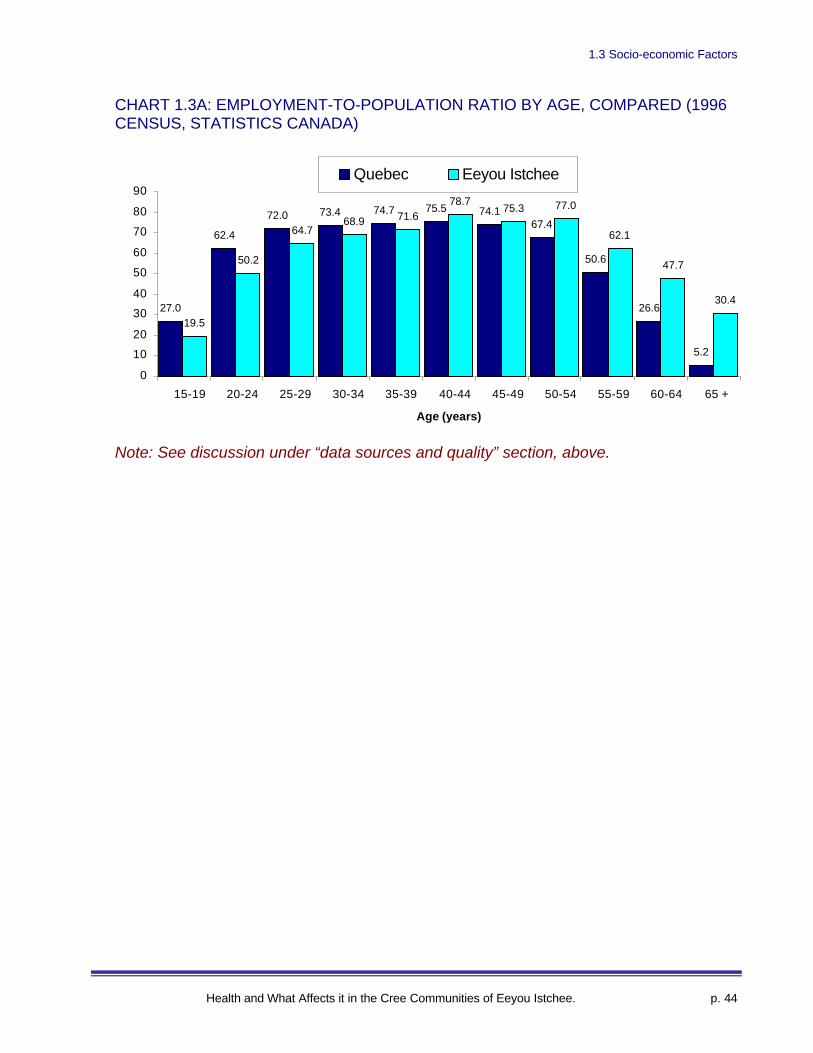
1.3 Socio-economic Factors
Health and What Affects it in the Cree Communities of Eeyou Istchee. p. 44
CHART 1.3A: EMPLOYMENT-TO-POPULATION RATIO BY AGE, COMPARED (1996CENSUS, STATISTICS CANADA)
Note: See discussion under “data sources and quality” section, above.
27.0
62.4
72.0 73.4 74.7 75.5 74.167.4
50.6
26.6
5.2
19.5
50.2
64.768.9 71.6
78.775.3 77.0
62.1
47.7
30.4
0
10
20
30
40
50
60
70
80
90
15-19 20-24 25-29 30-34 35-39 40-44 45-49 50-54 55-59 60-64 65 +
Age (years)
Quebec Eeyou Istchee
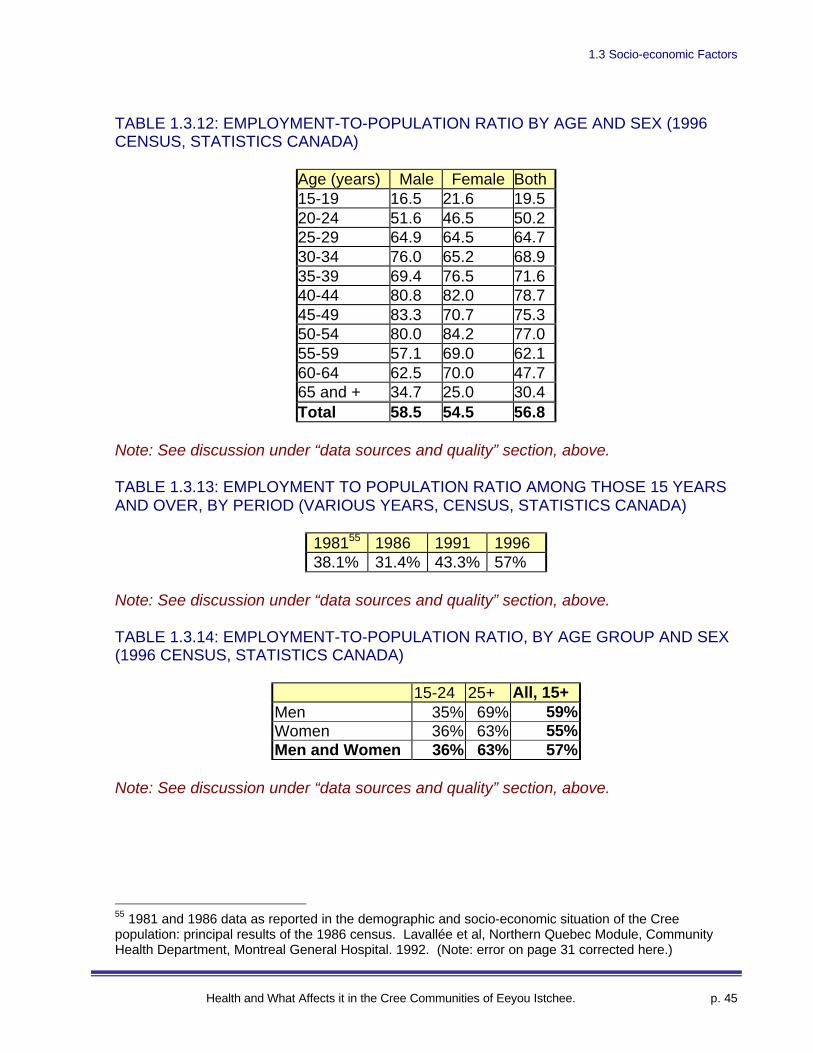
1.3 Socio-economic Factors
Health and What Affects it in the Cree Communities of Eeyou Istchee. p. 45
TABLE 1.3.12: EMPLOYMENT-TO-POPULATION RATIO BY AGE AND SEX (1996CENSUS, STATISTICS CANADA)
Age (years) Male Female Both15-19 16.5 21.6 19.520-24 51.6 46.5 50.225-29 64.9 64.5 64.730-34 76.0 65.2 68.935-39 69.4 76.5 71.640-44 80.8 82.0 78.745-49 83.3 70.7 75.350-54 80.0 84.2 77.055-59 57.1 69.0 62.160-64 62.5 70.0 47.765 and + 34.7 25.0 30.4Total 58.5 54.5 56.8
Note: See discussion under “data sources and quality” section, above.
TABLE 1.3.13: EMPLOYMENT TO POPULATION RATIO AMONG THOSE 15 YEARSAND OVER, BY PERIOD (VARIOUS YEARS, CENSUS, STATISTICS CANADA)
198155 1986 1991 199638.1% 31.4% 43.3% 57%
Note: See discussion under “data sources and quality” section, above.
TABLE 1.3.14: EMPLOYMENT-TO-POPULATION RATIO, BY AGE GROUP AND SEX(1996 CENSUS, STATISTICS CANADA)
15-24 25+ All, 15+Men 35% 69% 59%Women 36% 63% 55%Men and Women 36% 63% 57%
Note: See discussion under “data sources and quality” section, above.
55 1981 and 1986 data as reported in the demographic and socio-economic situation of the Creepopulation: principal results of the 1986 census. Lavallée et al, Northern Quebec Module, CommunityHealth Department, Montreal General Hospital. 1992. (Note: error on page 31 corrected here.)
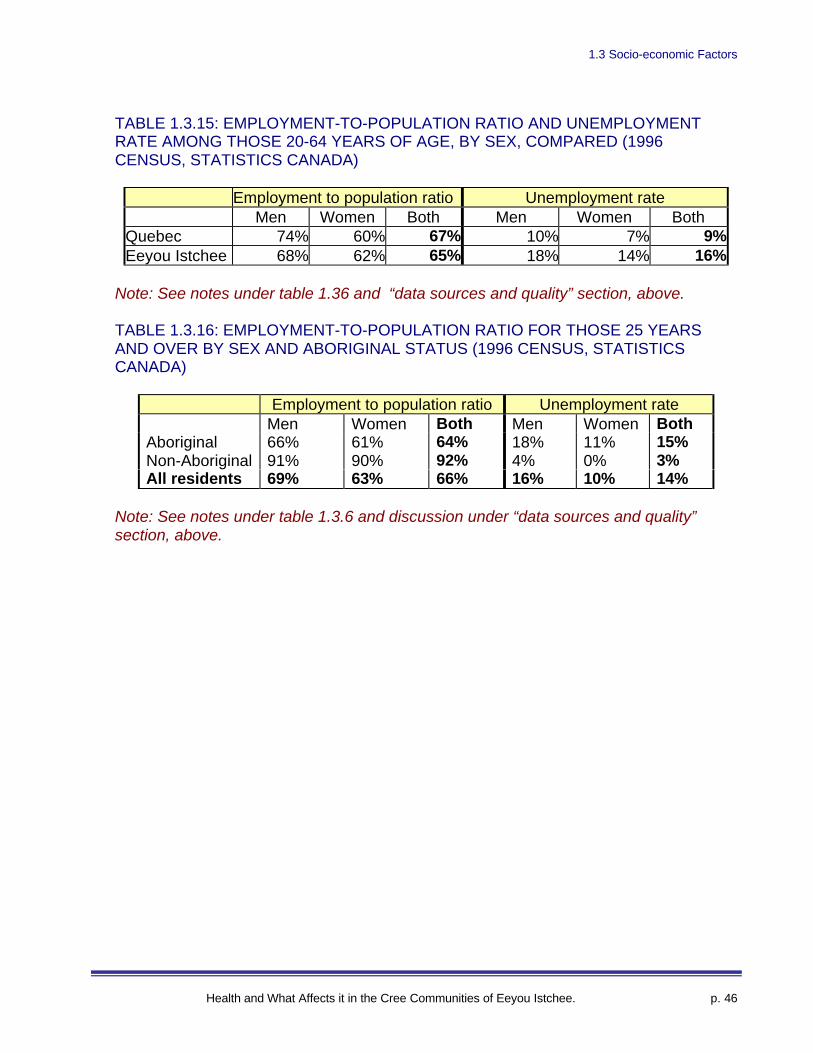
1.3 Socio-economic Factors
Health and What Affects it in the Cree Communities of Eeyou Istchee. p. 46
TABLE 1.3.15: EMPLOYMENT-TO-POPULATION RATIO AND UNEMPLOYMENTRATE AMONG THOSE 20-64 YEARS OF AGE, BY SEX, COMPARED (1996CENSUS, STATISTICS CANADA)
Employment to population ratio Unemployment rateMen Women Both Men Women Both
Quebec 74% 60% 67% 10% 7% 9%Eeyou Istchee 68% 62% 65% 18% 14% 16%
Note: See notes under table 1.36 and “data sources and quality” section, above.
TABLE 1.3.16: EMPLOYMENT-TO-POPULATION RATIO FOR THOSE 25 YEARSAND OVER BY SEX AND ABORIGINAL STATUS (1996 CENSUS, STATISTICSCANADA)
Employment to population ratio Unemployment rateMen Women Both Men Women Both
Aboriginal 66% 61% 64% 18% 11% 15%Non-Aboriginal 91% 90% 92% 4% 0% 3%All residents 69% 63% 66% 16% 10% 14%
Note: See notes under table 1.3.6 and discussion under “data sources and quality”section, above.
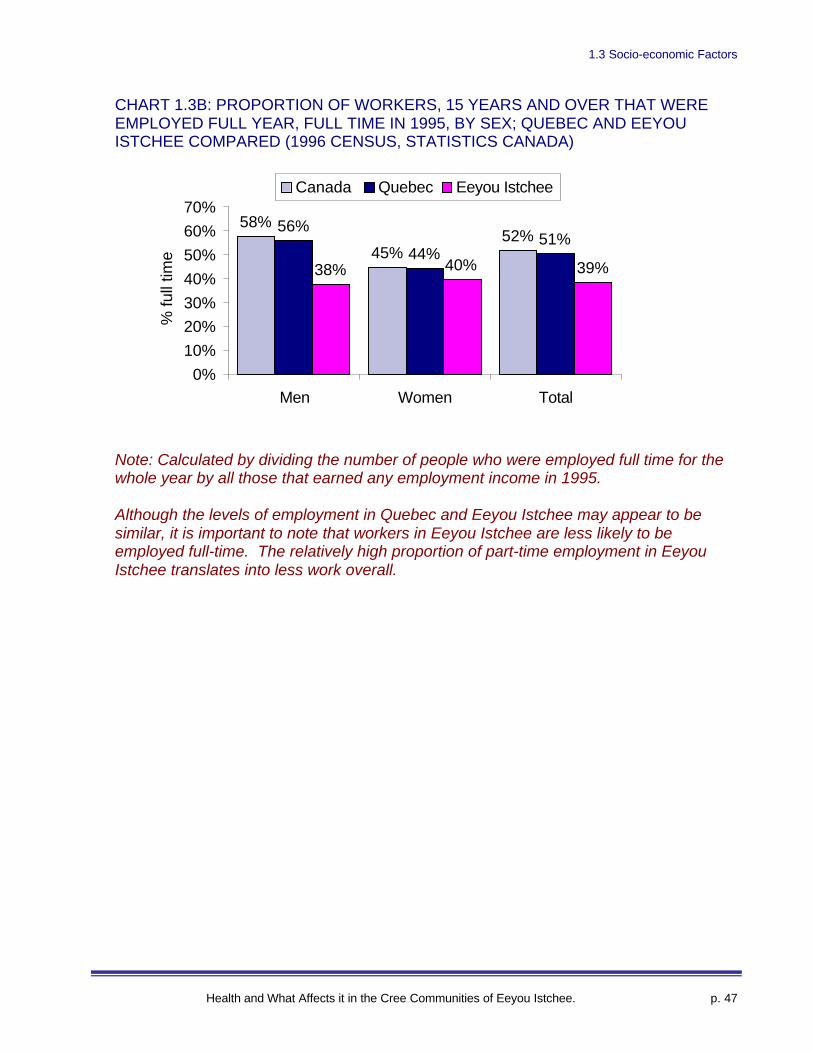
1.3 Socio-economic Factors
Health and What Affects it in the Cree Communities of Eeyou Istchee. p. 47
CHART 1.3B: PROPORTION OF WORKERS, 15 YEARS AND OVER THAT WEREEMPLOYED FULL YEAR, FULL TIME IN 1995, BY SEX; QUEBEC AND EEYOUISTCHEE COMPARED (1996 CENSUS, STATISTICS CANADA)
Note: Calculated by dividing the number of people who were employed full time for thewhole year by all those that earned any employment income in 1995.
Although the levels of employment in Quebec and Eeyou Istchee may appear to besimilar, it is important to note that workers in Eeyou Istchee are less likely to beemployed full-time. The relatively high proportion of part-time employment in EeyouIstchee translates into less work overall.
58%
45%52%
56%
44%51%
38% 40% 39%
0%
10%
20%
30%
40%
50%
60%
70%
Men Women Total
% fu
ll tim
eCanada Quebec Eeyou Istchee
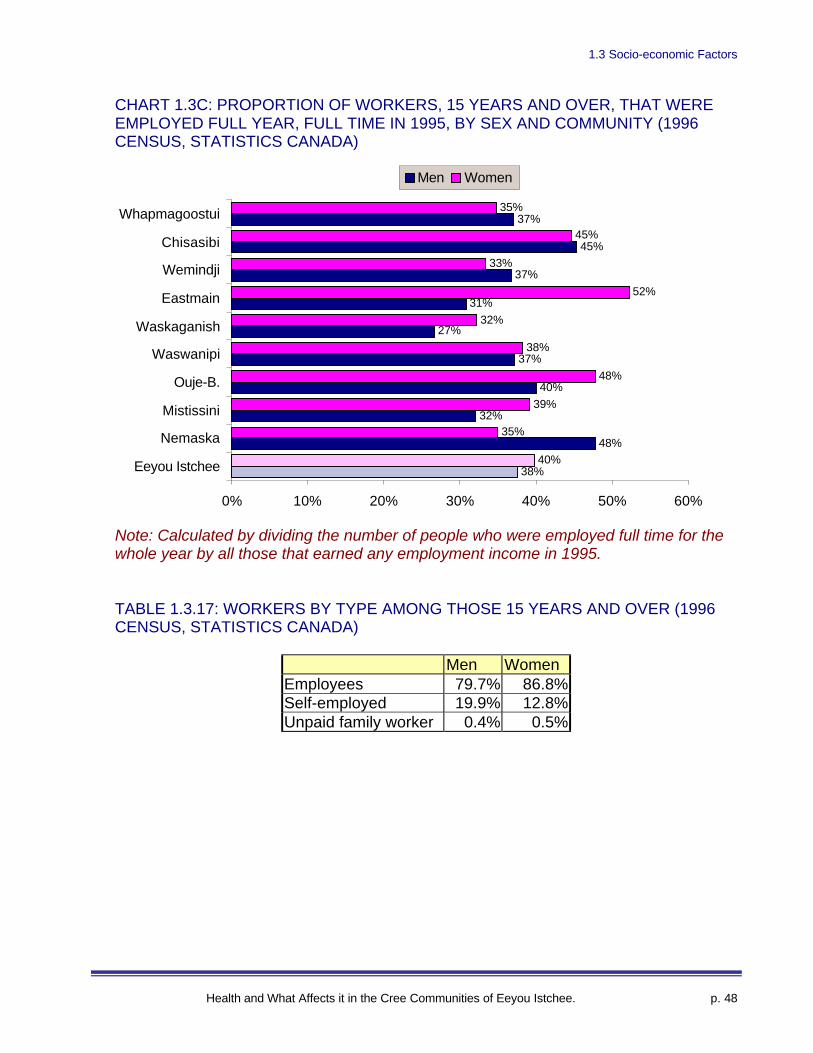
1.3 Socio-economic Factors
Health and What Affects it in the Cree Communities of Eeyou Istchee. p. 48
CHART 1.3C: PROPORTION OF WORKERS, 15 YEARS AND OVER, THAT WEREEMPLOYED FULL YEAR, FULL TIME IN 1995, BY SEX AND COMMUNITY (1996CENSUS, STATISTICS CANADA)
Note: Calculated by dividing the number of people who were employed full time for thewhole year by all those that earned any employment income in 1995.
TABLE 1.3.17: WORKERS BY TYPE AMONG THOSE 15 YEARS AND OVER (1996CENSUS, STATISTICS CANADA)
Men WomenEmployees 79.7% 86.8%Self-employed 19.9% 12.8%Unpaid family worker 0.4% 0.5%
38%
48%
32%
40%
37%
27%
31%
37%
45%
37%
40%
35%
39%
48%
38%
32%
52%
33%
45%
35%
0% 10% 20% 30% 40% 50% 60%
Eeyou Istchee
Nemaska
Mistissini
Ouje-B.
Waswanipi
Waskaganish
Eastmain
Wemindji
Chisasibi
Whapmagoostui
Men Women
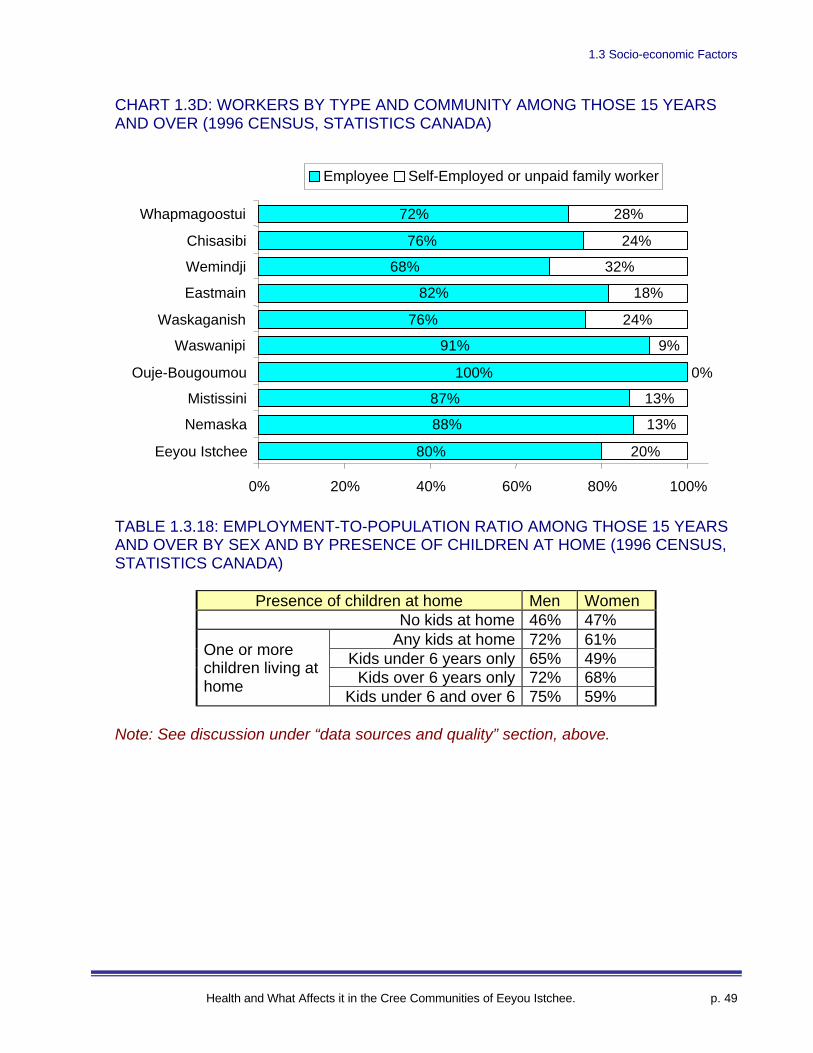
1.3 Socio-economic Factors
Health and What Affects it in the Cree Communities of Eeyou Istchee. p. 49
CHART 1.3D: WORKERS BY TYPE AND COMMUNITY AMONG THOSE 15 YEARSAND OVER (1996 CENSUS, STATISTICS CANADA)
TABLE 1.3.18: EMPLOYMENT-TO-POPULATION RATIO AMONG THOSE 15 YEARSAND OVER BY SEX AND BY PRESENCE OF CHILDREN AT HOME (1996 CENSUS,STATISTICS CANADA)
Presence of children at home Men WomenNo kids at home 46% 47%
Any kids at home 72% 61%Kids under 6 years only 65% 49%
Kids over 6 years only 72% 68%
One or morechildren living athome
Kids under 6 and over 6 75% 59%
Note: See discussion under “data sources and quality” section, above.
80%
88%
87%
100%
91%
76%
82%
68%
76%
72%
20%
13%
13%
0%
9%
24%
18%
32%
24%
28%
0% 20% 40% 60% 80% 100%
Eeyou Istchee
Nemaska
Mistissini
Ouje-Bougoumou
Waswanipi
Waskaganish
Eastmain
Wemindji
Chisasibi
Whapmagoostui
Employee Self-Employed or unpaid family worker
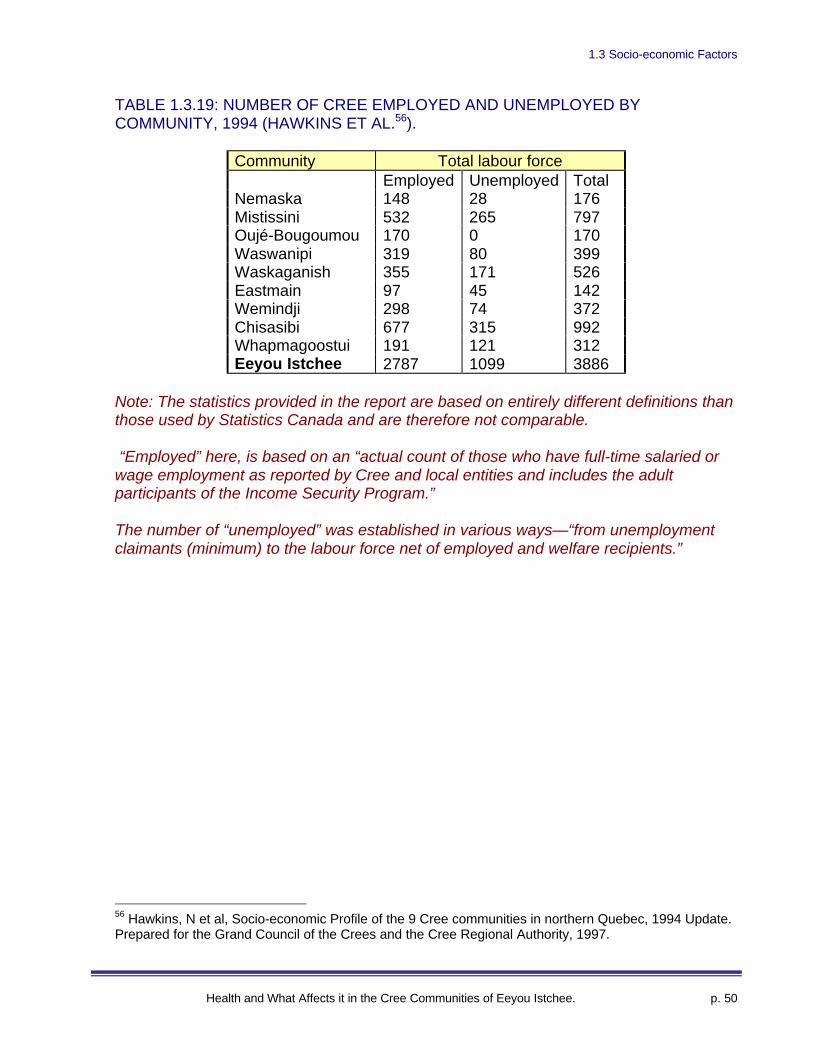
1.3 Socio-economic Factors
Health and What Affects it in the Cree Communities of Eeyou Istchee. p. 50
TABLE 1.3.19: NUMBER OF CREE EMPLOYED AND UNEMPLOYED BYCOMMUNITY, 1994 (HAWKINS ET AL.56).
Community Total labour forceEmployed Unemployed Total
Nemaska 148 28 176Mistissini 532 265 797Oujé-Bougoumou 170 0 170Waswanipi 319 80 399Waskaganish 355 171 526Eastmain 97 45 142Wemindji 298 74 372Chisasibi 677 315 992Whapmagoostui 191 121 312Eeyou Istchee 2787 1099 3886
Note: The statistics provided in the report are based on entirely different definitions thanthose used by Statistics Canada and are therefore not comparable.
“Employed” here, is based on an “actual count of those who have full-time salaried orwage employment as reported by Cree and local entities and includes the adultparticipants of the Income Security Program.”
The number of “unemployed” was established in various ways—“from unemploymentclaimants (minimum) to the labour force net of employed and welfare recipients.”
56 Hawkins, N et al, Socio-economic Profile of the 9 Cree communities in northern Quebec, 1994 Update.Prepared for the Grand Council of the Crees and the Cree Regional Authority, 1997.

1.3 Socio-economic Factors
Health and What Affects it in the Cree Communities of Eeyou Istchee. p. 51
TABLE 1.3.20: CREE LABOUR FORCE BY COMMUNITY AND SOURCE OFINCOME, 1994 (HAWKINS ET AL.57).
Community Incomesecurity
Creeentities
Bandadmin.
Localenterprises
Other Un-employed
Total
Nemaska 53 43 31 17 4 28 176Mistissini 326 93 57 56 0 265 797Oujé-B. 93 12 46 18 1 0 170Waswanipi 189 39 43 44 4 80 399Waskaganish 160 49 64 71 11 171 526Eastmain 25 23 26 23 0 45 142Wemindji 143 32 45 70 8 74 372Chisasibi 315 150 115 93 4 315 992Whapmagoostui 115 23 36 17 0 121 312Eeyou Istchee 1419 464 463 409 32 1099 3886% 37% 12% 12% 11% 1% 28% 100%
Note: See notes under table 1.3.19 for definition of unemployed.
TABLE 1.3.21: INCOME SOURCE OF THE EMPLOYED LABOUR FORCE IN CREEREGION BY COMMUNITY AND SOURCE OF INCOME (HAWKINS ET AL.58).
Community Income Securitybenefits (ISP)
Full-time jobs Total % ISP
Nemaska 53 95 148 36%Mistissini 326 206 532 61%Oujé-B. 93 77 170 55%Waswanipi 189 130 319 59%Waskaganish 160 195 355 45%Eastmain 25 72 97 26%Wemindji 143 155 298 48%Chisasibi 315 362 677 47%Whapmagoostui 115 76 191 60%Eeyou Istchee 1419 1368 2787 51%
Note: See notes under table 1.3.19 for definition of unemployed.
57 IBID58 IBID
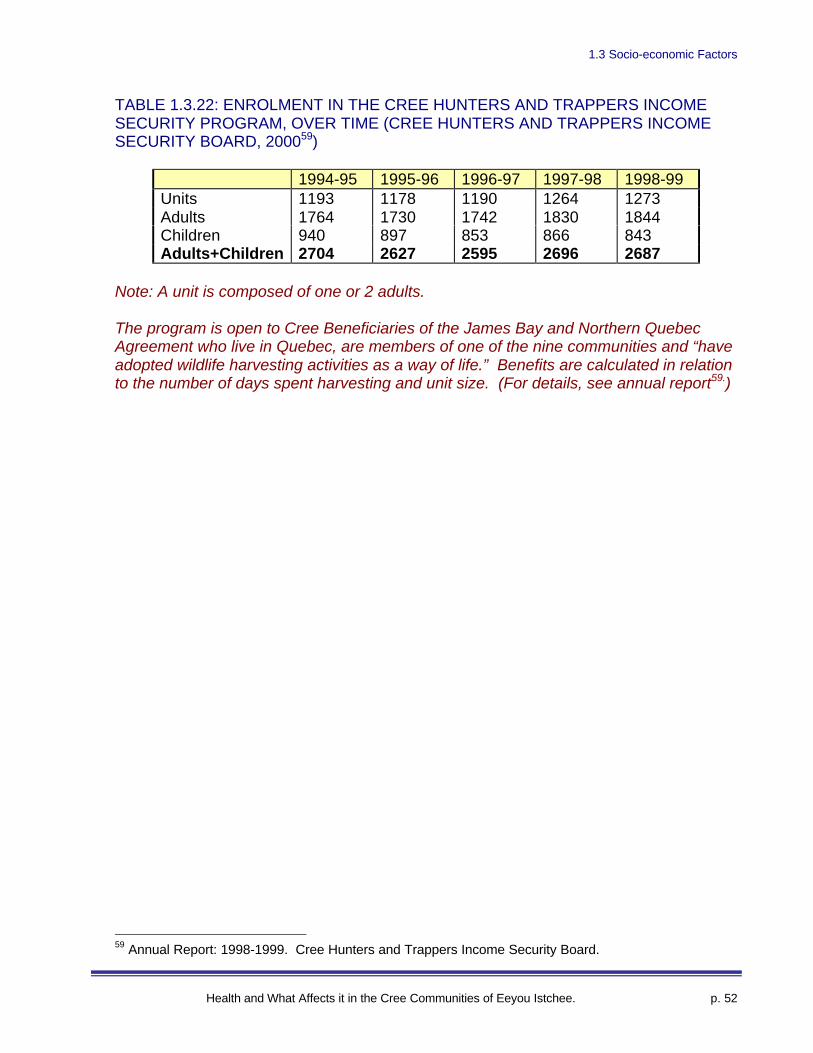
1.3 Socio-economic Factors
Health and What Affects it in the Cree Communities of Eeyou Istchee. p. 52
TABLE 1.3.22: ENROLMENT IN THE CREE HUNTERS AND TRAPPERS INCOMESECURITY PROGRAM, OVER TIME (CREE HUNTERS AND TRAPPERS INCOMESECURITY BOARD, 200059)
1994-95 1995-96 1996-97 1997-98 1998-99Units 1193 1178 1190 1264 1273Adults 1764 1730 1742 1830 1844Children 940 897 853 866 843Adults+Children 2704 2627 2595 2696 2687
Note: A unit is composed of one or 2 adults.
The program is open to Cree Beneficiaries of the James Bay and Northern QuebecAgreement who live in Quebec, are members of one of the nine communities and “haveadopted wildlife harvesting activities as a way of life.” Benefits are calculated in relationto the number of days spent harvesting and unit size. (For details, see annual report59.)
59 Annual Report: 1998-1999. Cree Hunters and Trappers Income Security Board.
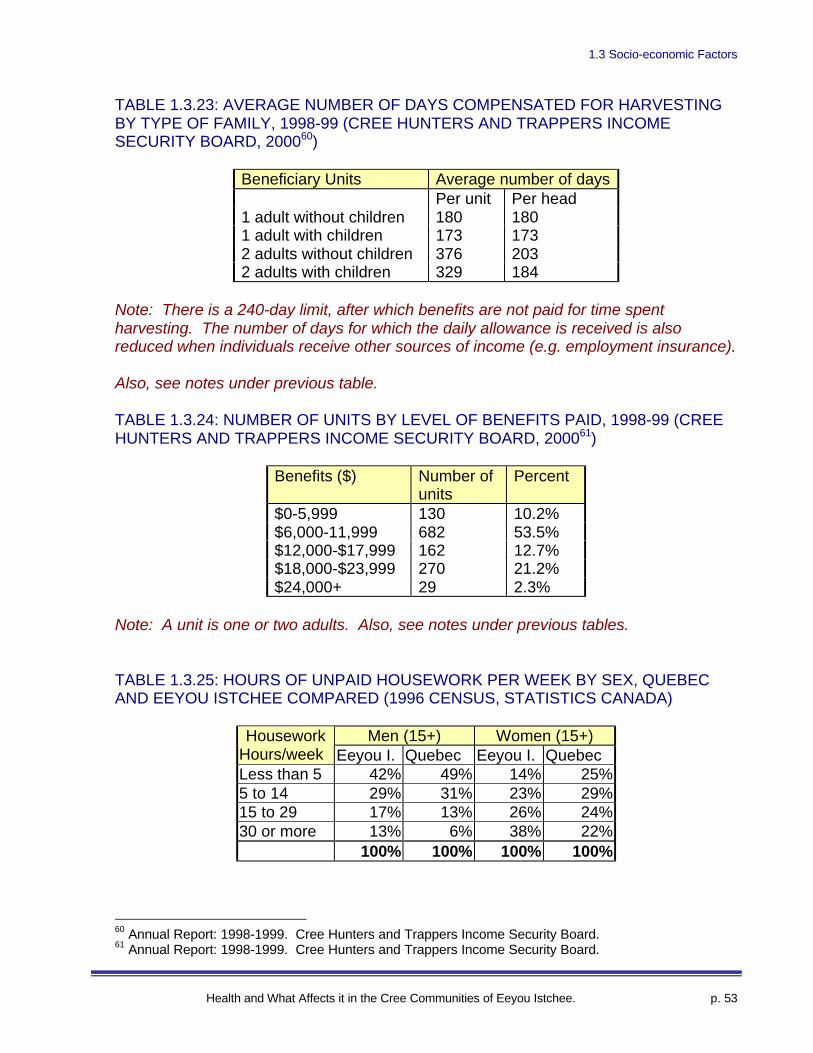
1.3 Socio-economic Factors
Health and What Affects it in the Cree Communities of Eeyou Istchee. p. 53
TABLE 1.3.23: AVERAGE NUMBER OF DAYS COMPENSATED FOR HARVESTINGBY TYPE OF FAMILY, 1998-99 (CREE HUNTERS AND TRAPPERS INCOMESECURITY BOARD, 200060)
Beneficiary Units Average number of daysPer unit Per head
1 adult without children 180 1801 adult with children 173 1732 adults without children 376 2032 adults with children 329 184
Note: There is a 240-day limit, after which benefits are not paid for time spentharvesting. The number of days for which the daily allowance is received is alsoreduced when individuals receive other sources of income (e.g. employment insurance).
Also, see notes under previous table.
TABLE 1.3.24: NUMBER OF UNITS BY LEVEL OF BENEFITS PAID, 1998-99 (CREEHUNTERS AND TRAPPERS INCOME SECURITY BOARD, 200061)
Benefits ($) Number ofunits
Percent
$0-5,999 130 10.2%$6,000-11,999 682 53.5%$12,000-$17,999 162 12.7%$18,000-$23,999 270 21.2%$24,000+ 29 2.3%
Note: A unit is one or two adults. Also, see notes under previous tables.
TABLE 1.3.25: HOURS OF UNPAID HOUSEWORK PER WEEK BY SEX, QUEBECAND EEYOU ISTCHEE COMPARED (1996 CENSUS, STATISTICS CANADA)
Men (15+) Women (15+)HouseworkHours/week Eeyou I. Quebec Eeyou I. QuebecLess than 5 42% 49% 14% 25%5 to 14 29% 31% 23% 29%15 to 29 17% 13% 26% 24%30 or more 13% 6% 38% 22%
100% 100% 100% 100%
60 Annual Report: 1998-1999. Cree Hunters and Trappers Income Security Board.61 Annual Report: 1998-1999. Cree Hunters and Trappers Income Security Board.
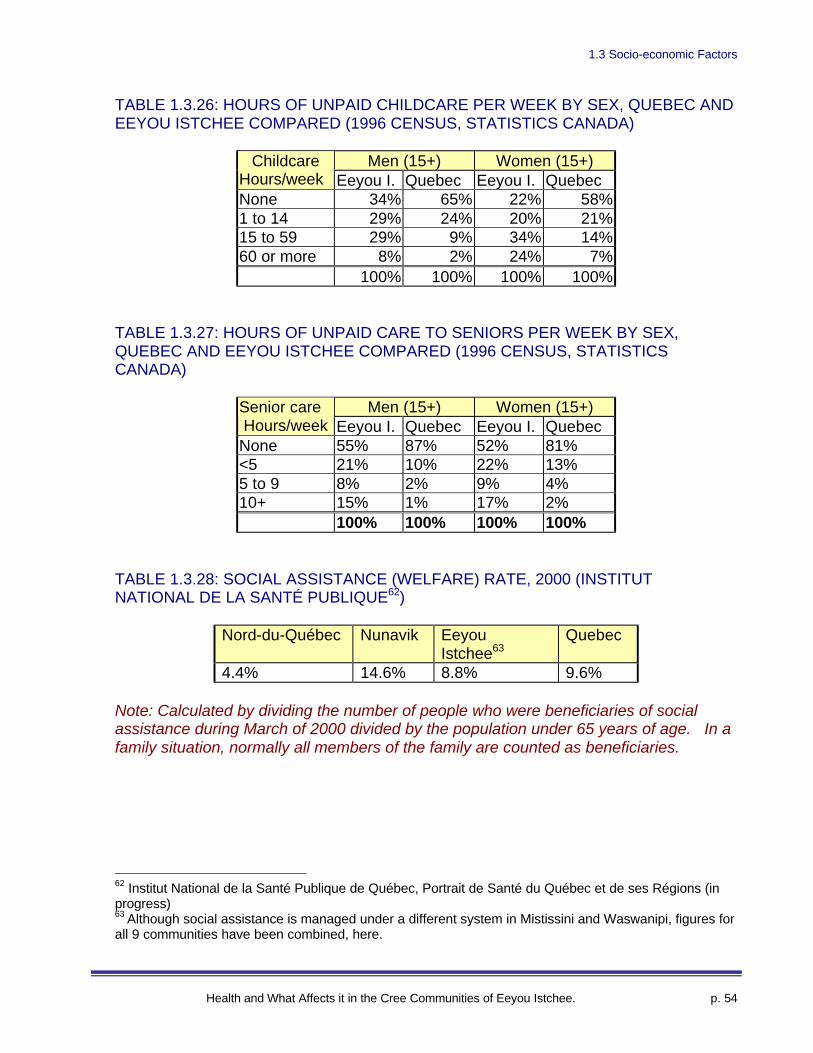
1.3 Socio-economic Factors
Health and What Affects it in the Cree Communities of Eeyou Istchee. p. 54
TABLE 1.3.26: HOURS OF UNPAID CHILDCARE PER WEEK BY SEX, QUEBEC ANDEEYOU ISTCHEE COMPARED (1996 CENSUS, STATISTICS CANADA)
Men (15+) Women (15+)ChildcareHours/week Eeyou I. Quebec Eeyou I. QuebecNone 34% 65% 22% 58%1 to 14 29% 24% 20% 21%15 to 59 29% 9% 34% 14%60 or more 8% 2% 24% 7%
100% 100% 100% 100%
TABLE 1.3.27: HOURS OF UNPAID CARE TO SENIORS PER WEEK BY SEX,QUEBEC AND EEYOU ISTCHEE COMPARED (1996 CENSUS, STATISTICSCANADA)
Men (15+) Women (15+)Senior careHours/week Eeyou I. Quebec Eeyou I. Quebec
None 55% 87% 52% 81%<5 21% 10% 22% 13%5 to 9 8% 2% 9% 4%10+ 15% 1% 17% 2%
100% 100% 100% 100%
TABLE 1.3.28: SOCIAL ASSISTANCE (WELFARE) RATE, 2000 (INSTITUTNATIONAL DE LA SANTÉ PUBLIQUE62)
Nord-du-Québec Nunavik EeyouIstchee63
Quebec
4.4% 14.6% 8.8% 9.6%
Note: Calculated by dividing the number of people who were beneficiaries of socialassistance during March of 2000 divided by the population under 65 years of age. In afamily situation, normally all members of the family are counted as beneficiaries.
62 Institut National de la Santé Publique de Québec, Portrait de Santé du Québec et de ses Régions (inprogress)63 Although social assistance is managed under a different system in Mistissini and Waswanipi, figures forall 9 communities have been combined, here.
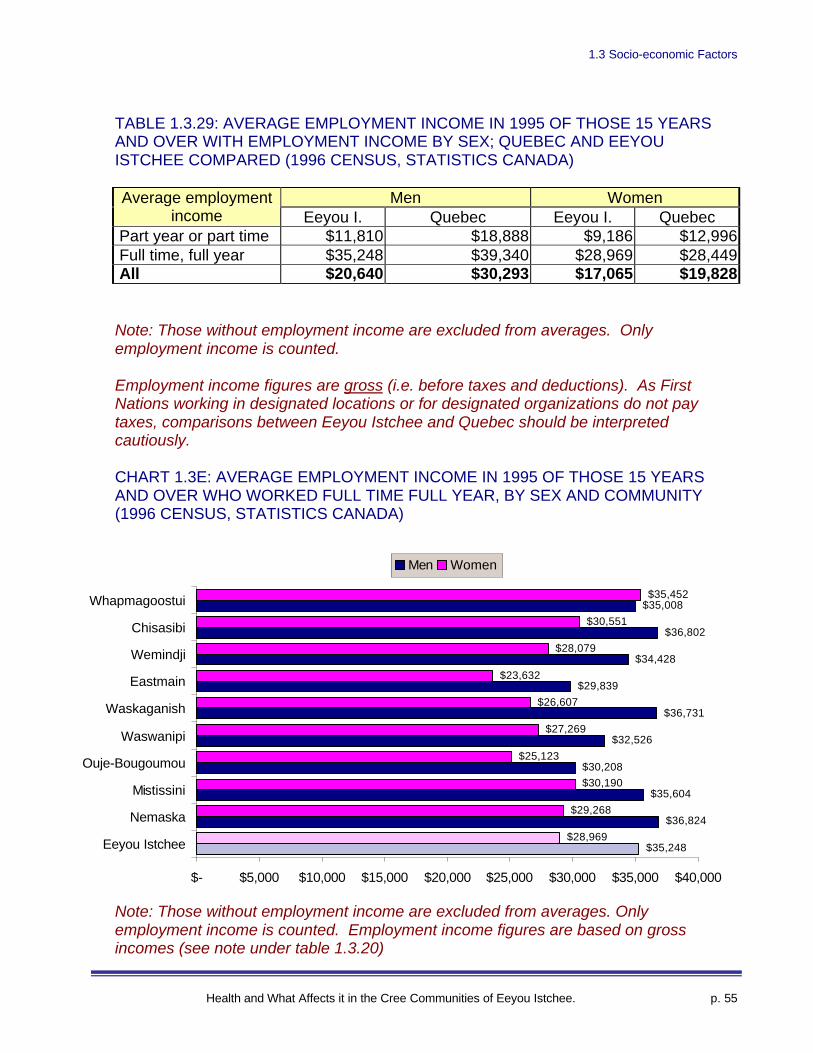
1.3 Socio-economic Factors
Health and What Affects it in the Cree Communities of Eeyou Istchee. p. 55
TABLE 1.3.29: AVERAGE EMPLOYMENT INCOME IN 1995 OF THOSE 15 YEARSAND OVER WITH EMPLOYMENT INCOME BY SEX; QUEBEC AND EEYOUISTCHEE COMPARED (1996 CENSUS, STATISTICS CANADA)
Men WomenAverage employmentincome Eeyou I. Quebec Eeyou I. Quebec
Part year or part time $11,810 $18,888 $9,186 $12,996 Full time, full year $35,248 $39,340 $28,969 $28,449 All $20,640 $30,293 $17,065 $19,828
Note: Those without employment income are excluded from averages. Onlyemployment income is counted.
Employment income figures are gross (i.e. before taxes and deductions). As FirstNations working in designated locations or for designated organizations do not paytaxes, comparisons between Eeyou Istchee and Quebec should be interpretedcautiously.
CHART 1.3E: AVERAGE EMPLOYMENT INCOME IN 1995 OF THOSE 15 YEARSAND OVER WHO WORKED FULL TIME FULL YEAR, BY SEX AND COMMUNITY(1996 CENSUS, STATISTICS CANADA)
Note: Those without employment income are excluded from averages. Onlyemployment income is counted. Employment income figures are based on grossincomes (see note under table 1.3.20)
$35,248
$36,824
$35,604
$30,208
$32,526
$36,731
$29,839
$34,428
$36,802
$35,008
$28,969
$29,268
$30,190
$25,123
$27,269
$26,607
$23,632
$28,079
$30,551
$35,452
$- $5,000 $10,000 $15,000 $20,000 $25,000 $30,000 $35,000 $40,000
Eeyou Istchee
Nemaska
Mistissini
Ouje-Bougoumou
Waswanipi
Waskaganish
Eastmain
Wemindji
Chisasibi
Whapmagoostui
Men Women
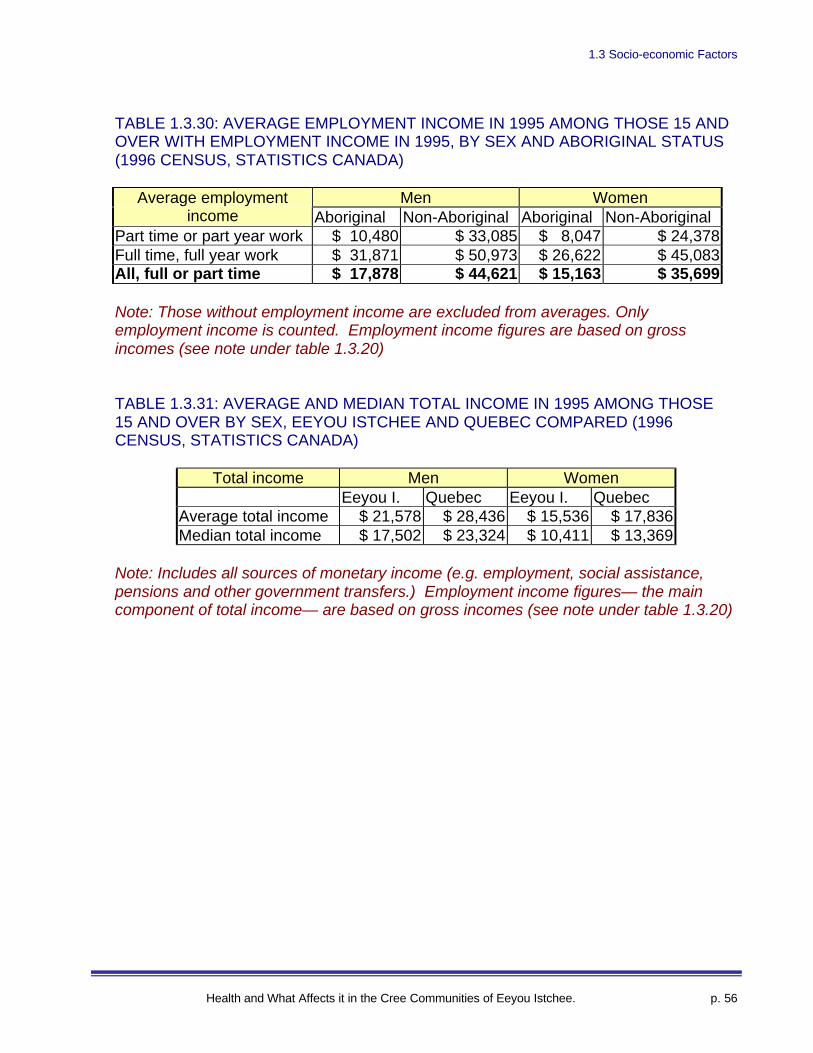
1.3 Socio-economic Factors
Health and What Affects it in the Cree Communities of Eeyou Istchee. p. 56
TABLE 1.3.30: AVERAGE EMPLOYMENT INCOME IN 1995 AMONG THOSE 15 ANDOVER WITH EMPLOYMENT INCOME IN 1995, BY SEX AND ABORIGINAL STATUS(1996 CENSUS, STATISTICS CANADA)
Men WomenAverage employmentincome Aboriginal Non-Aboriginal Aboriginal Non-Aboriginal
Part time or part year work $ 10,480 $ 33,085 $ 8,047 $ 24,378Full time, full year work $ 31,871 $ 50,973 $ 26,622 $ 45,083All, full or part time $ 17,878 $ 44,621 $ 15,163 $ 35,699
Note: Those without employment income are excluded from averages. Onlyemployment income is counted. Employment income figures are based on grossincomes (see note under table 1.3.20)
TABLE 1.3.31: AVERAGE AND MEDIAN TOTAL INCOME IN 1995 AMONG THOSE15 AND OVER BY SEX, EEYOU ISTCHEE AND QUEBEC COMPARED (1996CENSUS, STATISTICS CANADA)
Total income Men WomenEeyou I. Quebec Eeyou I. Quebec
Average total income $ 21,578 $ 28,436 $ 15,536 $ 17,836Median total income $ 17,502 $ 23,324 $ 10,411 $ 13,369
Note: Includes all sources of monetary income (e.g. employment, social assistance,pensions and other government transfers.) Employment income figures— the maincomponent of total income— are based on gross incomes (see note under table 1.3.20)
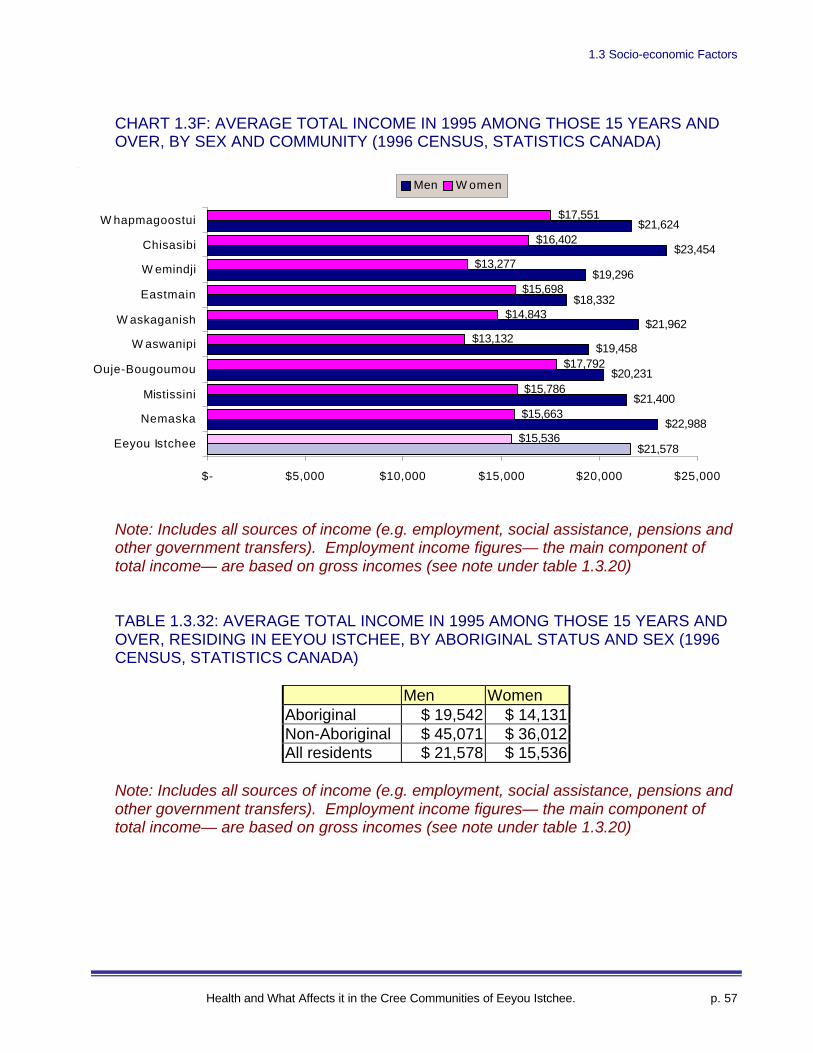
1.3 Socio-economic Factors
Health and What Affects it in the Cree Communities of Eeyou Istchee. p. 57
CHART 1.3F: AVERAGE TOTAL INCOME IN 1995 AMONG THOSE 15 YEARS ANDOVER, BY SEX AND COMMUNITY (1996 CENSUS, STATISTICS CANADA)
Note: Includes all sources of income (e.g. employment, social assistance, pensions andother government transfers). Employment income figures— the main component oftotal income— are based on gross incomes (see note under table 1.3.20)
TABLE 1.3.32: AVERAGE TOTAL INCOME IN 1995 AMONG THOSE 15 YEARS ANDOVER, RESIDING IN EEYOU ISTCHEE, BY ABORIGINAL STATUS AND SEX (1996CENSUS, STATISTICS CANADA)
Men WomenAboriginal $ 19,542 $ 14,131Non-Aboriginal $ 45,071 $ 36,012All residents $ 21,578 $ 15,536
Note: Includes all sources of income (e.g. employment, social assistance, pensions andother government transfers). Employment income figures— the main component oftotal income— are based on gross incomes (see note under table 1.3.20)
$21,578
$22,988
$21,400
$20,231
$19,458
$21,962
$18,332
$19,296
$23,454
$21,624
$15,536
$15,663
$15,786
$17,792
$13,132
$14,843
$15,698
$13,277
$16,402
$17,551
$- $5,000 $10,000 $15,000 $20,000 $25,000
Eeyou Istchee
Nemaska
Mistissini
Ouje-Bougoumou
W aswanipi
W askaganish
Eastmain
W emindji
Chisasibi
W hapmagoostui
Men W omen
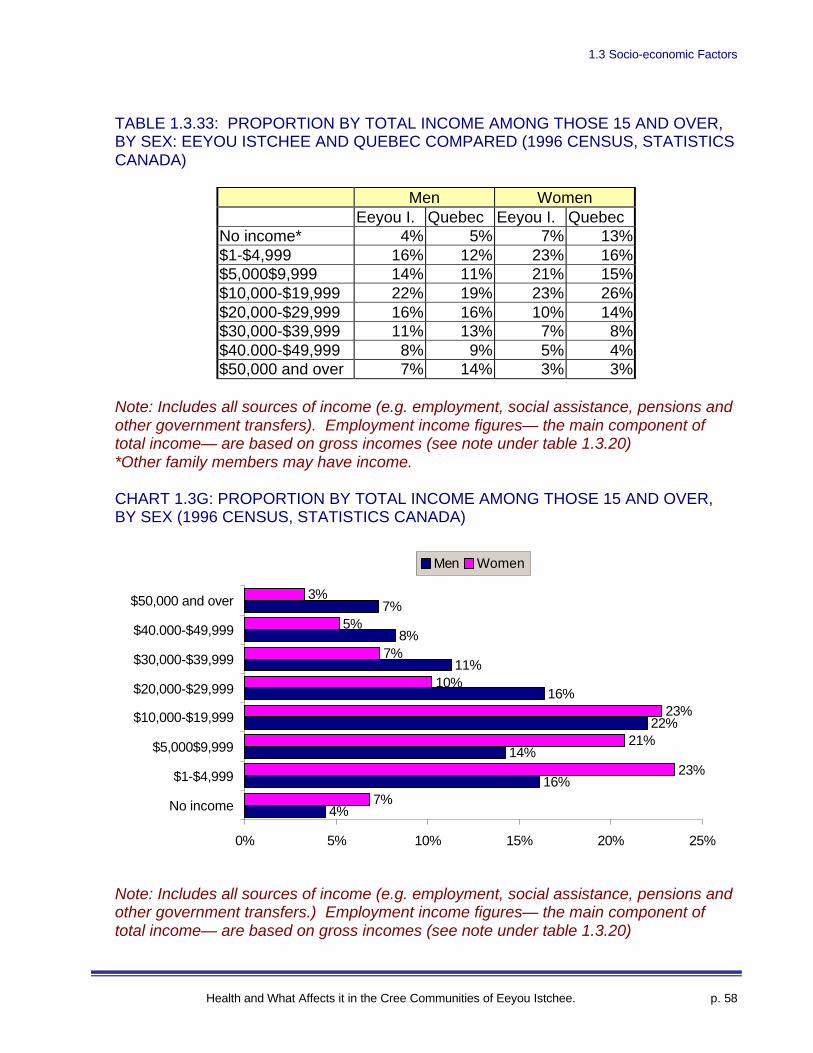
1.3 Socio-economic Factors
Health and What Affects it in the Cree Communities of Eeyou Istchee. p. 58
TABLE 1.3.33: PROPORTION BY TOTAL INCOME AMONG THOSE 15 AND OVER,BY SEX: EEYOU ISTCHEE AND QUEBEC COMPARED (1996 CENSUS, STATISTICSCANADA)
Men WomenEeyou I. Quebec Eeyou I. Quebec
No income* 4% 5% 7% 13%$1-$4,999 16% 12% 23% 16%$5,000$9,999 14% 11% 21% 15%$10,000-$19,999 22% 19% 23% 26%$20,000-$29,999 16% 16% 10% 14%$30,000-$39,999 11% 13% 7% 8%$40.000-$49,999 8% 9% 5% 4%$50,000 and over 7% 14% 3% 3%
Note: Includes all sources of income (e.g. employment, social assistance, pensions andother government transfers). Employment income figures— the main component oftotal income— are based on gross incomes (see note under table 1.3.20)*Other family members may have income.
CHART 1.3G: PROPORTION BY TOTAL INCOME AMONG THOSE 15 AND OVER,BY SEX (1996 CENSUS, STATISTICS CANADA)
Note: Includes all sources of income (e.g. employment, social assistance, pensions andother government transfers.) Employment income figures— the main component oftotal income— are based on gross incomes (see note under table 1.3.20)
4%
16%
14%
22%
16%
11%
8%
7%
7%
23%
21%
23%
10%
7%
5%
3%
0% 5% 10% 15% 20% 25%
No income
$1-$4,999
$5,000$9,999
$10,000-$19,999
$20,000-$29,999
$30,000-$39,999
$40.000-$49,999
$50,000 and over
Men Women
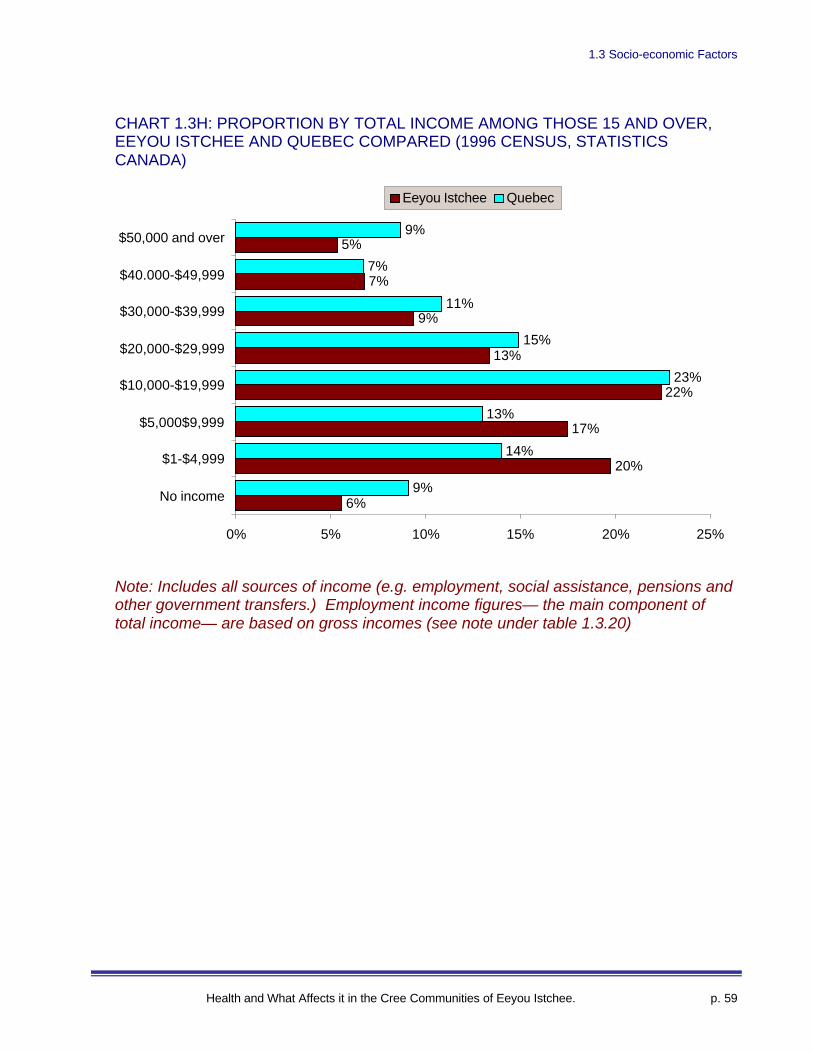
1.3 Socio-economic Factors
Health and What Affects it in the Cree Communities of Eeyou Istchee. p. 59
CHART 1.3H: PROPORTION BY TOTAL INCOME AMONG THOSE 15 AND OVER,EEYOU ISTCHEE AND QUEBEC COMPARED (1996 CENSUS, STATISTICSCANADA)
Note: Includes all sources of income (e.g. employment, social assistance, pensions andother government transfers.) Employment income figures— the main component oftotal income— are based on gross incomes (see note under table 1.3.20)
6%
20%
17%
22%
13%
9%
7%
5%
9%
14%
13%
23%
15%
11%
7%
9%
0% 5% 10% 15% 20% 25%
No income
$1-$4,999
$5,000$9,999
$10,000-$19,999
$20,000-$29,999
$30,000-$39,999
$40.000-$49,999
$50,000 and over
Eeyou Istchee Quebec
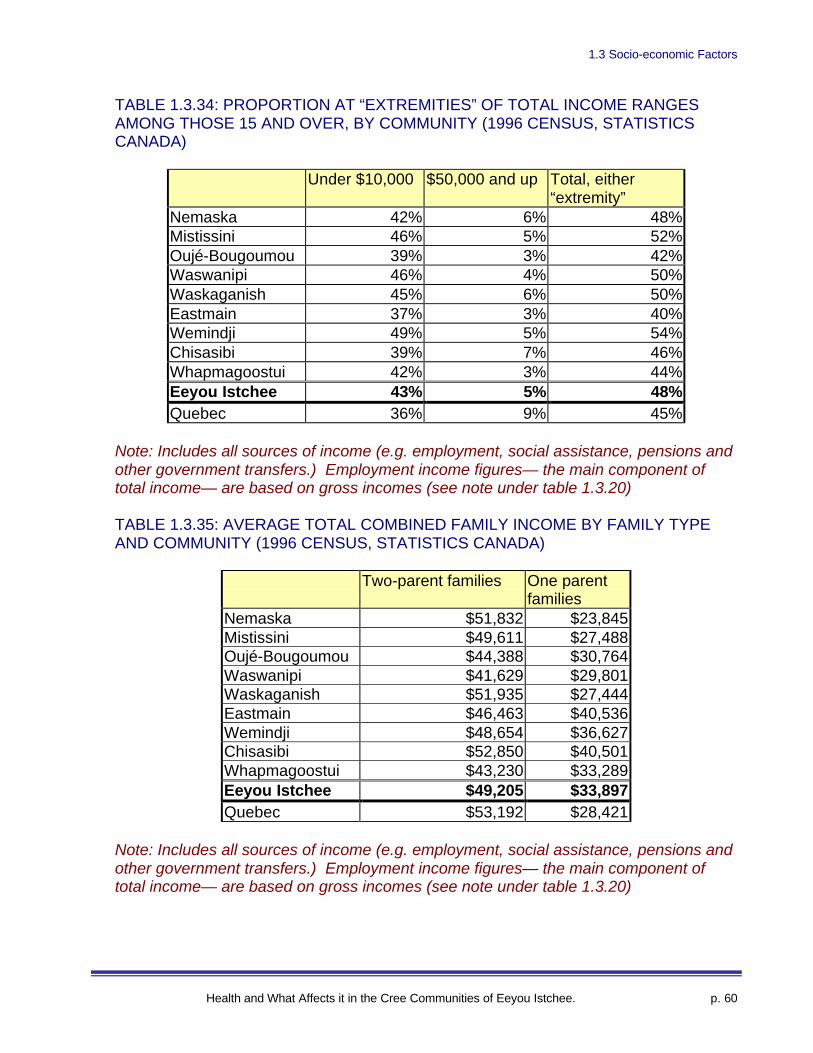
1.3 Socio-economic Factors
Health and What Affects it in the Cree Communities of Eeyou Istchee. p. 60
TABLE 1.3.34: PROPORTION AT “EXTREMITIES” OF TOTAL INCOME RANGESAMONG THOSE 15 AND OVER, BY COMMUNITY (1996 CENSUS, STATISTICSCANADA)
Under $10,000 $50,000 and up Total, either“extremity”
Nemaska 42% 6% 48%Mistissini 46% 5% 52%Oujé-Bougoumou 39% 3% 42%Waswanipi 46% 4% 50%Waskaganish 45% 6% 50%Eastmain 37% 3% 40%Wemindji 49% 5% 54%Chisasibi 39% 7% 46%Whapmagoostui 42% 3% 44%Eeyou Istchee 43% 5% 48%Quebec 36% 9% 45%
Note: Includes all sources of income (e.g. employment, social assistance, pensions andother government transfers.) Employment income figures— the main component oftotal income— are based on gross incomes (see note under table 1.3.20)
TABLE 1.3.35: AVERAGE TOTAL COMBINED FAMILY INCOME BY FAMILY TYPEAND COMMUNITY (1996 CENSUS, STATISTICS CANADA)
Two-parent families One parentfamilies
Nemaska $51,832 $23,845Mistissini $49,611 $27,488Oujé-Bougoumou $44,388 $30,764Waswanipi $41,629 $29,801Waskaganish $51,935 $27,444Eastmain $46,463 $40,536Wemindji $48,654 $36,627Chisasibi $52,850 $40,501Whapmagoostui $43,230 $33,289Eeyou Istchee $49,205 $33,897Quebec $53,192 $28,421
Note: Includes all sources of income (e.g. employment, social assistance, pensions andother government transfers.) Employment income figures— the main component oftotal income— are based on gross incomes (see note under table 1.3.20)
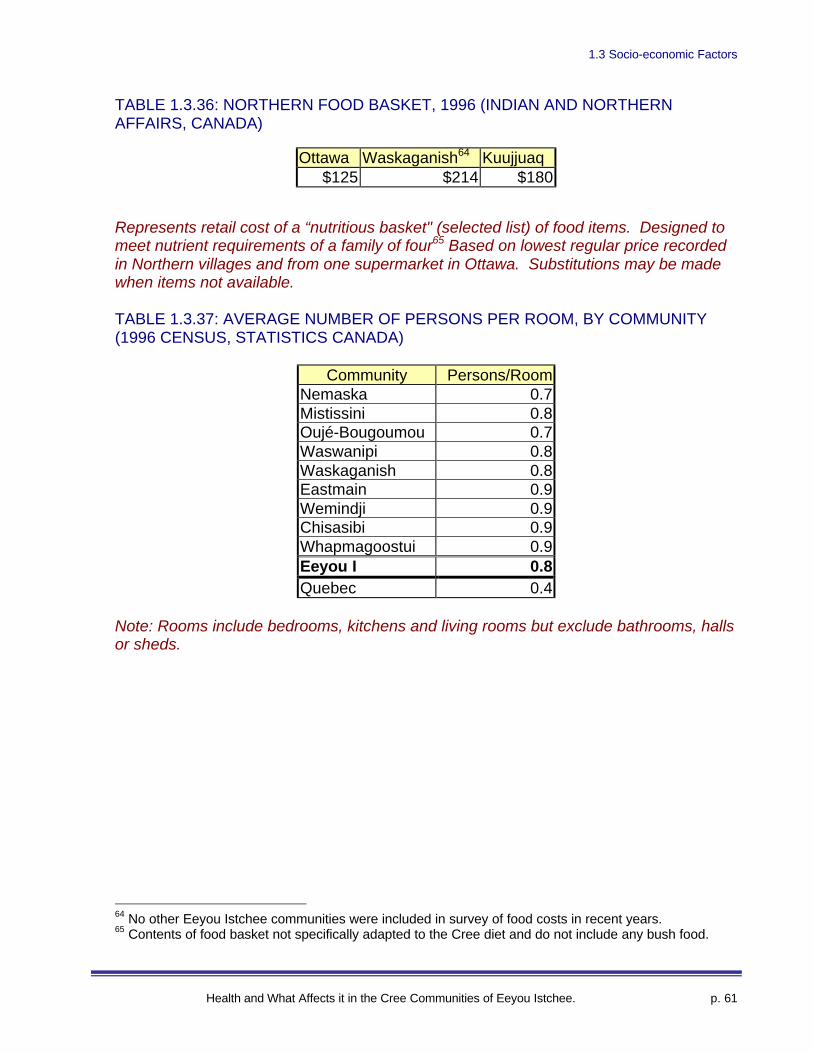
1.3 Socio-economic Factors
Health and What Affects it in the Cree Communities of Eeyou Istchee. p. 61
TABLE 1.3.36: NORTHERN FOOD BASKET, 1996 (INDIAN AND NORTHERNAFFAIRS, CANADA)
Ottawa Waskaganish64 Kuujjuaq$125 $214 $180
Represents retail cost of a “nutritious basket" (selected list) of food items. Designed tomeet nutrient requirements of a family of four65 Based on lowest regular price recordedin Northern villages and from one supermarket in Ottawa. Substitutions may be madewhen items not available.
TABLE 1.3.37: AVERAGE NUMBER OF PERSONS PER ROOM, BY COMMUNITY(1996 CENSUS, STATISTICS CANADA)
Community Persons/RoomNemaska 0.7Mistissini 0.8Oujé-Bougoumou 0.7Waswanipi 0.8Waskaganish 0.8Eastmain 0.9Wemindji 0.9Chisasibi 0.9Whapmagoostui 0.9Eeyou I 0.8Quebec 0.4
Note: Rooms include bedrooms, kitchens and living rooms but exclude bathrooms, hallsor sheds.
64 No other Eeyou Istchee communities were included in survey of food costs in recent years.65 Contents of food basket not specifically adapted to the Cree diet and do not include any bush food.
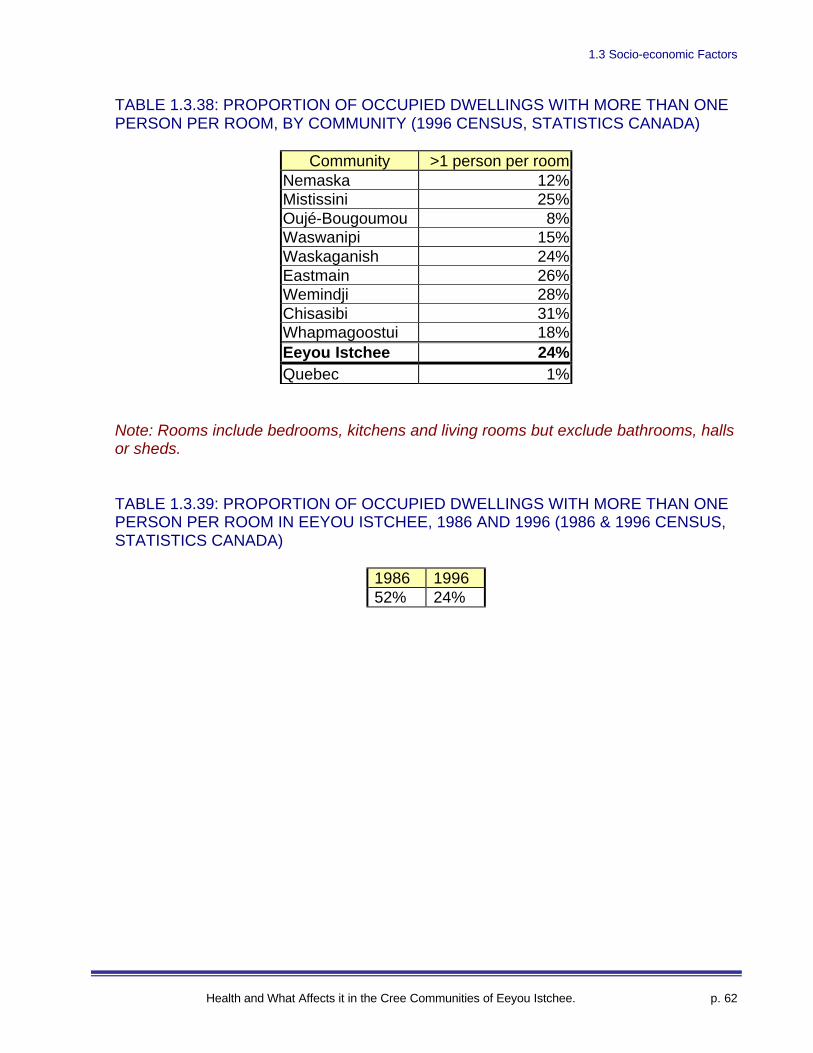
1.3 Socio-economic Factors
Health and What Affects it in the Cree Communities of Eeyou Istchee. p. 62
TABLE 1.3.38: PROPORTION OF OCCUPIED DWELLINGS WITH MORE THAN ONEPERSON PER ROOM, BY COMMUNITY (1996 CENSUS, STATISTICS CANADA)
Community >1 person per roomNemaska 12%Mistissini 25%Oujé-Bougoumou 8%Waswanipi 15%Waskaganish 24%Eastmain 26%Wemindji 28%Chisasibi 31%Whapmagoostui 18%Eeyou Istchee 24%Quebec 1%
Note: Rooms include bedrooms, kitchens and living rooms but exclude bathrooms, hallsor sheds.
TABLE 1.3.39: PROPORTION OF OCCUPIED DWELLINGS WITH MORE THAN ONEPERSON PER ROOM IN EEYOU ISTCHEE, 1986 AND 1996 (1986 & 1996 CENSUS,STATISTICS CANADA)
1986 199652% 24%
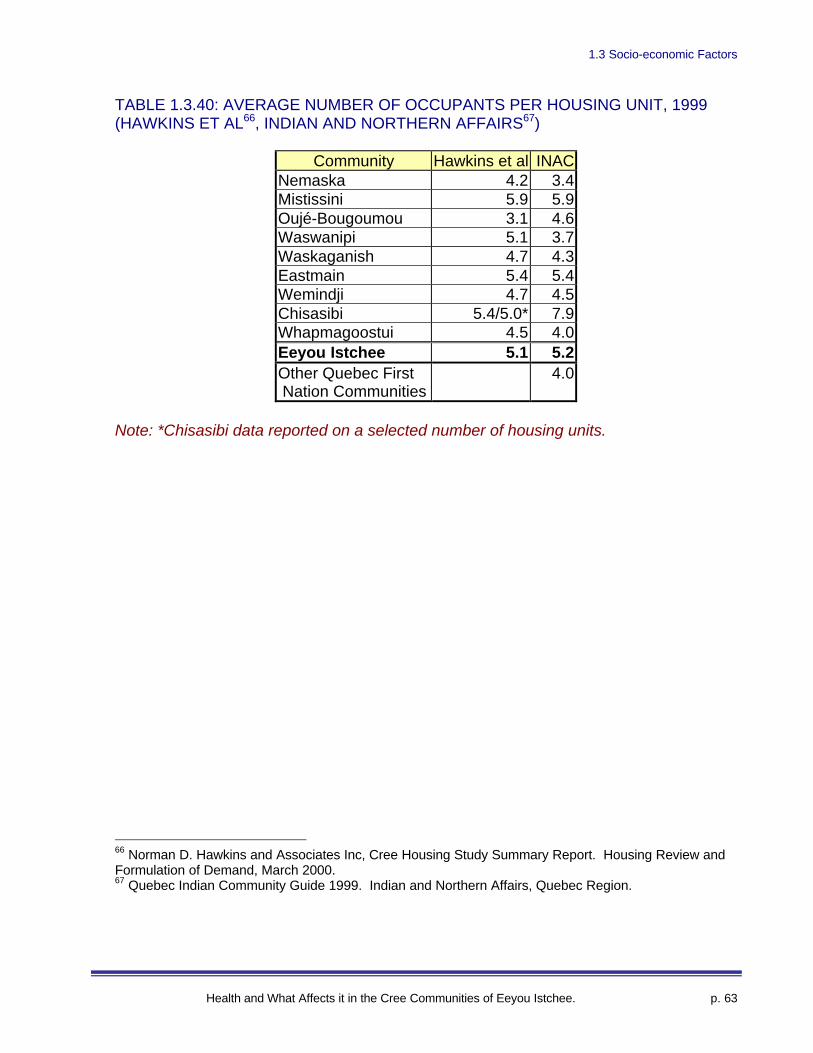
1.3 Socio-economic Factors
Health and What Affects it in the Cree Communities of Eeyou Istchee. p. 63
TABLE 1.3.40: AVERAGE NUMBER OF OCCUPANTS PER HOUSING UNIT, 1999(HAWKINS ET AL66, INDIAN AND NORTHERN AFFAIRS67)
Community Hawkins et al INACNemaska 4.2 3.4Mistissini 5.9 5.9Oujé-Bougoumou 3.1 4.6Waswanipi 5.1 3.7Waskaganish 4.7 4.3Eastmain 5.4 5.4Wemindji 4.7 4.5Chisasibi 5.4/5.0* 7.9Whapmagoostui 4.5 4.0Eeyou Istchee 5.1 5.2Other Quebec First Nation Communities
4.0
Note: *Chisasibi data reported on a selected number of housing units.
66 Norman D. Hawkins and Associates Inc, Cree Housing Study Summary Report. Housing Review andFormulation of Demand, March 2000.67 Quebec Indian Community Guide 1999. Indian and Northern Affairs, Quebec Region.
2. Specific Determinants of Health
Health and What Affects it in the Cree Communities of Eeyou Istchee. p. 64
2. Specific determinants of health: behaviour, lifestyle, riskand protective factors
Key Points
Ø The last health survey in Eeyou Istchee was in 1991. As a result, some of thedata in this section may be outdated.
Ø Smoking rates68 were higher than those for Quebec as a whole for both men(46% vs. 32%) and women (37% vs. 29%), although the number of cigarettessmoked was lower (37% of Cree smokers smoked 11 or more cigarettes per daycompared to 76% among other Quebecois.)
Ø Smoking rates were much higher among 15-24 year olds. 61% of them wereregular smokers and 16% were occasional smokers for a total of 77% thatsmoked at least occasionally. This compares with 50% among those 25-44, 24%among those 45-64 and 23% among those 65 and up.
Ø The percent that drank alcohol was lower than that for southern Quebec (49% vs.79%) and the percentage that had quit drinking was much higher among Cree(28% vs. 6%)
Ø Drinkers were more common in the inland communities (54% vs. 45%) and“heavy” drinking (5 or more drinks at a time) was considerably higher in theinland communities (83% vs. 55% of those who drink).
Ø There is data that suggests that compared to other Quebecois, Cree drinkerstend to drink more heavily when they drink.69
Ø 51% of men (15+) and 65% of women reported that they never consumed drugs(e.g. marijuana, hashish, solvents, cocaine etc.) The figures increase to 77%and 89% respectively when asking only about the year preceding the survey.
Ø The most commonly reported drug used was marijuana or hashish.Ø Males and 15-24 year olds appear to be the most physically active segments in
the population.Ø Women in Eeyou Istchee are less likely to have received a PAP test or
performed a breast self-exam compared to women in other parts of Quebec.Ø The proportion of births to women under 18 is higher in Eeyou Istchee (8.1%)
than Quebec as a whole (1.3%)Ø Low birth weight (<2500 g) is less common in Eeyou Istchee (2% vs. 6% for
Quebec) as are premature births (4.0% vs. 7.3% for Quebec)
68 “Regular smokers”69 The “number of drinks” questions asked on the Quebec survey and the Cree survey were not identical.
2. Specific Determinants of Health
Health and What Affects it in the Cree Communities of Eeyou Istchee. p. 65
Data Sources and Quality
• Useful information on certain behaviour-related issues (e.g. smoking, drinking,physical activity) can only be attained from survey data. Unfortunately the mostrecent source of survey-based health data (Santé Québec) for Eeyou Istcheedates back to 1991.
• Self-reported (survey derived) information on stigmatized, sensitive or verypersonal issues such as drinking is generally assumed to underestimate theextent of the phenomena measured.
• Three indices to measure “at-risk” drinking are presented, CAGE, ADI andModified ADI:
o CAGE: individuals answering yes to two of four questions70 are considered“at-risk” for alcohol-related problems.
o ADI: identifies a drinking problem for individuals who answered "yes" to atleast one CAGE question and admitted to having been confronted with atleast one of the problems in table 2.7.
• Modified ADI excludes two problematic CAGE questions (see below)
• Santé Québec noted that the CAGE and ADI scales “lose some of theirdiscriminating power” when applied to Cree. 80% of drinkers said yes to “Haveyou ever felt that you should cut down on your drinking?” and 72% respondedaffirmatively to “Have you ever felt bad or guilty about your drinking?”71 Thereport suggests that these high rates may be related to disapproval of drinkingand prohibition of alcohol consumption in most communities. The CAGE andADI indices may not be the best measures of “at-risk” drinking in Eeyou Istchee.
• A modified ADI was derived and proposed as an alternative. It specificallyexcludes the questions about wanting to cut down and about feeling bad orguilty. The modified index has not been validated.
70 CAGE questions: 1) Have you ever been criticized by people around you because of your drinking? 2)Have you ever felt that you should cut down on your drinking? 3) Have you ever tried to cut down on yourdrinking? 4) Have you ever felt bad or guilty about your drinking?71 34% of all Cree 15 and over were CAGE positive, with figures of 64% among occasional drinkers and76% among habitual drinkers
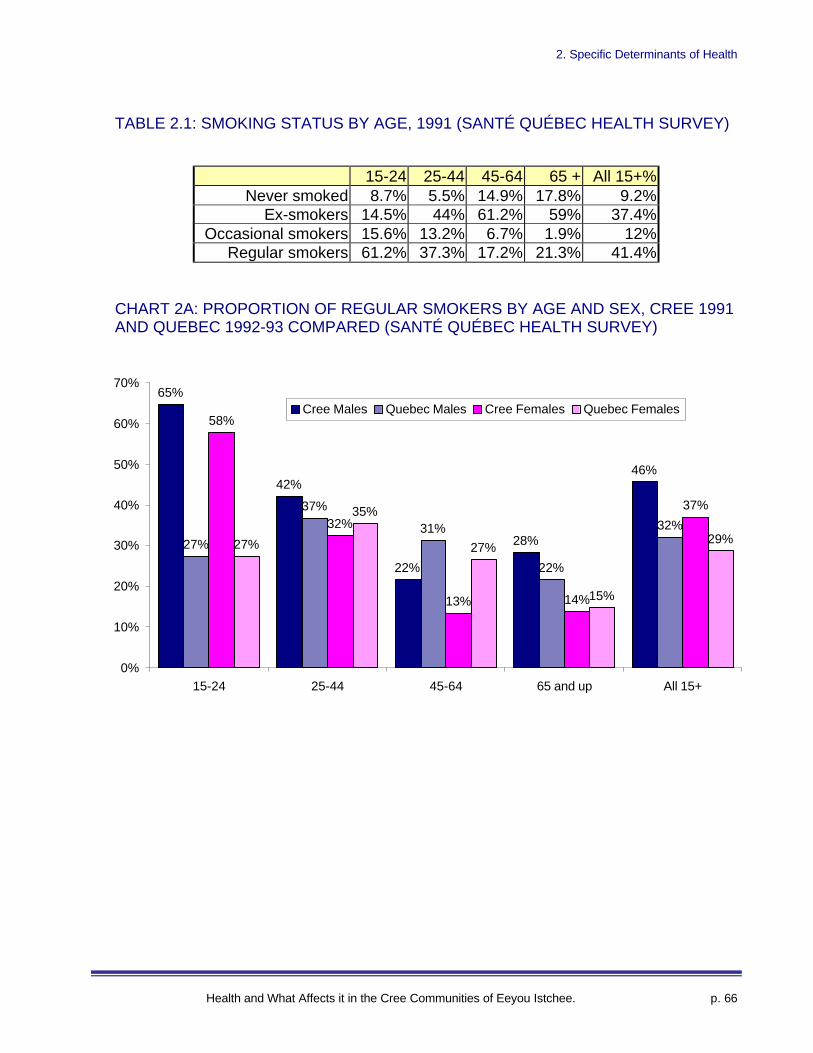
2. Specific Determinants of Health
Health and What Affects it in the Cree Communities of Eeyou Istchee. p. 66
TABLE 2.1: SMOKING STATUS BY AGE, 1991 (SANTÉ QUÉBEC HEALTH SURVEY)
15-24 25-44 45-64 65 + All 15+%Never smoked 8.7% 5.5% 14.9% 17.8% 9.2%
Ex-smokers 14.5% 44% 61.2% 59% 37.4%Occasional smokers 15.6% 13.2% 6.7% 1.9% 12%
Regular smokers 61.2% 37.3% 17.2% 21.3% 41.4%
CHART 2A: PROPORTION OF REGULAR SMOKERS BY AGE AND SEX, CREE 1991AND QUEBEC 1992-93 COMPARED (SANTÉ QUÉBEC HEALTH SURVEY)
65%
42%
22%
28%
46%
27%
37%
31%
22%
32%
58%
32%
13% 14%
37%
27%
35%
27%
15%
29%
0%
10%
20%
30%
40%
50%
60%
70%
15-24 25-44 45-64 65 and up All 15+
Cree Males Quebec Males Cree Females Quebec Females
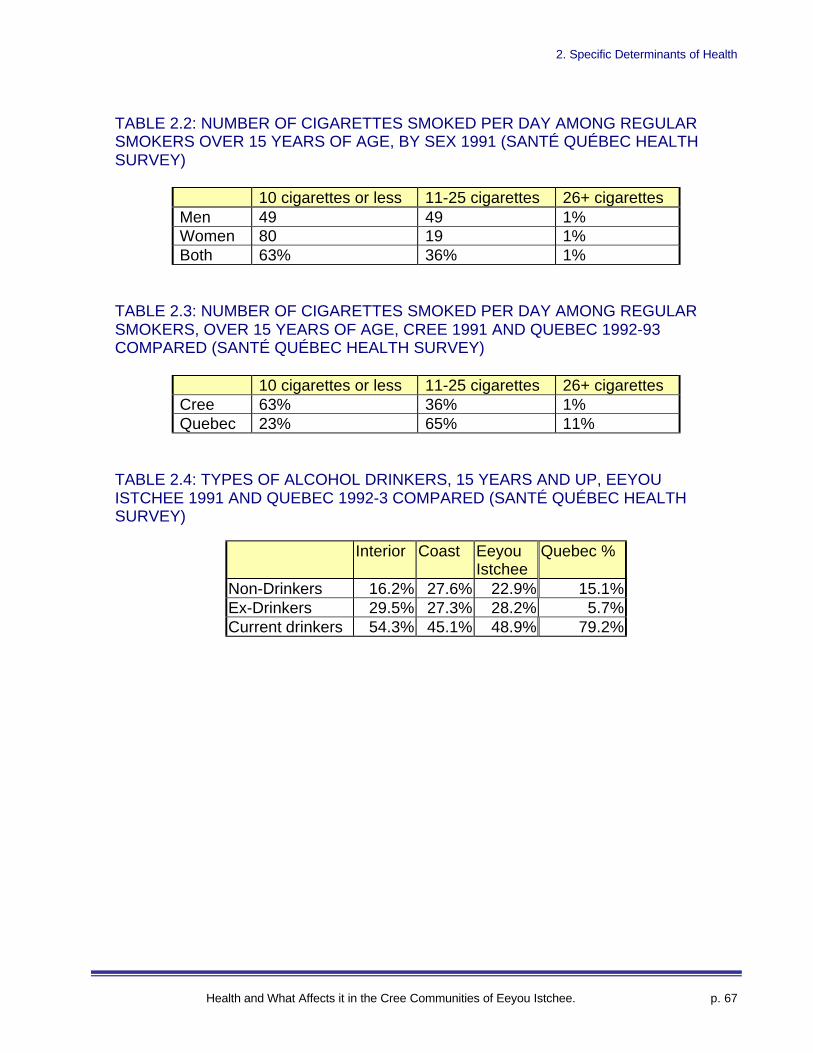
2. Specific Determinants of Health
Health and What Affects it in the Cree Communities of Eeyou Istchee. p. 67
TABLE 2.2: NUMBER OF CIGARETTES SMOKED PER DAY AMONG REGULARSMOKERS OVER 15 YEARS OF AGE, BY SEX 1991 (SANTÉ QUÉBEC HEALTHSURVEY)
10 cigarettes or less 11-25 cigarettes 26+ cigarettesMen 49 49 1%Women 80 19 1%Both 63% 36% 1%
TABLE 2.3: NUMBER OF CIGARETTES SMOKED PER DAY AMONG REGULARSMOKERS, OVER 15 YEARS OF AGE, CREE 1991 AND QUEBEC 1992-93COMPARED (SANTÉ QUÉBEC HEALTH SURVEY)
10 cigarettes or less 11-25 cigarettes 26+ cigarettesCree 63% 36% 1%Quebec 23% 65% 11%
TABLE 2.4: TYPES OF ALCOHOL DRINKERS, 15 YEARS AND UP, EEYOUISTCHEE 1991 AND QUEBEC 1992-3 COMPARED (SANTÉ QUÉBEC HEALTHSURVEY)
Interior Coast EeyouIstchee
Quebec %
Non-Drinkers 16.2% 27.6% 22.9% 15.1%Ex-Drinkers 29.5% 27.3% 28.2% 5.7%Current drinkers 54.3% 45.1% 48.9% 79.2%
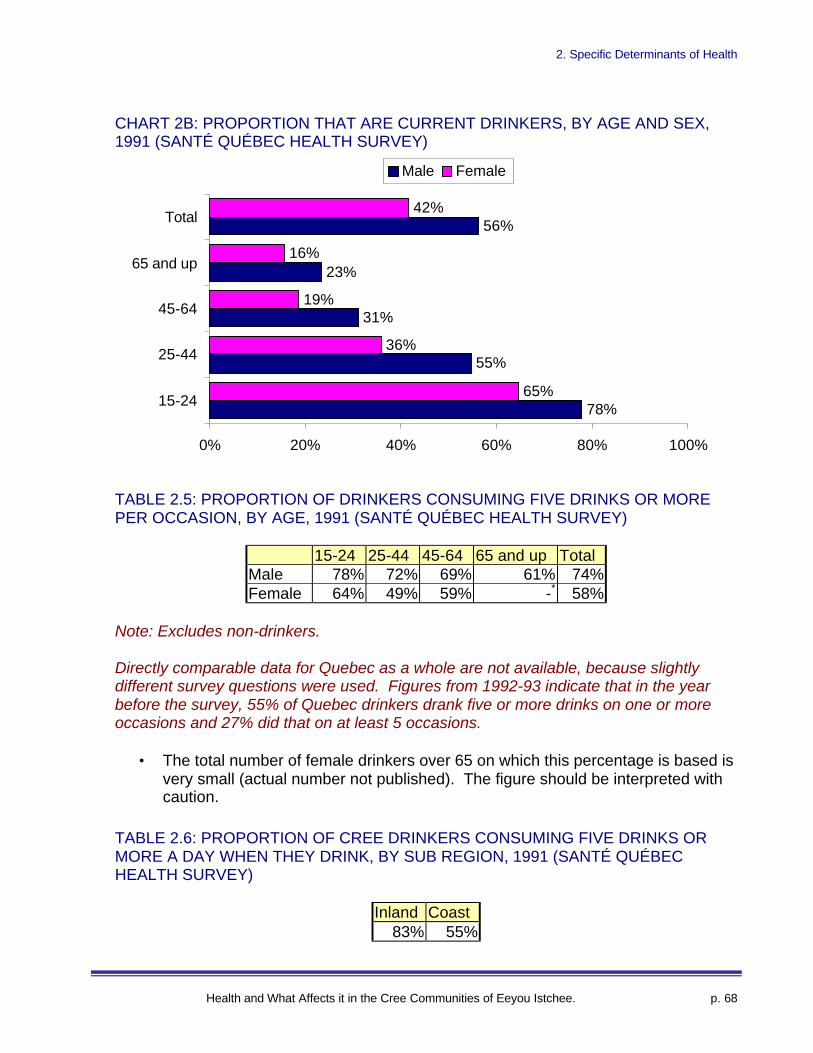
2. Specific Determinants of Health
Health and What Affects it in the Cree Communities of Eeyou Istchee. p. 68
CHART 2B: PROPORTION THAT ARE CURRENT DRINKERS, BY AGE AND SEX,1991 (SANTÉ QUÉBEC HEALTH SURVEY)
TABLE 2.5: PROPORTION OF DRINKERS CONSUMING FIVE DRINKS OR MOREPER OCCASION, BY AGE, 1991 (SANTÉ QUÉBEC HEALTH SURVEY)
15-24 25-44 45-64 65 and up TotalMale 78% 72% 69% 61% 74%Female 64% 49% 59% -* 58%
Note: Excludes non-drinkers.
Directly comparable data for Quebec as a whole are not available, because slightlydifferent survey questions were used. Figures from 1992-93 indicate that in the yearbefore the survey, 55% of Quebec drinkers drank five or more drinks on one or moreoccasions and 27% did that on at least 5 occasions.
• The total number of female drinkers over 65 on which this percentage is based isvery small (actual number not published). The figure should be interpreted withcaution.
TABLE 2.6: PROPORTION OF CREE DRINKERS CONSUMING FIVE DRINKS ORMORE A DAY WHEN THEY DRINK, BY SUB REGION, 1991 (SANTÉ QUÉBECHEALTH SURVEY)
Inland Coast83% 55%
78%
55%
31%
23%
56%
65%
36%
19%
16%
42%
0% 20% 40% 60% 80% 100%
15-24
25-44
45-64
65 and up
Total
Male Female

2. Specific Determinants of Health
Health and What Affects it in the Cree Communities of Eeyou Istchee. p. 69
TABLE 2.7: PROBLEMS RELATED TO ALCOHOL CONSUMPTION IN THE 12MONTHS PRECEDING THE SURVEY BY SEX, 15 YEARS AND OVER, 1991 (SANTÉQUÉBEC HEALTH SURVEY)
Males Females TotalHurt yourself of someone else in a fight because of alcohol 17% 7% 12%
Had trouble at work or at school because of drinking 13% 7% 10%
Been warned because of drunken driving72 13% 5% 9%
Had problems with health because of drinking 12% 5% 8%
Was sent home because of being drunk in a public place 10% 3% 7%
Had an accident, injury or hurt someone accidentally when drunk 8% 3% 6%
Had alcohol-related hospitalization or had to go for treatment foran alcohol problem
6% 2% 4%
Lost a job (or got kicked out of school) because of drinking 3% 2% 3%
Answered "yes" to at least one of these questions 34% 15% 24%
TABLE 2.8: PROPORTION OF "AT-RISK" DRINKERS ACCORDING TO THE CAGE,ADI AND MODIFIED ADI INDICES, BY AGE AND SEX, 1991 (SANTÉ QUÉBECHEALTH SURVEY)
CAGE ADI Modified ADIMales Females Males Females Males Females
15-19 39% 46% 44% 39% 16% 18%20-24 65% 49% 65% 33% 36% 17%25-44 42% 22.2 37% 12% 25% 8%45-64 22% 14% 13% 9% 8% 4%65 and over 12% 0%* 8% 3% 4% 0%*All ages 40% 28% 37% 20% 21% 10%
* The total number of drinkers over 65 on which these percentages are based is verysmall (actual number not published). The figure should be interpreted with caution.
72 Figures for “been warned for drunken driving” should be interpreted with caution, since it is suspectedthat some respondents may have misunderstood the statement.
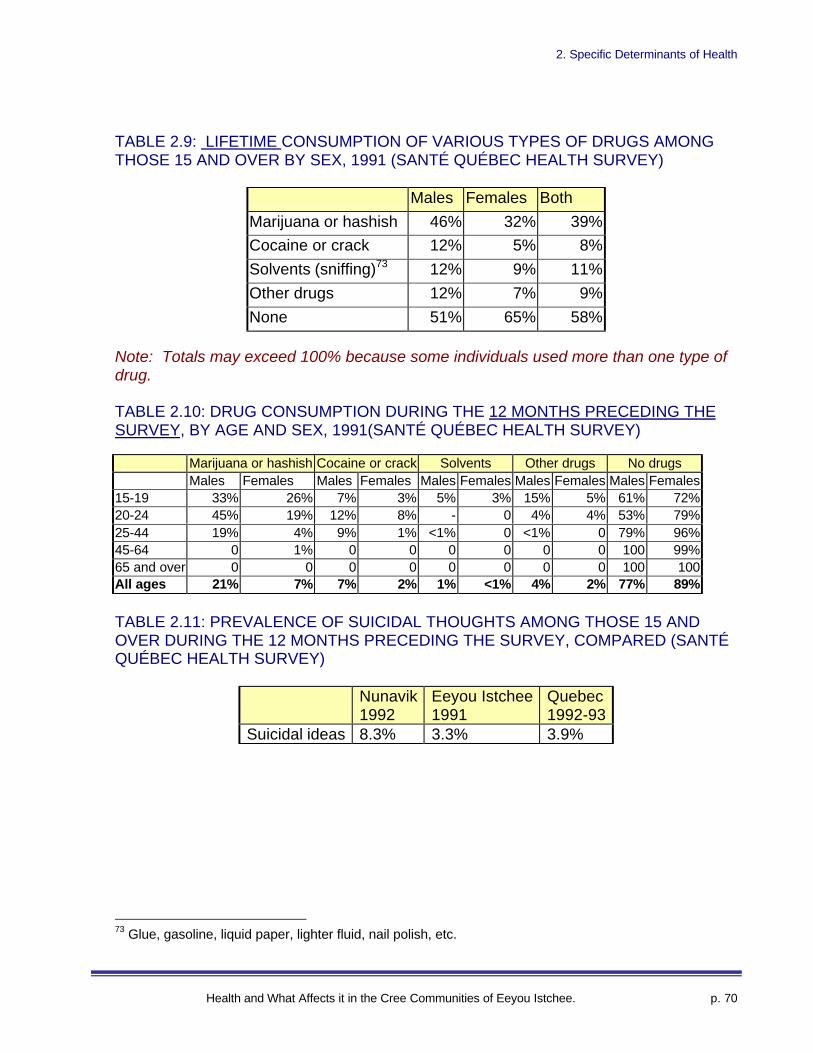
2. Specific Determinants of Health
Health and What Affects it in the Cree Communities of Eeyou Istchee. p. 70
TABLE 2.9: LIFETIME CONSUMPTION OF VARIOUS TYPES OF DRUGS AMONGTHOSE 15 AND OVER BY SEX, 1991 (SANTÉ QUÉBEC HEALTH SURVEY)
Males Females Both
Marijuana or hashish 46% 32% 39%
Cocaine or crack 12% 5% 8%
Solvents (sniffing)73 12% 9% 11%
Other drugs 12% 7% 9%
None 51% 65% 58%
Note: Totals may exceed 100% because some individuals used more than one type ofdrug.
TABLE 2.10: DRUG CONSUMPTION DURING THE 12 MONTHS PRECEDING THESURVEY, BY AGE AND SEX, 1991(SANTÉ QUÉBEC HEALTH SURVEY)
Marijuana or hashish Cocaine or crack Solvents Other drugs No drugsMales Females Males Females Males Females Males Females Males Females
15-19 33% 26% 7% 3% 5% 3% 15% 5% 61% 72%20-24 45% 19% 12% 8% - 0 4% 4% 53% 79%25-44 19% 4% 9% 1% <1% 0 <1% 0 79% 96%45-64 0 1% 0 0 0 0 0 0 100 99%65 and over 0 0 0 0 0 0 0 0 100 100All ages 21% 7% 7% 2% 1% <1% 4% 2% 77% 89%
TABLE 2.11: PREVALENCE OF SUICIDAL THOUGHTS AMONG THOSE 15 ANDOVER DURING THE 12 MONTHS PRECEDING THE SURVEY, COMPARED (SANTÉQUÉBEC HEALTH SURVEY)
Nunavik1992
Eeyou Istchee1991
Quebec1992-93
Suicidal ideas 8.3% 3.3% 3.9%
73 Glue, gasoline, liquid paper, lighter fluid, nail polish, etc.
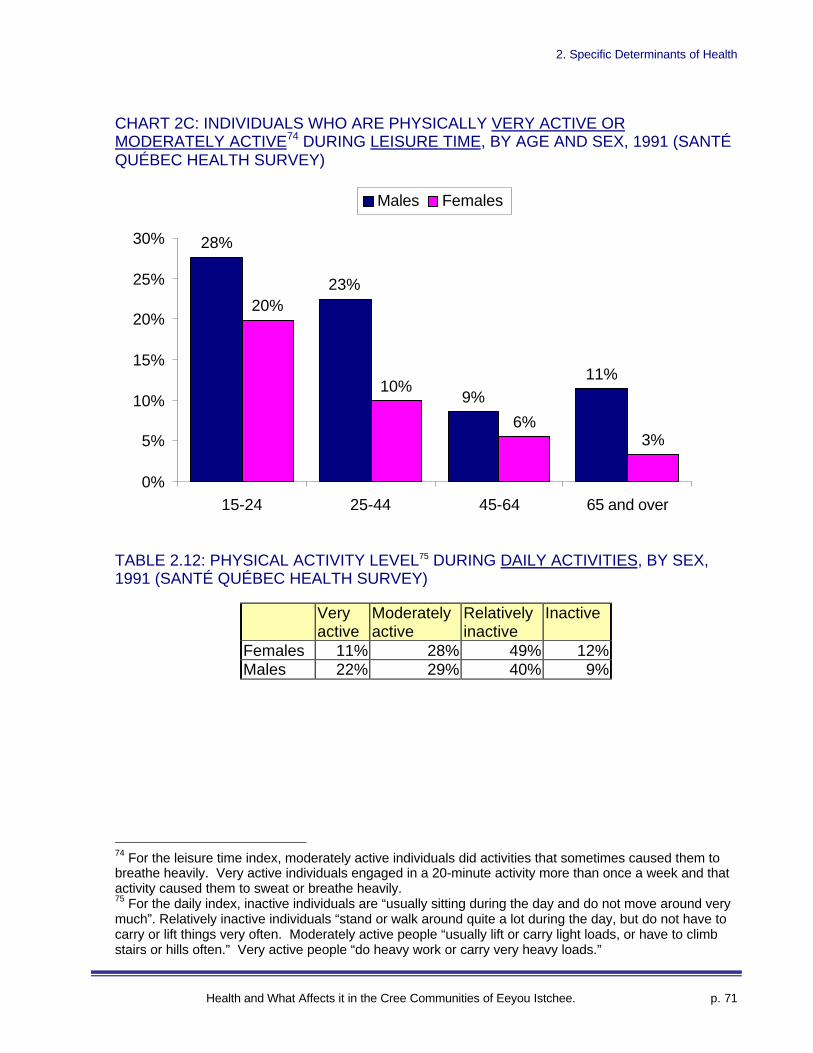
2. Specific Determinants of Health
Health and What Affects it in the Cree Communities of Eeyou Istchee. p. 71
CHART 2C: INDIVIDUALS WHO ARE PHYSICALLY VERY ACTIVE ORMODERATELY ACTIVE74 DURING LEISURE TIME, BY AGE AND SEX, 1991 (SANTÉQUÉBEC HEALTH SURVEY)
TABLE 2.12: PHYSICAL ACTIVITY LEVEL75 DURING DAILY ACTIVITIES, BY SEX,1991 (SANTÉ QUÉBEC HEALTH SURVEY)
Veryactive
Moderatelyactive
Relativelyinactive
Inactive
Females 11% 28% 49% 12%Males 22% 29% 40% 9%
74 For the leisure time index, moderately active individuals did activities that sometimes caused them tobreathe heavily. Very active individuals engaged in a 20-minute activity more than once a week and thatactivity caused them to sweat or breathe heavily.75 For the daily index, inactive individuals are “usually sitting during the day and do not move around verymuch”. Relatively inactive individuals “stand or walk around quite a lot during the day, but do not have tocarry or lift things very often. Moderately active people “usually lift or carry light loads, or have to climbstairs or hills often.” Very active people “do heavy work or carry very heavy loads.”
28%
23%
9%11%
20%
10%
6%3%
0%
5%
10%
15%
20%
25%
30%
15-24 25-44 45-64 65 and over
Males Females
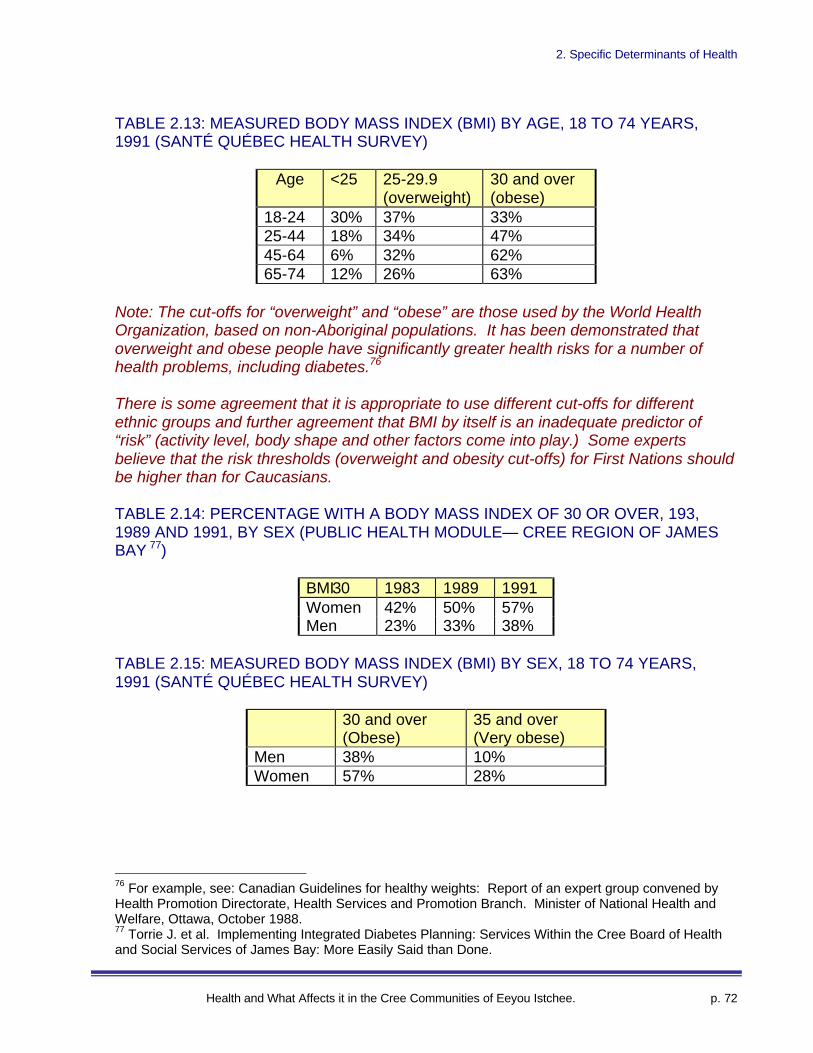
2. Specific Determinants of Health
Health and What Affects it in the Cree Communities of Eeyou Istchee. p. 72
TABLE 2.13: MEASURED BODY MASS INDEX (BMI) BY AGE, 18 TO 74 YEARS,1991 (SANTÉ QUÉBEC HEALTH SURVEY)
Age <25 25-29.9(overweight)
30 and over(obese)
18-24 30% 37% 33%25-44 18% 34% 47%45-64 6% 32% 62%65-74 12% 26% 63%
Note: The cut-offs for “overweight” and “obese” are those used by the World HealthOrganization, based on non-Aboriginal populations. It has been demonstrated thatoverweight and obese people have significantly greater health risks for a number ofhealth problems, including diabetes.76
There is some agreement that it is appropriate to use different cut-offs for differentethnic groups and further agreement that BMI by itself is an inadequate predictor of“risk” (activity level, body shape and other factors come into play.) Some expertsbelieve that the risk thresholds (overweight and obesity cut-offs) for First Nations shouldbe higher than for Caucasians.
TABLE 2.14: PERCENTAGE WITH A BODY MASS INDEX OF 30 OR OVER, 193,1989 AND 1991, BY SEX (PUBLIC HEALTH MODULE— CREE REGION OF JAMESBAY 77)
BMI�30 1983 1989 1991Women 42% 50% 57%Men 23% 33% 38%
TABLE 2.15: MEASURED BODY MASS INDEX (BMI) BY SEX, 18 TO 74 YEARS,1991 (SANTÉ QUÉBEC HEALTH SURVEY)
30 and over(Obese)
35 and over(Very obese)
Men 38% 10%Women 57% 28%
76 For example, see: Canadian Guidelines for healthy weights: Report of an expert group convened byHealth Promotion Directorate, Health Services and Promotion Branch. Minister of National Health andWelfare, Ottawa, October 1988.77 Torrie J. et al. Implementing Integrated Diabetes Planning: Services Within the Cree Board of Healthand Social Services of James Bay: More Easily Said than Done.
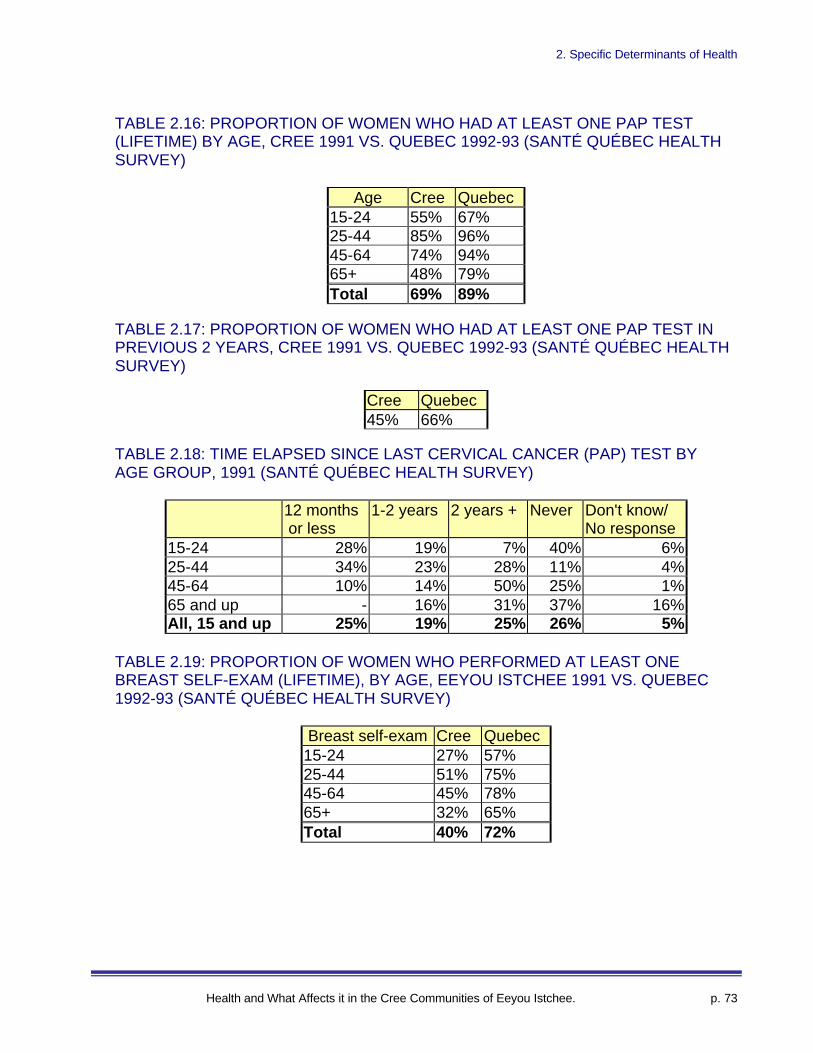
2. Specific Determinants of Health
Health and What Affects it in the Cree Communities of Eeyou Istchee. p. 73
TABLE 2.16: PROPORTION OF WOMEN WHO HAD AT LEAST ONE PAP TEST(LIFETIME) BY AGE, CREE 1991 VS. QUEBEC 1992-93 (SANTÉ QUÉBEC HEALTHSURVEY)
Age Cree Quebec15-24 55% 67%25-44 85% 96%45-64 74% 94%65+ 48% 79%Total 69% 89%
TABLE 2.17: PROPORTION OF WOMEN WHO HAD AT LEAST ONE PAP TEST INPREVIOUS 2 YEARS, CREE 1991 VS. QUEBEC 1992-93 (SANTÉ QUÉBEC HEALTHSURVEY)
Cree Quebec45% 66%
TABLE 2.18: TIME ELAPSED SINCE LAST CERVICAL CANCER (PAP) TEST BYAGE GROUP, 1991 (SANTÉ QUÉBEC HEALTH SURVEY)
12 months or less
1-2 years 2 years + Never Don't know/No response
15-24 28% 19% 7% 40% 6%25-44 34% 23% 28% 11% 4%45-64 10% 14% 50% 25% 1%65 and up - 16% 31% 37% 16%All, 15 and up 25% 19% 25% 26% 5%
TABLE 2.19: PROPORTION OF WOMEN WHO PERFORMED AT LEAST ONEBREAST SELF-EXAM (LIFETIME), BY AGE, EEYOU ISTCHEE 1991 VS. QUEBEC1992-93 (SANTÉ QUÉBEC HEALTH SURVEY)
Breast self-exam Cree Quebec15-24 27% 57%25-44 51% 75%45-64 45% 78%65+ 32% 65%Total 40% 72%

2. Specific Determinants of Health
Health and What Affects it in the Cree Communities of Eeyou Istchee. p. 74
TABLE 2.20: PROPORTION OF WOMEN WHO HAD A BREAST EXAM BY APROFESSIONAL (LIFETIME), BY AGE, EEYOU ISTCHEE 1991 VS. QUEBEC 1992-93 (SANTÉ QUÉBEC HEALTH SURVEY)
Breast exam Cree Quebec15-24 22% 65%25-44 43% 92%45-64 43% 92%65+ 38% 81%Total 35% 86%
TABLE 2.21: PERCENT OF BIRTHS TO MOTHERS UNDER 18 AND UNDER 20YEARS OF AGE, REGIONS COMPARED, 1997 (QUEBEC MINISTRY OF HEALTHAND SOCIAL SERVICES)
Age EeyouIstchee78
Nord-du-Québec79
Nunavik80 Quebec
Under 18 8.1% 1.2% 8.4% 1.3%Under 20 23.5% 6.6% 21.4% 4.7%
Note: Includes all births (singleton and multiples.)
TABLE 2.22: TEENAGE FERTILITY RATE (INSPQ81)
Eeyou Istchee Nunavik Quebec130.5 168.1 16.0
Note: Number of births per 1,000 women (15-19 years) per year.
78 Using regionally managed birth records, the Public Health Module reported similar results with 8.2% ofbirths to women under the age of 18 and 23% to women under 20.79 See footnote #2 for description of Nord-du-Québec region80 See footnote #3 for description of Nunavik region81 Institut National de la Santé Publique de Québec, Portrait de Santé du Québec et de ses Régions,2001 (in progress)
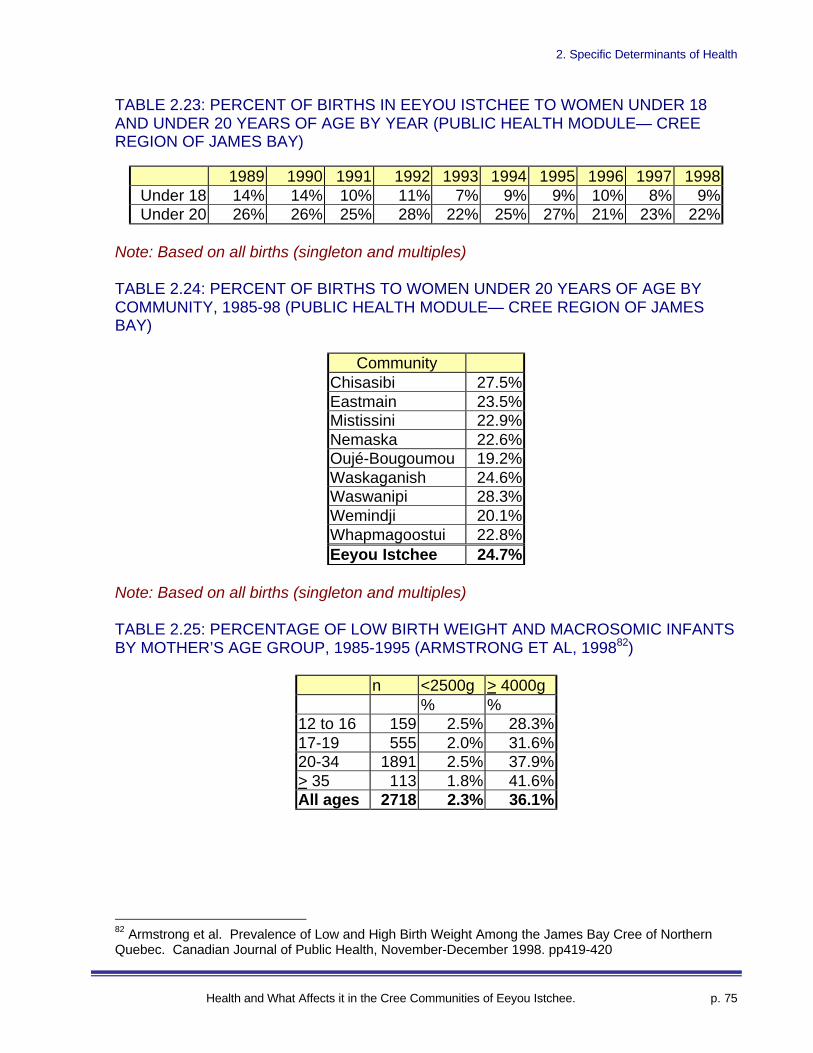
2. Specific Determinants of Health
Health and What Affects it in the Cree Communities of Eeyou Istchee. p. 75
TABLE 2.23: PERCENT OF BIRTHS IN EEYOU ISTCHEE TO WOMEN UNDER 18AND UNDER 20 YEARS OF AGE BY YEAR (PUBLIC HEALTH MODULE— CREEREGION OF JAMES BAY)
1989 1990 1991 1992 1993 1994 1995 1996 1997 1998Under 18 14% 14% 10% 11% 7% 9% 9% 10% 8% 9%Under 20 26% 26% 25% 28% 22% 25% 27% 21% 23% 22%
Note: Based on all births (singleton and multiples)
TABLE 2.24: PERCENT OF BIRTHS TO WOMEN UNDER 20 YEARS OF AGE BYCOMMUNITY, 1985-98 (PUBLIC HEALTH MODULE— CREE REGION OF JAMESBAY)
CommunityChisasibi 27.5%Eastmain 23.5%Mistissini 22.9%Nemaska 22.6%Oujé-Bougoumou 19.2%Waskaganish 24.6%Waswanipi 28.3%Wemindji 20.1%Whapmagoostui 22.8%Eeyou Istchee 24.7%
Note: Based on all births (singleton and multiples)
TABLE 2.25: PERCENTAGE OF LOW BIRTH WEIGHT AND MACROSOMIC INFANTSBY MOTHER’S AGE GROUP, 1985-1995 (ARMSTRONG ET AL, 199882)
n <2500g > 4000g% %
12 to 16 159 2.5% 28.3%17-19 555 2.0% 31.6%20-34 1891 2.5% 37.9%> 35 113 1.8% 41.6%All ages 2718 2.3% 36.1%
82 Armstrong et al. Prevalence of Low and High Birth Weight Among the James Bay Cree of NorthernQuebec. Canadian Journal of Public Health, November-December 1998. pp419-420
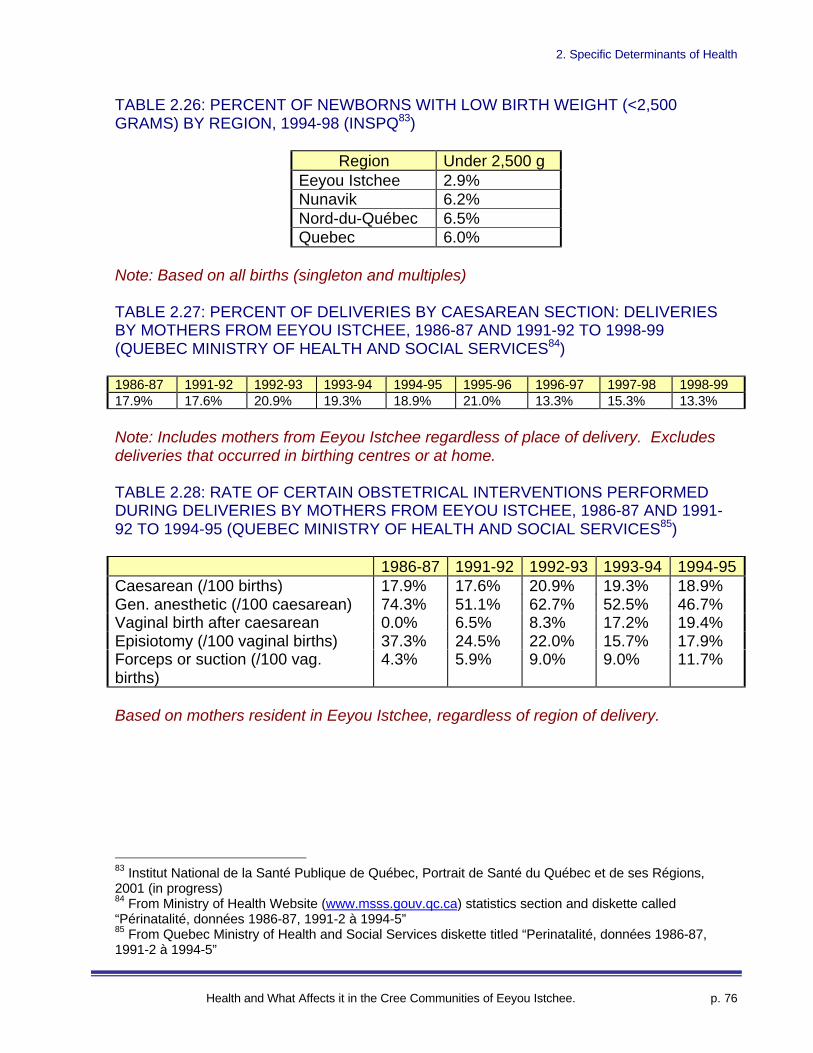
2. Specific Determinants of Health
Health and What Affects it in the Cree Communities of Eeyou Istchee. p. 76
TABLE 2.26: PERCENT OF NEWBORNS WITH LOW BIRTH WEIGHT (<2,500GRAMS) BY REGION, 1994-98 (INSPQ83)
Region Under 2,500 gEeyou Istchee 2.9%Nunavik 6.2%Nord-du-Québec 6.5%Quebec 6.0%
Note: Based on all births (singleton and multiples)
TABLE 2.27: PERCENT OF DELIVERIES BY CAESAREAN SECTION: DELIVERIESBY MOTHERS FROM EEYOU ISTCHEE, 1986-87 AND 1991-92 TO 1998-99(QUEBEC MINISTRY OF HEALTH AND SOCIAL SERVICES84)
1986-87 1991-92 1992-93 1993-94 1994-95 1995-96 1996-97 1997-98 1998-9917.9% 17.6% 20.9% 19.3% 18.9% 21.0% 13.3% 15.3% 13.3%
Note: Includes mothers from Eeyou Istchee regardless of place of delivery. Excludesdeliveries that occurred in birthing centres or at home.
TABLE 2.28: RATE OF CERTAIN OBSTETRICAL INTERVENTIONS PERFORMEDDURING DELIVERIES BY MOTHERS FROM EEYOU ISTCHEE, 1986-87 AND 1991-92 TO 1994-95 (QUEBEC MINISTRY OF HEALTH AND SOCIAL SERVICES85)
1986-87 1991-92 1992-93 1993-94 1994-95Caesarean (/100 births) 17.9% 17.6% 20.9% 19.3% 18.9%Gen. anesthetic (/100 caesarean) 74.3% 51.1% 62.7% 52.5% 46.7%Vaginal birth after caesarean 0.0% 6.5% 8.3% 17.2% 19.4%Episiotomy (/100 vaginal births) 37.3% 24.5% 22.0% 15.7% 17.9%Forceps or suction (/100 vag.births)
4.3% 5.9% 9.0% 9.0% 11.7%
Based on mothers resident in Eeyou Istchee, regardless of region of delivery.
83 Institut National de la Santé Publique de Québec, Portrait de Santé du Québec et de ses Régions,2001 (in progress)84 From Ministry of Health Website (www.msss.gouv.qc.ca) statistics section and diskette called“Périnatalité, données 1986-87, 1991-2 à 1994-5”85 From Quebec Ministry of Health and Social Services diskette titled “Perinatalité, données 1986-87,1991-2 à 1994-5”
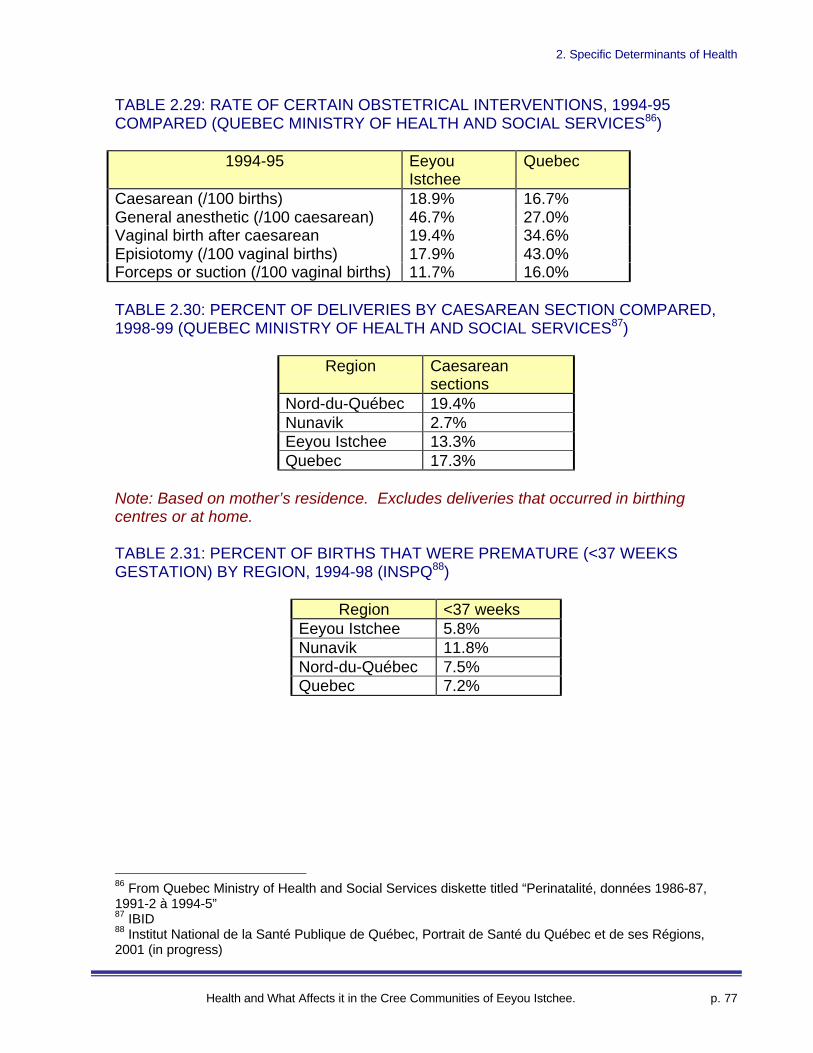
2. Specific Determinants of Health
Health and What Affects it in the Cree Communities of Eeyou Istchee. p. 77
TABLE 2.29: RATE OF CERTAIN OBSTETRICAL INTERVENTIONS, 1994-95COMPARED (QUEBEC MINISTRY OF HEALTH AND SOCIAL SERVICES86)
1994-95 EeyouIstchee
Quebec
Caesarean (/100 births) 18.9% 16.7%General anesthetic (/100 caesarean) 46.7% 27.0%Vaginal birth after caesarean 19.4% 34.6%Episiotomy (/100 vaginal births) 17.9% 43.0%Forceps or suction (/100 vaginal births) 11.7% 16.0%
TABLE 2.30: PERCENT OF DELIVERIES BY CAESAREAN SECTION COMPARED,1998-99 (QUEBEC MINISTRY OF HEALTH AND SOCIAL SERVICES87)
Region Caesareansections
Nord-du-Québec 19.4%Nunavik 2.7%Eeyou Istchee 13.3%Quebec 17.3%
Note: Based on mother’s residence. Excludes deliveries that occurred in birthingcentres or at home.
TABLE 2.31: PERCENT OF BIRTHS THAT WERE PREMATURE (<37 WEEKSGESTATION) BY REGION, 1994-98 (INSPQ88)
Region <37 weeksEeyou Istchee 5.8%Nunavik 11.8%Nord-du-Québec 7.5%Quebec 7.2%
86 From Quebec Ministry of Health and Social Services diskette titled “Perinatalité, données 1986-87,1991-2 à 1994-5”87 IBID88 Institut National de la Santé Publique de Québec, Portrait de Santé du Québec et de ses Régions,2001 (in progress)
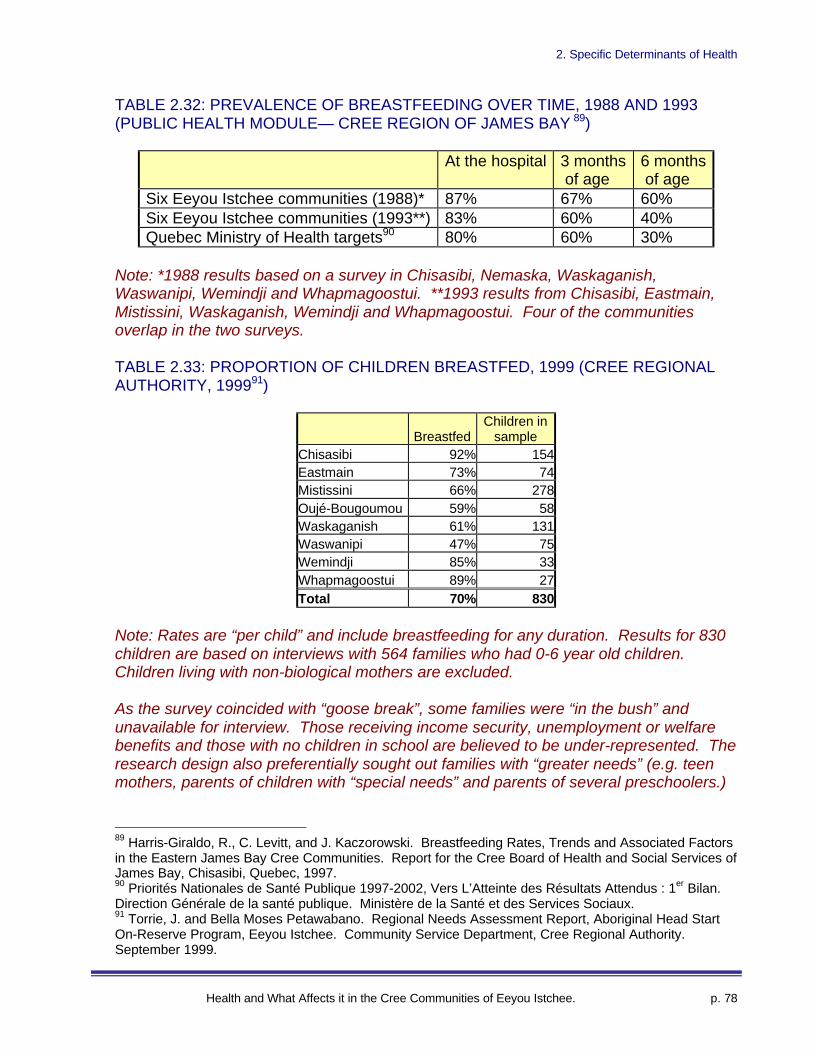
2. Specific Determinants of Health
Health and What Affects it in the Cree Communities of Eeyou Istchee. p. 78
TABLE 2.32: PREVALENCE OF BREASTFEEDING OVER TIME, 1988 AND 1993(PUBLIC HEALTH MODULE— CREE REGION OF JAMES BAY 89)
At the hospital 3 months of age
6 months of age
Six Eeyou Istchee communities (1988)* 87% 67% 60%Six Eeyou Istchee communities (1993**) 83% 60% 40%Quebec Ministry of Health targets90 80% 60% 30%
Note: *1988 results based on a survey in Chisasibi, Nemaska, Waskaganish,Waswanipi, Wemindji and Whapmagoostui. **1993 results from Chisasibi, Eastmain,Mistissini, Waskaganish, Wemindji and Whapmagoostui. Four of the communitiesoverlap in the two surveys.
TABLE 2.33: PROPORTION OF CHILDREN BREASTFED, 1999 (CREE REGIONALAUTHORITY, 199991)
BreastfedChildren in
sampleChisasibi 92% 154Eastmain 73% 74Mistissini 66% 278Oujé-Bougoumou 59% 58Waskaganish 61% 131Waswanipi 47% 75Wemindji 85% 33Whapmagoostui 89% 27Total 70% 830
Note: Rates are “per child” and include breastfeeding for any duration. Results for 830children are based on interviews with 564 families who had 0-6 year old children.Children living with non-biological mothers are excluded.
As the survey coincided with “goose break”, some families were “in the bush” andunavailable for interview. Those receiving income security, unemployment or welfarebenefits and those with no children in school are believed to be under-represented. Theresearch design also preferentially sought out families with “greater needs” (e.g. teenmothers, parents of children with “special needs” and parents of several preschoolers.)
89 Harris-Giraldo, R., C. Levitt, and J. Kaczorowski. Breastfeeding Rates, Trends and Associated Factorsin the Eastern James Bay Cree Communities. Report for the Cree Board of Health and Social Services ofJames Bay, Chisasibi, Quebec, 1997.90 Priorités Nationales de Santé Publique 1997-2002, Vers L’Atteinte des Résultats Attendus : 1er Bilan.Direction Générale de la santé publique. Ministère de la Santé et des Services Sociaux.91 Torrie, J. and Bella Moses Petawabano. Regional Needs Assessment Report, Aboriginal Head StartOn-Reserve Program, Eeyou Istchee. Community Service Department, Cree Regional Authority.September 1999.
2. Specific Determinants of Health
Health and What Affects it in the Cree Communities of Eeyou Istchee. p. 79
The effect of these biases are minimized by the size of the sample (in excess of 50% oftarget families.)
3. Health Services- Resources and Utilization
Health and What Affects it in the Cree Communities of Eeyou Istchee. p. 80
3. Health Services- Resources and Utilization
This section focuses on the funding, staffing, organization and utilization of services.Information is presented on health care expenditures in Eeyou Istchee, the number andtype of beds available, the number of doctors and nurses as well as a variety ofhospitalization-derived indicators.
Along with population-based determinants (sections 1 and 2), the extent, type, use andaccessibility of health services are viewed as predictors of the health of a population. Inthe case of remote locations, accessibility takes on a special connotation and presentsspecial challenges for timely and equitable delivery of the full range of health careservices.
The health service utilization measures included address two conceptually differenttypes of measures:
• The use of regionally provided services (by anyone) and• Services accessed by residents of Eeyou Istchee, regardless of service location
The hospitalization statistics included in this section primarily refer to service usepatterns. Injury-related hospitalization data is also reported as a morbidity measure inthe next section (Health Status).
Key Points
Ø Gross expenditures on health in Eeyou Istchee in1997-98 amounted to$50,320,000 according to the Quebec Ministry of Health. As discussed undertable 3.1, this figure may not be accurate and is difficult to interpret.
Ø Per capita expenditure on health care through the Eeyou Istchee health systemis about double that of Quebec as a whole ($4097 vs. $2030). As explainedunder table 3.3, the comparison is difficult to interpret and the figures may not beaccurate.
Ø Staffing levels for nurses were 50% lower for Eeyou Istchee than for Quebec asa whole on a per capita basis. This is despite extensive travel time andadditional tasks related to the lack of infrastructure required of nurses in a remotelocation. In Eeyou Istchee in 1998-99, there were 6.0 equivalent-to-full-timenurses per 1,000 persons compared to 9.0 for the province as whole.
Ø About three-quarters (74%) of hospitalizations for residents of Eeyou Istcheeoccur outside of the region.
Ø About one-third (31%) of hospitalizations in Nord-du-Québec are for residents ofEeyou Istchee.
3. Health Services- Resources and Utilization
Health and What Affects it in the Cree Communities of Eeyou Istchee. p. 81
Ø The hospital bed occupancy rate in Eeyou Istchee is 62.9% compared to 83.3%for Quebec.
Ø The average hospital stay for Eeyou Istchee residents dropped 21% between1982-83 and 1997-98.
Ø The average hospital stay within the Eeyou Istchee regional hospital was downby 12% over the same period.
Ø Among residents of Eeyou Istchee, the number of surgical operations for inguinalor crural hernia was up by 100% between 1982-83 and 1997-98. The number ofgall bladder removals was up 63%, and the number of hysterectomies, down by53%.
Ø Per capita expenditure on health care through the Eeyou Istchee health systemis about double that of Quebec as a whole ($4097 vs. $2030). However, seeexplanatory notes under table 3.1 as several mitigating factors makecomparisons difficult.
Ø About three-quarters (74%) of hospitalizations for residents of Eeyou Istcheeoccur outside of the region.
Ø About one-third (31%) of hospitalizations in Nord-du-Québec are for residents ofEeyou Istchee.
Data Sources and Quality
• Figures presented in this section are based on data published by the QuebecMinistry of Health. It is important to note that their figures, particularly regardingexpenditures and staffing levels, are not necessarily considered factual oraccurate. They are reprinted here, as advisory- to show what the Ministry,presumably, believes to be true. Please see additional notes under therespective tables.
• Several tables are based on hospitalizations for “short term care”. A number ofvery specific definitions apply.
Short term care:o Surgeries done on an outpatient basis (day surgery), and other “day
procedures” (e.g. hemato-oncology, endoscopy), as well as home-basedcare, are excluded.
o Only institutions that primarily offer active care (“soins actifs”) areincluded. Facilities offering primarily psychiatric, rehabilitative,convalescent or long-term care are excluded.
o Active care is defined as short-term care dispensed by a general orspecialized care institution. Certain CLSC's are also included if theirmandate includes short-term care.
o Institutions whose short-term care turnover rate is low (discharges pershort-term care bed <15/year) are excluded.
o This data excludes long term care (even in short term beds), psychiatriccare and healthy newborns.
3. Health Services- Resources and Utilization
Health and What Affects it in the Cree Communities of Eeyou Istchee. p. 82
o Hospital stays, which began as short-term but became long-term, areexcluded.
Length of stay:o Refers to the number of days spent in the dispensing institution, including
the day of admission and any temporary leaves taking place between thedate of admission and date of discharge. The day of the discharge is notincluded.
o The minimum number of days in a stay is one (1).o Average length of stay (ALS) is presented in days and equals the number
of days of hospitalization divided by the number of hospitalizations for ayear for each category (age or sex or diagnosis).
Diagnosis:o When a person who is hospitalized receives a number of diagnoses, the
diagnosis that is considered the main reason for the hospitalization isretained.
• For all MEDECHO-derived (hospitalization) records, episodes resulting inhospital transfers (e.g. 2 nights in Chisasibi followed by 3 nights inChibougamau) are counted as separate hospitalizations. The result is anoverestimated number of hospitalizations and an underestimation of the “true”length of stay.

3. Health Services- Resources and Utilization
Health and What Affects it in the Cree Communities of Eeyou Istchee. p. 83
TABLE 3.1: GROSS EXPENDITURES BY SECTOR 1997-98 (QUEBEC MINISTRY OFHEALTH AND SOCIAL SERVICES92)
Sector ExpenditureHealth Promotion $2,757,000Diagnostic procedures $966,000Treatment - physical (in-patient) $10,456,000Treatment - mental (in-patient) $14,000Rehabilitation $2,509,000Social support, protection and shelter $2,841,000Home care $1,060,000Complementary services $8,328,000Administrative activities $13,313,000Other activities $8,058,000Total $50,302,000
Note: The expenditures are not necessarily considered factual or accurate and maynot agree with those believed accurate by the CBHSSJB. They are reprinted here forthe purpose of revealing what the Quebec Ministry of Health may believe to be true.The information is taken from newsletters (“Info-SIFO”.)
The total reported is comprehensive; including expenses related to principal activities(related to each establishment’s mission) and all “accessory” activities (e.g. not directlyrelated). Totals include incomes and benefits for physicians and other staff, retirementand RREGOP payments, travel costs, building and equipment acquisitions (“fixedassets”), First Nations non-insured health benefits etc. Any income is not deductedfrom the (gross) expenditures.
INFO-SIFO draws its information from three sources:
Financial reports of institutions—information broken down by sector (“formulaire AS-471”)Financial reports of institutions—information not broken down by sector (“formulaire AS-471”)Other sources of information (e.g. RAMQ, MSSS, Community organizations, OPHQ),some of which is not available by region.
92 Info-Sifo : Bulletin d’information concernant Système d’Information Financière et Opérationnelle.Direction de la gestion de l’information. Service du développement de l’information. MSSS. The Info-Sifo newsletter is available on the Ministry’s website (www.msss.gouv.qc.ca)

3. Health Services- Resources and Utilization
Health and What Affects it in the Cree Communities of Eeyou Istchee. p. 84
TABLE 3.2: TOTAL GROSS EXPENDITURES BY YEAR (QUEBEC MINISTRY OFHEALTH AND SOCIAL SERVICES93)
Total expenditures Per capita1990-91 $27,736,000 $3,2381991-92 $34,949,000 $3,3071992-93 $31,632,000 $2,9471993-94 $32,334,000 $2,9651994-95 $37,668,000 $3,4061995-96 $41,942,000 $3,7101996-97 $46,182,000 $3,9701997-98 $50,302,000 $4,097
Note: Please see important notes under table 3.1.
Figures are not adjusted for inflation. Per capita amounts are calculated by dividing theamount total spent by institutions in the region by the resident population.
TABLE 3.3: GROSS EXPENDITURES PER CAPITA COMPARED (QUEBECMINISTRY OF HEALTH AND SOCIAL SERVICES94)
Per capita (1997-98)Nord-du-Québec $1,863Nunavik $6,266Eeyou Istchee $4,097Quebec $2,030
Note: Please see important notes under table 3.1
Interpret with caution: Figures for Eeyou Istchee and Nunavik include non-insuredhealth benefits as well as very significant travel costs. These two elements substantiallyincrease spending and make direct comparisons with other jurisdictions “like comparingapples and oranges.”
Services received by residents of region A in region B are counted as costs in region B.
93 IBID94 IBID
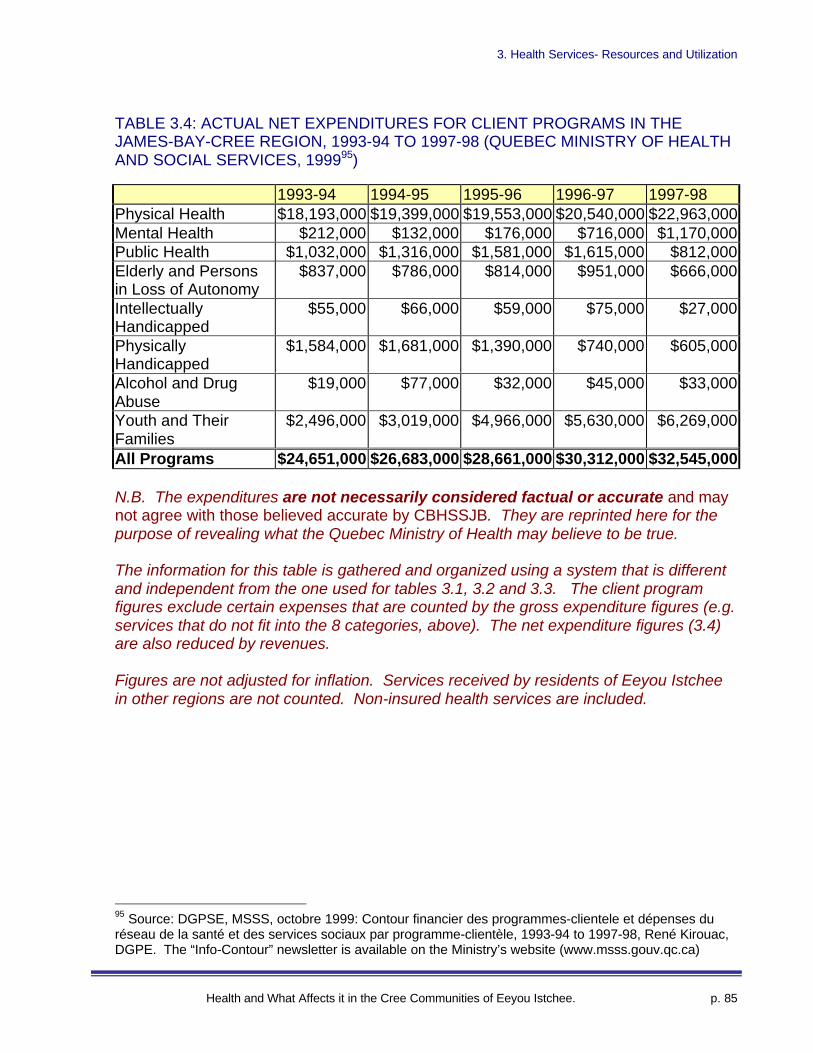
3. Health Services- Resources and Utilization
Health and What Affects it in the Cree Communities of Eeyou Istchee. p. 85
TABLE 3.4: ACTUAL NET EXPENDITURES FOR CLIENT PROGRAMS IN THEJAMES-BAY-CREE REGION, 1993-94 TO 1997-98 (QUEBEC MINISTRY OF HEALTHAND SOCIAL SERVICES, 199995)
1993-94 1994-95 1995-96 1996-97 1997-98Physical Health $18,193,000 $19,399,000 $19,553,000 $20,540,000 $22,963,000Mental Health $212,000 $132,000 $176,000 $716,000 $1,170,000Public Health $1,032,000 $1,316,000 $1,581,000 $1,615,000 $812,000Elderly and Personsin Loss of Autonomy
$837,000 $786,000 $814,000 $951,000 $666,000
IntellectuallyHandicapped
$55,000 $66,000 $59,000 $75,000 $27,000
PhysicallyHandicapped
$1,584,000 $1,681,000 $1,390,000 $740,000 $605,000
Alcohol and DrugAbuse
$19,000 $77,000 $32,000 $45,000 $33,000
Youth and TheirFamilies
$2,496,000 $3,019,000 $4,966,000 $5,630,000 $6,269,000
All Programs $24,651,000 $26,683,000 $28,661,000 $30,312,000 $32,545,000
N.B. The expenditures are not necessarily considered factual or accurate and maynot agree with those believed accurate by CBHSSJB. They are reprinted here for thepurpose of revealing what the Quebec Ministry of Health may believe to be true.
The information for this table is gathered and organized using a system that is differentand independent from the one used for tables 3.1, 3.2 and 3.3. The client programfigures exclude certain expenses that are counted by the gross expenditure figures (e.g.services that do not fit into the 8 categories, above). The net expenditure figures (3.4)are also reduced by revenues.
Figures are not adjusted for inflation. Services received by residents of Eeyou Istcheein other regions are not counted. Non-insured health services are included.
95 Source: DGPSE, MSSS, octobre 1999: Contour financier des programmes-clientele et dépenses duréseau de la santé et des services sociaux par programme-clientèle, 1993-94 to 1997-98, René Kirouac,DGPE. The “Info-Contour” newsletter is available on the Ministry’s website (www.msss.gouv.qc.ca)
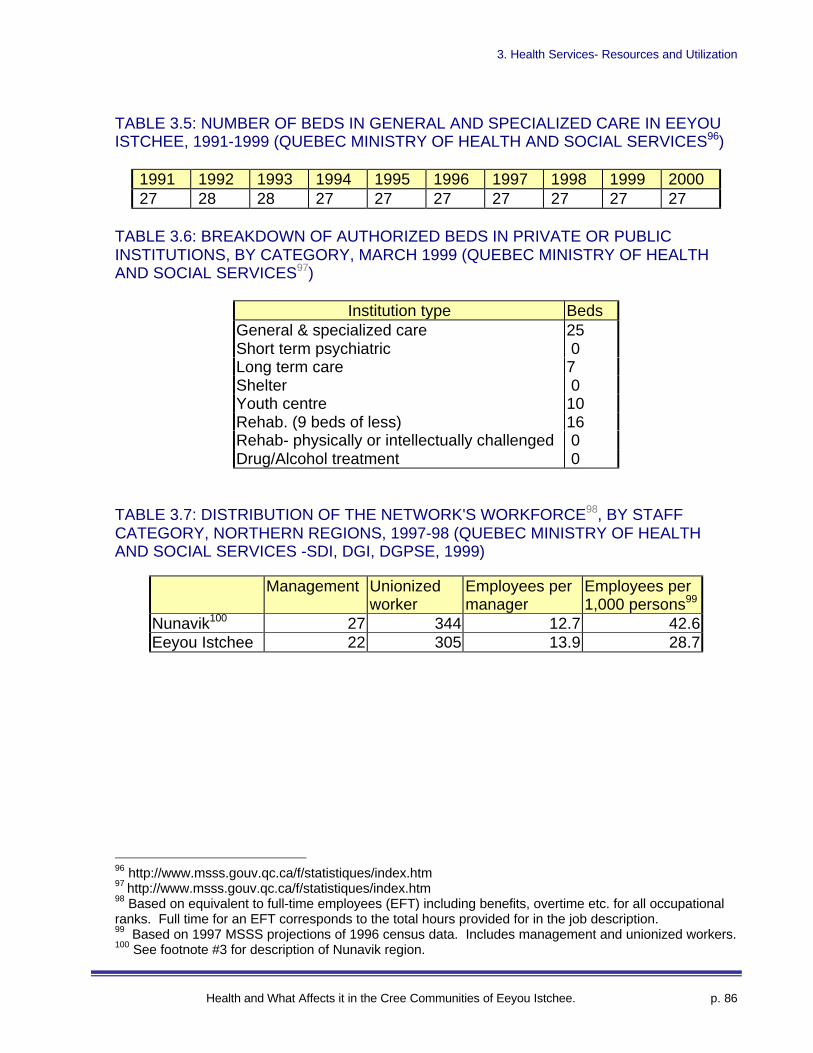
3. Health Services- Resources and Utilization
Health and What Affects it in the Cree Communities of Eeyou Istchee. p. 86
TABLE 3.5: NUMBER OF BEDS IN GENERAL AND SPECIALIZED CARE IN EEYOUISTCHEE, 1991-1999 (QUEBEC MINISTRY OF HEALTH AND SOCIAL SERVICES96)
1991 1992 1993 1994 1995 1996 1997 1998 1999 200027 28 28 27 27 27 27 27 27 27
TABLE 3.6: BREAKDOWN OF AUTHORIZED BEDS IN PRIVATE OR PUBLICINSTITUTIONS, BY CATEGORY, MARCH 1999 (QUEBEC MINISTRY OF HEALTHAND SOCIAL SERVICES97)
Institution type BedsGeneral & specialized care 25Short term psychiatric 0Long term care 7Shelter 0Youth centre 10Rehab. (9 beds of less) 16Rehab- physically or intellectually challenged 0Drug/Alcohol treatment 0
TABLE 3.7: DISTRIBUTION OF THE NETWORK'S WORKFORCE98, BY STAFFCATEGORY, NORTHERN REGIONS, 1997-98 (QUEBEC MINISTRY OF HEALTHAND SOCIAL SERVICES -SDI, DGI, DGPSE, 1999)
Management Unionizedworker
Employees permanager
Employees per1,000 persons99
Nunavik100 27 344 12.7 42.6Eeyou Istchee 22 305 13.9 28.7
96 http://www.msss.gouv.qc.ca/f/statistiques/index.htm97 http://www.msss.gouv.qc.ca/f/statistiques/index.htm98 Based on equivalent to full-time employees (EFT) including benefits, overtime etc. for all occupationalranks. Full time for an EFT corresponds to the total hours provided for in the job description.99 Based on 1997 MSSS projections of 1996 census data. Includes management and unionized workers.100 See footnote #3 for description of Nunavik region.
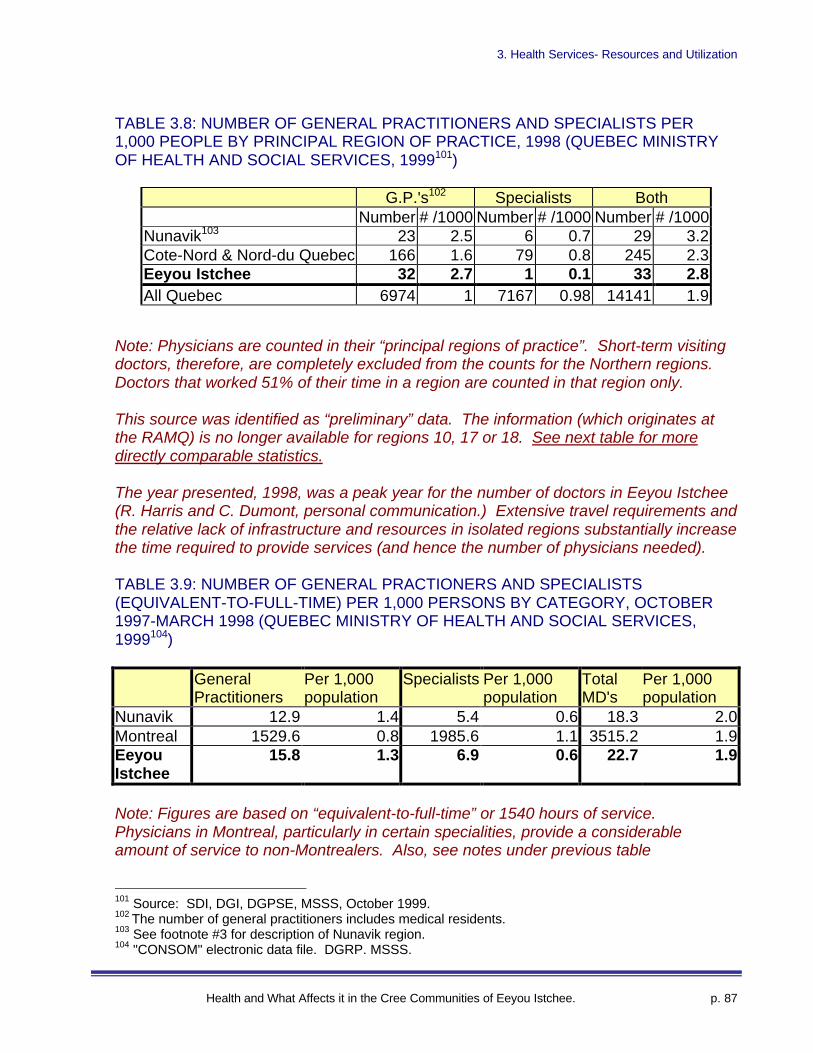
3. Health Services- Resources and Utilization
Health and What Affects it in the Cree Communities of Eeyou Istchee. p. 87
TABLE 3.8: NUMBER OF GENERAL PRACTITIONERS AND SPECIALISTS PER1,000 PEOPLE BY PRINCIPAL REGION OF PRACTICE, 1998 (QUEBEC MINISTRYOF HEALTH AND SOCIAL SERVICES, 1999101)
G.P.'s102 Specialists BothNumber # /1000 Number # /1000 Number # /1000
Nunavik103 23 2.5 6 0.7 29 3.2Cote-Nord & Nord-du Quebec 166 1.6 79 0.8 245 2.3Eeyou Istchee 32 2.7 1 0.1 33 2.8All Quebec 6974 1 7167 0.98 14141 1.9
Note: Physicians are counted in their “principal regions of practice”. Short-term visitingdoctors, therefore, are completely excluded from the counts for the Northern regions.Doctors that worked 51% of their time in a region are counted in that region only.
This source was identified as “preliminary” data. The information (which originates atthe RAMQ) is no longer available for regions 10, 17 or 18. See next table for moredirectly comparable statistics.
The year presented, 1998, was a peak year for the number of doctors in Eeyou Istchee(R. Harris and C. Dumont, personal communication.) Extensive travel requirements andthe relative lack of infrastructure and resources in isolated regions substantially increasethe time required to provide services (and hence the number of physicians needed).
TABLE 3.9: NUMBER OF GENERAL PRACTIONERS AND SPECIALISTS(EQUIVALENT-TO-FULL-TIME) PER 1,000 PERSONS BY CATEGORY, OCTOBER1997-MARCH 1998 (QUEBEC MINISTRY OF HEALTH AND SOCIAL SERVICES,1999104)
GeneralPractitioners
Per 1,000population
Specialists Per 1,000population
TotalMD's
Per 1,000population
Nunavik 12.9 1.4 5.4 0.6 18.3 2.0Montreal 1529.6 0.8 1985.6 1.1 3515.2 1.9EeyouIstchee
15.8 1.3 6.9 0.6 22.7 1.9
Note: Figures are based on “equivalent-to-full-time” or 1540 hours of service.Physicians in Montreal, particularly in certain specialities, provide a considerableamount of service to non-Montrealers. Also, see notes under previous table
101 Source: SDI, DGI, DGPSE, MSSS, October 1999.102 The number of general practitioners includes medical residents.103 See footnote #3 for description of Nunavik region.104 "CONSOM" electronic data file. DGRP. MSSS.
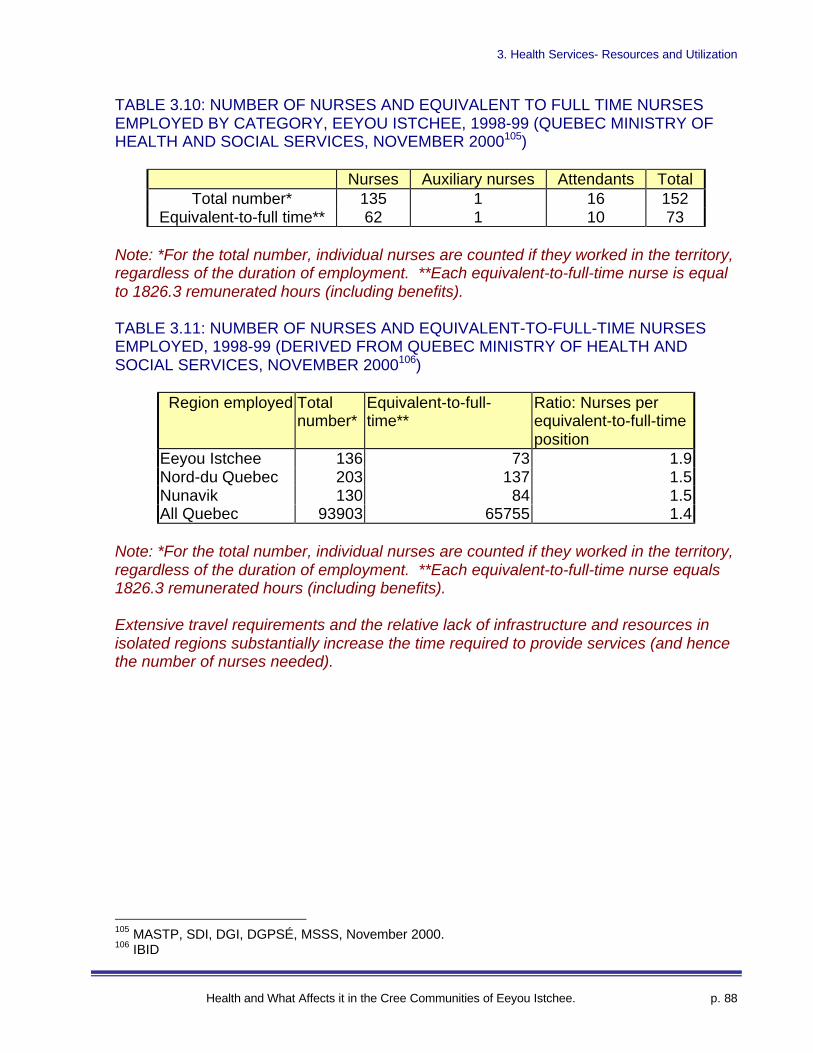
3. Health Services- Resources and Utilization
Health and What Affects it in the Cree Communities of Eeyou Istchee. p. 88
TABLE 3.10: NUMBER OF NURSES AND EQUIVALENT TO FULL TIME NURSESEMPLOYED BY CATEGORY, EEYOU ISTCHEE, 1998-99 (QUEBEC MINISTRY OFHEALTH AND SOCIAL SERVICES, NOVEMBER 2000105)
Nurses Auxiliary nurses Attendants TotalTotal number* 135 1 16 152
Equivalent-to-full time** 62 1 10 73
Note: *For the total number, individual nurses are counted if they worked in the territory,regardless of the duration of employment. **Each equivalent-to-full-time nurse is equalto 1826.3 remunerated hours (including benefits).
TABLE 3.11: NUMBER OF NURSES AND EQUIVALENT-TO-FULL-TIME NURSESEMPLOYED, 1998-99 (DERIVED FROM QUEBEC MINISTRY OF HEALTH ANDSOCIAL SERVICES, NOVEMBER 2000106)
Region employed Totalnumber*
Equivalent-to-full-time**
Ratio: Nurses perequivalent-to-full-timeposition
Eeyou Istchee 136 73 1.9Nord-du Quebec 203 137 1.5Nunavik 130 84 1.5All Quebec 93903 65755 1.4
Note: *For the total number, individual nurses are counted if they worked in the territory,regardless of the duration of employment. **Each equivalent-to-full-time nurse equals1826.3 remunerated hours (including benefits).
Extensive travel requirements and the relative lack of infrastructure and resources inisolated regions substantially increase the time required to provide services (and hencethe number of nurses needed).
105 MASTP, SDI, DGI, DGPSÉ, MSSS, November 2000.106 IBID
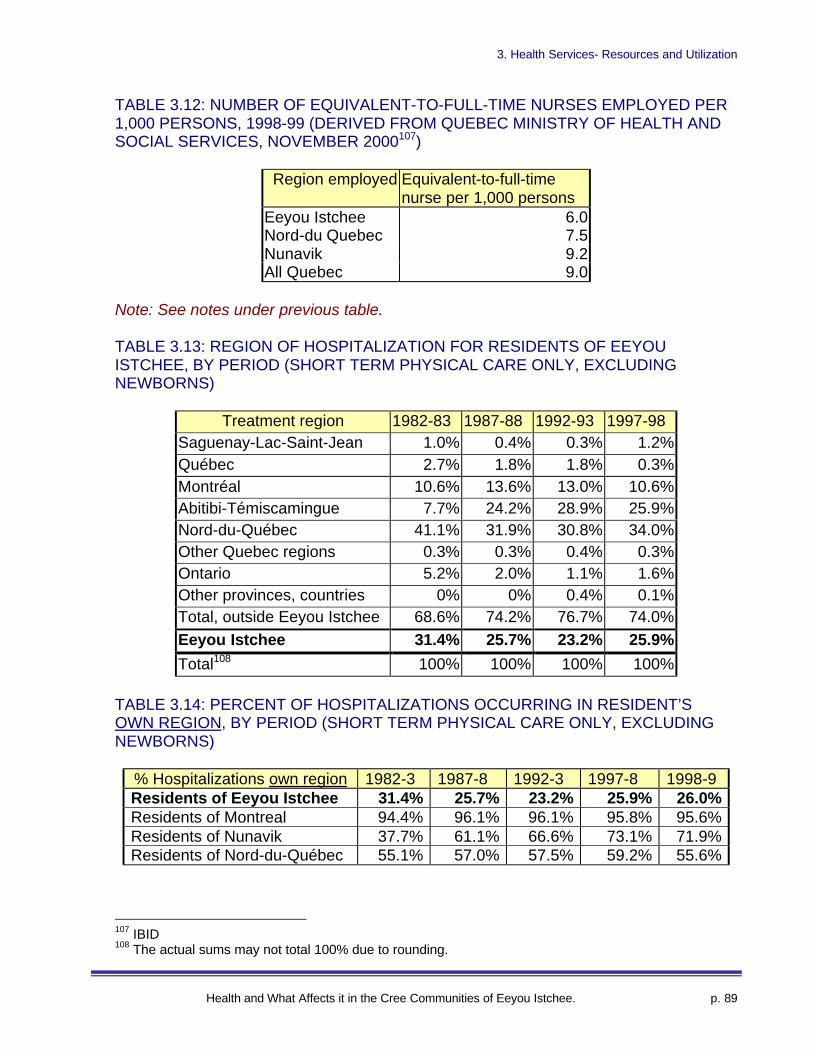
3. Health Services- Resources and Utilization
Health and What Affects it in the Cree Communities of Eeyou Istchee. p. 89
TABLE 3.12: NUMBER OF EQUIVALENT-TO-FULL-TIME NURSES EMPLOYED PER1,000 PERSONS, 1998-99 (DERIVED FROM QUEBEC MINISTRY OF HEALTH ANDSOCIAL SERVICES, NOVEMBER 2000107)
Region employed Equivalent-to-full-timenurse per 1,000 persons
Eeyou Istchee 6.0Nord-du Quebec 7.5Nunavik 9.2All Quebec 9.0
Note: See notes under previous table.
TABLE 3.13: REGION OF HOSPITALIZATION FOR RESIDENTS OF EEYOUISTCHEE, BY PERIOD (SHORT TERM PHYSICAL CARE ONLY, EXCLUDINGNEWBORNS)
Treatment region 1982-83 1987-88 1992-93 1997-98Saguenay-Lac-Saint-Jean 1.0% 0.4% 0.3% 1.2%Québec 2.7% 1.8% 1.8% 0.3%Montréal 10.6% 13.6% 13.0% 10.6%Abitibi-Témiscamingue 7.7% 24.2% 28.9% 25.9%Nord-du-Québec 41.1% 31.9% 30.8% 34.0%Other Quebec regions 0.3% 0.3% 0.4% 0.3%Ontario 5.2% 2.0% 1.1% 1.6%Other provinces, countries 0% 0% 0.4% 0.1%Total, outside Eeyou Istchee 68.6% 74.2% 76.7% 74.0%Eeyou Istchee 31.4% 25.7% 23.2% 25.9%
Total108 100% 100% 100% 100%
TABLE 3.14: PERCENT OF HOSPITALIZATIONS OCCURRING IN RESIDENT’SOWN REGION, BY PERIOD (SHORT TERM PHYSICAL CARE ONLY, EXCLUDINGNEWBORNS)
% Hospitalizations own region 1982-3 1987-8 1992-3 1997-8 1998-9Residents of Eeyou Istchee 31.4% 25.7% 23.2% 25.9% 26.0%Residents of Montreal 94.4% 96.1% 96.1% 95.8% 95.6%Residents of Nunavik 37.7% 61.1% 66.6% 73.1% 71.9%Residents of Nord-du-Québec 55.1% 57.0% 57.5% 59.2% 55.6%
107 IBID108 The actual sums may not total 100% due to rounding.
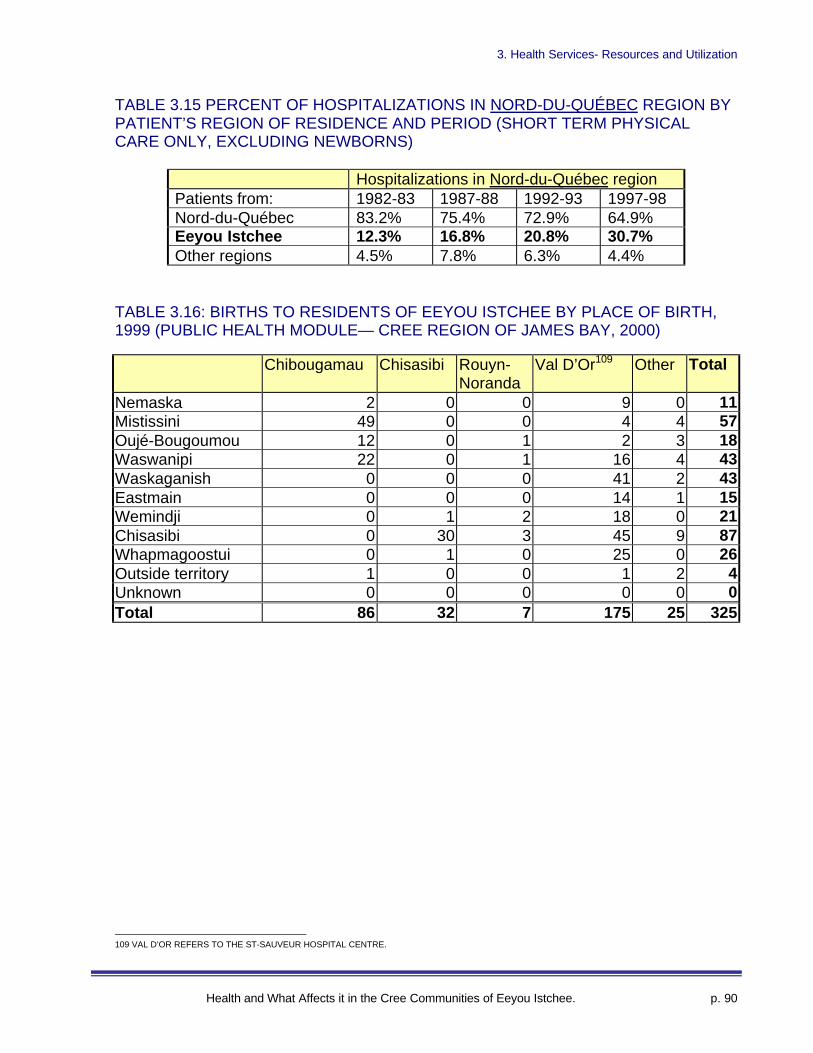
3. Health Services- Resources and Utilization
Health and What Affects it in the Cree Communities of Eeyou Istchee. p. 90
TABLE 3.15 PERCENT OF HOSPITALIZATIONS IN NORD-DU-QUÉBEC REGION BYPATIENT’S REGION OF RESIDENCE AND PERIOD (SHORT TERM PHYSICALCARE ONLY, EXCLUDING NEWBORNS)
Hospitalizations in Nord-du-Québec regionPatients from: 1982-83 1987-88 1992-93 1997-98Nord-du-Québec 83.2% 75.4% 72.9% 64.9%Eeyou Istchee 12.3% 16.8% 20.8% 30.7%Other regions 4.5% 7.8% 6.3% 4.4%
TABLE 3.16: BIRTHS TO RESIDENTS OF EEYOU ISTCHEE BY PLACE OF BIRTH,1999 (PUBLIC HEALTH MODULE— CREE REGION OF JAMES BAY, 2000)
Chibougamau Chisasibi Rouyn-Noranda
Val D’Or109 Other Total
Nemaska 2 0 0 9 0 11Mistissini 49 0 0 4 4 57Oujé-Bougoumou 12 0 1 2 3 18Waswanipi 22 0 1 16 4 43Waskaganish 0 0 0 41 2 43Eastmain 0 0 0 14 1 15Wemindji 0 1 2 18 0 21Chisasibi 0 30 3 45 9 87Whapmagoostui 0 1 0 25 0 26Outside territory 1 0 0 1 2 4Unknown 0 0 0 0 0 0Total 86 32 7 175 25 325
109 VAL D’OR REFERS TO THE ST-SAUVEUR HOSPITAL CENTRE.
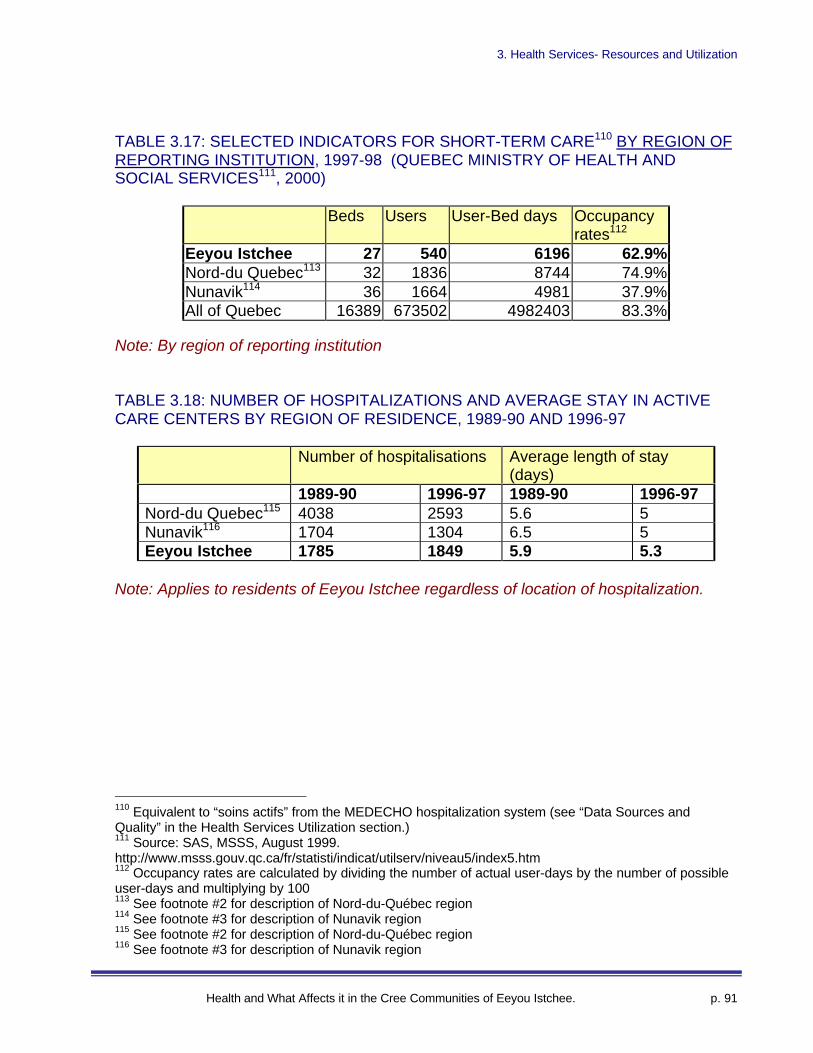
3. Health Services- Resources and Utilization
Health and What Affects it in the Cree Communities of Eeyou Istchee. p. 91
TABLE 3.17: SELECTED INDICATORS FOR SHORT-TERM CARE110 BY REGION OFREPORTING INSTITUTION, 1997-98 (QUEBEC MINISTRY OF HEALTH ANDSOCIAL SERVICES111, 2000)
Beds Users User-Bed days Occupancyrates112
Eeyou Istchee 27 540 6196 62.9%Nord-du Quebec113 32 1836 8744 74.9%Nunavik114 36 1664 4981 37.9%All of Quebec 16389 673502 4982403 83.3%
Note: By region of reporting institution
TABLE 3.18: NUMBER OF HOSPITALIZATIONS AND AVERAGE STAY IN ACTIVECARE CENTERS BY REGION OF RESIDENCE, 1989-90 AND 1996-97
Number of hospitalisations Average length of stay(days)
1989-90 1996-97 1989-90 1996-97Nord-du Quebec115 4038 2593 5.6 5Nunavik116 1704 1304 6.5 5Eeyou Istchee 1785 1849 5.9 5.3
Note: Applies to residents of Eeyou Istchee regardless of location of hospitalization.
110 Equivalent to “soins actifs” from the MEDECHO hospitalization system (see “Data Sources andQuality” in the Health Services Utilization section.)111 Source: SAS, MSSS, August 1999.http://www.msss.gouv.qc.ca/fr/statisti/indicat/utilserv/niveau5/index5.htm112 Occupancy rates are calculated by dividing the number of actual user-days by the number of possibleuser-days and multiplying by 100113 See footnote #2 for description of Nord-du-Québec region114 See footnote #3 for description of Nunavik region115 See footnote #2 for description of Nord-du-Québec region116 See footnote #3 for description of Nunavik region
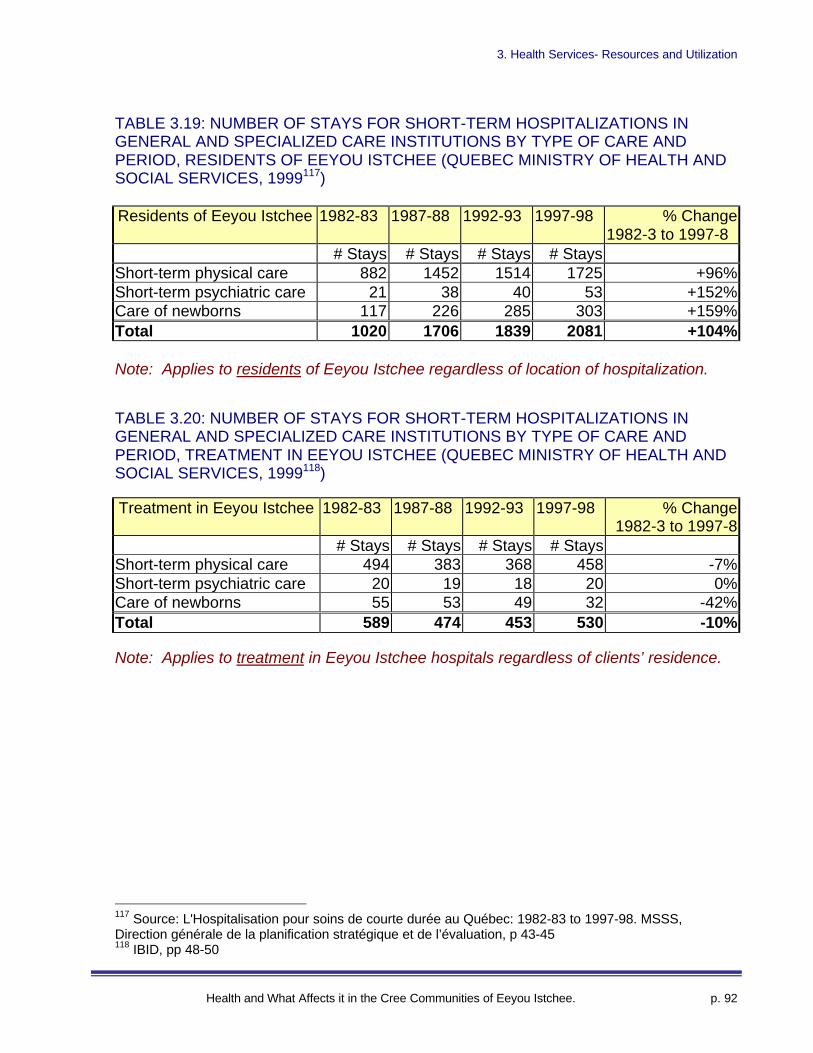
3. Health Services- Resources and Utilization
Health and What Affects it in the Cree Communities of Eeyou Istchee. p. 92
TABLE 3.19: NUMBER OF STAYS FOR SHORT-TERM HOSPITALIZATIONS INGENERAL AND SPECIALIZED CARE INSTITUTIONS BY TYPE OF CARE ANDPERIOD, RESIDENTS OF EEYOU ISTCHEE (QUEBEC MINISTRY OF HEALTH ANDSOCIAL SERVICES, 1999117)
Residents of Eeyou Istchee 1982-83 1987-88 1992-93 1997-98 % Change1982-3 to 1997-8
# Stays # Stays # Stays # StaysShort-term physical care 882 1452 1514 1725 +96%Short-term psychiatric care 21 38 40 53 +152%Care of newborns 117 226 285 303 +159%Total 1020 1706 1839 2081 +104%
Note: Applies to residents of Eeyou Istchee regardless of location of hospitalization.
TABLE 3.20: NUMBER OF STAYS FOR SHORT-TERM HOSPITALIZATIONS INGENERAL AND SPECIALIZED CARE INSTITUTIONS BY TYPE OF CARE ANDPERIOD, TREATMENT IN EEYOU ISTCHEE (QUEBEC MINISTRY OF HEALTH ANDSOCIAL SERVICES, 1999118)
Treatment in Eeyou Istchee 1982-83 1987-88 1992-93 1997-98 % Change1982-3 to 1997-8
# Stays # Stays # Stays # StaysShort-term physical care 494 383 368 458 -7%Short-term psychiatric care 20 19 18 20 0%Care of newborns 55 53 49 32 -42%Total 589 474 453 530 -10%
Note: Applies to treatment in Eeyou Istchee hospitals regardless of clients’ residence.
117 Source: L'Hospitalisation pour soins de courte durée au Québec: 1982-83 to 1997-98. MSSS,Direction générale de la planification stratégique et de l’évaluation, p 43-45118 IBID, pp 48-50
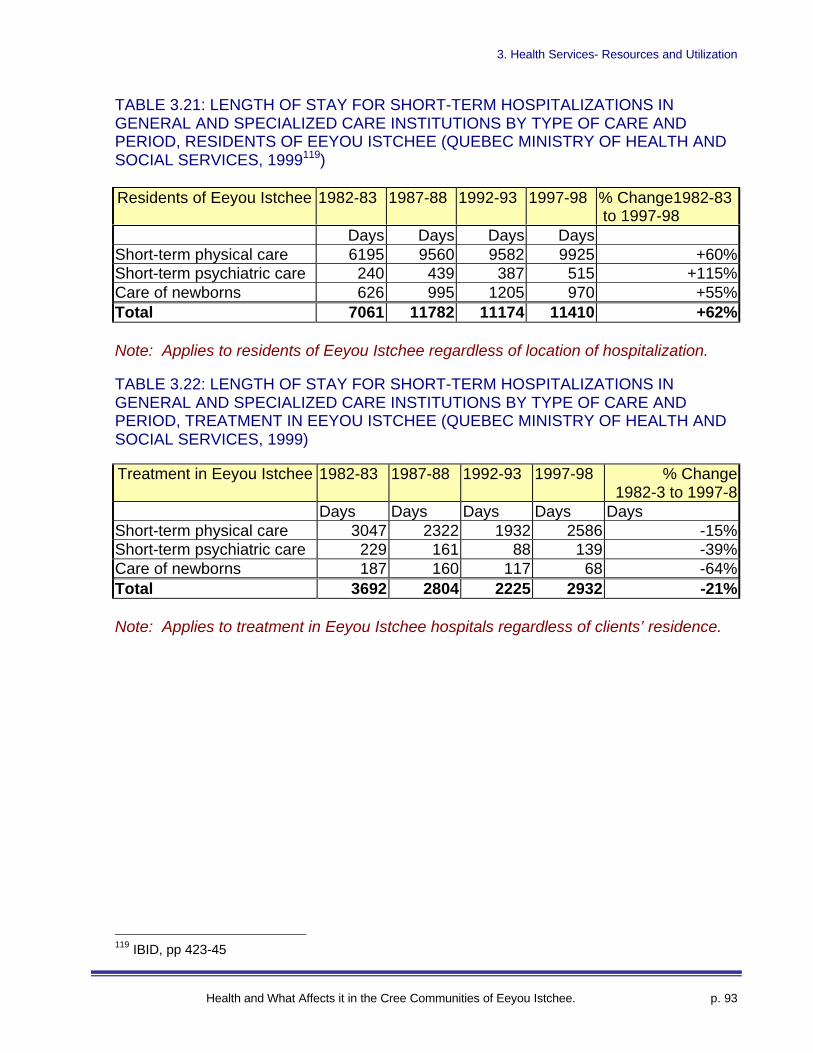
3. Health Services- Resources and Utilization
Health and What Affects it in the Cree Communities of Eeyou Istchee. p. 93
TABLE 3.21: LENGTH OF STAY FOR SHORT-TERM HOSPITALIZATIONS INGENERAL AND SPECIALIZED CARE INSTITUTIONS BY TYPE OF CARE ANDPERIOD, RESIDENTS OF EEYOU ISTCHEE (QUEBEC MINISTRY OF HEALTH ANDSOCIAL SERVICES, 1999119)
Residents of Eeyou Istchee 1982-83 1987-88 1992-93 1997-98 % Change1982-83 to 1997-98
Days Days Days DaysShort-term physical care 6195 9560 9582 9925 +60%Short-term psychiatric care 240 439 387 515 +115%Care of newborns 626 995 1205 970 +55%Total 7061 11782 11174 11410 +62%
Note: Applies to residents of Eeyou Istchee regardless of location of hospitalization.
TABLE 3.22: LENGTH OF STAY FOR SHORT-TERM HOSPITALIZATIONS INGENERAL AND SPECIALIZED CARE INSTITUTIONS BY TYPE OF CARE ANDPERIOD, TREATMENT IN EEYOU ISTCHEE (QUEBEC MINISTRY OF HEALTH ANDSOCIAL SERVICES, 1999)
Treatment in Eeyou Istchee 1982-83 1987-88 1992-93 1997-98 % Change1982-3 to 1997-8
Days Days Days Days DaysShort-term physical care 3047 2322 1932 2586 -15%Short-term psychiatric care 229 161 88 139 -39%Care of newborns 187 160 117 68 -64%Total 3692 2804 2225 2932 -21%
Note: Applies to treatment in Eeyou Istchee hospitals regardless of clients’ residence.
119 IBID, pp 423-45
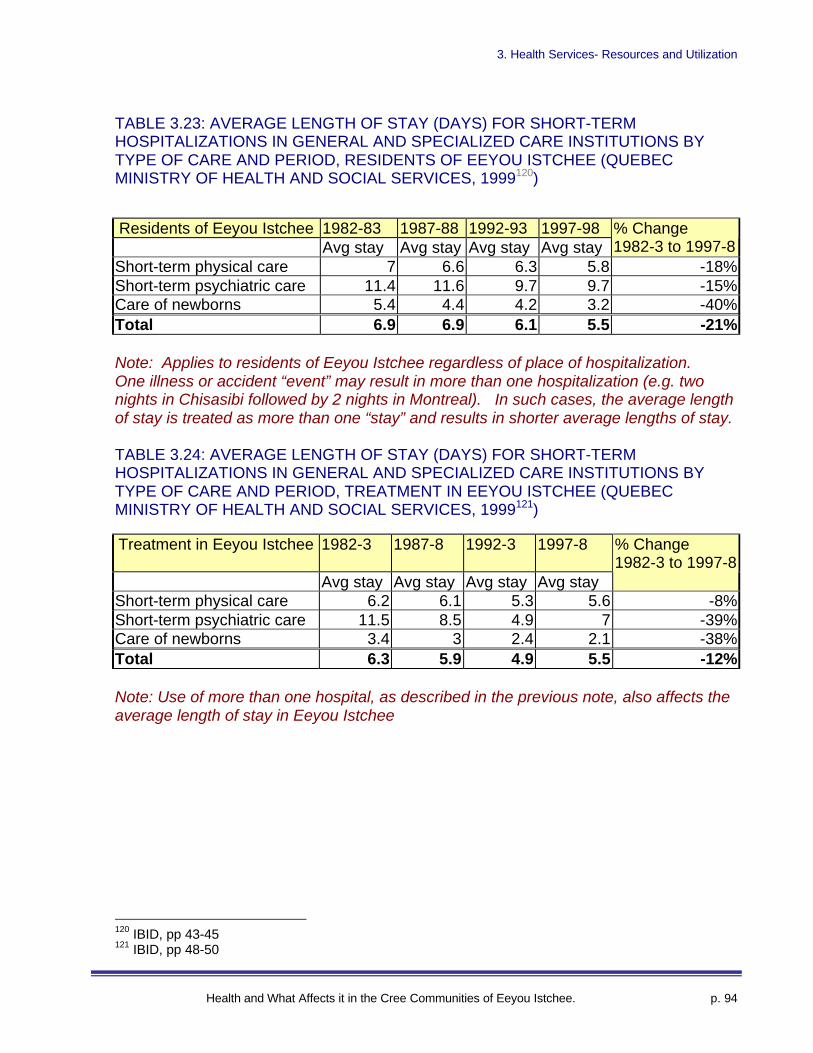
3. Health Services- Resources and Utilization
Health and What Affects it in the Cree Communities of Eeyou Istchee. p. 94
TABLE 3.23: AVERAGE LENGTH OF STAY (DAYS) FOR SHORT-TERMHOSPITALIZATIONS IN GENERAL AND SPECIALIZED CARE INSTITUTIONS BYTYPE OF CARE AND PERIOD, RESIDENTS OF EEYOU ISTCHEE (QUEBECMINISTRY OF HEALTH AND SOCIAL SERVICES, 1999120)
Residents of Eeyou Istchee 1982-83 1987-88 1992-93 1997-98Avg stay Avg stay Avg stay Avg stay
% Change1982-3 to 1997-8
Short-term physical care 7 6.6 6.3 5.8 -18%Short-term psychiatric care 11.4 11.6 9.7 9.7 -15%Care of newborns 5.4 4.4 4.2 3.2 -40%Total 6.9 6.9 6.1 5.5 -21%
Note: Applies to residents of Eeyou Istchee regardless of place of hospitalization.One illness or accident “event” may result in more than one hospitalization (e.g. twonights in Chisasibi followed by 2 nights in Montreal). In such cases, the average lengthof stay is treated as more than one “stay” and results in shorter average lengths of stay.
TABLE 3.24: AVERAGE LENGTH OF STAY (DAYS) FOR SHORT-TERMHOSPITALIZATIONS IN GENERAL AND SPECIALIZED CARE INSTITUTIONS BYTYPE OF CARE AND PERIOD, TREATMENT IN EEYOU ISTCHEE (QUEBECMINISTRY OF HEALTH AND SOCIAL SERVICES, 1999121)
Treatment in Eeyou Istchee 1982-3 1987-8 1992-3 1997-8
Avg stay Avg stay Avg stay Avg stay
% Change1982-3 to 1997-8
Short-term physical care 6.2 6.1 5.3 5.6 -8%Short-term psychiatric care 11.5 8.5 4.9 7 -39%Care of newborns 3.4 3 2.4 2.1 -38%Total 6.3 5.9 4.9 5.5 -12%
Note: Use of more than one hospital, as described in the previous note, also affects theaverage length of stay in Eeyou Istchee
120 IBID, pp 43-45121 IBID, pp 48-50
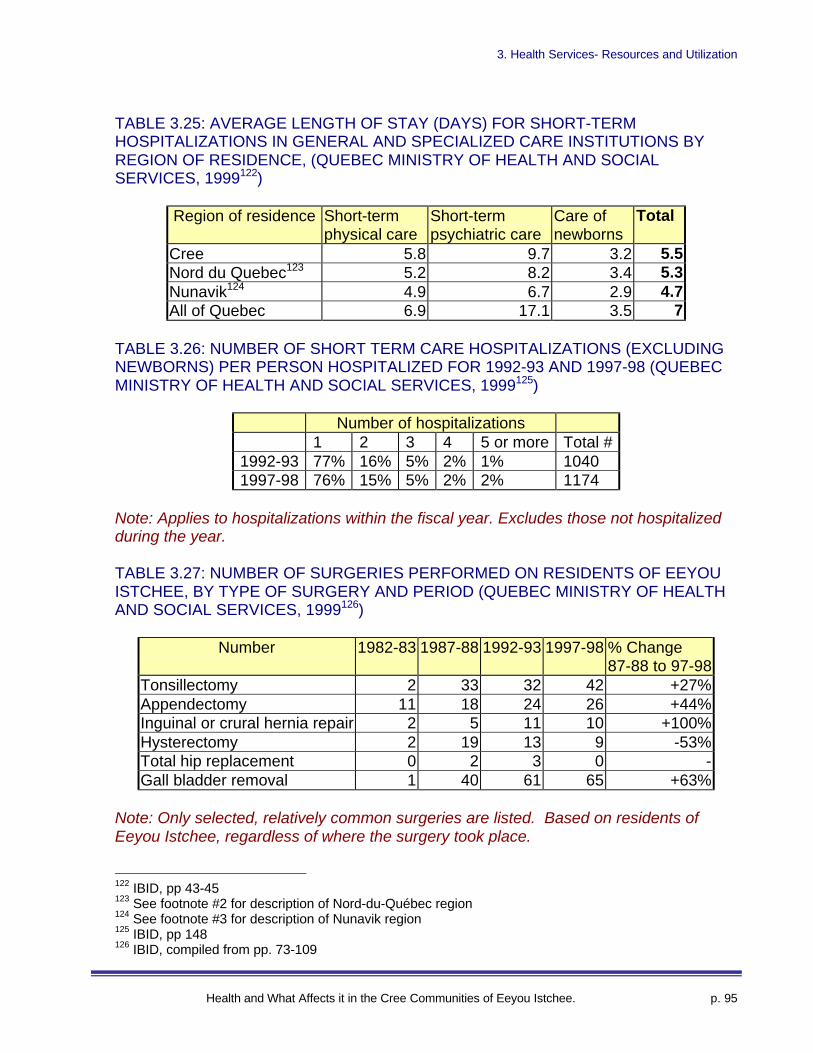
3. Health Services- Resources and Utilization
Health and What Affects it in the Cree Communities of Eeyou Istchee. p. 95
TABLE 3.25: AVERAGE LENGTH OF STAY (DAYS) FOR SHORT-TERMHOSPITALIZATIONS IN GENERAL AND SPECIALIZED CARE INSTITUTIONS BYREGION OF RESIDENCE, (QUEBEC MINISTRY OF HEALTH AND SOCIALSERVICES, 1999122)
Region of residence Short-termphysical care
Short-termpsychiatric care
Care ofnewborns
Total
Cree 5.8 9.7 3.2 5.5Nord du Quebec123 5.2 8.2 3.4 5.3Nunavik124 4.9 6.7 2.9 4.7All of Quebec 6.9 17.1 3.5 7
TABLE 3.26: NUMBER OF SHORT TERM CARE HOSPITALIZATIONS (EXCLUDINGNEWBORNS) PER PERSON HOSPITALIZED FOR 1992-93 AND 1997-98 (QUEBECMINISTRY OF HEALTH AND SOCIAL SERVICES, 1999125)
Number of hospitalizations1 2 3 4 5 or more Total #
1992-93 77% 16% 5% 2% 1% 10401997-98 76% 15% 5% 2% 2% 1174
Note: Applies to hospitalizations within the fiscal year. Excludes those not hospitalizedduring the year.
TABLE 3.27: NUMBER OF SURGERIES PERFORMED ON RESIDENTS OF EEYOUISTCHEE, BY TYPE OF SURGERY AND PERIOD (QUEBEC MINISTRY OF HEALTHAND SOCIAL SERVICES, 1999126)
Number 1982-83 1987-88 1992-93 1997-98 % Change87-88 to 97-98
Tonsillectomy 2 33 32 42 +27%Appendectomy 11 18 24 26 +44%Inguinal or crural hernia repair 2 5 11 10 +100%Hysterectomy 2 19 13 9 -53%Total hip replacement 0 2 3 0 -Gall bladder removal 1 40 61 65 +63%
Note: Only selected, relatively common surgeries are listed. Based on residents ofEeyou Istchee, regardless of where the surgery took place.
122 IBID, pp 43-45123 See footnote #2 for description of Nord-du-Québec region124 See footnote #3 for description of Nunavik region125 IBID, pp 148126 IBID, compiled from pp. 73-109
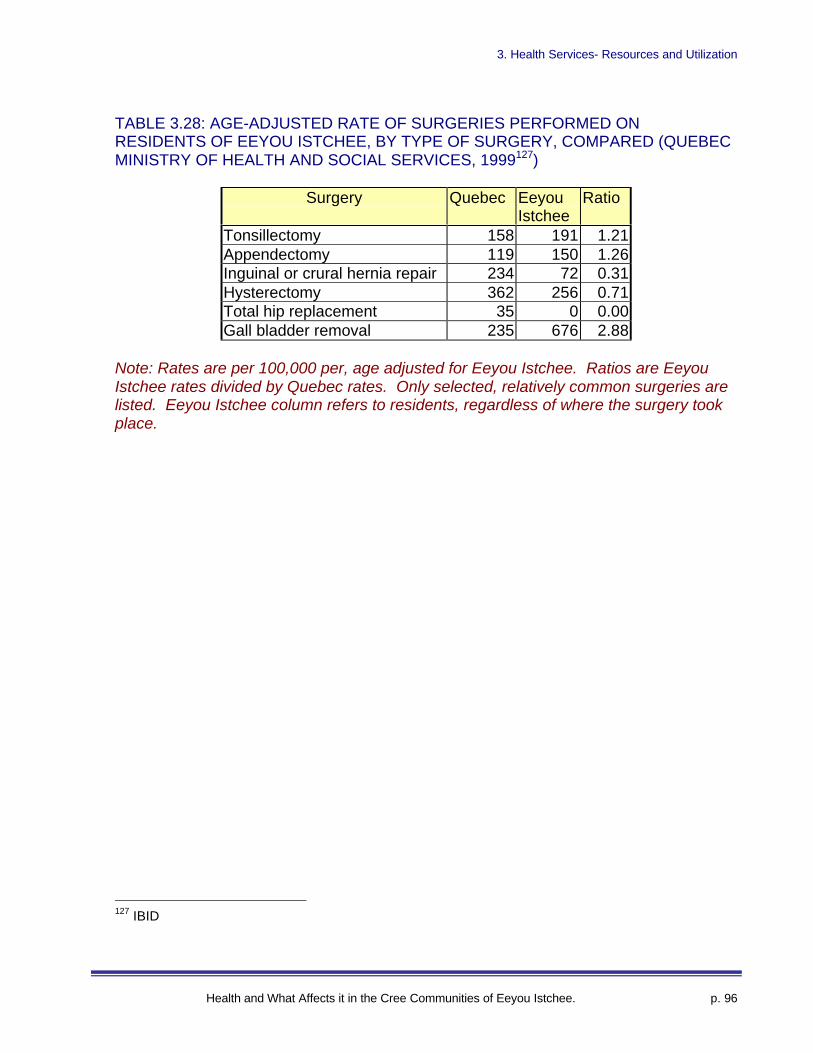
3. Health Services- Resources and Utilization
Health and What Affects it in the Cree Communities of Eeyou Istchee. p. 96
TABLE 3.28: AGE-ADJUSTED RATE OF SURGERIES PERFORMED ONRESIDENTS OF EEYOU ISTCHEE, BY TYPE OF SURGERY, COMPARED (QUEBECMINISTRY OF HEALTH AND SOCIAL SERVICES, 1999127)
Surgery Quebec EeyouIstchee
Ratio
Tonsillectomy 158 191 1.21Appendectomy 119 150 1.26Inguinal or crural hernia repair 234 72 0.31Hysterectomy 362 256 0.71Total hip replacement 35 0 0.00Gall bladder removal 235 676 2.88
Note: Rates are per 100,000 per, age adjusted for Eeyou Istchee. Ratios are EeyouIstchee rates divided by Quebec rates. Only selected, relatively common surgeries arelisted. Eeyou Istchee column refers to residents, regardless of where the surgery tookplace.
127 IBID
4. Health Status
Health and What Affects it in the Cree Communities of Eeyou Istchee. p. 97
4. Health Status
This section provides direct measures of the population’s health including:
• Infectious diseases• Chronic diseases (including diabetes)• Life expectancy• Mortality by cause• Injury-related hospitalization
Key Points
Ø Chlamydia is the most common reportable disease, with 84 cases in 1999.Ø The chlamydia rate for Eeyou Istchee is 813 (per 100,000 per year) compared to
87 for Quebec.Ø No AIDS cases have been reported. The limited available data on HIV is
somewhat inconclusive.Ø 11.0% of adults (15+) have been diagnosed with diabetes. The figure reaches
about 30% in adults 50 and over.Ø Waswanipi’s diabetes rate is highest (18.8%) and Whapmagoostui’s is lowest
(7.05)Ø Life expectancy for men is 74.8 (compared to 74.5 for Quebec) and 75.5 for
women (compared to 81.1). There was an unexplained drop in life expectancyamong women (80.5 to 75.5) between 1988-92 and 1993-97.
Ø Infant mortality in Eeyou Istchee is almost three times the provincial average(14.9 vs. 5.3 per 1,000 live births)
Ø For all-causes and ages combined, mortality rates in Eeyou Istchee are similar tothose for Quebec as a whole (which are somewhat lower than those for Canada).
Ø Cancer death rates are somewhat lower in Eeyou Istchee (149.9 vs. 217.5 per100,000 per year).
Ø The death rate related to respiratory causes was somewhat higher (149.9 inEeyou Istchee vs. 64.3 in Quebec).
Ø The diabetes mortality rate was higher (rates: 42.5 in Eeyou Istchee vs. 19.2 inQuebec)
Ø Deaths from gastrointestinal causes were more common (rates: 54.7 in EeyouIstchee vs. 26.5 in Quebec)
Ø Death rates related to motor vehicles were also higher (26.7 in Eeyou Istchee vs.11.2 in Quebec)
4. Health Status
Health and What Affects it in the Cree Communities of Eeyou Istchee. p. 98
Data Sources and Quality
• We believe that the Quebec Ministry of Health mortality rates reported in severaltables below are underestimated. (See next point for detail.)
• A detailed review of three sources of death records128 for the period 1987-92revealed undercounting as well as overcounting by the Ministry of Healthmortality register (vital statistics). Systematic undercounting by the Ministry’sregister was related to the misallocation of some Mistissini deaths to the Lac-St-Jean (02) region (which includes a “Mistassini”).
Overcounting by the Ministry also occurred, but to a lesser extent. For example,about half of the deaths mistakenly allocated to Eeyou Istchee were Inuit fromWhapmagoostui’s “other half” Kuujjuaraapik (region 17). They were likelyallocated to region 18 subsequent to the use of the non-specific “Great-Whale”on the death certificate.
The overall effect is a net underestimation of total deaths by the Ministry (thesame applies to the Module’s in-house register). Mortality statistics should beinterpreted cautiously.
128 Mortalité de la population des huit villages cris de la Baie James, 1987-92. RRSSS-MontrealCentre/Cree Board of Health and Social Services. St-Pierre, M H. 1995 p. 93-103. The study was basedon a review of three sources of mortality data: Quebec Ministry of Health, Public Health Moduleconfidential registry and the JBNQA beneficiary list.
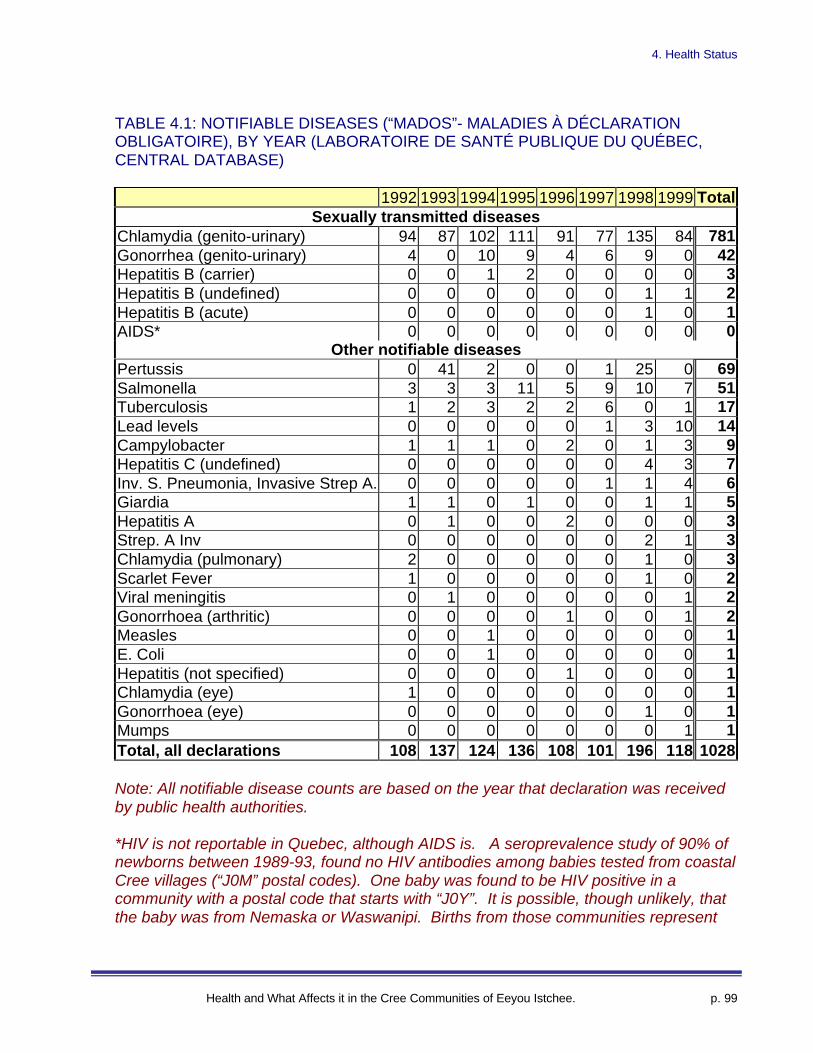
4. Health Status
Health and What Affects it in the Cree Communities of Eeyou Istchee. p. 99
TABLE 4.1: NOTIFIABLE DISEASES (“MADOS”- MALADIES À DÉCLARATIONOBLIGATOIRE), BY YEAR (LABORATOIRE DE SANTÉ PUBLIQUE DU QUÉBEC,CENTRAL DATABASE)
1992 1993 1994 1995 1996 1997 1998 1999 TotalSexually transmitted diseases
Chlamydia (genito-urinary) 94 87 102 111 91 77 135 84 781Gonorrhea (genito-urinary) 4 0 10 9 4 6 9 0 42Hepatitis B (carrier) 0 0 1 2 0 0 0 0 3Hepatitis B (undefined) 0 0 0 0 0 0 1 1 2Hepatitis B (acute) 0 0 0 0 0 0 1 0 1AIDS* 0 0 0 0 0 0 0 0 0
Other notifiable diseasesPertussis 0 41 2 0 0 1 25 0 69Salmonella 3 3 3 11 5 9 10 7 51Tuberculosis 1 2 3 2 2 6 0 1 17Lead levels 0 0 0 0 0 1 3 10 14Campylobacter 1 1 1 0 2 0 1 3 9Hepatitis C (undefined) 0 0 0 0 0 0 4 3 7Inv. S. Pneumonia, Invasive Strep A. 0 0 0 0 0 1 1 4 6Giardia 1 1 0 1 0 0 1 1 5Hepatitis A 0 1 0 0 2 0 0 0 3Strep. A Inv 0 0 0 0 0 0 2 1 3Chlamydia (pulmonary) 2 0 0 0 0 0 1 0 3Scarlet Fever 1 0 0 0 0 0 1 0 2Viral meningitis 0 1 0 0 0 0 0 1 2Gonorrhoea (arthritic) 0 0 0 0 1 0 0 1 2Measles 0 0 1 0 0 0 0 0 1E. Coli 0 0 1 0 0 0 0 0 1Hepatitis (not specified) 0 0 0 0 1 0 0 0 1Chlamydia (eye) 1 0 0 0 0 0 0 0 1Gonorrhoea (eye) 0 0 0 0 0 0 1 0 1Mumps 0 0 0 0 0 0 0 1 1Total, all declarations 108 137 124 136 108 101 196 118 1028
Note: All notifiable disease counts are based on the year that declaration was receivedby public health authorities.
*HIV is not reportable in Quebec, although AIDS is. A seroprevalence study of 90% ofnewborns between 1989-93, found no HIV antibodies among babies tested from coastalCree villages (“J0M” postal codes). One baby was found to be HIV positive in acommunity with a postal code that starts with “J0Y”. It is possible, though unlikely, thatthe baby was from Nemaska or Waswanipi. Births from those communities represent
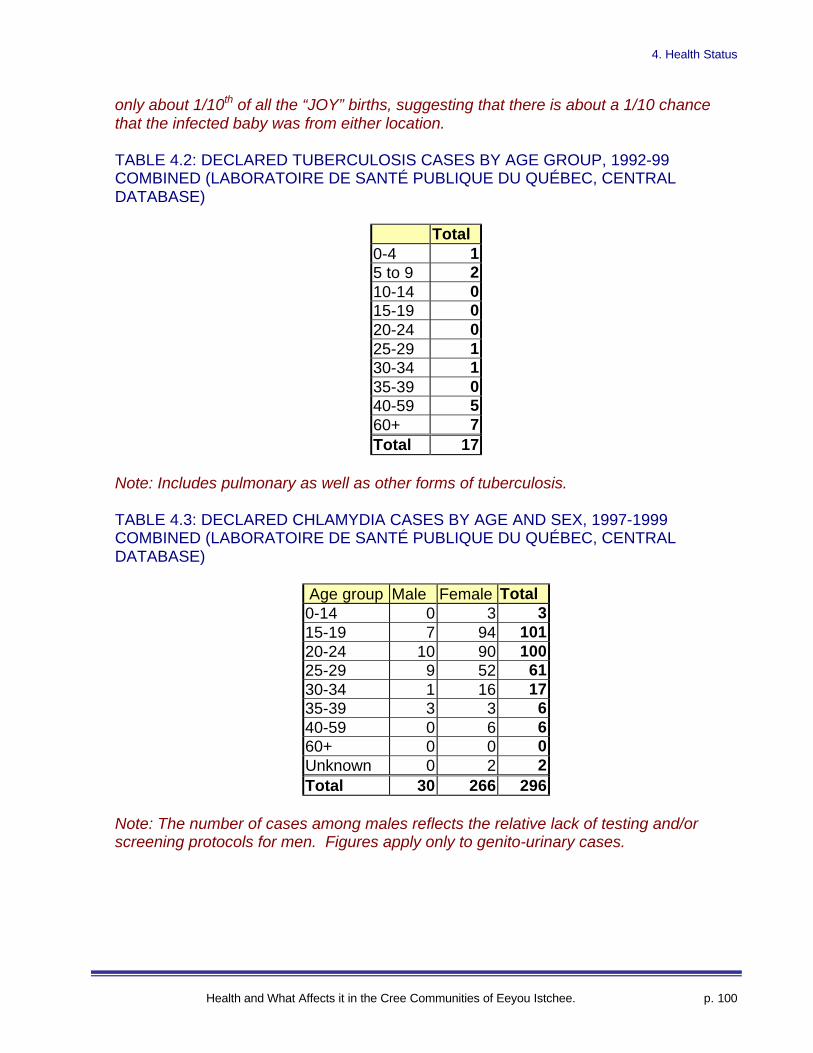
4. Health Status
Health and What Affects it in the Cree Communities of Eeyou Istchee. p. 100
only about 1/10th of all the “JOY” births, suggesting that there is about a 1/10 chancethat the infected baby was from either location.
TABLE 4.2: DECLARED TUBERCULOSIS CASES BY AGE GROUP, 1992-99COMBINED (LABORATOIRE DE SANTÉ PUBLIQUE DU QUÉBEC, CENTRALDATABASE)
Total0-4 15 to 9 210-14 015-19 020-24 025-29 130-34 135-39 040-59 560+ 7Total 17
Note: Includes pulmonary as well as other forms of tuberculosis.
TABLE 4.3: DECLARED CHLAMYDIA CASES BY AGE AND SEX, 1997-1999COMBINED (LABORATOIRE DE SANTÉ PUBLIQUE DU QUÉBEC, CENTRALDATABASE)
Age group Male Female Total0-14 0 3 315-19 7 94 10120-24 10 90 10025-29 9 52 6130-34 1 16 1735-39 3 3 640-59 0 6 660+ 0 0 0Unknown 0 2 2Total 30 266 296
Note: The number of cases among males reflects the relative lack of testing and/orscreening protocols for men. Figures apply only to genito-urinary cases.
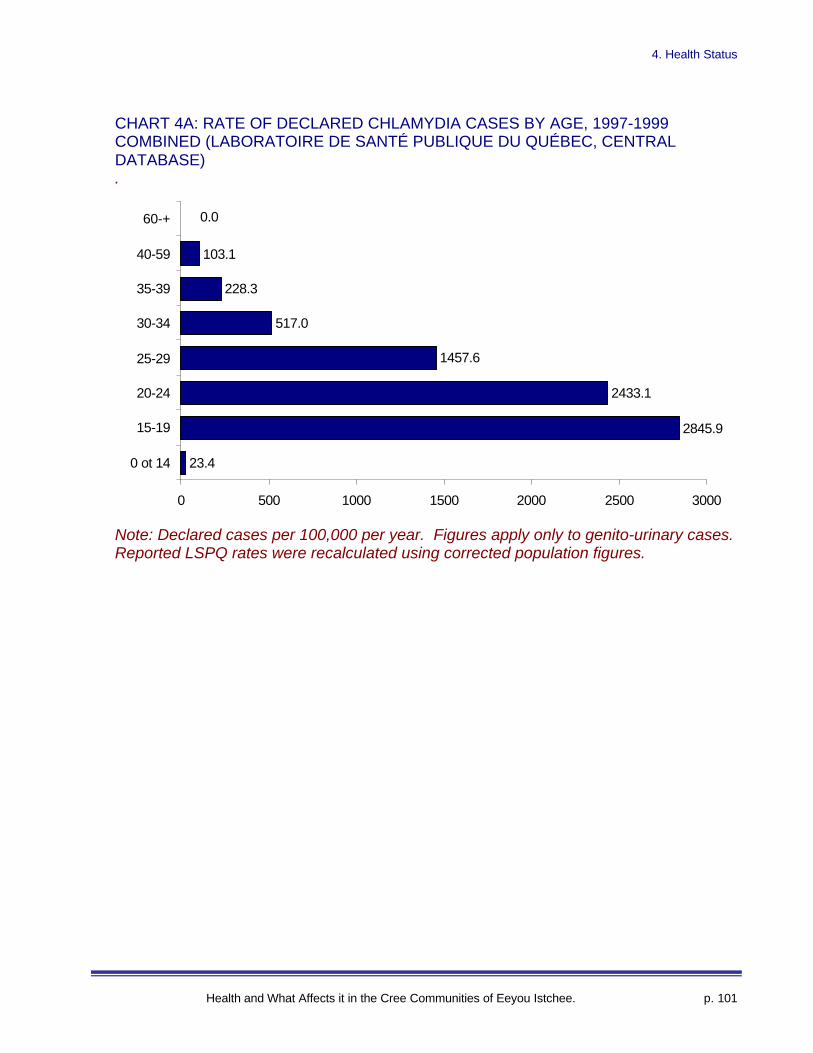
4. Health Status
Health and What Affects it in the Cree Communities of Eeyou Istchee. p. 101
CHART 4A: RATE OF DECLARED CHLAMYDIA CASES BY AGE, 1997-1999COMBINED (LABORATOIRE DE SANTÉ PUBLIQUE DU QUÉBEC, CENTRALDATABASE).
Note: Declared cases per 100,000 per year. Figures apply only to genito-urinary cases.Reported LSPQ rates were recalculated using corrected population figures.
23.4
2845.9
2433.1
1457.6
517.0
228.3
103.1
0.0
0 500 1000 1500 2000 2500 3000
0 ot 14
15-19
20-24
25-29
30-34
35-39
40-59
60-+
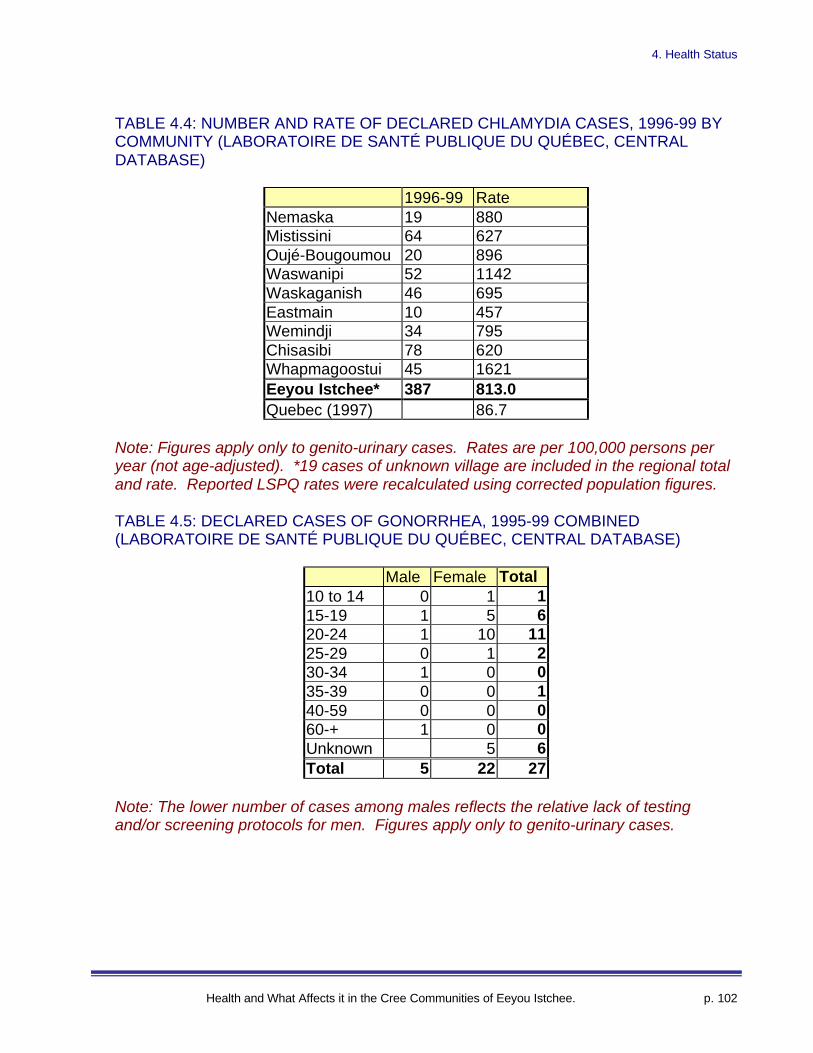
4. Health Status
Health and What Affects it in the Cree Communities of Eeyou Istchee. p. 102
TABLE 4.4: NUMBER AND RATE OF DECLARED CHLAMYDIA CASES, 1996-99 BYCOMMUNITY (LABORATOIRE DE SANTÉ PUBLIQUE DU QUÉBEC, CENTRALDATABASE)
1996-99 RateNemaska 19 880Mistissini 64 627Oujé-Bougoumou 20 896Waswanipi 52 1142Waskaganish 46 695Eastmain 10 457Wemindji 34 795Chisasibi 78 620Whapmagoostui 45 1621Eeyou Istchee* 387 813.0Quebec (1997) 86.7
Note: Figures apply only to genito-urinary cases. Rates are per 100,000 persons peryear (not age-adjusted). *19 cases of unknown village are included in the regional totaland rate. Reported LSPQ rates were recalculated using corrected population figures.
TABLE 4.5: DECLARED CASES OF GONORRHEA, 1995-99 COMBINED(LABORATOIRE DE SANTÉ PUBLIQUE DU QUÉBEC, CENTRAL DATABASE)
Male Female Total10 to 14 0 1 115-19 1 5 620-24 1 10 1125-29 0 1 230-34 1 0 035-39 0 0 140-59 0 0 060-+ 1 0 0Unknown 5 6Total 5 22 27
Note: The lower number of cases among males reflects the relative lack of testingand/or screening protocols for men. Figures apply only to genito-urinary cases.

4. Health Status
Health and What Affects it in the Cree Communities of Eeyou Istchee. p. 103
TABLE 4.6: RATE OF DECLARED GONORRHEA CASES, COMPARED(LABORATOIRE DE SANTÉ PUBLIQUE DU QUÉBEC, CENTRAL DATABASE)
Eeyou Istchee1996-99
Quebec1997
38.7 7.5
Note: Figures apply only to genito-urinary cases. Rates are per 100,000 persons peryear (not age-adjusted. Reported LSPQ rates were recalculated using correctedpopulation figures from the Institut National de la Statistique du Québec.
TABLE 4.7: PERCENT OF POPULATION REPORTING CERTAIN HEALTHPROBLEMS, COMPARED (SANTÉ QUÉBEC HEALTH SURVEY)
Reported problems Nunavik 1992
Cree 1991
Quebec 1987
Hay fever 0.1% 1.1% 6.0%Mental disorders 3.2% 1.9% 7.4%Injuries 0.9% 2.5% 5.0%Skin diseases and allergies 4.7% 4.1% 7.9%High blood pressure 5.2% 4.5% 6.3%Backaches 4.3% 5.0% 7.7%Arthritis or Rheumatism 4.0% 6.3% 10.0%Allergies (excluding hayfever and skin allergies)
5.3% 6.5% 6.5%
Headaches 7.7% 6.6% 8.4%
TABLE 4.8: RATE (PREVALENCE) OF DIAGNOSED DIABETES, 1989, 1991 1997-2000 (CREE BOARD OF HEALTH AND SOCIAL SERVICES OF JAMES BAY, 2000129)
1989* 1991* 1997 1998 1999 2000Number 230 406 607 733 821 890Rate 4.1% 7.1% 8.4% 9.6% 10.3% 11.0%
Note: *Figures from 1989 and 1991 are from studies undertaken prior to the creation ofthe CBHSSJB diabetes register in 1996.
129 Annual Diabetes Update, Eeyou Istchee, May 2000. Cree Board of Health and Social Services ofJames Bay
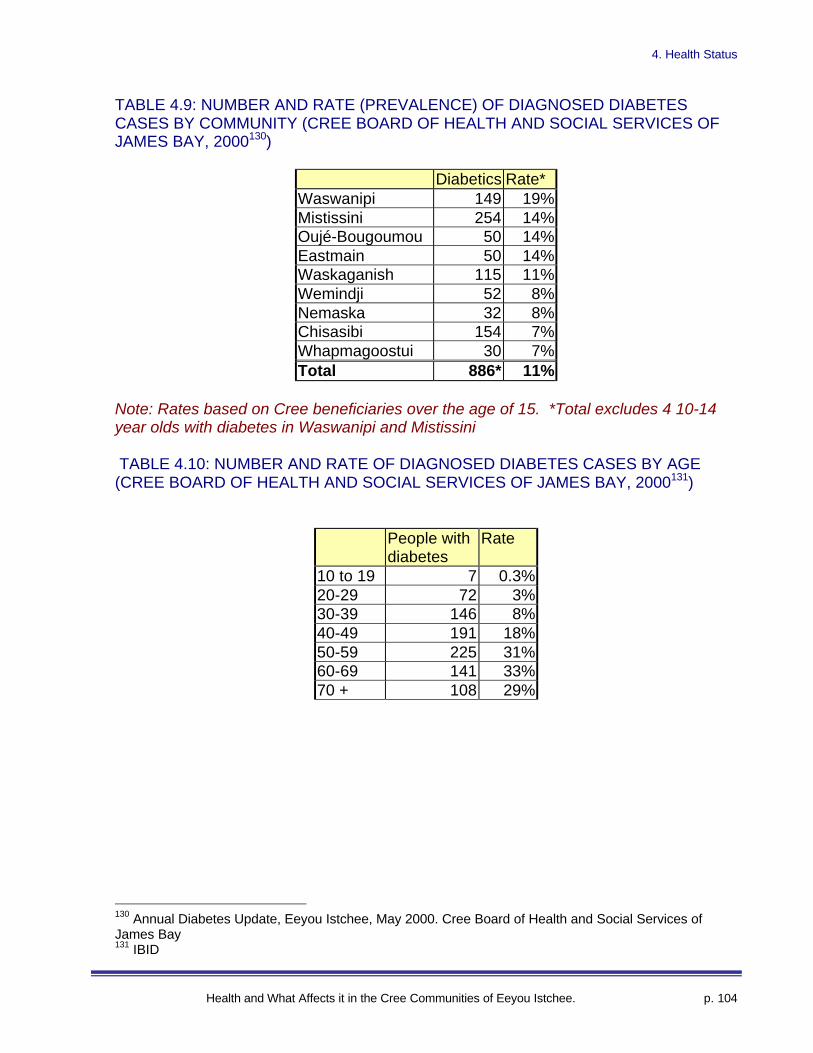
4. Health Status
Health and What Affects it in the Cree Communities of Eeyou Istchee. p. 104
TABLE 4.9: NUMBER AND RATE (PREVALENCE) OF DIAGNOSED DIABETESCASES BY COMMUNITY (CREE BOARD OF HEALTH AND SOCIAL SERVICES OFJAMES BAY, 2000130)
Diabetics Rate*Waswanipi 149 19%Mistissini 254 14%Oujé-Bougoumou 50 14%Eastmain 50 14%Waskaganish 115 11%Wemindji 52 8%Nemaska 32 8%Chisasibi 154 7%Whapmagoostui 30 7%Total 886* 11%
Note: Rates based on Cree beneficiaries over the age of 15. *Total excludes 4 10-14year olds with diabetes in Waswanipi and Mistissini
TABLE 4.10: NUMBER AND RATE OF DIAGNOSED DIABETES CASES BY AGE(CREE BOARD OF HEALTH AND SOCIAL SERVICES OF JAMES BAY, 2000131)
People withdiabetes
Rate
10 to 19 7 0.3%20-29 72 3%30-39 146 8%40-49 191 18%50-59 225 31%60-69 141 33%70 + 108 29%
130 Annual Diabetes Update, Eeyou Istchee, May 2000. Cree Board of Health and Social Services ofJames Bay131 IBID
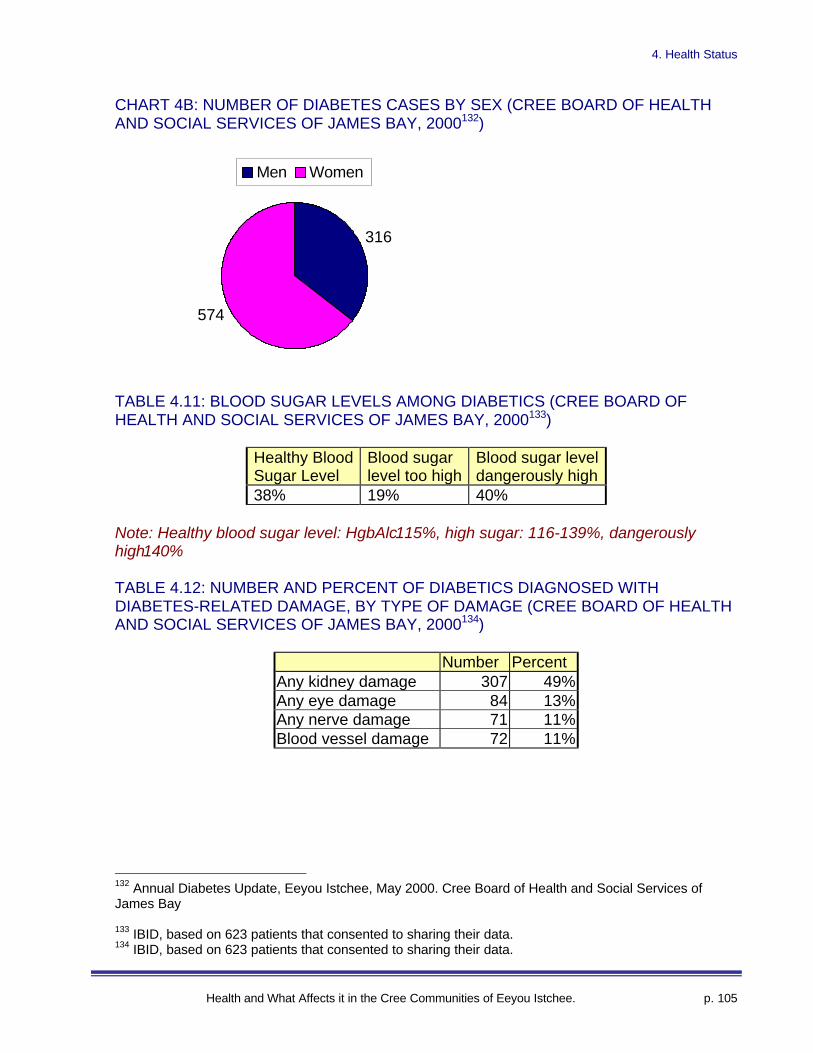
4. Health Status
Health and What Affects it in the Cree Communities of Eeyou Istchee. p. 105
CHART 4B: NUMBER OF DIABETES CASES BY SEX (CREE BOARD OF HEALTHAND SOCIAL SERVICES OF JAMES BAY, 2000132)
TABLE 4.11: BLOOD SUGAR LEVELS AMONG DIABETICS (CREE BOARD OFHEALTH AND SOCIAL SERVICES OF JAMES BAY, 2000133)
Healthy BloodSugar Level
Blood sugarlevel too high
Blood sugar leveldangerously high
38% 19% 40%
Note: Healthy blood sugar level: HgbAlc�115%, high sugar: 116-139%, dangerouslyhigh�140%
TABLE 4.12: NUMBER AND PERCENT OF DIABETICS DIAGNOSED WITHDIABETES-RELATED DAMAGE, BY TYPE OF DAMAGE (CREE BOARD OF HEALTHAND SOCIAL SERVICES OF JAMES BAY, 2000134)
Number PercentAny kidney damage 307 49%Any eye damage 84 13%Any nerve damage 71 11%Blood vessel damage 72 11%
132 Annual Diabetes Update, Eeyou Istchee, May 2000. Cree Board of Health and Social Services ofJames Bay
133 IBID, based on 623 patients that consented to sharing their data.134 IBID, based on 623 patients that consented to sharing their data.
316
574
Men Women
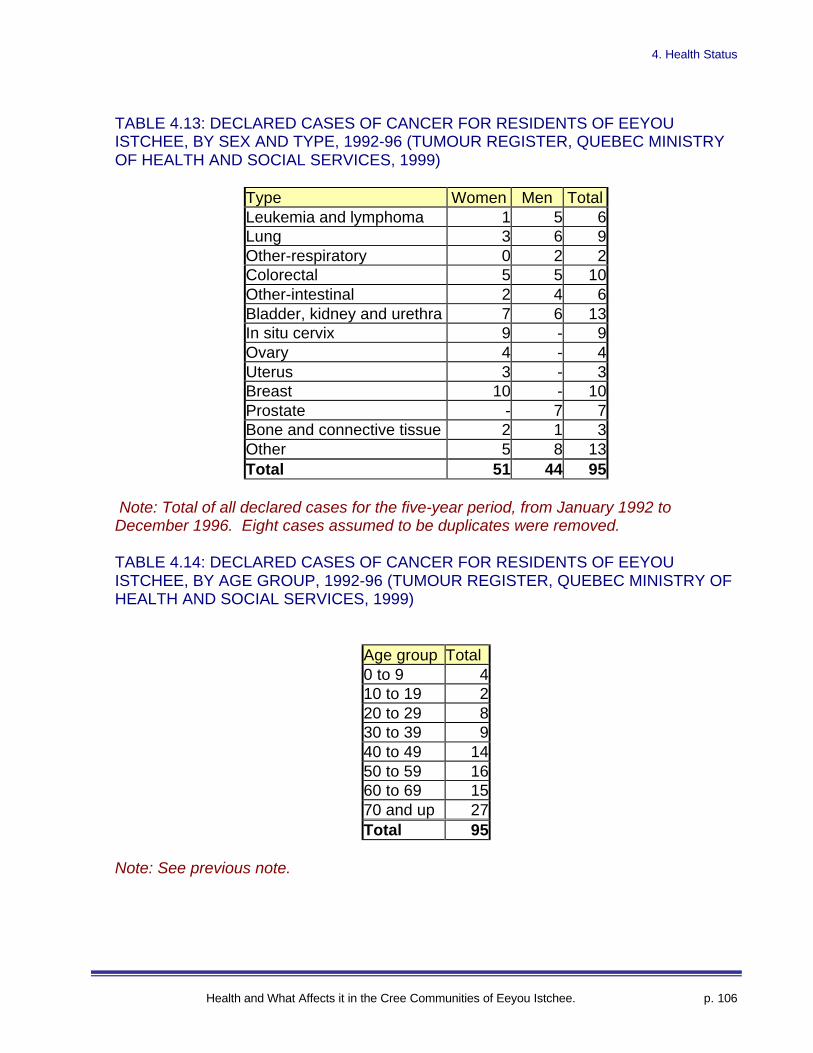
4. Health Status
Health and What Affects it in the Cree Communities of Eeyou Istchee. p. 106
TABLE 4.13: DECLARED CASES OF CANCER FOR RESIDENTS OF EEYOUISTCHEE, BY SEX AND TYPE, 1992-96 (TUMOUR REGISTER, QUEBEC MINISTRYOF HEALTH AND SOCIAL SERVICES, 1999)
Type Women Men TotalLeukemia and lymphoma 1 5 6Lung 3 6 9Other-respiratory 0 2 2Colorectal 5 5 10Other-intestinal 2 4 6Bladder, kidney and urethra 7 6 13In situ cervix 9 - 9Ovary 4 - 4Uterus 3 - 3Breast 10 - 10Prostate - 7 7Bone and connective tissue 2 1 3Other 5 8 13Total 51 44 95
Note: Total of all declared cases for the five-year period, from January 1992 toDecember 1996. Eight cases assumed to be duplicates were removed.
TABLE 4.14: DECLARED CASES OF CANCER FOR RESIDENTS OF EEYOUISTCHEE, BY AGE GROUP, 1992-96 (TUMOUR REGISTER, QUEBEC MINISTRY OFHEALTH AND SOCIAL SERVICES, 1999)
Age group Total0 to 9 410 to 19 220 to 29 830 to 39 940 to 49 1450 to 59 1660 to 69 1570 and up 27Total 95
Note: See previous note.
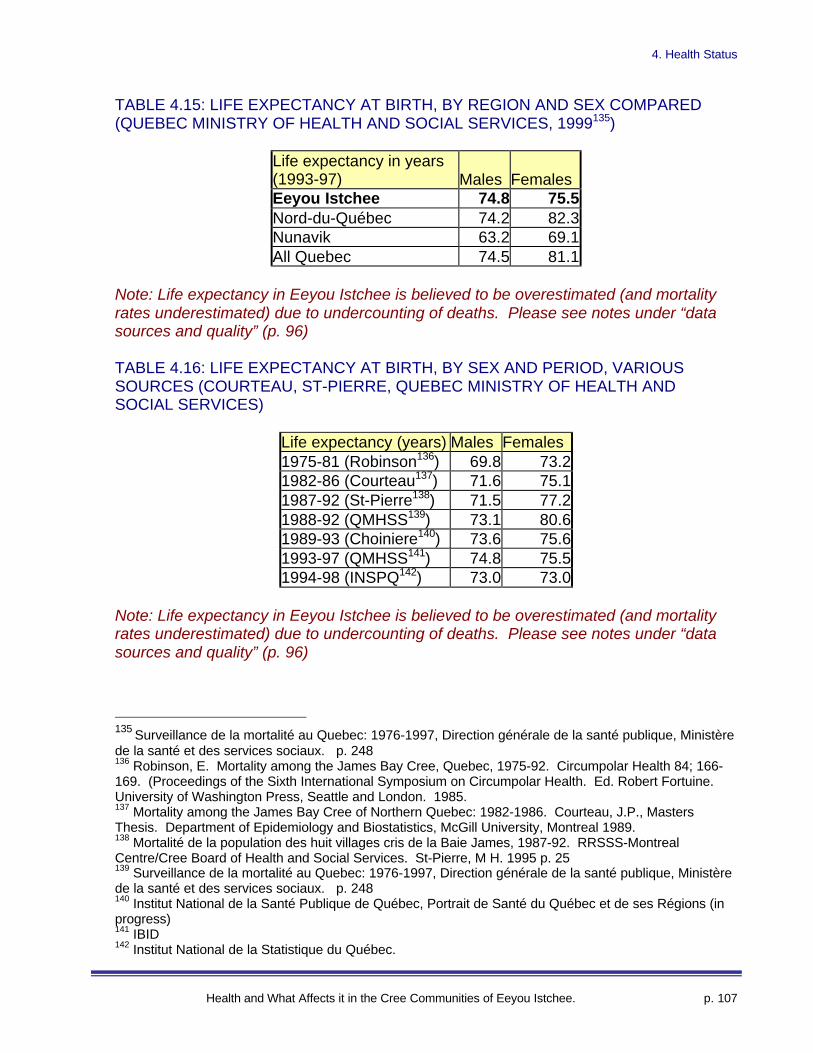
4. Health Status
Health and What Affects it in the Cree Communities of Eeyou Istchee. p. 107
TABLE 4.15: LIFE EXPECTANCY AT BIRTH, BY REGION AND SEX COMPARED(QUEBEC MINISTRY OF HEALTH AND SOCIAL SERVICES, 1999135)
Life expectancy in years(1993-97) Males FemalesEeyou Istchee 74.8 75.5Nord-du-Québec 74.2 82.3Nunavik 63.2 69.1All Quebec 74.5 81.1
Note: Life expectancy in Eeyou Istchee is believed to be overestimated (and mortalityrates underestimated) due to undercounting of deaths. Please see notes under “datasources and quality” (p. 96)
TABLE 4.16: LIFE EXPECTANCY AT BIRTH, BY SEX AND PERIOD, VARIOUSSOURCES (COURTEAU, ST-PIERRE, QUEBEC MINISTRY OF HEALTH ANDSOCIAL SERVICES)
Life expectancy (years) Males Females1975-81 (Robinson136) 69.8 73.21982-86 (Courteau137) 71.6 75.11987-92 (St-Pierre138) 71.5 77.21988-92 (QMHSS139) 73.1 80.61989-93 (Choiniere140) 73.6 75.61993-97 (QMHSS141) 74.8 75.51994-98 (INSPQ142) 73.0 73.0
Note: Life expectancy in Eeyou Istchee is believed to be overestimated (and mortalityrates underestimated) due to undercounting of deaths. Please see notes under “datasources and quality” (p. 96)
135 Surveillance de la mortalité au Quebec: 1976-1997, Direction générale de la santé publique, Ministèrede la santé et des services sociaux. p. 248136 Robinson, E. Mortality among the James Bay Cree, Quebec, 1975-92. Circumpolar Health 84; 166-169. (Proceedings of the Sixth International Symposium on Circumpolar Health. Ed. Robert Fortuine.University of Washington Press, Seattle and London. 1985.137 Mortality among the James Bay Cree of Northern Quebec: 1982-1986. Courteau, J.P., MastersThesis. Department of Epidemiology and Biostatistics, McGill University, Montreal 1989.138 Mortalité de la population des huit villages cris de la Baie James, 1987-92. RRSSS-MontrealCentre/Cree Board of Health and Social Services. St-Pierre, M H. 1995 p. 25139 Surveillance de la mortalité au Quebec: 1976-1997, Direction générale de la santé publique, Ministèrede la santé et des services sociaux. p. 248140 Institut National de la Santé Publique de Québec, Portrait de Santé du Québec et de ses Régions (inprogress)141 IBID142 Institut National de la Statistique du Québec.
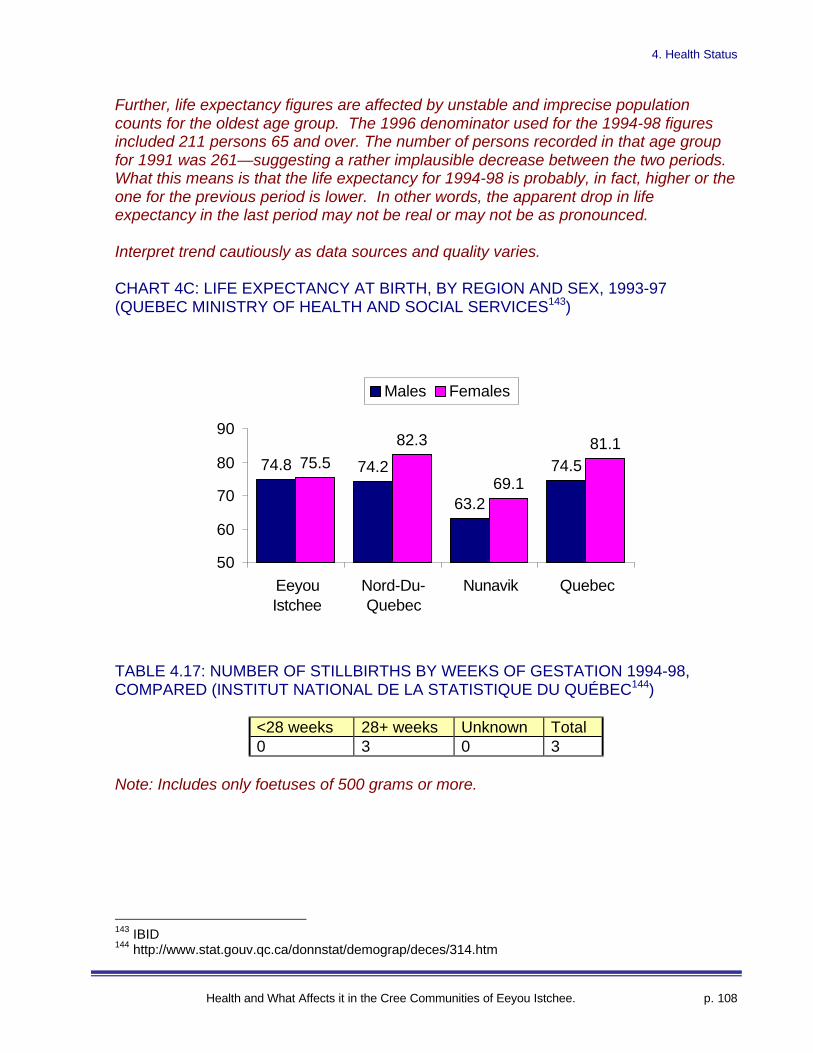
4. Health Status
Health and What Affects it in the Cree Communities of Eeyou Istchee. p. 108
Further, life expectancy figures are affected by unstable and imprecise populationcounts for the oldest age group. The 1996 denominator used for the 1994-98 figuresincluded 211 persons 65 and over. The number of persons recorded in that age groupfor 1991 was 261—suggesting a rather implausible decrease between the two periods.What this means is that the life expectancy for 1994-98 is probably, in fact, higher or theone for the previous period is lower. In other words, the apparent drop in lifeexpectancy in the last period may not be real or may not be as pronounced.
Interpret trend cautiously as data sources and quality varies.
CHART 4C: LIFE EXPECTANCY AT BIRTH, BY REGION AND SEX, 1993-97(QUEBEC MINISTRY OF HEALTH AND SOCIAL SERVICES143)
TABLE 4.17: NUMBER OF STILLBIRTHS BY WEEKS OF GESTATION 1994-98,COMPARED (INSTITUT NATIONAL DE LA STATISTIQUE DU QUÉBEC144)
<28 weeks 28+ weeks Unknown Total0 3 0 3
Note: Includes only foetuses of 500 grams or more.
143 IBID144 http://www.stat.gouv.qc.ca/donnstat/demograp/deces/314.htm
74.8 74.2
63.2
74.575.582.3
69.1
81.1
50
60
70
80
90
EeyouIstchee
Nord-Du-Quebec
Nunavik Quebec
Males Females
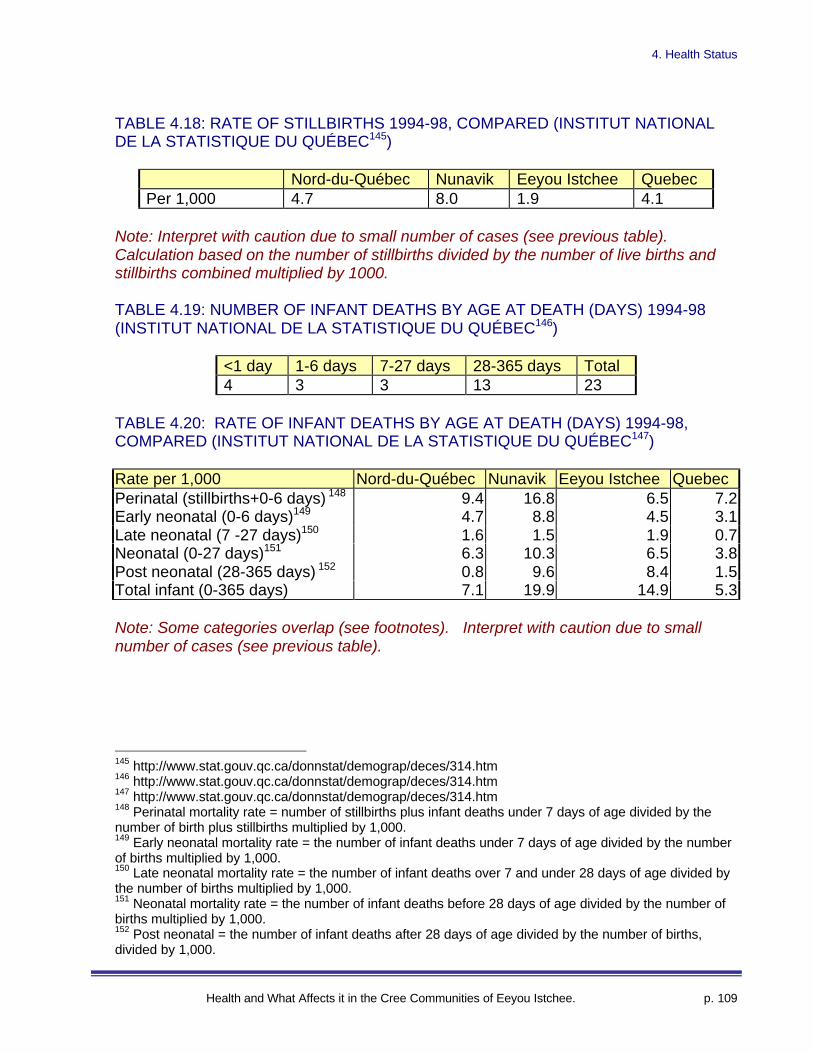
4. Health Status
Health and What Affects it in the Cree Communities of Eeyou Istchee. p. 109
TABLE 4.18: RATE OF STILLBIRTHS 1994-98, COMPARED (INSTITUT NATIONALDE LA STATISTIQUE DU QUÉBEC145)
Nord-du-Québec Nunavik Eeyou Istchee QuebecPer 1,000 4.7 8.0 1.9 4.1
Note: Interpret with caution due to small number of cases (see previous table).Calculation based on the number of stillbirths divided by the number of live births andstillbirths combined multiplied by 1000.
TABLE 4.19: NUMBER OF INFANT DEATHS BY AGE AT DEATH (DAYS) 1994-98(INSTITUT NATIONAL DE LA STATISTIQUE DU QUÉBEC146)
<1 day 1-6 days 7-27 days 28-365 days Total4 3 3 13 23
TABLE 4.20: RATE OF INFANT DEATHS BY AGE AT DEATH (DAYS) 1994-98,COMPARED (INSTITUT NATIONAL DE LA STATISTIQUE DU QUÉBEC147)
Rate per 1,000 Nord-du-Québec Nunavik Eeyou Istchee QuebecPerinatal (stillbirths+0-6 days) 148 9.4 16.8 6.5 7.2Early neonatal (0-6 days)149 4.7 8.8 4.5 3.1Late neonatal (7 -27 days)150 1.6 1.5 1.9 0.7Neonatal (0-27 days)151 6.3 10.3 6.5 3.8Post neonatal (28-365 days) 152 0.8 9.6 8.4 1.5Total infant (0-365 days) 7.1 19.9 14.9 5.3
Note: Some categories overlap (see footnotes). Interpret with caution due to smallnumber of cases (see previous table).
145 http://www.stat.gouv.qc.ca/donnstat/demograp/deces/314.htm146 http://www.stat.gouv.qc.ca/donnstat/demograp/deces/314.htm147 http://www.stat.gouv.qc.ca/donnstat/demograp/deces/314.htm148 Perinatal mortality rate = number of stillbirths plus infant deaths under 7 days of age divided by thenumber of birth plus stillbirths multiplied by 1,000.149 Early neonatal mortality rate = the number of infant deaths under 7 days of age divided by the numberof births multiplied by 1,000.150 Late neonatal mortality rate = the number of infant deaths over 7 and under 28 days of age divided bythe number of births multiplied by 1,000.151 Neonatal mortality rate = the number of infant deaths before 28 days of age divided by the number ofbirths multiplied by 1,000.152 Post neonatal = the number of infant deaths after 28 days of age divided by the number of births,divided by 1,000.

4. Health Status
Health and What Affects it in the Cree Communities of Eeyou Istchee. p. 110
TABLE 4.21: RATE OF INFANT DEATHS BY AGE AT DEATH AND PERIOD (CREEBOARD OF HEALTH AND SOCIAL SERVICES, QUEBEC MINISTRY OF HEALTH,INSTITUT NATIONAL DE LA STATISTIQUE DU QUÉBEC)
Rate per 1,000 Perinatal Neonatal Post-neonatal Infant1975-81 Robinson153 9.6 8.0 29.0 37.01982-86 (Courteau)154 6.8 2.6 14.6 17.21987-92 (St-Pierre)155 6.7 3.1 8.0 11.01994-98 (ISQ)156 6.5 6.5 8.4 14.9
Note: Interpret cautiously as data sources vary and numbers are small. See footnotesfrom previous table for definitions.
153 Robinson, E. Mortality among the James Bay Cree, Quebec, 1975-92. Circumpolar Health 84; 166-169. (Proceedings of the Sixth International Symposium on Circumpolar Health. Ed. Robert Fortuine.University of Washington Press, Seattle and London. 1985.154 Mortality among the James Bay Cree of Northern Quebec: 1982-1986. Courteau, J.P., MastersThesis. Department of Epidemiology and Biostatistics, McGill University, Montreal 1989.155 Mortalité de la population des huit villages cris de la Baie James, 1987-92. RRSSS-MontrealCentre/Cree Board of Health and Social Services St-Pierre, M H. 1995 p. 30156 http://www.stat.gouv.qc.ca/donnstat/demograp/deces/314.htm
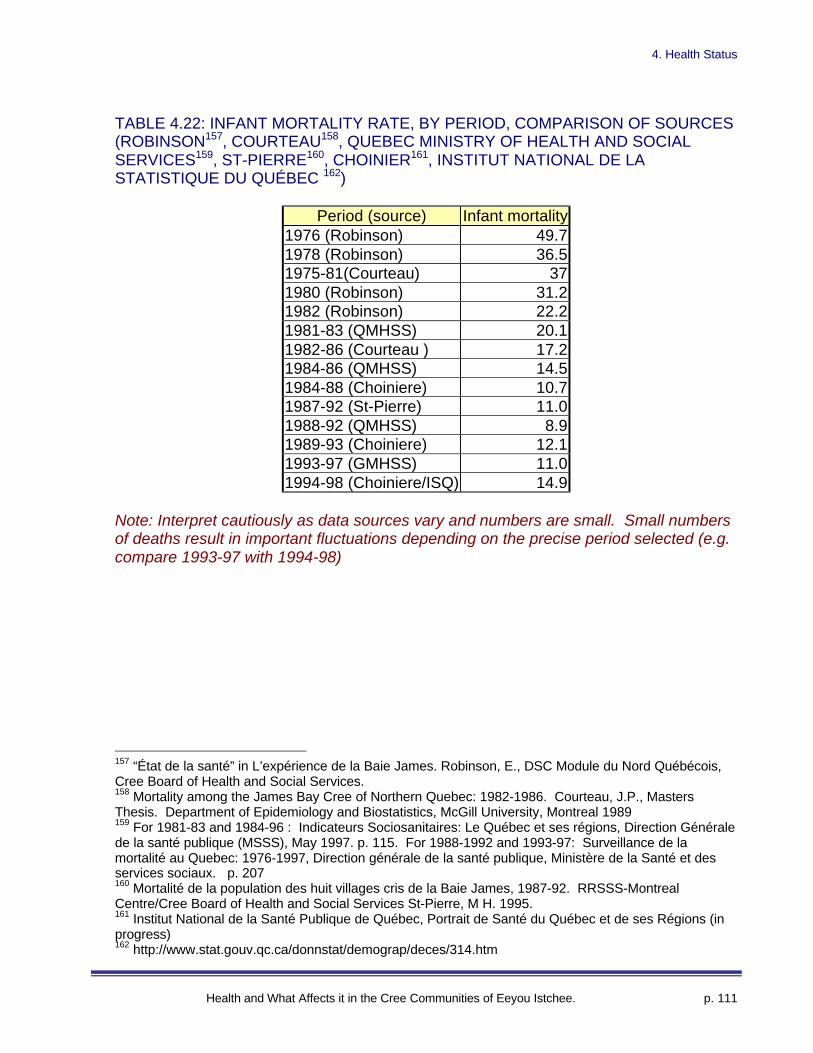
4. Health Status
Health and What Affects it in the Cree Communities of Eeyou Istchee. p. 111
TABLE 4.22: INFANT MORTALITY RATE, BY PERIOD, COMPARISON OF SOURCES(ROBINSON157, COURTEAU158, QUEBEC MINISTRY OF HEALTH AND SOCIALSERVICES159, ST-PIERRE160, CHOINIER161, INSTITUT NATIONAL DE LASTATISTIQUE DU QUÉBEC 162)
Period (source) Infant mortality1976 (Robinson) 49.71978 (Robinson) 36.51975-81(Courteau) 371980 (Robinson) 31.21982 (Robinson) 22.21981-83 (QMHSS) 20.11982-86 (Courteau ) 17.21984-86 (QMHSS) 14.51984-88 (Choiniere) 10.71987-92 (St-Pierre) 11.01988-92 (QMHSS) 8.91989-93 (Choiniere) 12.11993-97 (GMHSS) 11.01994-98 (Choiniere/ISQ) 14.9
Note: Interpret cautiously as data sources vary and numbers are small. Small numbersof deaths result in important fluctuations depending on the precise period selected (e.g.compare 1993-97 with 1994-98)
157 “État de la santé” in L’expérience de la Baie James. Robinson, E., DSC Module du Nord Québécois,Cree Board of Health and Social Services.158 Mortality among the James Bay Cree of Northern Quebec: 1982-1986. Courteau, J.P., MastersThesis. Department of Epidemiology and Biostatistics, McGill University, Montreal 1989159 For 1981-83 and 1984-96 : Indicateurs Sociosanitaires: Le Québec et ses régions, Direction Généralede la santé publique (MSSS), May 1997. p. 115. For 1988-1992 and 1993-97: Surveillance de lamortalité au Quebec: 1976-1997, Direction générale de la santé publique, Ministère de la Santé et desservices sociaux. p. 207160 Mortalité de la population des huit villages cris de la Baie James, 1987-92. RRSSS-MontrealCentre/Cree Board of Health and Social Services St-Pierre, M H. 1995.161 Institut National de la Santé Publique de Québec, Portrait de Santé du Québec et de ses Régions (inprogress)162 http://www.stat.gouv.qc.ca/donnstat/demograp/deces/314.htm

4. Health Status
Health and What Affects it in the Cree Communities of Eeyou Istchee. p. 112
TABLE 4.23: NUMBER OF DEATHS BY CAUSE AND YEAR AMONG RESIDENTS OFEEYOU ISTCHEE, 1990-1997 (QUEBEC MINISTRY OF HEALTH AND SOCIALSERVICES, 1999163)
1990 1991 1992 1993 1994 1995 1996 1997AIDS (042-044) 0 0 0 0 0 0 0 0Cancer (140-208) 4 5 10 4 6 8 10 8 Stomach cancer (151) 1 1 1 0 0 0 0 0 Colon or rectal cancer (153--154) 0 0 1 1 1 0 0 1 Trachea, bronchial or lung cancer (162) 2 2 1 0 2 2 2 5 Breast cancer (women only) (174) 0 0 1 0 0 1 2 0 Cervical and uterine cancer (women only) (180) 0 0 0 0 0 0 0 0 Prostate cancer (men only) (185) 0 1 0 0 1 1 0 0 Leukemia (204-208) 1 0 0 1 0 0 1 0Diabetes mellitus (250) 1 1 2 2 2 2 3 0Circulatory disease (390-459) 10 9 7 8 12 13 4 12 Hypertensive disease (401-405) 0 0 0 0 0 0 0 0 Ischemic myocardiopathy (410-414) 5 2 5 3 3 5 4 6 Cerebro-vascular disease (430-438) 2 3 0 3 6 5 0 2Respiratory disease (460-519) 6 2 4 7 7 6 5 9 Pneumonia and flu (480-487) 2 1 1 2 2 3 0 5 Chronic obstructive pulmonary disease (490-496) 3 1 1 2 1 2 2 4Gastro-intestinal disease (520-579) 1 0 3 4 0 4 1 2 Cirrhosis of the liver (571)164 1 0 1 0 0 1 0 0Congenital anomaly (740-759) 2 0 0 2 0 1 1 1Accident, poisoning, trauma (E800-E999) 8 12 15 8 4 10 3 6 Motor vehicle ((E810-E819) 6 1 5 3 3 4 0 3 Falls (E880-E888) 0 0 0 0 0 1 0 0 Suicide (E950-E959) 2 2 5 2 0 0 1 0 Homicide (E960-E969) 0 0 1 0 0 0 0 0Alcoholism and cirrhosis of the liver (292; 303; 571) 1 0 1 2 1 1 0 0All Other causes 0 3 8 8 7 6 9 11All causes (001-999) 33 32 49 45 39 50 36 49
Note: The number of deaths in Eeyou Istchee is believed to be underestimated due toundercounting of deaths. Please see notes under “data sources and quality” (p. 96)
Numbers in brackets correspond to codes from the International Classification ofDiseases, 9th edition (ICD-9).
163 Surveillance de la mortalité au Quebec: 1976-1997, Direction générale de la santé publique, Ministèrede la Santé et des services sociaux. Compiled from pp.4-200164 There is overlap between the “Cirrhosis of the liver (571)” category and the “Alcoholism and cirrhosisof the liver (292; 303; 571)” category. The totals, though only count those deaths once.
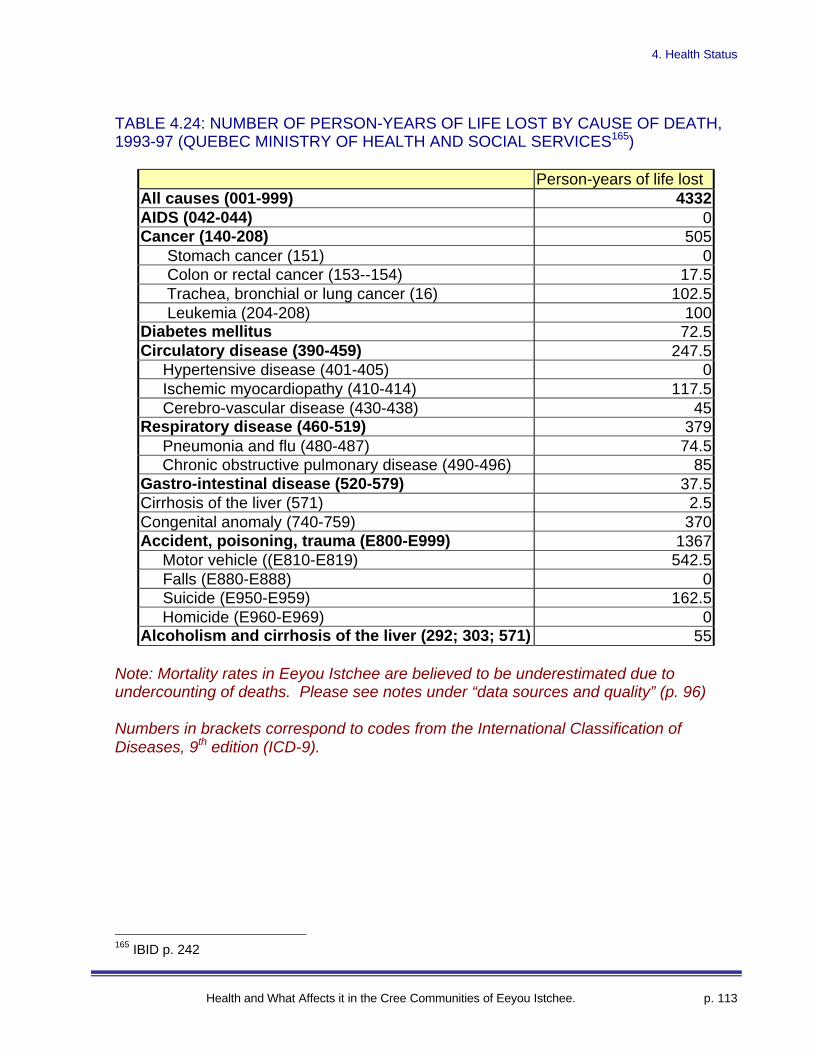
4. Health Status
Health and What Affects it in the Cree Communities of Eeyou Istchee. p. 113
TABLE 4.24: NUMBER OF PERSON-YEARS OF LIFE LOST BY CAUSE OF DEATH,1993-97 (QUEBEC MINISTRY OF HEALTH AND SOCIAL SERVICES165)
Person-years of life lostAll causes (001-999) 4332AIDS (042-044) 0Cancer (140-208) 505 Stomach cancer (151) 0 Colon or rectal cancer (153--154) 17.5 Trachea, bronchial or lung cancer (16) 102.5 Leukemia (204-208) 100Diabetes mellitus 72.5Circulatory disease (390-459) 247.5 Hypertensive disease (401-405) 0 Ischemic myocardiopathy (410-414) 117.5 Cerebro-vascular disease (430-438) 45Respiratory disease (460-519) 379 Pneumonia and flu (480-487) 74.5 Chronic obstructive pulmonary disease (490-496) 85Gastro-intestinal disease (520-579) 37.5Cirrhosis of the liver (571) 2.5Congenital anomaly (740-759) 370Accident, poisoning, trauma (E800-E999) 1367 Motor vehicle ((E810-E819) 542.5 Falls (E880-E888) 0 Suicide (E950-E959) 162.5 Homicide (E960-E969) 0Alcoholism and cirrhosis of the liver (292; 303; 571) 55
Note: Mortality rates in Eeyou Istchee are believed to be underestimated due toundercounting of deaths. Please see notes under “data sources and quality” (p. 96)
Numbers in brackets correspond to codes from the International Classification ofDiseases, 9th edition (ICD-9).
165 IBID p. 242
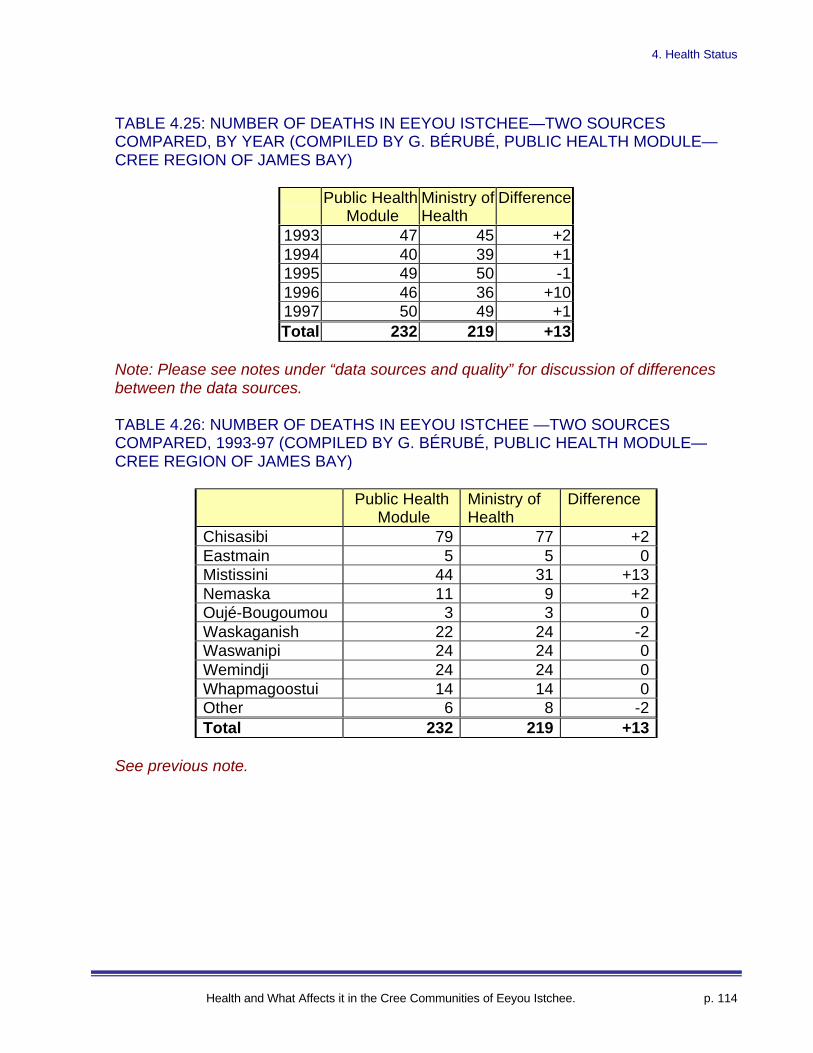
4. Health Status
Health and What Affects it in the Cree Communities of Eeyou Istchee. p. 114
TABLE 4.25: NUMBER OF DEATHS IN EEYOU ISTCHEE—TWO SOURCESCOMPARED, BY YEAR (COMPILED BY G. BÉRUBÉ, PUBLIC HEALTH MODULE—CREE REGION OF JAMES BAY)
Public Health Module
Ministry ofHealth
Difference
1993 47 45 +21994 40 39 +11995 49 50 -11996 46 36 +101997 50 49 +1Total 232 219 +13
Note: Please see notes under “data sources and quality” for discussion of differencesbetween the data sources.
TABLE 4.26: NUMBER OF DEATHS IN EEYOU ISTCHEE —TWO SOURCESCOMPARED, 1993-97 (COMPILED BY G. BÉRUBÉ, PUBLIC HEALTH MODULE—CREE REGION OF JAMES BAY)
Public Health Module
Ministry ofHealth
Difference
Chisasibi 79 77 +2Eastmain 5 5 0Mistissini 44 31 +13Nemaska 11 9 +2Oujé-Bougoumou 3 3 0Waskaganish 22 24 -2Waswanipi 24 24 0Wemindji 24 24 0Whapmagoostui 14 14 0Other 6 8 -2Total 232 219 +13
See previous note.

4. Health Status
Health and What Affects it in the Cree Communities of Eeyou Istchee. p. 115
TABLE 4.27: DOCUMENTED SUICIDE COUNTS, COMPARISON OF SOURCES(PUBLIC HEALTH MODULE— CREE REGION OF JAMES BAY 166)
Public Health Module167
QMHSS168
Courteau169 Damestoy170 &Barss171
1982-86 3 3 31982-91 9 8 101987-92 9 101982-96 17 16
Note: The Public Health Module— Cree Region of James Bay and Quebec Ministry ofHealth and Social Services counts are available separately for each year. Othersources report data for specific periods. Direct comparisons are available when theperiods overlap.
166 Extracted from a more detailed accounting: “Paper 1: Distribution of suicides among Creecommunities, 1981-1997. Jill Torrie. Public Health Module Cree Region Jan. 13, 1999.167 In-house records.168 Surveillance de la mortalité au Quebec: 1976-1997, Direction générale de la santé publique, Ministèrede la santé et des services sociaux and Profil des traumatismes au Québec : mise à jour, 1991 à 1995.Direction de la santé publique de Montréal-Centre.169 Mortality among the James Bay Cree of Northern Quebec: 1982-1986. Courteau, J.P., MastersThesis. Department of Epidemiology and Biostatistics, McGill University, Montreal 1989.170 Department of Epidemiology and Biostatistics, McGill University, Montreal.171 Suicide and parasuicide among the Cree of eastern James Bay, Canada: circumstances andprevention. Special Research Report, Barss, P., Cree Board of Health and Social Services.
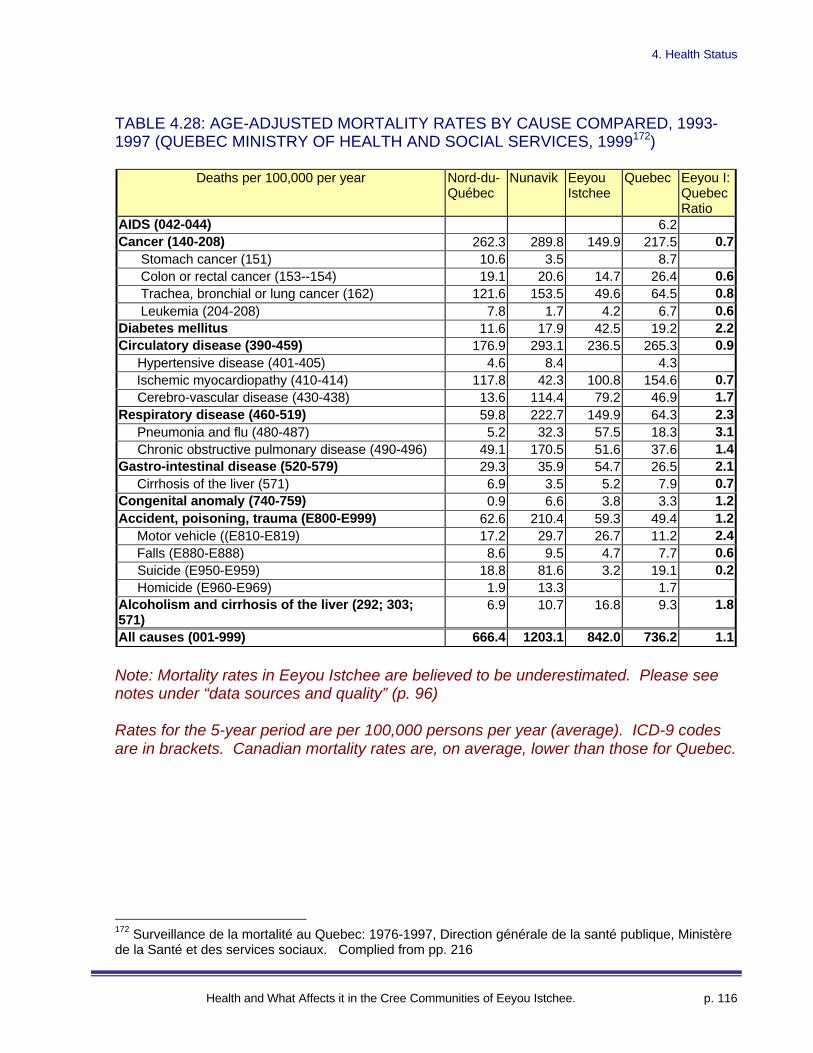
4. Health Status
Health and What Affects it in the Cree Communities of Eeyou Istchee. p. 116
TABLE 4.28: AGE-ADJUSTED MORTALITY RATES BY CAUSE COMPARED, 1993-1997 (QUEBEC MINISTRY OF HEALTH AND SOCIAL SERVICES, 1999172)
Deaths per 100,000 per year Nord-du-Québec
Nunavik EeyouIstchee
Quebec Eeyou I:QuebecRatio
AIDS (042-044) 6.2Cancer (140-208) 262.3 289.8 149.9 217.5 0.7 Stomach cancer (151) 10.6 3.5 8.7 Colon or rectal cancer (153--154) 19.1 20.6 14.7 26.4 0.6 Trachea, bronchial or lung cancer (162) 121.6 153.5 49.6 64.5 0.8 Leukemia (204-208) 7.8 1.7 4.2 6.7 0.6Diabetes mellitus 11.6 17.9 42.5 19.2 2.2Circulatory disease (390-459) 176.9 293.1 236.5 265.3 0.9 Hypertensive disease (401-405) 4.6 8.4 4.3 Ischemic myocardiopathy (410-414) 117.8 42.3 100.8 154.6 0.7 Cerebro-vascular disease (430-438) 13.6 114.4 79.2 46.9 1.7Respiratory disease (460-519) 59.8 222.7 149.9 64.3 2.3 Pneumonia and flu (480-487) 5.2 32.3 57.5 18.3 3.1 Chronic obstructive pulmonary disease (490-496) 49.1 170.5 51.6 37.6 1.4Gastro-intestinal disease (520-579) 29.3 35.9 54.7 26.5 2.1 Cirrhosis of the liver (571) 6.9 3.5 5.2 7.9 0.7Congenital anomaly (740-759) 0.9 6.6 3.8 3.3 1.2Accident, poisoning, trauma (E800-E999) 62.6 210.4 59.3 49.4 1.2 Motor vehicle ((E810-E819) 17.2 29.7 26.7 11.2 2.4 Falls (E880-E888) 8.6 9.5 4.7 7.7 0.6 Suicide (E950-E959) 18.8 81.6 3.2 19.1 0.2 Homicide (E960-E969) 1.9 13.3 1.7Alcoholism and cirrhosis of the liver (292; 303;571)
6.9 10.7 16.8 9.3 1.8
All causes (001-999) 666.4 1203.1 842.0 736.2 1.1
Note: Mortality rates in Eeyou Istchee are believed to be underestimated. Please seenotes under “data sources and quality” (p. 96)
Rates for the 5-year period are per 100,000 persons per year (average). ICD-9 codesare in brackets. Canadian mortality rates are, on average, lower than those for Quebec.
172 Surveillance de la mortalité au Quebec: 1976-1997, Direction générale de la santé publique, Ministèrede la Santé et des services sociaux. Complied from pp. 216
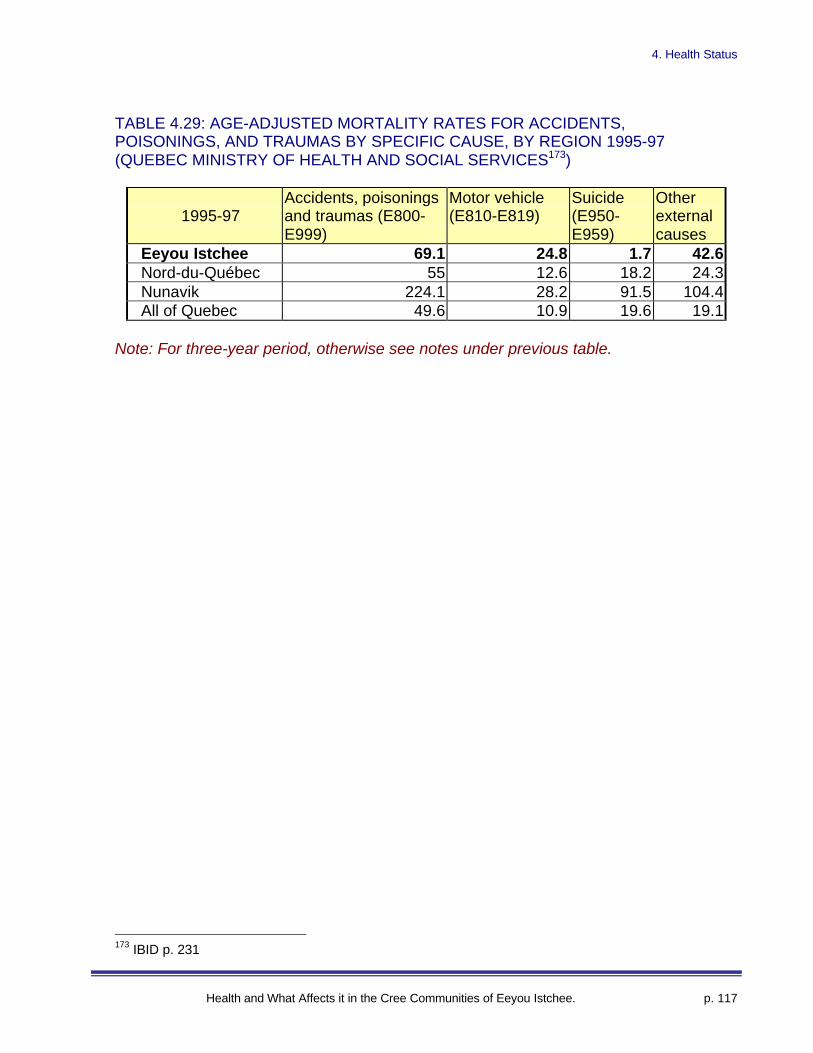
4. Health Status
Health and What Affects it in the Cree Communities of Eeyou Istchee. p. 117
TABLE 4.29: AGE-ADJUSTED MORTALITY RATES FOR ACCIDENTS,POISONINGS, AND TRAUMAS BY SPECIFIC CAUSE, BY REGION 1995-97(QUEBEC MINISTRY OF HEALTH AND SOCIAL SERVICES173)
1995-97Accidents, poisoningsand traumas (E800-E999)
Motor vehicle(E810-E819)
Suicide(E950-E959)
Otherexternalcauses
Eeyou Istchee 69.1 24.8 1.7 42.6Nord-du-Québec 55 12.6 18.2 24.3Nunavik 224.1 28.2 91.5 104.4All of Quebec 49.6 10.9 19.6 19.1
Note: For three-year period, otherwise see notes under previous table.
173 IBID p. 231
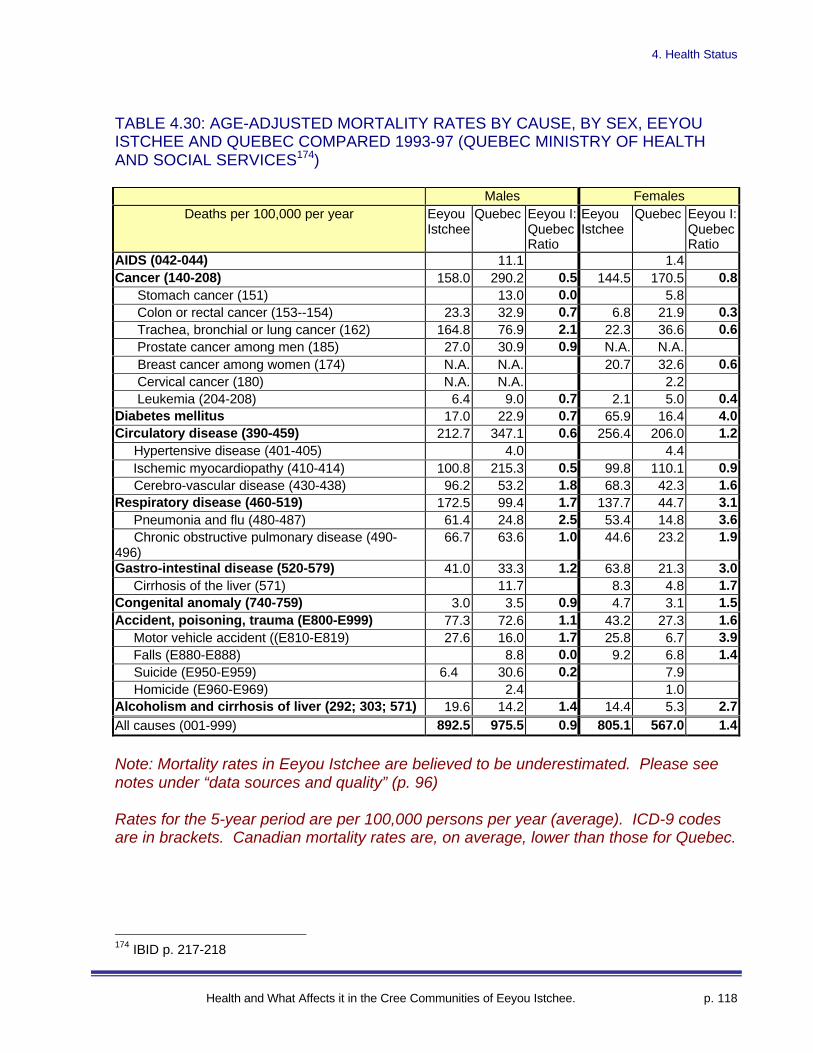
4. Health Status
Health and What Affects it in the Cree Communities of Eeyou Istchee. p. 118
TABLE 4.30: AGE-ADJUSTED MORTALITY RATES BY CAUSE, BY SEX, EEYOUISTCHEE AND QUEBEC COMPARED 1993-97 (QUEBEC MINISTRY OF HEALTHAND SOCIAL SERVICES174)
Males FemalesDeaths per 100,000 per year Eeyou
IstcheeQuebec Eeyou I:
QuebecRatio
EeyouIstchee
Quebec Eeyou I:QuebecRatio
AIDS (042-044) 11.1 1.4Cancer (140-208) 158.0 290.2 0.5 144.5 170.5 0.8 Stomach cancer (151) 13.0 0.0 5.8 Colon or rectal cancer (153--154) 23.3 32.9 0.7 6.8 21.9 0.3 Trachea, bronchial or lung cancer (162) 164.8 76.9 2.1 22.3 36.6 0.6 Prostate cancer among men (185) 27.0 30.9 0.9 N.A. N.A. Breast cancer among women (174) N.A. N.A. 20.7 32.6 0.6 Cervical cancer (180) N.A. N.A. 2.2 Leukemia (204-208) 6.4 9.0 0.7 2.1 5.0 0.4Diabetes mellitus 17.0 22.9 0.7 65.9 16.4 4.0Circulatory disease (390-459) 212.7 347.1 0.6 256.4 206.0 1.2 Hypertensive disease (401-405) 4.0 4.4 Ischemic myocardiopathy (410-414) 100.8 215.3 0.5 99.8 110.1 0.9 Cerebro-vascular disease (430-438) 96.2 53.2 1.8 68.3 42.3 1.6Respiratory disease (460-519) 172.5 99.4 1.7 137.7 44.7 3.1 Pneumonia and flu (480-487) 61.4 24.8 2.5 53.4 14.8 3.6 Chronic obstructive pulmonary disease (490-496)
66.7 63.6 1.0 44.6 23.2 1.9
Gastro-intestinal disease (520-579) 41.0 33.3 1.2 63.8 21.3 3.0 Cirrhosis of the liver (571) 11.7 8.3 4.8 1.7Congenital anomaly (740-759) 3.0 3.5 0.9 4.7 3.1 1.5Accident, poisoning, trauma (E800-E999) 77.3 72.6 1.1 43.2 27.3 1.6 Motor vehicle accident ((E810-E819) 27.6 16.0 1.7 25.8 6.7 3.9 Falls (E880-E888) 8.8 0.0 9.2 6.8 1.4 Suicide (E950-E959) 6.4 30.6 0.2 7.9 Homicide (E960-E969) 2.4 1.0Alcoholism and cirrhosis of liver (292; 303; 571) 19.6 14.2 1.4 14.4 5.3 2.7All causes (001-999) 892.5 975.5 0.9 805.1 567.0 1.4
Note: Mortality rates in Eeyou Istchee are believed to be underestimated. Please seenotes under “data sources and quality” (p. 96)
Rates for the 5-year period are per 100,000 persons per year (average). ICD-9 codesare in brackets. Canadian mortality rates are, on average, lower than those for Quebec.
174 IBID p. 217-218
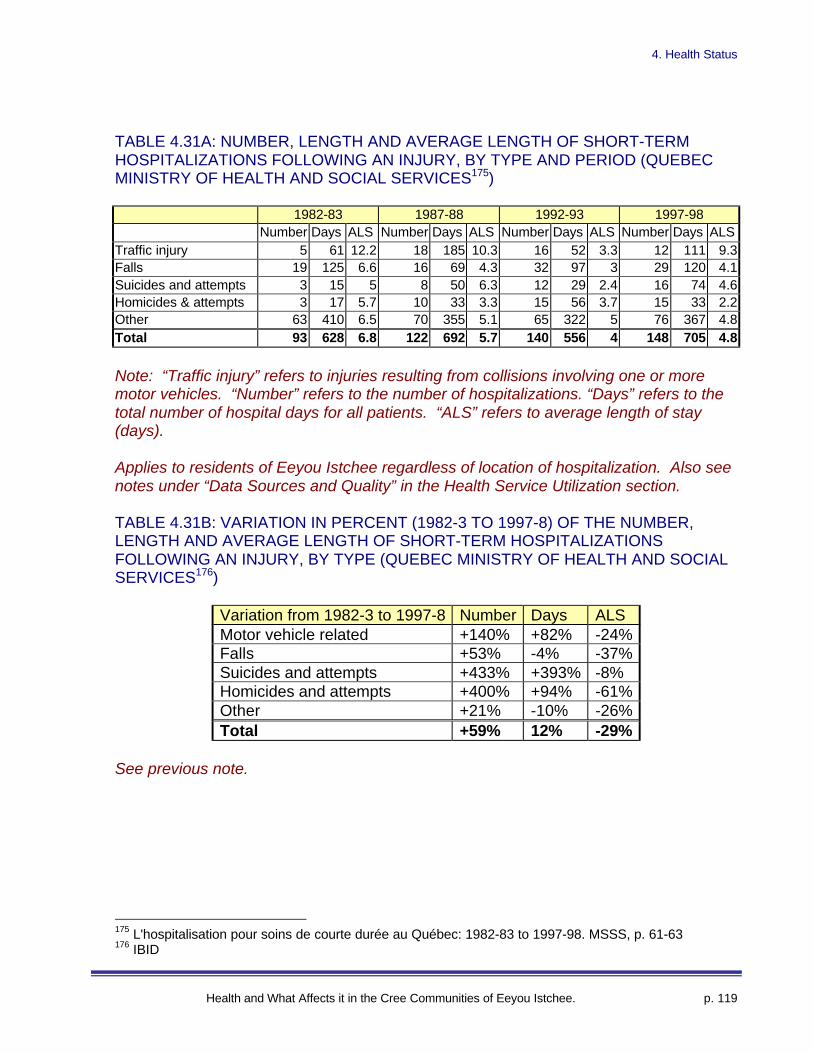
4. Health Status
Health and What Affects it in the Cree Communities of Eeyou Istchee. p. 119
TABLE 4.31A: NUMBER, LENGTH AND AVERAGE LENGTH OF SHORT-TERMHOSPITALIZATIONS FOLLOWING AN INJURY, BY TYPE AND PERIOD (QUEBECMINISTRY OF HEALTH AND SOCIAL SERVICES175)
1982-83 1987-88 1992-93 1997-98Number Days ALS Number Days ALS Number Days ALS Number Days ALS
Traffic injury 5 61 12.2 18 185 10.3 16 52 3.3 12 111 9.3Falls 19 125 6.6 16 69 4.3 32 97 3 29 120 4.1Suicides and attempts 3 15 5 8 50 6.3 12 29 2.4 16 74 4.6Homicides & attempts 3 17 5.7 10 33 3.3 15 56 3.7 15 33 2.2Other 63 410 6.5 70 355 5.1 65 322 5 76 367 4.8Total 93 628 6.8 122 692 5.7 140 556 4 148 705 4.8
Note: “Traffic injury” refers to injuries resulting from collisions involving one or moremotor vehicles. “Number” refers to the number of hospitalizations. “Days” refers to thetotal number of hospital days for all patients. “ALS” refers to average length of stay(days).
Applies to residents of Eeyou Istchee regardless of location of hospitalization. Also seenotes under “Data Sources and Quality” in the Health Service Utilization section.
TABLE 4.31B: VARIATION IN PERCENT (1982-3 TO 1997-8) OF THE NUMBER,LENGTH AND AVERAGE LENGTH OF SHORT-TERM HOSPITALIZATIONSFOLLOWING AN INJURY, BY TYPE (QUEBEC MINISTRY OF HEALTH AND SOCIALSERVICES176)
Variation from 1982-3 to 1997-8 Number Days ALSMotor vehicle related +140% +82% -24%Falls +53% -4% -37%Suicides and attempts +433% +393% -8%Homicides and attempts +400% +94% -61%Other +21% -10% -26%Total +59% 12% -29%
See previous note.
175 L'hospitalisation pour soins de courte durée au Québec: 1982-83 to 1997-98. MSSS, p. 61-63176 IBID
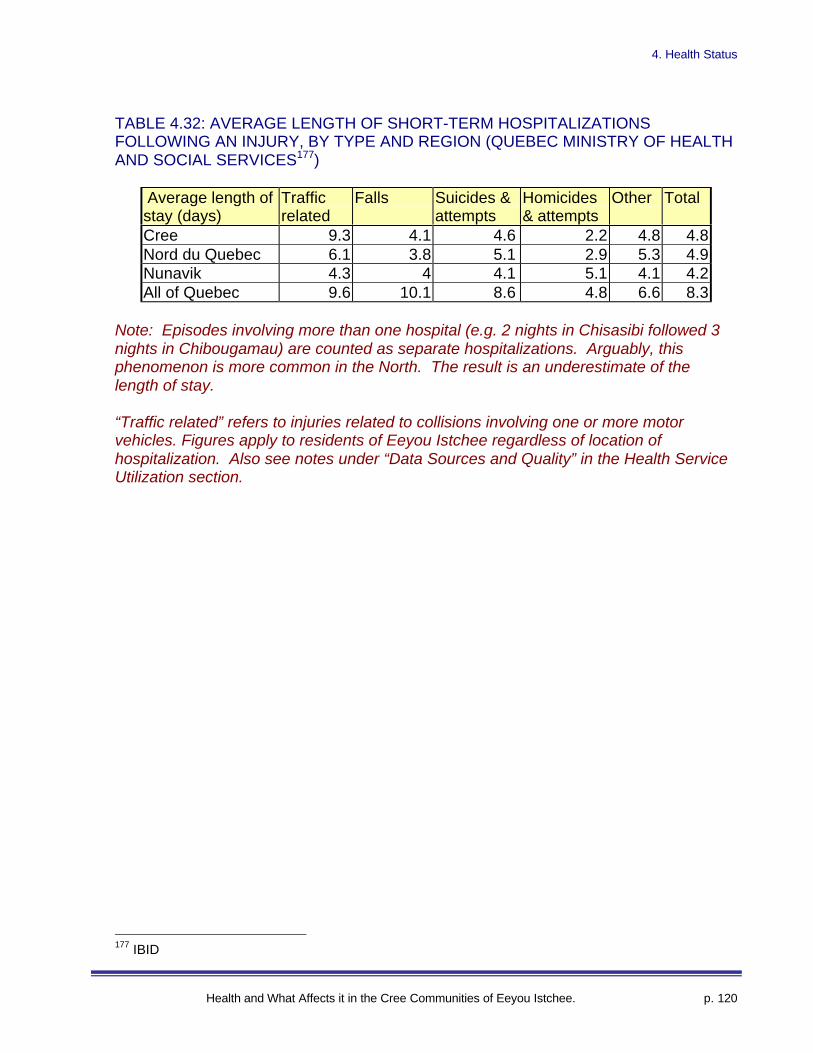
4. Health Status
Health and What Affects it in the Cree Communities of Eeyou Istchee. p. 120
TABLE 4.32: AVERAGE LENGTH OF SHORT-TERM HOSPITALIZATIONSFOLLOWING AN INJURY, BY TYPE AND REGION (QUEBEC MINISTRY OF HEALTHAND SOCIAL SERVICES177)
Average length ofstay (days)
Trafficrelated
Falls Suicides &attempts
Homicides& attempts
Other Total
Cree 9.3 4.1 4.6 2.2 4.8 4.8Nord du Quebec 6.1 3.8 5.1 2.9 5.3 4.9Nunavik 4.3 4 4.1 5.1 4.1 4.2All of Quebec 9.6 10.1 8.6 4.8 6.6 8.3
Note: Episodes involving more than one hospital (e.g. 2 nights in Chisasibi followed 3nights in Chibougamau) are counted as separate hospitalizations. Arguably, thisphenomenon is more common in the North. The result is an underestimate of thelength of stay.
“Traffic related” refers to injuries related to collisions involving one or more motorvehicles. Figures apply to residents of Eeyou Istchee regardless of location ofhospitalization. Also see notes under “Data Sources and Quality” in the Health ServiceUtilization section.
177 IBID
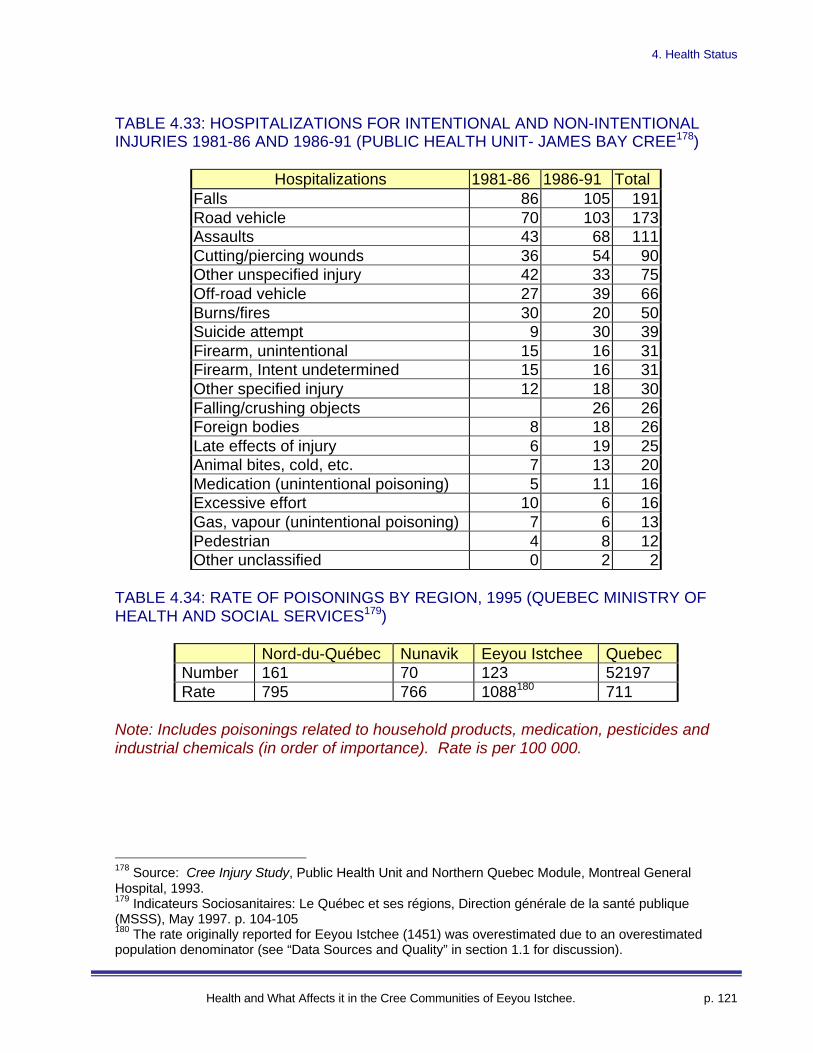
4. Health Status
Health and What Affects it in the Cree Communities of Eeyou Istchee. p. 121
TABLE 4.33: HOSPITALIZATIONS FOR INTENTIONAL AND NON-INTENTIONALINJURIES 1981-86 AND 1986-91 (PUBLIC HEALTH UNIT- JAMES BAY CREE178)
Hospitalizations 1981-86 1986-91 TotalFalls 86 105 191Road vehicle 70 103 173Assaults 43 68 111Cutting/piercing wounds 36 54 90Other unspecified injury 42 33 75Off-road vehicle 27 39 66Burns/fires 30 20 50Suicide attempt 9 30 39Firearm, unintentional 15 16 31Firearm, Intent undetermined 15 16 31Other specified injury 12 18 30Falling/crushing objects 26 26Foreign bodies 8 18 26Late effects of injury 6 19 25Animal bites, cold, etc. 7 13 20Medication (unintentional poisoning) 5 11 16Excessive effort 10 6 16Gas, vapour (unintentional poisoning) 7 6 13Pedestrian 4 8 12Other unclassified 0 2 2
TABLE 4.34: RATE OF POISONINGS BY REGION, 1995 (QUEBEC MINISTRY OFHEALTH AND SOCIAL SERVICES179)
Nord-du-Québec Nunavik Eeyou Istchee QuebecNumber 161 70 123 52197Rate 795 766 1088180 711
Note: Includes poisonings related to household products, medication, pesticides andindustrial chemicals (in order of importance). Rate is per 100 000.
178 Source: Cree Injury Study, Public Health Unit and Northern Quebec Module, Montreal GeneralHospital, 1993.179 Indicateurs Sociosanitaires: Le Québec et ses régions, Direction générale de la santé publique(MSSS), May 1997. p. 104-105180 The rate originally reported for Eeyou Istchee (1451) was overestimated due to an overestimatedpopulation denominator (see “Data Sources and Quality” in section 1.1 for discussion).
Copyright © 2022 FDOKUMEN