Dielectric investigations on a bent-core liquid crystal
9
Dielectric investigations on a bent-core liquid crystal Lucia Marino, Andrei Th. Ionescu, Salvatore Marino, and Nicola Scaramuzza Citation: J. Appl. Phys. 112, 114113 (2012); doi: 10.1063/1.4767915 View online: http://dx.doi.org/10.1063/1.4767915 View Table of Contents: http://jap.aip.org/resource/1/JAPIAU/v112/i11 Published by the American Institute of Physics. Related Articles Numerical simulations of electrostatic interactions between an atomic force microscopy tip and a dielectric sample in presence of buried nano-particles J. Appl. Phys. 112, 114313 (2012) Study of magnetodielectric effect in hexagonal Ho1−xDyxMnO3 J. Appl. Phys. 112, 104116 (2012) Dielectric, magnetic, and thermodynamic properties of Y1−xSrxMnO3 (x=0.1 and 0.2) J. Appl. Phys. 112, 104115 (2012) Critical electrical behaviors of finger-sensing metal/polymer composites near the percolation threshold Appl. Phys. Lett. 101, 211904 (2012) Lateral resolution improvement in scanning nonlinear dielectric microscopy by measuring super-higher-order nonlinear dielectric constants Appl. Phys. Lett. 101, 213112 (2012) Additional information on J. Appl. Phys. Journal Homepage: http://jap.aip.org/ Journal Information: http://jap.aip.org/about/about_the_journal Top downloads: http://jap.aip.org/features/most_downloaded Information for Authors: http://jap.aip.org/authors
-
Upload
independent -
Category
Documents
-
view
1 -
download
0
Transcript of Dielectric investigations on a bent-core liquid crystal
Dielectric investigations on a bent-core liquid crystalLucia Marino, Andrei Th. Ionescu, Salvatore Marino, and Nicola Scaramuzza Citation: J. Appl. Phys. 112, 114113 (2012); doi: 10.1063/1.4767915 View online: http://dx.doi.org/10.1063/1.4767915 View Table of Contents: http://jap.aip.org/resource/1/JAPIAU/v112/i11 Published by the American Institute of Physics. Related ArticlesNumerical simulations of electrostatic interactions between an atomic force microscopy tip and a dielectricsample in presence of buried nano-particles J. Appl. Phys. 112, 114313 (2012) Study of magnetodielectric effect in hexagonal Ho1−xDyxMnO3 J. Appl. Phys. 112, 104116 (2012) Dielectric, magnetic, and thermodynamic properties of Y1−xSrxMnO3 (x=0.1 and 0.2) J. Appl. Phys. 112, 104115 (2012) Critical electrical behaviors of finger-sensing metal/polymer composites near the percolation threshold Appl. Phys. Lett. 101, 211904 (2012) Lateral resolution improvement in scanning nonlinear dielectric microscopy by measuring super-higher-ordernonlinear dielectric constants Appl. Phys. Lett. 101, 213112 (2012) Additional information on J. Appl. Phys.Journal Homepage: http://jap.aip.org/ Journal Information: http://jap.aip.org/about/about_the_journal Top downloads: http://jap.aip.org/features/most_downloaded Information for Authors: http://jap.aip.org/authors
Dielectric investigations on a bent-core liquid crystal
Lucia Marino,1,2 Andrei Th. Ionescu,2,3 Salvatore Marino,2 and Nicola Scaramuzza1,2,a)
1Dipartimento di Fisica, Universita�della Calabria, Via Pietro Bucci, Cubo 31C, 87036 Rende (Cosenza), Italy2CNR-IPCF UoS di Cosenza, Licryl Laboratory, and Centro di Eccellenza CEMIF.CAL, Universita�dellaCalabria, 87036 Rende (Cosenza), Italy3Faculty of Physics, University of Bucharest, P.O. Box MG-11, RO-077125 Bucharest, Romania
(Received 5 August 2012; accepted 31 October 2012; published online 7 December 2012)
Dielectric measurements on a bent-core liquid crystal were carried out in the frequency range from
10 mHz to 100 kHz in planar aligned cells. Four relaxation ranges were detected during heating
condition: two in a low frequency range of a few hertz probably due to conductivity and interface
relaxation phenomena, another between 10 and 20 Hz, and another one in a range between 10 kHz
and 100 kHz in smectic as in nematic and isotropic phases. The third relaxation response is no
more visible during cooling conditions. Dielectric increments, distribution parameters, and
relaxation frequencies have been evaluated at different temperatures by fitting data with Havriliak-
Negami (H-N) relaxation function, which is an empirical modification of the Debye relaxation
model. The presence of a relaxation response between 10 and 20 Hz and the relatively great values
of the permittivity could suggest the presence of a ferroelectric response due to the presence of
cybotactic clusters. VC 2012 American Institute of Physics. [http://dx.doi.org/10.1063/1.4767915]
I. INTRODUCTION
The discovery of the mesogenic properties of bent-core
molecules has opened another exciting dimension in the
field of thermotropic liquid crystals (LCs). Different aspects,
for instance, the observation of ferroelectricity due to a
spontaneous chiral symmetry breaking in smectic phases
composed of non-chiral molecules,1 make this kind of liquid
crystals very interesting and useful for a great number of
applications. Up today, most of the research effort has
focused on bent-core smectics, because liquid phases exhib-
iting mainly orientational order (nematic (N) phases) are
less common.
However, there has been a sudden increase in the theo-
retical studies2–7 predicting bent-core nematic (BCN) and
isotropic structures with interesting properties, such as biax-
iality and spontaneous chirality. In this context, the experi-
mental evidence of a ferroelectric response to a switching
electric field in a low molar mass nematic bent-core liquid
crystal can be placed.8
This kind of response could be explained by considering
the effect of the molecules’ kinked shape; while rod-shaped
molecules can translate during shear flow, bent-shaped mole-
cules experience a steric barrier caused by neighboring mole-
cules and this may promote the formation of temporary
clusters even in isotropic phase. For the same reason, the
BCN structure is much less common than the N phase of the
calamitics. This is mainly because of the kinked shape that is
not really compatible with the translational freedom of the
calamitic nematics. For this reason, BCNs exhibit some un-
usual physical properties compared to calamitic ones. These
include giant flexoelectricity,9 unprecedented scenarios in
electroconvection,10–12 as well as an unusual behavior found
by light scattering13 and 2H NMR measurements8 indicating
the presence of clusters with higher ordering.
Dielectric spectroscopy (DS) is a widespread tool for
studying liquid crystals which is based on determining the fre-
quency (f) dependent complex permittivity of the substance. It
provides not only important material parameters like the static
dielectric permittivity and dc electrical conductivity, but it
also provides information on the molecular dynamics. The
number of relaxation modes is characteristic of the phase and
can be associated with certain molecular rotations; the charac-
teristic frequencies reflect how those motions are hindered.
In this work, the DS technique is used to investigate the
smectic, nematic, and isotropic phases of a bent-shaped liquid
crystal and in order to find the parameters of observed phe-
nomenon (relaxation time, conductivity, dielectric increment,
etc.), it is necessary to fit the data with generalized relaxation
functions. Nowadays, the phenomenological Havriliak-
Negami (HN) equation is most frequently used to determine
the frequency and temperature dependence of the dielectric
parameters.
A low frequency relaxation response seen even in the
nematic and isotropic phases probably could be explained by
the formation of SmC-type cybotactic clusters, regarded as
strongly fragmented SmC phases. Such clustering effect has
been suggested by several studies,10,14–17 though the exact size,
shape, and temporal behavior of the clusters are not known.
II. EXPERIMENTAL
The material used for this study is ODA-9 (Manufac-
turers: S. Torgova, Lebedev Physical Institute, Russian
Academy of Sciences). The phase sequence of this sample is
Cr68:0 �C ������!73:6 �C
SmC98:2 �C ������!98:0 �C
N109:5 �C ������!110:3 �C
I
obtained from DSC measurements.
a)Author to whom correspondence should be addressed. Electronic mail:
0021-8979/2012/112(11)/114113/8/$30.00 VC 2012 American Institute of Physics112, 114113-1
JOURNAL OF APPLIED PHYSICS 112, 114113 (2012)
A Japanese planar aligned commercial cell (EHC Ltd,
Tokyo, Japan) with a thickness of (2.0 6 0.2) lm and an ITO
resistance of 100 X/� has been used. The material was intro-
duced into the cells using capillary suction in its isotropic
state. The dielectric measurements have been carried out
using an EG&G 273A galvanostat-potentiostat/impedenti-
ometer controlled by the impedance software M398 in order
to acquire the real and imaginary parts of impedance in the
frequency range of 10 mHz–100 kHz with a maximum
applied voltage of 1.0 V (RMS) below the Freedericksz
threshold. No bias field was applied. In order to perform
dielectric measurements as a function of temperature, the
sample has been placed in a CaLCTec FB150 programmable
temperature hot stage with temperature stability within the
range of 0.1 �C.
The measurements have been done at different constant
temperatures starting from the smectic to isotropic phases
and then slowly cooled from isotropic to crystalline phases.
III. RESULTS AND DISCUSSION
In the specified conditions, real and imaginary parts of
the perpendicular component of the complex dielectric
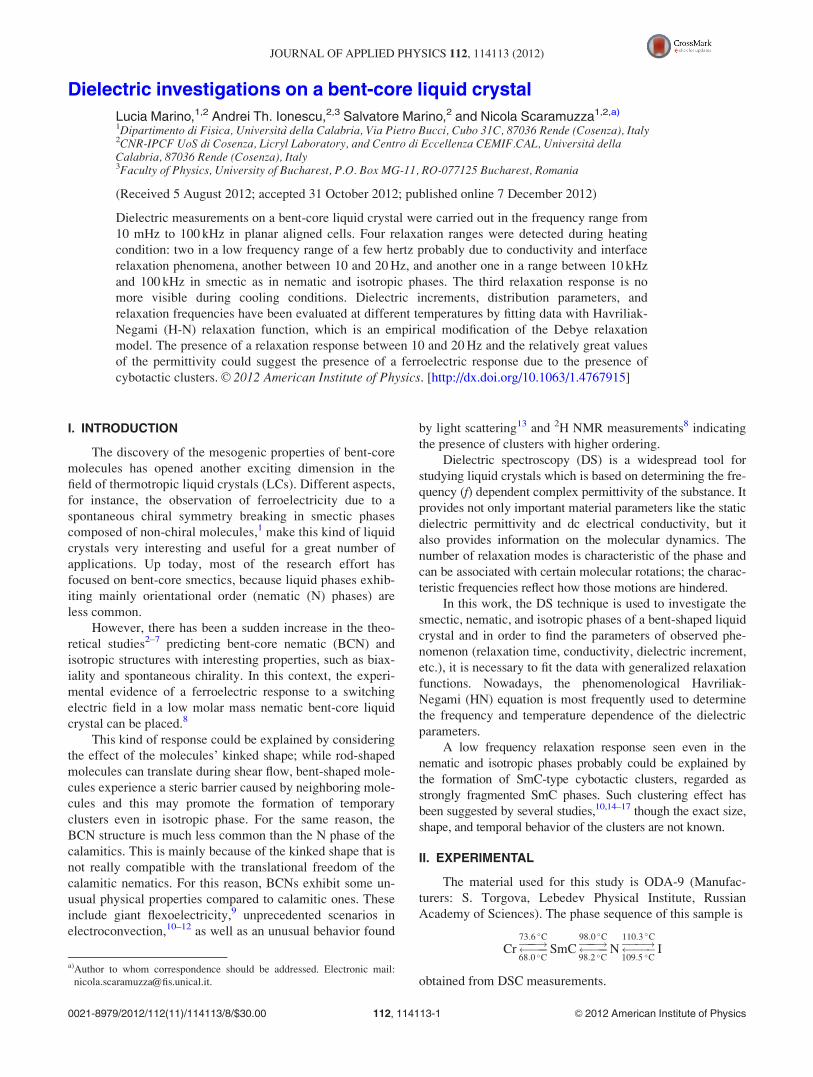
FIG. 1. Dielectric spectrum of ODA-9 acquired at T¼ 86.1 �C in heating
conditions: (a) real part, (b) imaginary part, and (c) Cole-Cole plot. The inset
shows a magnification of the selected region. Symbols: experiment; solid
lines: fitting.
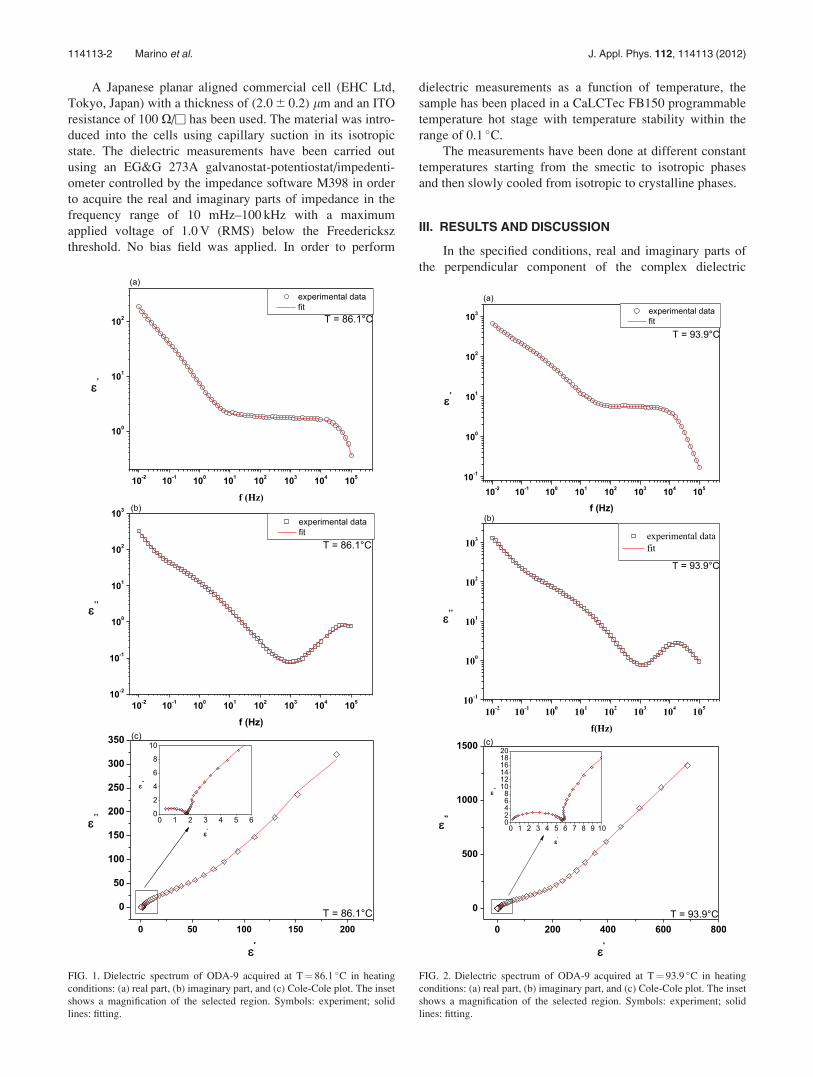
FIG. 2. Dielectric spectrum of ODA-9 acquired at T¼ 93.9 �C in heating
conditions: (a) real part, (b) imaginary part, and (c) Cole-Cole plot. The inset
shows a magnification of the selected region. Symbols: experiment; solid
lines: fitting.
114113-2 Marino et al. J. Appl. Phys. 112, 114113 (2012)
permittivity have been measured in function of frequency at
fixed temperatures.
The director relaxation can be described in terms of the
complex dielectric permittivity, which is given by
e�?ðf Þ ¼ eIðf Þ � ieIIðf Þ; (1)
where eI gives the real part of dielectric permittivity and its
spectrum is called the dispersion curve, eII gives the imagi-
nary part of the complex permittivity and its spectrum is
called the absorption or dielectric loss curve, and f being
the frequency of the applied electric field. In order to under-
stand the temperature dependence of measured dielectric
relaxation, e�?ðf Þ can be described by the Havriliak-Negami
function18 with the addition of a conductivity contribution
(third term) present at lower frequencies
e�?ðf Þ ¼ e1 þX
j
Dej
½1þ ðif sjÞaj �bj� ir
e0ð2pf Þn ; (2)
where Dej is the dielectric strength, e1 is the high-frequency
limit of permittivity, sj ¼ 1/frj is the relaxation time, frj is the
corresponding relaxation frequency, aj and bj are shape
parameters describing the asymmetry and broadness of the
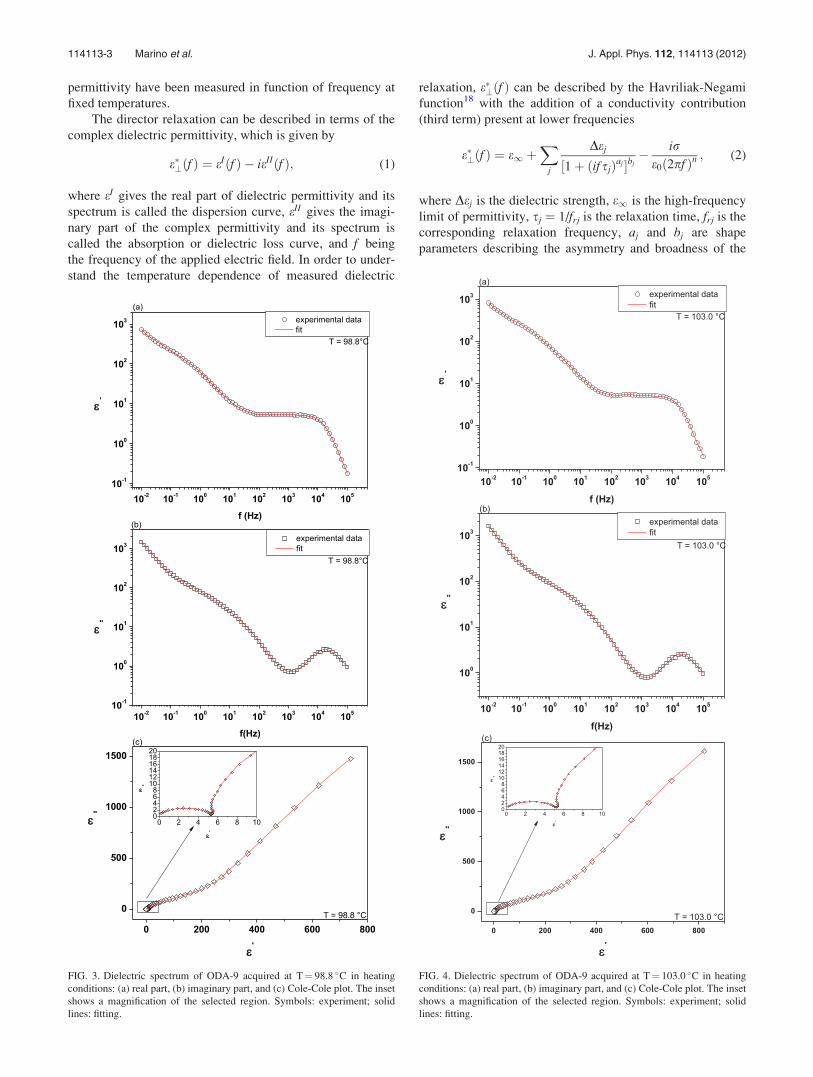
FIG. 3. Dielectric spectrum of ODA-9 acquired at T¼ 98.8 �C in heating
conditions: (a) real part, (b) imaginary part, and (c) Cole-Cole plot. The inset
shows a magnification of the selected region. Symbols: experiment; solid
lines: fitting.
FIG. 4. Dielectric spectrum of ODA-9 acquired at T¼ 103.0 �C in heating
conditions: (a) real part, (b) imaginary part, and (c) Cole-Cole plot. The inset
shows a magnification of the selected region. Symbols: experiment; solid
lines: fitting.
114113-3 Marino et al. J. Appl. Phys. 112, 114113 (2012)
dielectric dispersion curve, ranging between 0 and 1, and j is
the number of the relaxation processes. In the last term, r is
related to the conductivity, and n is a fitting parameter
responsible for the slope of the conductivity. In the case of
pure Ohmic conductivity, n¼ 1, while the decrease of n, n< 1
could be observed if, in addition to the contribution to eII
from conductivity, there is an influence of electrode polariza-
tion. The HN response reduces to Cole-Davidson19 response
when a ¼ 1, and to Cole-Cole response20 when b ¼ 1.
It has to be noticed that the real part eIðf Þ of the complex
dielectric permittivity is proportional to the imaginary part
rIIðf Þ, eIðf Þ / �rIIðf Þ=f , and the dielectric losses eIIðf Þ are
proportional to the real part rIðf Þ of the ac-conductivity,
eIIðf Þ / rIðf Þ=f .21
Dielectric spectra for smectic C (see Figures 1 and 2),
nematic (see Figures 3 and 4), and isotropic phases (see
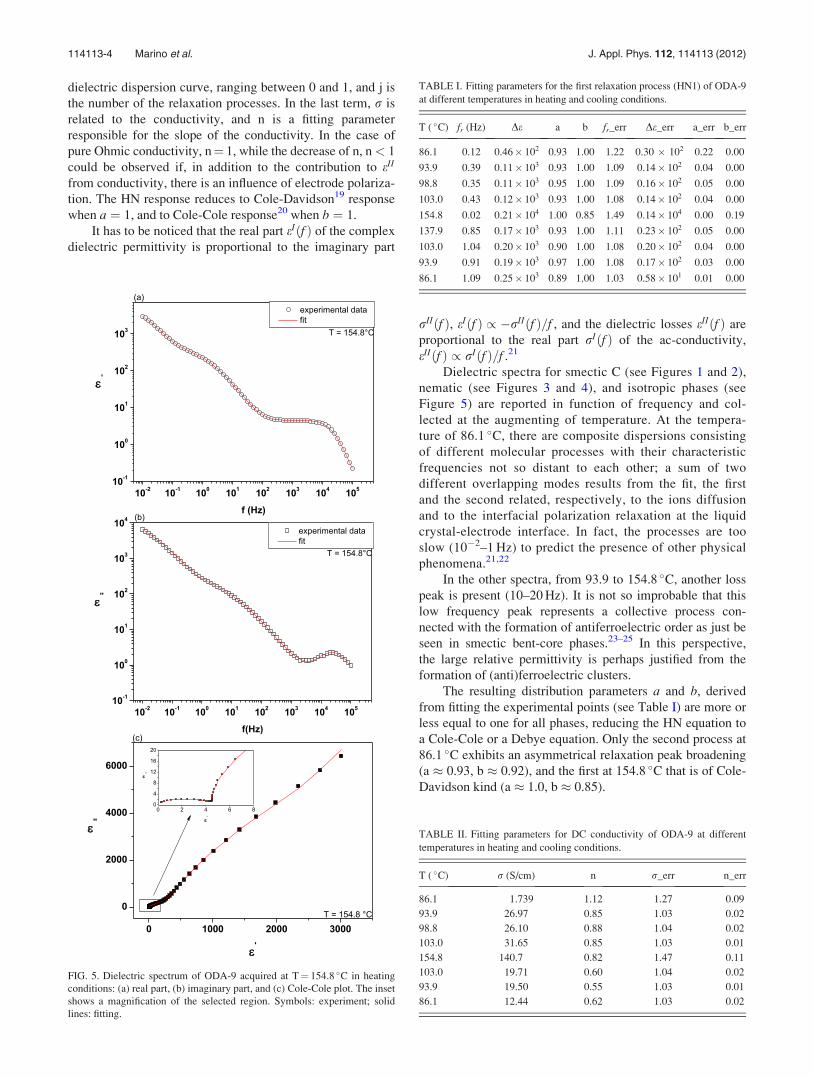
Figure 5) are reported in function of frequency and col-
lected at the augmenting of temperature. At the tempera-
ture of 86.1 �C, there are composite dispersions consisting
of different molecular processes with their characteristic
frequencies not so distant to each other; a sum of two
different overlapping modes results from the fit, the first
and the second related, respectively, to the ions diffusion
and to the interfacial polarization relaxation at the liquid
crystal-electrode interface. In fact, the processes are too
slow (10�2–1 Hz) to predict the presence of other physical
phenomena.21,22
In the other spectra, from 93.9 to 154.8 �C, another loss
peak is present (10–20 Hz). It is not so improbable that this
low frequency peak represents a collective process con-
nected with the formation of antiferroelectric order as just be
seen in smectic bent-core phases.23–25 In this perspective,
the large relative permittivity is perhaps justified from the
formation of (anti)ferroelectric clusters.
The resulting distribution parameters a and b, derived
from fitting the experimental points (see Table I) are more or
less equal to one for all phases, reducing the HN equation to
a Cole-Cole or a Debye equation. Only the second process at
86.1 �C exhibits an asymmetrical relaxation peak broadening
(a � 0.93, b � 0.92), and the first at 154.8 �C that is of Cole-
Davidson kind (a � 1.0, b � 0.85).
FIG. 5. Dielectric spectrum of ODA-9 acquired at T¼ 154.8 �C in heating
conditions: (a) real part, (b) imaginary part, and (c) Cole-Cole plot. The inset
shows a magnification of the selected region. Symbols: experiment; solid
lines: fitting.
TABLE II. Fitting parameters for DC conductivity of ODA-9 at different
temperatures in heating and cooling conditions.
T ( �C) r (S/cm) n r_err n_err
86.1 1.739 1.12 1.27 0.09
93.9 26.97 0.85 1.03 0.02
98.8 26.10 0.88 1.04 0.02
103.0 31.65 0.85 1.03 0.01
154.8 140.7 0.82 1.47 0.11
103.0 19.71 0.60 1.04 0.02
93.9 19.50 0.55 1.03 0.01
86.1 12.44 0.62 1.03 0.02
TABLE I. Fitting parameters for the first relaxation process (HN1) of ODA-9
at different temperatures in heating and cooling conditions.
T ( �C) fr (Hz) De a b fr_err De_err a_err b_err
86.1 0.12 0.46� 102 0.93 1.00 1.22 0.30 � 102 0.22 0.00
93.9 0.39 0.11� 103 0.93 1.00 1.09 0.14� 102 0.04 0.00
98.8 0.35 0.11� 103 0.95 1.00 1.09 0.16� 102 0.05 0.00
103.0 0.43 0.12� 103 0.93 1.00 1.08 0.14� 102 0.04 0.00
154.8 0.02 0.21� 104 1.00 0.85 1.49 0.14� 104 0.00 0.19
137.9 0.85 0.17� 103 0.93 1.00 1.11 0.23� 102 0.05 0.00
103.0 1.04 0.20� 103 0.90 1.00 1.08 0.20� 102 0.04 0.00
93.9 0.91 0.19� 103 0.97 1.00 1.08 0.17� 102 0.03 0.00
86.1 1.09 0.25� 103 0.89 1.00 1.03 0.58� 101 0.01 0.00
114113-4 Marino et al. J. Appl. Phys. 112, 114113 (2012)
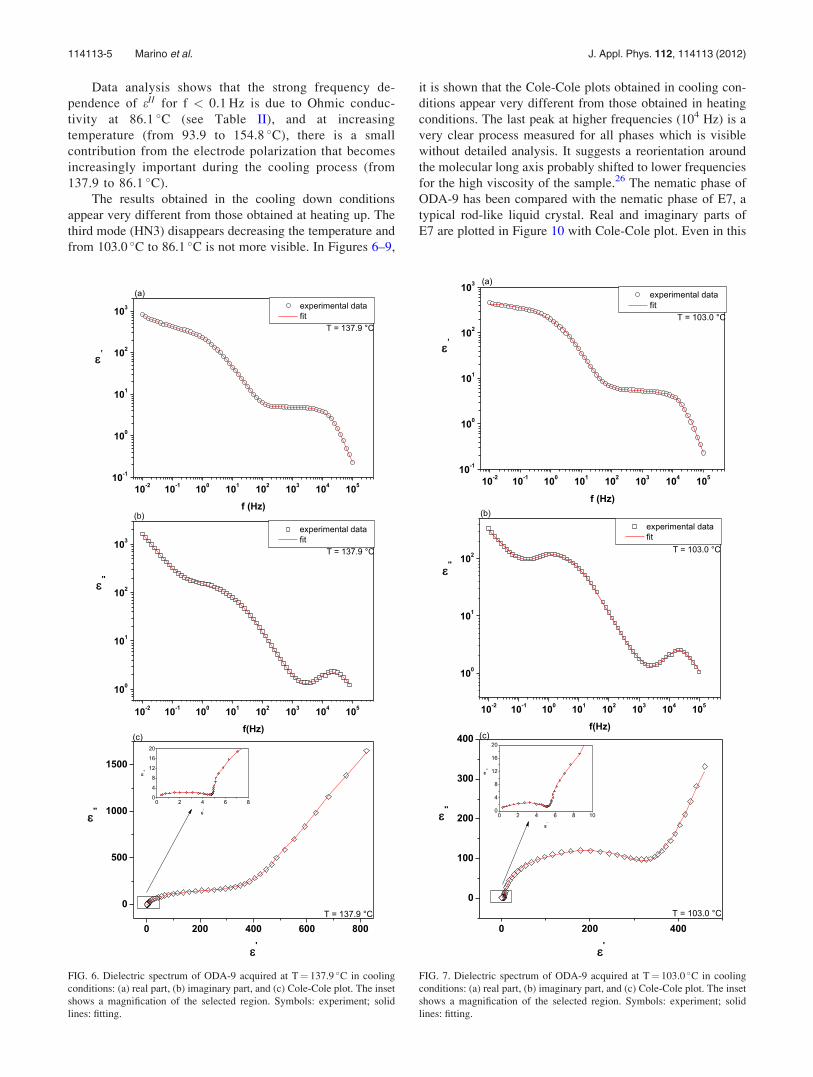
Data analysis shows that the strong frequency de-
pendence of eII for f < 0.1 Hz is due to Ohmic conduc-
tivity at 86.1 �C (see Table II), and at increasing
temperature (from 93.9 to 154.8 �C), there is a small
contribution from the electrode polarization that becomes
increasingly important during the cooling process (from
137.9 to 86.1 �C).
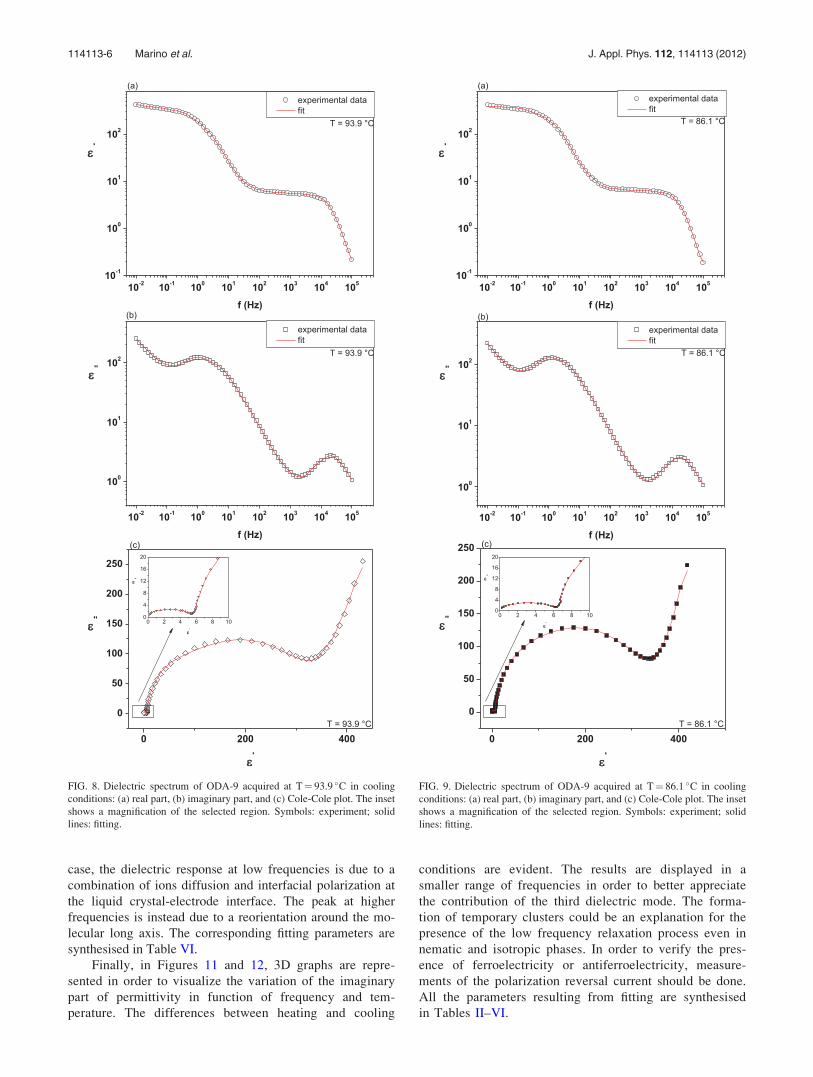
The results obtained in the cooling down conditions
appear very different from those obtained at heating up. The
third mode (HN3) disappears decreasing the temperature and
from 103.0 �C to 86.1 �C is not more visible. In Figures 6–9,
it is shown that the Cole-Cole plots obtained in cooling con-
ditions appear very different from those obtained in heating
conditions. The last peak at higher frequencies (104 Hz) is a
very clear process measured for all phases which is visible
without detailed analysis. It suggests a reorientation around
the molecular long axis probably shifted to lower frequencies
for the high viscosity of the sample.26 The nematic phase of
ODA-9 has been compared with the nematic phase of E7, a
typical rod-like liquid crystal. Real and imaginary parts of
E7 are plotted in Figure 10 with Cole-Cole plot. Even in this
FIG. 6. Dielectric spectrum of ODA-9 acquired at T¼ 137.9 �C in cooling
conditions: (a) real part, (b) imaginary part, and (c) Cole-Cole plot. The inset
shows a magnification of the selected region. Symbols: experiment; solid
lines: fitting.
FIG. 7. Dielectric spectrum of ODA-9 acquired at T¼ 103.0 �C in cooling
conditions: (a) real part, (b) imaginary part, and (c) Cole-Cole plot. The inset
shows a magnification of the selected region. Symbols: experiment; solid
lines: fitting.
114113-5 Marino et al. J. Appl. Phys. 112, 114113 (2012)
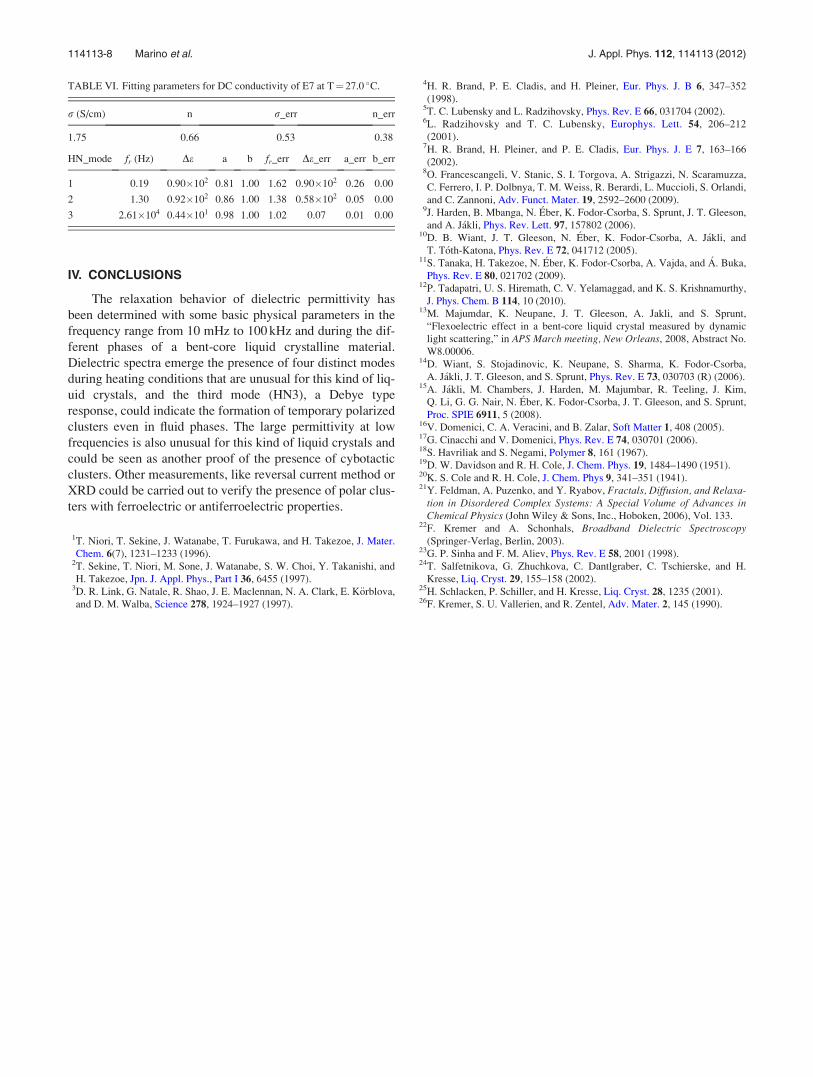
case, the dielectric response at low frequencies is due to a
combination of ions diffusion and interfacial polarization at
the liquid crystal-electrode interface. The peak at higher
frequencies is instead due to a reorientation around the mo-
lecular long axis. The corresponding fitting parameters are
synthesised in Table VI.
Finally, in Figures 11 and 12, 3D graphs are repre-
sented in order to visualize the variation of the imaginary
part of permittivity in function of frequency and tem-
perature. The differences between heating and cooling
conditions are evident. The results are displayed in a
smaller range of frequencies in order to better appreciate
the contribution of the third dielectric mode. The forma-
tion of temporary clusters could be an explanation for the
presence of the low frequency relaxation process even in
nematic and isotropic phases. In order to verify the pres-
ence of ferroelectricity or antiferroelectricity, measure-
ments of the polarization reversal current should be done.
All the parameters resulting from fitting are synthesised
in Tables II–VI.
FIG. 8. Dielectric spectrum of ODA-9 acquired at T¼ 93.9 �C in cooling
conditions: (a) real part, (b) imaginary part, and (c) Cole-Cole plot. The inset
shows a magnification of the selected region. Symbols: experiment; solid
lines: fitting.
FIG. 9. Dielectric spectrum of ODA-9 acquired at T¼ 86.1 �C in cooling
conditions: (a) real part, (b) imaginary part, and (c) Cole-Cole plot. The inset
shows a magnification of the selected region. Symbols: experiment; solid
lines: fitting.
114113-6 Marino et al. J. Appl. Phys. 112, 114113 (2012)
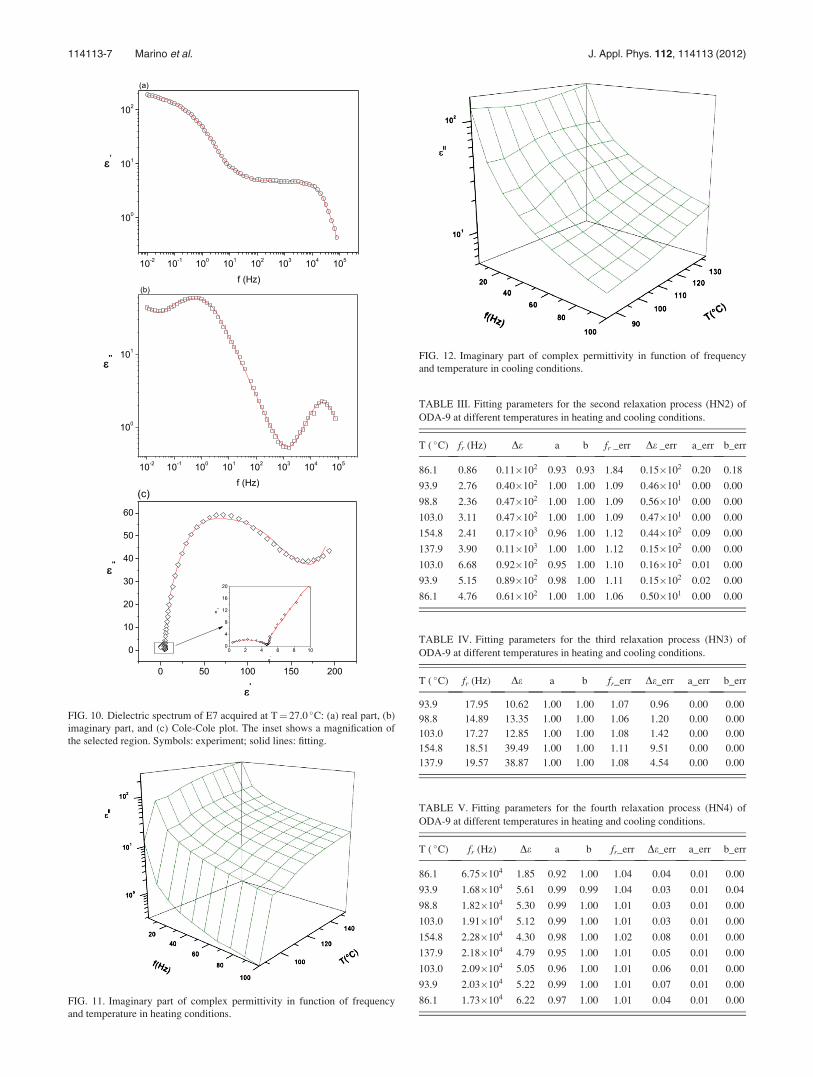
FIG. 11. Imaginary part of complex permittivity in function of frequency
and temperature in heating conditions.
FIG. 12. Imaginary part of complex permittivity in function of frequency
and temperature in cooling conditions.
TABLE III. Fitting parameters for the second relaxation process (HN2) of
ODA-9 at different temperatures in heating and cooling conditions.
T ( �C) fr (Hz) De a b fr _err De _err a_err b_err
86.1 0.86 0.11�102 0.93 0.93 1.84 0.15�102 0.20 0.18
93.9 2.76 0.40�102 1.00 1.00 1.09 0.46�101 0.00 0.00
98.8 2.36 0.47�102 1.00 1.00 1.09 0.56�101 0.00 0.00
103.0 3.11 0.47�102 1.00 1.00 1.09 0.47�101 0.00 0.00
154.8 2.41 0.17�103 0.96 1.00 1.12 0.44�102 0.09 0.00
137.9 3.90 0.11�103 1.00 1.00 1.12 0.15�102 0.00 0.00
103.0 6.68 0.92�102 0.95 1.00 1.10 0.16�102 0.01 0.00
93.9 5.15 0.89�102 0.98 1.00 1.11 0.15�102 0.02 0.00
86.1 4.76 0.61�102 1.00 1.00 1.06 0.50�101 0.00 0.00
TABLE IV. Fitting parameters for the third relaxation process (HN3) of
ODA-9 at different temperatures in heating and cooling conditions.
T ( �C) fr (Hz) De a b fr_err De_err a_err b_err
93.9 17.95 10.62 1.00 1.00 1.07 0.96 0.00 0.00
98.8 14.89 13.35 1.00 1.00 1.06 1.20 0.00 0.00
103.0 17.27 12.85 1.00 1.00 1.08 1.42 0.00 0.00
154.8 18.51 39.49 1.00 1.00 1.11 9.51 0.00 0.00
137.9 19.57 38.87 1.00 1.00 1.08 4.54 0.00 0.00
FIG. 10. Dielectric spectrum of E7 acquired at T¼ 27.0 �C: (a) real part, (b)
imaginary part, and (c) Cole-Cole plot. The inset shows a magnification of
the selected region. Symbols: experiment; solid lines: fitting.
TABLE V. Fitting parameters for the fourth relaxation process (HN4) of
ODA-9 at different temperatures in heating and cooling conditions.
T ( �C) fr (Hz) De a b fr_err De_err a_err b_err
86.1 6.75�104 1.85 0.92 1.00 1.04 0.04 0.01 0.00
93.9 1.68�104 5.61 0.99 0.99 1.04 0.03 0.01 0.04
98.8 1.82�104 5.30 0.99 1.00 1.01 0.03 0.01 0.00
103.0 1.91�104 5.12 0.99 1.00 1.01 0.03 0.01 0.00
154.8 2.28�104 4.30 0.98 1.00 1.02 0.08 0.01 0.00
137.9 2.18�104 4.79 0.95 1.00 1.01 0.05 0.01 0.00
103.0 2.09�104 5.05 0.96 1.00 1.01 0.06 0.01 0.00
93.9 2.03�104 5.22 0.99 1.00 1.01 0.07 0.01 0.00
86.1 1.73�104 6.22 0.97 1.00 1.01 0.04 0.01 0.00
114113-7 Marino et al. J. Appl. Phys. 112, 114113 (2012)
IV. CONCLUSIONS
The relaxation behavior of dielectric permittivity has
been determined with some basic physical parameters in the
frequency range from 10 mHz to 100 kHz and during the dif-
ferent phases of a bent-core liquid crystalline material.
Dielectric spectra emerge the presence of four distinct modes
during heating conditions that are unusual for this kind of liq-
uid crystals, and the third mode (HN3), a Debye type
response, could indicate the formation of temporary polarized
clusters even in fluid phases. The large permittivity at low
frequencies is also unusual for this kind of liquid crystals and
could be seen as another proof of the presence of cybotactic
clusters. Other measurements, like reversal current method or
XRD could be carried out to verify the presence of polar clus-
ters with ferroelectric or antiferroelectric properties.
1T. Niori, T. Sekine, J. Watanabe, T. Furukawa, and H. Takezoe, J. Mater.
Chem. 6(7), 1231–1233 (1996).2T. Sekine, T. Niori, M. Sone, J. Watanabe, S. W. Choi, Y. Takanishi, and
H. Takezoe, Jpn. J. Appl. Phys., Part I 36, 6455 (1997).3D. R. Link, G. Natale, R. Shao, J. E. Maclennan, N. A. Clark, E. K€orblova,
and D. M. Walba, Science 278, 1924–1927 (1997).
4H. R. Brand, P. E. Cladis, and H. Pleiner, Eur. Phys. J. B 6, 347–352
(1998).5T. C. Lubensky and L. Radzihovsky, Phys. Rev. E 66, 031704 (2002).6L. Radzihovsky and T. C. Lubensky, Europhys. Lett. 54, 206–212
(2001).7H. R. Brand, H. Pleiner, and P. E. Cladis, Eur. Phys. J. E 7, 163–166
(2002).8O. Francescangeli, V. Stanic, S. I. Torgova, A. Strigazzi, N. Scaramuzza,
C. Ferrero, I. P. Dolbnya, T. M. Weiss, R. Berardi, L. Muccioli, S. Orlandi,
and C. Zannoni, Adv. Funct. Mater. 19, 2592–2600 (2009).9J. Harden, B. Mbanga, N. �Eber, K. Fodor-Csorba, S. Sprunt, J. T. Gleeson,
and A. J�akli, Phys. Rev. Lett. 97, 157802 (2006).10D. B. Wiant, J. T. Gleeson, N. �Eber, K. Fodor-Csorba, A. J�akli, and
T. T�oth-Katona, Phys. Rev. E 72, 041712 (2005).11S. Tanaka, H. Takezoe, N. �Eber, K. Fodor-Csorba, A. Vajda, and �A. Buka,
Phys. Rev. E 80, 021702 (2009).12P. Tadapatri, U. S. Hiremath, C. V. Yelamaggad, and K. S. Krishnamurthy,
J. Phys. Chem. B 114, 10 (2010).13M. Majumdar, K. Neupane, J. T. Gleeson, A. Jakli, and S. Sprunt,
“Flexoelectric effect in a bent-core liquid crystal measured by dynamic
light scattering,” in APS March meeting, New Orleans, 2008, Abstract No.
W8.00006.14D. Wiant, S. Stojadinovic, K. Neupane, S. Sharma, K. Fodor-Csorba,
A. J�akli, J. T. Gleeson, and S. Sprunt, Phys. Rev. E 73, 030703 (R) (2006).15A. J�akli, M. Chambers, J. Harden, M. Majumbar, R. Teeling, J. Kim,
Q. Li, G. G. Nair, N. �Eber, K. Fodor-Csorba, J. T. Gleeson, and S. Sprunt,
Proc. SPIE 6911, 5 (2008).16V. Domenici, C. A. Veracini, and B. Zalar, Soft Matter 1, 408 (2005).17G. Cinacchi and V. Domenici, Phys. Rev. E 74, 030701 (2006).18S. Havriliak and S. Negami, Polymer 8, 161 (1967).19D. W. Davidson and R. H. Cole, J. Chem. Phys. 19, 1484–1490 (1951).20K. S. Cole and R. H. Cole, J. Chem. Phys 9, 341–351 (1941).21Y. Feldman, A. Puzenko, and Y. Ryabov, Fractals, Diffusion, and Relaxa-
tion in Disordered Complex Systems: A Special Volume of Advances inChemical Physics (John Wiley & Sons, Inc., Hoboken, 2006), Vol. 133.
22F. Kremer and A. Schonhals, Broadband Dielectric Spectroscopy(Springer-Verlag, Berlin, 2003).
23G. P. Sinha and F. M. Aliev, Phys. Rev. E 58, 2001 (1998).24T. Salfetnikova, G. Zhuchkova, C. Dantlgraber, C. Tschierske, and H.
Kresse, Liq. Cryst. 29, 155–158 (2002).25H. Schlacken, P. Schiller, and H. Kresse, Liq. Cryst. 28, 1235 (2001).26F. Kremer, S. U. Vallerien, and R. Zentel, Adv. Mater. 2, 145 (1990).
TABLE VI. Fitting parameters for DC conductivity of E7 at T¼ 27.0 �C.
r (S/cm) n r_err n_err
1.75 0.66 0.53 0.38
HN_mode fr (Hz) De a b fr_err De_err a_err b_err
1 0.19 0.90�102 0.81 1.00 1.62 0.90�102 0.26 0.00
2 1.30 0.92�102 0.86 1.00 1.38 0.58�102 0.05 0.00
3 2.61�104 0.44�101 0.98 1.00 1.02 0.07 0.01 0.00
114113-8 Marino et al. J. Appl. Phys. 112, 114113 (2012)