Diameter and Height Distributions of Natural Even-Aged Pine Forests (Pinus sylvestris) in Western...
14
29 Taiwan J For Sci 28(1): 29-41, 2013 Research paper Diameter and Height Distributions of Natural Even-Aged Pine Forests (Pinus sylvestris) in Western Khentey, Mongolia Khongor Tsogt, 1,2) Tsogt Zandraabal, 2) Chinsu Lin 1,3) 【Summary】 The purpose of this study was to find a suitable probability density function (PDF) to model the diameter at breast height (dbh) and height distributions of even-aged pine (Pinus sylvestris L.) forests. For the study, three different age-classes (AGs) of pine forests were used. Burr, Dagum, and Johnson SB distributions were applied due to their flexible properties. Result showed that dbh distributions of the 10~15- (AG1) and 40~45-yr (AG2) stands were left-tailed, while the 60~65- yr (AG3) stand was normally skewed. Height distributions of the AG1 and AG3 stands were left- tailed, while that of the AG2 stand showed no obvious distribution shape, due to its discrete height distribution. A distribution study revealed that in left-tailed forests, dbh and height distribution shapes were best approximated by the Dagum distribution. In the case of the normal distribution shape, the Johnson SB was better than the Burr and Dagum ones. Based on these results, we con- cluded that dbh distributions of even-aged AG1 and AG2 forests were heavily left-tailed, and the forest structure tended to normal for the AG3 forest. The height distribution is left tailed (AG1 and AG3) if a forest’s height growth is not constrained by space, while it will become discrete in a high-density stand (AG2). Key words: diameter at breast height, height, left-tailed distribution, Scots pine (Pinus sylvestris L). Tsogt K, Zandraabal T, Lin C. 2013. Diameter and height distributions of natural even-aged pine forests (Pinus sylvestris) in Western Khentey, Mongoli. Taiwan J For Sci 28(1):29-41. 1) D epartment of Forest and Natural Resources, National Chiayi Univ., 300 University Rd., Chiayi 60004, Taiwan. 國立嘉義大學森林暨自然資源學系,60004 嘉義市學府路300 號。 2) I nstitute of Botany, Mongolian Academy of Sciences, 77 Jukov Avenue, 51 Ulaanbaatar 210351, Mongolia. 蒙古國科學院植物所。 3) Corresponding author, e-mail:[email protected] 通訊作者。 Received September 2012, Accepted March 2013. 2012 年9 月送審 2013 年3 月通過。
Transcript of Diameter and Height Distributions of Natural Even-Aged Pine Forests (Pinus sylvestris) in Western...
29Taiwan J For Sci 28(1): 29-41, 2013
Research paper
Diameter and Height Distributions of Natural Even-Aged Pine Forests (Pinus sylvestris) in Western Khentey, Mongolia
Khongor Tsogt,1,2) Tsogt Zandraabal,2) Chinsu Lin1,3)
【Summary】
The purpose of this study was to find a suitable probability density function (PDF) to model the diameter at breast height (dbh) and height distributions of even-aged pine (Pinus sylvestris L.) forests. For the study, three different age-classes (AGs) of pine forests were used. Burr, Dagum, and Johnson SB distributions were applied due to their flexible properties. Result showed that dbh distributions of the 10~15- (AG1) and 40~45-yr (AG2) stands were left-tailed, while the 60~65-yr (AG3) stand was normally skewed. Height distributions of the AG1 and AG3 stands were left-tailed, while that of the AG2 stand showed no obvious distribution shape, due to its discrete height distribution. A distribution study revealed that in left-tailed forests, dbh and height distribution shapes were best approximated by the Dagum distribution. In the case of the normal distribution shape, the Johnson SB was better than the Burr and Dagum ones. Based on these results, we con-cluded that dbh distributions of even-aged AG1 and AG2 forests were heavily left-tailed, and the forest structure tended to normal for the AG3 forest. The height distribution is left tailed (AG1 and AG3) if a forest’s height growth is not constrained by space, while it will become discrete in a high-density stand (AG2).Key words: diameter at breast height, height, left-tailed distribution, Scots pine (Pinus sylvestris L).Tsogt K, Zandraabal T, Lin C. 2013. Diameter and height distributions of natural even-aged pine
forests (Pinus sylvestris) in Western Khentey, Mongoli. Taiwan J For Sci 28(1):29-41.
1) Department of Forest and Natural Resources , Nat ional Chiayi Univ. , 300 Univers i ty Rd. , Chiayi
60004, Taiwan. 國立嘉義大學森林暨自然資源學系,60004嘉義市學府路300號。2) Inst i tute of Botany, Mongol ian Academy of Sciences , 77 Jukov Avenue, 51 Ulaanbaatar 210351,
Mongolia. 蒙古國科學院植物所。3) Corresponding author, e-mail:[email protected] 通訊作者。
Received September 2012, Accepted March 2013. 2012年9月送審 2013年3月通過。
30 Tsogt et al.─Stand structure of natural even-aged pine forests in Mongolia
研究報告
蘇格蘭松同齡天然林的直徑與樹高分佈
Khongor Tsogt1,2) Tsogt Zandraabal2) 林金樹1,3)
摘 要
本文以蒙古國Khentey省的西部天然同齡林為研究地區,利用Burr、Dagum以及Johnson SB機率密度函數模擬配適蘇格蘭松(Pinus sylvestris L.)不同齡級的林分胸高直徑以及樹高的分佈模式。結果顯示:10年生以及40年生齡級的林分直徑分佈為向左偏斜的分佈(negatively skewed distribution),60年生的齡級則為常態分佈(normal distribution);10年生以及60年生齡級的林分樹高分佈為向左偏斜的分佈,40年生齡級的林分的立木樹高呈離散的分佈,並無明顯的分佈特徵。依據配適函數模型的結果,蘇格蘭松同齡天然林的林分直徑以及樹高分佈可以利用Dagum、Burr、Johnson SB函數配適之,但由模型統計值顯示Dagum函數模型對於左偏分布的林分結構配適效果較為理想,而Johnson SB函數對於常態的林分結構配適效果較佳。林分結構資料顯示:若蘇格蘭松同齡天然林分有足夠的林分空間
以供生長,林分的直徑結構會呈現很明顯的左偏分布,經過40年的生長期,會發展成為常態分佈;如果林分的生長空間有限,則林分的樹高結構將會由左偏現象發展為不規則結構。60年齡級以下的林分(AG1、AG3)樹高結構為左偏分布,但是如果林分密度太高將造成離散型結構,無明顯的函數分布型態。
關鍵詞:胸高直徑、樹高、左偏分佈、蘇格蘭松。
Tsogt K、Zandraabal T、林金樹。2013。蘇格蘭松同齡天然林的直徑與樹高分佈。台灣林業科學28(1):29-41。
INTRODUCTIONInformation concerning the size-class
distribution of a forest stand such as the diameter at breast height (dbh) and height classes is generally required for effective for-est management planning. dbh and height distributions are particularly valuable for volume estimations of forest stands and yield planning. Even for unmanaged forest stands, dbh and height information can be used as standards for comparison of different types of managed stands. Thus, detailed modeling of the distributions of dbh and height classes for forest-vegetational types is required.
A wide range of probability density functions (PDFs) have been used in forestry to model tree dbh and height structural dis-
tributions (Bailey and Dell 1973, Hafley and Schreuder 1977, Gove et al. 2008, Wang et al. 2010, Tsogt and Lin 2013) and age dis-tributions (Lin et al. 2007). Regular shaped (unimodal) distributions may take different shapes. A suitable PDF model that can ex-press empirical distributions of diameter and height parameters of stands should be care-fully derived using an appropriate theoretical distribution function. Some flexible PDF al-gorithms such as Beta, Burr, Dagum (inverse Burr), Gamma, Johnson SB, and Weibull have been widely used for this purpose in forestry.
Weibull is generally the most favored distribution in forestry as it is easy to use and able to describe both positive and negative
31Taiwan J For Sci 28(1): 29-41, 2013
skewness. A comparison study of lognor-mal and Weibull distributions on a regularly shaped birch forest dbh distribution structure showed that Weibull was superior (Tsogt et al. 2011c). However, that study included no other distribution functions. According to Lindsay et al. (1996), the Burr distribution outper-forms the Weibull distribution in its ability to drive the dbh distribution, while Dagum has the ability to fit a rotated sigmoid dbh distri-bution (Gove et al. 2008). Both Weibull and Burr distributions are Dagum family distribu-tions, and Dagum distributions have a wider region of applicability then either of the other two (Lindsay et al, 1996). The Burr (Zimmer and Burr 1963) and Dagum (1977) distribu-tions are together called Burr-type distribu-tions and were introduced to forest research by Lindsay et al. (1996). These distributions are inherently more flexible, because they can cover a much larger area of the skewness-kurtosis plane than the Weibull distribution (Rodriguez 1977, Tadikamalla 1980, Lindsay et al. 1996, Gove et al. 2008). That is because Burr-type distributions can approximate nor-mal, gamma, lognormal, exponential, logistic, and several Pearson-type distributions (Rodri-guez 1977, Tadikamalla 1980).
Hafley and Schreuder’s (1977) first in-troduced the Johnson SB distribution in the forest literature, and their study showed that the Johnson SB distribution gave the best performance, while the normal, lognormal and gamma distributions were inferior to the Weibull and beta distributions in terms of their general performance over a variety of even-aged stands. Generally beta was the sec-ond best fitting distribution, and Weibull was the third best. From the viewpoint of practical applications, they believed that the Johnson SB distribution has important advantages over the beta distribution, in that it spans a slightly broader range of the skewness-kur-
tosis space than the beta distribution (i.e., it also covers the region between the lognormal and gamma). Since then, it has been widely used for modeling forest dbh and height dis-tributions (Hafley and Buford 1985, Knoebel and Burkhart 1991, Zhou and McTague 1996, Kamziah et al. 1999, Li et al. 2002, Scolforo et al. 2003, Zhang et al. 2003). Later, its parameterization method was improved by Rennols and Wang (2005). The Johnson SB distribution covers a different region of the skewness-kurtosis plane from those of the Burr and Dagum distributions (Johnson 1949, Hafley and Schreuder 1977).
Understanding forest structures is help-ful in determining forest productivity (Yang and Feng 1989, Chiu et al. 2010, Huang et al. 2012). Recently, some studies focused on the dbh and height distributions of species-specific forest stands such as birch (Tsogt et al. 2011c) and larch (Tsogt et al. 2011a, b, Tsogt and Lin 2013) in Mongolia. But, no one has studied dbh and height distribution of pine forests. The purpose of this study was to derive an appropriate distribution for model-ing the dbh and height distributions of even-aged pine forests using the Burr, Dagum, and Johnson SB distributions.
MATERIALS AND METHODS
Study sitesThe distribution models investigated in
this paper were fitted to dbh and height mea-surements of 3 forest stands: P1 (49°45’86”N, 109°04’40”E at 920 m elevation) and P2 (49°46’16”N, 107°01’12” E at 888 m eleva-tion) at Khuder soum Selenge aimag, and P3 (49°11’25”N, 106°39’02”E at 1145 m eleva-tion) at Shariin gol soum Darkhan-Uul aimag. The species found at these study sites is a pure forest of Scots pine (Pinus sylvestris L.). Scots pine forests dominate the area of this
32 Tsogt et al.─Stand structure of natural even-aged pine forests in Mongolia
study which belongs to the Western Khen-tey forest-vegetational province. It is also a common species of subtaiga forests of the Western Khentey by elevation-belt zonation (Tsedendash 1993).
The climate of the Khentey Mountains is characterized by the Asiatic anticyclone in winter, which is typically centered southwest of Lake Baikal and causes dry and cold win-ters with mean January temperatures of as low as -28 to -23℃ (Tsedendash 1993). Mean July temperatures range 12~18℃. Frost oc-curs from the end of August to early June on 280~300 d yr-1 (Tsedendash 1993). Annual precipitation at the weather station (at Shariin gol) was 256.23 mm, and mean annual tem-perature was 1.12℃ for the years 1996~2004. Dry periods occurred from 10 April to 30 July during these 9 yr; however, extreme dry-ness did not occur, which often takes place in the dry steppe and Gobi desert. Most pre-cipitation falls during summer, from June to August. Livestock is traditionally kept in the study area because subtaiga forests border the steppe zone, which is crucial for the livestock of nomadic herder families, and the grazing
capacity tends to be higher in the biome tran-sition zone between forests and steppe.
In this study, 3 plots with ages ranging 10~65-yr representing young (P1), juvenile (P2), and old (P3) stands were selected for analysis. The dbh and height of all trees taller than 1.3 m were measured. Basic inventory information and the measured descriptive characteristics of the study plots are respec-tively shown in Tables 1 and 2. According to the history of forest management, the P1 and P2 stands were originally not forests. These stands resulted from an expansion of the for-est area due to favorable site conditions and abundant parent material (seed sources and advanced regeneration). Only a few old trees grow around the P1 stand, while a large area of old forest can be found adjacent to the P2 stand. Since no records revealed that the forest stand of P3 resulted from forest expan-sion, the P3 stand should be an original forest.
All 3 stands were examined, and dbh and height were found to be negatively skewed (Table 2). This indicates that the diameter and height of the stands were negatively skewed or left-tailed distributed. In terms of the small
Table 1. Inventory information of the study site Number of treesPlot no. Year of inventory Plot size by plot area /ha-1 Average age of plot trees (yr)
P1 2005 50 x 40 m 239 1195 10~15P2 2005 40 x 40 m 250 1563 40~45P3 2001 50 x 20 m 96 960 60~65
Table 2. Descriptive diameter at breast height (dbh) and height statistics of the study sitePlot no. Variables Mean Standard deviation Minimum~maximum Skewness KurtosisP1 dbh (cm) 16.10 6.03 2.50~30.00 -0.23 -0.75 Height (m) 14.06 3.58 3.30~19.66 -0.94 0.21P2 dbh (cm) 15.80 6.18 2.50~30.00 -0.17 -0.82 Height (m) 11.88 3.25 6.19~15.02 -0.82 -0.91P3 dbh (cm) 22.10 5.58 8.30~36.80 -0.02 -0.1 Height (m) 15.89 2.58 6.11~21.62 -1.36 3.67
33Taiwan J For Sci 28(1): 29-41, 2013
value (close to 0) of P3 dbh, the diameter dis-tribution of the P3 stand was almost symmet-rically tailed, which was the exception among the tested stands. The negative kurtosis of dbh showed that the forest distribution of the study sites was a little bit flatter than a normal distribution. The height of the P2 forest had a negative kurtosis, but the kurtosis of P1 and P3 was positive. This indicates that P1 and P3 heights had peaked distributions, while that of P2 was flat.
Modeling
ModelsThis study modeled dbh and height dis-
tributions of the forest plots with 3 functions, including the Burr, Dagum, and Johnson SBs provided by the software Easyfit 5.5 Profes-sional. Both the PDF and cumulative density function (CDF) of the tested functions are presented.
Burr distributionThe Burr distribution (Zimmer and Burr
1963) has a flexible shape, and controllable scale and location, which makes it appealing for data fitting. It is sometimes considered to be an alternative to a normal distribution when data show a slightly positive skew-ness. For a random variable, x, such as dbh or height, with the boundary γ ≤ x < +∞, the PDF of the Burr 4-parameter distribution is:
f(x) = ; (1)
where k and α > 0 are the 2 shape parameters, β > 0 is the scale parameter, and γ is the loca-tion parameter. If γ = 0, then the distribution can be simplified to a 3-parameter one. The
CDF of the Burr 4-parameter distribution of the random variable, x, is:
F(x) = 1–
. (2)
Dagum distributionThe Dagum distribution (Dagum 1977)
is an inverse Burr distribution (Klugman et al. 1998). It is also known as the kappa distribu-tion (Mielke 1973, Mielke and Johnson 1973) and extended Burr-III distribution (Shao et al. 2008). With the support random variable, x (γ ≤ x < +∞), the PDF of the Dagum 4-parameter distribution is:
f(x) = (γ ≤ x + ∞); (3)
where k and α > 0 are the 2 shape parameters, β > 0 is the scale parameter, and γ is the loca-tion parameter. If γ = 0, then the distribution is a 3-parameter one. The CDF of the Dagum 4-parameter distribution is:
F(x) = . (4)
Johnson SB distributionThe Johnson SB (1949) has been very
commonly used in forest distributional studies (Hafley and Schreuder 1977) because of its flexibility of distributional form and its abil-ity to equally well represent positively and negatively skewed distributions. Equations (5) and (6) show the PDF and CDF of the John-son SB distribution for a random variable, x. In the equations, ε and λ denote location and range parameters, δ and γ are 2 shape param-eters, and Φ is the Laplace integral (Zhang et al. 2003).
34 Tsogt et al.─Stand structure of natural even-aged pine forests in Mongolia
f(x) = exp
. (5)
F(x) = Φ . (6)
Model fittingIn these PDFs, parameters can be esti-
mated by different statistical methods such as maximum-likelihood (ML), moments, and percentiles. Parameters of the PDFs in this paper were estimated by the ML method us-ing the distribution fitting software, Easyfit 5.5 Professional (MathWave Technologies 2013).
Model comparisonTo evaluate the fitted PDF models, Kol-
omogorov-Smirnov (K-S), Anderson-Darling (A-D), and χ2 tests were used for testing the goodness-of-fit. The K-S test (Kolmogorov 1933, Smirnov 1948) is a nonparametric test of the equality of a continuous, 1-dimensional probability distribution that can be used to compare a sample with a reference (or theo-retical) probability distribution. It is based on the empirical CDF. The CDF is the prob-ability that the variable takes a value of ≤ x. For continuous distributions, the CDF is ex-pressed by equation (7):
F(x) = ∫x
–∞ f(t)dt. (7)
So the theoretical CDF is displayed as a continuous curve. The empirical CDF (Eq. 8) is displayed as a stepped discontinuous line based on the number of bins:
Fn(x) = *[Number of observations ≤ x]. (8)
The K-S statistic is based on the largest vertical difference between the theoretical and empirical CDFs. Critical K-S values used
in this study were based on a table published in the statistical literature (D’Agostino and Stephens 1986). The A-D test (Anderson and Darling 1952) is also a nonparametric test of whether there is evidence that a given sample of data did not arise from a given probability distribution. It is more sensitive to the tails of a distribution than the K-S test. The χ2
test (Chernoff and Lehmann 1954) is used for binned data and checks if sample data came from a specific distribution. The value of the test statistic depends on how the data is binned. The dbh and height data were grouped into intervals of equal probabilities. Each bin should contain at least 5 or more data points, otherwise no answer is available.
Hypothesis tests of dbh and height struc-ture models were carried out by examining the p value that was associated with a good-ness-of-fit statistic. When the p value was less than a predefined critical value or a signifi-cant probability level, the null hypothesis was rejected, and it was concluded that the data did not come from the specified distribution.
RESULTS
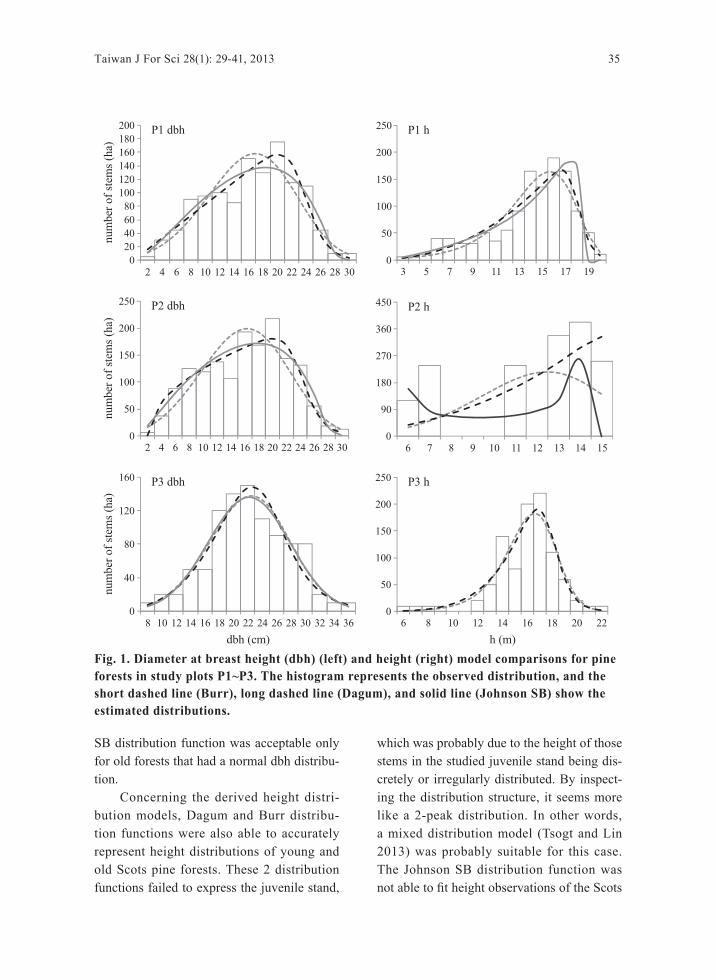
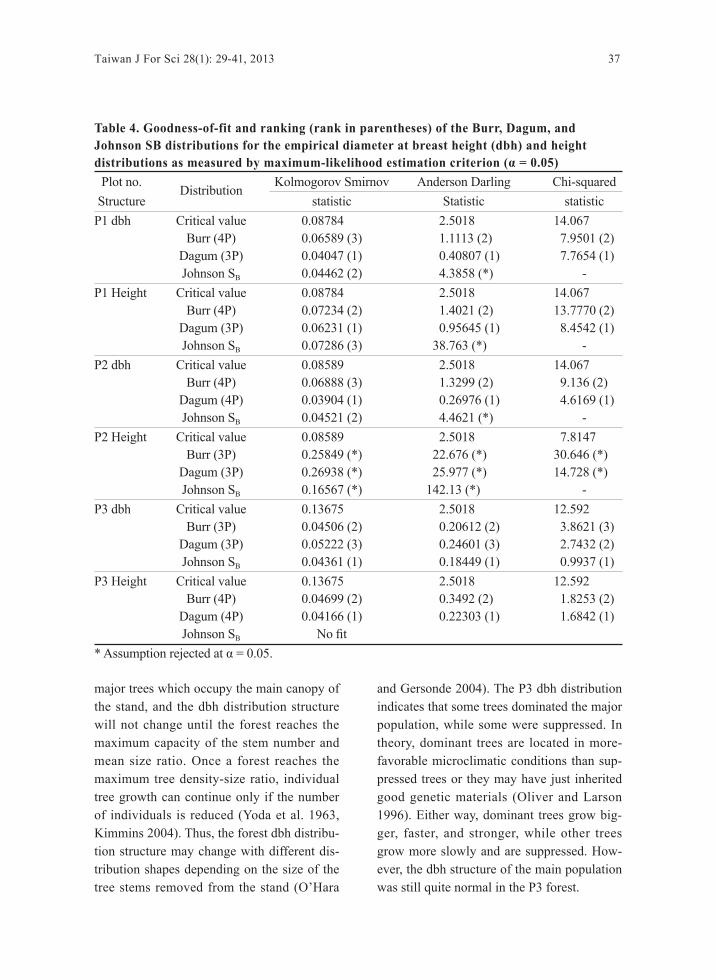
Figure 1 demonstrates the tallied fre-quency of the observed dbh and height of the studied forests. The stem dbh and height were respectively grouped into 2-cm and 1-m widths. The derived PDF distribution models of each site by Burr, Dagum, and Johnson methods are also demonstrated. Table 3 shows the corresponding parameters of the derived distribution models in Fig. 1. According to the test results of the goodness-of-fit shown in Table 4, the Dagum and Burr distribution functions are suitable for representing the dbh structure of Scots pine forests because the K-S, A-D, and χ2 statistics all agreed that the dbh distribution models were acceptable for young, juvenile, and old forests. The Johnson
35Taiwan J For Sci 28(1): 29-41, 2013
SB distribution function was acceptable only for old forests that had a normal dbh distribu-tion.
Concerning the derived height distri-bution models, Dagum and Burr distribu-tion functions were also able to accurately represent height distributions of young and old Scots pine forests. These 2 distribution functions failed to express the juvenile stand,
which was probably due to the height of those stems in the studied juvenile stand being dis-cretely or irregularly distributed. By inspect-ing the distribution structure, it seems more like a 2-peak distribution. In other words, a mixed distribution model (Tsogt and Lin 2013) was probably suitable for this case. The Johnson SB distribution function was not able to fit height observations of the Scots
Fig. 1. Diameter at breast height (dbh) (left) and height (right) model comparisons for pine forests in study plots P1~P3. The histogram represents the observed distribution, and the short dashed line (Burr), long dashed line (Dagum), and solid line (Johnson SB) show the estimated distributions.
36 Tsogt et al.─Stand structure of natural even-aged pine forests in Mongolia
pine forests. The Weibull distribution func-tion was found (results not shown) to be able to express the dbh and height structure of the stands, but the test of goodness-of-fit showed that the results were identical to the derived Burr distribution models.
DISCUSSION
Distribution features of the derived dbh models
By visual inspection of the histogram shown in Fig. 1, one can see that young and juvenile forests had peaks in the 20-cm dbh class. The derived Burr and Johnson SB mod-els peaked at the 16-cm position, which was somewhat distant from the observed peak location. In contrast, the curve of the derived Dagum model peaked at the same location as the observed one. The dbh histogram of the old forest was almost identical to a normal distribution. In this case, the curves of the derived Dagum, Burr, and Johnson SB mod-els accurately peaked at the location of the observed peak. This indicated that the Dagum function had a better ability to obtain the spe-
cific curve feature which is the most clumped dbh class. Peaks estimated by the Burr mod-els were almost identical to the average dbh position of the observed histogram. This can be seen from Table 2. The derived Johnson SB model peaked at a position covering the dominant DBH classes, which made its curve a little bit flat. This was more evident in plot 2 of juvenile forests in Fig. 1.
The P1 and P2 dbh distributions were identical, even though their geographical lo-cations and ages differed. According to their dbh distribution shape, their regeneration and growth patterns were the same. In P1 and P2, most stems were established shortly after a disturbance, and this still left enough grow-ing space for stems to become established later, in 1960~1965 (P2) and 1990~1995 (P1) (Tsogt et al. 2008). During 5 yr, many seed-lings successfully grew and survived after re-generation; those are 10-yr old in P1 and 40-yr old in P2. They are evident on the P1 and P2 dbh distributions of Fig. 1, where plateaus are on the left side of the peak. Left-tailed dbh distributions indicate that growth space is still sufficient (in free growth situations) for
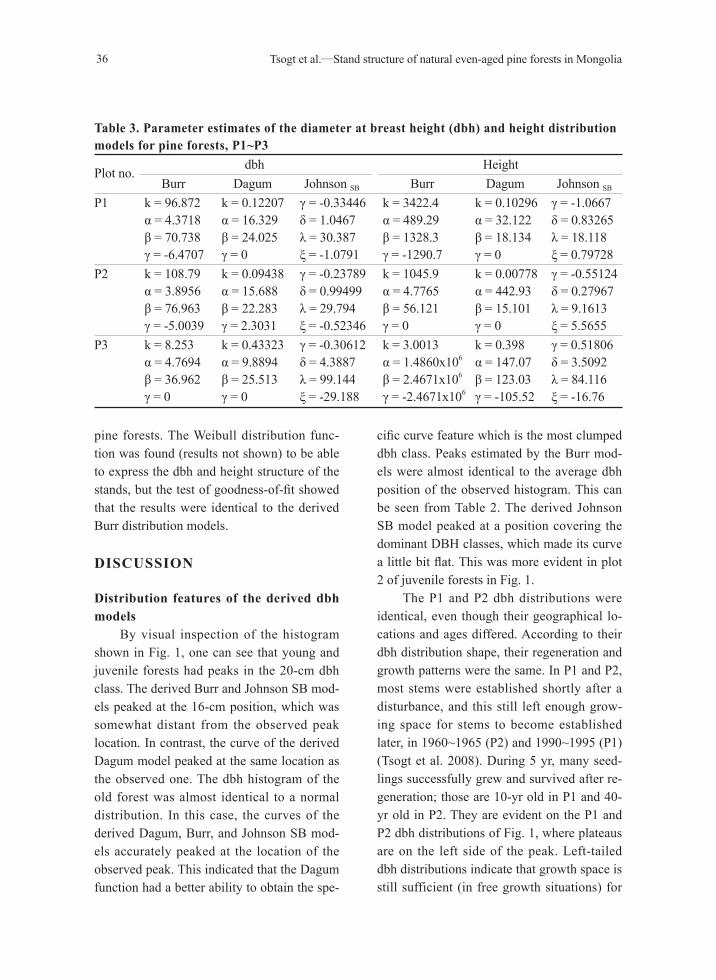
Table 3. Parameter estimates of the diameter at breast height (dbh) and height distribution models for pine forests, P1~P3
Plot no. dbh Height Burr Dagum Johnson SB Burr Dagum Johnson SB
P1 k = 96.872 k = 0.12207 γ = -0.33446 k = 3422.4 k = 0.10296 γ = -1.0667 α = 4.3718 α = 16.329 δ = 1.0467 α = 489.29 α = 32.122 δ = 0.83265 β = 70.738 β = 24.025 λ = 30.387 β = 1328.3 β = 18.134 λ = 18.118 γ = -6.4707 γ = 0 ξ = -1.0791 γ = -1290.7 γ = 0 ξ = 0.79728P2 k = 108.79 k = 0.09438 γ = -0.23789 k = 1045.9 k = 0.00778 γ = -0.55124 α = 3.8956 α = 15.688 δ = 0.99499 α = 4.7765 α = 442.93 δ = 0.27967 β = 76.963 β = 22.283 λ = 29.794 β = 56.121 β = 15.101 λ = 9.1613 γ = -5.0039 γ = 2.3031 ξ = -0.52346 γ = 0 γ = 0 ξ = 5.5655P3 k = 8.253 k = 0.43323 γ = -0.30612 k = 3.0013 k = 0.398 γ = 0.51806 α = 4.7694 α = 9.8894 δ = 4.3887 α = 1.4860x10⁶ α = 147.07 δ = 3.5092 β = 36.962 β = 25.513 λ = 99.144 β = 2.4671x10⁶ β = 123.03 λ = 84.116 γ = 0 γ = 0 ξ = -29.188 γ = -2.4671x10⁶ γ = -105.52 ξ = -16.76
37Taiwan J For Sci 28(1): 29-41, 2013
major trees which occupy the main canopy of the stand, and the dbh distribution structure will not change until the forest reaches the maximum capacity of the stem number and mean size ratio. Once a forest reaches the maximum tree density-size ratio, individual tree growth can continue only if the number of individuals is reduced (Yoda et al. 1963, Kimmins 2004). Thus, the forest dbh distribu-tion structure may change with different dis-tribution shapes depending on the size of the tree stems removed from the stand (O’Hara
and Gersonde 2004). The P3 dbh distribution indicates that some trees dominated the major population, while some were suppressed. In theory, dominant trees are located in more-favorable microclimatic conditions than sup-pressed trees or they may have just inherited good genetic materials (Oliver and Larson 1996). Either way, dominant trees grow big-ger, faster, and stronger, while other trees grow more slowly and are suppressed. How-ever, the dbh structure of the main population was still quite normal in the P3 forest.
Table 4. Goodness-of-fit and ranking (rank in parentheses) of the Burr, Dagum, and Johnson SB distributions for the empirical diameter at breast height (dbh) and height distributions as measured by maximum-likelihood estimation criterion (α = 0.05) Plot no. Distribution Kolmogorov Smirnov Anderson Darling Chi-squared Structure statistic Statistic statisticP1 dbh Critical value 0.08784 2.5018 14.067 Burr (4P) 0.06589 (3) 1.1113 (2) 7.9501 (2) Dagum (3P) 0.04047 (1) 0.40807 (1) 7.7654 (1) Johnson SB 0.04462 (2) 4.3858 (*) -P1 Height Critical value 0.08784 2.5018 14.067 Burr (4P) 0.07234 (2) 1.4021 (2) 13.7770 (2) Dagum (3P) 0.06231 (1) 0.95645 (1) 8.4542 (1) Johnson SB 0.07286 (3) 38.763 (*) -P2 dbh Critical value 0.08589 2.5018 14.067 Burr (4P) 0.06888 (3) 1.3299 (2) 9.136 (2) Dagum (4P) 0.03904 (1) 0.26976 (1) 4.6169 (1) Johnson SB 0.04521 (2) 4.4621 (*) -P2 Height Critical value 0.08589 2.5018 7.8147 Burr (3P) 0.25849 (*) 22.676 (*) 30.646 (*) Dagum (3P) 0.26938 (*) 25.977 (*) 14.728 (*) Johnson SB 0.16567 (*) 142.13 (*) -P3 dbh Critical value 0.13675 2.5018 12.592 Burr (3P) 0.04506 (2) 0.20612 (2) 3.8621 (3) Dagum (3P) 0.05222 (3) 0.24601 (3) 2.7432 (2) Johnson SB 0.04361 (1) 0.18449 (1) 0.9937 (1)P3 Height Critical value 0.13675 2.5018 12.592 Burr (4P) 0.04699 (2) 0.3492 (2) 1.8253 (2) Dagum (4P) 0.04166 (1) 0.22303 (1) 1.6842 (1) Johnson SB No fit * Assumption rejected at α = 0.05.
38 Tsogt et al.─Stand structure of natural even-aged pine forests in Mongolia
Distribution features of the derived height models
As can be seen, height distributions of P1 and P3 were continuous with long left tails and outstanding peaks at the larger end of the curves, while that of P2 was discrete with 2 separate distinct groups (2 gaps exist at 8~10 and 12 m). It was also evident that the height growth of the P2 stand was worse than those of P1 and P3. This demonstrated that the P1 and P3 stands were growing without adverse influences or effective disturbances, but on the contrary, the P2 stand appeared to have been significantly disturbed. Another consid-eration is that tree height repression occurs first in short trees with small trees crowns. In our case, those were 6- and 7-m-high trees in the P2 distribution which were ~40-yr-old stems according to the graphical analysis in Fig. 1. This can occur in individual trees as they become suppressed or in entire stands as they approach stagnation (Eversol 1955). This explains why the average height of P2 was shorter than that of P1. As a result, the Burr, Dagum, and Johnson functions were able to extract suitable distribution models for the non-disturbed stands, but failed to derive a meaningful height structure of the discretely distributed stand.
According to Oliver and Larson (1996), trees with close neighbors on both sides maintain small live crowns, and their height growth eventually slows. When an adjacent tree has a wider spacing on the far side, it maintains rapid height growth. The canopy of the P2 stand was much closer than those of P1 and P3, this was probably why the P2 stand showed a smaller height at age compared to the P1 and P3 stands.
There are many factors that might influ-ence the structure of forest stands. There are inherent factors (such as aging and genetics), physical factors (such as site properties), nat-
ural disturbances (such as fire, wind, insects, and disease), and management practices (such as thinning and logging) (Oliver and Larson 1996). In even-aged stands, competition for light, water, and nutrients depends largely on the number of stems per unit area. Stand canopy closure might become pronouncedly heterogeneous due to a combination of en-vironmental and genetic factors. Some trees became dominant while others became sup-pressed over time (Barnes et al. 1998). Any changes in these factors will cause the contin-uous forest distribution to break down, creat-ing a discrete or irregular distribution. In this situation, a better suggestion for modeling of the forest structure is to first diagnose the ob-served histogram and then fit the distribution using a mixed model.
CONCLUSIONS
The dbh and height distributions of natu-rally generated, even-aged young pine forests are left-tailed in Western Khentey, Mongolia. Few distribution functions have the ability to simulate left-skewed distributions. The Burr, Dagum, and Johnson SB PDFs can theoreti-cally describe both left- and right-skewed distributions. However, our study showed that the Dagum distribution was superior accord-ing to the statistics of the model goodness-of-fit test. The Burr PDF was generally good enough to model the diameter and height dis-tributions. The Johnson SB was found to be the best only for the case of a normal distri-bution. In fact, the Johnson SB is good at ex-tracting heavily tailed or bounded tail shapes which were not found in this study.
dbh and height distribution models can be employed to predict the number of stems of various dbh and height classes of a forest stand up to 65 years of age. In addition, the height distribution of a forest stand should be
39Taiwan J For Sci 28(1): 29-41, 2013
considered and determined simultaneously for a better explanation of the forest structure and also for better estimates of forest volume stocks. For example, the dbh distribution shapes of P1 and P2 were almost identical; they could be considered to have same struc-ture, while their height structures obviously greatly differed. The height distribution of P2 revealed the degree of seriousness the competition for resources among tree stems in the stand was. Moreover, although the dbh distribution of the old forest stand showed a normal distribution, its height distribution contrarily demonstrated that some trees were constantly suppressed by dominant trees. Without an analysis of the height distribu-tions, we could not have figured out much information about the formation of the forest structure. This kind of information is vital for forest management planning and thinning or an understanding of how structures of natural forests behave due to variations of driving factors (stem density and other environment factors).
For actual applications, it is suggested that the Burr function is suitable for deriving the distribution as its peak tends to average classes of forest diameter and height struc-ture, while the Dagum function is better for finding the dominant size class. The Johnson SB function is suggested for drawing a flat-tened distribution shape where dominant size classes are clumped together or size classes are equally distributed along the range of dis-tribution (Tsogt and Lin 2011c).
ACKNOWLEDGEMENTS
This work was carried out with the sup-port of the National Science Council, Taiwan and a project funded by the Taiwan Forestry Bureau (100AS-8.3.3-FB-e1). The authors are also thankful to the Institute of Botany, Mon-
golian Academy of Sciences and Mongolian-Russian joint biological complex project for gathering the forest inventory data.
LITERATURE CITED
Anderson TW, Darling DA. 1952. Asymp-totic theory of certain “goodness-of-fit” criteria based on stochastic processes. Ann Math Sta-tistics 23:193-212.Bailey RL, Dell TR. 1973. Quantifying diam-eter distribution with the Weibull-function. For Sci 19:97-104.Barnes BV, Zak DR, Denton SR, Spurr SH. 1998. Forest ecology. 4th edition. New York: J Wiley.Chernoff H, Lehmann EL. 1954. The use of maximum likelihood estimates in χ2 tests for goodness-of-fit. Ann Math Statistics 25(3):579-86.Chiu CM, Nigh G, Chien CT, Ying CC. 2010. Diameter distribution models for thinned tai-wania (Taiwania cryptomeroides) plantations. Aust For 73(1):3-11.Dagum C. 1977. A new model of personal income distribution: specification and estima-tion. Econ Appl 30:413-37.D'Agostino RB, Stephens MA. 1986. Good-ness-of-fit techniques, New York: Marcel Dekker.Eversole KR. 1955. Spacing test in a Douglas-fir plantation. For Sci 1:14-8.Hafley WL, Buford MA. 1985. A bivariate model for growth and yield prediction. For Sci 31:237-47.Hafley WL, Schreuder HT. 1977. Statistical distributions for fitting diameter and height data in even-aged stands. Can J For Res 7:481-7.Huang KL, Wang CH, Yen TM. 2012. Pre-dicting diameter distribution of four main Taiwanese coniferous plantations based on the Weibull function. Conference proceedings in Sustainable Forest Ecosystem Management
40 Tsogt et al.─Stand structure of natural even-aged pine forests in Mongolia
in Rapidly Changing World. 12-14 Sept 2012. Ilan, Taiwan: Ilan Univesity. 22 p.Johnson NL. 1949. Systems of frequency curves generated by methods of translation. Biometrika 36:149-76.Kamziah AK, Ahmad MI, Lapongan J. 1999. Nonlinear regression approach to esti-mating Johnson SB parameters for diameter data. Can J For Res 29:310-4.Kimmins JP. 2004. Forest ecology: a founda-tion for sustainable forest management and environmental ethics in forestry, 3rd edition. Upper Saddle River, NJ: Prentice Hall.Klugman SA, Panjer HH, Willmot GE. 1998. Loss models. New York: J Wiley.Knoebel BR, Burkhart HE. 1991. A bivari-ate distribution approach to modeling forest diameter distributions at two points of time. Biometrics 47:241-53.Kolmogorov A. 1933. Sulla determinazione empirica di una legge di distribuzione. G Inst Ital Attuari 4:83.Li F, Zhang L, Davis CJ. 2002. Modeling the joint distribution of tree diameters and heights by bivariate generalized beta distribution. For Sci 48(1):47-58.Lin C, Chan MH, Chen FS, Wang YN. 2007. Age structure and growth pattern of an endan-gered species, Amentotaxus formosana Li. J Integr Plant Biol 49(2):157-67.Lindsay SR, Wood GR, Woollons RC. 1996. Modelling the diameter distribution of forest stands using the Burr distribution. J Appl Stat 23:609-19.MathWave Technologies. 2013. Mathwave data analysis and simulation. Available at http://www.mathwave.com/help/easyfit/html/analyses/fitting/manual.html. Accessed 30 Aug 2012.Gove JH, Ducey MJ, Leak WB, Zhang L. 2008. Rotated sigmoid structures in managed uneven-aged northern hardwood stands: a look at the Burr type III distribution. Forestry
81:161-76.O’Hara KL, Gersonde RF. 2004. Stocking control concepts in uneven-aged silviculture. Forestry 77(2):131-43.Oliver C, Larson B. 1996. Forest stand dy-namics: update edition. New York: J Wiley.Rennols K, Wang M. 2005. A new param-eterization of Johnson’s SB distribution with application to fitting forest tree diameter data. Can J For Res 35:575-9.Rodriguez RN. 1977. A guide to the Burr type XII distributions. Biometrika 64:129-34.Smirnov NV. 1948. Tables for estimating the goodness of fit of empirical distributions. Ann Math Statistics 19:279.Scolforo JRS, Tabai FCV, Macedo RLG, Acerbi FW, Assis AL. 2003. SB distribution’s accuracy to represent the diameter distribution of Pinus taeda, through five fitting methods. For Ecol Manage 175:489-96.Tadikamalla PR. 1980. A look at the Burr and related distributions. Int Stat Rev 48:337-44.Tsedendash G. 1993. Forest vegetation of the Khentey Mountains. PhD dissertation, Institute of Botany, Mogolian Academy of Sciences, Ulaanbaatar, Mongolia. [in Mongolian].Tsogt K, Dugarsuren N, Lin C, Zandraabal T. 2011a. Larch stand structure analysis of boreal forest in Mongolia. ICEST2011. Singa-pore: IACSIT Press 6:2123-7.Tsogt K, Lin C. 2013. A flexible modeling of irregular diameter structure for the vol-ume estimation of forest stands. J For Res DOI:10.1007/s10310-012-0380-z.Tsogt K, Lin C, Zandraabal T. 2011b. Di-ameter structure analysis of forest stand and selection of suitable model. Mongolian J Biol Sci 9(1-2):19-22.Tsogt K, Zandraabal T, Marnaan B, Dugar-jav D, Lin C. 2011c. To describe birch forest diameter distribution study by Weibull and lognormal model in eastern Khentey. NUM memoir, biology. Ulaanbaatar 15:93-102. [in
41Taiwan J For Sci 28(1): 29-41, 2013
Mongolian with English summary].Tsogt Z, Tsedendash G, Dorjsuren C, Tushigmaa J. 2008. Eastern Khentii forests structure, productivity and dynamic: in research report of north-eastern Mongolian forests structure, productivity and dynamic. Ulaan-baatar, Mongolia: Institute of Botany, Mon-golian Academy of Science. [in Mongolian].Wang M, Upadhyay A, Zhang L. 2010. Tri-variate distribution modeling of tree diameter, height, and volume. For Sci 56:290-300.Yang Y, Feng F. 1989. The application of parameter prediction models and parameter recovery models to the analysis of tree growth and stand structure in Taiwan. Q J Chin For 22(1):53-71.
Yoda K, Kira T, Ogawa H, Hozumi K. 1963. Self-thinning in overcrowded pure stands un-der cultivated and natural conditions. J Biol Osaka City Univ. 14:107-29.Zhang L, Packard KC, Liu C. 2003. A comparison of estimation methods for fitting Weibull and Johnson’s SB distributions to mixed spruce-fir stands in northeastern North America. Can J For Res 33:1340-7.Zhou B, McTague JP. 1996. Comparison and evaluation of five methods of estimation of the Johnson system parameters. Can J For Res 26:928-35.Zimmer WJ, Burr IW. 1963. Variables sam-pling plans based on non-normal populations. Industrial Quality Control 21: 18-36.

42