Diagnosing osteoporosis by using dental panoramic radiographs: The OSTEODENT project
8
Diagnosing osteoporosis by using dental panoramic radiographs: The OSTEODENT project Hugh Devlin, BDS, BSc, MSc, PhD, a Kety Karayianni, DDS, PhD, b Anastasia Mitsea, DDS, MSc, c Reinhilde Jacobs, LDS, MSc, PhD, d Christina Lindh, DDS, Odont Dr, e Paul van der Stelt, DDS, PhD, f Elizabeth Marjanovic, BSc, MSc, PhD, g Judith Adams, MBBS, FRCR, FRCP, h Susan Pavitt, BSc, PhD, i and Keith Horner, BChD, MSc, PhD, FDSRCPS Glasg, FRCR, DDR, j Manchester, England; Athens, Greece; Leuven, Belgium; Malmö, Sweden; and Amsterdam, The Netherlands UNIVERSITY OF MANCHESTER, UNIVERSITY OF ATHENS, KATHOLIEKE UNIVERSITEIT LEUVEN, MALMÖ UNIVERSITY, AND ACADEMIC CENTRE FOR DENTISTRY Objectives. Measurement of cortical thickness and subjective assessment of cortical porosity on panoramic radiographs are methods previously reported for diagnosing osteoporosis. The aims of this study were to determine the relative efficacy of the mandibular cortical index and cortical width in detecting osteoporosis, both alone and in combination, and to determine the optimal cortical width threshold for referral for additional osteoporosis investigation. Study design. Six hundred seventy-one postmenopausal women 45 to 70 years of age were recruited for this study. They received dual energy x-ray absorptiometry (DXA) scans of the left hip and lumbar spine (L1 to L4), and dental panoramic radiographic examinations of the teeth and jaws. Three observers separately assessed the mandibular cortical width and porosity in the mental foramen region of the mandible. Cortical width was corrected for magnification errors. Chi-squared automatic interaction detection analysis (CHAID) software was used (SPSS AnswerTree, version 3.1, SPSS Inc., Chicago, IL). Results. Chi-squared automatic interaction detection analysis showed that the cortical porosity was a poorer predictor of osteoporosis than mandibular cortical width. For the 3 observers, a mandibular cortical width of 3 mm provided diagnostic odds ratios of 6.51, 6.09, and 8.04. The test is therefore only recommended in triage screening of individuals by using radiographs made for purposes other than osteoporosis. Conclusion. When evaluating panoramic radiographs, only those patients with the thinnest mandibular cortices (i.e., 3 mm) should be referred for further osteoporosis investigation. (Oral Surg Oral Med Oral Pathol Oral Radiol Endod 2007;104:821-8) Cortical width and porosity on dental panoramic radio- graphs have been shown to be potentially useful meth- ods of assessing an individual’s risk of systemic osteo- porosis. 1 These radiographs are primarily taken as an aid to the diagnosis of oral and dental disease but may also provide information about a patient’s osteoporotic status. The OSTEODENT project was a collaboration between 5 European centers to determine the best ra- diographic and clinical method of identifying those individuals most at risk of osteoporosis. A thin mandibular cortical width has been shown to be correlated with reduced skeletal bone mineral den- sity, but controversy surrounds the issue of what con- stitutes a “thin” cortical threshold, as this affects the sensitivity and specificity of the diagnostic test. It has been recommended that a cortical width 4.5 mm should be used as an indicator of high osteoporosis risk. 2 Although choosing a 4.5 mm threshold will produce a high-sensitivity test, it will produce a large number of false-positives and unnecessary further con- firmatory bone mineral density examinations. Using this threshold in this study, a sensitivity of 89.5% and specificity of 33.9% (diagnostic odds ratio 4.4) was This work was supported by a research and technological develop- ment project grant from the European Commission Fifth Framework Programme, Quality of Life and Management of Living Resources (QLK6-2002-02243; OSTEODENT). a Reader, School of Dentistry, University of Manchester. b Professor, Dental School, University of Athens. c Postgraduate doctoral student, Dental School, University of Athens. d Oral Imaging Centre, School of Dentistry, Oral Pathology and Maxillofacial Surgery, Katholieke Universiteit Leuven. e Associate Professor, Faculty of Odontology, Malmo University. f Professor, Academic Centre for Dentistry. g Research Associate, Imaging Science and Biomedical Engineering, University of Manchester. h Professor, Imaging Science and Biomedical Engineering, University of Manchester. i Cochrane Senior Research Fellow, School of Dentistry, University of Manchester. j School of Dentistry, University of Manchester. Received for publication Sep 15, 2006; returned for revision Nov 7, 2006; accepted for publication Dec 22, 2006. 1079-2104/$ - see front matter © 2007 Mosby, Inc. All rights reserved. doi:10.1016/j.tripleo.2006.12.027 821
Transcript of Diagnosing osteoporosis by using dental panoramic radiographs: The OSTEODENT project

Diagnosing osteoporosis by using dental panoramic radiographs:The OSTEODENT projectHugh Devlin, BDS, BSc, MSc, PhD,a Kety Karayianni, DDS, PhD,b Anastasia Mitsea, DDS, MSc,c
Reinhilde Jacobs, LDS, MSc, PhD,d Christina Lindh, DDS, Odont Dr,e Paul van der Stelt, DDS, PhD,f
Elizabeth Marjanovic, BSc, MSc, PhD,g Judith Adams, MBBS, FRCR, FRCP,h Susan Pavitt, BSc, PhD,i
and Keith Horner, BChD, MSc, PhD, FDSRCPS Glasg, FRCR, DDR,j Manchester, England; Athens,Greece; Leuven, Belgium; Malmö, Sweden; and Amsterdam, The NetherlandsUNIVERSITY OF MANCHESTER, UNIVERSITY OF ATHENS, KATHOLIEKE UNIVERSITEIT LEUVEN, MALMÖUNIVERSITY, AND ACADEMIC CENTRE FOR DENTISTRY
Objectives. Measurement of cortical thickness and subjective assessment of cortical porosity on panoramic radiographs aremethods previously reported for diagnosing osteoporosis. The aims of this study were to determine the relative efficacy ofthe mandibular cortical index and cortical width in detecting osteoporosis, both alone and in combination, and todetermine the optimal cortical width threshold for referral for additional osteoporosis investigation.Study design. Six hundred seventy-one postmenopausal women 45 to 70 years of age were recruited for this study.They received dual energy x-ray absorptiometry (DXA) scans of the left hip and lumbar spine (L1 to L4), and dentalpanoramic radiographic examinations of the teeth and jaws. Three observers separately assessed the mandibularcortical width and porosity in the mental foramen region of the mandible. Cortical width was corrected formagnification errors. Chi-squared automatic interaction detection analysis (CHAID) software was used (SPSSAnswerTree, version 3.1, SPSS Inc., Chicago, IL).Results. Chi-squared automatic interaction detection analysis showed that the cortical porosity was a poorer predictorof osteoporosis than mandibular cortical width. For the 3 observers, a mandibular cortical width of �3 mm provideddiagnostic odds ratios of 6.51, 6.09, and 8.04. The test is therefore only recommended in triage screening ofindividuals by using radiographs made for purposes other than osteoporosis.Conclusion. When evaluating panoramic radiographs, only those patients with the thinnest mandibular cortices (i.e.,�3 mm) should be referred for further osteoporosis investigation. (Oral Surg Oral Med Oral Pathol Oral Radiol Endod
2007;104:821-8)This work was supported by a research and technological develop-ment project grant from the European Commission Fifth FrameworkProgramme, Quality of Life and Management of Living Resources(QLK6-2002-02243; OSTEODENT).aReader, School of Dentistry, University of Manchester.bProfessor, Dental School, University of Athens.cPostgraduate doctoral student, Dental School, University of Athens.dOral Imaging Centre, School of Dentistry, Oral Pathology andMaxillofacial Surgery, Katholieke Universiteit Leuven.eAssociate Professor, Faculty of Odontology, Malmo University.fProfessor, Academic Centre for Dentistry.gResearch Associate, Imaging Science and Biomedical Engineering,University of Manchester.hProfessor, Imaging Science and Biomedical Engineering, Universityof Manchester.iCochrane Senior Research Fellow, School of Dentistry, University ofManchester.jSchool of Dentistry, University of Manchester.Received for publication Sep 15, 2006; returned for revision Nov 7,2006; accepted for publication Dec 22, 2006.1079-2104/$ - see front matter© 2007 Mosby, Inc. All rights reserved.
doi:10.1016/j.tripleo.2006.12.027Cortical width and porosity on dental panoramic radio-graphs have been shown to be potentially useful meth-ods of assessing an individual’s risk of systemic osteo-porosis.1 These radiographs are primarily taken as anaid to the diagnosis of oral and dental disease but mayalso provide information about a patient’s osteoporoticstatus. The OSTEODENT project was a collaborationbetween 5 European centers to determine the best ra-diographic and clinical method of identifying thoseindividuals most at risk of osteoporosis.
A thin mandibular cortical width has been shown tobe correlated with reduced skeletal bone mineral den-sity, but controversy surrounds the issue of what con-stitutes a “thin” cortical threshold, as this affects thesensitivity and specificity of the diagnostic test. It hasbeen recommended that a cortical width �4.5 mmshould be used as an indicator of high osteoporosisrisk.2 Although choosing a �4.5 mm threshold willproduce a high-sensitivity test, it will produce a largenumber of false-positives and unnecessary further con-firmatory bone mineral density examinations. Usingthis threshold in this study, a sensitivity of 89.5% and
specificity of 33.9% (diagnostic odds ratio � 4.4) was821
OOOOE822 Devlin et al. December 2007
achieved for identifying spinal osteoporosis in post-menopausal women. Diagnostic odds ratio is the ratioof the positive likelihood ratio and the negative likeli-hood ratio.
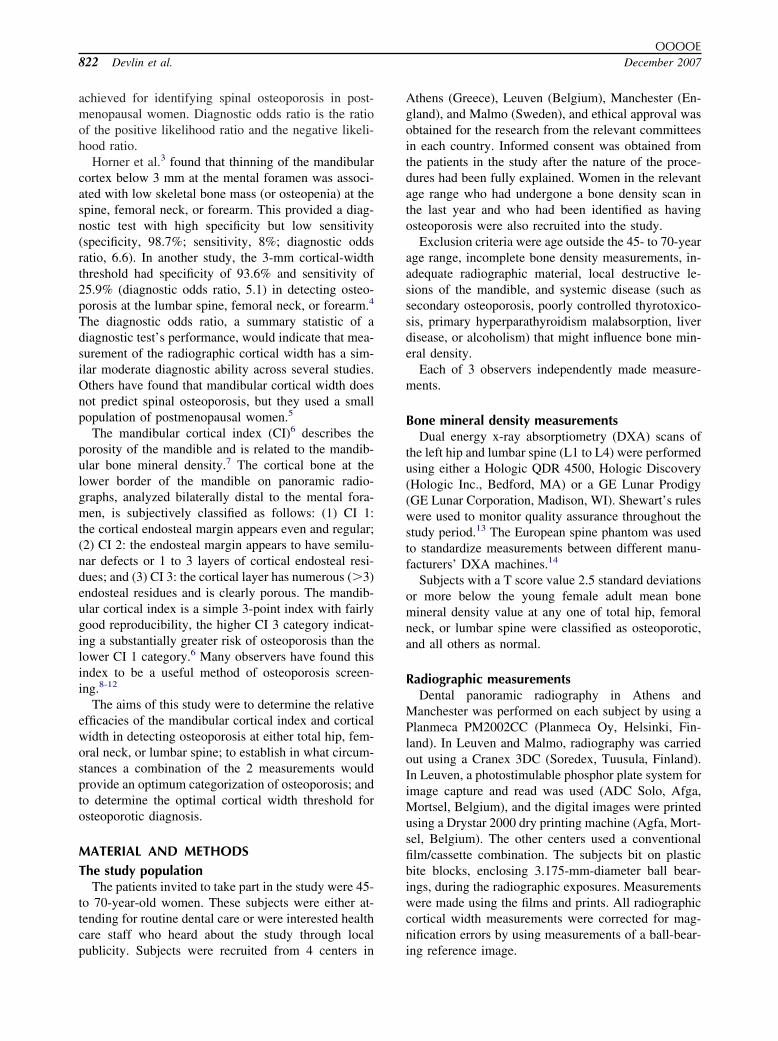
Horner et al.3 found that thinning of the mandibularcortex below 3 mm at the mental foramen was associ-ated with low skeletal bone mass (or osteopenia) at thespine, femoral neck, or forearm. This provided a diag-nostic test with high specificity but low sensitivity(specificity, 98.7%; sensitivity, 8%; diagnostic oddsratio, 6.6). In another study, the 3-mm cortical-widththreshold had specificity of 93.6% and sensitivity of25.9% (diagnostic odds ratio, 5.1) in detecting osteo-porosis at the lumbar spine, femoral neck, or forearm.4
The diagnostic odds ratio, a summary statistic of adiagnostic test’s performance, would indicate that mea-surement of the radiographic cortical width has a sim-ilar moderate diagnostic ability across several studies.Others have found that mandibular cortical width doesnot predict spinal osteoporosis, but they used a smallpopulation of postmenopausal women.5
The mandibular cortical index (CI)6 describes theporosity of the mandible and is related to the mandib-ular bone mineral density.7 The cortical bone at thelower border of the mandible on panoramic radio-graphs, analyzed bilaterally distal to the mental fora-men, is subjectively classified as follows: (1) CI 1:the cortical endosteal margin appears even and regular;(2) CI 2: the endosteal margin appears to have semilu-nar defects or 1 to 3 layers of cortical endosteal resi-dues; and (3) CI 3: the cortical layer has numerous (�3)endosteal residues and is clearly porous. The mandib-ular cortical index is a simple 3-point index with fairlygood reproducibility, the higher CI 3 category indicat-ing a substantially greater risk of osteoporosis than thelower CI 1 category.6 Many observers have found thisindex to be a useful method of osteoporosis screen-ing.8-12
The aims of this study were to determine the relativeefficacies of the mandibular cortical index and corticalwidth in detecting osteoporosis at either total hip, fem-oral neck, or lumbar spine; to establish in what circum-stances a combination of the 2 measurements wouldprovide an optimum categorization of osteoporosis; andto determine the optimal cortical width threshold forosteoporotic diagnosis.
MATERIAL AND METHODSThe study population
The patients invited to take part in the study were 45-to 70-year-old women. These subjects were either at-tending for routine dental care or were interested healthcare staff who heard about the study through local
publicity. Subjects were recruited from 4 centers inAthens (Greece), Leuven (Belgium), Manchester (En-gland), and Malmo (Sweden), and ethical approval wasobtained for the research from the relevant committeesin each country. Informed consent was obtained fromthe patients in the study after the nature of the proce-dures had been fully explained. Women in the relevantage range who had undergone a bone density scan inthe last year and who had been identified as havingosteoporosis were also recruited into the study.
Exclusion criteria were age outside the 45- to 70-yearage range, incomplete bone density measurements, in-adequate radiographic material, local destructive le-sions of the mandible, and systemic disease (such assecondary osteoporosis, poorly controlled thyrotoxico-sis, primary hyperparathyroidism malabsorption, liverdisease, or alcoholism) that might influence bone min-eral density.
Each of 3 observers independently made measure-ments.
Bone mineral density measurementsDual energy x-ray absorptiometry (DXA) scans of
the left hip and lumbar spine (L1 to L4) were performedusing either a Hologic QDR 4500, Hologic Discovery(Hologic Inc., Bedford, MA) or a GE Lunar Prodigy(GE Lunar Corporation, Madison, WI). Shewart’s ruleswere used to monitor quality assurance throughout thestudy period.13 The European spine phantom was usedto standardize measurements between different manu-facturers’ DXA machines.14
Subjects with a T score value 2.5 standard deviationsor more below the young female adult mean bonemineral density value at any one of total hip, femoralneck, or lumbar spine were classified as osteoporotic,and all others as normal.
Radiographic measurementsDental panoramic radiography in Athens and
Manchester was performed on each subject by using aPlanmeca PM2002CC (Planmeca Oy, Helsinki, Fin-land). In Leuven and Malmo, radiography was carriedout using a Cranex 3DC (Soredex, Tuusula, Finland).In Leuven, a photostimulable phosphor plate system forimage capture and read was used (ADC Solo, Afga,Mortsel, Belgium), and the digital images were printedusing a Drystar 2000 dry printing machine (Agfa, Mort-sel, Belgium). The other centers used a conventionalfilm/cassette combination. The subjects bit on plasticbite blocks, enclosing 3.175-mm-diameter ball bear-ings, during the radiographic exposures. Measurementswere made using the films and prints. All radiographiccortical width measurements were corrected for mag-nification errors by using measurements of a ball-bear-
ing reference image.
OOOOEVolume 104, Number 6 Devlin et al. 823
Three experienced radiologists independently mademeasurements on the dental panoramic radiographs ofmandibular cortical width in the region of the mentalforamen and of the mandibular cortical index. Themandibular cortical width was measured in the mentalforamen region, perpendicular to a tangent to the lowerborder of the mandible. Measurements were made us-ing an eyepiece graticule (Graticules Ltd., Tonbridge,England) with a �6 magnification lens and recorded tothe nearest 0.1 mm. Measurements from both sides ofthe mandible were averaged. The number of patientsfor whom cortical width and CI measurements weremade by each observer are shown in Table I. In somecases, observers were unable to complete measure-ments of all radiographs.
The 3 expert radiologists independently used thecortical index (CI) to classify mandibular cortical ero-sions. With this index, the most severe porosity of thecortical bone distal to the mental foramen on both sidesof the mandible is recorded. All measurements weremade with the observers blinded to the reference os-teoporotic diagnosis.
Statistical analysisChi-squared automatic interaction detection
(CHAID) analysis software provides information aboutwhich category combination of a predictor variableyields the highest percentage or the optimum predictionof a desired outcome (SPSS AnswerTree, version 3.1,SPSS, Inc.). Cortical widths and CI values were enteredsimultaneously into a CHAID analysis. By default,CHAID converted mandibular cortical width data intoordinal data with 10 categories, each with a similarnumber of cases. The division of any continuous vari-able into categories produces a range of values that donot produce a perfectly optimal classification. Chi-squared automatic interaction detection analysis com-pared the different categories and merged those cate-gories that showed no differences on the outcome byusing a likelihood ratio chi-square test. The significancevalue for merging categories was P � .05. Chi-squaredautomatic interaction detection partitioned the corticalwidth data into categories that show significant differ-
Table I. Mandibular cortical width and porosity
No. of observationsObserver 1
cortical widthObserver 2
cortical width co
Valid 645 653Missing 8 0
Complete measurements of all radiographs were not completed in soCI, cortical index.
ences as they relate to the presence of osteoporosis at
any site. The categories were reanalyzed until theycould not be further divided into significantly differentsubcategories or would contain less than 50 subjects. ABonferroni adjustment was used so that across therange of tests a 0.05 type 1 error rate was maintained.
After the tree analysis was complete, each end nodewas a subset of the study sample, containing cases witha certain range of the predictor variables (mandibularcortical width and/or cortical index). The risk of mis-classification was calculated as the proportion of allcases that were classified incorrectly by the tree anal-ysis. The percentage response indicated the percentageof osteoporotic individuals that were in the particularcategory at each node. The percentage index was theratio (�100) between the percentage of osteoporoticindividuals at that node to the overall percentage ofosteoporotic individuals in the overall sample. An op-timum threshold would therefore have the highest cu-mulative value of percentage index and percentageresponse. Previous work had recommended a corticalwidth of less than 3 mm4 and a cortical index �16 asthe optimum threshold.
The diagnostic odds ratio is a summary statistic of adiagnostic test’s performance. It was calculated for all3 observers by using either cortical index or corticalwidth to diagnose osteoporosis. A diagnostic odds ratiois the ratio of positive likelihood ratio (true positiverate/false-positive rate) and negative likelihood ratio(false-negative rate/true negative rate).
RESULTSSix hundred seventy-one consecutive women were
initially recruited to the study, but 8 subjects wereexcluded because they were less than 45 years of age.Two patients were excluded because total hip–bonemineral density had not been measured, and a further 8subjects were excluded because the dental panoramicradiographs were damaged, lost, or had unacceptableimage quality. Of the 653 subjects included in thestudy, 141 (21.6%) were classified as having osteopo-rosis involving at least 1 site. Observers differedslightly in the number of measurements that were pos-
r 3idth Observer 1 CI Observer 2 CI Observer 3 CI
649 652 6534 1 0
es.
Observertical w
6530
me cas
sible on the radiographs (Table I).

otal fe
OOOOE824 Devlin et al. December 2007
Observer 1 dataUsing CHAID analysis, the mandibular cortical
width had a stronger, more significant relationship withosteoporosis than cortical index (Fig. 1). Mandibularcortical width was partitioned into 4 categories thatgave significantly different proportions of osteoporoticindividuals from each other (P � .00001; chi-square �107.6). The highest prevalence of osteoporosis (64.1%)was found in node 1 (cortical width �2.7 mm), whichwas about 3 times higher than that of the whole sample(21.6%). The cortical index was not a significant vari-able in predicting osteoporosis and was excluded fromthe tree model. The estimate of the overall misclassifi-
Fig. 1. Chi-squared automatic interaction detection analysis (ocategorical variable. The figures above the row of boxes refresulting numbers (and percentage) of normal and osteoporoticcontains the number of individuals (and percentage of entire sat any site. Osteopor, osteoporosis present at femoral neck, t
Table II. Summary statistics using CHAID analysisfrom data collected by observer 1
Observer 1Cortical width
range (mm)Response
(%)*Index(%)†
Node 1 �2.7 64.1 296.2Node 2 2.7-3.1 36.9 170.7Node 3 3.1-3.7 23.6 109.1Node 4 �3.7 and missing 9.1 42.3
CHAID, chi-squared automatic interaction detection.*Indicates the percentage of osteoporotic individuals that are in theparticular category at each node.†The index is the ratio (�100) between the percentage of osteopo-rotic individuals at that node to the overall percentage of osteoporoticindividuals in the overall sample. An optimum threshold wouldtherefore have the highest cumulative value of index percentage andresponse percentage.
cation risk was 0.189 (SE � 0.015).
For nodes 1 and 2 (cortical width �3.1 mm), thecumulative response was 50.4% and the cumulativeindex was 233.0% for detecting osteoporosis. At thehigher threshold of �3.7-mm mandibular corticalwidth, the cumulative response was reduced to 34.3%and the cumulative index was 158.4%. For verificationof the model, the CHAID analysis was repeated on thesame radiographs for cortical width and CI data col-
r 1 data). Four nodes were formed using cortical width as thehe category limits of cortical width. The boxes contain theduals falling into that particular category range. The total rowin that category. Normal indicates no osteoporosis is present
mur, or lumbar spine.
Table III. Summary statistical data from CHAID anal-ysis for observer 2
Observer 2Cortical width
range (mm)Response
(%)*Index(%)†
Node 1 �2.9 52.3 242.1Node 2 2.9-3.9 17.7 82.1
Cortical width�3.9 mmand CI 1 or�1
Node 5 11.9 55.2Node 4 1.2 5.4
Nodes are tabulated in order according to their response percentage.CHAID, chi-squared automatic interaction detection; CI, corticalindex.*Indicates the percentage of osteoporotic individuals that are in theparticular category at each node.†The index is the ratio (�100) between the percentage of osteopo-rotic individuals at that node to the overall percentage of osteoporoticindividuals in the overall sample. An optimum threshold wouldtherefore have the highest cumulative value of index percentage andresponse percentage.
bserveer to tindivi
ample)
lected by the other 2 experienced radiologists.

osis is present at any site. Osteopor, osteoporosis present at femoral
OOOOEVolume 104, Number 6 Devlin et al. 825
Observer 2 dataCortical width was found to be a more significant
variable than cortical index and was included first in thetree analysis. The first split below the root node is dueto cortical width because this variable had a strongerrelationship with osteoporosis than cortical index. Atnode 1 (threshold cortical width �2.9 mm), the re-sponse was 52.3%, (i.e., about half of the patients wereosteoporotic), and the index was 242.1% (Table III).Node 1 contained the group with the greatest likelihoodof a patient being osteoporotic. The cortical width value�3.93 mm was split into 2 nodes based on corticalindex (Fig. 2), but only 11.9% of those individuals witha cortical width greater than 3.93 mm and a corticalindex greater than 1 were osteoporotic (Table II). This
Fig. 2. Chi-squared automatic interaction detection analysis (1, 2, and 3) refer to the category limits of cortical width. Theosteoporotic individuals falling into that particular categoryprovided a significant further subdivision of subjects (CI vasignificantly different proportion of osteoporotic individuals.entire sample) in that category. Normal indicates no osteoporneck, total femur, or lumbar spine.
observer 2 data). The figures above the middle row of boxes (nodesboxes contain the resulting numbers (and percentage) of normal andrange of cortical width. At node 3 only, mandibular cortical indexlues either �1 or 1), providing categories (nodes 4 and 5) with aThe total row contains the number of individuals (and percentage of
is much less than the 21.6% for the sample population.
Table IV. Summary statistics using CHAID analysisfrom data collected by observer 3
Observer 3Cortical width
range (mm)Response
(%)*Index(%)†
Node 1 �2.6 74.6 345.6Node 2 2.6-2.9 40.0 185.2Node 3 2.9-3.1 23.4 108.5Node 4 3.1-4.4 12.5 57.7Node 5 �4.4 1.6 7.2
CHAID, chi-squared automatic interaction detection.*Indicates the percentage of osteoporotic individuals that are in theparticular category at each node.†The index is the ratio (�100) between the percentage of osteopo-rotic individuals at that node to the overall percentage of osteoporoticindividuals in the overall sample. An optimum threshold wouldtherefore have the highest cumulative value of index percentage and
response percentage.
teopor
ortical
OOOOE826 Devlin et al. December 2007
The estimate of the overall misclassification risk was0.207 (SE � 0.016).
Observer 3 dataIn the tree analysis, only cortical width was found to
be a significant variable, and cortical index was ex-cluded (Table IV and Fig. 3). In node 1 (subjects witha cortical width of �2.6 mm), 74.6% of patients wereosteoporotic. For both nodes 1 and 2 (cortical width�2.9 mm), the cumulative response for detecting os-teoporosis was 57.6% and the cumulative index was266.6%. The estimate of the overall misclassificationrisk was 0.165 (SE � 0.014).
Diagnostic odds ratioTherefore, data from the 3 experienced observers
was partitioned in similar ways with cortical widththresholds less than about 3 mm, segmenting the data inan optimal manner. The diagnostic odds ratios were
Fig. 3. Chi-squared automatic interaction detection analysis (ocortical width. The figures above the row of boxes labeled no(nodes 1-5) contain the resulting numbers (and percentage)category range. The total row contains the number of indivindicates no osteoporosis is present at any site. Osteopor, os
Table V. Diagnosis of osteoporosis assuming a threshObserver Cortical width
�LR �LR
1 4.23 0.652 3.53 0.583 3.86 0.48
This analysis was separately repeated for mandibular cortical index wDiagnosis of osteoporosis was made when the T score at total hip, fem�LR, positive likelihood ratio; �LR, negative likelihood ratio; CI, c
separately calculated for a threshold of mandibular corti-
cal width (�3 mm and �3 mm) and a threshold corticalindex of any erosion versus no erosion (Table V). Thediagnostic odds ratios were greater for cortical width(median, 6.51) than cortical erosion (median, 4.13).
DISCUSSIONChi-squared automatic interaction detection analysis
is used widely in market research to identify thosegroups of individuals that would most likely respond toadvertising campaigns, mail shots, or promotions for aparticular product or service. Those people who wouldbe most likely to want the product in question arecontacted, and costs incurred by inefficiently contactingnonresponders are minimized. In the medical field,CHAID has been used to determine those variables thatbest predict survival after major traumatic injury, andthen those variables are segmented to establish theirsignificantly different outcome predictability.15 In den-tistry, this technique has been used infrequently but has
r 3). Subjects were categorized according to their mandibularto 5 refer to the category limits of cortical width. The boxesmal and osteoporotic individuals falling into that particular(and percentage of entire sample) in that category. Normalosis present at femoral neck, total femur, or lumbar spine.
�3 mm for cortical widthMandibular cortical index
�LR �LR Ratio
1.35 0.36 3.751.32 0.32 4.131.35 0.25 5.4
hreshold of cortical erosion present (CI � 1) indicating osteoporosis.ck, or spine was less than �2.5. Ratio indicates diagnostic odds ratio.index.
bservedes 1of noriduals
old of
Ratio
6.516.098.04
ith the toral ne
great potential for audit projects such as identifying

OOOOEVolume 104, Number 6 Devlin et al. 827
those categories of patients most likely to fail to keepappointment dates16 or who would be expected to useindependent dental services.17
In the present study, CHAID analysis showed thatthe cortical index was a poorer predictor of osteoporo-sis than mandibular cortical width. The sensitivity ofany diagnostic test is dependent on the threshold of thetest above which a diagnosis of disease is made, but thecortical index does not provide an accurate method ofosteoporosis diagnosis. Halling et al.18 found that intheir highest cortical index category (CI 3), the sensi-tivity in detecting a reduced bone mineral density wasonly 50%. In a study by Sutthiprapaporn et al.,19 whenthe criterion for a positive finding of reduced bonemineral density was the presence of any cortical erosion(CI � 1), then sensitivity was improved to 73.0% at theexpense of a reduced specificity of 49.0%. However,comparisons are difficult between these studies, be-cause the criterion for low bone density differed be-tween them.
In using the cortical index to diagnose osteoporosis,Klemetti et al.6 found the sensitivity and specificitywere low. The presence of any cortical erosion gave asensitivity of 71% and specificity of 40% (diagnosticodds ratio, 1.63); skeletal osteoporosis was diagnosedin a subject when either value of the bone mineraldensity from their femoral neck and lumbar spine werein the lowest quintile of their population (n � 355).(Since 1994, most authors use the reference standard ofthe World Health Organization for diagnosing osteopo-rosis, i.e., dual energy x-ray absorptiometry T scoremeasurement less than �2.5).20 Combining corticalindex (CI � 1 vs. CI � 1) and cortical width (CW � 4mm vs. � 4 mm), so that a patient must fail boththresholds to be classed as osteoporotic, increased thespecificity to 99%, but reduced the sensitivity to 10%.6
The sensitivity of a diagnostic test is not constantacross populations with differing severity of disease. Inmany published studies, patients were recruited follow-ing referral for bone mineral density assessment, and itis possible that the spectrum of severity of osteoporosismay not relate to that in primary care. Taguchi et al.2
found that for normal postmenopausal women (n � 159),with any cortical erosion (CI � 1), the sensitivity �86.8% and specificity � 63.6% for diagnosing spinalosteoporosis (diagnostic odds ratio, 11.49). These high-sensitivity values may not be possible in a generalpractice setting where the severity of disease may beexpected to be less. Taguchi et al.21 found that thepositive likelihood ratio for identifying women withosteoporosis was 6.40 for a thin cortical width and 7.11for a severely eroded cortex. If the study populationnow consists of patients who are mildly affected by
osteoporosis, positive likelihood ratios will move to-ward unity. Similarly, the positive predictive values formandibular cortical erosion will also depend on thespectrum of osteoporotic disease in the study sample. Inthe present study, the population consisted of a mixtureof healthy volunteers and patients recruited from anosteoporotic clinic.
As well as the pain and suffering to the individualconcerned, the treatment of hip fractures is a heavyburden to any health care system, with an average costper hip fracture of £13,000 in the first year and £7,000for the subsequent year in the UK.22 Diagnosing pa-tients at the greatest risk of osteoporosis is an effectiveidentification strategy that avoids the unnecessary costsof confirmatory axial DXA scanning on healthy indi-viduals. White et al.10 used a classification and regres-sion tree analysis to analyze the clinical and radio-graphic features for identifying osteoporosis and foundthat the thickness of the mandibular cortex was one ofthe most clinically useful risk factors, which is inagreement with this study.
But these radiographic indices do not provide suffi-cient diagnostic evidence by themselves for definitivediagnosis and are only useful in triage screening ofindividuals by using radiographs taken for other pur-poses. Determining which radiographic index is thebest discriminator for osteoporosis involves analyzingsensitivity and specificity, which are interdependentand trade off with one another. The diagnostic oddsratio measures the performance of a test and is the ratioof the odds of a positive test result in a patient withdisease compared with one without disease (or positivelikelihood ratio divided by negative likelihood ratio).Using cortical width (�4.3 mm) for diagnosing os-teopenia and osteoporosis at either the lumbar spine orfemoral neck, Taguchi et al.21 found a positive likeli-hood ratio of 1.65 and a negative likelihood ratio of0.22, giving a diagnostic ratio derived from this data of7.5, which is similar to the data presented in our study.But diagnostic ratio values need to be above 20 toindicate strong diagnostic evidence for a test.23 In ourstudy, both cortical width and cortical index measure-ments from all 3 experts had positive likelihood ratiosof �5. This would indicate that the tests had a fairlysmall influence on diagnosis because there was limitedchange in the pretest to posttest probability of osteopo-rosis,24 but the use of radiographic indices can bejustified if the radiographs are taken for other purposesthan osteoporosis diagnosis.
Some authors have not found any relationship be-tween axial or femoral osteoporosis and mandibularbone quality; for example, the evidence linking osteo-porosis and implant failure in the jaws is poor.25 De-spite this, endosteal cortical thinning has been observed
in the tibia26 and mandible27 and may be a generalized
OOOOE828 Devlin et al. December 2007
age- and sex-related phenomenon. We have described astatistical relationship between mandibular corticalthickness and osteoporotic status, but the physiologicallinking mechanism may involve a complex interactionbetween local factors, estrogen deficiency, the individ-ual’s peak bone mass, and many other factors.
In conclusion, the study demonstrated that mandib-ular cortical width has better efficacy than the mandib-ular cortical index in detecting osteoporosis. There wasno evidence for any benefit associated with combiningthe 2 measurements to detect osteoporosis. Only thosewith the thinnest mandibular cortices (�3 mm) shouldbe referred for further osteoporosis investigation, be-cause it is this group that has the highest likelihood ofosteoporosis.
REFERENCES1. Horner K, Devlin H, Alsop CW, Hodgkinson IM, Adams JE.
Mandibular bone mineral density as a predictor of skeletal os-teoporosis. Brit J of Radiol 1996;69:1019-25.
2. Taguchi A, Suei Y, Sanada M, Ohtsuka M, Nakamoto T, SumidaH, et al. Validation of dental panoramic radiography measuresfor identifying postmenopausal women with spinal osteoporosis.Am J Roentgenol 2004;183:1755-60.
3. Horner K, Devlin H, Harvey L. Detecting patients with lowskeletal bone mass. J Dent 2002;30:171-5.
4. Devlin H, Horner K. Mandibular radiomorphometric indices inthe diagnosis of reduced skeletal bone mineral density. Osteo-poros Int 2002;13:373-78.
5. Yasar F, Akgunlu F. The differences in panoramic mandibularindices and fractal dimension between patients with and withoutspinal osteoporosis. Dentomaxillofac Radiol 2006;35:1-9.
6. Klemetti E, Kolmakov S, Kroger H. Pantomography in assess-ment of the osteoporosis risk group. Scand J Dent Res 1994;102:68-72.
7. Horner K, Devlin H. The relationships between two indices ofmandibular bone quality and bone mineral density measured bydual energy X-ray absorptiometry. Dentomaxillofac Radiol1998;27:17-21.
8. Klemetti E, Kolmakow S. Morphology of the mandibular cortexon panoramic radiographs as an indicator of bone quality. Den-tomaxillofac Radiol 1997;26:22-5.
9. Bollen AM, Taguchi A, Hujoel PP, Hollender LG. Case-controlstudy on self-reported osteoporotic fractures and mandibularcortical bone. Oral Surg Oral Med Oral Pathol Oral RadiolEndod 2000;90:518-24.
10. White SC, Taguchi A, Kao D, Wu S, Service SK, Yoon D, et al.Clinical and panoramic predictors of femur bone mineral density.Osteoporos Int 2005;16:339-46.
11. Nakamoto T, Taguchi A, Ohtsuka M, Suei Y, Fujita M, Tani-moto K, et al. Dental panoramic radiograph as a tool to detectpostmenopausal women with low bone mineral density: un-trained general dental practitioners’ diagnostic performance. Os-teoporos Int 2003;14:659-64.
12. Taguchi A, Suei Y, Ohtsuka M, Otani K, Tanimoto K, Ohtaki M.Usefulness of panoramic radiography in the diagnosis of post-menopausal osteoporosis in women. Width and morphology ofinferior cortex of the mandible. Dentomaxillofac Radiol1996;25:263-7.
13. Orwoll ES, Oviatt SK. Longitudinal precision of dual-energy
x-ray absorptiometry in a multicenter study. The Nafarelin/BoneStudy Group. J Bone Miner Res 1991;6:191-7.
14. Pearson J, Dequeker J, Henley M, Bright J, Reeve J, Kalender W,et al. European semi-anthropomorphic spine phantom for thecalibration of bone densitometers: assessment of precision, sta-bility and accuracy. The European Quantitation of OsteoporosisStudy Group. Osteoporos Int 1995;5:174-84.
15. Hill DA, Delaney LM, Roncal S. A chi-square automatic inter-action detection (CHAID) analysis of factors determining traumaoutcomes. J Trauma 1997;42:62-6.
16. Moles DR, Bedi R. A simple technique for data management ingeneral dental practice audit. Prim Dent Care 1997;4:61-5.
17. McGrath C, Moles D, Bedi R. Who uses independent dentalservices? Findings from a national survey. Prim Dent Care1999;6:157-60.
18. Halling A, Persson GR, Berglund J, Johansson O, Renvert S.Comparison between the Klemetti index and heel DXA BMDmeasurements in the diagnosis of reduced skeletal bone mineraldensity in the elderly. Osteoporos Int 2005;16:999-1003.
19. Sutthiprapaporn P, Taguchi A, Nakamoto T, Ohtsuka M, MallickPC, Tsuda M, et al. Diagnostic performance of general dentalpractitioners after lecture in identifying post-menopausal womenwith low bone mineral density by panoramic radiographs. Den-tomaxillofac Radiol 2006;35:249-52.
20. Kanis JA, WHO Study Group. Assessment of fracture risk and itsapplication to screening for postmenopausal osteoporosis: syn-opsis of a WHO report. Osteoporos Int 1994;4:368-81.
21. Taguchi A, Tsuda M, Ohtsuka M, Kodama I, Sanada M, Naka-moto T, et al. Use of dental panoramic radiographs in identifyingyounger postmenopausal women with osteoporosis. OsteoporosInt 2006;17:387-94.
22. Torgerson D, Iglesias C, Reid DM. The effective management ofosteoporosis. In: Barlow DH, ed. The economics of fractureprevention. London: Aesculapius Medical Press; 2001. p.111-21.
23. Deeks JJ. Systematic reviews of evaluations of diagnostic andscreening tests. In: Egger M, Smith GD, Altman DG, editors.Systematic reviews in health care: meta-analysis in context. 2nded. London: BMJ Publishing Group; 2001. p. 255-6.
24. Jaeschke R, Guyatt GH, Sackett DL. Users’ guides to the medicalliterature. VI. How to use an article about a diagnostic test. B:what are the results and will they help me in caring for mypatients? The Evidence-Based Medicine Working Group. JAMA1994;271:703-7.
25. Mombelli A, Cionca N. Systemic diseases affecting osseointegra-tion therapy. Clin Oral Implants Res 2006;17(Suppl 2):97-103.
26. Amorim MA, Takayama L, Jorgetti V, Pereira RM. Comparativestudy of axial and femoral bone mineral density and parametersof mandibular bone quality in patients receiving dental implants.Osteoporos Int 2006;17:1494-500.
27. Bollen AM, Taguchi A, Hujoel PP, Hollender LG. Case-controlstudy on self-reported osteoporotic fractures and mandibularcortical bone. Oral Surg Oral Med Oral Pathol Radiol Endod2000;90:518-24.
Reprint requests:
Hugh Devlin, PhD, MSc, BSc, BDSSchool of DentistryUniversity of ManchesterHigher Cambridge StreetManchester, M15 6FH, United Kingdom
[email protected]