Robust model-based detection of the lung field boundaries in portablechest radiographs supported by...
11
Robust model-based detection of the lung field boundaries in portable chest radiographs supported by selective thresholding This article has been downloaded from IOPscience. Please scroll down to see the full text article. 2009 Meas. Sci. Technol. 20 104019 (http://iopscience.iop.org/0957-0233/20/10/104019) Download details: IP Address: 83.212.50.138 The article was downloaded on 04/09/2009 at 20:32 Please note that terms and conditions apply. The Table of Contents and more related content is available HOME | SEARCH | PACS & MSC | JOURNALS | ABOUT | CONTACT US
Transcript of Robust model-based detection of the lung field boundaries in portablechest radiographs supported by...

Robust model-based detection of the lung field boundaries in portable chest radiographs
supported by selective thresholding
This article has been downloaded from IOPscience. Please scroll down to see the full text article.
2009 Meas. Sci. Technol. 20 104019
(http://iopscience.iop.org/0957-0233/20/10/104019)
Download details:
IP Address: 83.212.50.138
The article was downloaded on 04/09/2009 at 20:32
Please note that terms and conditions apply.
The Table of Contents and more related content is available
HOME | SEARCH | PACS & MSC | JOURNALS | ABOUT | CONTACT US
IOP PUBLISHING MEASUREMENT SCIENCE AND TECHNOLOGY
Meas. Sci. Technol. 20 (2009) 104019 (10pp) doi:10.1088/0957-0233/20/10/104019
Robust model-based detection of the lungfield boundaries in portable chestradiographs supported by selectivethresholdingD K Iakovidis1,3, M A Savelonas1 and G Papamichalis2
1 Department of Informatics and Computer Technology, Technological Educational Institute of Lamia,GR-35100 Lamia, Greece2 1st Department of Thoracic Surgery, Chest Hospital of Athens ‘Sotiria’, Greece
E-mail: [email protected] and [email protected]
Received 1 February 2009, in final form 26 May 2009Published 4 September 2009Online at stacks.iop.org/MST/20/104019
AbstractPortable chest radiography is a valuable tool for screening patients hospitalized in intensivecare, providing visual cues for diagnosis and physiological measurements. However, itspracticality comes at the cost of quality, which is mainly affected by misaligned bodypositioning, thus increasing x-ray misinterpretation rates. This paper presents a novelmethodology for the detection of the lung field boundaries in portable chest radiographs ofpatients with bacterial pulmonary infections. Such infections are radiographically manifestedas foci of consolidations which can lead to vague or invisible lung field boundaries, difficult todistinguish even by experienced physicians. Conventional and state-of-the-art approachesaddress mainly stationary radiographs, whereas only a few of them cope with pulmonaryinfections. The proposed methodology is based on an active shape model incorporating shapeprior information about the lung fields. The model is initialized by a novel technique utilizinga set of salient points detected on the peripheral anatomic structures of the lungs. A selectivethresholding algorithm based on a spinal cord sampling process supports both the initializationand the evolution of the model for the detection of the lung field boundaries. The experimentsshow that the proposed methodology outperforms state-of-the-art approaches.
Keywords: portable chest radiography, lung, infections, active shape models, thresholding,physiological measurements
1. Introduction
The first and the most critical step in computerized analysis ofchest radiographs is the detection of the lung field boundaries.Once the boundaries of the lung fields are defined, assessmentof the condition of the lungs and physiological measurementscan take place [1, 2]. Plain chest radiographs are usuallyobtained in a controlled setup where the patients are positionedin a standard way at the x-ray device. However, in the caseof critically ill patients, this is not always feasible as they may
3 Author to whom any correspondence should be addressed.
be in pain or disabled. To cope with this problem, portablex-ray devices are commonly used in intensive care to obtainthe radiographs from various relative distances and angles topatients immobilized in bed—not necessarily in a standardposition. However, its practicality comes at the cost of qualitymainly because of misaligned body positioning during imageacquisition [3]. Consequently, such radiographs are moredifficult to read and subject to a higher misinterpretation rate.
The detection of the lung field boundaries becomeseven more difficult in the presence of bacterial pulmonaryinfections. The most common radiographic manifestationof such infections is foci of consolidations [4]. These are
0957-0233/09/104019+10$30.00 1 © 2009 IOP Publishing Ltd Printed in the UK
Meas. Sci. Technol. 20 (2009) 104019 D K Iakovidis et al.
visible as bright shadows interfering with the interior lungintensities and can lead to weak lung field boundaries, difficultto distinguish even by experienced physicians. Therefore,a computational approach that would robustly detect theboundaries of the lung fields would be an asset to the medicalcommunity.
Since the beginning of the 1960s, a variety ofcomputational approaches to the detection of the lung fieldboundaries in plain chest radiographs have been proposed.These include rule-based methodologies [6–12], neuralnetwork, Markov random fields and other pattern classificationapproaches [1, 13, 14], active contour models [15], activeshape and active appearance models [16] and graph cuts [17].The studies [6–11] indicate that the detection performanceof most rule-based methodologies can degrade if the qualityof the radiograph is poor or if the positioning of the patientdeviates from the standard. Recently, a rule-based approachcoping with the issue of positioning has been proposed in[12]. This approach is unsupervised and defines a set ofsalient control points around the lung fields. The salientpoint detection process is supported by a selective thresholdingalgorithm that cuts off image intensities based on localintensity histograms sampled from the spinal cord. Thedetected points are then intuitively interpolated by Beziercurves [18]. The preliminary results presented indicate itssuitability for portable radiography, its robustness to thepresence of consolidations and its advantage against the graphcuts approach [17]. A drawback of this methodology is that itmay produce implausible shapes especially if parts of the lungfields are excluded from the radiograph.
Supervised state-of-the-art approaches that have providedexcellent solutions to the detection of the lung field boundariesinclude active shape and active appearance models [1, 5,16]. Active shape models (ASMs) [19] represent the shapeof an image region by the principal components of landmarkpoint vectors, whereas the grey-level appearance of that regionis limited to its border and consists of the normalized firstderivative of the intensity profiles centred at each landmarkthat run perpendicular to the region’s contour. The evolutionof the model involves the minimization of the distance betweenthe true and the modelled first derivative profiles of theregion. Active appearance models (AAMs) [20] have beenproposed as an alternative to ASMs. In AAMs, a combinedprincipal component analysis of the landmarks and pixelvalues inside the region is made facilitating the generationof plausible instances of both geometry and texture. Theevolution of the model is steered by the difference betweenthe true pixel values and the modelled pixel values withinthe region. The comparative advantage of the ASMs and theAAMs over pattern classification and rule-based approachesis that they incorporate a priori shape information, thusthey are capable of producing more plausible shapes intheir output. However, their dependence on local imagederivatives makes them sensitive to fitting weak boundariesthus increasing the likelihood of the contour to leak throughthese boundaries. Experimental results of the application ofan ASM for the detection of the lung field boundaries inthe presence of a bacterial infection have been presented in
[5], where the results reported indicate the prevalence of sucherrors. Although ASMs have not yet been applied explicitlyon portable radiographs, their shape-constrained deformabilitymakes them a competent candidate.
In this paper, we propose a novel methodology forlung field boundary detection suitable for portable chestradiographs of patients with bacterial pulmonary infections.The proposed methodology is based on the ASM approachwhich is initialized and enhanced by techniques from [12],in order to limit contour leaking in the presence of lungconsolidations. The initialization of the ASM is determined bya novel technique utilizing a set of salient points detected onthe peripheral anatomic structures of the lungs. A selectivethresholding algorithm based on a spinal cord samplingprocess supports both the initialization and the evolution ofthe model for the detection of the lung field boundaries. Thismethodology provides robustness to the lung field deformationin the presence of weak boundaries and produces plausibleshapes even if parts of the lung fields are excluded from theradiograph. Moreover, as in [12] but unlike the conventionalapproaches, the lung field regions overlapped by the heart arenot excluded since abnormalities due to bacterial infectionsmay be present, even behind the heart [4].
The remainder of this paper consists of three sections.Section 2 describes the proposed methodology. Section 3presents the results of its experimental evaluation incomparison with relevant state-of-the-art approaches. Theconclusions derived from this study are summarized in thelast section, where perspectives for future research are alsoprovided.
2. Methodology
The proposed methodology assumes that (a) the patient’s bodymay not necessarily be aligned with the portable x-ray device,since he/she may be immobilized in bed and (b) the spinalcord lies roughly somewhere in the middle of the radiograph,considering that both the patient’s lungs are examined.
Let I be a new chest radiograph of size N × M pixels.The detection of the lung field boundaries is realized in threephases:
(1) salient points detection;
(2) selective thresholding;
(3) ASM-based image segmentation.
In the first phase, a set of points indicating two regionsbounded by the outer ribcage and the spinal cord is detected.This set of points is used as input to the next phases. In thesecond phase, the chest radiograph I is processed so that imageregions irrelevant to the problem investigated are subtractedfrom it. In the last phase, the processed image is used toguide the evolution of the ASM, which is modified so as toachieve robust and accurate detection of the lung fields. Thethree phases of the proposed methodology are described in thefollowing subsections.
2
Meas. Sci. Technol. 20 (2009) 104019 D K Iakovidis et al.
M
Nh
0
255
0 255
0
255
0 255Horizontal profile 4
0
255
0 255
0
255
0 255Horizontal profile 4
Spinal cor
Lung fields
L C R
M
Nh
0
255
0 255
0
255
0 255Horizontal profile 4
0
255
0 255
0
255
0 255Horizontal profile 4
Spinal cord
Lung fields
L C R
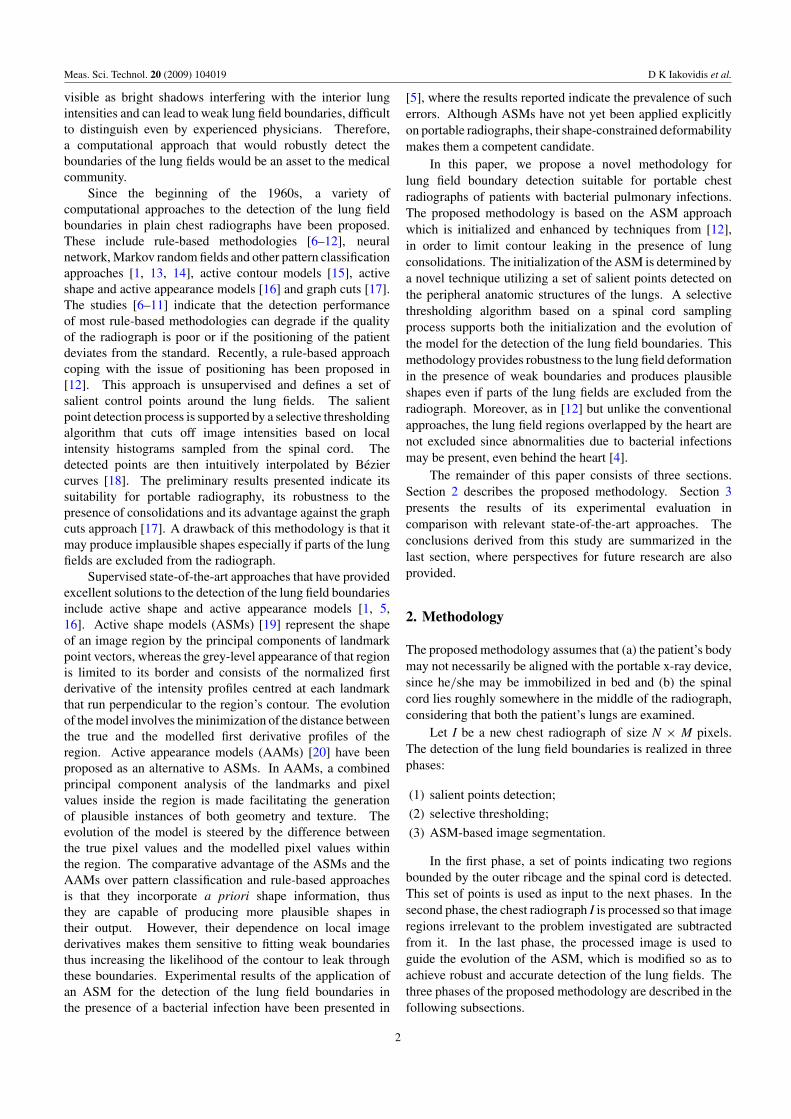
Figure 1. Salient point detection. The image is sampled with rectangular windows as that indicated with dashed borders on the right. Anexample profile extracted from this window is illustrated on the left. The detected maxima indicated as black points on the right. The blackvertical lines indicate the midlines of the central, left and right columns. The white vertical lines are located at [L + (C − L)/2] and [R +(R − C)/2].
2.1. Salient point detection
The peripheral anatomic structures to the lungs, such as thespinal cord and the ribcage, remain unaffected by the presenceof a pulmonary bacterial infection. Based on this considerationthe first phase of the proposed methodology aims to detect a setof salient points that fall approximately on outer ribcage andthe spinal cord, indicating two regions, each of which enclosesa lung field.
Radiograph I is uniformly sampled from top to bottomwith sh non-overlapping rectangular windows of h × M,pixels, where h < N (figure 1). For each sample an averagehorizontal profile, i.e. the average grey level of its rows,per column, is estimated. Radiographic image profiles havebeen proved valuable in several radiographic image analysistasks [5–8, 11] as they provide a simple though effectivemeans to navigate through a radiograph by using only one-dimensional information and elementary signal processingtechniques. The proposed methodology utilizes horizontalprofiles of consecutive image samples in order to obtain spatialinstances of the radiograph from which the spinal cord andthe ribcage boundaries are detectable even if the patient isbent. This sampling approach does not consider standardlung field positioning as the approaches mentioned in [5–8, 11]. An example profile is illustrated in figure 1. Thetwo valleys around the central peak correspond to the lungfields, whereas the peaks after these valleys correspond to theribcage boundaries. Each profile is smoothed by followinga moving average approach that facilitates noise insensitivity.The local maxima detected for each profile are illustrated asblack points on the radiograph of figure 1. The localization ofthe maxima remains practically unaffected by the presence ofconsolidations, since their density, and therefore their intensity,is generally lower than the density of the spinal cord and ofthe ribcage [4, 21].
In the following, possibly relevant maxima are selectedand classified into three sets: (a) spinal cord points, (b) pointsof the left side of the ribcage and (c) points of the right side ofthe ribcage. To this direction, sv non-overlapping rectangularwindows of N × w, w < M, pixels uniformly sample theradiograph from left to right and the average intensity ofeach sample is estimated. Considering a chest radiographthat displays both the patient’s lungs, it is assumed that the
spinal cord lies roughly somewhere in the middle of the image.This is implemented by assigning as candidate spinal cordpoints those bilaterally closer to the column with the maximumaverage intensity within columns [M/4] and [3M/4]. Thiscolumn will be referred to as the central column C.
Similarly, a left column L and a right column R aredetermined as the columns with the maximum averageintensity between columns 0 and [M/4], and between columns[3M/4] and M, respectively. Considering the relative positionsof the lung fields with respect to the spinal cord [7], thepoints closest to the left side of column [L + (C − L)/2] areselected as candidate points belonging to the left side of theribcage and the points closest to the right side of column [R +(R − C)/2] are selected as candidate points belonging to theright side of the ribcage.
The salient point detection algorithm is implemented asfollows:
Step 1. Detect local maxima of horizontal profiles:
• Acquire sh consecutive non-overlapping rectangularsamples of h × M, h < N pixels from the whole image.
• For each of sh samples
– calculate its average horizontal profile;– detect the local maxima of each profile.
Step 2. Detect a central, a left and a right column:
• Acquire sv non-overlapping rectangular samples of N ×w, w < M pixels from the whole image.
• For each of sv samples
– calculate the average intensity.
• Set as central column C the midline of the sample withthe maximum average intensity between columns M/2 −M/4 and M/2 + M/4.
• Set as left column L the midline of the sample withthe maximum average intensity between columns 0 andM/2 − M/4.
• Set as right column R the midline of the sample with themaximum average intensity between columns M/2 + M/4and M − 1.
Step 3. Classify the detected local maxima to the spinal cord,and to the outer left and right boundaries of the left and theright lung field, respectively.
3
Meas. Sci. Technol. 20 (2009) 104019 D K Iakovidis et al.
m
h5
h10
h16 Hmm
h5
h10
h16 H
(a) (b)
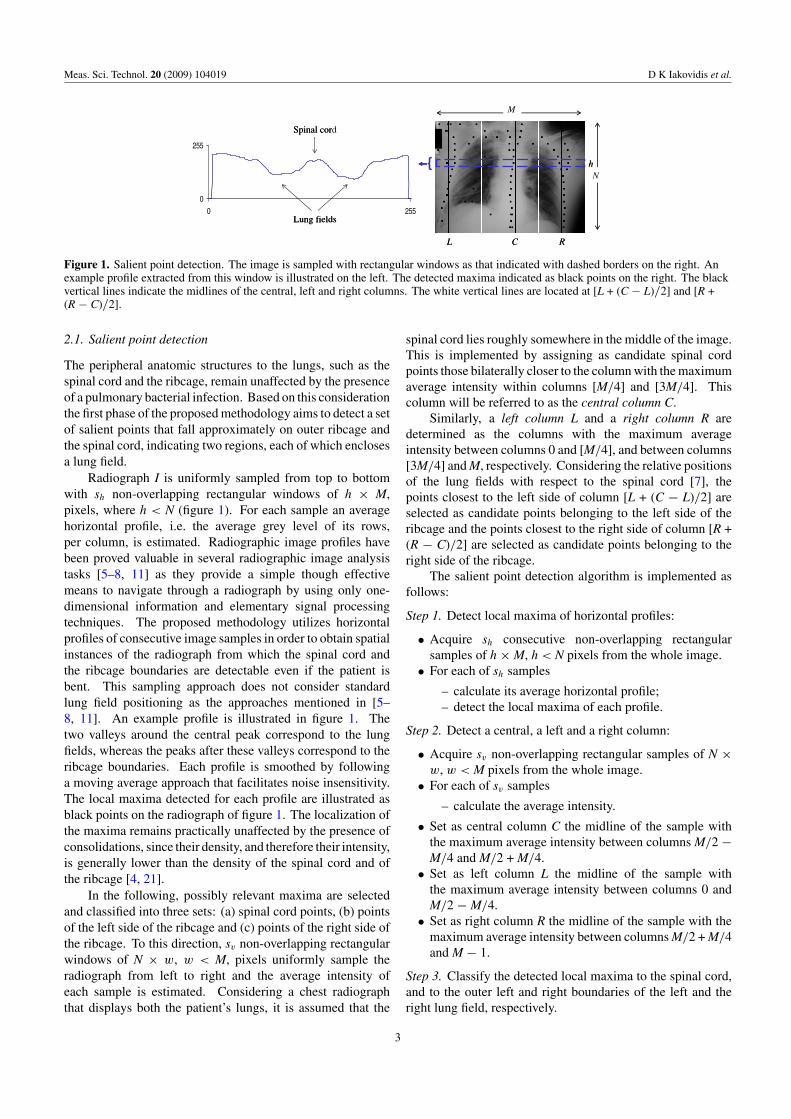
Figure 2. Selective thresholding. (a) Histograms hi , i = 1, . . . , sh are calculated from samples acquired at the spinal cord points. Thehistogram peaks indicated with dashes are accumulated to H. (b) The output of the selective thresholding algorithm.
• For each of sh samples:
– Set the local maxima closest to C as spinal cordpoints.
– Set the local maxima closest to the left side of columnL + (C − L)/2 as points of the outer left boundary ofthe left lung field.
– Set the local maxima closest to the right side ofcolumn R + (R − C)/2 as points of the outer rightboundary of the right lung field.
2.2. Selective thresholding
The second phase applies the selective thresholding algorithm,preliminarily described in [12], in order to subtract regions thatdo not belong to the lung fields, from the chest radiograph.This algorithm is based on the fact that every anatomicstructure visible in the radiograph is characterized by a setof intensities depicting its density [21].
The selective thresholding algorithm begins withsampling the spinal cord at the points detected in the previousstep of this methodology. Sampling is performed withsquare windows centred at each point (figure 2). From eachsample the highest histogram peak along with its neighbouringhistogram components are selected. The selected componentsfrom all samples are accumulated in a new single histogram H.The non-zero components of that histogram will correspondto the most prevalent intensities of the spinal cord, the heartand other anatomic structures that overlap the spinal cord.
By setting these intensities to zero, a significant part of, oreven the whole image regions corresponding to the anatomicstructures that overlap the spinal cord are subtracted fromI. Moreover, since many other structures in the radiograph,except for the lung fields, are of similar densities to thoseacross the spinal cord, they are expected to have similarintensity distributions. For example, the spinal cord consistsof bone tissue similar to the clavicles. Therefore, a part ofthese structures will also be subtracted from I.
Further subtraction of irrelevant image regions isperformed by setting all the intensities of I that are higherthan the maximum intensity m of H, to zero. This operationsubtracts from I image regions that are unlikely to belong to thelung fields since the spinal cord is generally brighter that bothnormal lung parenchyma and consolidations. Such regionsmay include dense objects used for patient’s monitoring orsupport.
The selective thresholding algorithm is implemented asfollows:
Step 1. Sample the radiograph across spinal cord:
• For each of sh salient points detected on the spinal cord
– acquire a square image sample of x2 pixels.
• For each image sample i = 1, . . . , sh:
– calculate its intensity histogram hi ,– select a set of histogram components phi centred at
its highest peak.
Step 2. Accumulate the values phi from all samples into asingle histogram H.Step 3. Find the last non-zero component m of H.Step 4. Generate an output image T(I) from I as follows:
• set the intensities of I that correspond to the non-zerocomponents of H, to zero;
• set the intensities of I that are larger than m, to zero.
The results of this algorithm can improve if the spinal cordpoints are populated by interpolation before the application ofstep 1. This is due to the increase of the samples acquired,which leads to a more representative statistical distribution ofintensities in H.
2.3. ASM-based image segmentation
The shape of a lung field can be described by n landmarkpoints (x1,y1), . . . , (xn, yn) forming a shape vector x =(x1, y1, . . . , xn, yn)
T . The ASM approach [19] appliesprincipal component analysis (PCA) to build a shape modelfrom a set of training shape vectors of ground truth lung fieldboundaries in different chest radiographs.
Let x denote the mean of N training shape vectors.
x = 1
N
N∑i=1
xi. (1)
The covariance matrix of the shape vectors is
Cx = 1
N
N∑i=1
(xi − x)(xi − x)T (2)
from which t eigenvectors φi , i = 1, . . . , t corresponding to thelargest eigenvalues λi , i = 1, . . . , t, are estimated. The value
4
Meas. Sci. Technol. 20 (2009) 104019 D K Iakovidis et al.
of t is determined as the smallest t for which the followinginequality holds [5]
t∑i=1
λi � fv
2n∑i=1
λi (3)
where fv is the desired percentage of the shape variation to berepresented by the t principal eigenvectors. The eigenvectorsform the matrix
� = (φ1| φ2| · · · |φt ) (4)
which is used for the approximation of a shape x in
x = x + � · bx, (5)
where bx holds the shape parameters. Since � is orthogonalthe shape parameters can be estimated from equation (5)
bx = �T(x − x). (6)
In addition to the shape, the ASM models also the localappearance of the image region around each landmark.The local appearance is represented by the normalized firstderivatives of image intensity profiles sampled around eachlandmark, perpendicular to the contour. The derivatives areused instead of image intensities in order to reduce the effectsof global intensity changes. Considering that the intensityprofiles of x are gi = (gi1, gi2, . . . , gi2k+1)
T, k > 0, centredaround each landmark i = 1, . . . , n, the normalized firstderivatives di = (di1, di2, . . . , di2k)
T are estimated by
dil = gil+1 − gil∑2kj=1 |gij+1 − gij |
, l = 1, . . . , 2k. (7)
The local appearance model is represented by the meandi and the covariance matrix Cdi of the normalized firstderivatives, estimated for any landmark i = 1, . . . , n overthe N training shapes.
The trained ASM is applied on a new chest radiographafter proper initialization and evolves to detect the lung fieldboundaries.
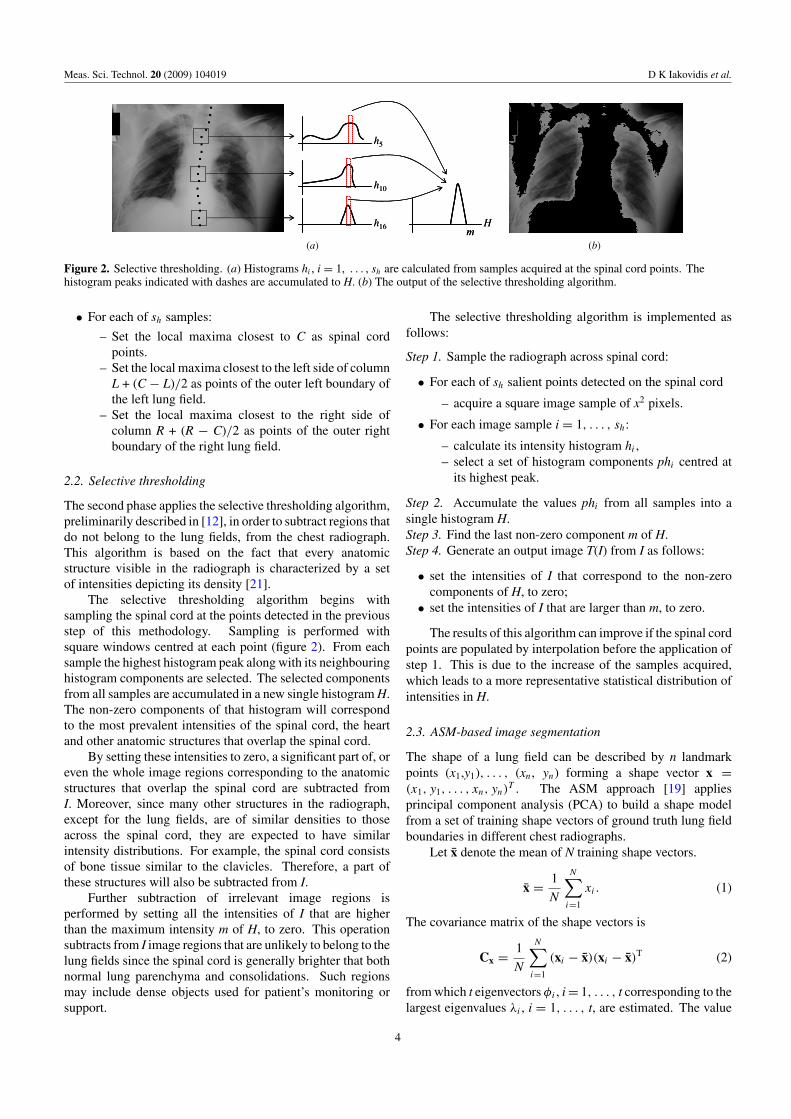
2.3.1. Initialization. The application of the ASM [19] ona new chest radiograph requires that the initial position, therotation and the scale of the mean shape of each lung field aredefined. To overcome this limitation, we propose a novelapproach for the initialization of the ASM. The proposedinitialization approach aims to provide an initial model thatfalls close to the target lung field boundaries.
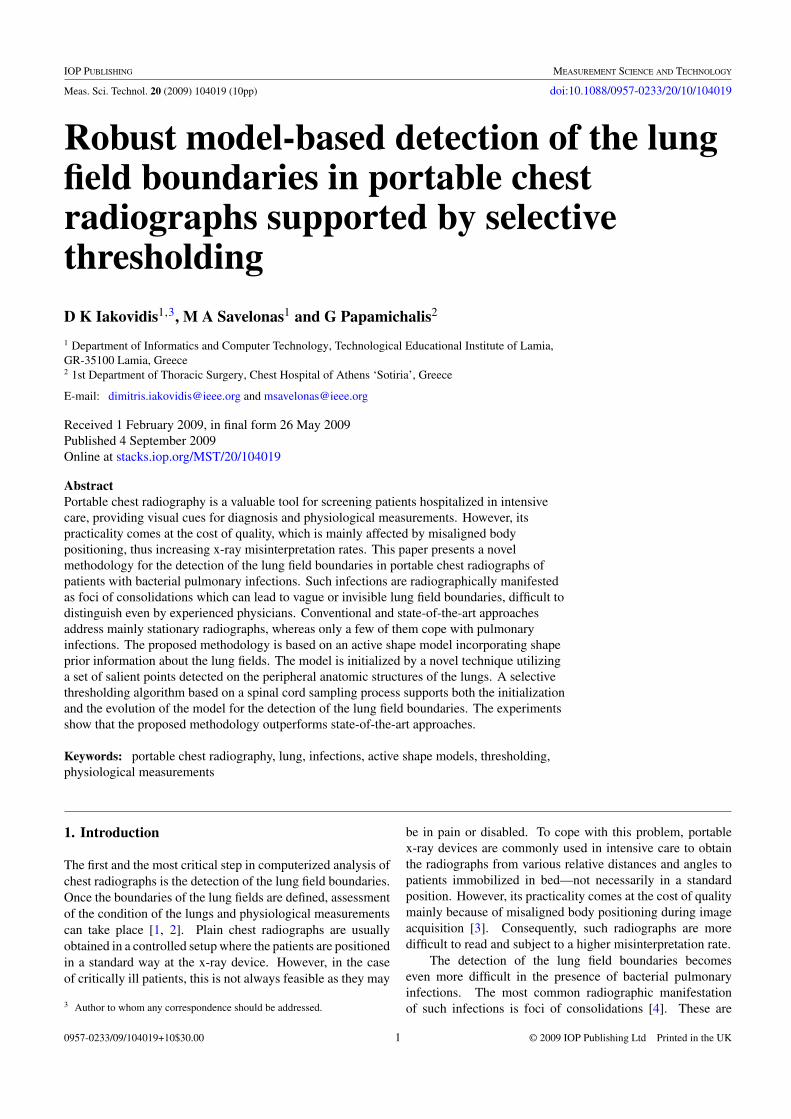
Primarily, the outer left and right salient points detected inthe first phase of our methodology are interpolated by Beziercurves [18] and connected, so as to segment I into two regions(figure 3(a)). We have considered the Bezier curves becausethey feature robustness to outliers [12]. These curves areintuitively controlled by the salient points, in the sense that theyare attracted by the internal control points, without necessarilypassing through them. The segmented image is binarized sothat the pixel values under the curve are equal to 1, and thepixel values over the curve are equal to 0. This binary imageis denoted as BI (I ) (figure 3(b)).
Secondly, a binary instance BT (I) of T(I) is obtained bysetting its non-zero pixel values to 1 (figure 3(c)). The two
(a) (b)
(c) (d )
(e) ( f )
(g) (h)
Figure 3. Proposed ASM initialization. (a) Interpolation of theouter left and right salient points detected in the first phase of ourmethodology; (b) the binary image BI (I ); (c) the binary instanceBT (I) of T(I) (illustrated in figure 2(b)); (d) the result ofBIT (I ) = BI (I )∧BT (I), the points in the middle indicate the spinalcord points dividing the image into two parts, BL
IT (I ) and BRIT (I );
(e) left part of BLIT (I ); (f ) right part of BR
IT (I ); (g) the rotationangle θ between the (black) line produced by linear regression andthe (white) vertical axis of the image; (h) initial contours xi , i = L,R, obtained from the data set used in the experiments.
binary images BI (I ) and BT (I) are then combined with thelogical ‘and’ operator to produce a new binary image BIT (I )
(figure 3(d)), which can be considered as a rough mask forthe two lung fields. This mask is further divided by the spinalcord points into two parts: a left part BL
IT (I ) (figure 3(e))and a right part BR
IT (I ) (figure 3(f )), corresponding to eachof the two lung fields. The centre of mass of each part ischosen for the positioning of the centre of mass of the meanshape of each lung field. The centre of mass is estimated bythe two first-order geometric moments of the binary image[24]. The rotation of both mean shapes is determined by theangle θ between the line obtained with linear regression fromthe spinal cord points and the vertical axis of the image [25](figure 3(g)). Given a fixed position and the rotation angle
5
Meas. Sci. Technol. 20 (2009) 104019 D K Iakovidis et al.
of the mean shape of the left and the right lung field, thecorresponding lung field model is iteratively scaled up untilit reaches a maximum overlap with the shapes of the non-zero regions of BL
IT (I ) and BRIT (I ), respectively (figure 3(h)).
The overlap ω between the areas of two shapes; a1 and a2, isdefined by the ratio [26]
ω = a1 ∩ a2
a1 ∪ a2. (8)
The translation, rotation and scaling of the shape modelare realized by the application of the following well-knowngeometric transformation on each of its landmarks (x, y) [23](
x ′
y ′
)=
(�x
�y
)+ ψ ·
(cos θ − sin θ
sin θ cos θ
) (x
y
), (9)
where �x and �y correspond to the horizontal and verticaltranslations of the shape’s centre of mass, θ is the rotationangle of the spinal cord and ψ is the scaling factor of theshape.
The proposed ASM initialization algorithm is imple-mented as follows:
Step 1. Generate rough binary masks BLIT (I ), BR
IT (I ) for eachlung field:
• calculate BIT (I ) = BI (I ) ∧ BT (I).• divide BIT (I ) into two parts based on the spinal cord
points and generate images BLIT (I ) and BR
IT (I ) from eachpart, such that BIT (I ) = BL
IT (I ) ∨ BRIT (I ).
Step 2. For each BiIT (I ), i = L, R:
• Calculate its centre of mass oi by its first-order geometricmoments.
Step 3. Calculate the rotation angle θ of the spinal cord bylinear regression of the spinal cord points.
Step 4. Initialize lung field models:For each model xi = xi + �i · bi
x, i = L, R:
• Set scale ψi = ψinitial.• Set initial overlap ωi
max = 0.• Repeat the following until maximum ωi is found.
– Transform xi using oi , θ , ψi in equation (9).– Estimate the overlap ωi of xi with the non-zero area
of BiIT (I ).
– ψi = ψi + ψstep
• Set model parameters bix = 0.
2.3.2. Evolution. The initialized ASM evolves accordingto a simple iterative scheme [19]. Each landmark can movealong a direction perpendicular to the contour by s positionson either side of the contour, evaluating 2s + 1 positions, intotal. The new position (x ′
i , y′i ) of each landmark i = 1, . . . , n,
on the search direction, is determined as the one minimizingthe Mahalanobis distance
μ(d′ij ) = (d′
ij − di )TC−1
di (d′ij − di ), (10)
where d′ij is a vector of normalized first derivatives estimated
from the 2s + 1 pixel intensity profile centred at each ofthe possible new landmark positions (x ′
ij , y′ij ), i = 1, . . . ,
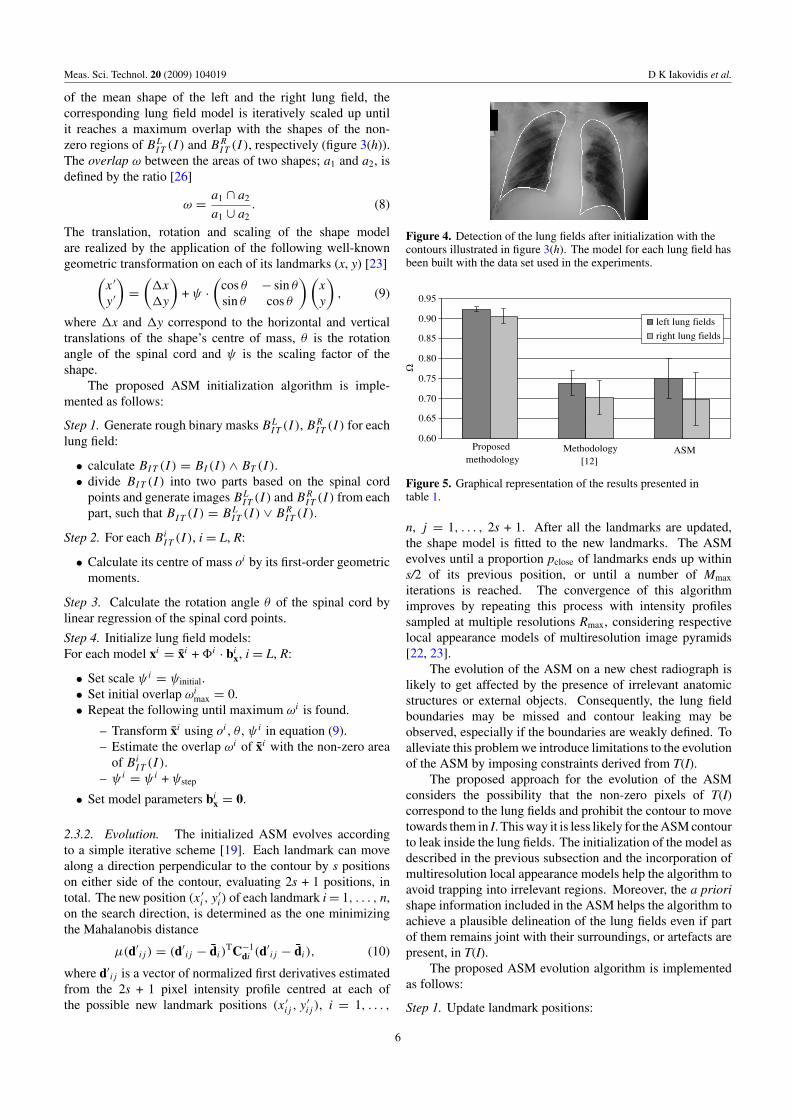
Figure 4. Detection of the lung fields after initialization with thecontours illustrated in figure 3(h). The model for each lung field hasbeen built with the data set used in the experiments.
ASMMethodology [12]
Proposed methodology
0.60
0.65
0.70
0.75
0.80
0.85
0.90
0.95
left lung fields
right lung fields
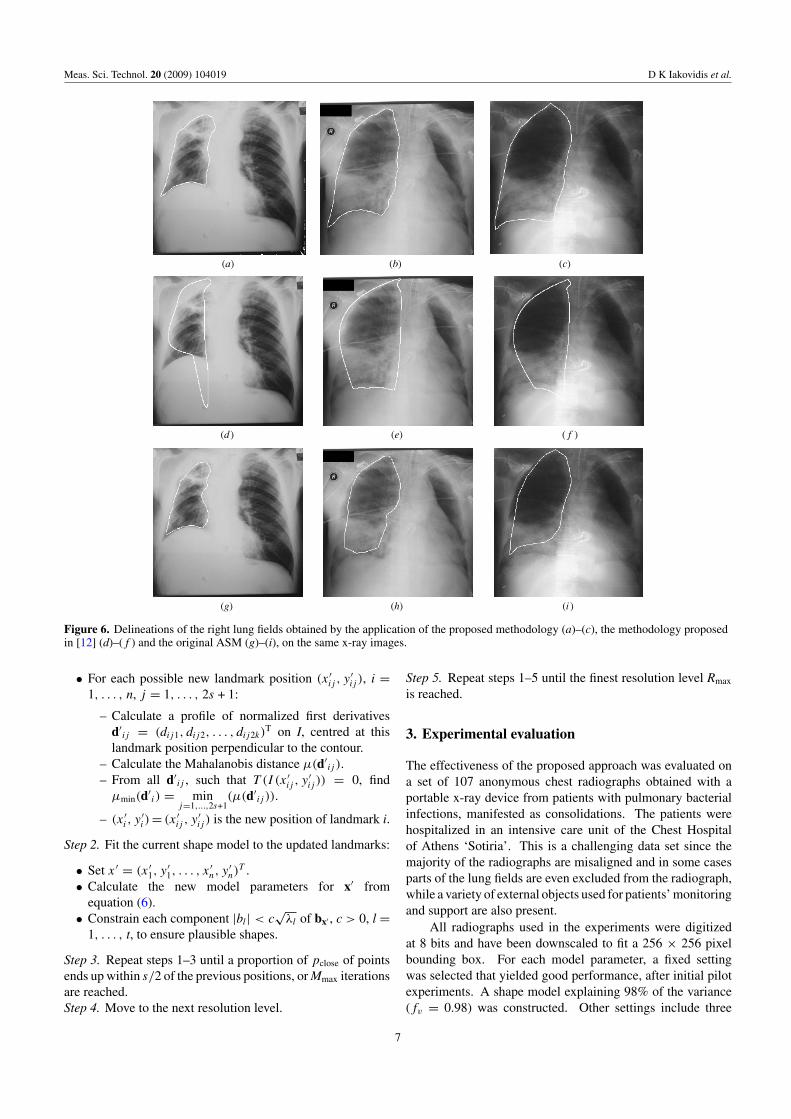
Figure 5. Graphical representation of the results presented intable 1.
n, j = 1, . . . , 2s + 1. After all the landmarks are updated,the shape model is fitted to the new landmarks. The ASMevolves until a proportion pclose of landmarks ends up withins/2 of its previous position, or until a number of Mmax
iterations is reached. The convergence of this algorithmimproves by repeating this process with intensity profilessampled at multiple resolutions Rmax, considering respectivelocal appearance models of multiresolution image pyramids[22, 23].
The evolution of the ASM on a new chest radiograph islikely to get affected by the presence of irrelevant anatomicstructures or external objects. Consequently, the lung fieldboundaries may be missed and contour leaking may beobserved, especially if the boundaries are weakly defined. Toalleviate this problem we introduce limitations to the evolutionof the ASM by imposing constraints derived from T(I).
The proposed approach for the evolution of the ASMconsiders the possibility that the non-zero pixels of T(I)correspond to the lung fields and prohibit the contour to movetowards them in I. This way it is less likely for the ASM contourto leak inside the lung fields. The initialization of the model asdescribed in the previous subsection and the incorporation ofmultiresolution local appearance models help the algorithm toavoid trapping into irrelevant regions. Moreover, the a priorishape information included in the ASM helps the algorithm toachieve a plausible delineation of the lung fields even if partof them remains joint with their surroundings, or artefacts arepresent, in T(I).
The proposed ASM evolution algorithm is implementedas follows:
Step 1. Update landmark positions:
6
Meas. Sci. Technol. 20 (2009) 104019 D K Iakovidis et al.
(d ) (e) ( f )
(g) (h) (i )
(a) (b) (c)
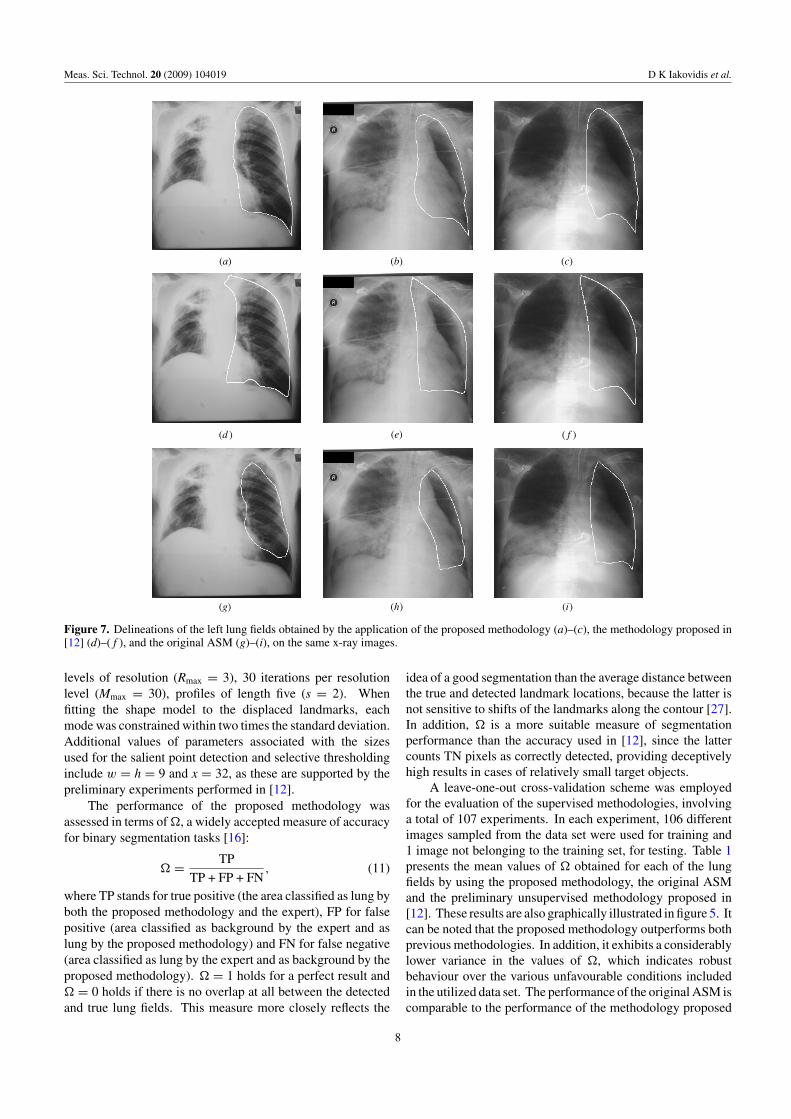
Figure 6. Delineations of the right lung fields obtained by the application of the proposed methodology (a)–(c), the methodology proposedin [12] (d)–(f ) and the original ASM (g)–(i), on the same x-ray images.
• For each possible new landmark position (x ′ij , y
′ij ), i =
1, . . . , n, j = 1, . . . , 2s + 1:
– Calculate a profile of normalized first derivativesd′
ij = (dij1, dij2, . . . , dij2k)T on I, centred at this
landmark position perpendicular to the contour.– Calculate the Mahalanobis distance μ(d′
ij ).– From all d′
ij , such that T (I (x ′ij , y
′ij )) = 0, find
μmin(d′i ) = min
j=1,...,2s+1(μ(d′
ij )).
– (x ′i , y
′i )= (x ′
ij , y′ij ) is the new position of landmark i.
Step 2. Fit the current shape model to the updated landmarks:
• Set x ′ = (x ′1, y
′1, . . . , x
′n, y
′n)
T .• Calculate the new model parameters for x′ from
equation (6).• Constrain each component |bl| < c
√λl of bx′ , c > 0, l =
1, . . . , t, to ensure plausible shapes.
Step 3. Repeat steps 1–3 until a proportion of pclose of pointsends up within s/2 of the previous positions, or Mmax iterationsare reached.Step 4. Move to the next resolution level.
Step 5. Repeat steps 1–5 until the finest resolution level Rmax
is reached.
3. Experimental evaluation
The effectiveness of the proposed approach was evaluated ona set of 107 anonymous chest radiographs obtained with aportable x-ray device from patients with pulmonary bacterialinfections, manifested as consolidations. The patients werehospitalized in an intensive care unit of the Chest Hospitalof Athens ‘Sotiria’. This is a challenging data set since themajority of the radiographs are misaligned and in some casesparts of the lung fields are even excluded from the radiograph,while a variety of external objects used for patients’ monitoringand support are also present.
All radiographs used in the experiments were digitizedat 8 bits and have been downscaled to fit a 256 × 256 pixelbounding box. For each model parameter, a fixed settingwas selected that yielded good performance, after initial pilotexperiments. A shape model explaining 98% of the variance(fv = 0.98) was constructed. Other settings include three
7
Meas. Sci. Technol. 20 (2009) 104019 D K Iakovidis et al.
(c)(b)(a)
( f )(e)(d )
(i)(h)(g)
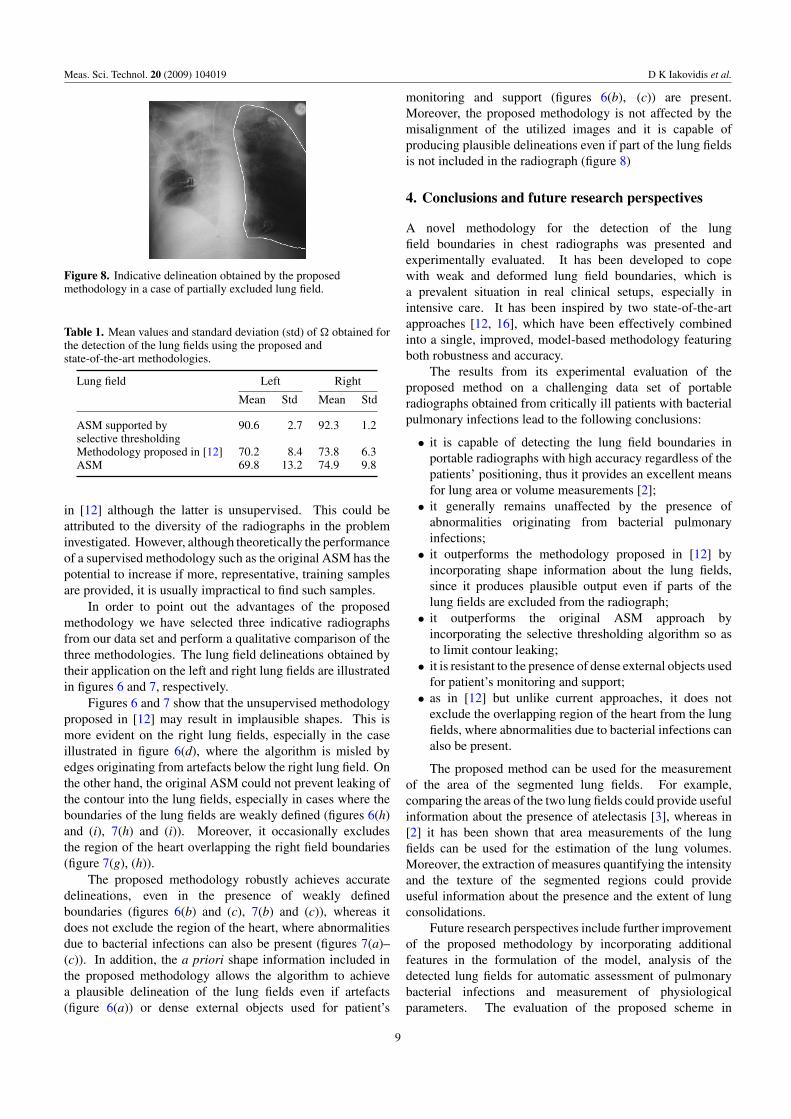
Figure 7. Delineations of the left lung fields obtained by the application of the proposed methodology (a)–(c), the methodology proposed in[12] (d)–(f ), and the original ASM (g)–(i), on the same x-ray images.
levels of resolution (Rmax = 3), 30 iterations per resolutionlevel (Mmax = 30), profiles of length five (s = 2). Whenfitting the shape model to the displaced landmarks, eachmode was constrained within two times the standard deviation.Additional values of parameters associated with the sizesused for the salient point detection and selective thresholdinginclude w = h = 9 and x = 32, as these are supported by thepreliminary experiments performed in [12].
The performance of the proposed methodology wasassessed in terms of , a widely accepted measure of accuracyfor binary segmentation tasks [16]:
= TP
TP + FP + FN, (11)
where TP stands for true positive (the area classified as lung byboth the proposed methodology and the expert), FP for falsepositive (area classified as background by the expert and aslung by the proposed methodology) and FN for false negative(area classified as lung by the expert and as background by theproposed methodology). = 1 holds for a perfect result and = 0 holds if there is no overlap at all between the detectedand true lung fields. This measure more closely reflects the
idea of a good segmentation than the average distance betweenthe true and detected landmark locations, because the latter isnot sensitive to shifts of the landmarks along the contour [27].In addition, is a more suitable measure of segmentationperformance than the accuracy used in [12], since the lattercounts TN pixels as correctly detected, providing deceptivelyhigh results in cases of relatively small target objects.
A leave-one-out cross-validation scheme was employedfor the evaluation of the supervised methodologies, involvinga total of 107 experiments. In each experiment, 106 differentimages sampled from the data set were used for training and1 image not belonging to the training set, for testing. Table 1presents the mean values of obtained for each of the lungfields by using the proposed methodology, the original ASMand the preliminary unsupervised methodology proposed in[12]. These results are also graphically illustrated in figure 5. Itcan be noted that the proposed methodology outperforms bothprevious methodologies. In addition, it exhibits a considerablylower variance in the values of , which indicates robustbehaviour over the various unfavourable conditions includedin the utilized data set. The performance of the original ASM iscomparable to the performance of the methodology proposed
8
Meas. Sci. Technol. 20 (2009) 104019 D K Iakovidis et al.
Figure 8. Indicative delineation obtained by the proposedmethodology in a case of partially excluded lung field.
Table 1. Mean values and standard deviation (std) of obtained forthe detection of the lung fields using the proposed andstate-of-the-art methodologies.
Lung field Left Right
Mean Std Mean Std
ASM supported by 90.6 2.7 92.3 1.2selective thresholdingMethodology proposed in [12] 70.2 8.4 73.8 6.3ASM 69.8 13.2 74.9 9.8
in [12] although the latter is unsupervised. This could beattributed to the diversity of the radiographs in the probleminvestigated. However, although theoretically the performanceof a supervised methodology such as the original ASM has thepotential to increase if more, representative, training samplesare provided, it is usually impractical to find such samples.
In order to point out the advantages of the proposedmethodology we have selected three indicative radiographsfrom our data set and perform a qualitative comparison of thethree methodologies. The lung field delineations obtained bytheir application on the left and right lung fields are illustratedin figures 6 and 7, respectively.
Figures 6 and 7 show that the unsupervised methodologyproposed in [12] may result in implausible shapes. This ismore evident on the right lung fields, especially in the caseillustrated in figure 6(d), where the algorithm is misled byedges originating from artefacts below the right lung field. Onthe other hand, the original ASM could not prevent leaking ofthe contour into the lung fields, especially in cases where theboundaries of the lung fields are weakly defined (figures 6(h)and (i), 7(h) and (i)). Moreover, it occasionally excludesthe region of the heart overlapping the right field boundaries(figure 7(g), (h)).
The proposed methodology robustly achieves accuratedelineations, even in the presence of weakly definedboundaries (figures 6(b) and (c), 7(b) and (c)), whereas itdoes not exclude the region of the heart, where abnormalitiesdue to bacterial infections can also be present (figures 7(a)–(c)). In addition, the a priori shape information included inthe proposed methodology allows the algorithm to achievea plausible delineation of the lung fields even if artefacts(figure 6(a)) or dense external objects used for patient’s
monitoring and support (figures 6(b), (c)) are present.Moreover, the proposed methodology is not affected by themisalignment of the utilized images and it is capable ofproducing plausible delineations even if part of the lung fieldsis not included in the radiograph (figure 8)
4. Conclusions and future research perspectives
A novel methodology for the detection of the lungfield boundaries in chest radiographs was presented andexperimentally evaluated. It has been developed to copewith weak and deformed lung field boundaries, which isa prevalent situation in real clinical setups, especially inintensive care. It has been inspired by two state-of-the-artapproaches [12, 16], which have been effectively combinedinto a single, improved, model-based methodology featuringboth robustness and accuracy.
The results from its experimental evaluation of theproposed method on a challenging data set of portableradiographs obtained from critically ill patients with bacterialpulmonary infections lead to the following conclusions:
• it is capable of detecting the lung field boundaries inportable radiographs with high accuracy regardless of thepatients’ positioning, thus it provides an excellent meansfor lung area or volume measurements [2];
• it generally remains unaffected by the presence ofabnormalities originating from bacterial pulmonaryinfections;
• it outperforms the methodology proposed in [12] byincorporating shape information about the lung fields,since it produces plausible output even if parts of thelung fields are excluded from the radiograph;
• it outperforms the original ASM approach byincorporating the selective thresholding algorithm so asto limit contour leaking;
• it is resistant to the presence of dense external objects usedfor patient’s monitoring and support;
• as in [12] but unlike current approaches, it does notexclude the overlapping region of the heart from the lungfields, where abnormalities due to bacterial infections canalso be present.
The proposed method can be used for the measurementof the area of the segmented lung fields. For example,comparing the areas of the two lung fields could provide usefulinformation about the presence of atelectasis [3], whereas in[2] it has been shown that area measurements of the lungfields can be used for the estimation of the lung volumes.Moreover, the extraction of measures quantifying the intensityand the texture of the segmented regions could provideuseful information about the presence and the extent of lungconsolidations.
Future research perspectives include further improvementof the proposed methodology by incorporating additionalfeatures in the formulation of the model, analysis of thedetected lung fields for automatic assessment of pulmonarybacterial infections and measurement of physiologicalparameters. The evaluation of the proposed scheme in
9
Meas. Sci. Technol. 20 (2009) 104019 D K Iakovidis et al.
the presence of other kinds of abnormalities includingabnormalities attached to the lung field boundaries is also achallenging perspective. This research will contribute to thedevelopment of a multimodal data mining system for adverseevents detection, which will be capable of co-evaluatingradiographic findings of patients with bacterial infections[28].
Acknowledgment
This work was supported in part by the EuropeanCommission’s Seventh Framework Information SocietyTechnologies (IST) Programme, Unit ICT for Health, projectDEBUGIT (no. 217139).
References
[1] Ginneken B V, Romeny B T H and Viergever M A 2001Computer-aided diagnosis in chest radiography: a surveyIEEE Trans. Med. Imaging 20 1228–41
[2] Ries A L, Clausen J L and Friedman P J 1979 Measurement oflung volumes from supine portable chest radiographs J.Appl. Phys. 47 1332–5
[3] Bongard F S and Sue D Y 2002 Current Critical CareDiagnosis & Treatment 2nd edn (New York: McGraw-Hill)
[4] Muller N L, Franquet T, Lee K S, Isabela C and Silva S 2006Imaging of Pulmonary Infections (Baltimore, MD: Williams& Wilkins)
[5] Ginneken B V, Katsuragawa S, Romeny B T H, Doi Kand Viergever M A 2002 Automatic detection ofabnormalities in chest radiographs using local textureanalysis IEEE Trans. Med. Imaging 21 139–49
[6] Meyers P H, Nice H C, Becker C M, Nettleton N J, SweeneyJ W and Meckstroht G R 1964 Automated computeranalysis of radiolographic images Radiology13 1029–34
[7] Xu X-W and Doi K 1995 Image feature analysis for computeraided diagnosis: accurate determination of the ribcageboundary in chest radiographs Med. Phys. 22 617–26
[8] Duryea J and Boone J 1995 A fully automatic algorithm forthe segmentation of lung fields in digital chest radiographicimages Med. Phys. 22 183–91
[9] Luo H, Gaborski R and Acharya R 2000 Automaticsegmentation of lung regions in chest radiographs: a modelguided approach Proc. Int. Conf. Image Processing (ICIP2000) vol 2 pp 483–6
[10] Ginneken B V and Romeny B T H 2000 Automaticsegmentation of lung fields in chest radiographs Med. Phys.27 2445–55
[11] Iglesias I, Tahoces P G, Souto M, Martinez de Alegria A,Lado M J and Vidal J J 2004 Lung segmentation onpostero-anterior digital chest radiographs using activecontours Lecture Notes in Computer Science vol 3138ed A Fred et al (Berlin: Springer) pp 538–46
[12] Iakovidis D K and Papamichalis G 2008 Automaticsegmentation of the lung fields in portable chestradiographs based on bezier interpolation of salient controlpoints Proc. IEEE Int. Conf. on Imaging Systems andTechniques (Chania, Greece) pp 82–7
[13] McNitt-Gray M F, Huang H J and Sayre J W 1995 Featureselection in the pattern classification problem of digitalchest radiograph segmentation IEEE Trans. Med. Imaging14 537–47
[14] Vittitoe N, Vargas-Voracek R and Floyd C Jr 1999 Markovrandom field modeling in posteroanterior chest radiographsegmentation Med. Phys. 26 1670–7
[15] Coppini G, Diciotti S, Falchini M, Villari N and Valli G 2003Neural networks for computer-aided diagnosis: detection oflung nodules in chest radiograms IEEE Trans. Inf. Technol.Biomed. 7 344–57
[16] Ginneken B V, Stegmann M B and Loog M 2006Segmentation of anatomical structures in chest radiographsusing supervised methods: a comparative study on a publicdatabase Med. Image Anal. 10 19–40
[17] Chen S, Cao L, Liu J and Tang X 2006 Automaticsegmentation of lung fields from radiographic images ofSARS patients using a new graph cuts algorithm Proc. Int.Conf. Pattern Recognition (ICPR 2006) vol 1 pp 271–4
[18] Bartels R H, Beatty J C and Barsky B A 1998 Bezier curvesAn Introduction to Splines for Use in Computer Graphicsand Geometric Modelling (San Francisco, CA: MorganKaufmann) chapter 10, pp 211–45
[19] Cootes T, Taylor C, Cooper D and Graham J 1995 Activeshape models—their training and application Comput. Vis.Image Underst. 61 38–59
[20] Cootes T F, Edwards G J and Taylor C J 2001 Activeappearance models IEEE Trans. Pattern Anal. Mach. Intell.23 681–5
[21] Novelline R A 1997 Squires’s Fundamentals of Radiology(Cambridge, MA: Harvard University Press)
[22] Cootes T 2000 An introduction to active shape models ImageProcessing and Analysis ed R Baldock and J Graham(Oxford: Oxford University Press) chapter 7,pp 223–48
[23] Gonzalez R C and Woods R E 2008 Digital Image Processing3rd edn (Upper Saddle River, NJ: Prentice-Hall)
[24] Prokop R J and Reeves A P 1992 A survey of moment-basedtechniques for unoccluded object representation andrecognition CVGIP: Graphical Models and ImageProcessing vol 54 (Amsterdam: Elsevier) pp 438–60
[25] Montgomery D C, Peck E A and Vining G 2003 Introductionto Linear Regression Analysis 3rd edn (New York: Wiley)
[26] Crum W R, Camara O and Hill L G 2006 Generalized overlapmeasures for evaluation and validation in medical imageanalysis IEEE Trans. Med. Imaging 25 1451–61
[27] Ginneken B V, Frangi A F, Staal J J, Romeny B T Hand Viergever M 2002 Active shape model segmentationwith optimal features IEEE Trans. Med. Imaging 21 924–33
[28] Lovis C, Colaert D and Stroetmann V N 2008 DebugIT forpatient safety—improving the treatment with antibioticsthrough multimedia data mining of heterogeneous clinicaldata Stud. Health Technol. Inform. 136 641–6
10