Development of Electroactive and Elastic Nanofibers that contain Polyaniline and Poly(L-lactide- co...
11
Development of Electroactive and Elastic Nanofibers that contain Polyaniline and Poly(L-lactide-co-e-caprolactone) for the Control of Cell Adhesion Sung In Jeong, In Dong Jun, Moon Jae Choi, Young Chang Nho, Young Moo Lee, Heungsoo Shin * Full Paper S. I. Jeong, M. J. Choi, Y. M. Lee School of Chemical Engineering, College of Engineering, Hanyang University, Haengdang-dong, Seongdong-gu, Seoul 133-791, Republic of Korea Y. C. Nho Radiation Application Research Division, Advanced Radiation Technology Institute, Korea Atomic Energy Research Institute, Sinjeongdong, Jeongeup, Jeonbuk 580-195, Republic of Korea I. D. Jun, H. Shin Department of Bioengineering, College of Engineering, Hanyang University, Haengdang-dong, Seongdong-gu, Seoul 133-791, Republic of Korea E-mail: [email protected] In this work, electrically conductive polyaniline (PAni) doped with camphorsulfonic acid (CPSA) is blended with poly(L-lactide-co-e-caprolactone) (PLCL), and then electrospun to prepare uniform nanofibers. The CPSA-PAni/PLCL nanofibers show a smooth fiber structure without coarse lumps or beads and consistent fiber diameters (which range from 100 to 700 nm) even with an increase in the amount of CPSA-PAni (from 0 to 30 wt.-%). However, the elongation at break decreases from 391.54 9.20% to 207.85 6.74% when 30% of CPSA-PAni is incorpo- rated. Analysis of the surface of the nanofibers demonstrates the presence of homogeneously blended CPSA-PAni. Most importantly, a four-point probe analysis reveals that electrical properties are maintained in the nanofibers where the conductivity is significantly increased from 0.0015 to 0.0138 S cm 1 when the nanofibers are prepared with 30% CPSA-PAni. The cell adhesion tests using human dermal fibroblasts, NIH-3T3 fibro- blasts, and C2C12 myoblasts demonstrate signifi- cantly higher adhesion on the CPSA-PAni/PLCL nanofibers than pure PLCL nanofibers. In addition, the growth of NIH-3T3 fibroblasts is enhanced under the stimulation of various direct current flows. The CPSA-PAni/PLCL nanofibers with electrically conduc- tive properties may potentially be used as a platform substrate to study the effect of electrical signals on cell activities and to direct desirable cell function for tissue engineering applications. Macromol. Biosci. 2008, 8, 627–637 ß 2008 WILEY-VCH Verlag GmbH & Co. KGaA, Weinheim DOI: 10.1002/mabi.200800005 627
-
Upload
independent -
Category
Documents
-
view
4 -
download
0
Transcript of Development of Electroactive and Elastic Nanofibers that contain Polyaniline and Poly(L-lactide- co...
Full Paper
Development of Electroactive and ElasticNanofibers that contain Polyaniline andPoly(L-lactide-co-e-caprolactone) for theControl of Cell Adhesion
Sung In Jeong, In Dong Jun, Moon Jae Choi, Young Chang Nho,Young Moo Lee, Heungsoo Shin*
I. D. Jun, H. ShinDepartment of Bioengineering, College of Engineering, HanyangUniversity, Haengdang-dong, Seongdong-gu, Seoul 133-791,Republic of KoreaE-mail: [email protected]
In this work, electrically conductive polyaniline (PAni) doped with camphorsulfonic acid(CPSA) is blendedwith poly(L-lactide-co-e-caprolactone) (PLCL), and then electrospun to prepareuniform nanofibers. The CPSA-PAni/PLCL nanofibers show a smooth fiber structure withoutcoarse lumps or beads and consistent fiber diameters (which range from 100 to 700 nm) evenwith an increase in the amount of CPSA-PAni (from 0 to 30 wt.-%). However, the elongation atbreak decreases from 391.54� 9.20% to 207.85� 6.74% when 30% of CPSA-PAni is incorpo-rated. Analysis of the surface of the nanofibers demonstrates the presence of homogeneouslyblended CPSA-PAni. Most importantly, a four-point probe analysis reveals that electricalproperties are maintained in the nanofibers where the conductivity is significantly increasedfrom 0.0015 to 0.0138 S � cm�1 when the nanofibersare prepared with 30% CPSA-PAni. The cell adhesiontests using human dermal fibroblasts, NIH-3T3 fibro-blasts, and C2C12 myoblasts demonstrate signifi-cantly higher adhesion on the CPSA-PAni/PLCLnanofibers than pure PLCL nanofibers. In addition,the growth of NIH-3T3 fibroblasts is enhanced underthe stimulation of various direct current flows. TheCPSA-PAni/PLCL nanofibers with electrically conduc-tive properties may potentially be used as a platformsubstrate to study the effect of electrical signals oncell activities and to direct desirable cell function fortissue engineering applications.
Macromol. Biosci. 2008, 8, 627–637
� 2008 WILEY-VCH Verlag GmbH & Co. KGaA, Weinheim
S. I. Jeong, M. J. Choi, Y. M. LeeSchool of Chemical Engineering, College of Engineering, HanyangUniversity, Haengdang-dong, Seongdong-gu, Seoul 133-791,Republic of KoreaY. C. NhoRadiation Application Research Division, Advanced RadiationTechnology Institute, Korea Atomic Energy Research Institute,Sinjeongdong, Jeongeup, Jeonbuk 580-195, Republic of Korea
DOI: 10.1002/mabi.200800005 627

S. I. Jeong, I. D. Jun, M. J. Choi, Y. C. Nho, Y. M. Lee, H. Shin
628
Introduction
The central strategy in tissue engineering involves a
biomaterial scaffold as a delivery carrier of cells.[1] The
ability of a scaffold to control cellular response to direct
particular repair and regeneration processes is essential for
the generation of successful tissue engineering products.
Therefore, many efforts have been made to understand
local interactions of cells with their microenvironment and
exploit these interactions to design an ideal scaffold that is
able to elicit a desirable cellular response.[2,3]
Cells in native tissue are surrounded by a complex
chemical, mechanical, and electrical microenvironment.[4–7]
While cell adhesion is mediated by integrin receptors
bound to extracellular matrix (ECM) proteins, tissue
specific mechanical stiffness and electrical signals deter-
mine cell division, development, and morphogenetic
alternation. For example, the stiffness of scaffolding
materials regulates the responses of skeletal myoblasts,
endothelial cells, and neuron cells with respect to the
formation of striated structure, induction of capillary
tubes, and neurite branch outgrowth, respectively.[8–10]
We have also reported the importance of mechanical
stimulation on the protein expression of smooth muscle
cells cultured on elastic and biodegradable poly(L-lactide-
co-e-caprolactone) (PLCL) scaffolds.[11] The influence of
electrical and electromagnetic fields on cells has also been
widely investigated, particularly on cardiac myocytes,
neuronal cells, keratinocytes, fibroblasts, and mesenchy-
mal stem cells.[12–16] Collectively, these studies have
emphasised that the mechanical and electrical properties
of scaffolds should be appropriately controlled to regen-
erate physiologically robust artificial tissue. However, the
number of studies that explore the response of cells
cultured on electroactive substrates is relatively limited
and the fabrication of electroactive synthetic scaffolds
with elastic properties is even more challenging.
The overall goal of our study is to synthesize a nano-
structured three-dimensional scaffold for regeneration of
tissue whose function can be significantly controlled by
mechanical and electrical stimulation, such as muscle,
neuron, and skin. The nanofibrous scaffold, which struc-
turally mimics the ECM, is generated by an electrospinning
method. This method has been widely utilized to fabricate
nanometer-scaled and three-dimensional interconnected
networks of natural and synthetic polymers.[17,18] The
electroactive and elastic properties of the nanofibers were
achieved by blending the conducting polymer, polyaniline
(PAni), with an elastic PLCL matrix using 1,1,1,3,3,3-
hexafluoropropan-2-ol (HFP) as a solvent. PAni has been
previously explored in several biomedical applications
including biosensors and scaffolds in tissue engineering,
and demonstrates biocompatibility in both in vitro and
in vivo analysis.[17,19,20]
Macromol. Biosci. 2008, 8, 627–637
� 2008 WILEY-VCH Verlag GmbH & Co. KGaA, Weinheim
Here, our primary objectives were to investigate cell
response to nanofibrous substrates prepared from the
mixture of PLCL and PAni using camphorsulfonic acid
(CPSA) as the dopant. First, the effect of incorporated PAni
on the morphology, mechanical strength, surface char-
acteristics, and conductivity of the fabricated nanofibers
was examined. The cellular response to the nanofibers was
then studied by investigation of the effect of PAni on the
adhesion and viability of three model cell types: primary
fibroblasts, NIH-3T3 fibroblasts, and C2C12 myoblasts.
Finally, we developed a house-made bioreactor to apply
electrical stimuli, and analyzed the metabolic activity of
the cells cultured on CPSA-PAni/PLCL scaffolds under
electrical stimulation.
Experimental Part
Materials
Polyaniline (PAni), camphorsulfonic acid (CPSA), 1,1,1,3,3,3-hexa-
fluoropropan-2-ol (HFP), tris-Base, triton X-100, toluene, and
e-caprolactone were purchased from Sigma Chemical Co. (St.
Louis, MO, USA). Reagents for the synthesis of PLCL were dried or
purified as previously described.[11,21] Fetal bovine serum (FBS),
Dulbecco’s modified eagle’s medium (DMEM), Dulbeccos phos-
phate buffered saline (PBS), Trypsin-EDTA, and penicillin-
streptomycin were purchased from Gibco BRL (Rockville, MD,
USA). Sucrose, L-ascorbic acid, aprotinin, leupeptin, and phenyl
methyl sulfonyl fluoride (PMSF) were purchased from Amresco Co.
(Solon, OH, USA). NaCl and MgCl2 were purchased from Junsei
chemical Co. (Tokyo, Japan). Water was distilled and deionized
(DDW) using the Milli-Q System (Millipore, MA, USA). Microscope
glass cover-slips (diameter: 12 mm) were purchased from
Marienfeld Co. (GmbH, Germany).
Synthesis and Preparation of Electrospun CPSA-PAni/
PLCL Nanofibers
The synthesis of PLCL was as described previously.[11,21] Briefly,
L-lactide (36 g) and e-caprolactone (28.5 g) were polymerized at
150 8C for 24 h in a 50 mL glass ampoule that contained 0.028 M
stannous octoate solution (2.381 g). The molar ratio of L-lactide,
e-caprolactone, and stannous octoate was 1:1:0.01. After poly-
merization, the PLCL was dissolved in chloroform and filtered
using a 0.45 mm pore membrane filter. The polymer was
precipitated into an excess amount of methanol, filtered off,
and dried under vacuum.
CPSA-PAni was prepared by mixing both 30 mg of PAni and
CPSA in 10 mL of HFP. PLCL (1 g) was also dissolved in 10 mL of HFP
by stirring for 4 h at room temperature (RT). The CPSA-PAni/PLCL
blends were prepared by mixing each solution with two different
ratios (PAni/PLCL: 15/85 and 30/70 v/v). The molecular structure
of PAni and PLCL is shown in Figure 1. For electrospinning, the
resulting solutions (10 mL) were loaded into a 20 mL glass syringe
(Hamilton, NV, USA) equipped with a blunt 23 gauge needle. The
glass syringe was then placed in a syringe pump (KD Scientific
DOI: 10.1002/mabi.200800005

Elong
Development of Electroactive and Elastic Nanofibers that contain Polyaniline and . . .
Figure 1. Chemical structure of a) PAni and CPSA and b) PLCL.
Single-Syringe Infusion Pump, Fisher, MA, USA) and the needle
was connected to the positive output of a high voltage power
supply (NanoNC, Seoul, Korea). The collector was wrapped with
aluminum foil and located at a fixed distance of 20 cm from the
needle. The flow rate of the solution, applied voltage, and spinning
time were fixed at 20 mL �min�1, 18–20 kV, and 24 h at RT,
respectively. A PLCL only nanofiber was prepared as a negative
control. The prepared nanofibers on the foil were dried for
overnight at RT.
Characterization of the Nanofibers
The morphology of the nanofibrous CPSA-PAni/PLCL scaffolds was
examined using scanning electron microscopy (SEM, JEOL
JSM-6300, Japan). To measure the mean diameter of each scaffold,
the images were captured and imported to Photoshop (Photoshop
CS, Adobe), and the diameters of fibers from 30 randomly selected
fields of each SEM image were manually measured.
The tensile properties of rectangular samples (10�30 mm2,
n¼5) were measured using Instron (Model 5567, Canton, MA,
USA) as previously described.[22] The thickness of the samples is
given in Table 1. A 10-Newton-maximum load cell was used at a
cross-head speed of 1 mm �min�1. Calculations were performed
based on stress–strain curves of each sample; the tensile strength,
elongation, and Young’s modulus (E) were calculated in the
following manner:
Tab
Sam
PAC
PAC
PAC
a)CPSA
Macrom
� 2008
Tensile strength ðMPaÞ ¼ F=A (1)
le 1. Composition, thickness, contact angle, and electrical conductivity of CPSA-PAni/PL
ple code CPSA-PAnia):PLCLb) Thickness Contact
%, v/v mm deg
L-1 0:100 0.33� 0.48 86.10�L-2 15:85 0.26� 0.51 86.88�L-3 30:70 0.21� 0.42 87.42�
-doped PAni was prepared by mixing both 30 mg of PAni and CPSA in 10 mL of HF
ol. Biosci. 2008, 8, 627–637
WILEY-VCH Verlag GmbH & Co. KGaA, Weinheim
where F is the maximum load of force and A
is the cross-sectional area of the nanofiber
specimen.
CL nan
angle
.
0.66
1.31
1.24
P; b)C
ationð%Þ ¼ ½ðL0 � LÞ=L0� � 100 (2)
where L0 refers to the initial length of the
sample and L is the elongated length at the
break age of the sample. The Young’s
modulus (E) was calculated from the slope
of the straight line of the stress–strain curve
in the elastic region.
For the characterization of surface prop-
erties, an attenuated total reflectance Fourier-
transform infrared (ATR FT-IR) spectro-
scopic investigation was carried out using
a Bruker TENSOR 37 (Bruker, MA, USA)
spectrophotometer with a scanning range between 2 400 and
800 cm�1. Raman spectra were recorded with a Jasco NRS-3100
spectrometer (Jasco, Tokyo, Japan) at wavelengths ranging from
800 to 2 000 cm�1. A holographic notch filter was used to filter out
the Raleigh radiation. The Raman radiation was dispersed using
an 1 800 groove per mm grating and detected by a politer cooled
charge coupled device array. X-Ray photoelectron spectroscopy
(XPS) investigations were carried out with an ESCA LAB 220I
(Thermo VG Scientific, MA, USA) spectrometer with a magnesium
anode source that produced Mg Ka (1 253.6 eV photons) radiation
with a pass energy of 20 eV for high-resolution narrow scans.
Thermal gravimetric analysis (SDT2960, TA Instrument, CA, USA)
was carried out to confirm the presence of CPSA-PAni within the
PLCL matrix. Ten milligrams of each sample, including pure PAni
and CPSA-PAni (negative control), was placed in the measurement
chamber and the scanning range was from RT to 900 8C with an
ascending rate of 5 8C �min�1.
The conductivity (s, S � cm�1) of the electrospun CPSA-PAni/
PLCL scaffolds (10�40 mm2, n¼5) was measured using a four
point probe analysis and calculated based on the equation: s¼ l/
(RsS) (where l is the distance between reference electrodes, Rs is the
bulk resistance of the membrane sample derived from an
impedance analyzer, and S is the cross-sectional area of the
sample) as previously reported.[23] The thermo- and hydro-
controlled chamber was used to avoid the influence of electro-
magnetic noise. Ohmic resistance (R) was measured by four-point
probe alternating current (ac) impedance spectroscopy using an
electrode system connected with an impedance/gain-phase
ofiber scaffolds.
Electrical conductivity
S � cmS1
0.0015� 0.0001
0.0077� 0.0001
0.0138� 0.0002
oncentration of PLCL: 10% (w/v).
www.mbs-journal.de 629

S. I. Jeong, I. D. Jun, M. J. Choi, Y. C. Nho, Y. M. Lee, H. Shin
630
analyzer (Solatron 1260) and an electrochemical interface
(Solatron 1287, Farnborough Hampshire, ONR, UK).[24]
in vitro Cell Culture Study
The human fibroblasts, NIH-3T3 (CRL-1658, American Type
Culture Collection (ATCC), Rockville, MD, USA), and C2C12
(CRL-1772, ATCC) were used to study the biocompatibility of
the scaffolds. The human fibroblasts were isolated from foreskin
biopsies donated by the Dermatology Department (Dongguk
University Hospital in Goyang, Korea). The human fibroblasts,
NIH-3T3, and C2C12 cells were cultured in DMEM supplemented
with 10% FBS and 1% penicillin-streptomycin under standard
culture conditions (37 8C and 5% CO2). When the cells were
cultured with 70–80% confluency, they were detached from the
culture flasks using a 0.05% Trypsin-EDTA solution. Following
three washes, the cells were re-suspended at 106 cells per mL and
were seeded onto the surface of the CPSA-PAni/PLCL nanofiber
scaffolds at a density of 2� 104 cells per cm2.
For the cell culture, circular samples were prepared by
punching out the electrospun nanofibers (diameter: 10 mm),
and all samples were sterilized by UV irradiation for 5 min,
immersed in 70% ethanol, washed three times with PBS, and then
placed in 24-well tissue culture plates (Corning, NY, USA) (under
the sterilization conditions, we did not observe shrinkage or other
deformation of the scaffolds). On day one after seeding, samples
were rinsed with PBS, and 70 mL of 3-(4,5-dimethylthiazol-
2-yl)-2,5-diphenyl tetrazolium bromide (MTT) solution (12�10�3 m) was added to each sample. After 4 h of incubation at
37 8C, the MTT solution was removed, and any insoluble formazan
crystals formed were dissolved with 100 mL of dimethyl sulfoxide.
The absorbance of the formazan product was measured at 540 nm
using a 96-well plate spectrophotometer (spectraMax M2e,
Molecular Devices, Ontario, Canada). Results were expressed as
a percentage of the absorbance of the sample to the negative
control.
To investigate the morphological changes of the cultured cells
on the scaffolds, samples were fixed in 3.7% formaldehyde in PBS
for 10 min. Following a wash in PBS, the samples were incubated
for 60 min at 37 8C with rhodamine-phalloidin (Invitrogen, NY,
USA), a specific dye for F-actin, and Hoechst 33258 (Invitrogen, NY,
USA) for a nuclear stain and then mounted on glass slides. The
samples were then visualized on a Nikon (TE2000-E, Nikon, Tokyo,
Japan) inverted microscope equipped with the appropriate
fluorescence filters. Digital images were acquired using a Nikon
camera (Digital sight DS-SWc, Nikon, Tokyo, Japan).
For the electrical stimulation experiment, the NIH-3T3 cells
were seeded on nanofibers (diameter: 18 mm, 1.5� 104 cells per
sample, n¼3). The cell-seeded scaffolds were placed between the
stainless steel electrodes connected to a direct current (DC) power
supply within the electrical stimulation chamber (diameter:
130 mm) filled with 100 mL of DMEM, and were cultured at 5% CO2
and 37 8C for 2 d under electrical stimulation. Various electrical
currents were applied through the voltage DC power supply (ED
Laboratory, ED-330, GyeongGiDo, Korea) ranging from 0 to 200
mA. The fresh culture media was changed each day. After culture,
viable cells were measured using an MTT assay and their
morphology was examined by F-actin staining.
Macromol. Biosci. 2008, 8, 627–637
� 2008 WILEY-VCH Verlag GmbH & Co. KGaA, Weinheim
Statistical Analysis
All the quantitative results were obtained from triplicate samples.
Data were expressed as a mean� standard deviation (SD).
Statistical analysis was carried out using paired Student’s t-test,
and a value of p< 0.05 was considered to be statistically
significant.
Results and Discussion
Characterization of Electrospun CPSA-PAni/PLCLNanofibers
We prepared the composite nanofiber scaffolds by
electrospinning physical blends of PLCL and CPSA-PAni
with two different volume ratios of PLCL to PAni, i.e., 85:15
and 70:30 (PACL-2 and PACL-3), respectively. As a control
group, pure PLCL was also electrospun at a concentration of
10% in HFP (PACL-1). Figure 2 shows SEM images, and the
distribution and mean value fiber diameters of the
prepared nanofibers. Since the color of the CPSA-PAni
solution was inherently dark blue, the color of the
corresponding CPSA-PAni/PLCL nanofibers became homo-
geneously darker as shown in Figure 2a–c as the amount of
PAni in the blend increased. Both CPSA-PAni and PLCL were
favorably dissolved in HFP and electrospun to form
smooth nanofibers. There was no indication of lumps or
coarse roughening on the surface of nanofibers by the
incorporation of PAni, as confirmed by SEM images. The
non-woven fibers were randomly distributed throughout
the scaffolds and formed interconnected pores. Intercon-
nected pores and a large pore volume of nanofiber
scaffolds are the most important factors that determine
cell adhesion and proliferation.[25] Image analysis of
approximately 50 fibers from three samples shows that
the diameters of the electrospun nanofibers range from
100 to 700 nm. Although increasing the volume ratio of
PAni to PLCL decreases the total concentration of PLCL in
the mixture, the mean fiber diameters of each sample were
consistent (430� 116, 423� 100, and 382� 102 nm for
PACL-1, PACL-2, and PACL-3, respectively). However, with
the incorporation of an increased amount of CPSA-PAni
solution, i.e., greater than 30%, we observed a decrease in
the nanofiber size with bead formation instead of the
generation of uniform nanofibers. Previous reports
demonstrated that the fiber diameter distribution of
electrospun nanofibers was affected by solvent concentra-
tions and viscosities of polymers.[17,26] Therefore, it is
important to optimise these parameters to obtain uniform
sized nanofibers. Our results suggest that bead-free
nanofibers can be reproducibly generated within a blend
with a concentration of PAni of less than 30%.
The control of fiber size is critical in our experiment to
investigate the effect of the presence of electroconductive
DOI: 10.1002/mabi.200800005

Development of Electroactive and Elastic Nanofibers that contain Polyaniline and . . .
Figure 2. Morphologies and fiber diameters of CPSA-PAni/PLCL nanofiber scaffolds. a–c) Macroscopics, d–f) SEM micrographs, g) averagefiber diameters, and h) distribution of fiber diameters of CPSA-PAni/PLCL nanofiber scaffolds.
functional groups on cell adhesion and morphology. Since
the fiber diameters of the CPSA-PAni/PLCL nanofibers were
within a similar range, we could exclude the possibility
that cellular responses were influenced by the size of the
fibers. Besides chemical properties, it has been established
that the size of nanofibers regulates adhesion, prolifera-
tion, and differentiation of NIH-3T3 fibroblasts, chondro-
cytes, and osteoblasts.[27–30]
The representative mechanical parameters of CPSA-
PAni/PLCL nanofibers calculated from stress–strain curves
are presented in Figure 3. Overall, PACL-1 shows the
highest tensile strength, Young’s modulus, and elongation
at break. For example, the tensile strength of PACL-1 was
1.04� 0.04 MPa, which decreased to 0.82� 0.04 and
0.69� 0.03 MPa for PACL-2 and PACL-3, respectively. In
particular, incorporation of PAni into PLCL significantly
Macromol. Biosci. 2008, 8, 627–637
� 2008 WILEY-VCH Verlag GmbH & Co. KGaA, Weinheim
reduces the elasticity of the nanofiber as shown in
Figure 3c. The elongation at break for pure PLCL was
391.54� 9.20%, which decreased to 309.41� 7.22% and
207.85� 6.74% when the volume ratio of PAni to PLCL was
increased to 15 and 30%, respectively. The elastic property
of the CPSA-PAni/PLCL scaffolds decreased with increasing
CPSA-PAni content. These characteristics may be a result of
the decrease in the concentration of total PLCL polymer
solution with the increased amount of CPSA-PAni in the
blend. Despite the reduced mechanical properties, elastic
properties of CPSA-PAni/PLCL nanofibers are much higher
than those of electroactive electrospun scaffolds from
other synthetic or natural polymers (PLGA and gelatin
exhibit a strain of 96% and 12.5%, and even native skin
extends between 35% and 115%).[25,31] Our results suggest
that the elastic properties of electroactive nanofibers can
www.mbs-journal.de 631

S. I. Jeong, I. D. Jun, M. J. Choi, Y. C. Nho, Y. M. Lee, H. Shin
Figure 3.Mechanical properties of CPSA-PAni/PLCL nanofiber scaffolds. a) Tensile strength, b) Young’s modulus, c) elongation at break, andd) stress–strain curve of CPSA-PAni/PLCL nanofiber scaffolds.
632
be enhanced by electrospinning with elastic polymers,
thereby allowing for more realistic mimicry of the
mechanical and electrical characteristics of the natural
ECM of soft tissue such as skin, skeletal muscle, and blood
vessels.
The conductivity of electrospun CPSA-PAni/PLCL nano-
fibers was measured at various ratios of CPSA-PAni and
PLCL in blend. As show in Table 1, PACL-1 without
incorporation of PAni shows the minimal conductivity
(0.0015 S � cm�1). Incorporation of PAni in the nanofiber
significantly increases the conductivity as a function of
increased amount of PAni where the conductivity of
PACL-2 and PACL-3 is 0.00765 and 0.0138 S � cm�1,
respectively. The main factor to determine the conductiv-
ity of PAni (more specifically emeraldine base) is known to
be the oxidation status originated by the interactions
between the organic acid and PAni. Furthermore, the
expanded structure of the coil-like PAni chains affects the
conductivity, which is influenced by the interactions of
the dopant (usually an organic acid) with the solvent.[17]
Previous reports have demonstrated that the conductivity
of PAni tremendously differs by selection of appropriate
solvents; the CPSA-PAni had a conductivity of 0.1 S � cm�1
Macromol. Biosci. 2008, 8, 627–637
� 2008 WILEY-VCH Verlag GmbH & Co. KGaA, Weinheim
in chloroform, which became four orders of magnitude
greater in m-cresol.[32,33] Considering the increased con-
ductivity of the PAni/PLCL composite nanofibers, we
assumed that CPSA, dissolved in HFP, protonated the
emeraldine base of PAni, thereby forming the polyelec-
trolyte salt within the organic matrix of PLCL. Our results
indicate that HFP was effective for the formation of a
CPSA-PAni salt within the PLCL matrix, which makes the
chain conformation of PAni conductive.[17] The result is
consistent with a previous study that used HFP for the
fabrication of nanofibers from a mixture of gelatin and
PAni. More importantly, the increased conductivity of the
CPSA-PAni/PLCL nanofibers with a higher amount of PAni
indicates that the expanded chains of CPSA-PAni are
homogeneously distributed in the PLCL.
We then examined the presentation of surface func-
tional groups of the nanofibers using ATR FT-IR and Raman
spectroscopy, and XPS measurements. As shown in
Figure 4, all the characterization methods support the
presence of CPSA-PAni on the surface of the composite
nanofibers. The ATR FT-IR spectra present the major
characteristic peaks of CPSA-PAni at 1 652, 1 543, 1 280, and
1 192 cm�1. All nanofibers show the characteristic ester
DOI: 10.1002/mabi.200800005

Development of Electroactive and Elastic Nanofibers that contain Polyaniline and . . .
Figure 4. Surface properties of CPSA-PAni/PLCL nanofiber scaffolds. a) ATR FT-IR, b) Raman, and c) XPS spectra of the samples.
stretching of PLCL at 1 751cm�1.[34] The characteristic
stretching peaks of CPSA-PAni are observed at 1 652cm�1
(C––O) and 1 543 cm�1 (N–H) in the PACL-2 and PACL-3
nanofiber samples, while the same peak disappears for the
PACL-1 nanofiber.[35] The results strongly suggested that
CPSA-PAni is present at the surface of the nanofibers. In
addition, the intensity of the corresponding peaks
appeared to increase as the amount of PAni in the
nanofibers increased. The ATR FT-IR spectra are similar to
those of PAni-blended electrically conductive materials
that include PAni-chitosan and PAni-polyurethane sub-
strates.[36,37]
The Raman spectra strengthened our early conclusion of
the presence of PAni on the surface of the nanofiber
composites. The characteristic two peaks for CPSA-PAni are
observed at 1 330 cm�1 (C–N) and 1 601 cm�1 (phenyl C–C),
which are present in spectra for PACL-2 and PACL-3
Macromol. Biosci. 2008, 8, 627–637
� 2008 WILEY-VCH Verlag GmbH & Co. KGaA, Weinheim
nanofibers, whereas both peaks disappear from the spectra
of the PACL-1 nanofibers. The presence of these character-
istic peaks is in a good agreement with previous
reports.[38,39] Notably, the intensity of these two bands in
PACL-3 is greater than that in PACL-2, which indicates that
the amount of CPSA-PAni may be correspondingly greater
at the nanofibers surface. The presence of nitrogen at the
surface of the composite nanofibers was doubly confirmed
by XPS, where the N 1s peak is observed at 399 eV for
PACL-2 and PACL-3 nanofibers only, while no nitrogen
peak is found in PACL-1.[35] PLCL shows only C 1s and O 1s
peaks present at binding energies of 291 and 530 eV,
respectively.[40] Collectively, these results suggest that the
electrospinning process of CPSA-PAni/PLCL blends is
successful for the presentation of electrically conducting
domains at the surface, which may be effective to transfer
electrical signals.
www.mbs-journal.de 633

S. I. Jeong, I. D. Jun, M. J. Choi, Y. C. Nho, Y. M. Lee, H. Shin
Figure 5. Thermal gravimetric properties of CPSA-PAni/PLCL nano-fiber scaffolds. When the temperature exceeded 800 8C, approxi-mately 12 and 21% relative to the original weight remained forPACL-2 and PACL-3, respectively.
634
The TGA profiles of CPSA-PAni/PLCL in Figure 5 show the
dependence of thermal stabilities of the nanofibers on
CPSA-PAni concentration. The thermal decomposition of
PAni followed two step processes, where the initial broad
decrease in the sample weight was observed from
approximately 150 to 400 8C and the second stage occurred
from approximately 550 to 750 8C. On the other hand,
PACL-1 was degraded before the maximum tested
temperature (900 8C) with trace amounts of unknown
impurities. When the volume ratio of PAni to PLCL
increased from 15 to 30%, the corresponding weight loss
at 900 8C was approximately 90 and 80%, respectively. The
remaining weight was attributed to the presence of PAni,
which decomposed by 20 over 900 8C. These TGA profiles
are similar to those of conductive and non-conductive
composite materials, which include polyaniline-
polyurethane and polyaniline-chitosan substrates.[36,37]
Figure 6. in vitro cellular response to CPSA-PAni/PLCL nanofiberscaffolds. Mitochondria metabolic activity of a) human dermalfibroblasts, b) NIH-3T3 fibroblasts, and c) mouse skeletal musclecells (C2C12) on CPSA-PAni /PLCL nanofibers prepared by theelectrospinning process, respectively.
in vitro Cell Response
To investigate the effect of PAni on cell adhesion, we
seeded three different types of cells on the CPSA-PAni/PLCL
nanofibers and measured mitochondria metabolic activity
using MTT assay. On day one after seeding, each cell type
showed different levels of enzymatic activity. The general
trend was observed that the relative amount of living cells
cultured on the nanofibers significantly increased in a PAni
concentration-dependent manner (Figure 6). For example,
the relative activity of human primary fibroblasts cultured
on PACL-3 was 186.54� 3.79, which was almost three
times greater that that on PACL-1 (63.55� 2.22%). Mouse
skeletal muscle cells (C2C12) showed the same behavior
where the relative activity increased from 35.95� 4.41% to
Macromol. Biosci. 2008, 8, 627–637
� 2008 WILEY-VCH Verlag GmbH & Co. KGaA, Weinheim
100.82� 11.82 when the volume ratio of PAni to PLCL
increased from 0 to 30%. The morphology and cytoskeletal
structure of adherent cells on the CPSA-PAni/PLCL
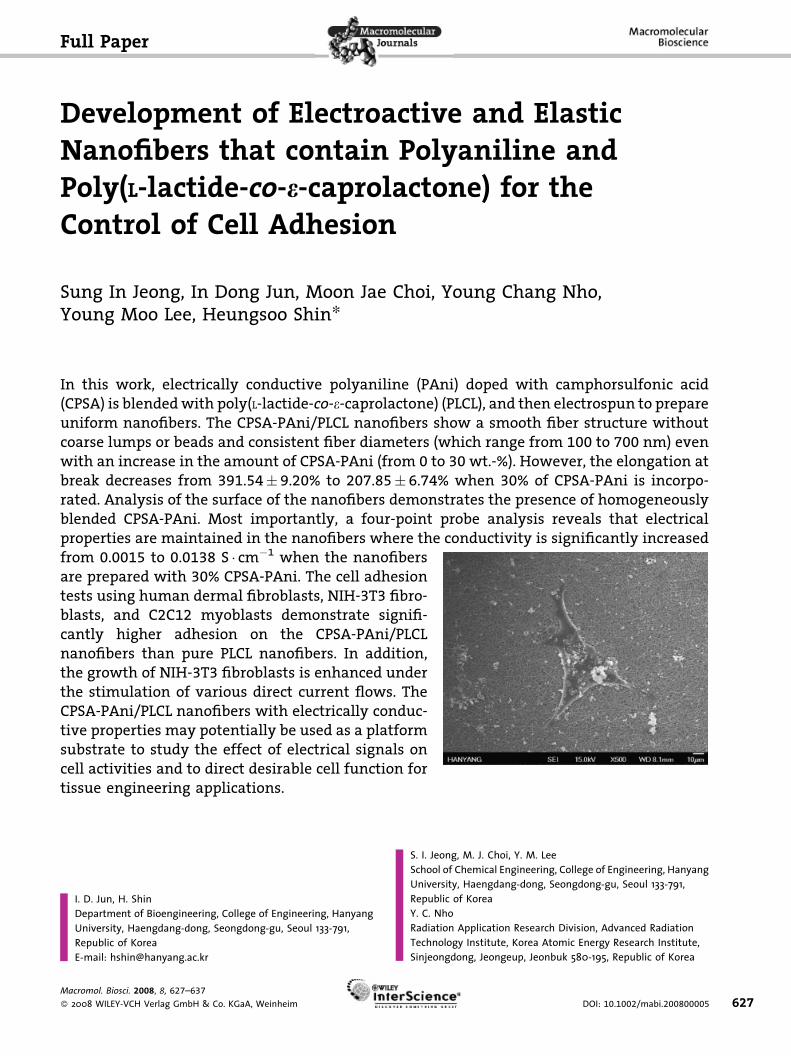
nanofibers were also assessed by staining F-actin follow-
ing the fixation of cells 1 day after seeding (Figure 7), which
DOI: 10.1002/mabi.200800005
Development of Electroactive and Elastic Nanofibers that contain Polyaniline and . . .
Figure 7. Representative SEM images (a–c) and fluorescence micrographs (d–f) demonstrating the formation of F-actin filaments in thehuman fibroblasts, NIH-3T3 fibroblast, and C2C12 cells cultured on CPSA-PAni/PLCL (PACL-3) nanofiber scaffolds for 1 d (scale bar¼ 100 mm).
indicates that the cells cultured on nanofibers maintain
normal morphologies and spread.
The biocompatibility of PAni has been reported from
other studies. PAni films and composites of PAni with
natural polymers allowed favorable attachment of H9c2
cardiac myoblasts, which remained viable and prolifer-
ated.[17,41] In our study, we re-confirmed the biocompat-
ibility of PAni-containing nanofibers using several cell
lines, and demonstrated that the incorporation of PAni
improved the metabolic activity of all cell types treated in
a concentration-dependent manner. Since PLCL has been
reported to allow limited cell adhesion, the composite
scaffold may be beneficial for enhanced cell compatibility
of PLCL. However, it is not clear whether the enhanced cell
adhesion is a result of either electroconductive properties
of the scaffolds or modified surface chemistry by
incorporated PAni, or both. Since the contact angle
measurement showed that all types of nanofiber scaffold
had similar values as shown in Table 1, the hydrophobi-
city/hydrophilicity of the surface may not be the primary
contributor for the observed phenomena. This would be
the subject of further investigations.
Finally, we used nanofibers as a model system to carry
out a preliminary study to investigate the combined
effects of electrical stimulus and an electrically conducting
substrate on the mitochondria metabolic activity of
NIH-3T3 cells. Cells were attached to PACL-1 and PACL-3
nanofibers. Subsequently, various electrical currents
were continuously applied to a cell/nanofiber scaffold
Macromol. Biosci. 2008, 8, 627–637
� 2008 WILEY-VCH Verlag GmbH & Co. KGaA, Weinheim
constructs for 2 days and their metabolic activities were
measured by MTT assay. As shown in Figure 8, the
mitochondria metabolic activity of NIH-3T3 cells
responded to the electrical stimulus. It was evident that
application of 200 mA was detrimental to the cells, which
showed minimal metabolic activity. At 0 and 2 mA, the
mitochondria metabolic activity of the NIH-3T3 cells was
similar to all the tested groups. However, 20 mA of
electrical current significantly increased the mitochondria
metabolic activity of NIH-3T3 cells cultured on PACL-3 as
compared to that on PACL-1.
The effect of electrical stimulation on cellular activities
has been reported using different cell types. The most
widely utilized conductive polymer is polypyrrole and its
derivatives. Schmidt and colleagues reported that one of
the murine neuron precursor cells, PC-12 cells, demon-
strated an increase in neurite outgrowth on polypyrrole
substrates when stimulated at 100 mA for 2 h.[13,42] On a
similar substrate, keratinocyte viability was increased by
20% upon stimulation at 100 mA as compared to a
non-stimulated control.[14] Recently, an electrically active
composite scaffold comprised of poly(e-caprolactone) and
PAni has been fabricated, which showed enhanced
calcification of osteoblasts under electrical stimulation.[43]
Although direct comparison between previous and current
studies may not be appropriate because our nanofibrous
scaffolds possess different chemical and morphological
properties, it is clear that PAni/PLCL composite scaffolds
may have transferred additive signals to adherent cells by
www.mbs-journal.de 635

S. I. Jeong, I. D. Jun, M. J. Choi, Y. C. Nho, Y. M. Lee, H. Shin
Figure 8. in vitro cellular response to CPSA-PAni/PLCL nanofiber scaffolds under electrical stimulation. Fluorescence micrographs demon-strating the formation of F-actin filaments of the NIH-3T3 fibroblast cultured on CPSA-PAni/PLCL (PACL-3) nanofiber scaffolds for 2 d underan electrical current of a) 20 and b) 200 mA, and c) mitochondria metabolic activity of NIH-3T3 fibroblasts (scale bar¼ 100 mm).
636
their unique electroconductive nature and thereby modu-
lated proliferation of the fibroblasts.
The PAni/PLCL scaffolds possess advantageous features
over previously fabricated electrically conductive polymer
composite systems: 1) the PLCL domain provides mecha-
nical stability, in particular the elastic properties of the
scaffolds, 2) polymer components can be easily dissolved
with HFP and then electrospun to form uniform fibers with
diverse diameter ranges, and 3) incorporated PAni can
enhance the biocompatibility of the composite scaffolds.
Our future studies will involve the use of PAni/PLCL
composite scaffolds to investigate the effects of electrical
stimulation and electroconductive properties of substrate
materials on the functional response of neural precursor
cells or muscle cells, which transfer most of their signals by
electrochemical processes.
Macromol. Biosci. 2008, 8, 627–637
� 2008 WILEY-VCH Verlag GmbH & Co. KGaA, Weinheim
Conclusion
In this study, we prepared electroactive CPSA-PAni/PLCL
nanofiber scaffolds using the electrospinning technique.
SEM analysis of the scaffolds showed that a nanoscaled
structure was successfully formed with a high pore
volume, interconnective pores, and a uniform mean fiber
diameter irrespective of PAni incorporation. Moreover, the
electrical conductivity of the CPSA-PAni/PLCL scaffolds
increased with increasing CPSA-PAni content. Analysis
with ATR FT-IR, Raman, and XPS spectra demonstrated the
presence of CPSA-PAni on the surface of the nanofiber
scaffolds. The adhesion of human dermal fibroblasts,
NIH-3T3 fibroblasts, and C2C12 cells on to the scaffolds
was dependent on the CPSA-PAni content. The growth of
NIH-3T3 cultured on the CPSA-PAni/PLCL scaffolds was
DOI: 10.1002/mabi.200800005

Development of Electroactive and Elastic Nanofibers that contain Polyaniline and . . .
controlled by the application of a medium range of
electrical stimulation. The CPSA-PAni/PLCL nanofiber
scaffolds combine the advantages of mechanical strength,
electrical conductivity, and the nanometer-scale features
of a native ECM, and may hold a great promise as an
electrically conductive scaffold for many tissue engineer-
ing applications under a mechano-electrically stimulated
microenvironment.
Acknowledgements: This work was supported by the Seoul R &BD Program funded by Seoul Development Institute (to Y.M. Leeand H. Shin). S.I.J. is very grateful to the BK21 Project for afellowship.
Received: January 8, 2008; Revised: February 21, 2008; Accepted:February 21, 2008; DOI: 10.1002/mabi.200800005
Keywords: conducting polymers; electrospinning; nanofibers;polyaniline; poly(L-lactide-co-e-caprolactone)
[1] W. F. Liu, C. S. Chen, Mater. Today 2005, 8, 28.[2] H. Shin, Biomaterials 2007, 28, 126.[3] H. Shin, S. Jo, A. G. Mikos, Biomaterials 2003, 24, 4353.[4] F. Rosso, A. Giordano, M. Barbarisi, A. Barbarisi, J. Cell.
Physiol. 2004, 199, 174.[5] G. Bao, S. Suresh, Nat. Mater. 2003, 2, 715.[6] A. Liedert, D. Kaspar, R. Blakytny, L. Claes, A. Ignatius,
Biochem. Biophys. Res. Commun. 2006, 349, 1.[7] S. Gerecht-Nir, M. Radisic, H. Park, C. Cannizzaro, J. Boublik,
R. Langer, G. Vunjak-Novakovic, Int. J. Dev. Biol. 2006, 50, 233.[8] A. J. Engler, M. A. Griffin, S. Sen, C. G. Bonnemann, H. L.
Sweeney, D. E. Discher, J. Cell. Biol. 2004, 166, 877.[9] C. F. Deroanne, C. M. Lapiere, B. V. Nusgens, Cardiovasc. Res.
2001, 49, 647.[10] A. P. Balgude, X. Yu, A. Szymanski, R. V. Bellamkonda,
Biomaterials 2001, 22, 1077.[11] S. I. Jeong, S. H. Kim, Y. H. Kim, Y. Jung, J. H. Kwon, B. S. Kim,
Y. M. Lee, J. Biomater. Sci., Polym. E 2004, 15, 645.[12] M. Radisic, H. Park, H. Shing, T. Consi, F. J. Schoen, R. Langer,
L. E. Freed, G. Vunjak-Novakovic, Proc. Natl. Acad. Sci. USA2004, 101, 18129.
[13] C. E. Schmidt, V. R. Shastri, J. P. Vacanti, R. Langer, Proc. Natl.Acad. Sci. USA 1997, 94, 8948.
[14] D. D. Ateh, P. Vadgama, H. A. Navsaria, Tissue Eng. 2006, 12,645.
[15] D. D. Ateh, A. Waterworth, D. Walker, B. H. Brown, H.Navsaria, P. Vadgama, J. Biomed. Mater. Res. A 2007.
[16] S. Sun, I. Titushkin, M. Cho, Bioelectrochemistry 2006, 69,133.
Macromol. Biosci. 2008, 8, 627–637
� 2008 WILEY-VCH Verlag GmbH & Co. KGaA, Weinheim
[17] M. Li, Y. Guo, Y. Wei, A. G. MacDiarmid, P. I. Lelkes,Biomaterials 2006, 27, 2705.
[18] Q. P. Pham, U. Sharma, A. G. Mikos, Tissue Eng. 2006, 12,1197.
[19] S. Kamalesh, P. Tan, J. Wang, T. Lee, E. T. Kang, C. H. Wang,J. Biomed. Mater. Res. 2000, 52, 467.
[20] M. Mattioli-Belmonte, G. Giavaresi, G. Biagini, L. Virgili, M.Giacomini, M. Fini, F. Giantomassi, D. Natali, P. Torricelli, R.Giardino, Int. J. Artif. Organs 2003, 26, 1077.
[21] S. I. Jeong, B. S. Kim, Y. M. Lee, K. J. Ihn, S. H. Kim, Y. H. Kim,Biomacromolecules 2004, 5, 1303.
[22] S. H. Lee, B. S. Kim, S. H. Kim, S. W. Kang, Y. H. Kim,Macromol. Biosci. 2004, 4, 802.
[23] C. H. Lee, S. Y. Hwang, J. Y. Sohn, H. B. Park, J. Y. Kim, Y. M.Lee, J. Power Sources 2006, 163, 339.
[24] C. H. Lee, H. B. Park, Y. M. Lee, R. D. Lee, Ind. Eng. Chem. Res.2005, 44, 7617.
[25] W. J. Li, C. T. Laurencin, E. J. Caterson, R. S. Tuan, F. K. Ko,J. Biomed. Mater. Res. A 2002, 60, 613.
[26] I. D. Norris, M. M. Shaker, F. K. Ko, A. G. MacDiarmid, Synth.Met. 2000, 114, 109.
[27] S. R. Bhattarai, N. Bhattarai, H. K. Yi, P. H. Hwang, D. I. Cha,H. Y. Kim, Biomaterials 2004, 25, 2595.
[28] K. L. Elias, R. L. Price, T. J. Webster, Biomaterials 2002, 23,3279.
[29] A. S. Badami, M. R. Kreke, M. S. Thompson, J. S. Riffle, A. S.Goldstein, Biomaterials 2006, 27, 596.
[30] W. J. Li, Y. J. Jiang, R. S. Tuan, Tissue Eng. 2006, 12, 1775.[31] Z. M. Huang, Y. Z. Zhang, S. Ramakrishna, C. T. Lim, Polymer
2004, 45, 5361.[32] J. K. Avlyanov, Y. G. Min, A. G. Macdiarmid, A. J. Epstein,
Synth. Met. 1995, 72, 65.[33] Y. N. Xia, J. M. Wiesinger, A. G. Macdiarmid, A. J. Epstein,
Chem. Mater. 1995, 7, 443.[34] K. Kesenci, A. Motta, L. Fambri, C. Migliaresi, J. Biomat. Sci.,
Polym. E 2001, 12, 337.[35] K. H. Hong, K. W. Oh, T. J. Kang, J. Appl. Polym. Sci. 2005, 96,
983.[36] F. D. R. Amado, L. F. Rodrigues, M. A. S. Rodrigues, A. M.
Bernardes, J. Z. Ferreira, C. A. Ferreira, Desalination 2005, 186,199.
[37] T. Thanpitcha, A. Sirivat, A. M. Jamieson, R. Rujiravanit,Carbohydr. Polym. 2006, 64, 560.
[38] M. C. Bernard, V. T. Bich, A. Hugot-Le Goff, Synth. Met. 1999,101, 809.
[39] G. M. do Nascimento, J. E. P. da Silva, S. I. C. de Torresi, M. L. A.Temperini, Macromolecules 2002, 35, 121.
[40] A. Layre, P. Couvreur, H. Chacun, J. Richard, C. Passirani, D.Requier, J. P. Benoit, R. Gref, J. Controlled Release 2006, 111,271.
[41] P. R. Bidez, S. X. Li, A. G. MacDiarmid, E. C. Venancio, Y. Wei,P. I. Lelkes, J. Biomater. Sci., Polym. E 2006, 17, 199.
[42] A. Kotwal, C. E. Schmidt, Biomaterials 2001, 22, 1055.[43] M. A. Whitehead, D. Fan, G. R. Akkaraju, L. T. Canham, J. L.
Coffer, J. Biomed. Mater. Res. A 2007, 83, 225.
www.mbs-journal.de 637


![Electroactive Benzothiazole Hydrazones and Their [Mo6O19]2− Derivatives: Promising Building Blocks for Conducting Molecular Materials](https://static.fdokumen.com/doc/165x107/634592e6df19c083b1082088/electroactive-benzothiazole-hydrazones-and-their-mo6o192-derivatives-promising.jpg)