Thin film hydrophilic electroactive polymer coatings for bioelectrodes
Upload
independentCategory
view
0download
0
0003-2654(2009)134:3;1-H
AnalystInterdisciplinary detection science
www.rsc.org/analyst Volume 134 | Number 3 | March 2009 | Pages 409–620
CRITICAL REVIEWChristy L. Haynes et al.Analytical methods to assess nanoparticle toxicity
PAPERSergio B. Mendes et al.An electroactive fiber optic chip for spectroelectrochemical characterization of ultra-thin redox-active films
ISSN 0003-2654

PAPER www.rsc.org/analyst | Analyst
An electroactive fiber optic chip for spectroelectrochemicalcharacterization of ultra-thin redox-active films
Brooke M. Beam,b Neal R. Armstrongb and Sergio B. Mendes*a
Received 21st August 2008, Accepted 21st November 2008
First published as an Advance Article on the web 19th December 2008
DOI: 10.1039/b814338b
The first, fully integrated, planar fiber optic platform with spectroelectrochemical capabilities, termed
the electroactive fiber optic chip (EA-FOC) is presented here. Spectroelectrochemical techniques
provide complementary optical and electrochemical data which are important for applications ranging
from thin film characterization to advanced sensor design. To create the EA-FOC a side-polished fiber
optic is coated with a thin film of indium-tin oxide (ITO) as the working electrode and used to probe
electrochemically-driven changes in absorbance for surface-confined redox species. A sensitivity
enhancement of �40 times higher than a transmission measurement is demonstrated for this first-
generation EA-FOC, using the methylene blue (MB) redox couple, cycling between the visibly colored,
oxidized form of MB, and its leuco (transparent) reduced form. Additionally, the EA-FOC is used to
probe the redox spectroelectrochemistry of an electrodeposited thin film, about 0.3% of a monolayer, of
the conducting polymer poly(3,4-ethylenedioxythiophene) (PEDOT). Unlike other waveguide formats,
the EA-FOC offers an ease of use due to its ability to simply couple to light sources and detectors
through standard fiber connectors to create a sensitive planar waveguide spectroelectrochemical
platform.
Introduction
Spectroelectrochemical techniques are routinely used to charac-
terize redox mechanisms of solution probe molecules,1,2 redox
processes of ultra-thin films of conducting polymers,3,4 and
electrochemical processes in adsorbed protein films.5,6 Measuring
optical changes that are coincident with the redox event provides
several significant advantages, mainly arising from the fact that
these optical changes occur independently of non-Faradaic
processes at the electrode/solution interface. Monitoring changes
in absorbance or reflectance as a function of applied potential
provides optical data that can be used to reconstruct the current
flowing solely in the Faradaic event without the capacitive
current background, which can often be larger than the Faradaic
current especially for ultra-thin redox films. When the optical
characterization is carried out on a waveguide platform, over-
coated with a transparent electrode material (e.g. indium-tin
oxide, tin oxide, boron-doped diamond, etc.),7–12 there can be
significant sensitivity enhancement relative to transmission
spectroelectrochemical experiments due to the increased optical
pathlength of the platform. This sensitivity enhancement is often
sufficient to allow for characterization of electron transfer events
at sub-monolayer coverages of the redox-active molecular system
and may provide information about structural changes which
occur during electron transfer.4,6,13,14 Additionally, multifunc-
tional spectroelectrochemical platforms are used for advanced
sensor technologies requiring the greater flexibility of the
aDepartment of Physics and Astronomy, University of Louisville,Louisville, Kentucky 40292, USA. E-mail: [email protected];Fax: +1-502-852-8128bDepartment of Chemistry, University of Arizona, Tucson, Arizona 85721,USA
454 | Analyst, 2009, 134, 454–459
combined electrochemical and spectroscopic techniques in sensor
architecture design.15,16
Over the last decade the sensitivity of spectroelectrochemical
measurements have been significantly enhanced by using
monochromatic and broadband attenuated total reflectance
(ATR),8,17–19 multi-mode waveguides,11,20–22 and single-mode
waveguides.7,10 These technologies follow on the original work of
Winograd and Kuwana using monochromatic ATR platforms
which demonstrated a �7-fold increase in sensitivity compared
to transmission spectroelectrochemical measurements.18 Itoh
and Fujishima subsequently demonstrated that a tin oxide film
coating on a 2 mm thick single-mode, gradient index channel
waveguide increased the sensitivity of spectroelectrochemical
measurements of a surface-confined molecule (methylene blue –
MB) by �150 times.11 A significant advance has been the
introduction of the electroactive integrated optical waveguide
(EA-IOW) platform,9,10 which is a single-mode, step-index guide,
overcoated with 25–50 nm of indium-tin oxide (ITO), and shows
the highest spectroelectrochemical sensitivity (relative to
a transmission experiment) yet reported of 103� and up to 104�.
A significant hindrance for these ATR and EA-IOW spec-
troelectrochemical technologies, however, has been interfacing
the internal reflection element (IRE) with standard, commer-
cially available spectroscopic instrumentation. Optical coupling
in and out of a planar waveguide platform requires precision
optics, tight mechanical tolerances, time-consuming alignment,
and for some configurations, advanced micro-optics fabrication
technologies, such as integrated diffraction gratings.7,23 Only one
field-portable instrument has been developed, by Heinemann and
co-workers, based on an ATR configuration and used to spec-
troelectrochemically detect ferrocyanide.24,25
Fiber optic-based spectroscopic devices, however, have the
advantage of being extremely easy to couple light into and out-of,
This journal is ª The Royal Society of Chemistry 2009
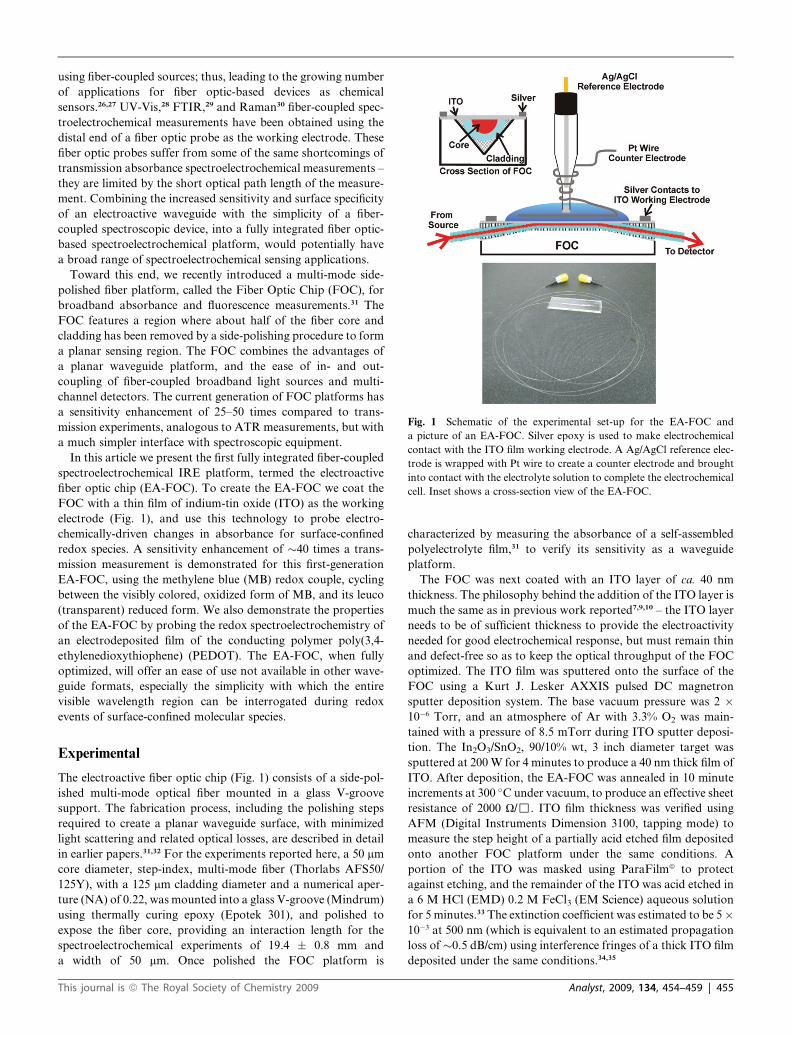
Fig. 1 Schematic of the experimental set-up for the EA-FOC and
a picture of an EA-FOC. Silver epoxy is used to make electrochemical
contact with the ITO film working electrode. A Ag/AgCl reference elec-
trode is wrapped with Pt wire to create a counter electrode and brought
into contact with the electrolyte solution to complete the electrochemical
cell. Inset shows a cross-section view of the EA-FOC.
using fiber-coupled sources; thus, leading to the growing number
of applications for fiber optic-based devices as chemical
sensors.26,27 UV-Vis,28 FTIR,29 and Raman30 fiber-coupled spec-
troelectrochemical measurements have been obtained using the
distal end of a fiber optic probe as the working electrode. These
fiber optic probes suffer from some of the same shortcomings of
transmission absorbance spectroelectrochemical measurements –
they are limited by the short optical path length of the measure-
ment. Combining the increased sensitivity and surface specificity
of an electroactive waveguide with the simplicity of a fiber-
coupled spectroscopic device, into a fully integrated fiber optic-
based spectroelectrochemical platform, would potentially have
a broad range of spectroelectrochemical sensing applications.
Toward this end, we recently introduced a multi-mode side-
polished fiber platform, called the Fiber Optic Chip (FOC), for
broadband absorbance and fluorescence measurements.31 The
FOC features a region where about half of the fiber core and
cladding has been removed by a side-polishing procedure to form
a planar sensing region. The FOC combines the advantages of
a planar waveguide platform, and the ease of in- and out-
coupling of fiber-coupled broadband light sources and multi-
channel detectors. The current generation of FOC platforms has
a sensitivity enhancement of 25–50 times compared to trans-
mission experiments, analogous to ATR measurements, but with
a much simpler interface with spectroscopic equipment.
In this article we present the first fully integrated fiber-coupled
spectroelectrochemical IRE platform, termed the electroactive
fiber optic chip (EA-FOC). To create the EA-FOC we coat the
FOC with a thin film of indium-tin oxide (ITO) as the working
electrode (Fig. 1), and use this technology to probe electro-
chemically-driven changes in absorbance for surface-confined
redox species. A sensitivity enhancement of �40 times a trans-
mission measurement is demonstrated for this first-generation
EA-FOC, using the methylene blue (MB) redox couple, cycling
between the visibly colored, oxidized form of MB, and its leuco
(transparent) reduced form. We also demonstrate the properties
of the EA-FOC by probing the redox spectroelectrochemistry of
an electrodeposited film of the conducting polymer poly(3,4-
ethylenedioxythiophene) (PEDOT). The EA-FOC, when fully
optimized, will offer an ease of use not available in other wave-
guide formats, especially the simplicity with which the entire
visible wavelength region can be interrogated during redox
events of surface-confined molecular species.
Experimental
The electroactive fiber optic chip (Fig. 1) consists of a side-pol-
ished multi-mode optical fiber mounted in a glass V-groove
support. The fabrication process, including the polishing steps
required to create a planar waveguide surface, with minimized
light scattering and related optical losses, are described in detail
in earlier papers.31,32 For the experiments reported here, a 50 mm
core diameter, step-index, multi-mode fiber (Thorlabs AFS50/
125Y), with a 125 mm cladding diameter and a numerical aper-
ture (NA) of 0.22, was mounted into a glass V-groove (Mindrum)
using thermally curing epoxy (Epotek 301), and polished to
expose the fiber core, providing an interaction length for the
spectroelectrochemical experiments of 19.4 � 0.8 mm and
a width of 50 mm. Once polished the FOC platform is
This journal is ª The Royal Society of Chemistry 2009
characterized by measuring the absorbance of a self-assembled
polyelectrolyte film,31 to verify its sensitivity as a waveguide
platform.
The FOC was next coated with an ITO layer of ca. 40 nm
thickness. The philosophy behind the addition of the ITO layer is
much the same as in previous work reported7,9,10 – the ITO layer
needs to be of sufficient thickness to provide the electroactivity
needed for good electrochemical response, but must remain thin
and defect-free so as to keep the optical throughput of the FOC
optimized. The ITO film was sputtered onto the surface of the
FOC using a Kurt J. Lesker AXXIS pulsed DC magnetron
sputter deposition system. The base vacuum pressure was 2 �10�6 Torr, and an atmosphere of Ar with 3.3% O2 was main-
tained with a pressure of 8.5 mTorr during ITO sputter deposi-
tion. The In2O3/SnO2, 90/10% wt, 3 inch diameter target was
sputtered at 200W for 4 minutes to produce a 40 nm thick film of
ITO. After deposition, the EA-FOC was annealed in 10 minute
increments at 300 �C under vacuum, to produce an effective sheet
resistance of 2000 U/,. ITO film thickness was verified using
AFM (Digital Instruments Dimension 3100, tapping mode) to
measure the step height of a partially acid etched film deposited
onto another FOC platform under the same conditions. A
portion of the ITO was masked using ParaFilmª to protect
against etching, and the remainder of the ITO was acid etched in
a 6 M HCl (EMD) 0.2 M FeCl3 (EM Science) aqueous solution
for 5 minutes.33 The extinction coefficient was estimated to be 5�10�3 at 500 nm (which is equivalent to an estimated propagation
loss of �0.5 dB/cm) using interference fringes of a thick ITO film
deposited under the same conditions.34,35
Analyst, 2009, 134, 454–459 | 455

A home-built fiber-coupled light source was used in all
experiments reported here. The light from a Xe-arc lamp (Oriel)
was reduced with an iris and was focused onto a fiber using a lens
(focal length ¼ 50.2 mm; with 1 : 1 imaging magnification).
Therefore, the EA-FOC could simply be plugged into the
broadband source for spectroscopic measurements using stan-
dard fiber connectors. The other end of the EA-FOC was fiber-
coupled into a spectrometer (SI Photonics 430) using a fiber
collimating lens (Thorlabs, focal length¼ 11 mm) and a focusing
lens (focal length ¼ 50.2 mm) into a collection fiber (SI
Photonics, 400 mm core); appropriate neutral density filters were
placed between the two lenses and perpendicular to the beam of
light. However, it is entirely feasible and straightforward to
replace our laboratory optical set-up employed for the
measurements presented here with commercially available fiber-
coupled light sources and detectors using the EA-FOC platform.
Spectroelectrochemical measurements were made in a sample
well surrounding the exposed fiber core. Electrical contact with
the EA-FOC was made using silver epoxy (SPI) painted around
the edge of the V-groove; two platinum wires (Sigma) were
attached bordering both ends of the exposed core to provide
contact of the working electrode to the potentiostat, minimizing
iR drop across the ITO film. Kapton (3M) tape was used to mask
the evanescent sensing region of the EA-FOC (19.5� 1 mm) and
the whole structure was backfilled with Sylgard 183 (Dow) pol-
y(dimethylsiloxane) (PDMS). The PDMS gasket created the
sample well, which isolated the electrolyte solution from the
silver contacts on the surface of the FOC. The outside of the Ag/
AgCl (BAS) reference electrode was wrapped with platinum wire
to provide a counter electrode in close proximity to both refer-
ence and working electrodes, and brought into contact with the
electrolyte solution on top of the EA-FOC to complete the
electrochemical cell (Fig. 1). A potentiostat (CHI Instruments
Fig. 2 (a) Broadband absorbance spectra at several potentials for an MB film
MB at 665 nm on the EA-FOC with respect to potential for 15 (-) and 80 (
(black line) and 80 mM (gray line) solutions. (d) Correlation of EA-FOC meas
(;) versus bulk solution MB concentration.
456 | Analyst, 2009, 134, 454–459
660) collected electrochemical measurements and maintained
potential control of the EA-FOC. The EA-FOC was cleaned
before all measurements by scrubbing with a 10% Triton-X
solution and a microfiber cloth, rinsing with Millipore water,
rinsing with ethanol and drying with a stream of N2.
Methylene blue (MB, Sigma) solutions in 0.1 M KNO3
(Sigma) were prepared at concentrations of 15, 50, 80, and 100
mM. The EA-FOCwas first cycled in electrolyte solution 10 times
over the potential region of interest to suppress both electro-
chemical and optical hysteresis of the ITO film.10 For spec-
troelectrochemical measurements, the MB solutions were
incubated in the sample well for 10 minutes. The EA-FOC
potential was scanned from 0.1 V to �0.4 V and back at a rate of
10 mV/s. Spectra were recorded every 40 mV and the absorbance
was calculated using reference spectra taken for the electrolyte
solution at the same potential. The sample well was then flushed
with about 10 cell volumes of electrolyte solution before intro-
duction of the nextMB solution. Electrochemical polymerization
of PEDOT onto the surface of the EA-FOC was carried out by
stepping the potential of the EA-FOC to 1.1 V in 10 mM 3,4-
ethylenedioxythiophene (EDOT, Aldrich) with 0.1 M LiClO4
(Aldrich) 10% methanol aqueous solution.36 We estimate the
PEDOT film to be ca. 0.3% of a monolayer assuming 3¼ 3.6 cm2/
nmol36 and an area of 10 A2 per EDOT unit.37 Spectroelec-
trochemical measurements were collected by scanning the
potential from 0.5 V to �0.8 V, and back, at 10 mV/s, recording
spectra every 40 mV.
Results and discussion
The MB redox couple was chosen to evaluate the sensitivity of
the EA-FOC to potential-driven absorbance changes. The
spectroelectrochemistry of adsorbed monolayers of MB has been
adsorbed onto the EA-FOC from an 80 mM solution. (b) Absorbance of
;) mM solution concentrations. (c) CVs of MB films deposited from 15
ured absorbance (-) with electrochemically determined surface coverage
This journal is ª The Royal Society of Chemistry 2009

Fig. 3 (a) CV of PEDOT film on the EA-FOC at 10 mV/s; (b) absor-
bance difference (at 550 nm) versus potential for PEDOT film on the EA-
FOC (inset: broadband absorbance spectra for reduced PEDOT at �0.8
V and oxidized polymer at 0.5 V versus Ag/AgCl on the EA-FOC); (c)
absorptovoltammogram for the same ultra-thin PEDOT film, at 10 mV/s.
previously established on IOW10,11 platforms; therefore, the MB
redox couple is used for comparison of the EA-FOC with these
well-known techniques. MB electrostatically adsorbs to the ITO
surface in its native oxidized form at coverages from sub-
monolayer up to monolayer, depending upon solution concen-
trations. Surface-adsorbedMB undergoes a chemically reversible
2-electron reduction to the transparent leuco form of the dye at
ca. �0.27 V versus a Ag/AgCl reference electrode. For the
micromolar solution concentrations used in this study, the bulk
MB absorbance does not contribute appreciably to the EA-FOC
spectroelectrochemical response.
Fig. 2a shows the broadband absorbance spectra recorded
using the EA-FOC at several potentials, in a solution of 80 mM
MB, where the absorbance maxima for both the monomer (665
nm) and aggregate forms of this dye (605 nm) are present.38
Fig. 2b is a plot of the absorbance of the monomer at 665 nm
versus potential as the potential is scanned from 0.1 V to �0.4 V
and back to 0.1 V. The optical absorbance changes for 80 mM
and 15 mM MB are easily detected. As the potential is scanned
more negative (forward sweep), the absorbance decreases as the
MB film is reduced to the transparent leuco form of the dye.
Upon scan reversal the oxidized forms of MB reappear with
some increase in absorbance intensity. This kind of hysteresis has
been observed previously for the characterization of MB redox
chemistry on the EA-IOW platform, at slow sweep rates only.9,10
The hysteresis has been attributed to re-oxidation of a higher
coverage ofMB created as a result of the reduction of the initially
adsorbed material, and diffusion-controlled adsorption of new
MB in concert with the reduction of the initial adsorbed MB. If
faster sweep rates are used, the absorbance changes for both
forward and reverse sweeps are similar and no hysteresis or
indication of increased MB coverage was seen.
For the complementary voltammograms collected for the
same MB concentrations (Fig. 2c), the Faradaic voltammetric
signal is small and difficult to resolve above the steeply sloping
background for the 80 mM solution of MB, and impossible to see
above background for an MB concentration of 15 mM or lower.
The large background current due to non-Faradaic processes
(i.e. double layer capacitance and redox processes which are not
associated with the redox chemistry of MB) makes character-
ization of Faradaic processes difficult using only current
detection; hence, the desire to use low background spectroelec-
trochemical measurements such as demonstrated here for the
EA-FOC.10
After background subtraction, the voltammetric peak area for
50, 80, and 100 mM MB solutions was determined and used to
calculate surface coverage of MB on the EA-FOC. For the 80
mM solution, the surface coverage was calculated to be 8.0 �10�11 mole/cm2, which corresponds to 30% of a full monolayer
based on a molecular area of 66 A2/molecule.39 Both the calcu-
lated surface coverage and the corresponding measured absor-
bance are directly proportional to the MB solution
concentration, as can be seen in Fig. 2d. The sensitivity of the
EA-FOC can then be calculated using the electrochemically
determined surface coverage and the experimentally measured
absorbance for these three solutions, using the Beer’s law rela-
tionship A ¼ S3G, where S is the EA-FOC sensitivity factor, 3 is
the molar absorptivity, and G is the surface coverage of MB. The
molar absorptivity is assumed to be the same as for MB in
This journal is ª The Royal Society of Chemistry 2009
solution, 2.2 � 104 M�1 cm�1 at 665 nm.39 The sensitivity of the
EA-FOC was calculated to be 40 � 2 or 20.6/cm, which is
comparable to sensitivities seen for our first-generation FOC
platform.31
Finally, the EA-FOC was used to electrochemically poly-
merize ultra-thin films of PEDOT, and probe the spectroelec-
trochemical characteristics of the polymer film as a further proof
of its sensitivity to redox events for surface-confined species. We
electropolymerized PEDOT over the entire coated ITO region,
by means of potential step electrodeposition as described else-
where.36 The coverage of PEDOT in the evanescent field region
was estimated to be ca. 0.3% of a monolayer, or 4.3� 10�12 mole/
cm2, assuming 3¼ 3.6 cm2/nmol36 and an area of 10 A2 per EDOT
unit.37 PEDOT undergoes a reversible oxidation from the neutral
dark blue form of the polymer to the almost transparent single
polaron state, and upon further oxidation to the bipolaron form
of the polymer.40 The reduction/oxidation voltammogram of the
electrodeposited PEDOT film on the EA-FOC shows broad
voltammetric peaks, poorly distinguishable from the background
current (Fig. 3a). The spectroelectrochemical measurement of the
change in absorbance at the lmax (550 nm) versus potential
illustrates the electrochromic behavior of the PEDOT film
(Fig. 3b). In Fig. 3c the first derivative of the absorbance change
Analyst, 2009, 134, 454–459 | 457

(at 550 nm) as a function of varying potential is plotted, to create
the absorptovoltammetric response.10,41 The cathodic transition
is represented by the upper portion of this plot; the lower portion
of this plot corresponds to the anodic wave. As expected from
previous absorptovoltammetric experiments, the electrochemical
events are much better resolved from background using optical
characterization. The peak separation (DEpeak) and the standard
redox potential (E�) is determined to be �0.12 V and �0.06 V
versus Ag/AgCl respectively from the absorptovoltammogram,
correlating well with the published electrochemical E� of �0 V
versus Ag/AgCl.40 The results from this study do not indicate the
oxidized form of the polymer, polaron or bipolaron, because the
absorptovoltammogram is only monitoring the appearance/
disappearance of the neutral polymer. The optical changes from
the transition from polaron to the bipolaron are less pronounced
and occur at longer wavelengths than the current experimental
set-up allows.40 Nevertheless, it is clear that the EA-FOC has the
requisite sensitivity to monitor optical changes to such redox-
active polymer films, down to surface coverages of ca. 0.3% of
a monolayer.
Conclusions
We have demonstrated a new spectroelectrochemical platform
which has many of the desirable features of planar waveguides,
and the convenience of fiber optic coupling for the broadband
spectroscopic characterization of ultra-thin films of redox-active
materials. As with the first-generation FOC counterpart, this
version of the EA-FOC shows a sensitivity improvement over
transmission experiments of ca. 40�. The sensitivity of the
device, analogous to the FOC platform, can be doubled by
simply inserting an annular mask in the optical pathway.31 We
anticipate further improvements in sensitivity will be possible by
increasing the interaction length of the device and generating an
EA-FOC based on a single-mode side-polished fiber. Planar
waveguide formats are more desirable than using the distal end
of an optical fiber for characterization of planar supported thin
films (e.g. biofilms, lipid bilayers, etc.).3,13,16,42 The major appeal
of the EA-FOC, however, lies in the combination of these planar
waveguide characteristics with the ease of fiber optic in- and out-
coupling of light over a broad spectral region, and the compat-
ibility with multi-channel spectroscopic detection capabilities.
UV-grade fibers have also recently been explored for FOC
platforms,43 and there is no fundamental reason that the EA-
FOC could not be extended to near- and even mid-IR spec-
troelectrochemical platforms, using conducting overlayers which
have sufficient transmittance in these spectral regions.29 Work in
progress seeks to expand the sensor capabilities of these new
platforms, and increase both their sensitivity and their ease of use
over broad spectral ranges.
Acknowledgements
The authors would like to thank Jill Craven for her help with
FOC fabrication. This work was supported by the National
Science Foundation under Grants Number DBI-0352449 (SBM)
and CHE-0517963 (NRA) and the Science and Technology
Center-Materials and Devices for Information Technology
Research Grant Number DMR-0120967 (NRA). BMB
458 | Analyst, 2009, 134, 454–459
acknowledges fellowship support from a TIRF Proposition 301
(Arizona) Graduate Fellowship in Photonics.
References
1 T. Kuwana and N. Winograd, in Electroanalytical Chemistry, ed. A.Bard, Marcel Dekker, Inc., New York, 1974, vol. 7, pp. 1–78.
2 W. R. Heineman, F. M. Hawkridge and H. N. Blount, inElectroanalytical Chemistry, ed. A. Bard, Marcel Dekker, Inc., NewYork, 1984, vol. 13, pp. 1–113.
3 C. Ge, N. R. Armstrong and S. S. Saavedra, Anal. Chem., 2007, 79,1401–1410.
4 C. Ge, W. J. Doherty III, S. B. Mendes, N. R. Armstrong andS. S. Saavedra, Talanta, 2005, 65, 1126–1131.
5 F. M. Hawkridge and I. Taniguchi, Comments Inorg. Chem., 1995, 17,163–187.
6 Z. O. Araci, A. F. Runge, W. J. Doherty and S. S. Saavedra, J. Am.Chem. Soc., 2008, 130, 1572–1573.
7 J. T. Bradshaw, S. B. Mendes, N. R. Armstrong and S. S. Saavedra,Anal. Chem., 2003, 75, 1080–1088.
8 W. J. Doherty, C. L. Donley, N. R. Armstrong and S. S. Saavedra,Appl. Spectrosc., 2002, 56, 920.
9 D. R. Dunphy, S. B. Mendes, S. S. Saavedra and N. R. Armstrong, inInterfacial Electrochemistry: Theory, Experiment and Applications, ed.A. Wieckowski, Marcel Dekker, Inc., New York, 1999, pp. 513–525.
10 D. R. Dunphy, S. B. Mendes, S. S. Saavedra and N. R. Armstrong,Anal. Chem., 1997, 69, 3086–3094.
11 K. Itoh and A. Fujishima, J. Phys. Chem., 1988, 92, 7043–7045.12 J. Stotter, J. Zak, Z. Behier, Y. Show and G. M. Swain, Anal. Chem.,
2002, 74, 5924–5930.13 A. F. Runge, S. B. Mendes and S. S. Saavedra, J. Phys. Chem. B,
2006, 110, 6732–6739.14 A. F. Runge, N. C. Rasmussen, S. S. Saavedra and S. B. Mendes,
J. Phys. Chem. B, 2005, 109, 424–431.15 A. B. Ellis and D. R. Walt, Chem. Rev., 2000, 100, 2477–2478.16 T. W. McBee, L.-Y. Wang, C. Ge, B. M. Beam, A. L. Moore,
D. Gust, T. A. Moore, N. R. Armstrong and S. S. Saavedra, J. Am.Chem. Soc., 2006, 128, 2184–2185.
17 W. N. Hansen, T. Kuwana and R. A. Osteryoung, Anal. Chem., 1966,38, 1810–1821.
18 N. Winograd and T. Kuwana, J. Electroanal. Chem., 1969, 23, 333–342.
19 N. Winograd and T. Kuwana, J. Am. Chem. Soc., 1971, 93, 4343–4350.
20 K. Itoh and A. Fujishima, in Electrochemistry in Transition, ed. O. J.Murphy, S. Srinivasan and B. E. Conway, Plenum Press, New York,1992, pp. 219–225.
21 S. E. Ross, C. J. Seliskar andW. R. Heineman,Anal. Chem., 2000, 72,5549–5555.
22 C. Piraud, E. Mwarania, G. Wylangowski, J. Wilkinson, K. O’Dwyerand D. J. Schiffrin, Anal. Chem., 1992, 64, 651–655.
23 S. B. Mendes, L. Li, J. J. Burke, J. E. Lee, D. R. Dunphy andS. S. Saavedra, Langmuir, 1996, 12, 3374–3376.
24 M. L. Stegemiller, W. R. Heineman, C. J. Seliskar, T. H. Ridgway,S. A. Bryan, T. Hubler and R. L. Sell, Environ. Sci. Technol., 2003,37, 123–130.
25 D. J. Monk, T. H. Ridgway, W. R. Heineman and C. J. Seliskar,Electroanalysis, 2002, 15, 1198–1203.
26 A. Leung, P. M. Shankar and R. Mutharasan, Sens. Actuators, B,2007, 125, 688–703.
27 C. McDonagh, C. S. Burke and B. D. MacCraith, Chem. Rev., 2008,108, 400–422.
28 D. A. VanDyke and H.-Y. Cheng, Anal. Chem., 1988, 60, 1256–1260.29 M. J. Shaw and W. E. Geiger, Organometallics, 1996, 15, 13–15.30 S. D. Schwab, R. L. McCreery and F. T. Gamble, Anal. Chem., 1986,
58, 2486–2492.31 B. M. Beam, R. C. Shallcross, J. Jang, N. R. Armstrong and
S. B. Mendes, Appl. Spectrosc., 2007, 61, 585–592.32 S.-M. Tseng and C.-L. Chen, Appl. Opt., 1992, 31, 3438–3447.33 J. E. A. M. van den Meerakker, P. C. Baarslag and M. Scholten,
J. Electrochem. Soc., 1995, 142, 2321–2325.34 R. Swanepoel, J. Phys. E, 1983, 16, 1214–1222.35 J. C. Manifacier, J. Gasiot and J. P. Fillard, J. Phys. E, 1976, 9, 1002–
1004.
This journal is ª The Royal Society of Chemistry 2009

36 W. J. Doherty, R. J. Wysocki, N. R. Armstrong and S. S. Saavedra,Macromolecules, 2006, 39, 4418–4424.
37 W. J. Doherty III, R. J. Wysocki, N. R. Armstrong andS. S. Saavedra, J. Phys. Chem. B, 2006, 110, 4900–4907.
38 K. Bergmann and C. T. O’Konski, Nature, 1963, 67, 2169–2177.39 G. Hahner, A. Marti and N. D. Spencer, J. Phys. Chem., 1996, 104,
7749–7757.
This journal is ª The Royal Society of Chemistry 2009
40 X. Chen and O. Inganas, J. Phys. Chem., 1996, 100, 15202–15206.41 E. E. Bancroft, H. N. Blount and F. M. Hawkridge, Biochem.
Biophys. Res. Commun., 1981, 101, 1331–1336.42 P. E. Smolenyak, R. A. Peterson, D. R. Dunphy, S. B. Mendes,
K. W. Nebesny, D. F. O’Brian, S. S. Saavedra andN. R. Armstrong, J. Porphyrins Phthalocyanines, 1999, 3, 620–633.
43 B. M. Beam, Ph.D. Dissertation, University of Arizona, 2008.
Analyst, 2009, 134, 454–459 | 459
Copyright © 2022 FDOKUMEN