Analysis of Plasmonics Based Fiber Optic Sensing Structures
159
Analysis of Plasmonics Based Fiber Optic Sensing Structures Hamed Moayyed Thesis Submitted to Faculdade de Ciências da Universidade do Porto in partial fulfillment of the requirements for the degree of Ph. D. in Physics 2016
-
Upload
khangminh22 -
Category
Documents
-
view
0 -
download
0
Transcript of Analysis of Plasmonics Based Fiber Optic Sensing Structures

Analysis of Plasmonics Based Fiber Optic Sensing Structures
Hamed Moayyed
Thesis Submitted to Faculdade de Ciências da Universidade do Porto in partial fulfillment of the requirements for the degree of Ph. D. in Physics
2016

Analysis of Plasmonics Based Fiber Optic Sensing Structures
Hamed Moayyed
Physics
Departmento de Física e Astronomia
Supervisor José Luís Campos de Oliveira Santos, Full Professor Faculdade de Ciências da Universidade do Porto
Co-supervisor Diana Catarino das Neves Viegas, Research Fellow International Iberian Nanotechnology Laboratory


“Nothing in life is to be feared, it is only to be understood.
Now is the time to understand more, so that we may fear less.”
Marie Curie


- ix -
Acknowledgements
Firstly, I would like to express my sincere gratitude to my advisor Prof. José Luís Santos for the
continuous support of my Ph.D study and related research, for his patience, motivation, and
immense knowledge. His guidance helped me in all the time of research and writing of this thesis.
His words can always inspire me and bring me to a higher level of thinking. What I learn from him
is not just how to do the studies to meet the graduation requirements, but how to view this world
from a new perspective.
I especially want to thank Prof. Faramarz Farahi for introducing me to my advisor, and providing
me this special opportunity to pursue my academic goals.
My co-advisor, Dr. Diana Viegas, has been always willing to listen to me and give me advices. I am
deeply grateful to her for her supports that helped me sort out the technical details of my work. A
special thanks to other members of our research team Dr. Luis Coelho and Ivo Leite, for their many
valuable discussions, constant caring and support.
To all my colleagues and friends from UOSE, namely, Luísa Mendonça, Dr. Pedro Jorge, Dr. Orlando
Frazão, Dr. Susana Silva, Dr. Marta Ferreira, Dr. Ivo Nascimento, Dr. Joel Carvalho, Dr. Paulo Caldas,
Rita Ribeiro, Dr. Carlos Gouveia and Hamid Hosseiny that somehow contributed for the great
experience and my profound joy that it is working in this group.
To INESC TEC for providing the facilities without which my research work would not be possible.
A word of recognition to Dr. Paulo Marques and Dr. Ireneu Dias for their support whenever it was
needed.
Heartfelt thanks goes to my family for their unconditional support; to my parents, without whom
I would not have gotten here, to my lovely wife Parisa for her endless patience, encouragement
and constant support, and to my beloved daughter Hana, who her beautiful smile has been a
source of strength and inspiration.

- x -
- xi -
Sumário
Plasmónica é hoje em dia uma palavra da moda no domínio da Ciência e na Tecnologia tantas vezes
é ela pronunciada e escrita. Frequentemente uma situação deste tipo não tem justificação
objectiva, mas tal não é o caso. O volume de ciência e de tecnologia de qualidade que resulta da
investigação e desenvolvimento em Plasmónica é enorme e cresce a ritmo acelerado. Na realidade
esta realidade não é de todo surpreendente caso se compreenda o que efectivamente significa a
plasmónica, a interacção coerente em ambiente controlado de um electrão e de um fotão,
constituindo-se uma nova entidade designada de plasmon, sendo esta não mais um fotão ou um
electrão, mas sim uma entidade hibrida que evidencia características de ambos. É esta mistura
que possibilita, por exemplo, conseguir-se imagem óptica com resolução bem superior à
determinada pelo convencional limite de difracção, isto porque neste caso o que domina é a
propriedade do electrão de evidenciar um comportamento ondulatório determinado pelo seu
comprimento de onda de DeBroglie, o qual é ordens de grandeza inferior ao comprimento de onda
associado ao fotão. É certo que a área da Plasmónica não é nova, antes pelo contrário já que existe
há mais de 100 anos, mas de facto foi só recentemente que o desenvolvimento da Nanociência e
da Nanotecnologia possibilitou a construção de condições que permitem a geração de plasmões
em ambiente controlado. Foi este progresso que originou o enorme desenvolvimento da
Plasmónica nas componentes de estudos fundamentais e de desenvolvimentos tecnológicos,
sendo reconhecido que se está apenas no início.
Na perspectiva histórica, uma das primeiras aplicações da Plasmónica foi na sensorização óptica,
primeiro com suporte em plataformas construídas pela assemblagem de componentes ópticos
discretos, mais tarde tirando partido da fibra óptica, um progresso que se poderá qualificar de
elevado alcance e que originou o aparecimento de uma nova área no domínio da sensorização
óptica, de modo sucinto identificada de sensores SPR em fibra óptica. O programa de investigação
que deu origem a esta tese situa-se nesta área, mais precisamente na análise teórica e
computacional de estruturas várias em fibra óptica que incorporam ressonância plasmónica
orientada para se conseguir uma determinada funcionalidade de sensorização. Essas estruturas
diferenciam-se pelo tipo de metal ou camada hibrida que se considera para suporte da
ressonância plasmónica, ou então pela geometria adoptada para a fibra óptica. Os resultados que
se obtêm a partir desse estudo e que se apresentam nesta tese têm valor pela compreensão que
possibilitam dos princípios físicos envolvidos, assim como no que respeita à identificação das suas
características de sensorização, mas também porque permitem orientar a fabricação dessas
estruturas, muito em particular quando esta necessita de ser sintonizada no sentido de satisfazer
especificações que decorrem da aplicação a que se destinam.

- xii -
Esta tese está organizada em sete capítulos. No Capítulo 1 começa-se por localizar historicamente
a investigação do fenómeno da ressonância plasmónica no domínio óptico e de como pode ser
utilizado para se conseguir funcionalidades de sensorização, primeiro em plataformas
construídas pela assemblagem de componentes ópticos discretos, mais tarde pela utilização da
fibra óptica. De seguida, avança-se para a contextualização desta abordagem de sensorização no
âmbito da actual e dinâmica actividade de I&D em Plasmónica. No Capítulo 2 são apresentados os
conceitos centrais que permitem a compreensão do fenómeno da ressonância plasmónica, assim
como a identificação das condições que possibilitam a sua existência em guias de onda planos. É
também analisada a propagação do campo electromagnético em estruturas multicamada. No
Capítulo 3 apresenta-se a revisão das várias técnicas que têm sido utilizadas na interrogação de
sensores baseados em plasmónica, sendo analisado o nível de desempenho passível de ser
conseguido quando se considera as abordagens de interrogação que têm sido descritas na
literatura, nomeadamente interrogação angular, no domínio espectral, em intensidade e em fase.
O Capítulo 4 desenvolve o estudo de sensores SPR em fibra óptica em configurações que integram
uma camada metálica única ou uma camada mista (metal + óxido) na perspectiva da interrogação
em fase. Os metais considerados são a prata, o ouro, o cobre e o alumínio no contexto da utilização
da fibra óptica com a geometria habitual, em taper e quando se considera a configuração em
optrodo. No Capítulo 5 expõe-se um estudo sobre as características de sensores em fibra óptica
baseados em plasmónica nos quais se considera uma camada interna de metal (prata) coberta por
uma outra com propriedades dieléctricas (óxido). Pretende-se com esta abordagem deslocar o
comprimento de onda de ressonância plasmónica para a região espectral utilizada pelos sistemas
de comunicação por fibra óptica, significando com isto a possibilidade de incorporar nos
elementos sensores componentes e dispositivos de elevado desempenho e relativamente baixo
custo como consequência da sua utilização massiva nos sistemas de comunicação óptica.
Diferentes óxidos serão considerados para a camada externa, como o dióxido de titânio, o dióxido
de silício e o óxido de alumínio, pretendendo-se com este estudo aferir como melhorar a
sensibilidade destas estruturas de sensorização a variações do índice de refracção do meio
envolvente. O Capítulo 6 trata o problema da integração de redes em fibra óptica (redes de Bragg
e redes de período longo) com estruturas convencionais de sensorização em fibra utilizando
ressonância plasmónica, sendo o objectivo tornar estas estruturas compatíveis com o domínio da
tecnologia da fibra monomodo onde se situam os sistemas de comunicação por fibra óptica,
resultando daí as vantagens acima já identificadas. Em particular, procurar-se-á estudar uma
configuração de sensorização de elevado potencial, nomeadamente a que resulta do acoplamento
de redes de período longo às estruturas convencionais de sensorização SPR em fibra. Finalmente,
no Capítulo 7 apresentam-se notas finais relativas ao trabalho desenvolvido e projectam-se
caminhos para investigação futura.

- xiii -
Abstract
Plasmonics is nowadays a fancy word in the world of Science and Technology so many times it is
pronounced or so often it is written. It frequently happens such a situation represents a
momentary fashion, but it will be fair to emphasize this is not the case. The amount of good science
and technology that derives from R&D in Plasmonics is huge and is growing at an accelerated pace.
As a matter of fact, such reality is not at all surprising if one understands what plasmonics means,
a coherent interaction of an electron and a photon in a controlled environment generating a new
entity, named plasmon, which is no more a photon or an electron, but a hybrid entity which shows
flavours of both. It is this mix of flavours that enables, for example, optical imaging well below the
standard diffraction limit because, in such case, dominates the electron flavour which has a wave
behaviour determined by its DeBroglie wavelength with a value orders of magnitude smaller than
the optical wavelength. It is true the field of Plasmonics is not new, is over 100 years old, but it
was only recently that the Nanoscience and the Nanotechnology developed to a point that enabled
to build up environments where plasmons could be generated in controlled conditions. It was
such possibility that induced the burst of activity in Plasmonics, both at a fundamental level and
at technological developments, being well present the perception this is just the beginning.
Historically, one of the first applications of Plasmonics was optical sensing, first supported in bulk
platforms and latter in optical fibers, a development that was truly a breakthrough, introducing a
new branch in the field of optical fiber sensing shortly identified as SPR optical fiber sensors. The
research programme that originated this thesis is anchored in this optical sensing approach,
mostly focused on the theoretical and computational analysis of several fiber optic structures
incorporating plasmonic resonance behaviour and oriented to the sensing functionality. Such
structures differentiate on the type of metal or hybrid layer considered to support plasmonic
resonance, or on the geometry of the optical fiber. Their research and the results obtained
reported in this thesis are relevant by itself in what concerns the understanding of the basic
working principles and identification of their sensing characteristics, but also to guide the
implementation of these sensing devices particularly when they need to be tailored to fit the
demands of a specific application.
The thesis is organized in seven chapters. Chapter 1 starts by locating historically the research on
the phenomenon of plasmonic resonance in the optical domain and how it can be applied to
achieve sensing functionalities, first in bulk optics platforms and later associated with the
utilization of optical fibers. Then, it proceeds to contextualize this sensing approach within the
actual and rather active field of R&D in Plasmonics. Chapter 2 delivers the basic concepts that
permit the understanding of the phenomenon of plasmonic resonance and the conditions for its
existence on dielectric-metal-dielectric slabs. The propagation of an electromagnetic field in a
- xiv -
multilayer structure will also be discussed. Chapter 3 presents a worked review of the different
techniques to interrogate plasmonic based sensors, addressing in particular the performance
level that can be achieved with each of the interrogation approaches analysed, namely angular
interrogation, spectral interrogation, intensity interrogation and phase interrogation. Chapter 4
develops the study of SPR based optical fiber sensing configurations integrating a single metal or
a bimetallic layer and, with the focus on phase interrogation, it is analysed the performance
associated with the utilization of different metals, namely silver, gold, copper, and aluminium
when the tapered and the tip (optrode) optical fibers geometric layouts are addressed. Chapter 5
presents a theoretical investigation of optical fiber plasmonic based sensors incorporating an
internal metallic layer of silver covered with an oxide layer. The objective is to shift the resonance
condition to longer wavelengths, therefore more suited to benefit from a broad range of optical
fiber technologies developed along the years within the context of optical fiber communications
systems. Different oxide materials like titanium dioxide, silicon dioxide and aluminium oxide are
considered aiming to achieve enhanced sensitivity to refractive index variations of the external
medium, particularly when addressing phase interrogation. Chapter 6 deals with the integration
of fiber gratings with standard fiber optic SPR sensing technology to bring it to the singlemode
domain, therefore turning it compatible with the vast field of fiber optic communication systems
with its large portfolio of advanced and cost effective components and devices. In particular,
emphasis is allocated on the theoretical analysis of long period grating (LPG) assisted optical fiber
sensing structures supported by Plasmonics. Finally, Chapter 7 presents some final notes relative
to the research performed and are outlined some paths for future work.

- xv -
Table of Contents
Acknowledgements ........................................................................................................................................ ix
Sumário .............................................................................................................................................................. xi
Abstract ........................................................................................................................................................... xiii
Table of Contents ........................................................................................................................................... xv
List of Figures .............................................................................................................................................. xxiv
List of Tables ................................................................................................................................................ xxiv
Historical Overview of Plasmonics ............................................................................................................ 1
1.1 First Descriptions .................................................................................................................................................. 2
1.2 SPR Optical Sensing .............................................................................................................................................. 3
1.2.1 Environmental Applications .......................................................................................................................... 4
1.2.2 Space Applications ............................................................................................................................................. 5
1.3 The Outcome of Optic Based SPR Sensing ................................................................................................... 5
1.4 The New World of Plasmonics ......................................................................................................................... 6
1.4.1 SPR Sensing and Microstructured Optical Fibers ................................................................................. 7
1.4.2 Multiplexing of SPR Sensors ....................................................................................................................... 11
1.4.3 Sensor Functionalization ............................................................................................................................. 11
1.4.4 Nanostructured Plasmonic Sensors ........................................................................................................ 12
1.5 Final Remarks ...................................................................................................................................................... 14
Theoretical Background of Plasmonics ................................................................................................ 15
2.1 Electromagnetic Theory of Surface Plasmons ........................................................................................ 16
2.2 Surface Plasmons on Metal-Dielectric Interface .................................................................................... 20
2.3 Surface Plasmons on Dielectric-Metal-Dielectric .................................................................................. 22
2.4 Excitation of Surface Plasmons ..................................................................................................................... 24
2.4.1 Kretschmann and Otto configurations ................................................................................................... 24
2.4.2 Grating Coupling .............................................................................................................................................. 27
2.4.3 Waveguide Coupling ...................................................................................................................................... 28

- xvi -
2.5 Theoretical Study of Optical Fiber based Surface Plasmon Resonance Sensors ...................... 29
2.5.1 Reflection Coefficient ..................................................................................................................................... 29
2.5.2 Transmitted Power ........................................................................................................................................ 31
2.5.3 Sensitivity and Quality parameter ........................................................................................................... 32
2.6 Optical Sensing based in Optical Fibers Coupled to SPR Phenomenum ...................................... 32
Interrogation of Plasmonics Sensing Structures ............................................................................... 34
3.1 Introduction .......................................................................................................................................................... 35
3.2 Angular Interrogation ....................................................................................................................................... 36
3.2.1 General Considerations and Historical Background......................................................................... 36
3.2.2 Principle of the Technique .......................................................................................................................... 38
3.2.3 Performance of the Technique .................................................................................................................. 39
3.3 Wavelength Interrogation ............................................................................................................................... 40
3.3.1 General Considerations and Historical Background......................................................................... 40
3.3.2 Principle of the Technique .......................................................................................................................... 43
3.3.3 Performance of the Technique .................................................................................................................. 44
3.4 Intensity Interrogation ..................................................................................................................................... 45
3.4.1 General Considerations and Historical Background......................................................................... 45
3.4.2 Principle of the Technique .......................................................................................................................... 47
3.4.3 Performance of the Technique .................................................................................................................. 48
3.5 Phase Interrogation ........................................................................................................................................... 48
3.5.1 General Considerations and Historical Background......................................................................... 48
3.5.2 Principle of the Technique .......................................................................................................................... 51
3.5.3 Performance of the Technique .................................................................................................................. 52
3.6 Conclusion ............................................................................................................................................................. 53
Optical Fiber SPR Sensing Structures with Single and Bimetal Layers ..................................... 55
4.1 Introduction .......................................................................................................................................................... 56
4.2 General Considerations .................................................................................................................................... 56
4.3 Optical Fiber SPR Sensor with a Single Metal Layer ............................................................................ 57
4.4 Optical Fiber SPR Sensor with Bimetal Layers ....................................................................................... 61
- xvii -
4.5 Optical Fiber SPR Sensor with Bimetal Layers in a Tapered Transmissive Geometry .......... 64
4.5.1 Modelling of the Tapered Sensing Structure ....................................................................................... 65
4.5.2 Optical Transmission of the Sensing Structure .................................................................................. 67
4.5.3 Performance of the Sensing Structure with Phase Interrogation ............................................... 68
4.6 Optical Fiber SPR Sensor with Bimetal Layers in a Tip (Optrode) ................................................. 72
4.6.1 Modelling the Optrode Sensing Structure ............................................................................................. 73
4.6.2 Performance of the Sensing Structure with Phase Interrogation ............................................... 77
4.7 Conclusion ............................................................................................................................................................. 78
Optical Fiber SPR Sensing Structures with Hybrid Layers ............................................................. 80
5.1 Introduction .......................................................................................................................................................... 81
5.2 General Considerations .................................................................................................................................... 82
5.3 Optical Fiber SPR Sensors with Metallic and Oxide Layers ............................................................... 84
5.4 Optical Fiber SPR Sensor with Metallic and Oxide Layers in a Tapered Transmissive
Topology ........................................................................................................................................................................ 90
5.5 Optical Fiber SPR Sensor with Metallic and Oxide Layers in a Tip (Optrode)
Geometry…………………………………………………………………………………………………………………………93
5.6 Conclusion ............................................................................................................................................................. 98
Grating Assisted Optical Fiber Sensing Structures Supported by Plasmonics ...................... 100
6.1 Introduction ........................................................................................................................................................101
6.2 Fiber Gratings .....................................................................................................................................................102
6.2.1 Fiber Bragg Gratings ....................................................................................................................................103
6.2.2 Long-Period Fiber Gratings .......................................................................................................................104
6.3 FBG Assisted SPR Based Optical Fiber Sensors ....................................................................................109
6.4 LPG Assisted SPR Based Optical Fiber Sensors ..................................................................................113
6.5 Paths for Experimental Research .............................................................................................................117
6.5.1 A General Technique for Phase Interrogation of SPR Fiber Sensors .......................................118
6.5.2 High Performance Phase Interrogation of LPG Assisted SPR Fiber Sensors ........................119
6.6 Conclusion .........................................................................................................................................................120
Conclusions and Future Work ................................................................................................................ 122

- xviii -
Annex ............................................................................................................................................................... 127
References .................................................................................................................................................. 1277

- xxiv -
List of Figures
1.1 First publication on the plasmonics [1]…………………………………………………………………………….. 1
1.2 First publication on theoretical studies of plasmonics [2]………………………………………………….. 2
1.3 Concept of the LMC: the evanescent field of the propagating light wave excites the
fluorescent labels (green blocks) bound to the immobilized groups (red forks) on the chip
surface [53]……………………………………………………………………………………………………………………..
5
1.4 First publication on SPR fiber optic sensors [55]………………………………………………………………. 5
1.5 Schematic of the three-hole microstructured optical fiber [64]………………………………………….. 9
2.1 Section of a planar waveguide with a step refractive index profile…………........................................ 17
2.2 A metal–dielectric waveguide………………………………………………………………...................................... 21
2.3 Thin metal layer sandwiched between two dielectrics………………………………………………………. 23
2.4 Different SPR configurations (a) prism coupling (Kretschmann configuration). (b) Grating
coupling. (c) Waveguide coupling……………………………………………………………………………………...
24
2.5 (a) Reflection of light at the metal surface (εm (ω)). The medium above the metal is a
dielectric Material (εd) as a glass or silica; below the metal is the analyte that can be air,
vacuum or an aqueous medium (εa). (b) Dispersion diagram of the attenuated total reflection
method (SP0: Dispersion of surface plasmon at metal/air interface)…………………………………...
25
2.6 (a) Otto configuration. The analyte (dielectric or air) lies between the prism and the metal
surface. (b) Kretschmann-Raether configuration. The metal film is in contact with the
prism…………………………………………………………………………………………………………………………........
26
2.7 (a) The grating coupler used to excite surface plasmons. (b) Wave vector diagram of the
input coupler. k0 is the wave vector of the incident light (kSP is the wave vector of the surface
plasmons and G = 2π/Λ, where Λ is the grating period………………………………………………………..
27
2.8 Side view of an integrated waveguide device with SPR excitation………………………………………. 28
2.9 Equivalent planar model of an optical fiber based plasmonic structure……………………………… 29
2.10 Electric and magnetic field vectors of p-wave at the inner surface of the multilayered
system……………………………………………………………………………………………………………………………..
30
3.1 The configuration of SPR sensor based on angular modulation [107]……………………………….... 37
3.2 (a) Schematic diagram of the wedge-shaped beam type angular interrogation-based SPR
sensor. (b) SPR spectra obtained from the various thicknesses of Au films on the glass
substrates as a function of the incidence angle [112]…………………………………………………………
38
3.3 A typical SPR curve in angular interrogation. At certain angles and wavelengths, the energy
associated with the incident radiation will couple with the SPW. The loss of this energy is
observed as a dip in the reflectivity…………………………………………………………………………………..
38
3.4 SPR curves for different refractive indices of the sensing medium in the cases of angular
interrogation…………………………………………………………………………………………………………………..
40
3.5 Dual-channel surface plasmon resonance sensor based on wavelength interrogation
[114]………………………………………………………………………………………………………………………………..
41
3.6 Illustration of the SPR fiber optic sensing element reported by Jorgenson et al. [118]…………… 42
3.7 A typical SPR curve in wavelength interrogation. At certain wavelength and angle, the energy
associated with the incident radiation will couple with the SPW which is observed as a dip
in the reflectivity……………………............................................................................................................................
43
- xxv -
3.8 SPR curves for different refractive indices of the sensing medium in the cases of wavelength
interrogation……………………………………………………………………………………………………………………
44
3.9 A typical SPR scanning instrument with intensity interrogation [125]………………………………… 45
3.10 Configuration of a SPR sensing system with polarization contrast and intensity interrogation
[136]………………………………………………………………………………………………………………………………..
47
3.11 Intensity interrogation of SPR sensors (the three curves are corresponding to three different
refractive indices of surrounding the dielectric…………………………………………………………………..
47
3.12 Scheme of SPR sensor based on interferometry. (1) light beam; (2, 4) polarisers; (3, 10)
beam-splitting cubes; (5) phase-retarding glass plate; (6) mirror; (7) SPR prism; (8) gold
film; (9) patterned coating; (11) analyser; (12) imaging lenses; (14) CCD camera [139]………..
49
3.13 Scheme of SPR sensor based on a Mach-Zehnder interferometer [144]………………………………... 50
3.14 Typical angular SPR curve (left) and the phase difference between the p- and s-components
of the reflected light (right)……………………………………………………………………………………………….
52
4.1 Schematic diagram of an SPR sensor based on optical fibre…………………………………………………. 58
4.2 Spectrum of the normalized transmitted optical power for the (a) Au, (b) Ag, (c) Cu, (d) Al
metals sensing structure…………………………………………………………………………………………………..
59
4.3 Variation of resonance wavelength of the SPR sensor with refractive index of the external
medium for each of the metals that overlay the optical fiber……………………………………………….
59
4.4 Schematic diagram of an SPR sensor based on an optical fibre with bimetallic layer 61
4.5 Spectral resonance of the SPR optical fiber based sensing structure incorporating a
bimetallic layer derived from the , combination of metals with (a) Al and (b) Au as outer
metal layer (the refractive index of the surrounding medium is ns=1.343)………………………….
62
4.6 Variation of (a) sensitivity, (b) Γλ with the ratio “inner layer thickness/total bimetallic
thickness” for different bimetallic combinations. These parameters were obtained from the
response of the SPR resonance to a variation of the external medium refractive index from
1.343 to 1.353 (δns=0.010). ………………………………………………………………………………………………
63
4.7 Tapered optical fiber surface plasmon resonance sensor………………………......................................... 65
4.8 Spectrum of the normalized transmitted optical power for a Ag-Au bimetallic sensing
structure (d1 = 45 nm – thickness of Ag layer and d2 = 25 nm – thickness of Au layer) and
different taper ratio when the surrounding medium having a refractive index of 1.333…………
68
4.9 Phase difference (between p and s polarizations) and phase sensitivity as function of the
refractive index of the surrounding medium, for a single metal layer sensing structure
comprised of 50, 60 and 70 nm thick (a) gold layer and (b) silver layer. The interrogation
wavelength is 632.8 nm…………………………………………………………………………………………………….
69
4.10 Phase difference (between p and s polarizations) and phase sensitivity as function of the
refractive index of the surrounding medium for different bimetallic sensing head
combinations……………………………………………………………………………………………………………….......
70
4.11 (a) Phase difference (between p and s polarizations) as function of the refractive index of
the surrounding medium and (b) associated phase sensitivity, for Ag-Au bimetallic
structures (d1 = 40 nm and d2 = 10 nm) having different taper ratios. The interrogation
wavelength considered is 632.8 nm, and the dashed vertical line at ns = 1.330 indicates the
point having maximum phase sensitivity……………………………………………………………………………
71
- xxvi -
4.12 Spectrum of the normalized transmitted optical power for the Ag-Au bimetallic sensing
structure (d1 = 40 nm and d2 = 10 nm) with taper ratio = 2.0 and surrounding medium having
a refractive index of 1.333. The dashed vertical line at 632.8 nm indicates the interrogation
wavelength corresponding to maximum phase sensitivity………………………………………………….
72
4.13 Schematic illustration of the SPR fiber optrode under analysis. The top and bottom of the
probe are polished to the same angle. The cladding of the optical fiber tip has been removed
in the sensing region and replaced by a bimetallic film………………………………………………………...
73
4.14 Schematic of a length dL of the taper region around the coordinate z where the radius of the
taper is ρ(z)……………………………………………………………………………………………………………………...
75
4.15 Variation of (a) phase difference (between s and p polarizations) and (b) phase sensitivity
as function of the refractive index of the surrounding medium for different radii of the tip
end. The sensing structure comprised of a 40 nm silver + 10 nm gold layer and tip length of
1 cm. The interrogation wavelength is 632.8 nm…………………………………………………………………
77
4.16 Variation of (a) Phase difference (between s and p polarizations) and (b) phase sensitivity
as function of the refractive index of the surrounding medium for different tip length. The
sensing structure comprised of a 40 nm silver + 10 nm gold layer and the tip end radius is
150 µm. The considered interrogation wavelength is 632.8 nm…………………………………………...
78
5.1 Schematic illustration of the SPR sensing head under analysis. The cladding of the optical
fiber has been removed in the sensing region and replaced by a metallic film covered with
an oxide overlayer…………………………………………………………………………………………………………….
84
5.2 Resonance of a fiber optic SPR structure with a single silver layer for several thicknesses
(refractive index of the external medium: 1.33)………………………………………………………………….
84
5.3 Spectral behaviour of the double layer fiber optic SPR structure for different thicknesses of
the oxide layer (TiO2, SiO2 and Al2O3 oxide materials are associated with (a), (b) and (c),
respectively; refractive index of the external medium: 1.33…………………………………………………
85
5.4 Evolution of the spectral width of the SPR resonance (full width at the power level 6 dB
above the minimum) as function of the thickness of the oxide layer. The refractive index of
the external medium is assumed to be 1.33………………………………………………………………………...
86
5.5 Normalized transmittance and phase difference (between p and s polarizations) as function
of the refractive index of the surrounding medium for an inner silver layer of 50 nm
combined with a TiO2 layer of 15 nm (solid curves) and a Al2O3 layer of 30 nm (dashed
curves). The interrogation wavelength is 830 nm………………………………………………………………
87
5.6 Normalized transmittance and phase difference (between p and s polarizations) as function
of the refractive index of the surrounding medium for an inner silver layer of 50 nm
combined with a TiO2 layer of 40 nm (solid curves) and a TiO2 layer of 55 nm (dashed
curves), associated to interrogation wavelengths of 1300 nm and 1550 nm, respectively……
87
5.7 Phase sensitivity versus normalized transmittance for a fiber optic SPR structure with an
inner silver layer of 50 nm combined with a TiO2 layer of 40 nm (interrogation wavelength
of 1300 nm)……………………………………………………………………………………………………………………...
88
5.8 Thickness of the oxide layer required to operate with maximum sensitivity to changes of the
refractive index of water, determined by the intersection of the horizontal line (that defines
in the y-axis the water refractive index at the wavelength of operation) with the curves
associated with different materials for the oxide layer. The interrogation wavelength is 630
nm (a) and 830 nm (b)………………………………………………………………………………………………………
89
- xxvii -
5.9 Same as Fig. 5.8 but now with interrogation wavelengths of (a) 1300 nm and (b) 550 nm…… 90
5.10 Schematic illustration of the SPR fiber taper geometry under analysis………………………………… 91
5.11 Resonance of a fiber optic SPR structure with a single silver layer for several thicknesses
(refractive index of the external medium: 1.33)………..................................................................................
92
5.12 Phase difference between the s and p light polarizations and associated phase sensitivity
versus the refractive index of the surrounding medium for a single silver layer with 80 nm
thickness and when this layer is covered by 20 nm of an oxide layer of TiO2, Al2O3, and SiO2.
The interrogation wavelength is (a) 632.8 nm and (b) 1550 nm…………………………………………..
92
5.13 Spectral behavior of the double layer fiber optic SPR structure with a single silver layer and
20 nm of oxide layers (TiO2, Al2O3, and SiO2) when the refractive index of the external
medium is 1.33…………………………………………………………………………………………………………………
93
5.14 Schematic illustration of the SPR fiber optrode under analysis. The top and bottom of the
probe are polished to the same angle. The cladding of the optical fiber tip has been removed
in the sensing region and replaced by a metallic film covered with an oxide
overlayer………………………………………………………………………………………………………………………....
94
5.15 Spectra of the normalized returned optical power for a fiber optic SPR structure with a single
silver layer for several thicknesses (refractive index of the external medium: 1.33……………….
94
5.16 Spectral behavior of the double layer fiber optic SPR structure for different thicknesses of
the oxide layer (TiO2, SiO2 and Al2O3 oxide materials are associated with (a), (b) and (c),
respectively; refractive index of the external medium: 1.33…………………………………………………
95
5.17 Evolution of the spectral width of the SPR resonance (full width at the power level 6 dB
above the minimum) as function of the thickness of the oxide layer. The refractive index of
the external medium is considered to be 1.33……………………………………………………………………..
95
5.18 Normalized transmittance and phase difference (between p and s polarizations) as function
of the refractive index of the surrounding medium for an inner silver layer of 80 nm
combined with a TiO2 layer of 15 nm (solid curves) and a Al2O3 layer of 30 nm (dashed
curves). These thicknesses were considered to allow operation wavelength around 830 nm...
97
5.19 Normalized transmittance and phase difference (between p and s polarizations) as function
of the refractive index of the surrounding medium for an inner silver layer of 80 nm
combined with a TiO2 layer of 40 nm (solid curves) and a TiO2 layer of 55 nm (dashed
curves), associated with interrogation wavelengths of 1300 nm and 1550 nm, respectively….
97
5.20 Phase sensitivity versus normalized transmittance for a fiber optic SPR structure with an
inner silver layer of 80 nm combined with a TiO2 layer of 40 nm (interrogation wavelength
of 1300 nm)……………………………………………………………………………………………………………………...
98
6.1 The diffraction of a light wave by a grating…………………………………………………………………………. 102
6.2 The diffraction of a light wave by a grating.Ray-optics illustration of core-mode Bragg
reflection by a fiber Bragg grating and the β axis diagram demonstrating the grating coupling
condition for m=-1 [199]…………………………………………………………………………………………………..
103
6.3 FBG working principle…………………………………………………………………………........................................ 104
6.4 Spectra of a typical FBG (data obtained at INESC TEC)………………………………………………………… 104
6.5 Ray-optics illustration of cladding-mode coupling by a long-period grating and the β axis
diagram demonstrating the grating coupling condition for m=-1 [199]………………………………
105
6.6 Coupling of the fundamental guided mode to cladding modes in a long-period grating…………. 105
6.7 Transmission spectrum of a typical LPG (data obtained at INESC TEC)………………………………… 106
- xxviii -
6.8 Theoretical determination of the relationship between grating periodicity and wavelength
where guided-to-cladding mode coupling takes place…………………………………………………………
107
6.9 Fiber interferometer based on a LPG and SPR modulation………………………………………………….. 109
6.10 Surface Plasmon resonance sensing structure with a fiber Bragg grating [234]……………………. 110
6.11 (a) Hollow core sensing structure with Bragg grating. (b) Cross section of the structure [61]... 111
6.12 Planar SPP sensor with (a) Bragg grating imprinted into the waveguide layer [236] and (b)
Bragg grating engraved on the top of the metal layer [237]………………………………………………….
111
6.13 Planar SPP sensor with (a) LPG imprinted into the waveguide layer and (b) LPG engraved
on the top of the metal layer………………………………………………………………………………………………
112
6.14 LPG induced coupling of the core mode to a cladding mode associated with the oscillation
angle θ……………………………………………………………………………………………………………………………..
114
6.15 Spectrum of the normalized transmitted optical power for the Ag-TiO2 sensing structure for
different grating periodicity (a) Λ = 300 μm and (b) Λ= 500 μm (when surrounding medium
having a refractive index of 1.333………………………………………………………………………………………
116
6.16 (a) Phase difference (between p and s polarizations) and (b) phase sensitivity as function of
the refractive index of the surrounding medium for different grating periodicities Λ = 300
μm and Λ = 500 μm. The interrogation wavelength is 1550 nm…………………………………………….
117
6.17 Optical fibre SPR interferometric sensing configuration with PHD signal processing………….. 119

- xxix -

- xxiv -
List of Tables
3.1 Performance of SPR interrogation techniques…………………………………………………………………………….. 54
4.1 Comparison of the refractive index sensitivity of an optical fiber based SPR sensor incorporating a
single metal layer when different metals are addressed………………………………………………………………..
60
4.2 Comparison of the values for the Γλ and Quality Parameter (χ) for the SPR sensing heads
incorporating thin films of gold, silver and copper………………………………………………………………………..
60

- xxv -
1
Historical Overview of Plasmonics
Summary: This Chapter starts to locate historically the research on the phenomenon of plasmonic
resonance in the optical domain and its support to achieve sensing functionalities, first in bulk optics
platforms and later associated with the utilization of optical fibers. This sensing approach is
contextualized within the actual and rather active field of R&D in Plasmonics which is continuously
opening new horizons in science and in technology.

Historical Overview of Plasmonics
- 2 -
1.1 First Descriptions
Plasmonics has been studied since the beginning of the 20th century, although the great
developments on SPR were achieved in the late 60s with bulk configurations. Surface plasmons
are electromagnetic excitations that propagate in wave like form along the planar interface
between a metal and a dielectric medium. The plasmon excitation produces a minimum in the
spectral transmittance for certain wavelength and refractive index values.
Between 1902 and 1912 R.M. Wood at John Hopkins University (Baltimore, USA) [1] (figure 1.1)
noticed that, when he shone polarized light on a metal backed diffraction grating, a pattern of
unusual dark and light bands appeared in the reflected light. Although he speculated about how
the light, gratings and metal interacted a clear answer to the phenomenon was not provided.
The first theoretical treatment of these anomalies is undergone by Lord Rayleigh in 1907 [2]
(figure 1.2). His "dynamical theory of the grating" was based on an expansion of the scattered
electromagnetic field in terms of outgoing waves only. With this assumption, he found that the
scattered field was singular at wavelengths for which one of the spectral orders emerged from the
grating at the grazing angle. He then observed that these wavelengths, which have come to be
called the Rayleigh wavelengths , λR correspond to the Wood anomalies [3]. Furthermore, these
singularities appeared only when the electric field was polarized perpendicular to the rulings, and
thus accounted for the S anomalies; for P polarization, his theory predicted a normal behavior
near λR.
Wood's later papers [4, 5] however, suggest that P anomalies could sometimes be observed.
Palmer [6, 7] very clearly demonstrated that P anomalies did exist in deeply ruled gratings. Thus,
anomalies of both the S and P type were obtainable, but P anomalies were found only on gratings
with deep grooves [3].
Figure 1.1 - First publication on the plasmonics [1].
Historical Overview of Plasmonics
- 3 -
In the fifties, more experimentation was done on electron energy losses in gasses and on thin foils
[8, 9]. The suggestion by Pines and Bohm [10-12] that the energy losses where due to the excitation
of conducting electrons creating plasma oscillation or plasmon was a great step forward. Further
research [9] revealed that the energy loss resulted from excitation of a surface plasma oscillation
in which part of the restoring electric field extended beyond the specimen boundary. Therefore,
the surface plasma oscillation could be affected by the presence of any film or contaminant on the
specimen surface. This effect was later described in terms of excitation of electromagnetic
'evanescent' waves at the surface of the metal, and in the 1970's evanescent waves where
described as a means to study ultra-thin metal films and coatings [13].
In the late sixties, optical excitation of surface plasmons by the method of attenuated total
reflection was demonstrated by Kretchman [14, 15] and Otto [16]. Since then, surface plasmons
have been intensively studied and their major properties have been assessed [17, 18].
1.2 SPR Optical Sensing
During the last two decades we have witnessed remarkable research and development activity
aimed at the realization of optical sensors for the measurement of chemical and biological
quantities. First, optical chemical sensors were based on the measurement of changes in
absorption spectrum and were developed for the measurement of CO� and O� concentration [19].
In the 1980s, surface plasmon resonance (SPR) and related techniques exploited evanescent
waves applied to the interrogation of thin films as well as biological and chemical interactions [20-
23]. In these sensors the target quantity is determined by measuring the refractive index,
absorbance and fluorescence properties of analyte molecules or a chemo-optical transducing
medium [24, 25]. The potential of surface plasmon resonance for characterization of thin films
Figure 1.2 - First publication on theoretical studies of plasmonics [2].

Historical Overview of Plasmonics
- 4 -
and monitoring processes at metal interfaces [26] was recognized in the late seventies. In 1982
the use of SPR for gas detection and biosensing was demonstrated by Nylander and Liedberg [23,
27, 28]. Since then SPR sensing has been receiving continuously growing attention from the
scientific community.
Within the last few years, the possibility of implementing the surface plasmon resonance sensing
principle into optical waveguide structures has attracted much attention. SPR sensors based on
optical waveguides offer various advantageous features for sensing. Indeed, they are small in size,
exhibit ruggedness, there is the prospect of fabrication of multiple and/or multichannel sensors
on a single optical chip and, in conjunction with optical fibers, they may, be used for remote
sensing applications.
Development of new SPR-sensing configurations as well as applications of SPR-sensing devices
for the measurement of physical, chemical and biological quantities have been widely described.
A great deal of work has been done in the exploitation of SPR for optical biosensing, as can be
assessed from the fact more than 75% of the research papers deal with applications of SPR to
detect biomolecular interactions. In this area, SPR, as a surface-oriented method, has shown a
great potential for affinity biosensors, allowing real-time analysis of biospecific interactions
without the use of labeled molecules. The SPR sensor technology has been commercialized by
several companies and has become a leading technology in the field of direct real-time observation
of the biomolecular interactions.
In the following a few recent applications of SPR sensors will be described, in particular their
employment in the detection of environmental pollutants and in space missions.
1.2.1 Environmental Applications
Surface Plasmon Resonance biosensors have been demonstrated for the detection of many
aqueous pollutants , as arsenic [29], ricin [30, 31], endocrine disruptors [32, 33], pesticides [34-
37], methane [38], heavy metals [39], bacteria and toxins [40-42], copper ions [43] and others.
Some of them have been tested in real lake water, surface water or groundwater samples.
Gaseous pollutants as NH3 [44], CO [45], NO2 [46], hydrogen [47, 48], SiO2 [49], ammonia and
amine gases [50], petroleum hydrocarbon vapors [51] are examples of additional compounds
whose detection has been addressed by SPR arrangements.
Optical sensors based on the SPR phenomenon has also been applied in the framework of other
medical and environmental applications, as food quality, safety analysis, detection of cancer,
allergy and heart attack markers, dioxins, phenols and aromatic hydrocarbons, as reported in [52].
Historical Overview of Plasmonics
- 5 -
SPR sensors are particularly suited for pollutant and explosive detection because they only
optically act on the surrounding ambient, therefore avoiding electric interaction. Moreover these
sensors are able to provide extremely high sensitivities.
1.2.2 Space Applications
SPR based sensors are also well suited for astrobiologial missions. An example of application of
these sensors on this environment is the The Life Marker Chip (LMC), where SPR sensing is
configured looking for the detection of organic or prebiotic molecules on the surface of planets or
moons. The design aim of the LMC is to detect 20-25 biomarker molecules on 20-50 samples
combining surface plasmon resonance and fluorescently labeled tracers. Specific Molecular
Identification of Life Experiment (SMILE) has been proposed as a possible LMC (figure 1.3).
Light with wavelength 635 nm is coupled into the LMC by fiber coupling. The light is then guided
by a Si3N4 (stoichiometric silicon nitride) waveguide (refractive index n=2.01) standing between
SiO2 (silicon oxide, n=1.47) top and bottom claddings. Locally, the top SiO2 cladding layer is
selectively removed. As shown in figure 1.3 in these regions the evanescent field is available for
probing the fluorescent spots and the top cladding consists of water [53].
1.3 The Outcome of Optic Based SPR Sensing
Due to all the favorable characteristics of optical fiber sensors, fiber sensing has been the focus of
substantial research and development along the years and many solutions for field applications
came out from this effort [54]. Following the degrees of freedom of the optical field, different
classes of fiber sensors have been researched along the years, but it can be fairly stated that fiber
optic sensors with spectral selectivity has been playing a major role in optical fiber sensor
technology and all points out this trend will be strengthened in the future.
Figure 1.3 - Concept of the LMC: the evanescent field of the propagating light wave excites the fluorescent labels
(green blocks) bound to the immobilized groups (red forks) on the chip surface [53].
Historical Overview of Plasmonics
- 6 -
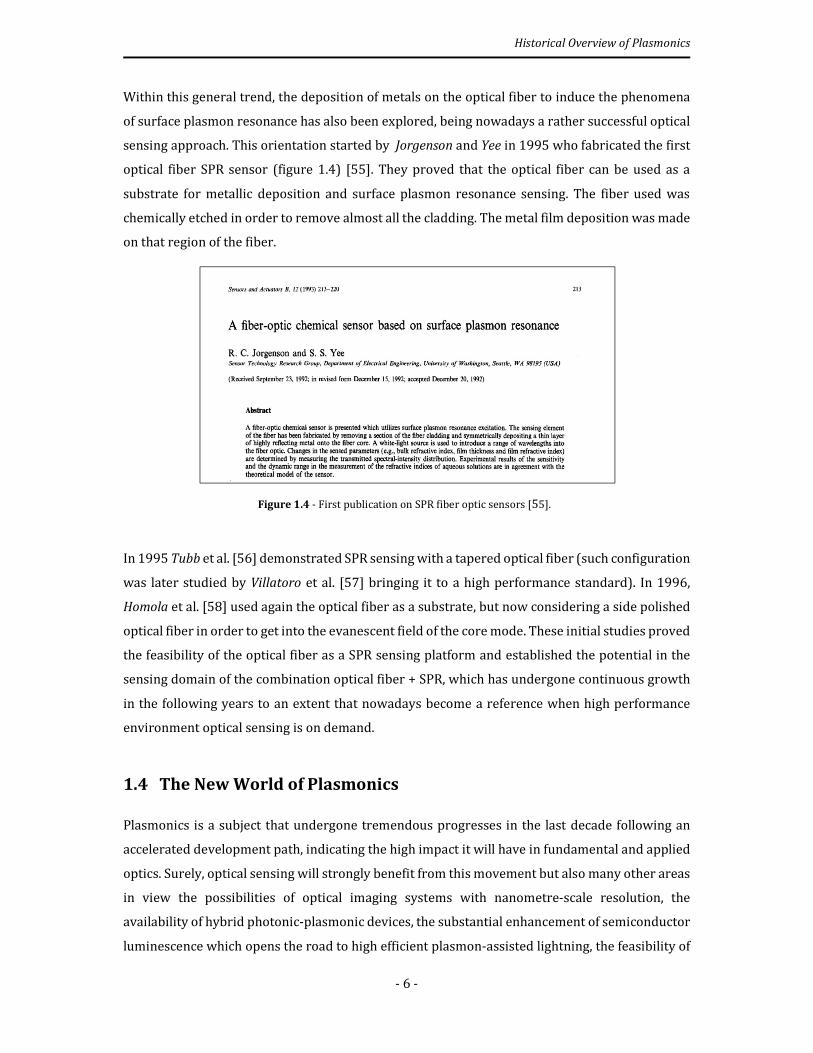
Within this general trend, the deposition of metals on the optical fiber to induce the phenomena
of surface plasmon resonance has also been explored, being nowadays a rather successful optical
sensing approach. This orientation started by Jorgenson and Yee in 1995 who fabricated the first
optical fiber SPR sensor (figure 1.4) [55]. They proved that the optical fiber can be used as a
substrate for metallic deposition and surface plasmon resonance sensing. The fiber used was
chemically etched in order to remove almost all the cladding. The metal film deposition was made
on that region of the fiber.
Figure 1.4 - First publication on SPR fiber optic sensors [55].
In 1995 Tubb et al. [56] demonstrated SPR sensing with a tapered optical fiber (such configuration
was later studied by Villatoro et al. [57] bringing it to a high performance standard). In 1996,
Homola et al. [58] used again the optical fiber as a substrate, but now considering a side polished
optical fiber in order to get into the evanescent field of the core mode. These initial studies proved
the feasibility of the optical fiber as a SPR sensing platform and established the potential in the
sensing domain of the combination optical fiber + SPR, which has undergone continuous growth
in the following years to an extent that nowadays become a reference when high performance
environment optical sensing is on demand.
1.4 The New World of Plasmonics
Plasmonics is a subject that undergone tremendous progresses in the last decade following an
accelerated development path, indicating the high impact it will have in fundamental and applied
optics. Surely, optical sensing will strongly benefit from this movement but also many other areas
in view the possibilities of optical imaging systems with nanometre-scale resolution, the
availability of hybrid photonic-plasmonic devices, the substantial enhancement of semiconductor
luminescence which opens the road to high efficient plasmon-assisted lightning, the feasibility of

Historical Overview of Plasmonics
- 7 -
plasmon antennas with large light capture characteristics, the foreseen viability of plasmonic
nanocircuits which combine a large bandwidth with a high level of integration, and others.
Therefore, to have a correct perspective of the reasons behind such huge promise and to draw a
balanced picture of possible future progress paths in plasmonics based optical sensing, it is
worthwhile to add here some paragraphs addressing general points of the subject [59].
1.4.1 SPR Sensing and Microstructured Optical Fibers
As briefly outlined in Section 1.3, plasmonics based optical sensing undergone a development leap
when the sensor platforms expanded from the prism coupling system layout to structures
supported by guided optics, particularly optical fibers and planar devices with input/output
fibers. This movement permitted to address functionalities not possible with the classic approach,
such as sensor miniaturization and remote operation. Pointing specifically to optical fiber SPR
sensors, in the last decade various compact configurations enabling effective coupling between
the fiber modes and the surface plasmonic waves have been investigated, such as those based on
metalized side-tapered single mode and multimode optical fibers, metalized tapered fibers,
metallized fiber Bragg gratings and others .
The consideration of standard optical fibers or derived structures (such as tapers, side-etched
fibers, etc.) for SPR sensors faced two main difficulties (common also to planar waveguides),
which have been limiting the performance level conceptually attainable with these platforms. The
most fundamental one is the problem of phase matching of a waveguide core mode and the surface
plasmonic wave (SPW), which implies the need the mode and the wave to have the same value for
the corresponding effective refractive indices at the operation wavelength, generating what is
known as a SPW of hybrid nature. In the case of a single mode waveguide, the effective refractive
index of its core mode is close to that of the core material, which is typically higher than 1.45. On
the other hand, the effective refractive index of a plasmon is close to that of the surrounding
analyte, with the most often found situations associated to the presence of air (refractive index
~1.0) and water (refractive index ~1.33). Therefore, it is necessary to move to shorter
wavelengths for the plasmon refractive index becomes high enough as to match that of a
waveguide core mode (for the case of gold metal film, this requires λ < 700 nm). Phase match
condition can be achieved at longer wavelengths incorporating in the sensing head an additional
dielectric thin film with specific characteristics [60], approach with some disadvantages, one of
them being added complexity. This phase matching problem can be attenuated by coupling to a
plasmon through the high order modes of a multimode waveguide. These modes can have
substantially lower effective refractive indices than the waveguide core index. Following this
strategy, light has to be launched into a waveguide as to excite high order modes, with some of

Historical Overview of Plasmonics
- 8 -
them in conditions to be phase matched with a plasmon. However, as only a fraction of higher
order modes fulfil this phase matching condition, only a fraction of total launched optical power
will be coupled to a plasmon, therefore reducing sensor sensitivity. Moreover, as power
distribution in high order modes is sensitive to the launching conditions this adds noise to the
system due to fluctuations in the coupling setup.
A much more effective approach recently proposed involves decoupling the SPW from the fiber
guided mode using a grating, therefore converting the hybrid SPW into a pure one [61]. As pointed
out, the difference between the effective refractive index of the guided mode and the effective
refractive index of pure SPW is large and requires a proper strategy to excite such surface
plasmonic wave (wavelength tuning, consideration of waveguide higher order modes or the
insertion of an additional layer). However, such gap can be bridged with a Bragg grating, which
allows the wave-vector matching condition to be met. It was pointed out the potential of this
approach to improve the sensitivity of SPR sensors. Indeed, in hybrid SPW the effective refractive
index is only slightly different from the effective refractive index of the guided mode supported
by the structure without the metal layer. This is because most of the energy is associated with the
guided mode and only slightly weighted by the plasmon effective index. This condition means the
hybrid mode is weakly sensitive to any change in the effective index of the plasmon, should it be
altered by the presence or absence of a surrounding layer. For the case of a pure SPW, since almost
all its energy is concentrated at the metal-dielectric interface, this scheme can be extremely
sensitive to small changes in the refractive index of the sensed medium.
The other difficulty mentioned above is more practical and has to be with the packaging of a
microfluidics setup, waveguide and a metallic layer into a sensing structure. Considering single
mode fiber based sensors, to metalize a surface close to the core first one has to strip the fiber
jacket and then polish the fiber cladding almost to the core to enable evanescent coupling with a
plasmon. This is a time-consuming process that compromises fiber integrity and turns the sensor
susceptible to mechanical failures. In addition, the integration of a metalized fiber piece into a
microfluidics setup presents extra difficulties, thus increasing the overall fabrication complexity
and cost.
The first difficulty pointed out is related with the reduced degrees of freedom available for sensors
supported in standard fibers, which means the tuning of their characteristics must be done acting
essentially on the sensor constituent materials, which are essentially those of the optical fiber (or
planar waveguide) with a variability strongly constrained by the need to assure, first of all, high
quality optical propagation. Therefore, not considering the Bragg grating coupling approach
described above, the open ground is from the geometry side, assuming it can be overcome the

Historical Overview of Plasmonics
- 9 -
technological problems associated with the fabrication of fibers with operation essentially defined
by their geometry.
The breakthrough associated with the development of microstructured optical fibers (MOF) is, to
a large extent, associated with the flexibility provided by the possibility to change readily the cross
section profile of the fiber, alternating silica and void regions and, with that, tailoring in a wide
range the characteristics of the modal propagation. This amplitude allows an easy compromise of
the guiding properties with those related with high performance plasmonic based optical sensing.
Indeed, in a MOF supported SPR sensor, plasmons on a surface of a thin metal film can be excited
by a Gaussian-like leaky mode of an effectively single mode waveguide. It has been demonstrated
the effective refractive index of such mode can be designed to be considerably smaller than that
of the core material, actually it can have a value from zero to that of the refractive index of the core
material [62]. This enables efficient phase matching with plasmons at any wavelength of choice,
while retaining highly sensitive response to changes in the refractive index of an analyte layer.
SPR sensing structures supported by MOF also considerably alleviate the second difficulty
abovementioned. Microfluidics in these fibers is enabled by passing the analyte through the
porous cladding, thus solving one of the packaging problems, as well as the fragility issue since no
polishing is involved. Additionally, the internal propagation of the fluids increases the safety when
dealing with the measurement of volatile or toxic samples. Deposition of metal layers inside the
MOF can be performed either with high pressure CVD techniques or wet chemistry deposition
techniques used in fabrication of metal covered hollow waveguides [63].
A recent development illustrates the potential of MOF for SPR sensing. A well-studied layout for a
microstructured optical fiber is the three-hole fiber illustrated in figure 1.5(a) [64]. The silica fiber
consists of three air holes, where cladding layers and gold layers are uniformly deposited in
sequence. Since the size of the air holes can be tens of micrometers, fabrication of the multi-
Figure 1.5 - Schematic of the three-hole microstructured optical fiber [64].
Historical Overview of Plasmonics
- 10 -
layered channel structures and the infiltration of sample into channels become easier. The
cladding layers, with a refractive index slightly smaller than the fiber core, are introduced to tune
the propagation loss of the sensor to a tolerable level. Polymers and down-doped silica are both
candidates for the cladding layers. The gold layers, generally with a nano-scale thickness, can be
coated via the technique of high-pressure microfluidic chemical deposition.
This structure was investigated to implement a dual-channel plasmonic sensor [65], with analyte
A in one of the metalized holes (denoted as Channel 1) and analyte B in the other two holes
(Channel 2&3). The study performed by the authors indicated the sensor in the standard
configuration given in figure 1.5(a) fails to distinguish between the two analytes when there is a
small refractive index difference between them (smaller than 0.01). So, it was proposed to
introduce an asymmetry in the sensing structure by adding a high refractive index polymer layer
on top of the gold surface of Channel 1, as illustrated in figure 1.5(b). In this case it turns possible
to have two distinct SPR resonance dips, showing a spectral shift with refractive index variations
with slopes of of 1535 nm/RIU (Channel 1) and 1550 nm/RIU (Channel 2&3). Assuming a
resolution of 0.01 nm for the reading spectrometer, the corresponding refractive index minimum
detectable variations are 6.51 × 10�� and 6.45 × 10��, respectively.
The authors mention the capability of this structure in dual analyte sensing yields two
applications. One is tracking two different analytes in one liquid sampling, where each analyte is
captured by a functional material deposited in the corresponding channel. The other is sensing
two different liquids samples simultaneously. Another interesting application of this device is to
implement a sensor with referencing properties. For example, Channel 1 can be chosen as the
sensing channel and channels 2 and 3 both work as reference channels, which are usually coated
with receptors responding to the non-targeted molecules in the sample. Both the referencing
signal and the sensing signal appear as absorption dips. The variation of the non-target molecules,
which causes a shift of the referencing signal, also contributes to the shift of the sensing resonance.
Hence, instead of monitoring a single resonance wavelength, the spectral separation of the two
dips can be used to nullify the non-specific effects. In addition, the two resonances share almost
the same instrumental noise and thermal instability, which also helps to eliminate external
influences.
This example illustrates the possibilities in SPR sensing offered by platforms based in
microstructured fibers. Moreover, to solve the two main difficulties identified for SPR sensors
supported by standard optical fibers (and planar waveguides), it provides a level of flexibility for
sensor design and tuning of performance level without parallel in other guided optics sensing
approaches, further enhanced when the integration of grating structures is considered. It is
therefore expectable to observe in the near future a growing level of R&D activity around the
Historical Overview of Plasmonics
- 11 -
combination of plasmonics and microstructured optical fibers towards advanced optical sensing
functionalities.
1.4.2 Multiplexing of SPR Sensors
The reported R&D activity oriented to multiplexing of SPR sensors has been residual, although
some efforts done on that direction in prism based sensors, as is the case of the work described
by [66] where a dual-channel configuration was proposed. The truth is the prism coupling systems
are not amenable to incorporate the multiplexing functionality, contrary to what happens when
the optical fiber is considered. Indeed, the unique feature of the fiber being simultaneously
sensing element and communication channel opens the intrinsic capability of this technology for
sensor multiplexing, a characteristic that has been widely explored in the context of many areas
addressed by fiber optic sensing, but not when considering SPR sensors, even when they are fiber
based. This somehow surprising reality has reasons eventually rooted to that the background of
the researchers that have been working out this type of sensors. Indeed, the illumination used is
almost invariably at wavelengths in the 850 nm region, where the availability of high-performance
fiber optic components is reduced, consequently not benefiting from the novel developments in
optical fiber technology which are anchored to the telecommunications field, in particular from
the high-tech optical fiber components available for the third telecommunications window (1550
nm), which are crucial for the development of effective fiber optic sensor networks. Some results
were reported on fiber SPR sensors operating in this spectral region [67, 68], for all reasons a path
to be reinforced in the future, opening the route for actively pursuing the topic of SPR sensor
multiplexing.
1.4.3 Sensor Functionalization
A topic relevant for all optical sensing heads intrinsically sensitive to refractive index, but
enhanced in the case of SPR based structures in view the performance level they exhibit which is
compatible with ultra-low detection thresholds, derives from the circumstance in many situations
the targeted measurand is not refractive index but another entity that can be detectable by
variations it induces in the sensor surrounding index. As an example, the detection of Hydrogen
with a SPR sensor can be achieved depositing a thin Palladium layer on the sensor structure, which
has a refractive index that depends on the nearby Hydrogen concentration. In general, refractive
index changes can be induced by a myriad of factors, which means the developing of a SPR sensor
to detect a specific species implies the need to amplify those changes connected with its presence
while minimizing the others associated to variations of any other parameter, a process known as

Historical Overview of Plasmonics
- 12 -
sensor functionalization. This is particularly acute in the domain of biochemical sensing because
the intrinsic high sensitivity of SPR sensors is an appealing characteristic to detect very small
concentrations of the targeted entity, admitting they induce refractive index changes larger
enough compared with any other environmental related changes, which for the case have a noisy
effect [69, 70].
In this domain substantial R&D effort has been done on how to detect specific molecules from
groups of molecules. Here, one of the main problems is that recognition molecules may exhibit
affinity to similar types of other unwanted molecules present in the environment. These
unwanted (“noise”) molecules will react with the biosensors and will alter the refractive index,
affecting important sensor parameters such as sensitivity, detection accuracy and reproducibility.
A second problem is related with nonspecific interactions between sensor surface with “noise”
molecules and with background refractive index variations, which can arise from many factors,
such as temperature, humidity and compositional fluctuations. These two issues demand the
conception and development of robust functionalization approaches for SPR based optical sensors
(actually, in most circumstances for all sensing platforms with refractive index intrinsic
sensitivity), desirably with tuning ability to the type of entities targeted for measurement. This is
a demanding challenge, particularly when addressing the biochemical area, and will continue to
be a focus of intense research and development activity.
1.4.4 Nanostructured Plasmonic Sensors
In the last few years, plasmonic nanostructures have been exploited in several ways for plasmonic
sensors [71, 72]. Therefore, surface-enhanced spectroscopies (SES), such as surface-enhanced
Raman scattering (SERS) [73, 74], surface enhanced resonance Raman scattering (SERRS) [75],
surface-enhanced infrared absorption (SEIRA) [76] or metal enhanced fluorescence (MEF) [77],
are considered as some of the most important optical sensing techniques. They are all based on a
significant amplification of the spectroscopic signal by electromagnetic field enhancement
induced by localized surface plasmon resonance (LSPR). In particular, SERS was the most widely
used SES as an extremely sensitive analytical technique for chemical or bio-analytical applications.
Although single molecule detection has already been predicted and observed in SERS [74, 78], in
most of the cases giant enhancements of the Raman signal were only reached for coupled
nanostructures such as at interstitial sites in nanoclusters or nanostructured surfaces with closely
spaced features [79, 80]. However, SERS behaviors at so-called hot spots are complex and usually
show poor repeatability and reproducibility, which limit their use in biosensor applications.
Particularly, the LSPR excitations at such interstitials or on nanoparticle sharp edges are highly
dependent on the excitation polarization [81]; as a consequence, the SERS signal will show in the
Historical Overview of Plasmonics
- 13 -
same way a strong dependence on the excitation polarization [82]. For example, using nano-
ellipses as SERS-active substrates, intense Raman signals could only be obtained when the
excitation polarization is parallel to the major axis of the nano-ellipses [83]. Such polarization
dependence also brings limitations to the actual sensing applications because rigorous
management of polarization in the measurements set-up will be required. This could be an
important drawback especially when the light polarization control cannot be easily completed
such as in optical fiber [84] or when the SERS substrate cannot be placed precisely in the right
orientation. Further developments for technology transfer of such optically based sensors will
depend on their robustness and simplicity for non-physicists users (biologist, medical doctors,
others).
Most of the SPR biosensors commercially available at present use surface plasmon polaritons
(SPPs), which are excited on continuous Au or Ag films in the attenuated total internal reflection
(ATR) geometry [85]. Owing to the resonant photon-SPP coupling conditions, namely the specific
combination of the wave vector and wavelength, SPPs provide an extremely small detection limit
exceeding 10-5 refractive-index units (RIU), which can be further improved using phase-sensitive
interferometry schemes [86]. However, the SPP-based approach still needs an improvement in
sensitivity for the detection of small analytes and does not always satisfy modern requirements
of biotechnology advancing towards new nanoscale designs and promising the manipulation on
the nanoscale level of size-based selectivity and selective chemical and biochemical nano-
architectures. Localized surface plasmons (LSPs) of metallic nanostructures seem much more
suitable to match these new trends, as well as to bring new functionalities, such as spectral
tenability [87] and strong enhancement of the local electric field [88]. However, LSP-based
sensors are known to provide at least an order of magnitude lower sensing response to refractive
index change compared with SPPs, with sensitivities not exceeding 100-300 nm per RIU in
spectral interrogation schemes as well as 10 times smaller probe depth [89], making them
applicable for only a very limited number of biological species. Understanding these problems in
sensing applications of existing plasmonics structures also induced focus on newly emerging
plasmonic metamaterials, composite structures consisting of subwavelength-size components.
The objective is to design a sensor-oriented metamaterial that is capable of supporting similar or
more sensitive guiding modes than SPPs. The metamaterial based approach may additionally offer
the advantages of nano-architectures, i.e., enable large effective area and the possibility of guiding
and imaging capabilities beyond the diffraction limit [90], as well as the feasibility of
nanomanipulation and nanotrapping [91].

Historical Overview of Plasmonics
- 14 -
1.5 Final Remarks
The coherent interaction of the photon and the electron which generates an hybrid structure
named Plasmon, with its own properties which shows flavours of the characteristics of the free
electron and of the free photon, is a phenomenon known since the beginning of the twenty
century, but can be fairly stated it was only recently that the conceptual relevance of such hybrid
entity was grasped, from where a huge technological impact has been emerging. This statement
becomes obvious when it is realized with plasmons optical sub-wavelength imaging turns
possible, overcoming the constraints of the optical diffraction limit which has always been
assumed to be an absolute one. The field of science that deals with this hybrid entity is identified
as Plasmonics and is nowadays one of the most fascinating fields of Photonics and the focus of a
worldwide R&D activity that takes place at a breathtaking pace.
Plasmonic has also strongly impacted the domain of optical sensing, starting from the modest
demonstration of this possibility in the 1970’s. Up to the end of the century SPR based optical
sensing progressed to a point it became the technique providing the best sensitivity in
measurement of refractive index changes of the sensor surrounding and was demonstrated the
advantages associated with the utilization of the optical fiber as a platform to host this sensing
principle. But was the outcome of nanoscience and nanotechnology at the turn of the century that
opened the door to rather large horizons for Plasmonic in general and plasmonics-based optical
sensing in particular. This new reality brought to the forefront the nanoengineering of materials
and, consequently, the new world of the metamaterials became accessible. The implications of this
are rather difficult to foresee but no doubt the breakthroughs will be tremendous in science and
technology, and surely optical sensing will not be an exception particularly when high
performance interrogation approaches are considered to read out the status of the sensors as is
the case of phase interrogation.
The research undergone in the context of this PhD programme was oriented to the analytical study
of the performance of SPR based fiber optic sensing heads with different geometries and material
compositions when coupled to optical phase interrogation. To do this first the theoretical
background of Plasmonics was reviewed which is the focus of next chapter.

2
Theoretical Background of Plasmonics
Summary: This chapter presents the physical concepts that define the Surface Plasmon Polaritons
phenomenon and the conditions for their existence on dielectric-metal-dielectric slabs. The
propagation of electromagnetic fields into a multilayer structure will also be discussed. This theory
consequently allows understanding and model surface plasmon resonance based sensors.
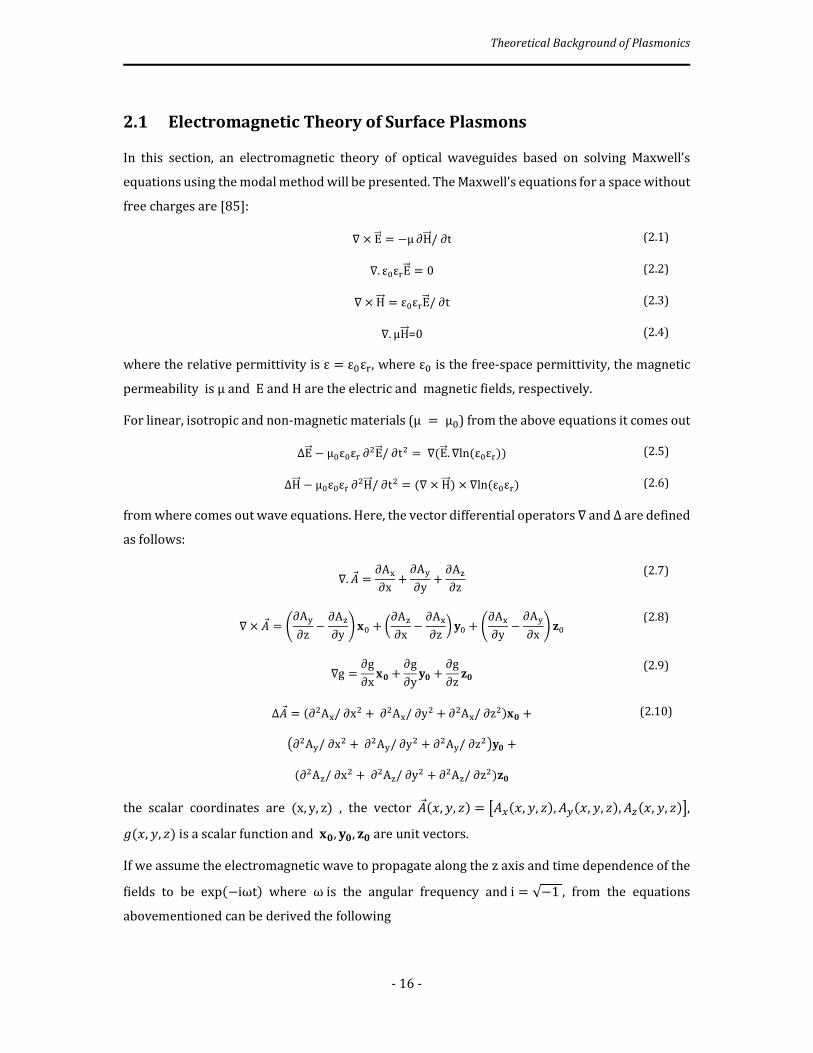
Theoretical Background of Plasmonics
- 16 -
2.1 Electromagnetic Theory of Surface Plasmons
In this section, an electromagnetic theory of optical waveguides based on solving Maxwell’s
equations using the modal method will be presented. The Maxwell’s equations for a space without
free charges are [85]:
∇ × E��� = −μ ∂H���/ ∂t (2.1)
∇. ε%ε&E��� = 0 (2.2)
∇ × H��� = ε%ε&E���/ ∂t (2.3)
∇. μH���=0 (2.4)
where the relative permittivity is ε = ε%ε&, where ε% is the free-space permittivity, the magnetic
permeability is μ and E and H are the electric and magnetic fields, respectively.
For linear, isotropic and non-magnetic materials (μ = μ%) from the above equations it comes out
∆E��� − μ%ε%ε& ∂�E���/ ∂t� = ∇(E���. ∇ln (ε%ε&)) (2.5)
∆H��� − μ%ε%ε& ∂�H���/ ∂t� = (∇ × H���) × ∇ln (ε%ε&) (2.6)
from where comes out wave equations. Here, the vector differential operators ∇ and Δ are defined
as follows:
∇. ,� = ∂A.∂x + ∂A1∂y + ∂A3∂z (2.7)
∇ × ,� = 5∂A1∂z − ∂A3∂y 6 7% + 8∂A3∂x − ∂A.∂z 9 :% + 5∂A.∂y − ∂A1∂x 6 ;% (2.8)
∇g = ∂g∂x 7= + ∂g∂y := + ∂g∂z ;= (2.9)
∆,� = (∂�A./ ∂x� + ∂�A./ ∂y� + ∂�A./ ∂z�)7= + (2.10)
>∂�A1/ ∂x� + ∂�A1/ ∂y� + ∂�A1/ ∂z�?:= +
(∂�A3/ ∂x� + ∂�A3/ ∂y� + ∂�A3/ ∂z�);=
the scalar coordinates are (x, y, z) , the vector ,�(A, B, C) = D,E(A, B, C), ,F(A, B, C), ,G(A, B, C)H,
I(A, B, C) is a scalar function and 7=, :=, ;= are unit vectors.
If we assume the electromagnetic wave to propagate along the z axis and time dependence of the
fields to be exp(−iωt) where ω is the angular frequency and i = √−1 , from the equations
abovementioned can be derived the following

Theoretical Background of Plasmonics
- 17 -
E = e(x, y)exp [i(βz − ωt)] (2.11)
H = h(x, y)exp [i(βz − ωt)] (2.12)
where β denotes the propagation constant of an electromagnetic mode.
A illustrated in figure 2.1, let’s consider an optical waveguide composed of three homogeneous
media with permitivities:
ε(x) = εS = nS�, x > U, (2.13)
ε(x) = ε� = n�� , − d ≤ x ≤ d, (2.14)
ε(x) = εX = nX�, x < −U, (2.15)
where U is the waveguiding layer half-width and nY (i = 1, 2, 3) is the refractive index of the
i layer. Notice εY and nY are generally complex permitivities and refractive indices.
Figure 2.1 - Section of a planar waveguide with a step refractive index profile.
By orienting the layers in the y-z plane as shown in figure 2.1, the field vectors can be written as:
E = e(x)exp [i(βz − ωt)] (2.16)
H = h(x)exp [i(βz − ωt)] (2.17)
and the wave equations are:
(∆[\]^_`a\_a + ω�εε%μ% − β�)eY = 0 (2.18)
(∆[\]^_`a\_a + ω�εε%μ% − β�)hY = 0 (2.19)
where (i = x, y, z).
The solutions of the equations 2.18 and 2.19 set above produce two different modes, one with
h3 = 0 called Transverse Magnetic (TM) and one with e3 = 0, denominate Transverse Electric
(TE). Substitution of the field profiles equations 2.16 and 2.17 into 2.18 and 2.19, respectively,
yields for the transversal components of the field vectors [85]:

Theoretical Background of Plasmonics
- 18 -
∂�e1(x)∂x� + (ω�εε%μ% − β�)e1(x) = 0 for TE modes (2.20)
∂�h1(x)∂x� + (ω�εε%μ% − β�)h1(x) = 0 for TM modes. (2.21)
From equations 2.1-2.4 and the definition of cross product:
∂e3∂y − ∂e1∂z = −iωμh. (2.22)
∂e.∂z − ∂e3∂x = −iωμh1 (2.23)
∂e1∂x − ∂e.∂y = −iωμh3 (2.24)
∂h3∂y − ∂h1∂z = iωεe. (2.25)
∂h.∂z − ∂e3∂x = iωεe1 (2.26)
∂h1∂x − ∂h.∂y = iωεe3 (2.27)
assuming
∂∂y = 0 (2.28)
and
kY� = ω�εiε%μ% − j�, i = 1, 2, 3 (2.29)
the solutions of equations 2.20 and 2.21 for TE modes are:
e1(x) = aYl exp(ikYx) + aY� exp(−ikYx) (2.30)
h.(x) = βμ%ω [aYl exp(ikYx) + aY� exp(−ikYx)] (2.31)
h3(x) = −kYμ%ω [aYl exp(ikYx) − aY� exp(−ikYx)] (2.32)
and for TM modes are:
h1(x) = bYl exp(ikYx) + bY� exp(−ikYx) (2.33)
e.(x) = −βεYε%ω [bYl exp(ikYx) + bY� exp(−ikYx)] (2.34)
e3(x) = nopopqr [bYl exp(ikYx) − bY� exp(−ikYx)]. (2.35)

Theoretical Background of Plasmonics
- 19 -
aY and bY are the amplitude of Transverse Electric (TE) and Transverse Magnetic (TM) fields,
respectively, and i=1, 2, 3, denotes the different sections of the planar waveguide (figure 2.1). The
superscript signs + and – in a and b show, wave propagation in the +A or – A direction. In the first
and third layer the fields decay exponentially with the distance to the second layer that represents
the metal, so aXl = aS� = 0 and bXl = bS� = 0. The boundary conditions of the Maxwell’s equations are such that the components of the electric
and magnetic fields parallel to the boundaries of the layers must be continuous at the borders of
the second layer (x = d and x = −d). As a result the previous equation for TE modes may be
expressed as:
e1(x = d) = a�l exp(ik�d) + a�� exp(−ik�d) = aSlexp (ikSd) (2.36)
h3(x = d) = −k�μ%ω [a�l exp(ik�d) + a�� exp(−ik�d)] =
−kSμ%ω [aSl exp(ikSd)] (2.37)
e1(x = −d) = a�l exp(−ik�d) + a�� exp(−ik�d) = aX�exp (ikXd) (2.38)
h3(x = −d) = −k�μ%ω [a�l exp(−ik�d) − a�� exp(ik�d)]
= −kXμ%ω [aX� exp(ikSd)] (2.39)
The surface wave definition demands the existence of scattered fields without incident waves
[92]. Therefore the determinant of the associated matrix E (equation 2.40) must be equal to zero
and thus formula 2.41 can be found:
( ) ( ) ( )( ) ( ) ( )
( ) ( ) ( )( ) ( ) ( )
2 2 2 2 3 3
2 2 3
1 2 2
1 1 2 2 2 2
exp exp exp
exp exp exp
exp exp exp
exp exp ex
0
0
0
0p
k ik d k ik d k ik
ik d ik d ik d
ik d ik d ik d
k ik d k ik d
d
E
k ik d
− −
−
=
−
− −
− − −
(2.40)
[(k� − kX)(kS − k�)] exp(i2k�d) + [(k� + kX)(kS + k�)] exp(−i2k�d) = 0. (2.41)
For TM modes instead can be written:
h1(x = d) = b�l exp(ik�d) + b�� exp(−ik�d) = bSlexp (ikSd) (2.42)
e3(x = d) = k�ε�ε%ω [b�l exp(ik�d) − b�� exp(−ik�d)] =
kSεSε%ω [bSl exp(ikSd)] (2.43)
h1(x = −d) = b�l exp(−ik�d) + b�� exp(ik�d) = bX�exp (ikXd) (2.44)
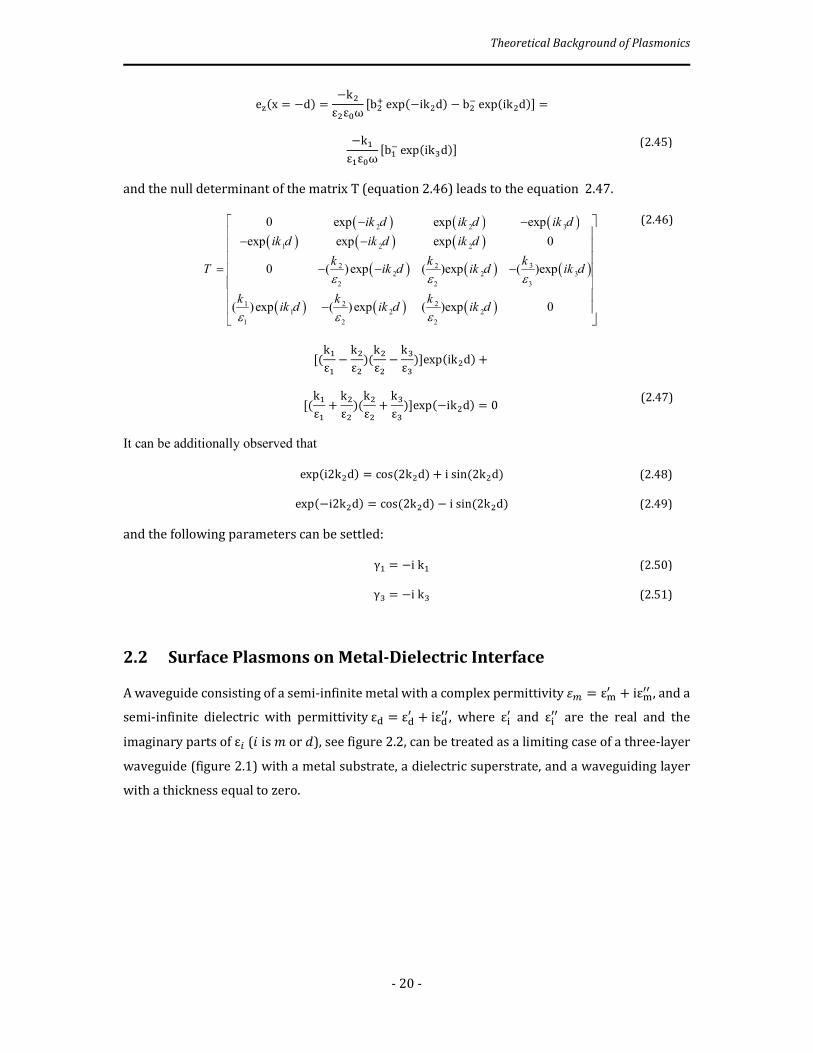
Theoretical Background of Plasmonics
- 20 -
e3(x = −d) = −k�ε�ε%ω [b�l exp(−ik�d) − b�� exp(ik�d)] =
−kXεXε%ω [bX� exp(ikSd)] (2.45)
and the null determinant of the matrix T (equation 2.46) leads to the equation 2.47.
( ) ( ) ( )( ) ( ) ( )
( ) ( ) ( )
( ) ( ) ( )
2 2 3
1 2 2
32 22 2
2 2 3
1 2 21 2 2
1 2
3
2
exp exp exp
exp exp exp 0
( )exp ( )exp ( )exp
( )
0
exp ( )exp ( )
0
e 0xp
ik d ik d ik d
ik d ik d ik d
kk kik d ik d ik d
k k kik d ik d ik d
Tε ε ε
ε ε ε
− −
− −
=
− − −
−
(2.46)
[(kXεX − k�ε� )(k�ε� − kSεS )]exp(ik�d) +
[(kXεX + k�ε� )(k�ε� + kSεS )]exp(−ik�d) = 0 (2.47)
It can be additionally observed that
exp(i2k�d) = cos (2k�d) + i sin (2k�d) (2.48)
exp(−i2k�d) = cos (2k�d) − i sin (2k�d) (2.49)
and the following parameters can be settled:
γX = −i kX (2.50)
γS = −i kS (2.51)
2.2 Surface Plasmons on Metal-Dielectric Interface
A waveguide consisting of a semi-infinite metal with a complex permittivity vw = εxy + iεxyy , and a
semi-infinite dielectric with permittivity εz = εzy + iεzyy, where εYy and εYyy are the real and the
imaginary parts of εi ({ is | or U), see figure 2.2, can be treated as a limiting case of a three-layer
waveguide (figure 2.1) with a metal substrate, a dielectric superstrate, and a waveguiding layer
with a thickness equal to zero.
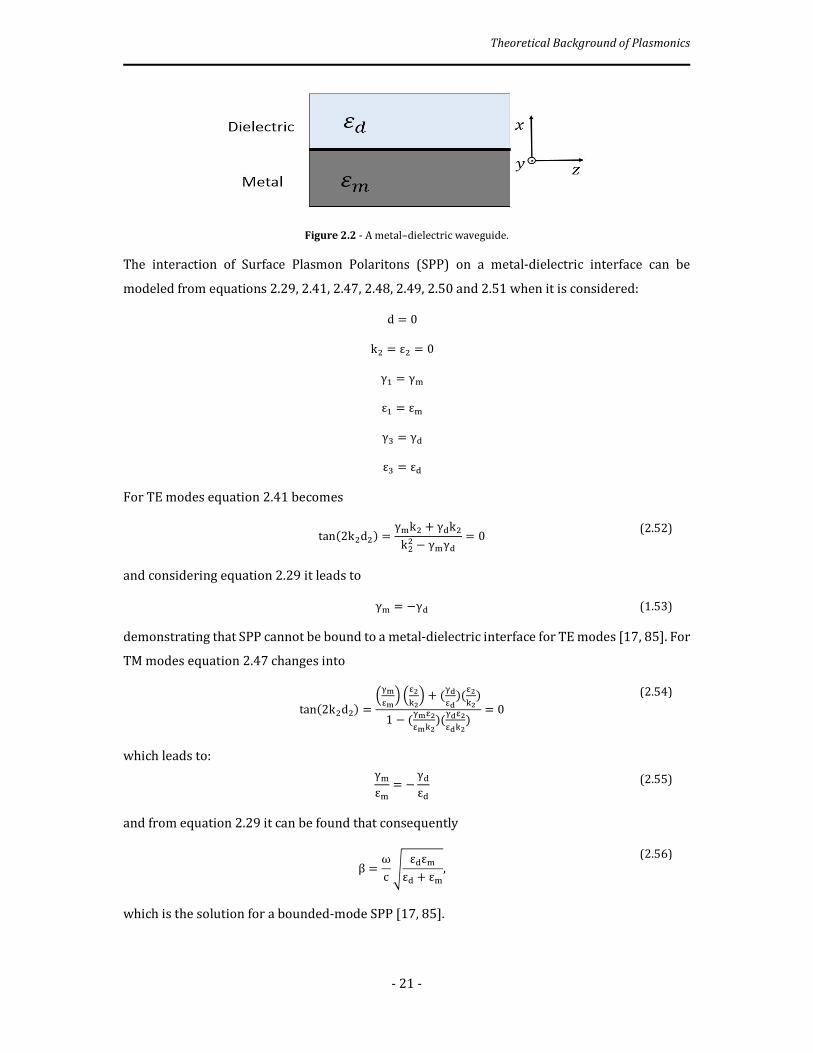
Theoretical Background of Plasmonics
- 21 -
Figure 2.2 - A metal–dielectric waveguide.
The interaction of Surface Plasmon Polaritons (SPP) on a metal-dielectric interface can be
modeled from equations 2.29, 2.41, 2.47, 2.48, 2.49, 2.50 and 2.51 when it is considered:
d = 0
k� = ε� = 0
γX = γx
εX = εx
γS = γz
εS = εz
For TE modes equation 2.41 becomes
tan(2k�d�) = γxk� + γzk�k�� − γxγz = 0 (2.52)
and considering equation 2.29 it leads to
γx = −γz (1.53)
demonstrating that SPP cannot be bound to a metal-dielectric interface for TE modes [17, 85]. For
TM modes equation 2.47 changes into
tan(2k�d�) = }~�p�� }p�n�� + (~�p�)(p�n�)1 − (~�p�p�n�)(~�p�p�n�) = 0
(2.54)
which leads to:
γxεx = − γzεz (2.55)
and from equation 2.29 it can be found that consequently
β = ωc � εzεxεz + εx, (2.56)
which is the solution for a bounded-mode SPP [17, 85].
Theoretical Background of Plasmonics
- 22 -
The real part of the refractive index of a media is associated to the effective refractive index while
its imaginary part is related with light absorption inside the medium itself. For lossless metals and
dielectrics (Im(εx) = Im(εz) = 0), equation 2.56 represents a guided mode, providing that
Re (εx) and Re (εz) have a different sign and Re (εx) < −�a (εz). Dielectrics usually have
Re (εz) > 0 and real metals absorb the electromagnetic field, which means Im(εx) ≠ 0. This
allows bounded SPP, in this case named evanescent modes, to exist even for Re (εx) > −�a (εz)
if Re (εx) < 0 and |Im (εx)| ≪ |Re (εx)|. The real part of the propagation constant β is related to
the SPP propagation speed while its imaginary part gives information about the SPP attenuation.
The propagation length L is the distance at which the SPP energy decreases of 1/a , therefore it
can be defined as [85]
L��� = 1[2jyy]. (2.57)
The electromagnetic (E-M) fields have a maximum intensity at the metal-dielectric interface and
decrease exponentially with the distance from the latter.
The skin depths at which the E-M fields decrease of 1/a are, according to [17]
l���,x = λ2π �a(�εx + εzεx ) (2.58)
into the metal and
l���,z = λ2π �a(�εz + εzεx ) (2.59)
into the dielectric.
2.3 Surface Plasmons on Dielectric-Metal-Dielectric
A Dielectric-Metal-Dielectric Waveguide is composed of a metal film sandwiched between two
semi-infinite dielectric media (figure 2.3). This kind of structure supports two TM modes that is
two surface plasmons at the opposite boundaries of the metal film, when the metal film is much
thicker than the penetration depth of a Surface Plasmon at each metal-dielectric interface. When
the metal thickness decreases, coupling between the two surface plasmons occurs, giving rise to
mixed modes of electromagnetic field [85].
Taking into consideration a symmetric waveguide, that is a dielectric-metal-dielectric interface
where the two dielectric media are equal and regarding equations 2.29, 2.48, 2.49, 2.50 and 2.51
when

Theoretical Background of Plasmonics
- 23 -
Figure 2.3 - Thin metal layer sandwiched between two dielectrics.
εX = εS = εz (2.60)
γX = γS = γz (2.61)
ε� = εx (2.62)
k� = kx (2.63)
the solutions for TE modes from equation 2.41 is:
tan(kxd) = γzkx and (2.64)
cot(kxd) = −γzkx (2.65)
while for TM modes equation 2.47 gives[17]:
tan(kxd) = εxγzεzkx and (2.66)
tan(kxd) = −εxkzεzγz (2.67)
For a generic asymmetric waveguide the SPP modes are associated with the characteristic
equation
[]^(2�wU) = }����� + }�����1 − (����)(����)
(2.68)
for the TE modes and
tan(2kxd) = }p�~�p�n�� + }p�~�p�n��1 − (p�~�p�n�)(p�~�p�n�)
(2.69)
for TM modes [17, 85].
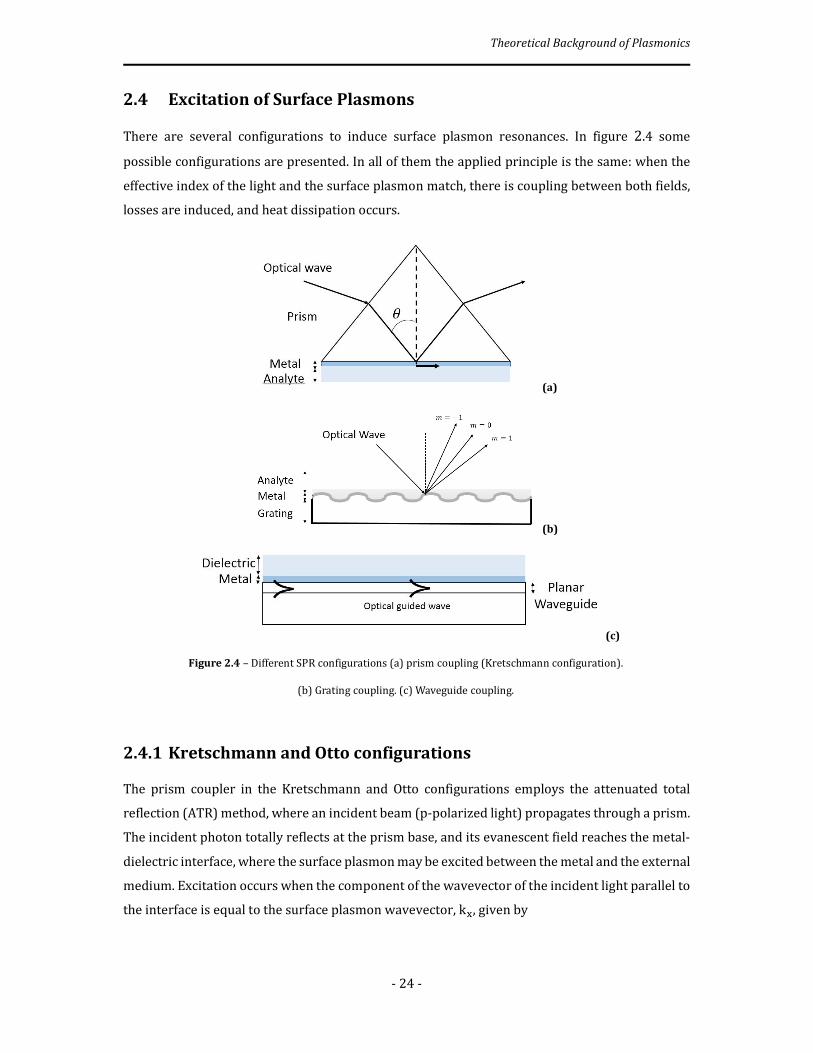
Theoretical Background of Plasmonics
- 24 -
2.4 Excitation of Surface Plasmons
There are several configurations to induce surface plasmon resonances. In figure 2.4 some
possible configurations are presented. In all of them the applied principle is the same: when the
effective index of the light and the surface plasmon match, there is coupling between both fields,
losses are induced, and heat dissipation occurs.
2.4.1 Kretschmann and Otto configurations
The prism coupler in the Kretschmann and Otto configurations employs the attenuated total
reflection (ATR) method, where an incident beam (p-polarized light) propagates through a prism.
The incident photon totally reflects at the prism base, and its evanescent field reaches the metal-
dielectric interface, where the surface plasmon may be excited between the metal and the external
medium. Excitation occurs when the component of the wavevector of the incident light parallel to
the interface is equal to the surface plasmon wavevector, k., given by
(a)
(b)
(c)
Figure 2.4 – Different SPR configurations (a) prism coupling (Kretschmann configuration).
(b) Grating coupling. (c) Waveguide coupling.
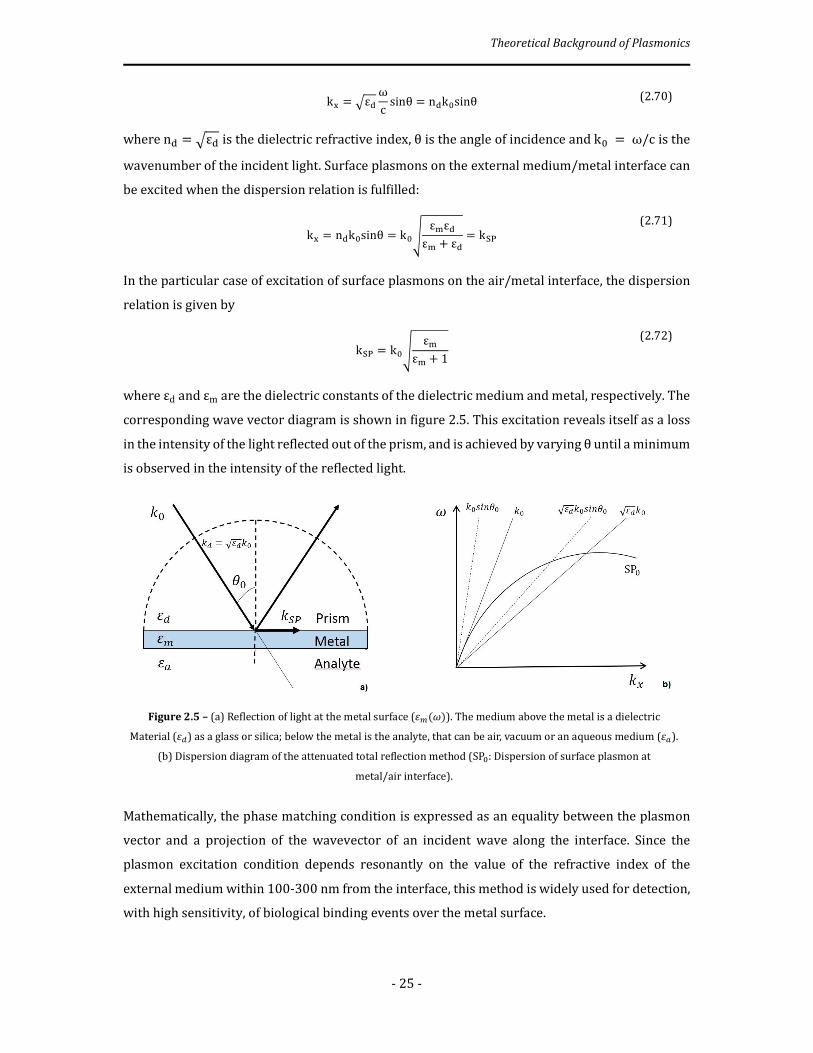
Theoretical Background of Plasmonics
- 25 -
k. = �εz ωc sinθ = nzk%sinθ (2.70)
where nz = �εz is the dielectric refractive index, θ is the angle of incidence and k% = ω/c is the
wavenumber of the incident light. Surface plasmons on the external medium/metal interface can
be excited when the dispersion relation is fulfilled:
k. = nzk%sinθ = k%� εxεzεx + εz = k�� (2.71)
In the particular case of excitation of surface plasmons on the air/metal interface, the dispersion
relation is given by
k�� = k%� εxεx + 1 (2.72)
where εd and εm are the dielectric constants of the dielectric medium and metal, respectively. The
corresponding wave vector diagram is shown in figure 2.5. This excitation reveals itself as a loss
in the intensity of the light reflected out of the prism, and is achieved by varying θ until a minimum
is observed in the intensity of the reflected light.
Mathematically, the phase matching condition is expressed as an equality between the plasmon
vector and a projection of the wavevector of an incident wave along the interface. Since the
plasmon excitation condition depends resonantly on the value of the refractive index of the
external medium within 100-300 nm from the interface, this method is widely used for detection,
with high sensitivity, of biological binding events over the metal surface.
Figure 2.5 – (a) Reflection of light at the metal surface (vw(�)). The medium above the metal is a dielectric
Material (v�) as a glass or silica; below the metal is the analyte, that can be air, vacuum or an aqueous medium (v�).
(b) Dispersion diagram of the attenuated total reflection method (SP%: Dispersion of surface plasmon at
metal/air interface).
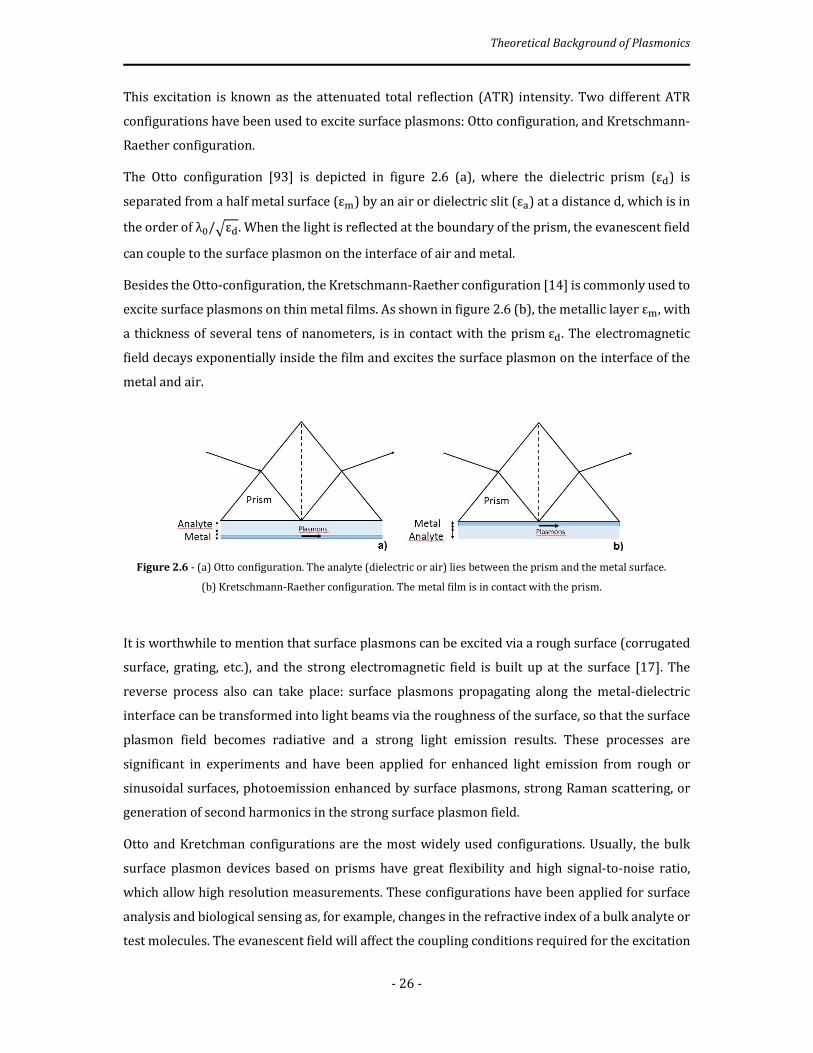
Theoretical Background of Plasmonics
- 26 -
This excitation is known as the attenuated total reflection (ATR) intensity. Two different ATR
configurations have been used to excite surface plasmons: Otto configuration, and Kretschmann-
Raether configuration.
The Otto configuration [93] is depicted in figure 2.6 (a), where the dielectric prism (εz) is
separated from a half metal surface (εx) by an air or dielectric slit (ε�) at a distance d, which is in
the order of λ%/�εz. When the light is reflected at the boundary of the prism, the evanescent field
can couple to the surface plasmon on the interface of air and metal.
Besides the Otto-configuration, the Kretschmann-Raether configuration [14] is commonly used to
excite surface plasmons on thin metal films. As shown in figure 2.6 (b), the metallic layer εx, with
a thickness of several tens of nanometers, is in contact with the prism εz. The electromagnetic
field decays exponentially inside the film and excites the surface plasmon on the interface of the
metal and air.
It is worthwhile to mention that surface plasmons can be excited via a rough surface (corrugated
surface, grating, etc.), and the strong electromagnetic field is built up at the surface [17]. The
reverse process also can take place: surface plasmons propagating along the metal-dielectric
interface can be transformed into light beams via the roughness of the surface, so that the surface
plasmon field becomes radiative and a strong light emission results. These processes are
significant in experiments and have been applied for enhanced light emission from rough or
sinusoidal surfaces, photoemission enhanced by surface plasmons, strong Raman scattering, or
generation of second harmonics in the strong surface plasmon field.
Otto and Kretchman configurations are the most widely used configurations. Usually, the bulk
surface plasmon devices based on prisms have great flexibility and high signal-to-noise ratio,
which allow high resolution measurements. These configurations have been applied for surface
analysis and biological sensing as, for example, changes in the refractive index of a bulk analyte or
test molecules. The evanescent field will affect the coupling conditions required for the excitation
Figure 2.6 - (a) Otto configuration. The analyte (dielectric or air) lies between the prism and the metal surface.
(b) Kretschmann-Raether configuration. The metal film is in contact with the prism.
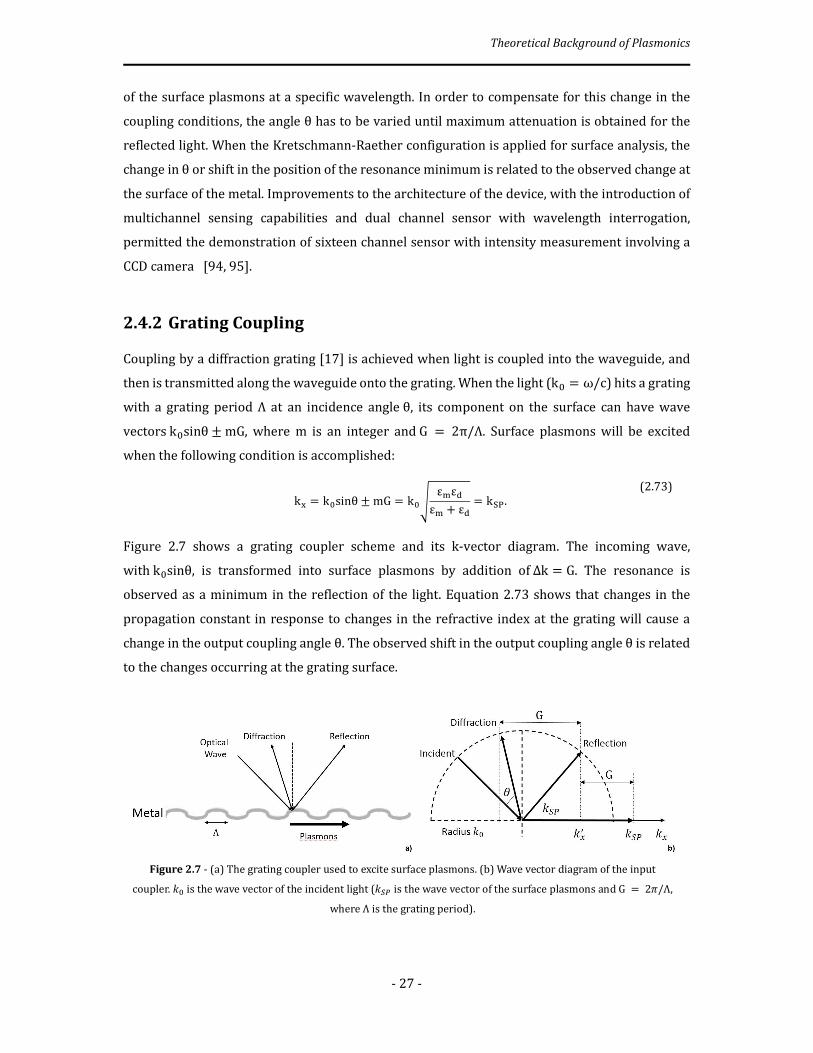
Theoretical Background of Plasmonics
- 27 -
of the surface plasmons at a specific wavelength. In order to compensate for this change in the
coupling conditions, the angle θ has to be varied until maximum attenuation is obtained for the
reflected light. When the Kretschmann-Raether configuration is applied for surface analysis, the
change in θ or shift in the position of the resonance minimum is related to the observed change at
the surface of the metal. Improvements to the architecture of the device, with the introduction of
multichannel sensing capabilities and dual channel sensor with wavelength interrogation,
permitted the demonstration of sixteen channel sensor with intensity measurement involving a
CCD camera [94, 95].
2.4.2 Grating Coupling
Coupling by a diffraction grating [17] is achieved when light is coupled into the waveguide, and
then is transmitted along the waveguide onto the grating. When the light (k% = ω/c) hits a grating
with a grating period Λ at an incidence angle θ, its component on the surface can have wave
vectors k%sinθ ± mG, where m is an integer and G = 2π/Λ. Surface plasmons will be excited
when the following condition is accomplished:
k. = k%sinθ ± mG = k%� εxεzεx + εz = k��. (2.73)
Figure 2.7 shows a grating coupler scheme and its k-vector diagram. The incoming wave,
with k%sinθ, is transformed into surface plasmons by addition of Δk = G. The resonance is
observed as a minimum in the reflection of the light. Equation 2.73 shows that changes in the
propagation constant in response to changes in the refractive index at the grating will cause a
change in the output coupling angle θ. The observed shift in the output coupling angle θ is related
to the changes occurring at the grating surface.
Figure 2.7 - (a) The grating coupler used to excite surface plasmons. (b) Wave vector diagram of the input
coupler. �% is the wave vector of the incident light (��� is the wave vector of the surface plasmons and G = 2�/Λ,
where Λ is the grating period).
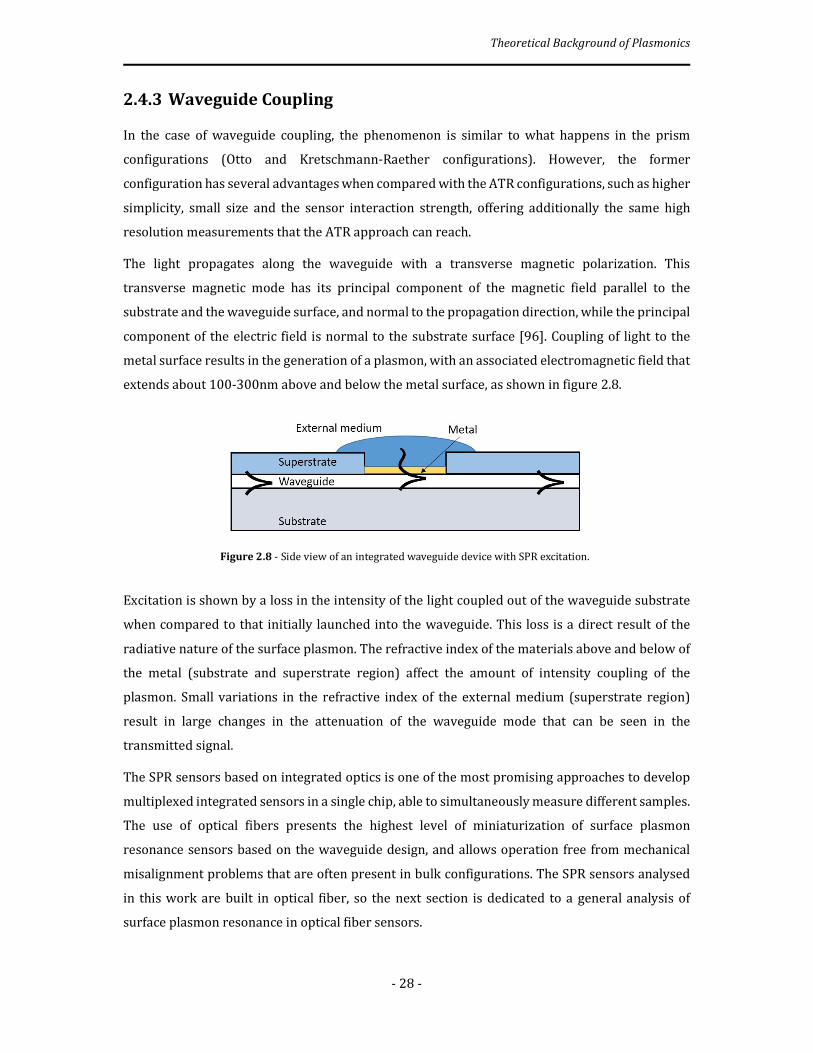
Theoretical Background of Plasmonics
- 28 -
2.4.3 Waveguide Coupling
In the case of waveguide coupling, the phenomenon is similar to what happens in the prism
configurations (Otto and Kretschmann-Raether configurations). However, the former
configuration has several advantages when compared with the ATR configurations, such as higher
simplicity, small size and the sensor interaction strength, offering additionally the same high
resolution measurements that the ATR approach can reach.
The light propagates along the waveguide with a transverse magnetic polarization. This
transverse magnetic mode has its principal component of the magnetic field parallel to the
substrate and the waveguide surface, and normal to the propagation direction, while the principal
component of the electric field is normal to the substrate surface [96]. Coupling of light to the
metal surface results in the generation of a plasmon, with an associated electromagnetic field that
extends about 100-300nm above and below the metal surface, as shown in figure 2.8.
Excitation is shown by a loss in the intensity of the light coupled out of the waveguide substrate
when compared to that initially launched into the waveguide. This loss is a direct result of the
radiative nature of the surface plasmon. The refractive index of the materials above and below of
the metal (substrate and superstrate region) affect the amount of intensity coupling of the
plasmon. Small variations in the refractive index of the external medium (superstrate region)
result in large changes in the attenuation of the waveguide mode that can be seen in the
transmitted signal.
The SPR sensors based on integrated optics is one of the most promising approaches to develop
multiplexed integrated sensors in a single chip, able to simultaneously measure different samples.
The use of optical fibers presents the highest level of miniaturization of surface plasmon
resonance sensors based on the waveguide design, and allows operation free from mechanical
misalignment problems that are often present in bulk configurations. The SPR sensors analysed
in this work are built in optical fiber, so the next section is dedicated to a general analysis of
surface plasmon resonance in optical fiber sensors.
Figure 2.8 - Side view of an integrated waveguide device with SPR excitation.
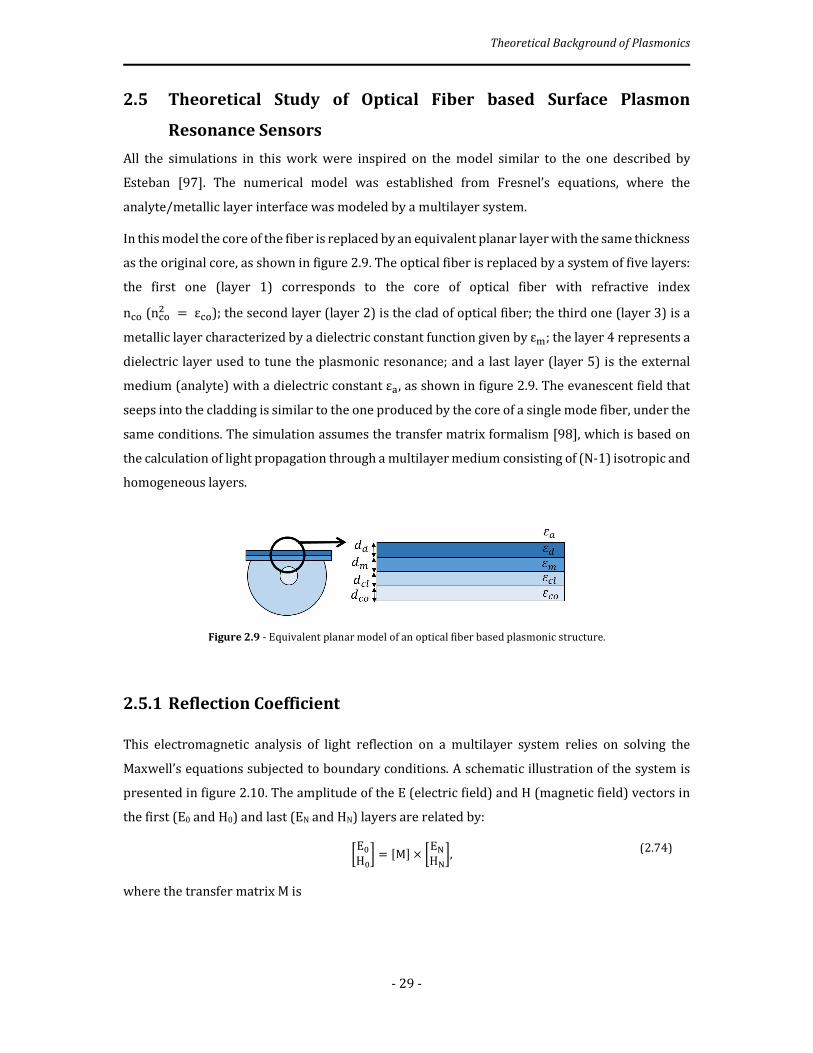
Theoretical Background of Plasmonics
- 29 -
2.5 Theoretical Study of Optical Fiber based Surface Plasmon
Resonance Sensors
All the simulations in this work were inspired on the model similar to the one described by
Esteban [97]. The numerical model was established from Fresnel’s equations, where the
analyte/metallic layer interface was modeled by a multilayer system.
In this model the core of the fiber is replaced by an equivalent planar layer with the same thickness
as the original core, as shown in figure 2.9. The optical fiber is replaced by a system of five layers:
the first one (layer 1) corresponds to the core of optical fiber with refractive index
n�� (n��� = �); the second layer (layer 2) is the clad of optical fiber; the third one (layer 3) is a
metallic layer characterized by a dielectric constant function given by εx; the layer 4 represents a
dielectric layer used to tune the plasmonic resonance; and a last layer (layer 5) is the external
medium (analyte) with a dielectric constant ε�, as shown in figure 2.9. The evanescent field that
seeps into the cladding is similar to the one produced by the core of a single mode fiber, under the
same conditions. The simulation assumes the transfer matrix formalism [98], which is based on
the calculation of light propagation through a multilayer medium consisting of (N-1) isotropic and
homogeneous layers.
2.5.1 Reflection Coefficient
This electromagnetic analysis of light reflection on a multilayer system relies on solving the
Maxwell’s equations subjected to boundary conditions. A schematic illustration of the system is
presented in figure 2.10. The amplitude of the E (electric field) and H (magnetic field) vectors in
the first (E0 and H0) and last (EN and HN) layers are related by:
�E%H% = [M] × �E¡H¡ , (2.74)
where the transfer matrix M is
Figure 2.9 - Equivalent planar model of an optical fiber based plasmonic structure.
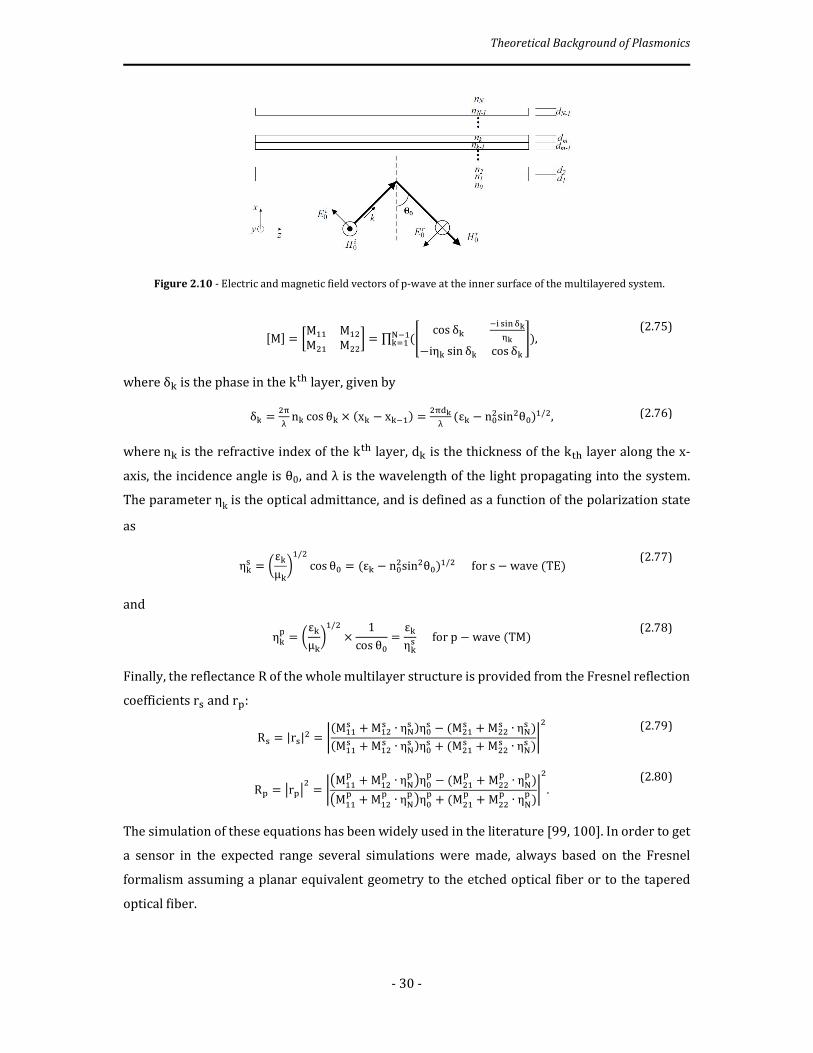
Theoretical Background of Plasmonics
- 30 -
[M] = �MXX MX�M�X M�� = ∏ (£ cos δn �Y ¥Y¦ §¨©¨−iηn sin δn cos δn«)¡�Xn¬X ,
(2.75)
where δn is the phase in the k® layer, given by
δn = �°̄ nn cos θn × (xn − xn�X) = �¯z¨° (εn − n%�sin�θ%)X/�, (2.76)
where nn is the refractive index of the k® layer, dn is the thickness of the k® layer along the x-
axis, the incidence angle is θ0, and λ is the wavelength of the light propagating into the system.
The parameter ηk is the optical admittance, and is defined as a function of the polarization state
as
ηn¥ = 8εnμn9X/� cos θ% = (εn − n%�sin�θ%)X/� for s − wave (TE) (2.77)
and
ηn³ = 8εnμn9X/� × 1cos θ% = εnηn¥ for p − wave (TM) (2.78)
Finally, the reflectance R of the whole multilayer structure is provided from the Fresnel reflection
coefficients r¥ and r³:
R¥ = |r¥|� = ´(MXX¥ + MX�¥ ∙ η¡¥ )η%¥ − (M�X¥ + M��¥ ∙ η¡¥ )(MXX¥ + MX�¥ ∙ η¡¥ )η%¥ + (M�X¥ + M��¥ ∙ η¡¥ )´�
(2.79)
R³ = ¶r³¶� = ´>MXX³ + MX�³ ∙ η¡³ ?η%³ − (M�X³ + M��³ ∙ η¡³ )>MXX³ + MX�³ ∙ η¡³ ?η%³ + (M�X³ + M��³ ∙ η¡³ )´�. (2.80)
The simulation of these equations has been widely used in the literature [99, 100]. In order to get
a sensor in the expected range several simulations were made, always based on the Fresnel
formalism assuming a planar equivalent geometry to the etched optical fiber or to the tapered
optical fiber.
Figure 2.10 - Electric and magnetic field vectors of p-wave at the inner surface of the multilayered system.
Theoretical Background of Plasmonics
- 31 -
To find the refractive indices of the layers involved in the simulation, different models were taken
into account, depending on the nature of the layer. The dielectric function, εx, corresponding to
the metal film was obtained following the Drude Model [101]. The frequency-dependent optical
properties of gold in the visible/near-UV range can be represented by the contribution of this
model. According to the modified Drude model, the real and imaginary parts of the metal
nanoparticle dielectric functions are given by expressions 2.81 and 2.82 [101],
εxy (λ) = 1 − λ�λ��λ³� (λ�+λ��) (2.81)
εxyy (λ) = λ�λ��λ³�(λ�+λ��), (2.82)
where λ³ and λ� denote the size dependent plasma and collision wavelengths of the nanoparticle,
respectively.
The core and silica dielectric functions were calculated with the Sellmeier [102] equation 2.83,
εz(λ) = nz�(λ) = 1 + BXλ�λ� − CX + B�λ�
λ� − C� + BSλ�λ� − CS, (2.83)
where λ is the radiation wavelength, and BX,�,S and CX,�,S are experimentally determined Sellmeier
coefficients.
2.5.2 Transmitted Power
Considering that all the guided rays are launched in the fiber using a collimated source and a
microscope objective, the angular power distribution of rays guided in the fiber is given as [103]
dP ∝ nX� sin θ cos θ(1 − nX� cos� θ)� dθ, (2.84)
where θ is the angle of the ray with the normal to the core-cladding interface and nX is the
refractive index of the core of the fiber. To calculate the effective transmitted power, the
reflectance (R³) for a single reflection is raised to the power of the number of reflections the
specific propagating angle undergoes with the sensor interface. Hence, for p-polarized light, the
generalized expression for the normalized transmitted power in an optical fiber based SPR sensor
will be given as
p&�¦¥ = ¹ R³¡º»¼(½)[nX� sin θ cos θ/(1 − nX� cos� θ)�]¯/�¾¿º dθ¹ [nX� sin θ cos θ/(1 − nX� cos� θ)�]¯/�¾¿º dθ
(2.85)

Theoretical Background of Plasmonics
- 32 -
where
N&ÁÂ(θ) = LD tan θ (2.86)
and
θ�& = sin�X(n�ÄnX ) (2.87)
Here, N&ÁÂ(θ) is the total number of reflections performed by a ray making an angle θ with the
normal to the core–metal layer interface in the sensing region. L and D are the length of the
exposed sensing region and the fiber core diameter respectively, and θ�& is the critical angle of the
fiber and n�Ä is the refractive index of the cladding of the fiber.
2.5.3 Sensitivity and Quality parameter
Resonance wavelength (λ&Á¥) is determined corresponding to the refractive index of the sensing
medium (n¥) in the SPR sensor based on spectral interrogation. If the refractive index of the
sensing medium is altered by δn¥, the resonance wavelength shifts by δλ&Á¥. The sensitivity (S¦)
of a SPR sensor with spectral interrogation is defined as [100]
S¦ = δλ&Á¥δn¥ (2.88)
A quantity that takes into account the sensitivity and the detection accuracy of the sensor is
identified as the of the Γλ-parameter SPR sensor, which is inversely proportional to the width of
the SPR response curve. If δÅ%.Æ is the spectral width of the SPR response curve corresponding to
50% reflectivity, this parameter is defined as
Γ° = δλ&Á¥δÅ%.Æ (2.89)
To denote the overall performance of the sensor, a quality parameter is introduced. If δλ%.Æ is the
spectral width of the SPR response curve corresponding to 50% reflectivity (full-width
at half- maximum of the SPR dip), the quality parameter (χ) is defined as [104]
χ = S¦δλ%.Æ . (2.90)
2.6 Optical Sensing based in Optical Fibers Coupled to SPR
Phenomenum
The importance of surface plasmon resonance fiber optic sensors in the field of chemical,
biological and environmental sensing has notably increased in the last years. Consequently, many
Theoretical Background of Plasmonics
- 33 -
different configurations and analytes have been studied in the literature [59]. However, the
demanding requirements of SPR systems impose the necessity of improving the performance
beyond that of the bulk configurations in order to fully exploit the advantages of optical fibers.
The optical fiber can be an almost ideal platform for surface plasmon resonance, for chemical and
biological sensors, where some measurements have to be made in hazard or difficult to access
places. Optical fiber configurations already demonstrated advantages when compared with other
surface plasmon resonance configurations due to their mechanical flexibility, and the possibility
to transmit optical signals at remote distances.
In an optical fiber the polarization can be TE or TM, although only the TM polarization will excite
the plasmon. The excitation in an optical fiber is not based on the incidence angle of the light, as
in the Otto or Kretschmann-Raether configurations, but by modulation of the intensity or
wavelength of the resonance, i.e., the output signal can be processed taking into account the total
power transmitted through the device, as it is usual with D-type fiber based sensors, or by
analysing the spectral properties of the transmitted signal. To excite efficiently a surface plasmon,
the phase matching condition between a plasmon and a waveguide mode has to be satisfied, which
mathematically amounts to the equality of their modal propagation constants (k�� = kÉ�ÊÁËÌYzÁ,
which corresponds to the equality of their effective refractive indices). In optical fiber SPR
configurations, there is always the need to get near the core in order to allow the electromagnetic
radiation to seep into the metallic layers and external medium. So, the cladding of the optical fiber
must somehow be reduced, to let the evanescent field interact with the external layers [5].
Several configurations have been made to improve the performance of fiber optic SPR sensors
[105]. Some of the most important layouts are related with tapered and tip optrode optical fiber
geometries, coupled to the consideration of different metallic elements. These structures were
studied looking for the maximization of their sensing characteristics, as reported after chapter 3
which is devoted to an outline of interrogation techniques oriented to SPR-based optical fiber
sensors.
3
Interrogation of Plasmonics Sensing Structures
Summary: This chapter presents a worked review of the different techniques to interrogate
plasmonic based sensors, addressing in particular the performance level that can be achieved with
each of the interrogation approaches. These include angular interrogation, spectral interrogation,
intensity interrogation and phase interrogation.
Interrogation of Plasmonics Sensing Structures
- 35 -
3.1 Introduction
The interaction of light wave with surface electrons in metals generating a plasmonic wave can
change the characteristics of the light in terms of amplitude, spectral distribution, phase, and
polarization. Any change in the wave vector of surface plasmon will change any of these
characteristics. Change in the dielectric constant or the refractive index of the dielectric medium
resulting in the change in wave vector of the surface plasmon can be determined by knowing the
changes in one of these properties. This is the principle of surface plasmon resonance (SPR)-based
sensors. On the basis of change in light characteristics, the measurement techniques can be
classified as angular, wavelength, intensity, and phase with their associated interrogations
approaches. Historically, angular interrogation was the first to be widely considered, but later the
others are becoming increasingly appellative, in particular the spectral (wavelength approach)
and phase reading when extremely high sensitivities are on demand.
This chapter reviews different techniques to perform interrogation of SPR-based sensors along
the indicated modulation mechanisms but, in advance, it can already be stated two favourable
characteristics for this type of sensing systems, namely: i) to be supported by optical waveguide
platforms, either fiber optics or planar integrated optics layouts with input/output fibers;
ii) interrogation in the spectral domain to benefit from wavelength encoded operation. As detailed
later, this can be done directly by monitoring the deep of the SPR loss band, which requires a
spectral analyzer or a tunable laser to scan a wavelength range that contains the extreme of the
SPR signature. An indirect approach relies on reading the optical power that propagates through
the sensor in two wavelengths, one in each side of the loss band. This can be achieved using two
lasers, or by illuminating the sensor with broadband light and the spectral interrogation lines be
defined by two FBGs [106]. Previous calibration permits to obtain from these two readings a
parameter only dependent on the spectral position of the SPR loss band and highly sensitive to its
displacement.
The resolution of a SPR sensing head depends not only on its intrinsic sensitivity to the measurand
but also on the performance of the interrogation technique considered. To benefit from the
wavelength encoded characteristics of these sensors the interrogation approach above briefly
outlined or variants shall be adopted. As also indicated, when better resolutions are on demand
this approach can be complemented by the consideration of an additional interrogation technique
which shows better performance. Eventually, the most favorable one would be phase reading,
associated with the fact light that propagates through the sensor at two different locations of the
SPR spectral loss band will experience different phase delays. Therefore, phase interrogation can
be achieved by illuminating the sensor with a laser line with emission in the region of the SPR loss
band where is maximum the slope of phase variation with the measurand induced band spectral

Interrogation of Plasmonics Sensing Structures
- 36 -
shift. Considering SPR can only exist for TM polarization, the TE wave will accumulate a SPR
immune phase delay when propagates through the sensor structure, therefore providing a
reference to the sensing effective TM wave.
In the following sections, each of the main interrogation techniques that have been reported in
the literature to recover the information from plasmonic based optical sensors will be described
and, for that, was considered instructive to refer to the original research published by the pioneers
of these techniques.
3.2 Angular Interrogation
3.2.1 General Considerations and Historical Background
In the attenuated total reflection (ATR) configuration, a transverse magnetic TM polarization light
passes through a prism and reflects at the metal/dielectric interface above the critical angle,
exciting a Surface Plasma Wave (SPW). At certain angles and wavelengths, the energy associated
with the incident radiation will couple with the SPW. The loss of this energy is observed as a dip
in the reflectivity spectrum. The interaction between the analyte and the recognition element
produces a change in the refractive index, which manifests itself as a shift in the SPR dip. Therefore
precise and accurate determination of the minimum in the spectrum is essential in detection of
the analyte. For the case of angular interrogation, the information about the measurand variations
is obtained from the shift in the prism incident angle required to maintain the resonance
condition.
In 1983s, Biedberg and co-workers at Linkoping University (Sweden) reported the first SPR
sensor based on angular interrogation [27]. This sensor can be used in gas detection and was
based on prism configuration. In the early 1990s, an angular modulation based SPR sensor
consisting of a light-emitting diode (LED) and a detector array with imaging optics was introduced
[107]. As shown in figure 3.1, a divergent beam produced by the LED was collimated and focused
by means of a cylindrical lens to produce a wedge-shaped beam of light, which was used to
illuminate a thin gold film on the back of a glass prism containing several sensing areas (channels).
The imaging optics consisted of one imaging and one cylindrical lens ordered in such a way that
the angular spectrum of each sensor channel was projected on separate rows of the array detector
[108]. This design has been adopted by Biacore and resulted in a family of commercial SPR sensors

Interrogation of Plasmonics Sensing Structures
- 37 -
with high performance (resolution down to 1 × 10⁻⁷ RIU) and multiple sensing channels (up to
four).
In 2004, Thirstrup et al. integrated several optical elements into a single sensor chip [109]. In this
approach, the cylindrical focusing optics utilized to create a beam of a desired angular span was
replaced by a diffraction grating of a special design incorporated into the sensing element [110,
111]. A wide parallel light beam was diffracted by the focusing grating and focused into a small
spot on the SPR measuring surface. The reflected light followed a similar path, producing a parallel
beam with an angular spectrum superimposed across the beam. A two dimensional photodetector
was used to measure the angular spectrum of the reflected light for several parallel channels. This
design offered a compact SPR platform with a resolution of about 5 × 10⁻⁷ RIU [111]. In 2006, Hong
et al. presented self-constructed angular interrogation based SPR sensor that can be used as an
immunosensor enough to analyse the antigen–antibody interaction [112]. An angular
interrogation-based SPR sensor was constructed with the Kretschmann–Raether geometry of the
attenuated total reflection method, as shown in figure 3.2(a), the light source used was a laser
diode with a fixed wavelength of 635 nm and a bandwidth of ≈5 nm. A polarizer was positioned
in front of the incident light to obtain the transverse magnetic polarized light. This procedure
preceded the making of a wedge-shaped beam of light by way of a planocylindrical glass lens. The
light passing through the planocylindrical glass lens was focused onto the fused silica prism
combined with a protein chip. The reflected wedge-shaped beam of light from the protein chip
was projected onto a one-dimensional CCD detector. The range of the measurable angle in this
configuration was approximately 6°. Figure 3.2(b) shows SPR spectra for different thicknesses of
Au films on the glass substrates as a function of the incidence angle. The detection limit of the
minimal refractive index variation was calculated to be 1.4 × 10⁻⁴ RIU.
Figure 3.1 - The configuration of SPR sensor based on angular modulation [107].

Interrogation of Plasmonics Sensing Structures
- 38 -
3.2.2 Principle of the Technique
For a prism of fixed refractive index and fixed wavelength of the light source, the resonance
condition is satisfied at a particular angle of incidence called resonance angle (θ&Á¥). At resonance,
the transfer of energy of incident light to surface plasmons takes place resulting in the reduction
in the intensity of the reflected light. In a sensing device based on the prism and angular
interrogation method, the intensity of the reflected light is measured as a function of angle of
incidence θ for fixed values of frequency, metal layer thickness, and dielectric constant of the
sensing medium. At resonance angle, a sharp dip is observed due to an efficient transfer of energy
to surface plasmons as shown in figure 3.3.
Figure 3.2 - (a) Schematic diagram of the wedge-shaped beam type angular interrogation-based SPR sensor.
(b) SPR spectra obtained from the various thicknesses of Au films on the glass substrates as a function of the
incidence angle [112].
Figure 3.3 - A typical SPR curve in angular interrogation. At certain angles and wavelengths, the energy associated
with the incident radiation will couple with the SPW. The loss of this energy is observed as a dip in the reflectivity.
Interrogation of Plasmonics Sensing Structures
- 39 -
The plot can also be obtained with the help of Fresnel’s equations for the three-layer system. For
a given frequency of the light source and the dielectric constant of the metal film, one can
determine the dielectric constant (εz) of the dielectric medium by using resonance condition
(Equation 2.71), if the value of the resonance angle (θ&Á¥) determined experimentally is
substituted. The resonance angle is very sensitive to the variation in the refractive index of the
dielectric medium. If the refractive index of the dielectric medium is changed, the resonance angle
will change accordingly. A graph between the resonance angle and the refractive index of the
dielectric medium serves as the calibration curve of the sensor. Any increase in the refractive
index of the dielectric medium increases the resonance angle.
3.2.3 Performance of the Technique
Sensitivity of an SPR sensor based on angular interrogation depends on how much the resonance
angle shifts with a change in the refractive index of the sensing layer. If the shift is large, the
sensitivity is large. Figure 3.4 shows a plot of reflectance as a function of angle of incidence of the
light beam for sensing layer with refractive indices nz and nz + δnz. Increase in the refractive
index by δnz shifts the resonance curve by δθ&Á¥ angle. The sensitivity of an SPR sensor with
angular interrogation is defined as [113]
S¦ = δθ&Á¥δnz (3.1)
The detection accuracy of an SPR sensor depends on how accurately and precisely the sensor can
detect the resonance angle and hence the refractive index of the sensing layer.
Apart from the resolution of the angle-measuring device, the accuracy of the detection of
resonance angle depends on the width of the SPR curve. The narrower the SPR curve, the higher
is the detection accuracy. Therefore, if δθ%.Æ is the angular width of the SPR response curve
corresponding to 50% reflectance, the detection accuracy of the sensor can be assumed to be
inversely proportional to δθ%.Æ. A quantity that takes into account the sensitivity and the detection
accuracy of the sensor is identified as the Γθ-parameter SPR sensor defined as [113]
Γ¾ = §¾º»Í§¾q.Î . (3.2)

Interrogation of Plasmonics Sensing Structures
- 40 -
It has been shown that modern SPR sensing systems based on the angular interrogation are
capable of an angular sensitivity of 140 degrees/RIU and a resolution of 5 × 10⁻⁷ RIU [111].
3.3 Wavelength Interrogation
3.3.1 General Considerations and Historical Background
In SPR sensors with wavelength modulation, a surface plasmon is excited by a collimated light
wave containing multiple wavelengths, typically a beam of polychromatic light. The excitation of
surface plasmons is observed as a dip in the wavelength spectrum of reflected light. The
wavelength yielding the strongest coupling is measured and used as a sensor output.
An SPR sensor with wavelength modulation and parallel channel architecture was reported in
2002 by Homola’s group [114]. In this sensor, which is shown in figure 3.5, a polychromatic light
from a halogen lamp was collimated into a large-diameter parallel beam, which was launched in
a prism coupler. The light reflected from different sensing channels was collected by different
output collimators coupled and transmitted to different inputs of a spectrograph. The SPR sensor
of this design was demonstrated to be able to resolve refractive index changes down to 2 × 10⁻⁷
RIU [115].
Figure 3.4 - SPR curves for different refractive indices of the sensing medium in the cases of angular interrogation.
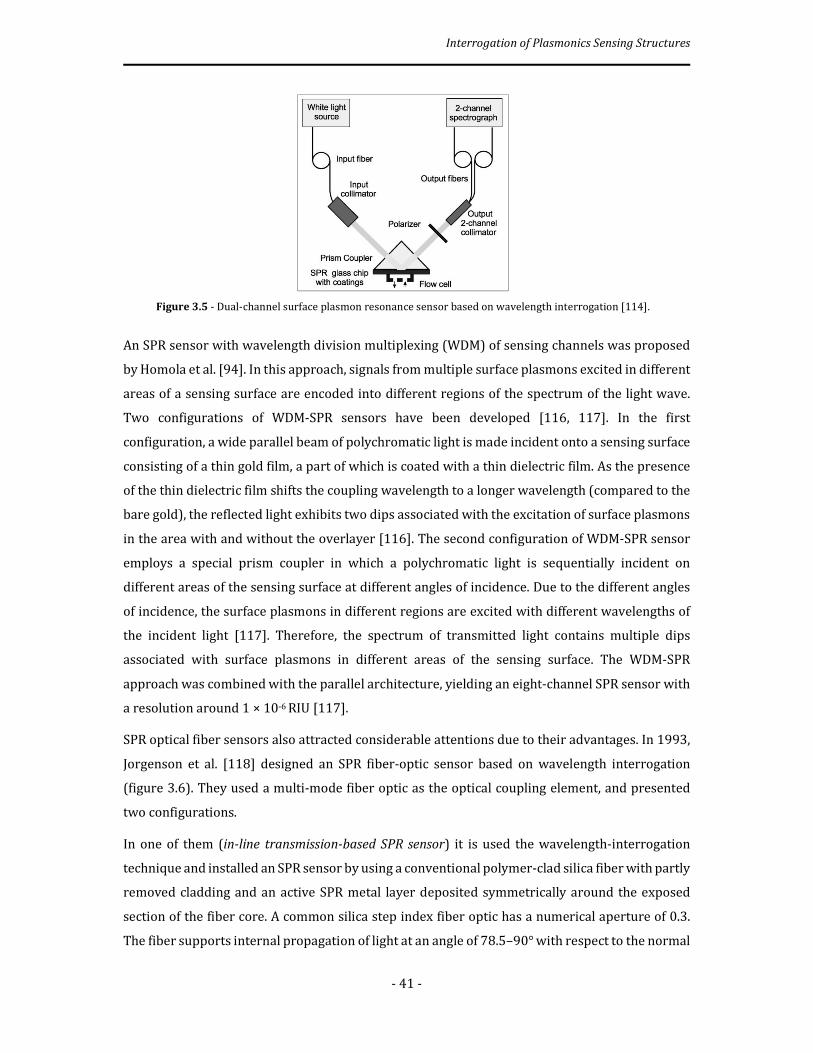
Interrogation of Plasmonics Sensing Structures
- 41 -
An SPR sensor with wavelength division multiplexing (WDM) of sensing channels was proposed
by Homola et al. [94]. In this approach, signals from multiple surface plasmons excited in different
areas of a sensing surface are encoded into different regions of the spectrum of the light wave.
Two configurations of WDM-SPR sensors have been developed [116, 117]. In the first
configuration, a wide parallel beam of polychromatic light is made incident onto a sensing surface
consisting of a thin gold film, a part of which is coated with a thin dielectric film. As the presence
of the thin dielectric film shifts the coupling wavelength to a longer wavelength (compared to the
bare gold), the reflected light exhibits two dips associated with the excitation of surface plasmons
in the area with and without the overlayer [116]. The second configuration of WDM-SPR sensor
employs a special prism coupler in which a polychromatic light is sequentially incident on
different areas of the sensing surface at different angles of incidence. Due to the different angles
of incidence, the surface plasmons in different regions are excited with different wavelengths of
the incident light [117]. Therefore, the spectrum of transmitted light contains multiple dips
associated with surface plasmons in different areas of the sensing surface. The WDM-SPR
approach was combined with the parallel architecture, yielding an eight-channel SPR sensor with
a resolution around 1 × 10⁻⁶ RIU [117].
SPR optical fiber sensors also attracted considerable attentions due to their advantages. In 1993,
Jorgenson et al. [118] designed an SPR fiber-optic sensor based on wavelength interrogation
(figure 3.6). They used a multi-mode fiber optic as the optical coupling element, and presented
two configurations.
In one of them (in-line transmission-based SPR sensor) it is used the wavelength-interrogation
technique and installed an SPR sensor by using a conventional polymer-clad silica fiber with partly
removed cladding and an active SPR metal layer deposited symmetrically around the exposed
section of the fiber core. A common silica step index fiber optic has a numerical aperture of 0.3.
The fiber supports internal propagation of light at an angle of 78.5–90° with respect to the normal
Figure 3.5 - Dual-channel surface plasmon resonance sensor based on wavelength interrogation [114].
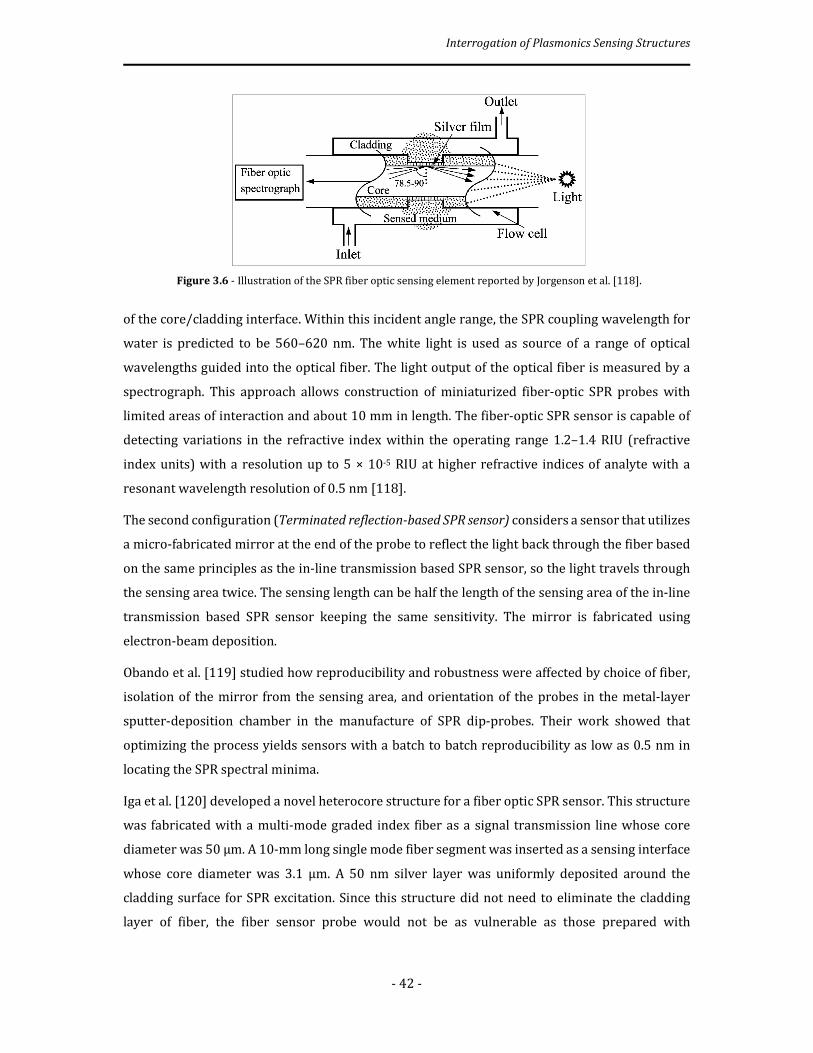
Interrogation of Plasmonics Sensing Structures
- 42 -
of the core/cladding interface. Within this incident angle range, the SPR coupling wavelength for
water is predicted to be 560–620 nm. The white light is used as source of a range of optical
wavelengths guided into the optical fiber. The light output of the optical fiber is measured by a
spectrograph. This approach allows construction of miniaturized fiber-optic SPR probes with
limited areas of interaction and about 10 mm in length. The fiber-optic SPR sensor is capable of
detecting variations in the refractive index within the operating range 1.2–1.4 RIU (refractive
index units) with a resolution up to 5 × 10⁻⁵ RIU at higher refractive indices of analyte with a
resonant wavelength resolution of 0.5 nm [118].
The second configuration (Terminated reflection-based SPR sensor) considers a sensor that utilizes
a micro-fabricated mirror at the end of the probe to reflect the light back through the fiber based
on the same principles as the in-line transmission based SPR sensor, so the light travels through
the sensing area twice. The sensing length can be half the length of the sensing area of the in-line
transmission based SPR sensor keeping the same sensitivity. The mirror is fabricated using
electron-beam deposition.
Obando et al. [119] studied how reproducibility and robustness were affected by choice of fiber,
isolation of the mirror from the sensing area, and orientation of the probes in the metal-layer
sputter-deposition chamber in the manufacture of SPR dip-probes. Their work showed that
optimizing the process yields sensors with a batch to batch reproducibility as low as 0.5 nm in
locating the SPR spectral minima.
Iga et al. [120] developed a novel heterocore structure for a fiber optic SPR sensor. This structure
was fabricated with a multi-mode graded index fiber as a signal transmission line whose core
diameter was 50 µm. A 10-mm long single mode fiber segment was inserted as a sensing interface
whose core diameter was 3.1 µm. A 50 nm silver layer was uniformly deposited around the
cladding surface for SPR excitation. Since this structure did not need to eliminate the cladding
layer of fiber, the fiber sensor probe would not be as vulnerable as those prepared with
Figure 3.6 - Illustration of the SPR fiber optic sensing element reported by Jorgenson et al. [118].

Interrogation of Plasmonics Sensing Structures
- 43 -
conventional techniques. Using this SPR sensor, resolutions were obtained with values of
2.1 × 10- 4 and 1.5 × 10⁻⁴ at refractive indices of 1.333 and 1.398, respectively.
Most recently, Zhao et al. [121] studied the potential for the modulation of SPR resonance
wavelength with a multi-layer structure. The multi-layer modulation technique used in their
sensor was confirmed to enhance the sensitivity of the SPR optical fiber sensor by adjusting the
SPR resonant wavelength. In this study, the sputtering processed deposited 20nm of TiO2, 11nm
of SiO2 and 30 nm of gold film on the material surface to change the refractive index. For operation
in the refractive index regions of 1.32 and 1.36, the sensitivities in wavelength interrogation of
the SPR optical fiber with the single gold thin film and multi-layers modulation were 1.08 × 10⁻⁵
RIU and 1.74 × 10⁻⁶ RIU, respectively.
3.3.2 Principle of the Technique
In the aforementioned method, the wavelength of the excitation light is kept constant, while the
angle of incidence is varied. If the angle of incidence is kept constant and the excitation light source
is polychromatic, then (2.77) will be satisfied at one particular wavelength of the light source
where the maximum transfer of energy from the source to the surface plasmon wave will take
place. This particular wavelength is called the resonance wavelength (λres) and the method is
called wavelength interrogation. As shown in figure 3.7, at resonance wavelength, a sharp dip is
observed due to an efficient transfer of energy to surface plasmons. Wavelength interrogation is
mostly used in optical fiber–based SPR sensors where all the guided rays are launched and the
light source used is polychromatic.
Figure 3.7 - A typical SPR curve in wavelength interrogation. At certain wavelength and angle, the energy associated
with the incident radiation will couple with the SPW which is observed as a dip in the reflectivity.

Interrogation of Plasmonics Sensing Structures
- 44 -
3.3.3 Performance of the Technique
SPR sensing based on wavelength interrogation depends on shift of resonance wavelength when
refractive index of sensing medium is changed. Figure 3.8 shows a plot of reflectance as a function
of resonance wavelength for sensing layer with refractive indices nz and nz + δnz. Increase in the
refractive index by δnz shifts the resonance curve by δλ&Á¥. Following the same approach
explained in the prior section about angular interrogation, the sensitivity of an SPR sensor with
wavelength interrogation is defined as
S¦ = δÅ&Á¥δnz (3.3)
while Γλ-parameter referenced to wavelength is established as
ΓÏ ≡ δÅ&Á¥δÅ%.Æ (3.4)
SPR sensors based on wavelength modulation that have been employed include prism [114],
optical fibers [121], and grating [122] based approaches. In section 3.3.1, were presented
examples of the performance of the SPR sensors under wavelength interrogation. It could be seen
that sensors based on a multi-layer modulation technique, as reported by Zhao et al. [121], offer
better sensitivities. Indeed, sensitivities under wavelength interrogation improved from 1.08 ×
10-5 RIU when considering an optical fiber with a single gold thin film to 1.74 × 10⁻⁶ RIU when a
multi-layers was considered.
Figure 3.8 - SPR curves for different refractive indices of the sensing medium in the cases of wavelength
interrogation.
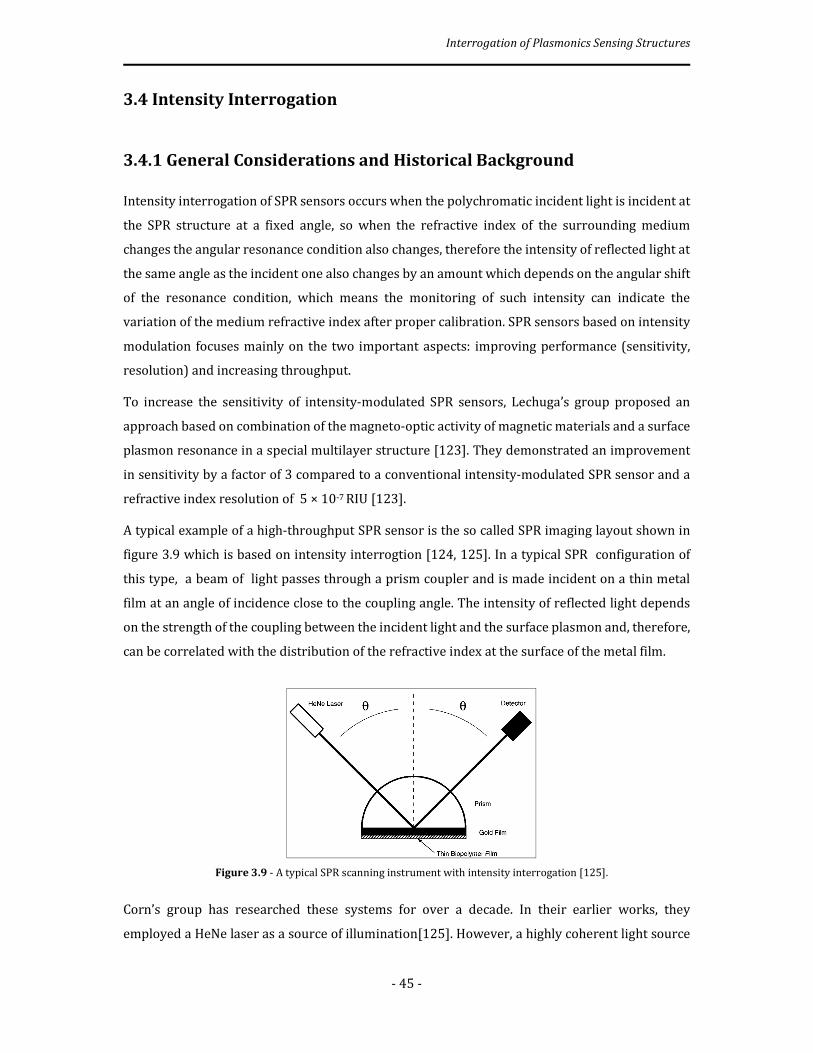
Interrogation of Plasmonics Sensing Structures
- 45 -
3.4 Intensity Interrogation
3.4.1 General Considerations and Historical Background
Intensity interrogation of SPR sensors occurs when the polychromatic incident light is incident at
the SPR structure at a fixed angle, so when the refractive index of the surrounding medium
changes the angular resonance condition also changes, therefore the intensity of reflected light at
the same angle as the incident one also changes by an amount which depends on the angular shift
of the resonance condition, which means the monitoring of such intensity can indicate the
variation of the medium refractive index after proper calibration. SPR sensors based on intensity
modulation focuses mainly on the two important aspects: improving performance (sensitivity,
resolution) and increasing throughput.
To increase the sensitivity of intensity-modulated SPR sensors, Lechuga’s group proposed an
approach based on combination of the magneto-optic activity of magnetic materials and a surface
plasmon resonance in a special multilayer structure [123]. They demonstrated an improvement
in sensitivity by a factor of 3 compared to a conventional intensity-modulated SPR sensor and a
refractive index resolution of 5 × 10⁻⁷ RIU [123].
A typical example of a high-throughput SPR sensor is the so called SPR imaging layout shown in
figure 3.9 which is based on intensity interrogtion [124, 125]. In a typical SPR configuration of
this type, a beam of light passes through a prism coupler and is made incident on a thin metal
film at an angle of incidence close to the coupling angle. The intensity of reflected light depends
on the strength of the coupling between the incident light and the surface plasmon and, therefore,
can be correlated with the distribution of the refractive index at the surface of the metal film.
Corn’s group has researched these systems for over a decade. In their earlier works, they
employed a HeNe laser as a source of illumination[125]. However, a highly coherent light source
Figure 3.9 - A typical SPR scanning instrument with intensity interrogation [125].
Interrogation of Plasmonics Sensing Structures
- 46 -
generated images with parasitic interference patterns that were disturbing SPR measurements.
In 1997 they improved their SPR instrument by introducing an incoherent light source and a near-
infrared (NIR) narrow band-pass filter [126]. Using this approach, they detected hybridization of
short (18-base) oligonucleotides at concentrations as low as 10 nM [127] (this was estimated to
correspond to a refractive index resolution in the 10-5 RIU range). The use of a white light source
and a band pass filter was also advocated by Yager’s group[128]. They demonstrated that by
tilting the interference filter, an operating wavelength of the SPR imaging sensor can be tuned
[128]. Later they demonstrated that their SPR imaging instrument operating at a wavelength of
853 nm can provide a refractive index resolution of 3 × 10⁻⁵ RIU [129]. In 2005, Corn’s group
reported SPR sensing with a special multilayer structure supporting long-range surface plasmons;
however, the use of long-range surface plasmons led only to minor sensitivity improvements of
20% (experiment) and 40% (theory) compared to the conventional SPR layout [130].
A dual-wavelength SPR system was reported by Zybin et al. [131]. In their SPR sensor, they used
two sequentially switched-on laser diodes, and the intensities of the reflected light at the two
different wavelengths were measured and the sensor output was defined as the difference of these
two signals. A refractive index resolution of 2 × 10⁻⁶ RIU was achieved when the signal was
averaged over a large beam diameter (6 mm2).
Campbell’s group reported an SPR imaging system with a controllable angle of incidence [132,
133]. This feature allows SPR patterns to be acquired sequentially at different angles of incidence
and selection of the optimum angle of incidence for the SPR measurements. With a HeNe laser as
a source of light, their sensor was able to measure simultaneously in 120 sensing channels with a
refractive index resolution of 2 × 10⁻⁵ RIU. Recently, they claimed an improvement in sensor
resolution down to 5 × 10⁻⁶ RIU [134].
Recently, Piliarik et al. investigated SPR sensing with an elliptically polarized light [135] and
concluded that a change in the polarization of light induced by the coupling of light to a surface
plasmon can be exploited to significantly improve the sensitivity and operating range of these SPR
sensors. In addition, this approach, provides high-contrast SPR patterns (with a low background),
which are well suited for automated analysis.
Homola’s group developed an SPR sensing approach based on polarization contrast and excitation
of surface plasmons on spatially patterned multilayers [136]. In this configuration, as illustrated
in figure 3.10, a prism coupler with an SPR chip containing a spatially patterned multilayer
structure was placed between two crossed polarizers. The output polarizer blocked all of the light
reflected from the (inactive) areas outside the sensing areas, generating high-contrast patterns.
Two types of SPR multilayers with opposite sensitivities to refractive index were employed, and
the output signal was defined as a ratio of the intensities generated from the two neighboring
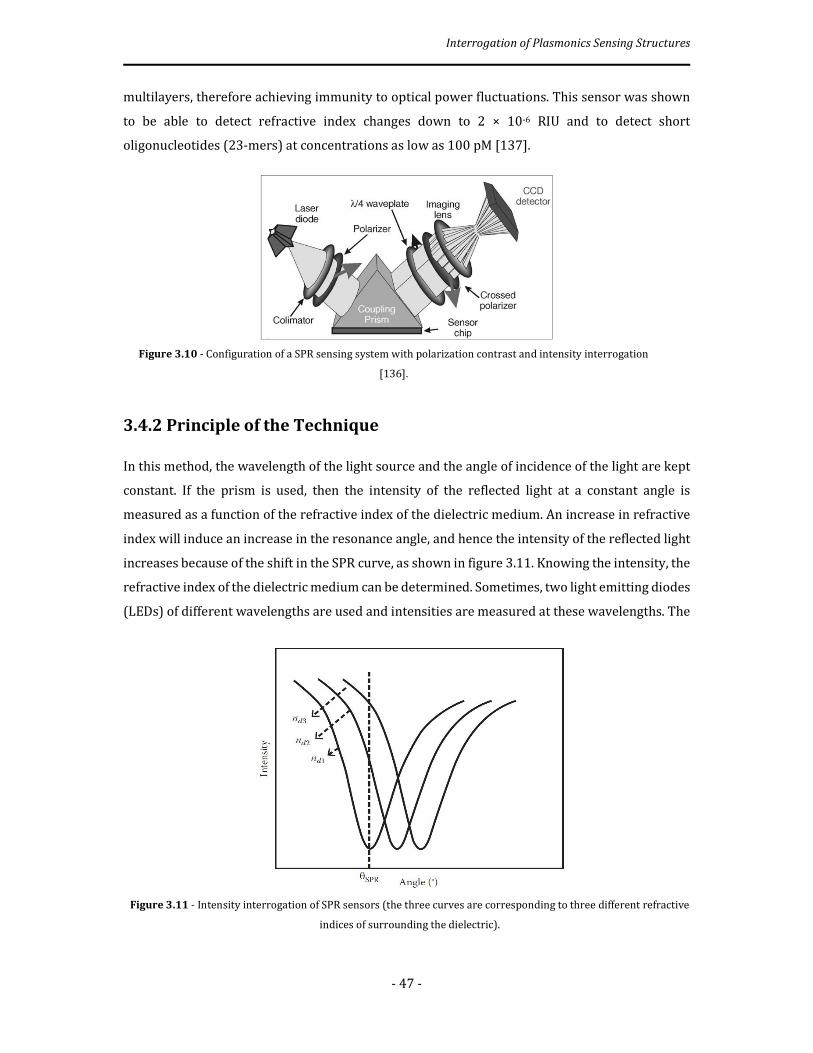
Interrogation of Plasmonics Sensing Structures
- 47 -
multilayers, therefore achieving immunity to optical power fluctuations. This sensor was shown
to be able to detect refractive index changes down to 2 × 10⁻⁶ RIU and to detect short
oligonucleotides (23-mers) at concentrations as low as 100 pM [137].
3.4.2 Principle of the Technique
In this method, the wavelength of the light source and the angle of incidence of the light are kept
constant. If the prism is used, then the intensity of the reflected light at a constant angle is
measured as a function of the refractive index of the dielectric medium. An increase in refractive
index will induce an increase in the resonance angle, and hence the intensity of the reflected light
increases because of the shift in the SPR curve, as shown in figure 3.11. Knowing the intensity, the
refractive index of the dielectric medium can be determined. Sometimes, two light emitting diodes
(LEDs) of different wavelengths are used and intensities are measured at these wavelengths. The
Figure 3.10 - Configuration of a SPR sensing system with polarization contrast and intensity interrogation
[136].
Figure 3.11 - Intensity interrogation of SPR sensors (the three curves are corresponding to three different refractive
indices of surrounding the dielectric).

Interrogation of Plasmonics Sensing Structures
- 48 -
knowledge of change in differential intensities is used to determine the change in the dielectric
constant of the medium.
3.4.3 Performance of the Technique
Different from the conventional optical setup performing angular interrogation, the laser and
detection system are fixed but the incident angle can be changed through the employment of a
paired off-axis parabolic mirrors and a set of rectangular mirrors. For the detection of intensity,
first incident angle alters to obtain the SPR curve and then calculated the first-order
differentiation of the original SPR curve. After that, the rectangular mirror moves to the
corresponding position where the maximum slope happens. Subsequently, changes in the
refractive index of the medium (^�) originates angular displacement of the SPR curve, therefore
a variation of the intensity level, I, incident on the photodetector. The sensitivity of the sensor is
defined as
S = δÑδ^� (3.5)
As shown in the prior section, the performance of the sensor reported by Homola’s group has the
highest sensitivity when compared with other sensing configurations based on intensity
interrogation. This approach presented herein offers considerably enhanced sensitivity than the
competing multichannel SPR sensing platforms and allows measuring changes in the refractive
index as small as 2 × 10⁻⁶ RIU [137].
3.5 Phase Interrogation
3.5.1 General Considerations and Historical Background
Around the year 2000, the research group of Nikitin demonstrated two SPR sensor platforms
based on interferometry [138, 139]. The first approach was based on the interference of the TM
polarized signal beam with the TE-polarized reference beam [138], whereas the second method
was based on a Mach-Zehnder interferometer combining TM polarized signal and reference
beams, as shown in figure 3.12 [139]. This configuration was demonstrated in two modes: (a)
phase contrast, which increases the sensor sensitivity and (b) “fringe mode”, where there was a
definite angle between the interfering beams and a pattern of interference fringes was
superimposed on the image of the surface. Local variations in the phase of the signal beam
resulted in bending and moving of the interference fringes. The reported refractive index
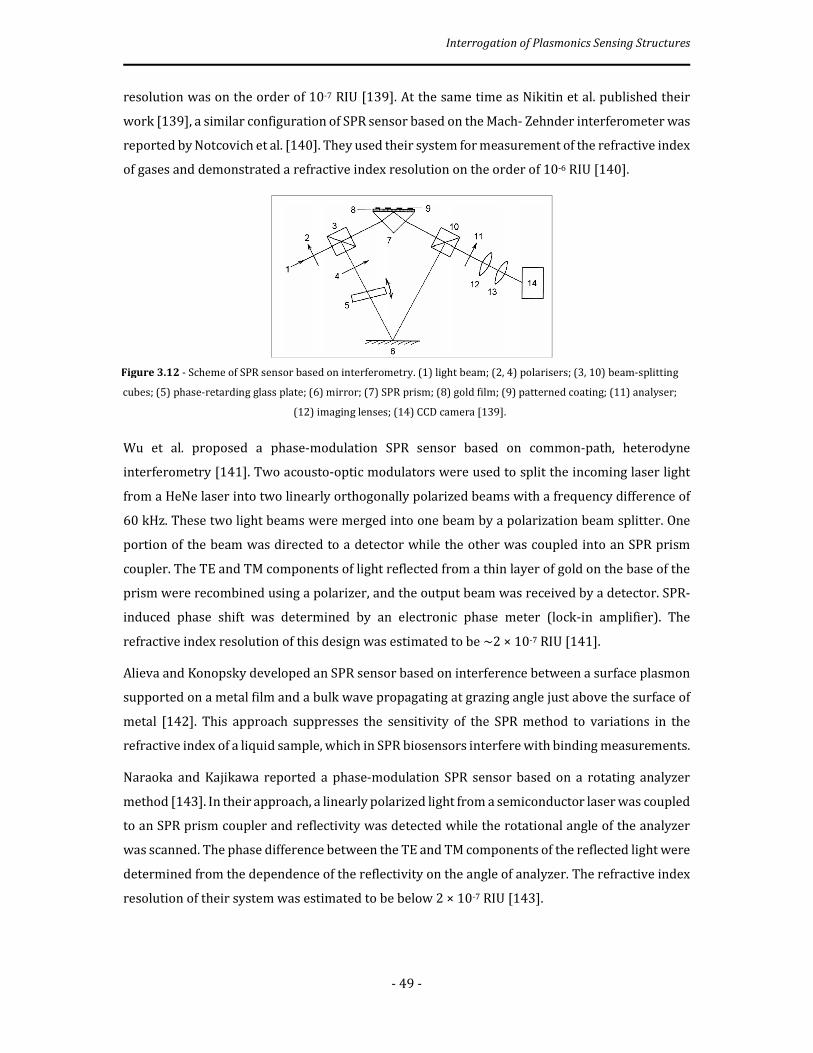
Interrogation of Plasmonics Sensing Structures
- 49 -
resolution was on the order of 10-7 RIU [139]. At the same time as Nikitin et al. published their
work [139], a similar configuration of SPR sensor based on the Mach- Zehnder interferometer was
reported by Notcovich et al. [140]. They used their system for measurement of the refractive index
of gases and demonstrated a refractive index resolution on the order of 10-6 RIU [140].
Wu et al. proposed a phase-modulation SPR sensor based on common-path, heterodyne
interferometry [141]. Two acousto-optic modulators were used to split the incoming laser light
from a HeNe laser into two linearly orthogonally polarized beams with a frequency difference of
60 kHz. These two light beams were merged into one beam by a polarization beam splitter. One
portion of the beam was directed to a detector while the other was coupled into an SPR prism
coupler. The TE and TM components of light reflected from a thin layer of gold on the base of the
prism were recombined using a polarizer, and the output beam was received by a detector. SPR-
induced phase shift was determined by an electronic phase meter (lock-in amplifier). The
refractive index resolution of this design was estimated to be ~2 × 10⁻⁷ RIU [141].
Alieva and Konopsky developed an SPR sensor based on interference between a surface plasmon
supported on a metal film and a bulk wave propagating at grazing angle just above the surface of
metal [142]. This approach suppresses the sensitivity of the SPR method to variations in the
refractive index of a liquid sample, which in SPR biosensors interfere with binding measurements.
Naraoka and Kajikawa reported a phase-modulation SPR sensor based on a rotating analyzer
method [143]. In their approach, a linearly polarized light from a semiconductor laser was coupled
to an SPR prism coupler and reflectivity was detected while the rotational angle of the analyzer
was scanned. The phase difference between the TE and TM components of the reflected light were
determined from the dependence of the reflectivity on the angle of analyzer. The refractive index
resolution of their system was estimated to be below 2 × 10⁻⁷ RIU [143].
Figure 3.12 - Scheme of SPR sensor based on interferometry. (1) light beam; (2, 4) polarisers; (3, 10) beam-splitting
cubes; (5) phase-retarding glass plate; (6) mirror; (7) SPR prism; (8) gold film; (9) patterned coating; (11) analyser;
(12) imaging lenses; (14) CCD camera [139].

Interrogation of Plasmonics Sensing Structures
- 50 -
In recent years, SPR sensors with phase modulation have been extensively studied by the
researchers at the Chinese University of Hong Kong and City University of Hong Kong. In 2002 Ho
et al. reported an SPR sensor based on the Mach-Zehnder interferometer [144]. In that work, as
shown in figure 3.13, an optical beam from an unpolarized HeNe laser passed through a prism
coupler and the TM polarized component of the beam excited surface plasmons in two parallel
sensing channels, one filled with a sample and the other with a reference solution. TE and TM
polarization components of the output beam were split by a polarizing beam splitter. The optical
path for TE polarization was modulated by means of a piezoelectric actuator. Finally, TM
polarization was converted to TE polarization by a half-waveplate, and the two beams were
recombined. The shift between the interference patterns for the measuring and reference sensing
channels was measured. Resolution of this sensor was estimated to be about 3 × 10⁻⁶ RIU [144].
An alternative configuration of an SPR sensor with phase modulation was reported by Wu et al. in
2004 [145]. In this configuration, one Mach-Zehnder interferometer performed independent
interference of TE and TM polarized components of a signal beam emerging from a prism coupler
and a reference beam. Subsequently, the output TE and TM beams were separated in a Wollaston
prism and directed to two separate detectors. A piezoelectric actuator modulated the optical path
in a reference arm of the interferometer, producing a periodic intensity modulation in both TE
and TM polarizations. The interference patterns for TE and TM polarizations were processed to
reduce the noise and compensate for instabilities in the setup [146], with the sensor output
determined as a mutual shift of the two patterns. Resolution of the sensor was estimated to be
5.5 × 10⁻⁸ RIU [145].
Another SPR sensor based on measuring the phase difference between TE and TM polarization
components of light beam was reported by Ho et al. [147]. They used a single beam and a
photoelastic phase modulator to introduce a carrier frequency so that the phase can be
Figure 3.13 - Scheme of SPR sensor based on a Mach-Zehnder interferometer [144].

Interrogation of Plasmonics Sensing Structures
- 51 -
determined by measuring the relative amplitude of the first harmonic signal. Resolution of the
sensor was determined to be ~1.2 × 10⁻⁶ RIU [147]. In 2007, a phase modulation-based SPR sensor
employing a Michelson interferometer was reported by Yuan et al. [148]. They used a Michelson
interferometer with an SPR prism coupler inserted in one arm of the interferometer. This
arrangement allows the TM polarized component of the light beam to incur a 2-fold phase shift
compared with that in the Mach-Zehnder interferometer. Therefore, the sensitivity of the
Michelson interferometer-based SPR sensor was twice as high as that of the SPR sensor with the
Mach-Zehnder configuration. This improvement was demonstrated in a single experimental
system incorporating both Michelson and Mach-Zehnder interferometers in which the refractive
index resolutions were established to be 7.7 × 10⁻⁷ and 1.5 × 10⁻⁶ RIU, respectively [148].
In 2008, the highest refractive index resolution of 2.8 × 10⁻⁹ RIU was reported by Li and coworkers
[149]. Comparing to the previously reported heterodyne-based SPR sensor [150], where phase
was measured by the lock-in technique, active adjustment was employed by Li to equalize the
amplitude of the reference and signal beams and the differential phase between them is
subsequently retrieved by the amplitude modulation (AM) method which also helps to realize
real-time measurement. The equalization of signal and reference beam amplitudes, as well as the
common path setup in optical heterodyne technique, has helped to eliminate noise from laser
intensity fluctuation and resulted in ultra-high resolution. In their experiment, apparent phase
change was observable by adding 0.00001% sucrose to pure water, which corresponding to
refractive index change of 1.4 × 10⁻⁸ RIU. As the signal magnitude is about 5 times of the noise
level, the resolution of the device has been determined to be 2.8 × 10⁻⁹ RIU. Experiments
conducted on glycerin water solution revealed a similar resolution of 7 × 10⁻⁹ RIU, while that on
interaction between mouse-IgG/antimouse-IgG resulted in a sensitivity of 10 fg/mL (67 aM),
which seems to be the highest ever achieved by SPR sensor.
3.5.2 Principle of the Technique
In this method, the phase difference between TM and TE polarized light in the reflection spectrum
for a monochromatic light source is measured as a function of the refractive index of outer
medium. It was determined that around the resonance angle, the variation in intensity of the
reflected light is small when the refractive index changes, so the sensitivity is poor. The same does
not happen if the parameter to be monitored turns out to be the phase difference between the p-

Interrogation of Plasmonics Sensing Structures
- 52 -
and s-components of the reflected light, as shown in figure 3.14, actually the other way around,
i.e., it is the region of maximum phase sensitivity.
3.5.3 Performance of the Technique
Phase interrogation can be achieved by illuminating the sensor with a laser line with emission in
the region of the SPR loss band where the slope of phase variation with the measurand induced
band spectral shift has its maximum value. Considering that only the TM polarization component
can couple to surface-plasmons and give rise to SPR, the TE wave will accumulate a SPR immune
phase delay when propagating through the sensor structure, therefore providing a reference level
to the sensing effective TM wave.
A possible classification for this interrogation approach is based on the way of generating these
waves. When using a polarizer to obtain, from a single optical source, the TE and TM components
which are made to interfere on the photodetector, the process is known as polarimetric
interrogation. In the case where the TE and TM waves are provided by two distinct light sources
with slightly different optical frequencies and are made to interfere resulting into a beat signal
with frequency low enough to be resolved by the photodetection and amplification electronics,
heterodyne interrogation is applied. Finally, if the reference wave propagates along a different
spatial path and brought to interfere with the TM light on the photodetector, the approach is
usually known as interference interrogation (though all the three processes rely on interference
phenomena).
Phase interrogation has not been widely explored in the context of SPR sensors. Surely, it is more
complex to implement, requiring more know-how on optical components, modulation
Figure 3.14 – Typical angular SPR curve (left) and the phase difference between the p- and s-components of the
reflected light (right).
Interrogation of Plasmonics Sensing Structures
- 53 -
instruments and signal processing techniques, but eventually the main reason is the circumstance
that most of the R&D community which has been working until recently in SPR sensing had a
biochemical background, therefore with a tendency to use in their research spectroscopic
equipment. This is going to change since plasmonics is now moving to fields other than sensing,
such as imaging and data storage, bringing to the subject researchers with diverse backgrounds.
A consequence of this dynamics is an improvement of the resolution values obtained for each of
the three described phase reading approaches.
Following the approach outlined for the interrogation techniques described before, the sensitivity
of SPR sensors relying on phase interrogation is defined as
SÒ = δÓÔ�Õδ^z (3.6)
where ÓÔ�Õ is the phase difference between the p and s components of the reflected light.
As outlined in previous section, for the case of interferometric (heterodyne) interrogation, a value
of 2.8 × 10⁻⁹ RIU was reported in 2008 [149], apparently the highest refractive index resolution
obtained to this date; when considering interferometric (polarimetric) interrogation, under
optimized conditions, it was obtained a resolution of 3.7 × 10⁻⁸ RIU [151]; for interferometric
interrogation, a resolution down to 2.2 × 10⁻⁷ RIU was reported in 2011 [152].
3.6 Conclusion
To conclude this chapter, it may be useful to have a summary of the state-of-the-art concerning
the interrogation of SPR sensors for refractive index measurement, as well as to add some
comments addressing the implementation of these sensors with optical fiber support.
Most of this research was performed with classical sensing heads based on a prism coupling
system in a Kretschmann configuration. The SPR induced phase change would be greatly
amplified if the light undergoes multiple attenuated total reflections, as happens when the sensing
platform is the optical fiber. This advantage is attenuated due to the propagation characteristics
of the fiber. If it is multimode, each mode generates its own resonance dip at a specific wavelength,
different from the other modes, resulting into a broadening of the full SPR resonance, factor that
decreases the phase sensitivity (as well as the sensitivity expectable from the different
interrogation approaches indicated in table 3.1). On the other hand, if in the sensing head a
standard monomode fiber is considered, its small numerical aperture limits the incident angles
from approximately 86.5 to 89.5 degrees (in the simplified picture of geometric optics), which is
far from the critical angle, meaning a reduced phase shift occurs in each reflection.
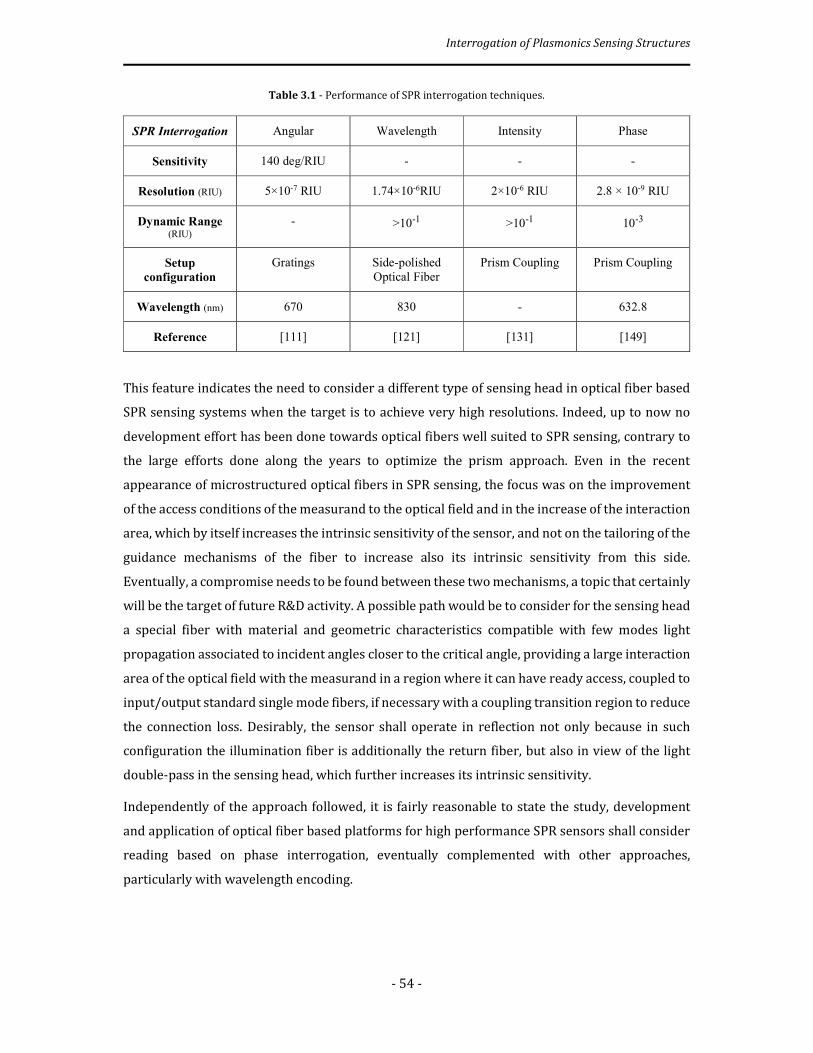
Interrogation of Plasmonics Sensing Structures
- 54 -
Table 3.1 - Performance of SPR interrogation techniques.
SPR Interrogation Angular Wavelength Intensity Phase
Sensitivity 140 deg/RIU - - -
Resolution (RIU) 5×10⁻⁷ RIU 1.74×10⁻⁶RIU 2×10⁻⁶ RIU 2.8 × 10⁻⁹ RIU
Dynamic Range (RIU)
- >10-1 >10-1 10-3
Setup
configuration
Gratings Side-polished
Optical Fiber
Prism Coupling Prism Coupling
Wavelength (nm) 670 830 - 632.8
Reference [111] [121] [131] [149]
This feature indicates the need to consider a different type of sensing head in optical fiber based
SPR sensing systems when the target is to achieve very high resolutions. Indeed, up to now no
development effort has been done towards optical fibers well suited to SPR sensing, contrary to
the large efforts done along the years to optimize the prism approach. Even in the recent
appearance of microstructured optical fibers in SPR sensing, the focus was on the improvement
of the access conditions of the measurand to the optical field and in the increase of the interaction
area, which by itself increases the intrinsic sensitivity of the sensor, and not on the tailoring of the
guidance mechanisms of the fiber to increase also its intrinsic sensitivity from this side.
Eventually, a compromise needs to be found between these two mechanisms, a topic that certainly
will be the target of future R&D activity. A possible path would be to consider for the sensing head
a special fiber with material and geometric characteristics compatible with few modes light
propagation associated to incident angles closer to the critical angle, providing a large interaction
area of the optical field with the measurand in a region where it can have ready access, coupled to
input/output standard single mode fibers, if necessary with a coupling transition region to reduce
the connection loss. Desirably, the sensor shall operate in reflection not only because in such
configuration the illumination fiber is additionally the return fiber, but also in view of the light
double-pass in the sensing head, which further increases its intrinsic sensitivity.
Independently of the approach followed, it is fairly reasonable to state the study, development
and application of optical fiber based platforms for high performance SPR sensors shall consider
reading based on phase interrogation, eventually complemented with other approaches,
particularly with wavelength encoding.

4
Optical Fiber SPR Sensing Structures with Single
and Bimetal Layers
Summary: This chapter develops the study of SPR based optical fiber sensing configurations
integrating a single metal or a bimetallic layer. With the focus on phase interrogation, it is analyzed
the performance associated with the utilization of different metals, namely silver, gold, copper, and
aluminum when the tapered and the tip (optrode) optical fibers geometric layouts are addressed.

Optical Fiber SPR Sensing Structures with Single and Bimetal Layers
- 56 -
4.1 Introduction
The basic approach to implement an optical fiber based SPR sensor relies on coating the fiber core
with a metal layer showing characteristics adequate to induce plasmonic resonance in the
conditions of light propagation in the optical fiber. Even so, and independently of the interrogation
technique to be applied to read the measurand induced variation of the properties of such
resonance signature, the type of metal to be used in a single layer, the possibility to include
bimetallic layers with distinct combinations of metals, the addition of oxide layers of different
materials, are all factors which, from the material side, strongly impact the performance of such
sensing structures. But the geometric element is also important, therefore it is expectable
different performances when standard fiber geometries, tapered configurations or optrode
layouts are addressed. Naturally, the combination of the material and the geometric elements
substantially increases the number of fiber optic based SPR sensing structures that may be
feasible. Consequently, to perform a comparative assessment of their relative merits and
drawbacks, it is important to build up a theoretical tool with characteristics that shall permit to
expediently analyse each one of these possibilities.
A core element of the PhD programme was to construct and test such theoretical tool and apply it
to the study of a variety of sensor architectures. The architecture of such model was outlined in
Chapter 2 and here the focus will be on the analysis of the tapered and optrode layouts when
single or bimetal layers are applied over the fiber. The performance of these sensing structures
will be analyzed when the phase interrogation technique is applied.
4.2 General Considerations
In general, silver (Ag) and gold (Au) are the two main metals that are used for SPR sensor
applications. As a matter of fact, Ag-based sensors are known for their narrow spectral width but
they are chemically very unstable and are highly vulnerable to oxidation when used in liquid or
gaseous environments. On the other hand, Au-based sensors are more sensitive but lesser
accurate than Ag-based sensors. However, an Au layer is chemically very stable.
Keeping these features in mind, some research has been done about the idea of bimetallic
structures but not in the sensing context [153]. In order to take the benefit of high sensitivity of
Au and high detection accuracy of Ag, a SPR sensor based on resonant bimetallic layers was
proposed a few years back [154]. It was shown that the bimetallic layers based sensor not only
displayed a high shift of resonance angle as an Au based sensor, but also showed narrower
resonance curve typical of an Ag-based sensor plus an additional advantage of protecting silver
against oxidation.
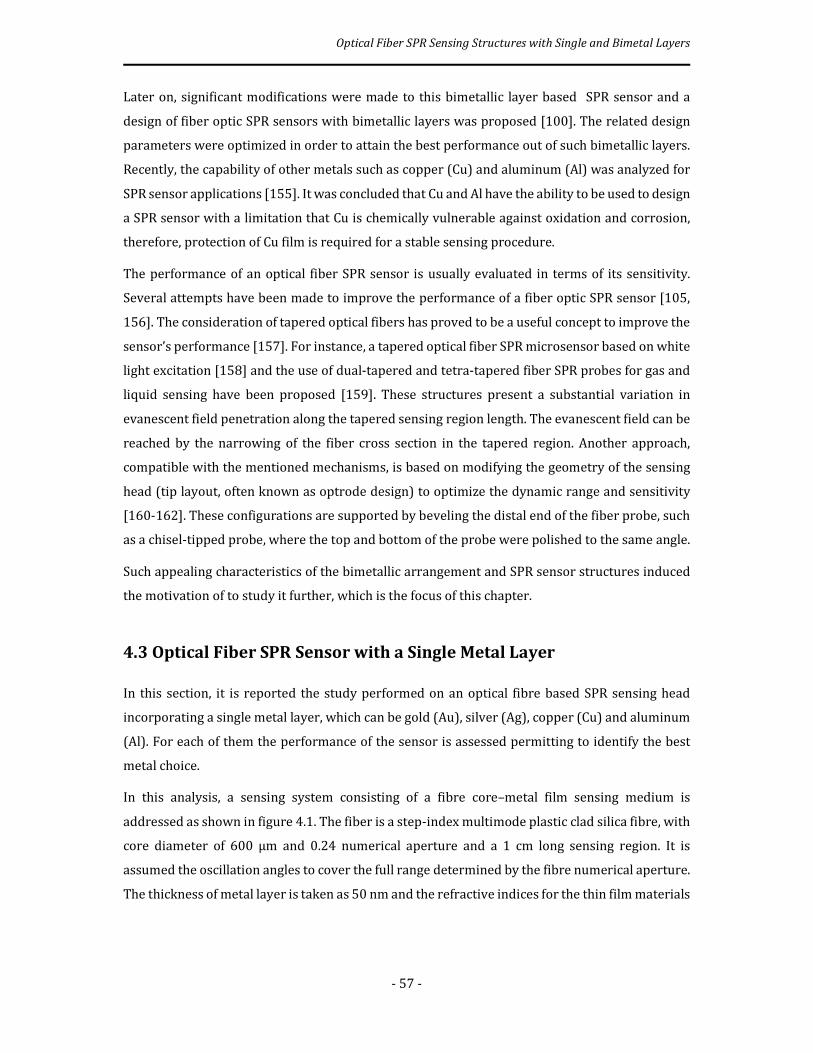
Optical Fiber SPR Sensing Structures with Single and Bimetal Layers
- 57 -
Later on, significant modifications were made to this bimetallic layer based SPR sensor and a
design of fiber optic SPR sensors with bimetallic layers was proposed [100]. The related design
parameters were optimized in order to attain the best performance out of such bimetallic layers.
Recently, the capability of other metals such as copper (Cu) and aluminum (Al) was analyzed for
SPR sensor applications [155]. It was concluded that Cu and Al have the ability to be used to design
a SPR sensor with a limitation that Cu is chemically vulnerable against oxidation and corrosion,
therefore, protection of Cu film is required for a stable sensing procedure.
The performance of an optical fiber SPR sensor is usually evaluated in terms of its sensitivity.
Several attempts have been made to improve the performance of a fiber optic SPR sensor [105,
156]. The consideration of tapered optical fibers has proved to be a useful concept to improve the
sensor’s performance [157]. For instance, a tapered optical fiber SPR microsensor based on white
light excitation [158] and the use of dual-tapered and tetra-tapered fiber SPR probes for gas and
liquid sensing have been proposed [159]. These structures present a substantial variation in
evanescent field penetration along the tapered sensing region length. The evanescent field can be
reached by the narrowing of the fiber cross section in the tapered region. Another approach,
compatible with the mentioned mechanisms, is based on modifying the geometry of the sensing
head (tip layout, often known as optrode design) to optimize the dynamic range and sensitivity
[160-162]. These configurations are supported by beveling the distal end of the fiber probe, such
as a chisel-tipped probe, where the top and bottom of the probe were polished to the same angle.
Such appealing characteristics of the bimetallic arrangement and SPR sensor structures induced
the motivation of to study it further, which is the focus of this chapter.
4.3 Optical Fiber SPR Sensor with a Single Metal Layer
In this section, it is reported the study performed on an optical fibre based SPR sensing head
incorporating a single metal layer, which can be gold (Au), silver (Ag), copper (Cu) and aluminum
(Al). For each of them the performance of the sensor is assessed permitting to identify the best
metal choice.
In this analysis, a sensing system consisting of a fibre core–metal film sensing medium is
addressed as shown in figure 4.1. The fiber is a step-index multimode plastic clad silica fibre, with
core diameter of 600 µm and 0.24 numerical aperture and a 1 cm long sensing region. It is
assumed the oscillation angles to cover the full range determined by the fibre numerical aperture.
The thickness of metal layer is taken as 50 nm and the refractive indices for the thin film materials
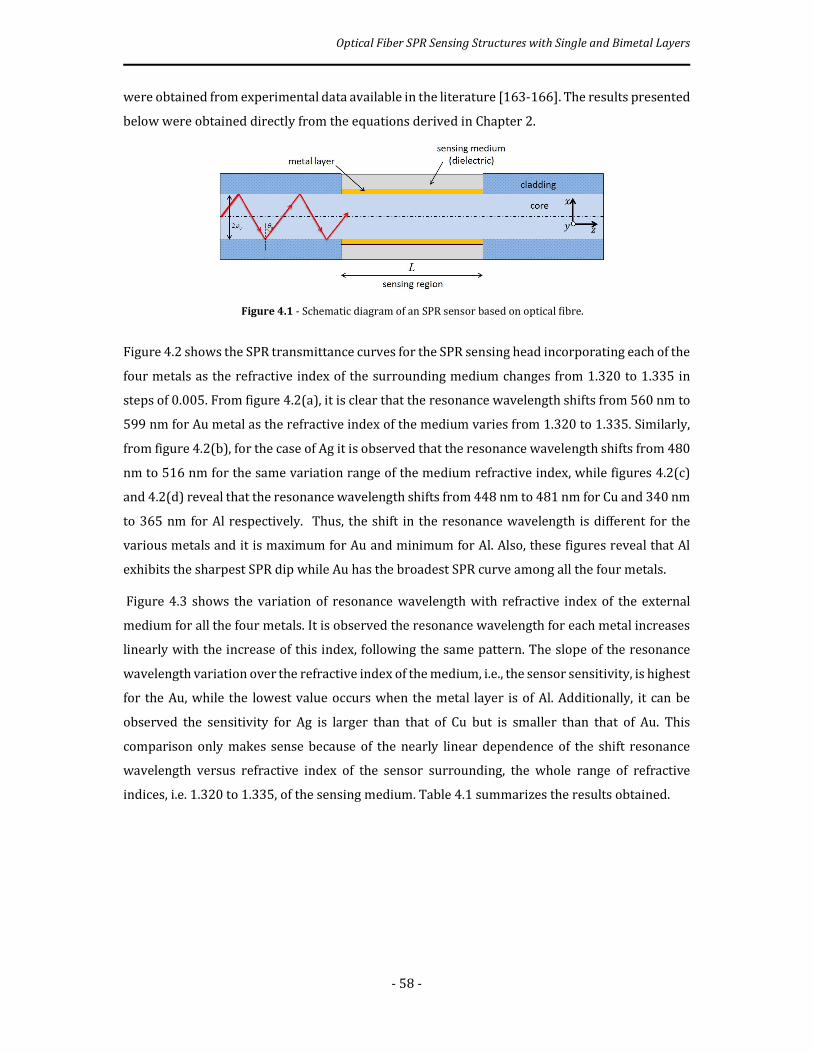
Optical Fiber SPR Sensing Structures with Single and Bimetal Layers
- 58 -
were obtained from experimental data available in the literature [163-166]. The results presented
below were obtained directly from the equations derived in Chapter 2.
Figure 4.2 shows the SPR transmittance curves for the SPR sensing head incorporating each of the
four metals as the refractive index of the surrounding medium changes from 1.320 to 1.335 in
steps of 0.005. From figure 4.2(a), it is clear that the resonance wavelength shifts from 560 nm to
599 nm for Au metal as the refractive index of the medium varies from 1.320 to 1.335. Similarly,
from figure 4.2(b), for the case of Ag it is observed that the resonance wavelength shifts from 480
nm to 516 nm for the same variation range of the medium refractive index, while figures 4.2(c)
and 4.2(d) reveal that the resonance wavelength shifts from 448 nm to 481 nm for Cu and 340 nm
to 365 nm for Al respectively. Thus, the shift in the resonance wavelength is different for the
various metals and it is maximum for Au and minimum for Al. Also, these figures reveal that Al
exhibits the sharpest SPR dip while Au has the broadest SPR curve among all the four metals.
Figure 4.3 shows the variation of resonance wavelength with refractive index of the external
medium for all the four metals. It is observed the resonance wavelength for each metal increases
linearly with the increase of this index, following the same pattern. The slope of the resonance
wavelength variation over the refractive index of the medium, i.e., the sensor sensitivity, is highest
for the Au, while the lowest value occurs when the metal layer is of Al. Additionally, it can be
observed the sensitivity for Ag is larger than that of Cu but is smaller than that of Au. This
comparison only makes sense because of the nearly linear dependence of the shift resonance
wavelength versus refractive index of the sensor surrounding, the whole range of refractive
indices, i.e. 1.320 to 1.335, of the sensing medium. Table 4.1 summarizes the results obtained.
Figure 4.1 - Schematic diagram of an SPR sensor based on optical fibre.

Optical Fiber SPR Sensing Structures with Single and Bimetal Layers
- 59 -
Figure 4.2 - Spectrum of the normalized transmitted optical power for the (a) Au, (b) Ag, (c) Cu, (d) Al metals sensing structure.
Figure 4.3 - Variation of resonance wavelength of the SPR sensor with refractive index of the external medium for
each of the metals that overlay the optical fiber.

Optical Fiber SPR Sensing Structures with Single and Bimetal Layers
- 60 -
Table 4.1 - Comparison of the refractive index sensitivity of an optical fiber based SPR sensor incorporating a single
metal layer when different metals are addressed.
Metal Layer Sensitivity (µm/RIU)
Gold (Au) 2.87
Silver (Ag) 2.40
Copper (Cu) 2.20
Aluminum (Al) 1.67
It can be seen from this Table that the sensitivity obtained for the structure with a gold layer is
the largest one (2.87 μm/RIU), while the smallest happens when aluminum is applied (1.67
μm/RIU), while intermediate values are obtained when layers of silver (2.40 μm/RIU) and copper
(2.20 μm/RIU) are under concern.
In chapter 3, the Γ-parameter associated with the sensor response to a specific measurand
variation was defined as the ratio of the variation of the value of the entity (angle, wavelength,
intensity, and phase) where resonance occurs and the range of this entity corresponding to the
width of the resonance at half-maximum. Here, the entity to be interrogated is the wavelength, so
the Γ parameter and Quality Parameter (χ) are useful to be considered, which are expressed by
equations (2.89) and (2.90).
For the sensing head structure deal with in this section, the values of the Γ (in wavelength, Γλ) and
of χ were evaluated for the case of the most favourable arrangements, associated with layers of
gold, silver and copper, with the results presented in Table 4.2. The sensor response was induced
by a variation of the external refractive index from 1.320 to 1.335.
Table 4.2 - Comparison of the values for the Γλ and Quality Parameter (χ) for the SPR sensing heads incorporating
thin films of gold, silver and copper.
The observation of the data in the Table indicates the SPR sensor incorporating a layer of copper
has the maximum Γλ parameter (1.571) and the maximum quality parameter (104.76 RIU-1), while
for a gold layer these values are, respectively, 0.462 and 30.86 RIU-1, with the situation of the
sensing head with a silver metal layer to show a performance between these two.
Metal Layer λn=1.320 (µm) FWHM δλ0.5 (µm) Γλ χ (RIU−1)
Gold (Au) 0.556 0.093 0.462 30.86
Silver (Ag) 0.480 0.042 0.857 57.14
Copper (Cu) 0.447 0.021 1.571 104.76
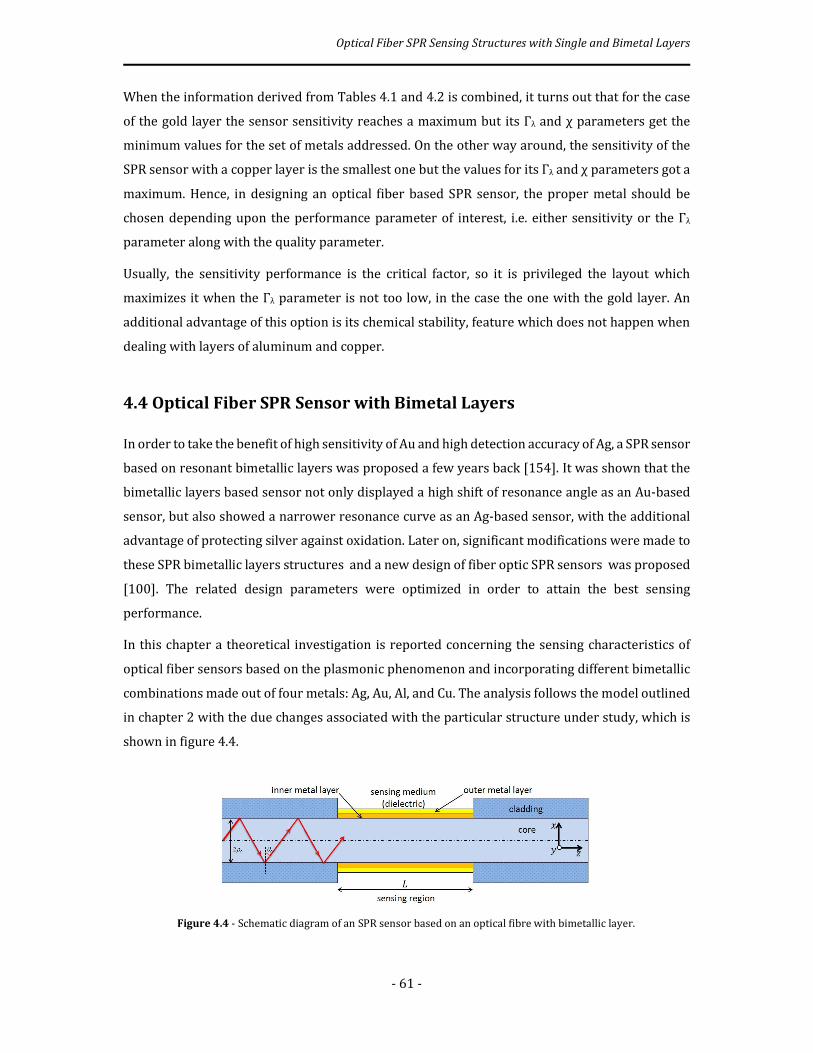
Optical Fiber SPR Sensing Structures with Single and Bimetal Layers
- 61 -
When the information derived from Tables 4.1 and 4.2 is combined, it turns out that for the case
of the gold layer the sensor sensitivity reaches a maximum but its Γλ and χ parameters get the
minimum values for the set of metals addressed. On the other way around, the sensitivity of the
SPR sensor with a copper layer is the smallest one but the values for its Γλ and χ parameters got a
maximum. Hence, in designing an optical fiber based SPR sensor, the proper metal should be
chosen depending upon the performance parameter of interest, i.e. either sensitivity or the Γλ
parameter along with the quality parameter.
Usually, the sensitivity performance is the critical factor, so it is privileged the layout which
maximizes it when the Γλ parameter is not too low, in the case the one with the gold layer. An
additional advantage of this option is its chemical stability, feature which does not happen when
dealing with layers of aluminum and copper.
4.4 Optical Fiber SPR Sensor with Bimetal Layers
In order to take the benefit of high sensitivity of Au and high detection accuracy of Ag, a SPR sensor
based on resonant bimetallic layers was proposed a few years back [154]. It was shown that the
bimetallic layers based sensor not only displayed a high shift of resonance angle as an Au-based
sensor, but also showed a narrower resonance curve as an Ag-based sensor, with the additional
advantage of protecting silver against oxidation. Later on, significant modifications were made to
these SPR bimetallic layers structures and a new design of fiber optic SPR sensors was proposed
[100]. The related design parameters were optimized in order to attain the best sensing
performance.
In this chapter a theoretical investigation is reported concerning the sensing characteristics of
optical fiber sensors based on the plasmonic phenomenon and incorporating different bimetallic
combinations made out of four metals: Ag, Au, Al, and Cu. The analysis follows the model outlined
in chapter 2 with the due changes associated with the particular structure under study, which is
shown in figure 4.4.
Figure 4.4 - Schematic diagram of an SPR sensor based on an optical fibre with bimetallic layer.

Optical Fiber SPR Sensing Structures with Single and Bimetal Layers
- 62 -
In this configuration the cladding around the core of a multimode step-index optical fiber is
removed and is coated with a metal layer of thickness d1. This inner layer is further covered with
a thin layer of thickness d2 of another metal and this outer layer is finally covered with the sensing
layer. In the analysis, the total bimetallic thickness is taken as 50 nm and the layer thickness of the
two metals is assumed as 25 nm each. Other relevant parameters had the values indicated in the
context of the study addressed in previous section.
Figure 4.5 depicts the spectral transmittance curves for six different bimetallic combinations,
namely (a) Au-Al, Ag-Al and Cu-Al and (b) Ag- Au, Cu-Au and Al-Au. In all these combinations, the
first metal represents the inner layer whereas the second metal represents the outer layer. Ag and
Cu are quite prone to oxidation and they are chemically not stable when used in liquid or gaseous
milieu. Due to this reason only, Ag and Cu have not been considered as outer layers. Al and Au
have been considered as an outer layer as they both are chemically stable. It is apparent from this
figure that the bimetallic combinations are able to tune the position as well as the width of the
SPR curve depending upon which two metals are coupled. For the same set of parameters and
coefficients, the resonance wavelength range, which was around between 340 and 555 nm for the
single metal case, is now constricted around between 385 and 615 nm. Also, the width of the SPR
curve varies for different bimetallic combinations depending upon which two metals are clubbed
together. Hence, it is quite worthwhile to estimate and figure out the best combination of two
metals which can provide the best performance.
Figure 4.6(a) shows the variation of sensitivity with inner layer, i.e., ratio of inner layer thickness
to total bimetallic thickness, for six bimetallic combinations. The curves drawn are derived from
the response of the SPR resonance to a variation of the external refractive index by a value
Ö^Õ=0.010.
Figure 4.5 – Spectral resonance of the SPR optical fiber based sensing structure incorporating a bimetallic layer
derived from the , combination of metals with (a) Al and (b) Au as outer metal layer (the refractive index of the
surrounding medium is ns=1.343).

Optical Fiber SPR Sensing Structures with Single and Bimetal Layers
- 63 -
The figure also contains the sensitivity of single metallic layers at points 0 and 1 on the x axis and
it clearly vindicates the earlier observation that the single Au layer is the most sensitive layout,
whereas the single Al layer is the least sensitive one. Au-Al and Ag-Au combinations also provide
good sensitivity. However, it is the Au-Al case which provides the larger sensitivity when
compared with all other combinations if the fraction of (inner) gold layer thickness is taken
greater than 0.3. It implies that a thick Au layer with a very thin covering of Al layer (around 2–4
nm) is able to provide quite a large sensitivity. Figure 4.6(b) shows the corresponding variation
in the Γλ parameter. As far as the single layer cases are concerned, it clearly suggests that the single
Al layer provides the highest Γλ whereas the single Au layer provides the smallest one. Among the
bimetallic combinations, Al-Au and Cu-Al are clearly better than all others. The Ag-Au combination
provides the minimum values of the Γλ among all the cases.
Gathering all these results, it can be concluded that no single metal (among Ag, Au, Al, and Cu) is
able to provide simultaneously reasonable values for all the performance parameters. However,
when these metals are used in bimetallic combinations of a well-defined thickness ratio, one can
find an overall sensing performance with high sensitivity and a good Γλ parameter along with a
large operating range. Moreover, the results indicate that bimetallic SPR sensors can surpass the
performance of single-layer systems, benefiting also from the enhanced chemical stability that
yields facilitating the process of surface functionalization for selective biochemical sensing
applications.
Figure 4.6 - Variation of (a) sensitivity, (b) Γλ with the ratio “inner layer thickness/total bimetallic thickness” for
different bimetallic combinations. These parameters were obtained from the response of the SPR resonance to a
variation of the external medium refractive index from 1.343 to 1.353 (δns=0.010).

Optical Fiber SPR Sensing Structures with Single and Bimetal Layers
- 64 -
4.5 Optical Fiber SPR Sensor with Bimetal Layers in a Tapered
Transmissive Geometry
The tapered optical fiber is the basis of many optical fiber devices and has become increasingly
important over the years. This structure have attracted a lot of interest because of their use in a
variety of applications, including interferometric devices [167, 168], directional couplers [169],
sensors [170, 171], optical probes [172], dye lasers [173], optical coupling [174], microspheres
coupling for whispering gallery modes [175, 176], and supercontinuum generation due to its
enhanced nonlinearity [177].
These structures present a substantial variation in evanescent field penetration along the tapered
sensing region length. The evanescent field can be reached by the narrowing of the fibre cross
section in the tapered region, as shown in figure 4.7. When the effective refractive index of the
surface plasmon mode approaches the value of the effective refractive index of a mode of the
uncoated tapered fibre, resonant coupling between the modes with the same azimuthal order of
both substructures can be observed at a specific combination of geometrical and material
parameters, and a resonant dip is observed in the transmission spectrum. The penetration of the
evanescent field, therefore the strength of light coupling with surface plasmons depends on the
numerical aperture of the fibre, which is related to the light acceptance angle limit. Since the angle
is fixed, these devices can operate in spectral shift mode or in power loss mode. In the spectral
shift mode the transmission spectrum of the plasmon resonance shifts as the outer refractive
index of the dielectric medium surrounding the structure changes. In the power loss mode, the
total optical power transmitted at the plasmon resonance changes with the outer refractive index
[178, 179].
In this section the behaviour of SPR sensing devices supported in tapered optical fibers and
incorporating bimetal layers is studied. First, it is presented the approach applied to analyse these
structures, then is it determined the optical power transmitted through them in the spectral
region where plasmonic resonance occurs and, finally, is evaluated the performance of these
sensing layouts under phase interrogation when addressing the detection of variations of the
surrounding medium refractive index.
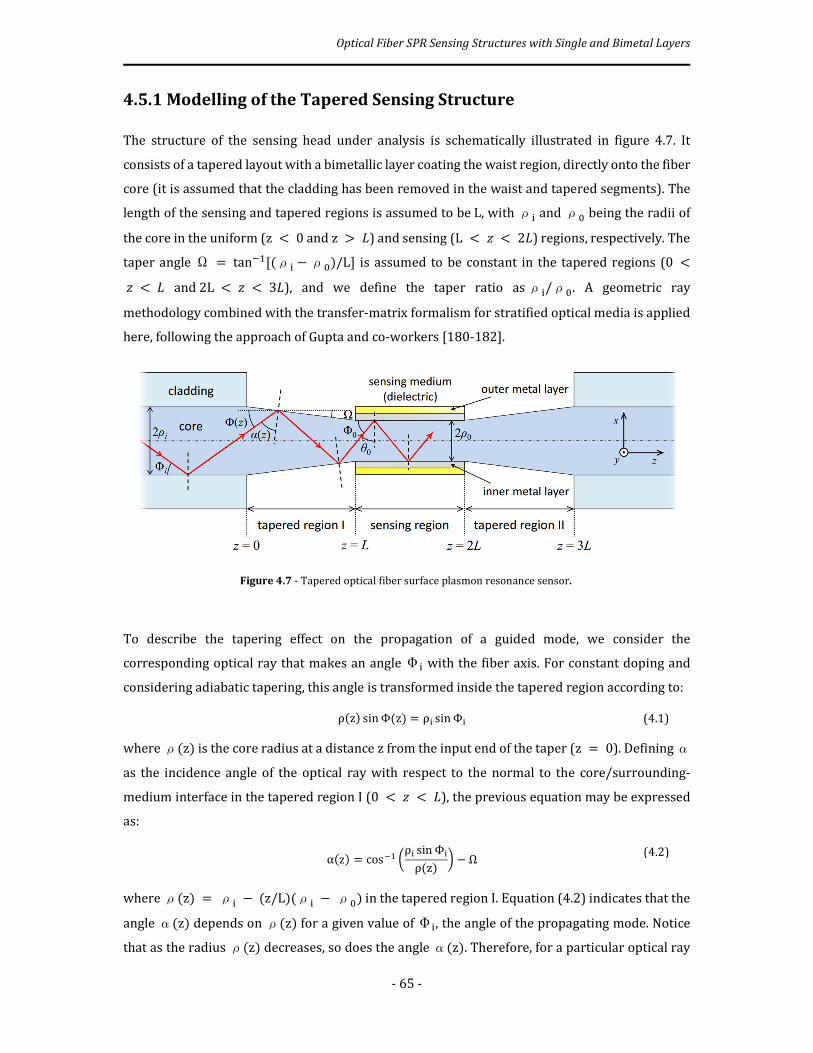
Optical Fiber SPR Sensing Structures with Single and Bimetal Layers
- 65 -
4.5.1 Modelling of the Tapered Sensing Structure
The structure of the sensing head under analysis is schematically illustrated in figure 4.7. It
consists of a tapered layout with a bimetallic layer coating the waist region, directly onto the fiber
core (it is assumed that the cladding has been removed in the waist and tapered segments). The
length of the sensing and tapered regions is assumed to be L, with ρY and ρ% being the radii of
the core in the uniform (z < 0 and z > ×) and sensing (L < C < 2×) regions, respectively. The
taper angle Ω = tan�X[(ρY −ρ%)/L] is assumed to be constant in the tapered regions (0 < C < × and 2L < C < 3×), and we define the taper ratio as ρY/ρ%. A geometric ray
methodology combined with the transfer-matrix formalism for stratified optical media is applied
here, following the approach of Gupta and co-workers [180-182].
To describe the tapering effect on the propagation of a guided mode, we consider the
corresponding optical ray that makes an angle ΦY with the fiber axis. For constant doping and
considering adiabatic tapering, this angle is transformed inside the tapered region according to:
ρ(z) sin Φ(z) = ρY sin ΦY (4.1)
where ρ(z) is the core radius at a distance z from the input end of the taper (z = 0). Defining α
as the incidence angle of the optical ray with respect to the normal to the core/surrounding-
medium interface in the tapered region I (0 < C < ×), the previous equation may be expressed
as:
α(z) = cos�X 8ρY sin ΦYρ(z) 9 − Ω (4.2)
where ρ(z) = ρY − (z/L)(ρY − ρ%) in the tapered region I. Equation (4.2) indicates that the
angle α(z) depends on ρ(z) for a given value of ΦY, the angle of the propagating mode. Notice
that as the radius ρ(z) decreases, so does the angle α(z). Therefore, for a particular optical ray
Figure 4.7 - Tapered optical fiber surface plasmon resonance sensor.
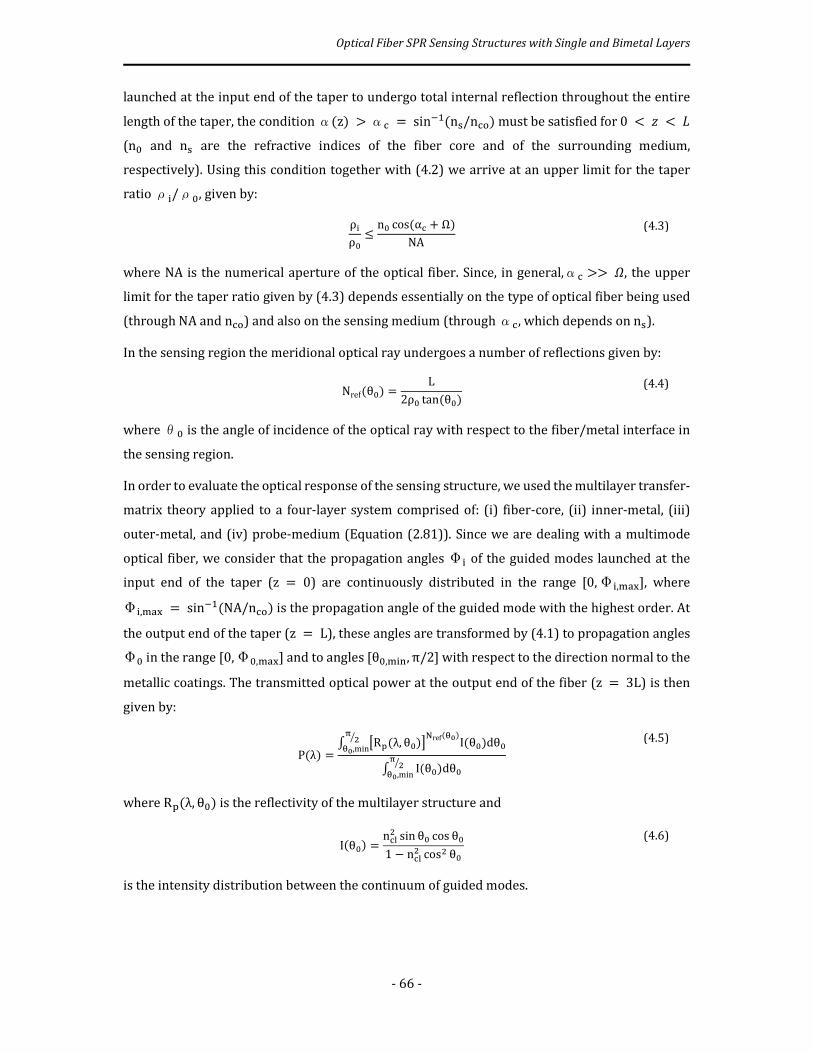
Optical Fiber SPR Sensing Structures with Single and Bimetal Layers
- 66 -
launched at the input end of the taper to undergo total internal reflection throughout the entire
length of the taper, the condition α(z) >α� = sin�X(n¥/n��) must be satisfied for 0 < C < ×
(n% and n¥ are the refractive indices of the fiber core and of the surrounding medium,
respectively). Using this condition together with (4.2) we arrive at an upper limit for the taper
ratio ρY/ρ%, given by:
ρYρ% ≤ n% cos(α� + Ω)NA (4.3)
where NA is the numerical aperture of the optical fiber. Since, in general,α� >> Ü, the upper
limit for the taper ratio given by (4.3) depends essentially on the type of optical fiber being used
(through NA and n��) and also on the sensing medium (through α�, which depends on n¥).
In the sensing region the meridional optical ray undergoes a number of reflections given by:
Nref(θ%) = L2ρ% tan(θ%) (4.4)
where θ% is the angle of incidence of the optical ray with respect to the fiber/metal interface in
the sensing region.
In order to evaluate the optical response of the sensing structure, we used the multilayer transfer-
matrix theory applied to a four-layer system comprised of: (i) fiber-core, (ii) inner-metal, (iii)
outer-metal, and (iv) probe-medium (Equation (2.81)). Since we are dealing with a multimode
optical fiber, we consider that the propagation angles ΦY of the guided modes launched at the
input end of the taper (z = 0) are continuously distributed in the range [0,ΦY,x�.], where
ΦY,x�. = sin�X(NA/n��) is the propagation angle of the guided mode with the highest order. At
the output end of the taper (z = L), these angles are transformed by (4.1) to propagation angles
Φ% in the range [0,Φ%,x�.] and to angles [θ%,xY¦, π/2] with respect to the direction normal to the
metallic coatings. The transmitted optical power at the output end of the fiber (z = 3L) is then
given by:
P(λ) = ¹ DR³(λ, θ%)H¡ref(¾q)I(θ%)dθ%¯ �ݾq,min¹ I(θ%)dθ%¯ �ݾq,min
(4.5)
where R³(λ, θ%) is the reflectivity of the multilayer structure and
I(θ%) = n�Ä� sin θ% cos θ%1 − n�Ä� cos� θ% (4.6)
is the intensity distribution between the continuum of guided modes.

Optical Fiber SPR Sensing Structures with Single and Bimetal Layers
- 67 -
In order to access the performance of phase interrogation of SPR based sensors supported by fiber
taper structures, the (complex) Fresnel reflection coefficients \Õ and \Ô are expressed the polar
form as:
\Õ = |\Õ|aiÒÞ , \Ô = ¶\Ô¶aiÒß (4.7)
Then, the phase difference variation δϕ³,¥ resulting from a single reflection at a given incident
angle between the á and the _ polarization components is:
ÖÓÔ,Õ(â%) = ÓÔ − ÓÕ (4.8)
and the total phase difference variation considering all the reflections inside the sensing region is
given by:
∆ÓÔ,Õ(â%) = ãref(â%)ÖÓÔ,Õ(â%) (4.9)
Following the expressed in Chapter 3, the sensitivity of the sensing structure to the refractive
index n¥ of the surrounding medium is defined as
äå,æ = ÖçÖ^Õ (4.10)
where δξ is the change in a given property of light (e.g. intensity, resonance wavelength or
phase) due to a variation of δn¥ in the refractive index of the surrounding medium. Here, the
focus is phase interrogation, where the property of light of interest is the phase difference Δϕ³,¥
between the á and _ polarization components. In this case, the phase sensitivity to refractive index
variations is then defined as S¦,è =δ(Δϕ³,¥)/δn¥.
4.5.2 Optical Transmission of the Sensing Structure
In our analysis, we have considered a step-index multimode silica optical fiber with core diameter
of 2éi = 600 μ| and numerical aperture NA = 0.24. The sensing head comprises a tapered layout
with a bimetallic coating on the region having uniform waist, as illustrated in figure 4.7. The
bimetallic coating consists of an inner Ag layer and an outer Au layer with thicknesses 45 nm and
25 nm, respectively, and their refractive indices were obtained following the Drude Model. The
sensing region had a length of L = 1 cm and the total length of the sensing head equal to 3L = 3 cm.
The taper ratio éi/é% varies from 1 (i.e. no taper) up to the maximum value of ~3 determined
using (4.3), and the taper angle Ü changes accordingly through Ω = tan�X[(ρY −ρ%)/L]. The
refractive index of the sensing layer is ^Õ= 1.333, which is the refractive index of water.

Optical Fiber SPR Sensing Structures with Single and Bimetal Layers
- 68 -
Figure 4.8 shows the transmitted optical power as function of the light’s wavelength. It can be
seen that for fixed bimetallic thicknesses the penetration of the evanescent wave inside the
sensing region becomes deeper, with the consequent increase of the SPR peak loss. The tapering
makes the angle of incidence of the rays more close to the critical angle, therefore it occurs a
deeper penetration of the evanescent wave. Due to this reason, the coupling between the
evanescent wave and the surface plasmon wave becomes much stronger and hence it can sense a
very slight change in the refractive index of the surrounding medium, i.e., there is an increase of
the device sensitivity.
4.5.3 Performance of the Sensing Structure with Phase Interrogation
In this analysis the taper ratio = 2, L = 1 cm, NA = 0.25, êi= 10° and the interrogation wavelength
λ = 632.8 nm. First it was compared the sensing performance in phase interrogation of single-
metal Au- and Ag-based structures with different thicknesses. Figure 4.9 shows the dependence
of the phase difference ëÓÔ,Õ between the TM (or á) and TE (or _) polarizations with the refractive
index ns of the surrounding medium, as well as the phase sensitivity äå,Ò (which corresponds to
the derivative of the phase difference curves). The analysis was done for single metal layer of Au,
figure 4.9(a), and Ag, figure 4.9(b), with the three different thicknesses of 50, 60 and 70 nm, values
accessible to experimental validation. The best results were achieved for the thickness of 50 nm,
resulting in phase sensitivities reaching 70000 degrees/RIU and 40000 degrees/RIU for Ag- and
Au- single layers, respectively. The main drawback of this layout is that the refractive index values
Figure 4.8 - Spectrum of the normalized transmitted optical power for a Ag-Au bimetallic sensing structure
(d1 = 45 nm – thickness of Ag layer and d2 = 25 nm – thickness of Au layer) and different taper ratio when the
surrounding medium having a refractive index of 1.333.

Optical Fiber SPR Sensing Structures with Single and Bimetal Layers
- 69 -
for maximum phase sensitivity (around 1.35 for Ag and 1.31 for Au) do not correspond to the
refractive indices associated with aqueous solutions.
To overcome this issue and looking for the tuning of the operation point of the sensor, i.e., to
configure it in order the sensor maximum sensitivity to occurs for a value of the external medium
refractive index close to that of water, a Ag-Au bimetallic combination was studied in figure 4.10
shows the numerically calculated results for this bimetallic configuration for various
combinations of (d1, d2), keeping constant the overall thickness at 50 nm.
Figure 4.9 - Phase difference (between p and s polarizations) and phase sensitivity as function of the refractive
index of the surrounding medium, for a single metal layer sensing structure comprised of 50, 60 and 70 nm thick
(a) gold layer and (b) silver layer. The interrogation wavelength is 632.8 nm.
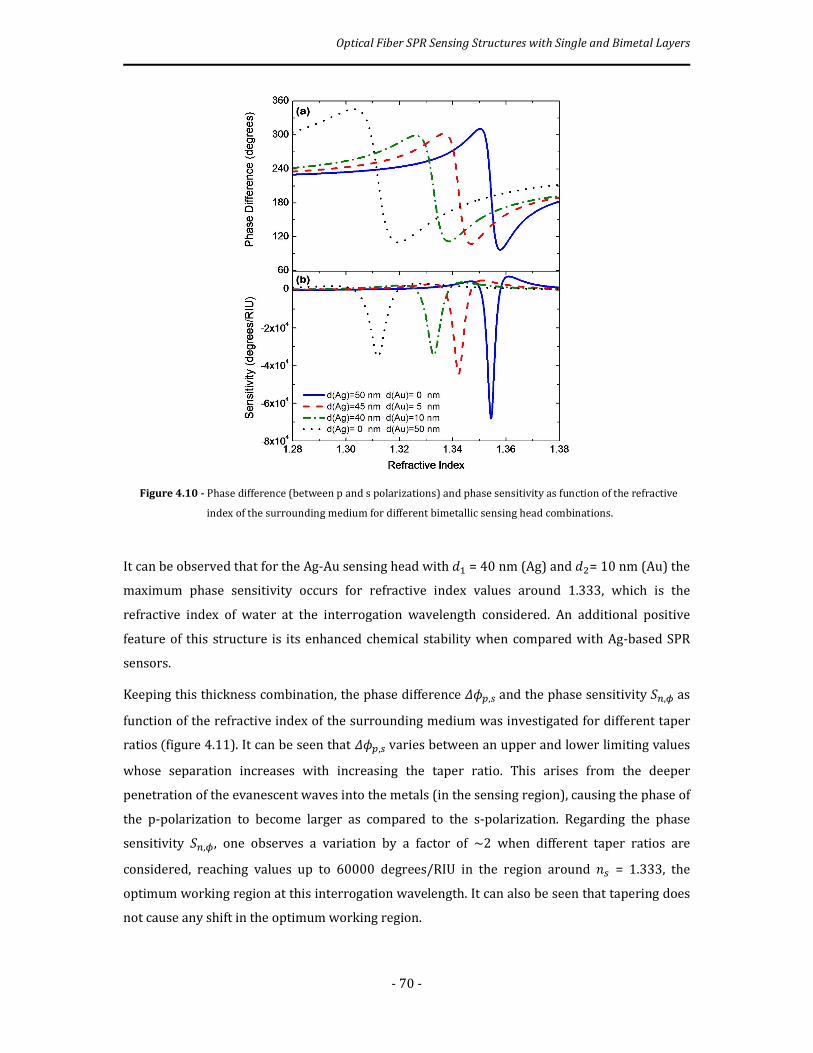
Optical Fiber SPR Sensing Structures with Single and Bimetal Layers
- 70 -
Figure 4.10 - Phase difference (between p and s polarizations) and phase sensitivity as function of the refractive
index of the surrounding medium for different bimetallic sensing head combinations.
It can be observed that for the Ag-Au sensing head with UX = 40 nm (Ag) and U�= 10 nm (Au) the
maximum phase sensitivity occurs for refractive index values around 1.333, which is the
refractive index of water at the interrogation wavelength considered. An additional positive
feature of this structure is its enhanced chemical stability when compared with Ag-based SPR
sensors.
Keeping this thickness combination, the phase difference ëÓÔ,Õ and the phase sensitivity äå,Ò as
function of the refractive index of the surrounding medium was investigated for different taper
ratios (figure 4.11). It can be seen that ëÓÔ,Õ varies between an upper and lower limiting values
whose separation increases with increasing the taper ratio. This arises from the deeper
penetration of the evanescent waves into the metals (in the sensing region), causing the phase of
the p-polarization to become larger as compared to the s-polarization. Regarding the phase
sensitivity äå,Ò, one observes a variation by a factor of ~2 when different taper ratios are
considered, reaching values up to 60000 degrees/RIU in the region around ^Õ = 1.333, the
optimum working region at this interrogation wavelength. It can also be seen that tapering does
not cause any shift in the optimum working region.

Optical Fiber SPR Sensing Structures with Single and Bimetal Layers
- 71 -
Figure 4.11 - (a) Phase difference (between p and s polarizations) as function of the refractive index of the
surrounding medium and (b) associated phase sensitivity, for Ag-Au bimetallic structures (d1 = 40 nm and d2 = 10 nm)
having different taper ratios. The interrogation wavelength considered is 632.8 nm, and the dashed vertical line at
ns = 1.330 indicates the point having maximum phase sensitivity.
The observation of figure 4.11 indicates the maximum phase sensitivity for an interrogation
wavelength of 632.8 nm occurs when the refractive index of the surrounding medium is close to
^Õ = 1.333. It is important to identify the region of the SPR resonance spectrum associated with
this value of ^Õ where maximum phase sensitivity to variations of ^Õ takes place. With this
objective, the transmitted TM (p-polarized) optical power spectrum is plotted in figure 4.12 for
the Ag-Au bimetallic sensing structure with taper ratio = 2, immersed in a surrounding medium
with ^Õ = 1.333. It can be seen the interrogation wavelength associated with the maximum phase
sensitivity (represented by the vertical line) corresponds to the SPR wavelength, a consequence
of the Kramers-Kronig relations from where derives that in resonance the phase slope variation
reaches a maximum.
Optical Fiber SPR Sensing Structures with Single and Bimetal Layers
- 72 -
Figure 4.12 - Spectrum of the normalized transmitted optical power for the Ag-Au bimetallic sensing structure
(d1 = 40 nm and d2 = 10 nm) with taper ratio = 2.0 and surrounding medium having a refractive index of 1.333. The
dashed vertical line at 632.8 nm indicates the interrogation wavelength corresponding to maximum phase sensitivity.
Actually, the fact that the maximum phase sensitivity occurs in the SPR resonance, therefore with
low level of optical power, may degrade the signal-noise ratio to a point that such high sensitivity
does not have impact in the final phase reading resolution. Therefore, in principle shall be
considered to operate in a wavelength where there is enough transmitted optical power, meaning
the choice of an wavelength located in either side of the SPR transmittance curve. Its exact value
may be determined from the compromise of sensitivity and available optical power to reach
maximum refractive index resolution. This topic will be investigated next chapter in the context
of another optical fiber based SPR sensing layout.
4.6 Optical Fiber SPR Sensor with Bimetal Layers in a Tip (Optrode)
As reported before, along the years a large number of fiber based sensing head layouts have been
proposed to measure a broad range of parameters, relying on diverse interaction mechanisms of
the measurand with the optical field One of the most attractive of those layouts is the reflective
fiber tip configuration, where the sensor functionality occurs at the end of the optical fiber,
therefore readily allowing point sensing at remote locations[183]. These fiber sensing devices are
commonly identified as fiber optrodes, a generalization of the initial meaning of the word optrode,
the combination of the words “optics” and “electrode”, indicating it strictly refers to the
modulation of the optical field by the electric characteristics of an electrode which interacts with
the targeted measurand [184]. To a large degree, fiber optrodes include a membrane at the tip of
the fiber with its fluorescent and spectroscopic properties changing with the variation of the
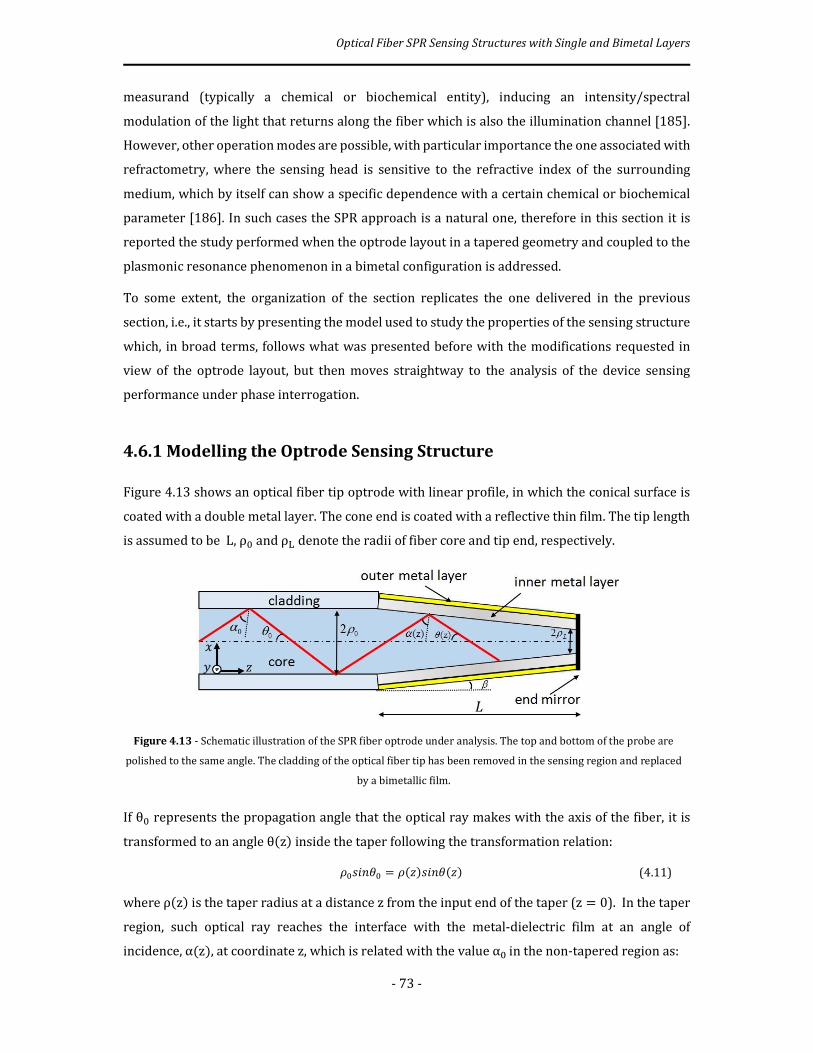
Optical Fiber SPR Sensing Structures with Single and Bimetal Layers
- 73 -
measurand (typically a chemical or biochemical entity), inducing an intensity/spectral
modulation of the light that returns along the fiber which is also the illumination channel [185].
However, other operation modes are possible, with particular importance the one associated with
refractometry, where the sensing head is sensitive to the refractive index of the surrounding
medium, which by itself can show a specific dependence with a certain chemical or biochemical
parameter [186]. In such cases the SPR approach is a natural one, therefore in this section it is
reported the study performed when the optrode layout in a tapered geometry and coupled to the
plasmonic resonance phenomenon in a bimetal configuration is addressed.
To some extent, the organization of the section replicates the one delivered in the previous
section, i.e., it starts by presenting the model used to study the properties of the sensing structure
which, in broad terms, follows what was presented before with the modifications requested in
view of the optrode layout, but then moves straightway to the analysis of the device sensing
performance under phase interrogation.
4.6.1 Modelling the Optrode Sensing Structure
Figure 4.13 shows an optical fiber tip optrode with linear profile, in which the conical surface is
coated with a double metal layer. The cone end is coated with a reflective thin film. The tip length
is assumed to be L, ρ% and ρì denote the radii of fiber core and tip end, respectively.
If θ% represents the propagation angle that the optical ray makes with the axis of the fiber, it is
transformed to an angle θ(z) inside the taper following the transformation relation:
é%_{^â% = é(C)_{^â(C) (4.11)
where ρ(z) is the taper radius at a distance z from the input end of the taper (z = 0). In the taper
region, such optical ray reaches the interface with the metal-dielectric film at an angle of
incidence, α(z), at coordinate z, which is related with the value α% in the non-tapered region as:
Figure 4.13 - Schematic illustration of the SPR fiber optrode under analysis. The top and bottom of the probe are
polished to the same angle. The cladding of the optical fiber tip has been removed in the sensing region and replaced
by a bimetallic film.
Optical Fiber SPR Sensing Structures with Single and Bimetal Layers
- 74 -
í(C) = cos�X 8é% cos í%é(C) 9 − β (4.12)
where ρ(z) = ρ% − (z L)(ρ% − ρì) ⁄ is the tip radius with the coordinate z and β = tan�X }ïq�ïðì � is
the taper angle. Notice that as the radius ρ(z) decreases, so does the angle α(z). Therefore, for a
particular optical ray launched at the input end of the taper to undergo total internal reflection
throughout the entire length of the taper, the condition α(z) > α� = sin�X(n¥/n��) must be
satisfied for 0 < C < × (n¥ and n�� are the refractive indices of the surrounding medium and fiber
core, respectively). Since α(z) becomes smaller along the propagation and considering (4.12), the
above condition is fulfilled when
cos�X 8é% cos í%éñ 9 − β > íò (4.13)
This is the basic equation which permits to analyze the two relevant situations, namely for a fixed
angle α% what is the maximum length of the optrode (taper) to keep the condition of total
reflection along its length and the other way around, i.e., for a fixed taper length what is the
minimum value for α%.
Considering the first of these two situations, regarding (4.13) and assuming a fixed angle of
incidence, the maximum taper length is:
× > é% − éñ[]^ óôõ_�X(öq ��¥ ÷qöø ) − íòù, (1.14)
On the other hand, when L is fixed, the minimum angle of incidence must satisfy:
í% > ôõ_�X £éñé% ôõ_[j + íò]«. (4.15)
The angle range of the rays at the coordinate z alters to [αX(z), α�] due to the variation of fiber
core diameter, where
íX(C) = ôõ_�X 8é%ôõ_âòúé(C) 9 − β, (4.16)
í� = �2 − j, (4.17)
where θ�& = sin�X(n�Ä n��⁄ ) is the critical angle (n�Ä and n�� are the refractive indices of the fiber
cladding and core, respectively) [187].
The normalized transmitted optical power through the sensing region of the fiber tip follows
equations (4.5) and (4.6) with the necessary adaptations
Optical Fiber SPR Sensing Structures with Single and Bimetal Layers
- 75 -
ûüú�åÕ = ¹ UCñ% ¹ D�ÔHýþ��Ñ(â)Uâ÷�÷�(G)¹ UCñ% ¹ Ñ(â)Uâ÷�÷�(G). (4.18a)
where
Ñ(â) = ^ò�� sinâcosâ(1 − ^ò�� cos�â) (4.18b)
is the intensity distribution between the continuum of guided modes (assuming meridional
excitation), R³ is the reflectivity of the multilayer structure and N&ÁÂ is the number of reflections
the optical ray with propagation angle θ undergoes in the sensing region [40].
In order to evaluate the number of reflections, it is considered a length dL of the taper region
around the coordinate z where the radius of the taper is ρ(z), as illustrated in figure 4.14.
With regard to this figure, tan(β) = b/h and tan[α(z) − β] = (h% − h)/b, therefore
ℎ = ℎ%1 + tan (j)tan [í(C) − j]. (4.19)
also,
ℎ% = 2ρ(z)tan [í(C) − j] (4.20)
With these relations, the equation for the longitudinal length advanced when the ray propagates
from one side of the taper to the other is given by
h = 2ρ(z)tan [α(z) − β]1 + tanβ tan [α(z) − β] (4.21)
The ray is reflected in the lower taper surface and propagates upwards towards the upper taper
surface. To simplify, we can consider the same length ℎ is advanced by the ray associated with this
Figure 4.14. Schematic of a length dL of the taper region around the coordinate z where the radius
of the taper is ρ(z).
Optical Fiber SPR Sensing Structures with Single and Bimetal Layers
- 76 -
upwards propagation (actually, the real value is smaller than ℎ). Therefore, in the distance 2ℎ we
have a reflection, which means in the distance U× the number of reflections is
Öã = 1 + tan (j)tan [í(C) − j]4ρ(z)tan [í(C) − j] UC (4.22)
Considering the full taper length, the number of reflections can be calculated as
ã�å� Ô�ü� = � 1 + tan (j)tan [í(C) − j]4ρ(z)tan [í(C) − j] UCñ%
(4.23)
Since the configuration works in reflection, the total number of reflections is given by:
ãú� = 2ã�å� Ô�ü� = � 1 + tan (j)tan [í(C) − j]2ρ(z)tan [í(C) − j] UCñ%
(4.24)
with α(z) given by (4.20). In order to access the performance of phase interrogation of SPR
sensors supported by fiber structures, it is convenient to express the amplitude reflection
coefficients r¥ and r³ in the polar form as
\Õ = |\Õ|aiÒÞ , \Ô = ¶\Ô¶aiÒß . (4.25)
AS before, if >δϕ³,¥? = D(ϕ³ − ϕ¥)H is the phase shift of the light between the á and _
polarizations for reflection �, the total phase shift accumulated by the light that propagates in the
optrode is given by
(ÓÔ − ÓÕ)ü�ü�� = 2 � (ÓÔ − ÓÕ) ý��� ß���
¬X. (4.26)
The situation is somehow simplified if it is determined an average phase shift per reflection. At
the input of the taper the angle of incidence can be considered to be α%, which corresponds to a
phase shift of >δϕ³,¥?�q = (ϕ³ − ϕ¥)�q; at the end of the taper the phase shift
is >δϕ³,¥?�(ì) = (ϕ³ − ϕ¥)�(ì), with α(L) obtained from (4.12) when ρ(z) = ρì. Therefore, an
approximation for this average phase shift is given by:
(δϕ³,¥)�ÊÁ&�ËÁ = (δϕ³,¥)�q + (δϕ³,¥)�(ì)2 (4.27)
and the total phase shift accounting for all reflections inside the sensing region is:
∆ÓÔ,Õ ≡ (ÓÔ − ÓÕ)ü�ü�� = ãú�(ÖÓÔ,Õ)���ú��� (4.28)
The evaluation of phase sensitivity is done with the same approach that was explained for the
tapered structure regarding (4.10).

Optical Fiber SPR Sensing Structures with Single and Bimetal Layers
- 77 -
4.6.2 Performance of the Sensing Structure with Phase Interrogation
The analysis performed considered a multimode silica fiber with core diameter 2ρX = 600 µm,
numerical aperture of 0.24 and sensing region L = 1 cm. The bimetallic combination consists of an
inner Ag layer and an outer Au layer with thicknesses UX and U�, respectively, and their refractive
indices were fitted from experimental data available in the literature [163-166]. Concerning the
metallic layers, the studies performed and reported before indicated that an Ag-Au sensing head
with UX = 40 nm (Ag) and U� = 10 nm (Au) shows maximum phase sensitivity for refractive index
values around the water value of 1.333. Accordingly to equation (4.24), the number of reflections
is N&ÁÂ = 14. As mentioned in the prior section, the phase shift introduced in each reflection was
assumed constant, the average of phase shift at the beginning of the
taper >δϕ³,¥?�q = (ϕ³ − ϕ¥)�q, with α% = 79° , and at the end of the taper >δϕ³,¥?�(ì) =(ϕ³ − ϕ¥)�(ì), with αì = 68°. Figure 4.15 shows the effects of tip end radii in the phase difference ëÓÔ,Õ and phase sensitivity
äå,Ò as function of the refractive index of the surrounding medium for an interrogation
wavelength of 632.8 nm. The observation of this data indicates the phase sensitivity increases
when the tip end radius decrease, reaching a value of 1.25 × 10Æ degrees/RIU (at ^Õ = 1.333)
when the radii of tip end is 150 μm.
Figure 4.15 - Variation of (a) phase difference (between s and p polarizations) and (b) phase sensitivity as function
of the refractive index of the surrounding medium for different radii of the tip end. The sensing structure comprised
of a 40 nm silver + 10 nm gold layer and tip length of 1 cm. The interrogation wavelength is 632.8 nm.
It was also investigated the effects of optrode length in the phase difference between _ and á
polarizations when the tip end radius is 150 μ|. The results are shown in figure 4.16. The analysis
of this data permits to conclude the phase sensitivity decreases when the tip length becomes
smaller. Indeed, it reaches a value of 1.25 × 10Æ degrees/RIU for a tip length of 10 mm, which is
reduced to 4.25 × 10� when such length is reduced to 4 mm.

Optical Fiber SPR Sensing Structures with Single and Bimetal Layers
- 78 -
Figure 4.16 - Variation of (a) Phase difference (between s and p polarizations) and (b) phase sensitivity as function
of the refractive index of the surrounding medium for different tip length. The sensing structure comprised of a 40
nm silver + 10 nm gold layer and the tip end radius is 150 µm. The considered interrogation wavelength is 632.8 nm.
The analysis presented here permits to guide the design of fiber optrodes highly sensitive to the
surrounding medium refractive index by plasmonic interaction at a certain wavelength window
and considering phase reading. The bimetallic combination is an effective approach, but other
possibilities may be considered, particularly when looking for operation at other wavelength
regions (mostly important around 1550 nm for sensing network applications), which can be
achieved incorporating an outer oxide layer. This operation wavelength shift of fiber optic SPR
based sensing structures is a topic addressed next chapters.
4.7 Conclusion
This Chapter addressed the study of optical fiber based SPR sensing structures incorporating a
single metal or a bimetallic layer when phase interrogation is the readout technique. The metals
included in this study were silver, gold, copper, and aluminum, and for the bimetallic configuration
were considered the tapered and the tip (optrode) optical fiber geometric layouts.
The Chapter started by stating the motivations to analyze bimetallic layers instead of the usual
single metal layer when optical fiber sensing structures based on the SPR phenomenon are under
concern. Then, on the basis of the model exposed in Chapter 2, it was numerically evaluated the
performance of single metal layer phase interrogated SPR sensors in standard optical fiber when
targeting the measurement of refractive index changes of the surrounding medium. This provided
the context to introduce the analysis of bimetallic configurations, the focus of the next section of
the Chapter. Such analysis was later expanded to include two different sensor geometric layouts,
one the transmissive tapered structure and the other the tip (optrode) reflective arrangement,
which implied to adapt the previously developed theoretical approach to permit the numerical
Optical Fiber SPR Sensing Structures with Single and Bimetal Layers
- 79 -
evaluation of the performance of all these sensor patterns and, consequently, be able to determine
their absolute and relative performances.
The results delivered in this chapter were obtained from a theoretical/computational analysis,
not including experimental validation. On the strategy under way at the Center of Applied
Photonics of INESC TEC to research and develop novel SPR sensing structures in optical fiber
platforms/waveguides, all these components are tackled in a coherent plan involving several
researchers, in particular PhD students, with complimentary focus, the one reported here
connected to the study and modelling of these devices looking to guide the experimental work and
to permit sensor performance optimization.
The phenomenon of plasmonic resonance associated with the metals addressed in this chapter
typically occurs in the visible region of the electromagnetic spectrum, independently of being
considered a single metal layer or a bimetal one. Theses wavelengths are not adequate for
propagation of light in the standard optical fibers used in optical communication systems due to
the presence of high losses. Indeed, theses fibers are designated for optimum light propagation in
the spectral region around 1550 nm. Therefore, it would highly convenient to have SPR resonance
at these wavelengths, which means the need to consider other layers in addition to the metal one.
This is the topic to be addressed next chapter.
5
Optical Fiber SPR Sensing Structures with Hybrid
Layers
Summary: This chapter presents a theoretical investigation of optical fiber surface plasmon
resonance sensors incorporating an internal metallic layer of silver covered with an oxide layer. The
objective is to shift the resonance condition to longer wavelengths, therefore more suited to benefit
from a broad range optical fiber technologies developed along the years within the context of optical
fiber communications systems. Different oxide materials like titanium dioxide, silicon dioxide and
aluminum oxide are considered aiming to achieve increased/enhanced sensitivity to refractive index
variations of the external medium, particularly when addressing phase interrogation.

Optical Fiber SPR Sensing Structures with Hybrid Layers
- 81 -
5.1 Introduction
As exposed in detail in previous chapters, the resonant interaction of light with free electrons in
metals originates loss bands in the light spectrum with a central wavelength that depends on the
properties of the metal as well as of the surrounding medium, particularly its refractive index.
This dependence is the principle of optical sensing based in plasmonics where, similarly to sensing
structures based on fiber Bragg gratings and distributed feedback fiber lasers, the measurand
information is encoded on the wavelength position of a spectral signature, with all the benefits
which result from this characteristic [188].
As also indicated before, in the development process of SPR sensing soon it was recognized the
obvious advantages of using the optical fiber as the SPR platform, starting by the fact of
propagation in these waveguides in most of the cases is supported by the effect of total internal
reflection, also central in plasmonic phenomena. Therefore, it has been observed a trend towards
the consideration of the optical fiber as the privileged platform for SPR sensing [189].
Consequently, most of the recent developments in this field involve the combination of the optical
fiber with nanostructures whose manufacturing became possible with the advances of the
Nanosciencies and Nanotechnologies. It is the case of SPR layouts involving the combination of
metal and oxide layers on the optical fiber surface, enabling the tailoring of the sensor
performance, most notably its sensitivity and wavelength operation region [190].
On this context it is important to emphasize the efforts oriented to apply fiber optic SPR sensing
structures at the third telecommunications window (around 1550 nm). Historically, it is known
that SPR sensors have been focused to detect refractive indices of aqueous media, which means
they are projected to be sensitive in the range of the refractive index of water (≈1.33). In the vast
majority of the studies reported the optical fiber based SPR sensors operate around 640 nm, some
in the 830 nm region, which are wavelengths where the availability of high-performance fibre
optic components is reduced. To take advantage of the highly developed fiber optic technology,
SPR fiber sensing must migrate to the third telecommunication window, surprisingly a move that
has been quite slow. With bulk optics, SPR films have been designed to exhibit resonances in the
1500 nm region [191], and in this wavelength window a fiber optic taper-based SPR sensing head
was reported for refractive index detection in the region of 1.44 [192]. Some years ago, it was
demonstrated a 1500 nm fiber optic SPR sensor for aqueous media refractive index measurement
based on a combination of a tilted fiber Bragg grating and a SPR film structure deposited at a
lapped cladding region of the fibre [193]. The results reported indicate the feasibility of this
approach, but it would be interesting to have a systematic approach to design and model the
performance of fiber optic SPR sensors operating at these wavelengths.
Optical Fiber SPR Sensing Structures with Hybrid Layers
- 82 -
This Chapter reports results obtained from a theoretical analysis of optical fiber based SPR
sensors incorporating a double layer structure, an internal metallic silver (Ag) layer covered by
an oxide layer. The analysis covers three different fiber geometries, the standard one where there
is no change in the fiber geometry and a transmission layout is assumed, a tapered transmissive
topology and a tapered reflective structure (tip or optrode identified configuration). The
performance of these sensing structures is dependent on the interrogation technique considered
with most of the results reported in this chapter associated with the phase interrogation
approach.
5.2 General Considerations
The theoretical fundamentals of plasmonics outlined in Chapter 2 indicate almost any metallic
layer with a dielectric medium attached can support a surface plasmon wave. The propagation
constant of the surface plasmon wave propagating at the interface between a semi-infinite
dielectric and metal can be written as,
k�� = k%� εxnz�εx + nz� , (5.1)
where k% is the free space wave number, εx the dielectric constant of the metal (εx = εxy + iεxyy)
and nz the refractive index of the dielectric. From equation 5.1 the surface plasmon wave may be
supported by the structure providing the following relation is fulfilled:
εxy < −nz� . (5.2)
At optical wavelengths, this condition is verified by several metals, gold and silver being the
preferred materials for applications [105]. As discussed on Chapter four, Gold demonstrates a
higher shift of resonance parameter to changes in the refractive index of sensing layer and is
chemically stable. Silver, on the other hand, displays a narrower width of the SPR curve, favouring
a higher SNR or detection resolution. The sharpness of the resonance curve depends upon the
imaginary part of the dielectric constant of the metal. Therefore, silver which has a larger value of
the imaginary part of the dielectric constant, shows a narrower width of the SPR curve, leading to
a higher SNR or detection resolution. In what concerns the shift of the resonance curve it depends
on the real part of the dielectric constant of the metal. This is larger in the case of gold than for
silver and hence gold demonstrates a higher shift of resonance parameter to changes in the
refractive index of sensing layer. Unfortunately, despite the great performance on sensing silver
is too susceptible to oxidation.

Optical Fiber SPR Sensing Structures with Hybrid Layers
- 83 -
A variety of other metals can sustain surface plasmon resonance, the basic condition the need to
have conduction band electrons able to resonate with light at the appropriate wavelength.
However, some of them are too reactive, as is the case of sodium (Na). Others are too broad in
their SPR response, as copper or aluminum (Cu, Al). Although, the capabilities of copper (Cu) and
aluminum (Al) for SPR sensor applications have also been analysed and it was established both
metals have the ability to be used for SPR sensor sensing. Like silver, copper has the problem to
be chemically vulnerable against oxidation and corrosion, therefore its protection is required for
a stable sensing application.
The oxidation problems can be overcome introducing a cover dielectric layer between the metal
layer and the external medium under measurement. Some of the dielectrics that can be used as
the second dielectric layer are MgF2, Ta2O5, SiO2 or TiO2 [194, 195], but there are some constraints
associated with the utilization of this interface dielectric, the most relevant one the reducing of
the sensor sensitivity since it is located just at the maximum of the surface plasmon wave field.
Consequently, in the first days of SPR sensing, where the device platforms were built assembling
bulk optics components, the inclusion of an interface dielectric layer was not popular, also because
visible light sources were readily available permitting to induce plasmonic behaviour in these
structures, with the additional bonus the alignment procedure could be performed with direct eye
vision.
The situation started to change when the optical fiber moved to be an effective platform for SPR
sensing. Now, the alignment issue was intrinsically solved but the working wavelength became a
problem due to the propagation losses in the fiber, from one side, and also considering it would
be rather convenient to work in the spectral region where the optical communication systems
operate, so the plethora of high performance fiber optic devices became accessible with
acceptable cost. Both factors pointed out to the high convenience to have optical fiber SPR based
sensing structures tailored to work in the 1550 nm wavelength region. This could be achieved
with the metals above indicated if a dielectric layer is included between the metal and the external
medium, consequently the research oriented to have fiber optic structures of this type showing
high refractive index sensing performance around 1550 nm became a rather hot topic.
This Chapter reports the study developed on this subject when the dielectric interface layer is an
oxide. In particular, were analysed in detail fiber optic SPR sensing structures when the interface
layer is titanium dioxide (TiO2), silicon dioxide (SiO2) and aluminum oxide (Al2O3).
Optical Fiber SPR Sensing Structures with Hybrid Layers
- 84 -
5.3 Optical Fiber SPR Sensors with Metallic and Oxide Layers
The structure of the sensing head under analysis is schematically illustrated in figure 5.1. The
sensing region is an uncladded fiber coated with a metallic layer followed by a layer of oxide
material. The length of the sensing region is assumed to be ×, é% the radius of the core and â% the
angle of incidence of the optical ray with respect to the normal to the core-cladding interface.
Figure 5.1 - Schematic illustration of the SPR sensing head under analysis. The cladding of the optical fiber has been
removed in the sensing region and replaced by a metallic film covered with an oxide overlayer.
The choice of the metal for the internal layer was determined by the best performance achieved
concerning the phase sensitivity of the double layer structure. Silver was found to be the most
adequate metal, with the shape of the SPR resonance versus thickness of the silver layer (without
the presence of the external oxide layer) shown in figure 5.2. The data shown was obtained
assuming a silica fiber with 100 µm core diameter, numerical aperture of 0.24 and an uncladded
length L = 1 cm. The refractive indices for the several materials mentioned in this Chapter were
obtained from experimental data available in the literature [163-166].
Figure 5.2 - Resonance of a fiber optic SPR structure with a single silver layer for several thicknesses
(refractive index of the external medium: 1.33).
A relevant information is to establish the thickness of this silver layer that provides the best
sensing performance when the oxide outer layer is added. When the silver layer is considered
Optical Fiber SPR Sensing Structures with Hybrid Layers
- 85 -
alone the data of figure 5.2 indicates a thickness of 70 nm is the one which originates the SPR
resonance with the most adequate characteristics for sensing. However, when the silver layer is
combined with an outer layer of oxide, the thickness of 50 nm for the silver layer is the one that
provides the best sensor performance, so this value was set for the analysis delivered in this
Chapter.
Three different oxide materials were considered for the outer oxide layer, titanium dioxide (TiO2),
silicon dioxide (SiO2) and aluminum oxide (Al2O3). It is known that the introduction of this layer
modifies substantially the characteristics of the SPR resonance, most notably the spectral region
where it appears [190]. This can be checked by the observation of figure 5.3 which shows the
location and shape evolution of the resonance for different thicknesses of the oxide layer. The SPR
sensing head is assumed to be surrounded by a non-dispersive external medium with refractive
index of ^Õ = 1.33.
Figure 5.3 - Spectral behaviour of the double layer fiber optic SPR structure for different thicknesses of the oxide
layer (TiO2, SiO2 and Al2O3 oxide materials are associated with (a), (b) and (c), respectively; refractive index of the
external medium: 1.33).
The inclusion of a TiO2 layer permits the largest displacement of the spectral response of the SPR
resonance, turning possible to locate it within the 830, 1300 and 1550 nm telecommunication
bands by adjusting the layer thickness within an interval technically feasible. This has also
implications in the width of the resonance, which consistently becomes larger when it moves to
longer wavelengths, as is shown in figure 5.4 which displays the spectral width of the resonance
versus the thickness of the oxide layer.
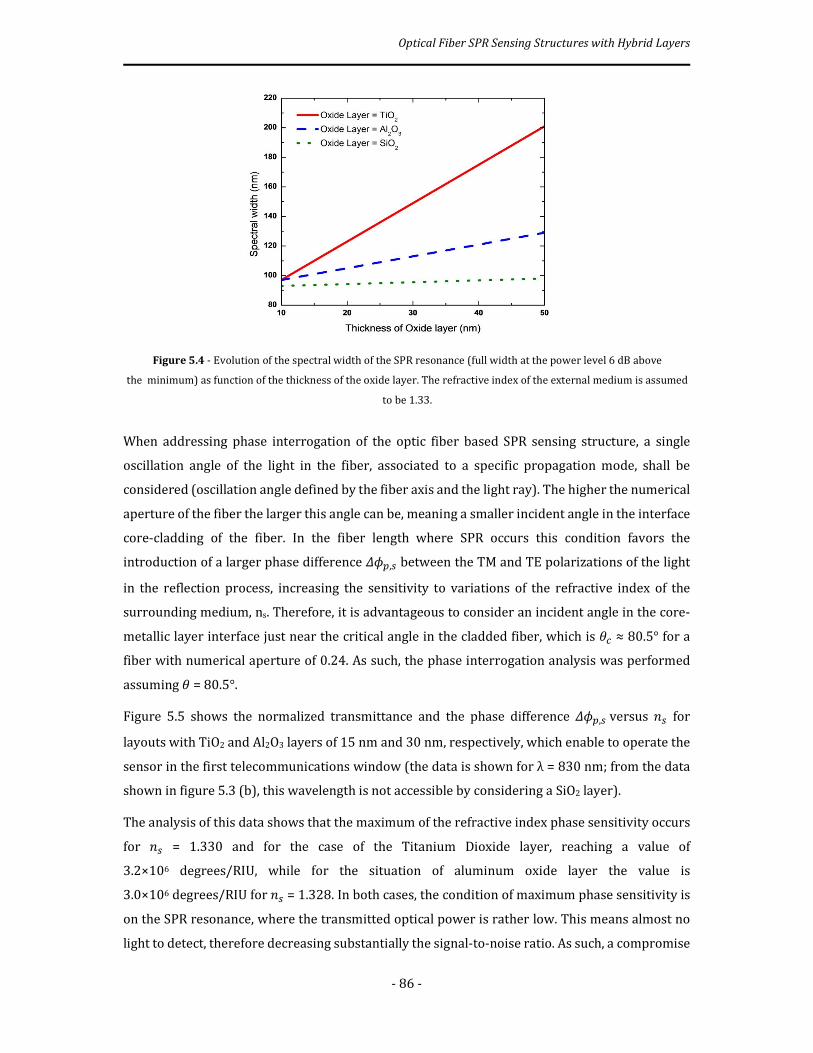
Optical Fiber SPR Sensing Structures with Hybrid Layers
- 86 -
Figure 5.4 - Evolution of the spectral width of the SPR resonance (full width at the power level 6 dB above
the minimum) as function of the thickness of the oxide layer. The refractive index of the external medium is assumed
to be 1.33.
When addressing phase interrogation of the optic fiber based SPR sensing structure, a single
oscillation angle of the light in the fiber, associated to a specific propagation mode, shall be
considered (oscillation angle defined by the fiber axis and the light ray). The higher the numerical
aperture of the fiber the larger this angle can be, meaning a smaller incident angle in the interface
core-cladding of the fiber. In the fiber length where SPR occurs this condition favors the
introduction of a larger phase difference ëÓÔ,Õ between the TM and TE polarizations of the light
in the reflection process, increasing the sensitivity to variations of the refractive index of the
surrounding medium, ns. Therefore, it is advantageous to consider an incident angle in the core-
metallic layer interface just near the critical angle in the cladded fiber, which is âò ≈ 80.5° for a
fiber with numerical aperture of 0.24. As such, the phase interrogation analysis was performed
assuming â = 80.5°.
Figure 5.5 shows the normalized transmittance and the phase difference ëÓÔ,Õ versus ^Õ for
layouts with TiO2 and Al2O3 layers of 15 nm and 30 nm, respectively, which enable to operate the
sensor in the first telecommunications window (the data is shown for λ = 830 nm; from the data
shown in figure 5.3 (b), this wavelength is not accessible by considering a SiO2 layer).
The analysis of this data shows that the maximum of the refractive index phase sensitivity occurs
for ^Õ = 1.330 and for the case of the Titanium Dioxide layer, reaching a value of
3.2×10⁶ degrees/RIU, while for the situation of aluminum oxide layer the value is
3.0×10⁶ degrees/RIU for ^Õ = 1.328. In both cases, the condition of maximum phase sensitivity is
on the SPR resonance, where the transmitted optical power is rather low. This means almost no
light to detect, therefore decreasing substantially the signal-to-noise ratio. As such, a compromise
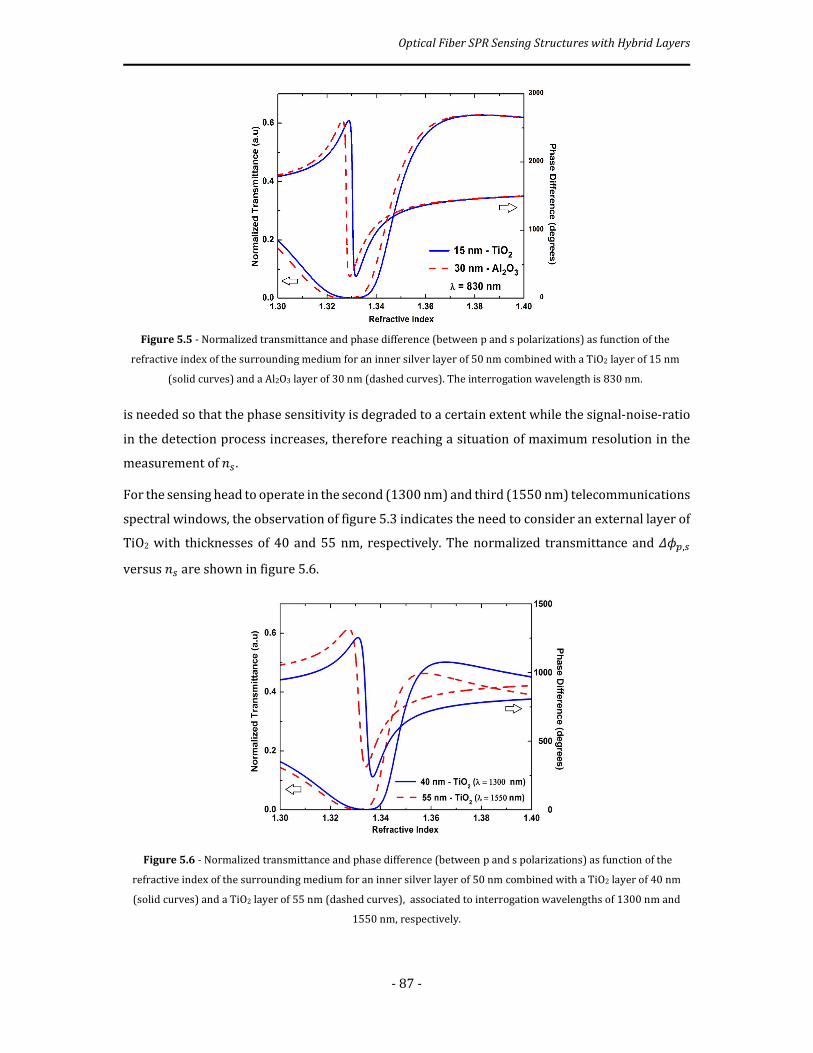
Optical Fiber SPR Sensing Structures with Hybrid Layers
- 87 -
is needed so that the phase sensitivity is degraded to a certain extent while the signal-noise-ratio
in the detection process increases, therefore reaching a situation of maximum resolution in the
measurement of ^Õ .
For the sensing head to operate in the second (1300 nm) and third (1550 nm) telecommunications
spectral windows, the observation of figure 5.3 indicates the need to consider an external layer of
TiO2 with thicknesses of 40 and 55 nm, respectively. The normalized transmittance and ëÓÔ,Õ
versus ^Õ are shown in figure 5.6.
Figure 5.6 - Normalized transmittance and phase difference (between p and s polarizations) as function of the
refractive index of the surrounding medium for an inner silver layer of 50 nm combined with a TiO2 layer of 40 nm
(solid curves) and a TiO2 layer of 55 nm (dashed curves), associated to interrogation wavelengths of 1300 nm and
1550 nm, respectively.
Figure 5.5 - Normalized transmittance and phase difference (between p and s polarizations) as function of the
refractive index of the surrounding medium for an inner silver layer of 50 nm combined with a TiO2 layer of 15 nm
(solid curves) and a Al2O3 layer of 30 nm (dashed curves). The interrogation wavelength is 830 nm.
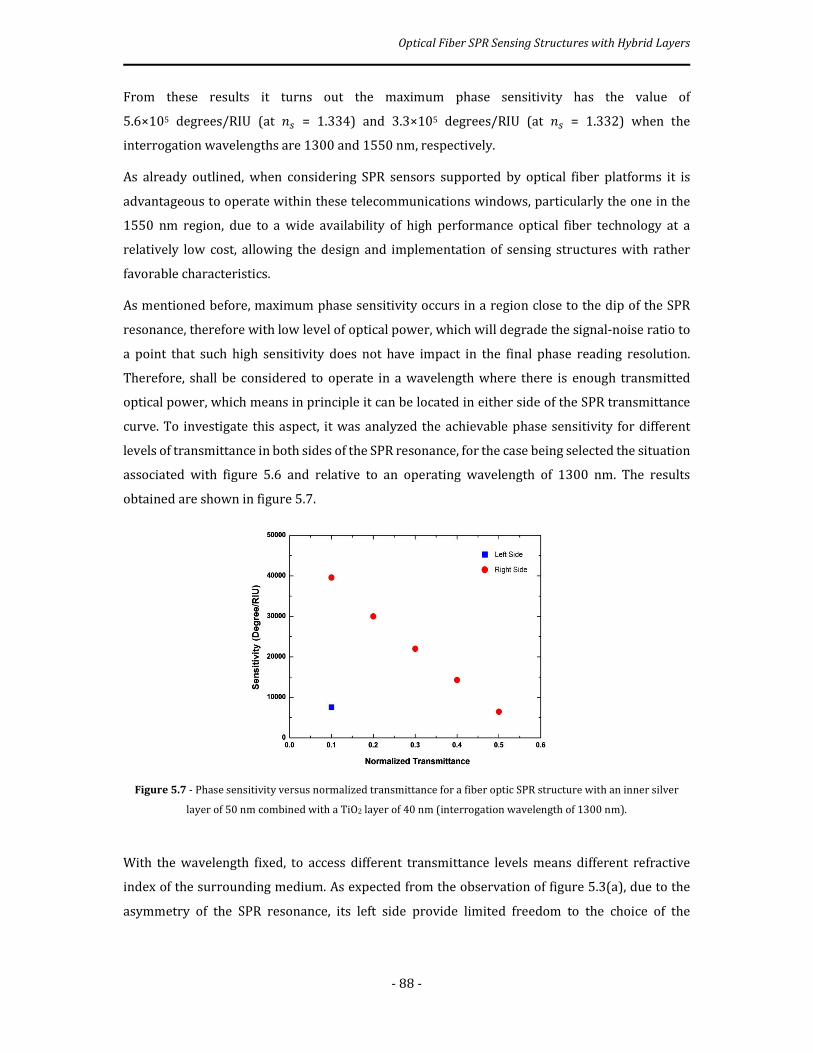
Optical Fiber SPR Sensing Structures with Hybrid Layers
- 88 -
From these results it turns out the maximum phase sensitivity has the value of
5.6×10⁵ degrees/RIU (at ^Õ = 1.334) and 3.3×10⁵ degrees/RIU (at ^Õ = 1.332) when the
interrogation wavelengths are 1300 and 1550 nm, respectively.
As already outlined, when considering SPR sensors supported by optical fiber platforms it is
advantageous to operate within these telecommunications windows, particularly the one in the
1550 nm region, due to a wide availability of high performance optical fiber technology at a
relatively low cost, allowing the design and implementation of sensing structures with rather
favorable characteristics.
As mentioned before, maximum phase sensitivity occurs in a region close to the dip of the SPR
resonance, therefore with low level of optical power, which will degrade the signal-noise ratio to
a point that such high sensitivity does not have impact in the final phase reading resolution.
Therefore, shall be considered to operate in a wavelength where there is enough transmitted
optical power, which means in principle it can be located in either side of the SPR transmittance
curve. To investigate this aspect, it was analyzed the achievable phase sensitivity for different
levels of transmittance in both sides of the SPR resonance, for the case being selected the situation
associated with figure 5.6 and relative to an operating wavelength of 1300 nm. The results
obtained are shown in figure 5.7.
Figure 5.7 - Phase sensitivity versus normalized transmittance for a fiber optic SPR structure with an inner silver
layer of 50 nm combined with a TiO2 layer of 40 nm (interrogation wavelength of 1300 nm).
With the wavelength fixed, to access different transmittance levels means different refractive
index of the surrounding medium. As expected from the observation of figure 5.3(a), due to the
asymmetry of the SPR resonance, its left side provide limited freedom to the choice of the

Optical Fiber SPR Sensing Structures with Hybrid Layers
- 89 -
operating pair (transmittance, sensitivity), indicating the preference to work out in the right side
of the resonance.
Optical sensors based in the SPR phenomenon are inherently highly sensitive to variations of the
external medium refractive index, permitting to detect very small changes of this measurand, for
example variations induced by biochemical processes. Therefore, it is in the context of
biochemical sensing that these devices are rather appellative, pointing out the relevance of
optimizing their performance in the situation where the external medium is water. Consequently,
for each type of the oxide layer it was determined the appropriate thickness in order to attain
maximum sensitivity at the refractive index of water evaluated at the sensor operating
wavelength.
Figure 5.8 shows the maximum phase sensitivity obtained when the operation wavelengths are
630 nm (a) and 830 nm (b). The most immediate outcome of the analysis of this data is that for
the case of operation at 630 nm it is possible to find the required thickness for the oxide materials
considered, TiO2, SiO2 and Al2O3. However, when moving to 830 nm, the layer of SiO2 leaves to be
an option, as the results shown in figure 5.3(b) already indicated.
Figure 5. 8 - Thickness of the oxide layer required to operate with maximum sensitivity to changes of the refractive
index of water, determined by the intersection of the horizontal line (that defines in the y-axis the water refractive
index at the wavelength of operation) with the curves associated with different materials for the oxide layer. The
interrogation wavelength is 630 nm (a) and 830 nm (b).
Figure 5.9 gives similar results but now considering as operating wavelengths 1300 nm (a) and
1550 nm (b). Again, the titanium dioxide option for the external layer permits to address
operation at both wavelengths, eventually being feasible to consider a layer of aluminum oxide
for 1300 nm interrogation, associated with a tackiness of ~86 nm, which is still technically
feasible.

Optical Fiber SPR Sensing Structures with Hybrid Layers
- 90 -
Figure 5.9 - Same as Fig. 5.8 but now with interrogation wavelengths of (a) 1300 nm and (b) 550 nm.
To summarize this section, the analysis presented here permitted to identify the main
characteristics of SPR fiber optic sensing structures with a double layer of metal/oxide,
particularly when phase interrogation is under concern, a readout approach which has been
scarcely analyzed before. Two of these characteristics are particularly relevant, one the possibility
to tune the sensor sensitivity to variations of the refractive index of the surrounding medium, the
other the amenability to tune the measurement operation to a specific wavelength region, most
notably the one around 1550 nm to benefit from the large portfolio of high performance fiber optic
components available at these wavelengths. It was found the inclusion of an internal silver layer
of 50 nm thickness permits the better performance for any of the three different oxide materials
considered for the external layer (TiO2, SiO2, and Al2O3). Also, the results obtained shows the
better flexibility is provided by the inclusion of a layer of titanium dioxide, approach that is
compatible with tuning the sensor operation to a large wavelength window that includes
operationally important wavelengths (630, 830, 1300 and 1550 nm).
5.4 Optical Fiber SPR Sensor with Metallic and Oxide Layers in a
Tapered Transmissive Topology
In this section the same approach described above to analyze combinations of metallic and oxide
layers which was done for normal optical fibers is implemented when tapered optical fibers are
addressed. The structure of the sensing head under analysis is illustrated in figure 5.10. It consists
of a fiber layout with a metal layer covered by an oxide layer. The length of the sensing region is
assumed to be ×, é% the radius of the core and â% the angle of incidence of the optical ray with
respect to the normal to the core-cladding interface. The modelling of this structure follows the
approach presented in Chapter 4.

Optical Fiber SPR Sensing Structures with Hybrid Layers
- 91 -
Figure 5.10 - Schematic illustration of the SPR fiber taper geometry under analysis.
It was considered a step-index multimode silica optical fiber with core diameter of 2éi = 600 µm
and numerical aperture NA = 0.24. The sensing head comprises a tapered layout with a
metal + oxide coating on the region having uniform waist, as illustrated in figure 5.10. The sensing
region has an extension of L = 1 cm, and the total length of the sensing head equals 3L = 3 cm. The
taper ratio éi/é0 = 2 and the oscillation angle considered in this analysis is êi= 10°. The SPR
sensing head is assumed to be surrounded by a non-dispersive external medium with refractive
index of ^Õ = 1.33.
As explained in the last section, when considering the sensor sensitivity the most adequate metal
for the inner layer of silver. The thickness of this layer is also an important parameter, therefore
it shall be chosen the value that optimizes de sensor performance. Figure 5.11 gives the SPR
resonance for several values of the silver layer thickness (without the presence of the external
oxide layer). When this layer is combined with an outer layer of oxide, the thickness of 80 nm for
the silver layer provides the best sensor performance, so this value was set for the analysis from
where comes out the results delivered in the following.
Figure 5.12 shows the effect of a coating layer with 20 nm of different oxides (TiO2, Al2O3 and SiO2)
over a 80 nm layer of Ag, for two different interrogation wavelengths, (a) 632.8 nm and (b) 1550
nm. In this figure the phase difference between s and p polarizations and the corresponding phase
sensitivities were considered. Notice that for a particular overlay material, the refractive index of
the surrounding medium is different in the situation of resonance in each wavelength, as it should
be because the other three degrees of freedom (oscillation angle, layers thicknesses and
wavelength) are fixed.
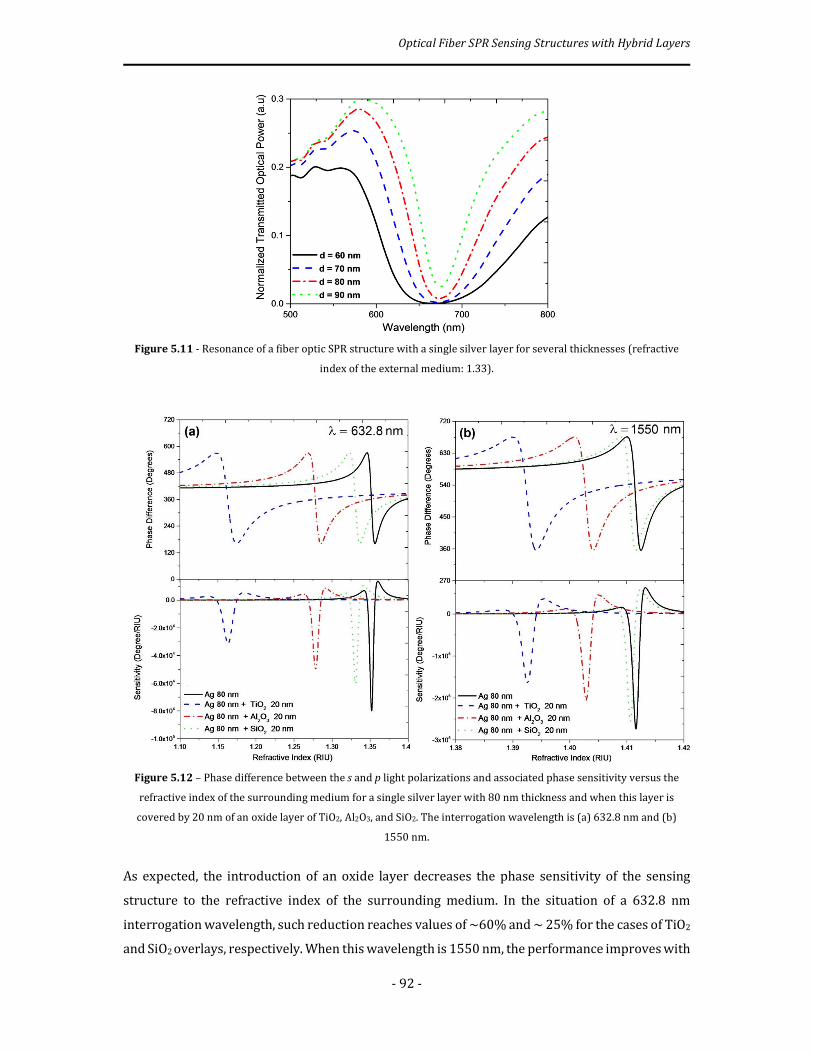
Optical Fiber SPR Sensing Structures with Hybrid Layers
- 92 -
Figure 5.11 - Resonance of a fiber optic SPR structure with a single silver layer for several thicknesses (refractive
index of the external medium: 1.33).
Figure 5.12 – Phase difference between the s and p light polarizations and associated phase sensitivity versus the
refractive index of the surrounding medium for a single silver layer with 80 nm thickness and when this layer is
covered by 20 nm of an oxide layer of TiO2, Al2O3, and SiO2. The interrogation wavelength is (a) 632.8 nm and (b)
1550 nm.
As expected, the introduction of an oxide layer decreases the phase sensitivity of the sensing
structure to the refractive index of the surrounding medium. In the situation of a 632.8 nm
interrogation wavelength, such reduction reaches values of ~60% and ~ 25% for the cases of TiO2
and SiO2 overlays, respectively. When this wavelength is 1550 nm, the performance improves with
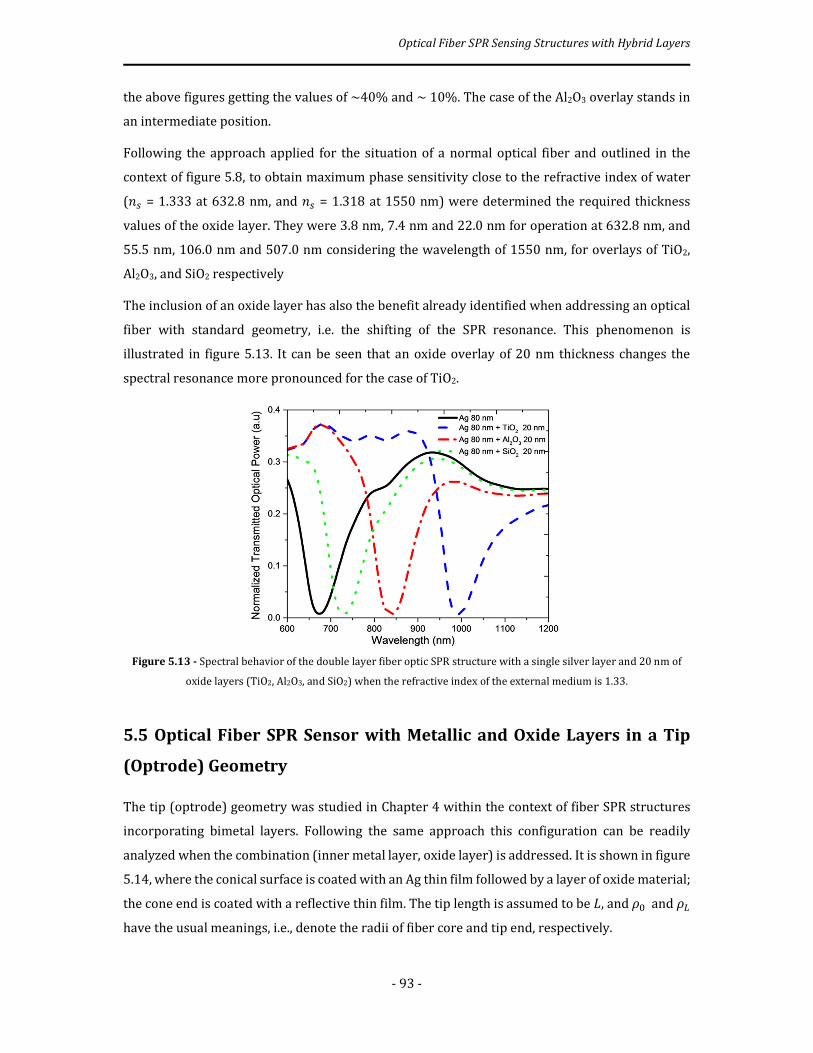
Optical Fiber SPR Sensing Structures with Hybrid Layers
- 93 -
the above figures getting the values of ~40% and ~ 10%. The case of the Al2O3 overlay stands in
an intermediate position.
Following the approach applied for the situation of a normal optical fiber and outlined in the
context of figure 5.8, to obtain maximum phase sensitivity close to the refractive index of water
(^Õ = 1.333 at 632.8 nm, and ^Õ = 1.318 at 1550 nm) were determined the required thickness
values of the oxide layer. They were 3.8 nm, 7.4 nm and 22.0 nm for operation at 632.8 nm, and
55.5 nm, 106.0 nm and 507.0 nm considering the wavelength of 1550 nm, for overlays of TiO2,
Al2O3, and SiO2 respectively
The inclusion of an oxide layer has also the benefit already identified when addressing an optical
fiber with standard geometry, i.e. the shifting of the SPR resonance. This phenomenon is
illustrated in figure 5.13. It can be seen that an oxide overlay of 20 nm thickness changes the
spectral resonance more pronounced for the case of TiO2.
Figure 5.13 - Spectral behavior of the double layer fiber optic SPR structure with a single silver layer and 20 nm of
oxide layers (TiO2, Al2O3, and SiO2) when the refractive index of the external medium is 1.33.
5.5 Optical Fiber SPR Sensor with Metallic and Oxide Layers in a Tip
(Optrode) Geometry
The tip (optrode) geometry was studied in Chapter 4 within the context of fiber SPR structures
incorporating bimetal layers. Following the same approach this configuration can be readily
analyzed when the combination (inner metal layer, oxide layer) is addressed. It is shown in figure
5.14, where the conical surface is coated with an Ag thin film followed by a layer of oxide material;
the cone end is coated with a reflective thin film. The tip length is assumed to be ×, and é% and éñ
have the usual meanings, i.e., denote the radii of fiber core and tip end, respectively.

Optical Fiber SPR Sensing Structures with Hybrid Layers
- 94 -
Figure 5.14 - Schematic illustration of the SPR fiber optrode under analysis. The top and bottom of the probe are
polished to the same angle. The cladding of the optical fiber tip has been removed in the sensing region and replaced
by a metallic film covered with an oxide overlayer.
In this analysis, it was considered a multimode silica fiber with 100 µm core diameter with
numerical aperture of 0.24, tip end diameter 60 µm and sensing region L = 1 cm. Accordingly, the
number of reflections estimated is ãú�=60. The refractive indices for the thin film materials were
obtained from experimental data available in the literature [163-166]. Concerning the metallic
layer, we have found in a previous study that silver is the most adequate one [196].
Figure 5.15 shows the spectrum of the light returning from the sensing head for different
thicknesses of the silver layer and, when combined with the spectral curves obtained when the
oxide layer is included, it turns out the best thickness for the silver layer is 80 nm, so this value
was set for the analysis that provided the results delivered in the following.
Figure 5.15 - Spectra of the normalized returned optical power for a fiber optic SPR structure with a single silver
layer for several thicknesses (refractive index of the external medium: 1.33).
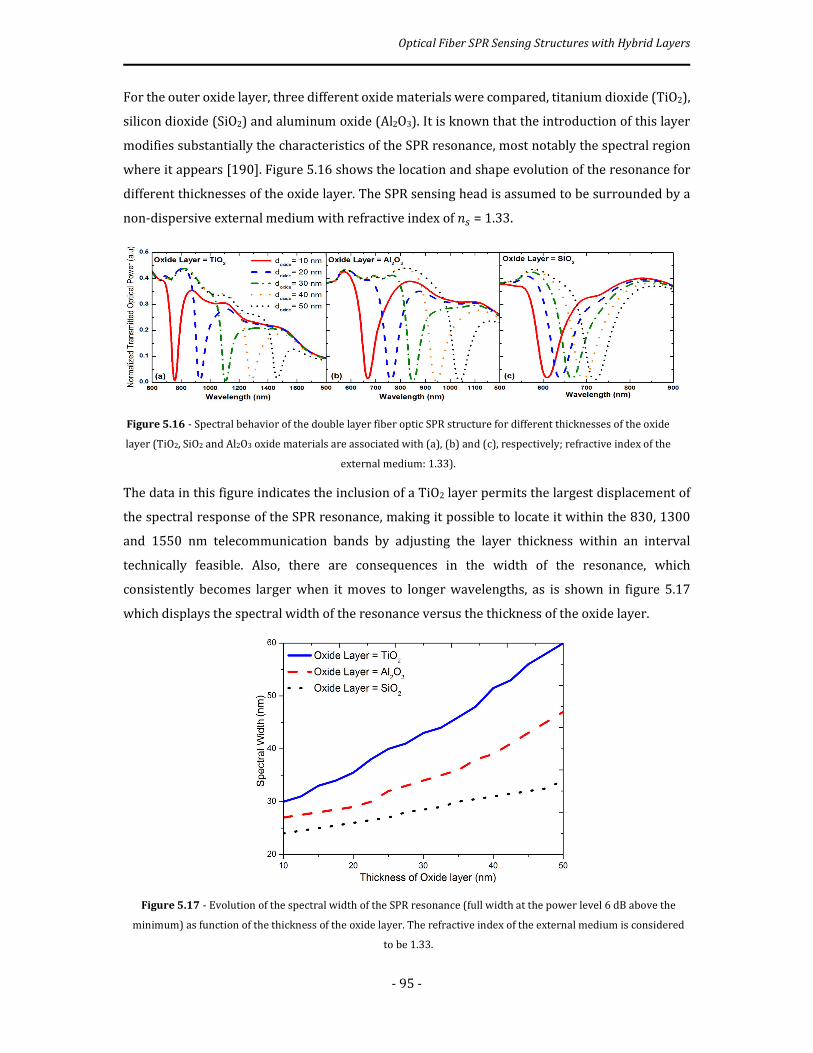
Optical Fiber SPR Sensing Structures with Hybrid Layers
- 95 -
For the outer oxide layer, three different oxide materials were compared, titanium dioxide (TiO2),
silicon dioxide (SiO2) and aluminum oxide (Al2O3). It is known that the introduction of this layer
modifies substantially the characteristics of the SPR resonance, most notably the spectral region
where it appears [190]. Figure 5.16 shows the location and shape evolution of the resonance for
different thicknesses of the oxide layer. The SPR sensing head is assumed to be surrounded by a
non-dispersive external medium with refractive index of ^Õ = 1.33.
Figure 5.16 - Spectral behavior of the double layer fiber optic SPR structure for different thicknesses of the oxide
layer (TiO2, SiO2 and Al2O3 oxide materials are associated with (a), (b) and (c), respectively; refractive index of the
external medium: 1.33).
The data in this figure indicates the inclusion of a TiO2 layer permits the largest displacement of
the spectral response of the SPR resonance, making it possible to locate it within the 830, 1300
and 1550 nm telecommunication bands by adjusting the layer thickness within an interval
technically feasible. Also, there are consequences in the width of the resonance, which
consistently becomes larger when it moves to longer wavelengths, as is shown in figure 5.17
which displays the spectral width of the resonance versus the thickness of the oxide layer.
Figure 5.17 - Evolution of the spectral width of the SPR resonance (full width at the power level 6 dB above the
minimum) as function of the thickness of the oxide layer. The refractive index of the external medium is considered
to be 1.33.

Optical Fiber SPR Sensing Structures with Hybrid Layers
- 96 -
To perform the study of phase interrogation of fiber optic based SPR sensing structures, a single
oscillation angle of the light in the fiber, associated to a specific propagation mode, shall be
considered (oscillation angle defined by the fiber axis and the light ray). The higher the numerical
aperture of the fiber the larger this angle can be, meaning a smaller angle of incidence in the
interface core-cladding of the fiber. In the fiber length where SPR occurs this condition favors the
introduction of a larger phase difference ëÓÔ,Õ between the TM and TE polarizations of the light
in the reflection process, increasing the sensitivity to variations of the refractive index of the
surrounding medium, ^Õ. As mentioned in the prior section, the phase shift introduced in each
reflection was assumed constant, the average phase shift at the beginning of the taper
is >ÖÓÔ,Õ?÷q = (ÓÔ − ÓÕ)÷q , with í% = 80° , and at the end of the
taper >ÖÓÔ,Õ?÷(ñ) = (ÓÔ − ÓÕ)÷(ñ), with íñ = 73.
Figure 5.18 shows the normalized transmittance and the phase difference ëÓÔ,Õversus ^Õ for
layouts with TiO2 and Al2O3 layers of 15 nm and 30 nm, respectively, which enable to operate the
sensor in the first telecommunications window (the data is shown for λ = 830 nm; from the data
given in figure 5.16(c), this wavelength is not accessible by considering a SiO2 layer). The analysis
of the results shows the maximum of the refractive index phase sensitivity, äå,è = δ(ΔÓ³,¥)/δn¥,
occurs close to ^Õ = 1.330, with a value of 5.72×10⁴ degrees/RIU for the case of the titanium
dioxide layer, while for the situation of aluminum oxide layer a slightly smaller value is obtained
(5.57×10⁴ degrees/RIU for ns = 1.327). In both cases, maximum phase sensitivity is close to the
SPR resonance, where the transmitted optical power is rather low. This means almost no light to
detect, therefore decreasing substantially the signal-to-noise ratio. As such, a compromise is
needed so that the phase sensitivity is degraded to a certain extent while the signal-noise-ratio in
the detection process increases, therefore reaching a situation of maximum resolution in the
measurement of ^Õ . Further analysis on this topic is delivered below.
For the sensing head to operate in the second (1300 nm) and third (1550 nm) telecommunications
spectral windows, the observation of figure 5.16 indicates the need to consider an external layer
of TiO2 with thicknesses of 40 and 55 nm, respectively. The normalized transmittance and
ëÓÔ,Õ versus ns are shown in figure 5.19. Regarding these results it turns out the maximum phase
sensitivity has the value of 4.11×10⁴ degrees/RIU (at ns = 1.335) and 3.1×10⁴ degrees/RIU (at
ns = 1.332) when the interrogation wavelengths are 1300 and 1550 nm, respectively.
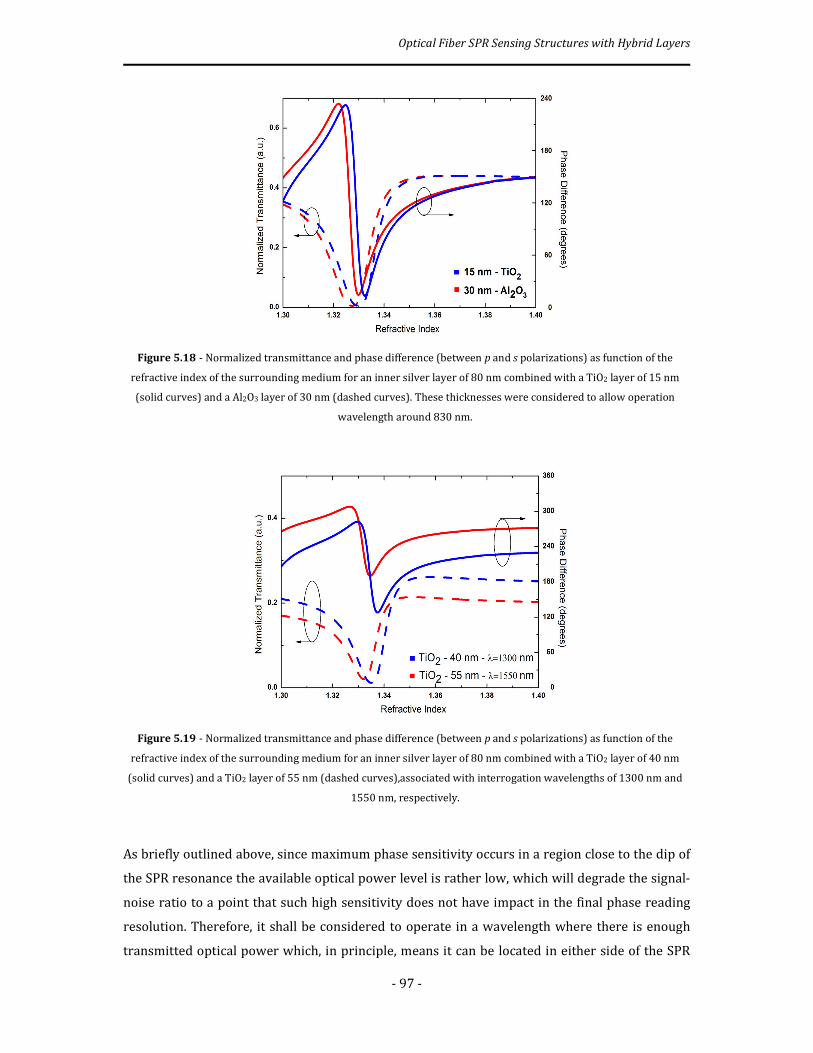
Optical Fiber SPR Sensing Structures with Hybrid Layers
- 97 -
Figure 5.18 - Normalized transmittance and phase difference (between p and s polarizations) as function of the
refractive index of the surrounding medium for an inner silver layer of 80 nm combined with a TiO2 layer of 15 nm
(solid curves) and a Al2O3 layer of 30 nm (dashed curves). These thicknesses were considered to allow operation
wavelength around 830 nm.
Figure 5.19 - Normalized transmittance and phase difference (between p and s polarizations) as function of the
refractive index of the surrounding medium for an inner silver layer of 80 nm combined with a TiO2 layer of 40 nm
(solid curves) and a TiO2 layer of 55 nm (dashed curves),associated with interrogation wavelengths of 1300 nm and
1550 nm, respectively.
As briefly outlined above, since maximum phase sensitivity occurs in a region close to the dip of
the SPR resonance the available optical power level is rather low, which will degrade the signal-
noise ratio to a point that such high sensitivity does not have impact in the final phase reading
resolution. Therefore, it shall be considered to operate in a wavelength where there is enough
transmitted optical power which, in principle, means it can be located in either side of the SPR

Optical Fiber SPR Sensing Structures with Hybrid Layers
- 98 -
transmittance curve. To investigate this aspect, it was analyzed the achievable phase sensitivity
for different levels of transmittance in both sides of the SPR resonance, for the case being selected
the situation associated with figure 5.19, i.e. relative to an operating wavelength of 1300 nm. The
results obtained are shown in figure 5.20.
Figure 5.20 - Phase sensitivity versus normalized transmittance for a fiber optic SPR structure with an inner silver
layer of 80 nm combined with a TiO2 layer of 40 nm (interrogation wavelength of 1300 nm).
With the wavelength fixed, to access different transmittance levels means a different refractive
index of the surrounding medium. As expected from the observation of figure 5.16(a), due to the
asymmetry of the SPR resonance, its left side provides limited freedom to the choice of the
operating pair (transmittance, sensitivity), indicating the preference to work out in the right side
of the resonance. This statement is confirmed by the results shown in figure 5.20 which indicates,
for example, that for a normalized transmittance level of 0.2, the right side of the SPR resonance
permits a phase sensitivity of ∼7×10³ degrees/RIU, value that reduces to ∼2.8×10³ degrees/RIU
when the left side is selected.
5.6 Conclusion
This Chapter addressed the study of optical fiber based SPR sensing structures incorporating a
hybrid overlay, with an inner layer of metal and a dielectric outside layer. The metal considered
was silver and the dielectrics were oxide materials, specifically titanium dioxide, silicon dioxide
and aluminum oxide. The analysis of these structures developed focusing on the reading of the
variations of the light phase difference between the p and s polarization states induced by
variations of the refractive index of the surrounding medium. Another central element was the
study of the dependence of the resonance wavelength on the characteristics of the oxide overlay,
Optical Fiber SPR Sensing Structures with Hybrid Layers
- 99 -
which permits to tailor the operation wavelength to a spectral window more amenable to the
optical fiber technology, most notably to the spectral region around 1550 nm due to its
widespread utilization in optical communications.
Three different fiber configurations were considered, one associated with the standard fiber
geometry and the other two with tapered and tip (optrode) layouts. In all cases was studied the
phase sensitivity to variations of the external medium refractive index and analyzed the
consequences of the spectral region of maximum phase sensitivity be located at the plasmonic
resonance wavelength, meaning reduced levels of optical power which implies a degradation of
the signal-to-noise ratio, therefore of the device phase sensitivity. It was outlined a strategy to
attenuate this situation by selecting the operation wavelength in order to be located at the side of
the spectral resonance, its precise position determined by a compromise between available
optical power and phase sensitivity in order to obtain the maximum readout resolution.
As already indicated in previous chapter, the results presented here were obtained from a
theoretical/computational analysis, not including experimental validation. Some clues of how to
acquire such validation will be delivered in Chapter 7.
6
Grating Assisted Optical Fiber Sensing Structures
Supported by Plasmonics
Summary: This Chapter deals with the integration of fiber gratings with standard fiber optic SPR
sensing technology to bring it to the singlemode domain, therefore turning it compatible with the
vast field of fiber optic communication systems with its large portfolio of advanced and cost effective
components and devices. In particular, emphasis is allocated on the theoretical analysis of long
period grating (LPG) assisted optical fiber sensing structures supported by Plasmonics. It is
concluded this (LPG + SPR) combination brings to the forefront the phase interrogation of SPR
sensors and are outlined paths for the experimental investigation of interrogation techniques of this
type, including advanced ones as the Pound-Drever-Hall interferometric interrogation approach.

Grating Assisted Optical Fiber Sensing Structures Supported by Plasmonics
- 101 -
6.1 Introduction
In previous chapters were analyzed from a theoretical and computational point of view fiber optic
sensing structures supported by the phenomenon of plasmonic resonance where the fiber
cladding is removed to perform the deposition of the metallic thin film. Several configurations
were investigated, starting with the basic one in which the cladding is removed but the core
geometry is kept, and proceeding to potentially more favorable structures associated with fiber
tapering and its particular but rather important case of the optrode (reflective) layout. Single
metal layer, double metal layers and the hybrid (metal and dielectric) pattern were the subject of
study. These structures require fibers with large cores to support light rays with oscillation angles
(modes) large enough to induce plasmonic resonance with a fairly high Q-factor, which means
they are not compatible with the optical fiber technology developed for optical communications
which stands on singlemode propagation. This is certainly a relevant limitation for the application
of fiber optic based SPR sensors because they require components and devices specific for this
application with the inherent cost increase, contrary to would happen if the fiber singlemode
approach become compatible with SPR sensing so, in such case, the remarkably large portfolio of
fiber optic components, optical sources, optical detectors and optical systems developed within
the realm of optical fiber communications would become readily available when addressing the
development of SPR based optical fiber sensors.
As a matter of fact, it is possible to turn compatible these two worlds by the introduction of a
connection element and for optical fibers it exists, the fiber grating, with its two main
materializations, the Fiber Bragg Grating (FBG) and the Long Period Grating (LPG). The
combination (FBG + SPR) in optical fibers have been the target of several studies looking to the
development of fiber optic sensors operating within the domain of fiber optic single mode
technology. The same cannot be stated when addressing the combination (LPG + SPR), which
actually has the potential to support the development of high performance fiber sensors mostly
when phase interrogation is applied. The circumstance this interrogation approach is rarely
considered in SPR based fiber optic sensing may explain the reduced focus on LPGs within this
context.
This Chapter presents some clues of how such combination (LPG + SPR) can be addressed to reach
workable fiber optic sensing devices. It is also proposed its coupling to an highly sensitive
interferometric technique that may progress SPR optical sensing to new measurement
performance levels. The Chapter is organized in the following way. It starts with a short review of
fiber gratings and proceeds to another one where it is reported some of the developments related
with the application of the combination (FBG + SPR) in SPR sensing. Then, it is outlined how can
be applied the combination (LPG + SPR) to achieve singlemode supported fiber optic SPR sensors
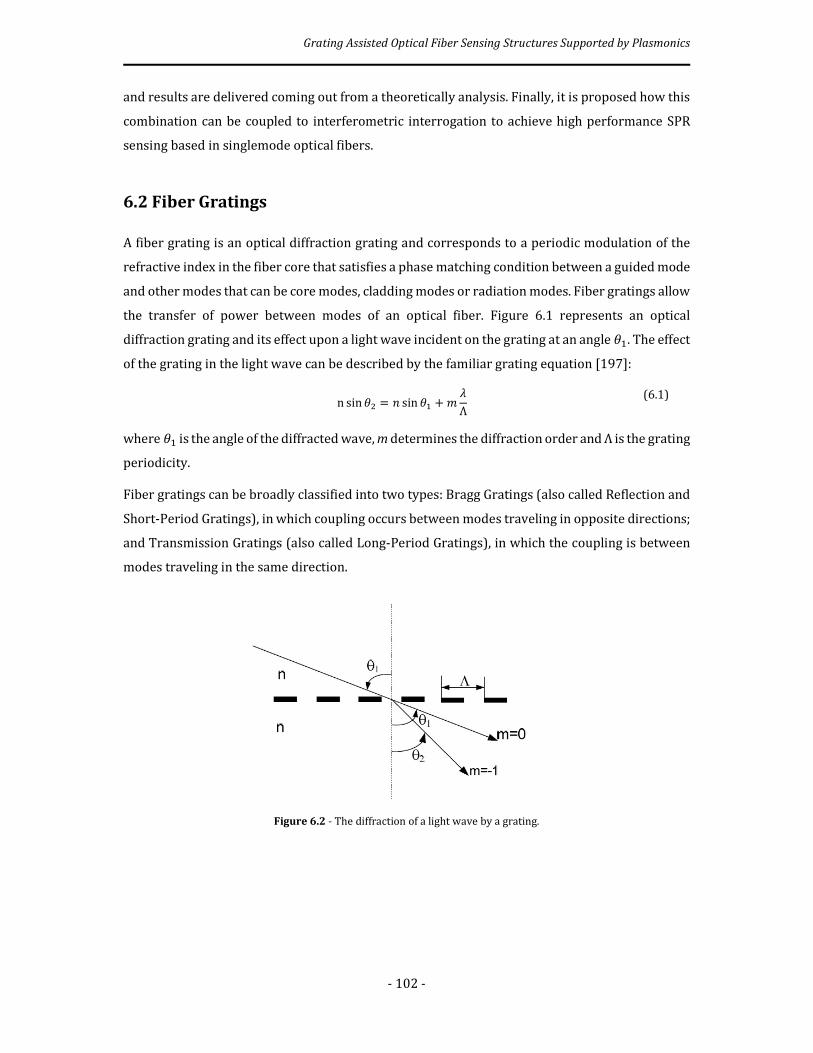
Grating Assisted Optical Fiber Sensing Structures Supported by Plasmonics
- 102 -
and results are delivered coming out from a theoretically analysis. Finally, it is proposed how this
combination can be coupled to interferometric interrogation to achieve high performance SPR
sensing based in singlemode optical fibers.
6.2 Fiber Gratings
A fiber grating is an optical diffraction grating and corresponds to a periodic modulation of the
refractive index in the fiber core that satisfies a phase matching condition between a guided mode
and other modes that can be core modes, cladding modes or radiation modes. Fiber gratings allow
the transfer of power between modes of an optical fiber. Figure 6.1 represents an optical
diffraction grating and its effect upon a light wave incident on the grating at an angle âX. The effect
of the grating in the light wave can be described by the familiar grating equation [197]:
n sin â� = ^ sin âX + | ÅΛ (6.1)
where âX is the angle of the diffracted wave, m determines the diffraction order and Λ is the grating
periodicity.
Fiber gratings can be broadly classified into two types: Bragg Gratings (also called Reflection and
Short-Period Gratings), in which coupling occurs between modes traveling in opposite directions;
and Transmission Gratings (also called Long-Period Gratings), in which the coupling is between
modes traveling in the same direction.
Figure 6.2 - The diffraction of a light wave by a grating.
Grating Assisted Optical Fiber Sensing Structures Supported by Plasmonics
- 103 -
6.2.1 Fiber Bragg Gratings
Figure 6.2 illustrates the general reflection layout for a fiber grating. In the case of a Bragg grating,
a mode with an incidence angle of âX is reflected into the same mode but traveling in the opposite
direction with an angle of â� = -âX.
Since the mode propagation constant β is simply defined by j =2�Ï ^�, where ^� = ^ò�_{^â,
the equation (6.1) can be rewritten for guided modes as [198, 199]:
j� = jX +| 2�Λ (6.2)
where jXand j2 are the constants of the propagating modes. In fiber gratings usually dominates
the first order diffraction, m=-1. This condition is illustrated in figure 6.2 in the j axis diagram.
In this figure, the solid circles represent bound core modes, the open circles represent cladding
modes and the region filled with dots represents the continuum of radiation modes. A negative j
value describes a mode that propagates in the –z direction. By using equation (6.2) and the fact
that in this case j< 0, it is obtained the resonant wavelength for the reflection of a mode of index
^�,X into a mode of index ^�,� as given by:
λ = (^�,X + ^�,�)Λ (6.3)
If the two modes are identical, the familiar result for the Bragg reflection would be obtained as:
λ� = 2^�Λ (6.4)
The principle of operation for these gratings is illustrated in figure 6.3.
Figure 6.2 - The diffraction of a light wave by a grating. Ray-optics illustration of core-mode Bragg reflection by a
fiber Bragg grating and the β axis diagram demonstrating the grating coupling condition for m=-1 [199].

Grating Assisted Optical Fiber Sensing Structures Supported by Plasmonics
- 104 -
Figure 6.3 - FBG working principle.
In this type of grating, the light in the fundamental guided mode is perturbed by the presence of
the periodic refractive index modulation in the fiber core and is reflected for wavelengths that
satisfy equation (6.4). The typical response of a FBG is shown figure 6.4.
Figure 6.4 - Spectra of a typical FBG (data obtained at INESC TEC).
Figure 6.4(a) represents the transmission spectrum of a FBG where it can be seen the wavelength
that satisfies the condition of phase matching, associated to a loss dip in the transmission
spectrum. Figure 6.4(b) represents the reflection spectrum of the same FBG.
6.2.2 Long-Period Fiber Gratings
Figure 6.5 illustrates the diffraction by a long-period grating of a mode with a bounce angle of âX
into a co-propagating mode with a bounce angle of â�. In this illustration, the first mode is a core
mode whereas the second is a cladding mode. Since here β2>0, the equation (6.1) predicts the
resonant wavelength for a long-period grating as

Grating Assisted Optical Fiber Sensing Structures Supported by Plasmonics
- 105 -
λ = (^�,X − ^�,�)Λ (6.5)
Analyzing the equations (6.4) and (6.5), it can be seen that for copropagating coupling, at a given
wavelength, a much longer grating period L is required than for counter-propagating coupling.
figure 6.6 illustrates the principle of operation of long period gratings proposed by Vengsarkar et
al. [198].
Figure 6.6 - Coupling of the fundamental guided mode to cladding modes in a long-period grating.
Light in the fundamental guided mode is perturbed by the presence of the grating in the fiber core.
The difference between the propagation constant of the guided mode and the phase-matching
vector of the grating equals the propagation constant of one or more cladding modes at
appropriate wavelengths, which correspond to a specific cladding mode (order m) [199]. Phase-
matching is a necessary, but not sufficient, condition for coupling between the core-guided and
the cladding-guided modes. Cladding-modes exist, at least, in a three-layer cylindrical waveguide
and share similarities with the modes present in multi-mode fibers (MMF) which supports
hundreds of modes. For significant coupling to occur between the core-guided mode and a
cladding-guided mode there must also be an overlap between the mode profiles. This requirement
explains why, over large wavelength ranges, coupling occurs only to a finite number of distinct
Figure 6.5 - Ray-optics illustration of cladding-mode coupling by a long-period grating and the β axis diagram
demonstrating the grating coupling condition for m=-1 [199].
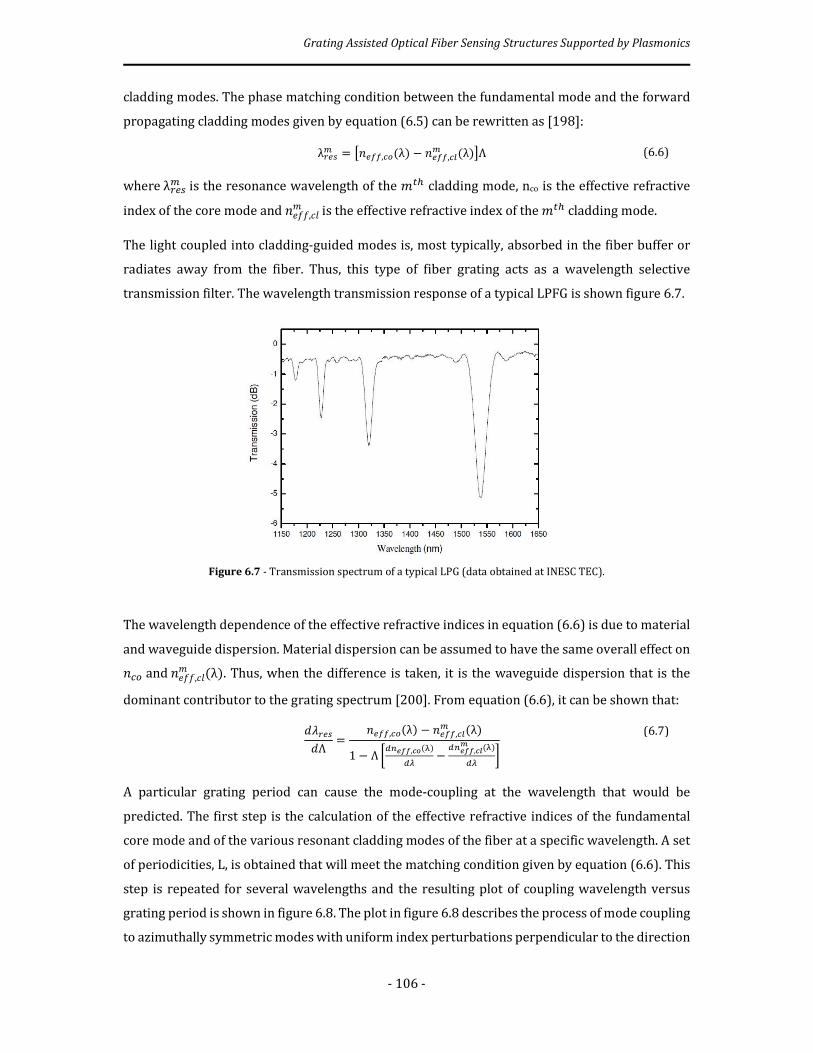
Grating Assisted Optical Fiber Sensing Structures Supported by Plasmonics
- 106 -
cladding modes. The phase matching condition between the fundamental mode and the forward
propagating cladding modes given by equation (6.5) can be rewritten as [198]:
λú�Õw = D^�,ò�(λ) − ^�,ò�w (λ)HΛ (6.6)
where λú�Õw is the resonance wavelength of the |ü� cladding mode, nco is the effective refractive
index of the core mode and ^a��,ô�| is the effective refractive index of the |ü� cladding mode.
The light coupled into cladding-guided modes is, most typically, absorbed in the fiber buffer or
radiates away from the fiber. Thus, this type of fiber grating acts as a wavelength selective
transmission filter. The wavelength transmission response of a typical LPFG is shown figure 6.7.
Figure 6.7 - Transmission spectrum of a typical LPG (data obtained at INESC TEC).
The wavelength dependence of the effective refractive indices in equation (6.6) is due to material
and waveguide dispersion. Material dispersion can be assumed to have the same overall effect on
^ò� and ^a��,ô�| (λ). Thus, when the difference is taken, it is the waveguide dispersion that is the
dominant contributor to the grating spectrum [200]. From equation (6.6), it can be shown that:
UÅú�ÕUΛ = ^�,ò�(λ) − ^�,ò�w (λ)1 − Λ ��å���,��(°)
�Ï − �å���,�� (°)�Ï
(6.7)
A particular grating period can cause the mode-coupling at the wavelength that would be
predicted. The first step is the calculation of the effective refractive indices of the fundamental
core mode and of the various resonant cladding modes of the fiber at a specific wavelength. A set
of periodicities, L, is obtained that will meet the matching condition given by equation (6.6). This
step is repeated for several wavelengths and the resulting plot of coupling wavelength versus
grating period is shown in figure 6.8. The plot in figure 6.8 describes the process of mode coupling
to azimuthally symmetric modes with uniform index perturbations perpendicular to the direction
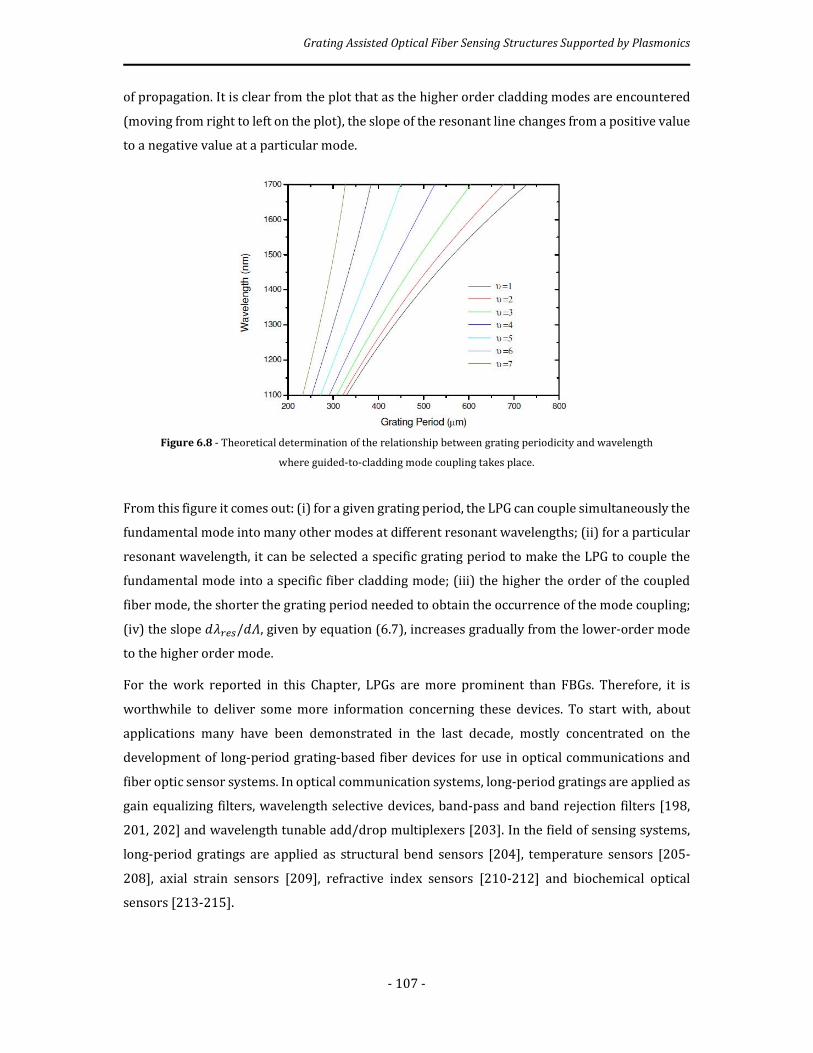
Grating Assisted Optical Fiber Sensing Structures Supported by Plasmonics
- 107 -
of propagation. It is clear from the plot that as the higher order cladding modes are encountered
(moving from right to left on the plot), the slope of the resonant line changes from a positive value
to a negative value at a particular mode.
Figure 6.8 - Theoretical determination of the relationship between grating periodicity and wavelength
where guided-to-cladding mode coupling takes place.
From this figure it comes out: (i) for a given grating period, the LPG can couple simultaneously the
fundamental mode into many other modes at different resonant wavelengths; (ii) for a particular
resonant wavelength, it can be selected a specific grating period to make the LPG to couple the
fundamental mode into a specific fiber cladding mode; (iii) the higher the order of the coupled
fiber mode, the shorter the grating period needed to obtain the occurrence of the mode coupling;
(iv) the slope UÅú�Õ/U!, given by equation (6.7), increases gradually from the lower-order mode
to the higher order mode.
For the work reported in this Chapter, LPGs are more prominent than FBGs. Therefore, it is
worthwhile to deliver some more information concerning these devices. To start with, about
applications many have been demonstrated in the last decade, mostly concentrated on the
development of long-period grating-based fiber devices for use in optical communications and
fiber optic sensor systems. In optical communication systems, long-period gratings are applied as
gain equalizing filters, wavelength selective devices, band-pass and band rejection filters [198,
201, 202] and wavelength tunable add/drop multiplexers [203]. In the field of sensing systems,
long-period gratings are applied as structural bend sensors [204], temperature sensors [205-
208], axial strain sensors [209], refractive index sensors [210-212] and biochemical optical
sensors [213-215].
Grating Assisted Optical Fiber Sensing Structures Supported by Plasmonics
- 108 -
As an historical note, the first long period grating inscribed successfully in an optical fiber was
described in 1996 by Vengsarkar et al. [216] for band-rejection filters and, in the same year, Bhatia
et al. [217] presented the first application of long period gratings for sensing. At that time there
was also presented the first theoretical studies on LPGs. The first theoretical model to determine
the cladding modes was presented in 1996 by Bhatia [218] and is based on a two-layer model that
neglects the effect of the core in the calculation of the cladding modes. In 1997 Erdogan presented
a model that includes the effect of the core in the calculation of the cladding modes [219]. This
model is known as the three – layer model. In these two models, the LPG was assumed to be
fabricated by using UV laser radiation, resulting in cladding modes with symmetric distribution.
The development of other techniques for the manufacture of LPGs (electric arc, CO2, etc.) led to
coupling to asymmetric cladding modes because these techniques produces a change in the
refractive index of the core that is non-uniform across the fiber cross section. This new situation
is not described by the two previous models. In 2003, Anemogiannis et al. [220] presented a
theoretical model that already covers this situation and their implementation is more complex but
has the advantage of solving the problems of asymmetric modes.
For long period gratings the analysis above outlined indicates the periodic modulation of the
refractive index in the fiber core shall be situated typically in the range from 100 μm to 1000 μm
along a fiber length of few centimeters. This modulation can be induced in the fiber using different
processes: UV laser irradiation, electric-arc discharge, periodic etching, CO2 laser irradiation and
mechanical processes are the most common techniques. Due to such broad range of techniques,
LPGs can been written virtually in all kinds of fiber, namely, in standard singlemode
telecommunications fibers [198], in two-mode or few-mode fibers [221], in polarization
maintaining fibers [222], in D-fibers [213], in non-photosensitive fibers [223], in multimode fibers
[224], in specially designed fibers: dispersion shifted [198], dispersion compensating [225],
depressed inner cladding [226], dual core [227] progressive three layered [228], in hybrid fibers
containing silica and polymers [229] or metal coatings [230], in a microstructured polymer fiber
[231] and in photonic crystal fibers [232], in pure-silica-core fiber [212] and other doped fibers
[233].
As mentioned at the end of Section 1, in optical fiber sensing the combination of LPGs with the
SPR phenomenon has been scarcely explored, and indeed it has rather interesting characteristics:
one of them is the utilization of single mode optical fibers without the need to remove the cladding
in order to access the core and to cover it with the metal layer to induce the plasmonic resonance
light behavior. Therefore, the geometry of the single mode optical fiber is maintained, meaning
full compatibility of such devices with standard optical fiber technology that shows a huge
portfolio due to the optical communications demand. A second one is the amenability to change
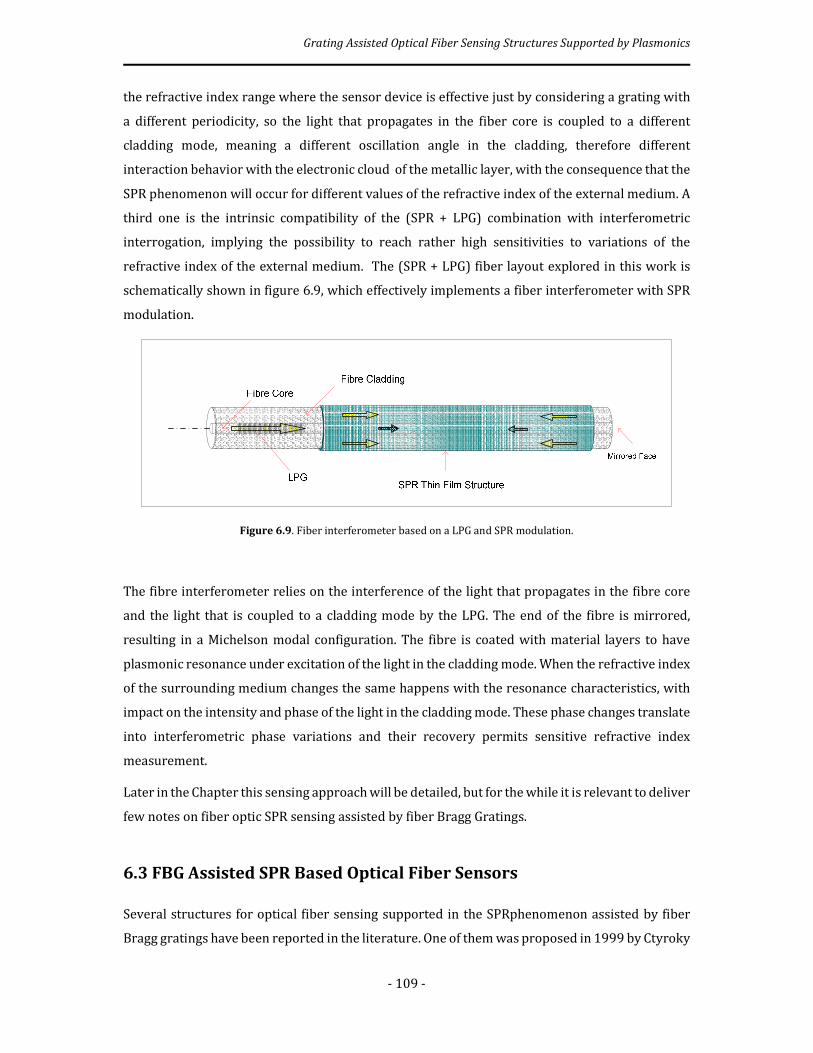
Grating Assisted Optical Fiber Sensing Structures Supported by Plasmonics
- 109 -
the refractive index range where the sensor device is effective just by considering a grating with
a different periodicity, so the light that propagates in the fiber core is coupled to a different
cladding mode, meaning a different oscillation angle in the cladding, therefore different
interaction behavior with the electronic cloud of the metallic layer, with the consequence that the
SPR phenomenon will occur for different values of the refractive index of the external medium. A
third one is the intrinsic compatibility of the (SPR + LPG) combination with interferometric
interrogation, implying the possibility to reach rather high sensitivities to variations of the
refractive index of the external medium. The (SPR + LPG) fiber layout explored in this work is
schematically shown in figure 6.9, which effectively implements a fiber interferometer with SPR
modulation.
Figure 6.9. Fiber interferometer based on a LPG and SPR modulation.
The fibre interferometer relies on the interference of the light that propagates in the fibre core
and the light that is coupled to a cladding mode by the LPG. The end of the fibre is mirrored,
resulting in a Michelson modal configuration. The fibre is coated with material layers to have
plasmonic resonance under excitation of the light in the cladding mode. When the refractive index
of the surrounding medium changes the same happens with the resonance characteristics, with
impact on the intensity and phase of the light in the cladding mode. These phase changes translate
into interferometric phase variations and their recovery permits sensitive refractive index
measurement.
Later in the Chapter this sensing approach will be detailed, but for the while it is relevant to deliver
few notes on fiber optic SPR sensing assisted by fiber Bragg Gratings.
6.3 FBG Assisted SPR Based Optical Fiber Sensors
Several structures for optical fiber sensing supported in the SPRphenomenon assisted by fiber
Bragg gratings have been reported in the literature. One of them was proposed in 1999 by Ctyroky

Grating Assisted Optical Fiber Sensing Structures Supported by Plasmonics
- 110 -
et al. [234]. It consists on a guided mode coupled to a surface plasmon-polariton as can be seen in
figure 6.10.
Figure 6.10 - Surface Plasmon resonance sensing structure with a fiber Bragg grating [234].
A Surface Plasmonic Wave (SPW) oscillates in the fiber core (or in the waveguide layer of the
planar structure). Its effective refractive index is only slightly different from the effective
refractive index of the guided mode supported by the structure without the metal layer. This is
because most of the energy is associated with the guided mode and only slightly weighted by the
plasmon-polariton’s effective index. This interaction means that the hybrid mode is sensitive to
any change in the effective index of the plasmon which depends on the refractive index of the
surrounding layer, the measurement target parameter.
In 2006, Nemova et al. [235] suggested an improved configuration by the use of the so called
“pure” SPP as opposed to the hybrid mode. Contrary to SPW, in this “pure” SPP almost all the
energy is concentrated at the metal-dielectric interface. The “pure” SPP decays exponentially away
from the metal surface, including a waveguide layer of the sensor structure. The difference
between the effective refractive index of the guided mode and the effective refractive index of the
“pure” SPP is thus large and requires a special scheme to excite the “pure” SPP. This is done with
a grating, which allows the wave-vector matching condition to be met. The advantage of using the
grating is that it decouples the coupling scheme from the second important parameter - the
overlap integral between the guided exciting mode and the “pure” SPP. Since almost all energy of
the “pure” SPP is concentrated at the metal-dielectric interface, this scheme is extremely sensitive
to small changes in the refractive index of the sensed medium. The value of the change in the
effective refractive index of the “pure” SPP caused by the variation in the refractive index of the
sensed medium depends on the parameters of the structure. For the particular case of a hollow
core layout, illustrated in figure 6.11, where a Bragg grating is imprinted in its waveguide layer, a
full theoretical modelmay be found in [61].
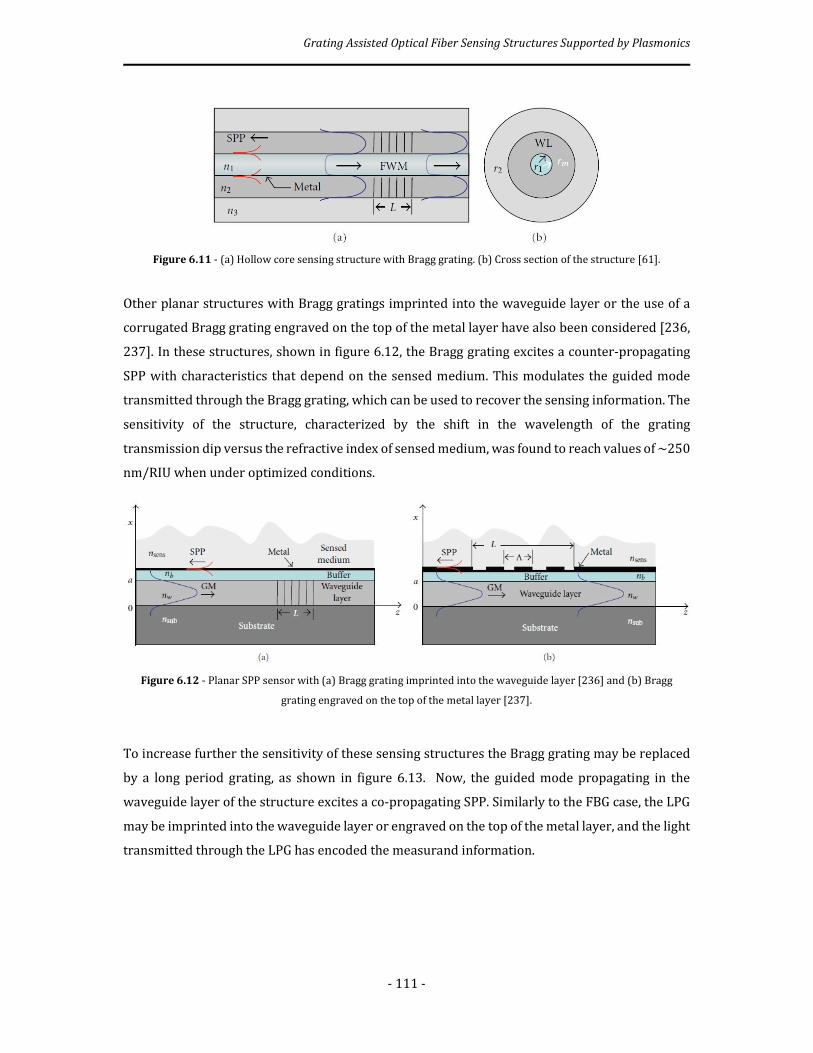
Grating Assisted Optical Fiber Sensing Structures Supported by Plasmonics
- 111 -
Figure 6.11 - (a) Hollow core sensing structure with Bragg grating. (b) Cross section of the structure [61].
Other planar structures with Bragg gratings imprinted into the waveguide layer or the use of a
corrugated Bragg grating engraved on the top of the metal layer have also been considered [236,
237]. In these structures, shown in figure 6.12, the Bragg grating excites a counter-propagating
SPP with characteristics that depend on the sensed medium. This modulates the guided mode
transmitted through the Bragg grating, which can be used to recover the sensing information. The
sensitivity of the structure, characterized by the shift in the wavelength of the grating
transmission dip versus the refractive index of sensed medium, was found to reach values of ∼250
nm/RIU when under optimized conditions.
Figure 6.12 - Planar SPP sensor with (a) Bragg grating imprinted into the waveguide layer [236] and (b) Bragg
grating engraved on the top of the metal layer [237].
To increase further the sensitivity of these sensing structures the Bragg grating may be replaced
by a long period grating, as shown in figure 6.13. Now, the guided mode propagating in the
waveguide layer of the structure excites a co-propagating SPP. Similarly to the FBG case, the LPG
may be imprinted into the waveguide layer or engraved on the top of the metal layer, and the light
transmitted through the LPG has encoded the measurand information.
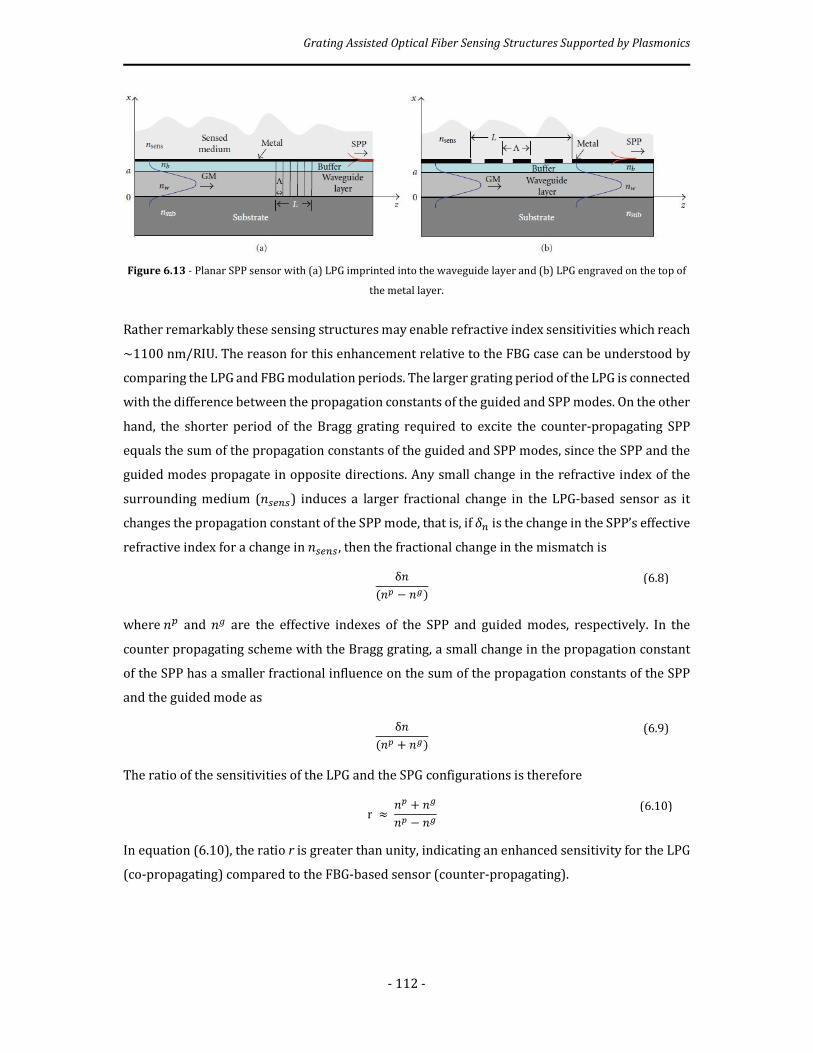
Grating Assisted Optical Fiber Sensing Structures Supported by Plasmonics
- 112 -
Figure 6.13 - Planar SPP sensor with (a) LPG imprinted into the waveguide layer and (b) LPG engraved on the top of
the metal layer.
Rather remarkably these sensing structures may enable refractive index sensitivities which reach
∼1100 nm/RIU. The reason for this enhancement relative to the FBG case can be understood by
comparing the LPG and FBG modulation periods. The larger grating period of the LPG is connected
with the difference between the propagation constants of the guided and SPP modes. On the other
hand, the shorter period of the Bragg grating required to excite the counter-propagating SPP
equals the sum of the propagation constants of the guided and SPP modes, since the SPP and the
guided modes propagate in opposite directions. Any small change in the refractive index of the
surrounding medium (^Õ�åÕ) induces a larger fractional change in the LPG-based sensor as it
changes the propagation constant of the SPP mode, that is, if Öå is the change in the SPP’s effective
refractive index for a change in ^Õ�åÕ , then the fractional change in the mismatch is
δ^(^Ô − ^�) (6.8)
where ^Ô and ^I are the effective indexes of the SPP and guided modes, respectively. In the
counter propagating scheme with the Bragg grating, a small change in the propagation constant
of the SPP has a smaller fractional influence on the sum of the propagation constants of the SPP
and the guided mode as
δ^(^Ô + ^�) (6.9)
The ratio of the sensitivities of the LPG and the SPG configurations is therefore
r ≈ ^Ô + ^�^Ô − ^� (6.10)
In equation (6.10), the ratio r is greater than unity, indicating an enhanced sensitivity for the LPG
(co-propagating) compared to the FBG-based sensor (counter-propagating).

Grating Assisted Optical Fiber Sensing Structures Supported by Plasmonics
- 113 -
6.4 LPG Assisted SPR Based Optical Fiber Sensors
As outlined at the end of Section 6.2, the consideration of fiber optic sensors associated with LPG
assisted plasmonic resonance is an interesting approach, yet scarcely explored. The reason for
this may be its coupling to interferometric (phase) interrogation, which is by far the less explored
of the interrogation techniques when addressing SPR sensors, and yet it is the one that has the
potential to provide the highest sensitivities. Owing to the focus of this work in the phase
interrogation of fiber optic SPR sensors, the combination (SPR + LPG) was naturally addressed as
described in the following.
The basic feature of the LPG assisted fiber optic SPR sensing is that the grating couples light which
propagates in the fiber core to a cladding mode with a certain oscillation angle, interacting in each
reflection at the cladding-metal interface in a condition of plasmonic resonance. An effective
configuration consists in assuming TM light and operation in reflection, so the radiation
propagates twice through the sensing region, with the LPG coupling light to the cladding and
recoupling back to the core. In this way it accumulates a phase difference to the light fraction that
always propagated in the core which provides the reference beam of the interferometric layout.
The recovery of the interferometric phase shall allow obtaining the component introduced by the
plasmonic resonance, therefore with information on the refractive index of the surrounding
medium. An approach of this type, illustrated in figure 6.9, is quite promising considering it is fully
compatible with single-mode fiber-optic technology while not compromising the performance of
SPR measurement since, in the sensing region, the light is allowed to propagate with oscillation
angles close to the critical angle where the phase shift introduced by the SPR phenomenon is
maximum, i.e. in a situation of maximum sensitivity [238].
To design a structure of this type first it is necessary to analyze how a LPG can be efficiently
operated within the context of this application. As shown in figure 6.14, when the LPG couples
light from the core to the cladding this means after the LPG the light propagates in a multimode
waveguide with diameter that equals the fiber diameter (125 µm for standard telecommunication
fibers). It is well known from basic fiber optic theory that for a step-index profile the number of
propagating modes is
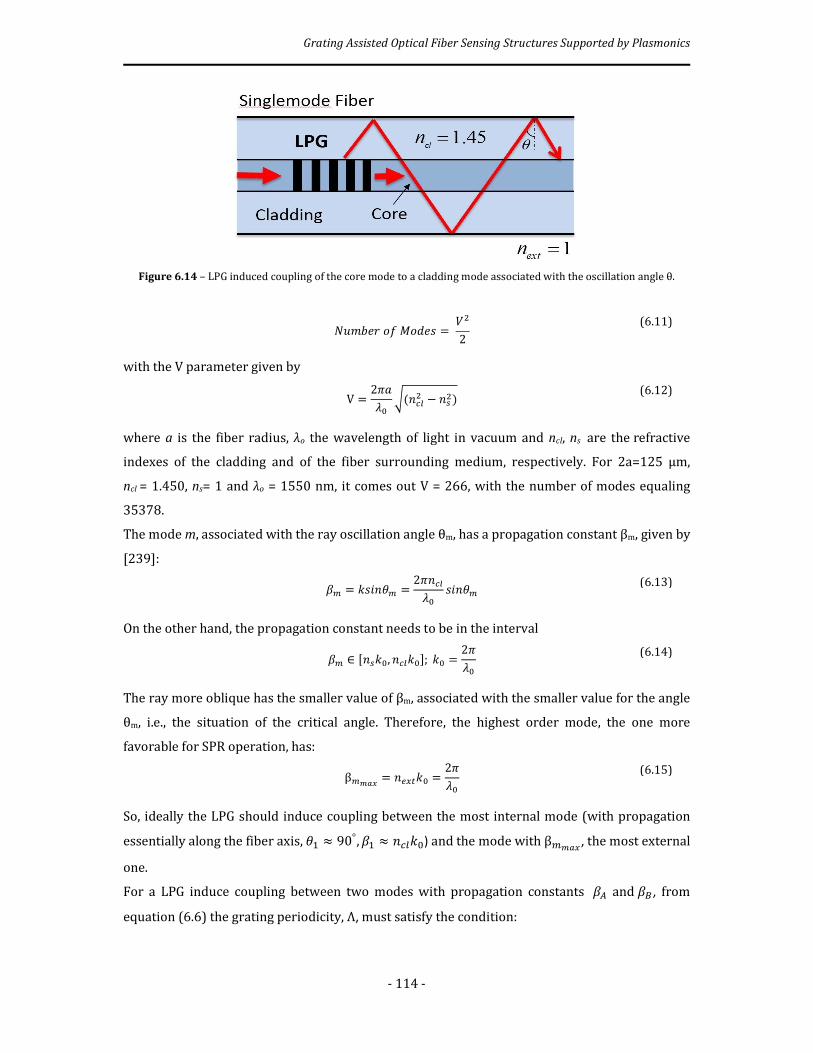
Grating Assisted Optical Fiber Sensing Structures Supported by Plasmonics
- 114 -
Figure 6.14 – LPG induced coupling of the core mode to a cladding mode associated with the oscillation angle θ.
ã#|$a\ õ� %õUa_ = &�2
(6.11)
with the V parameter given by
V = 2�]Å% ((^ò�� − ^Õ�) (6.12)
where a is the fiber radius, λo the wavelength of light in vacuum and ncl, ns are the refractive
indexes of the cladding and of the fiber surrounding medium, respectively. For 2a=125 µm,
ncl = 1.450, ns= 1 and λo = 1550 nm, it comes out V = 266, with the number of modes equaling
35378.
The mode m, associated with the ray oscillation angle θm, has a propagation constant βm, given by
[239]:
jw = �_{^âw = 2�^ò�Å% _{^âw (6.13)
On the other hand, the propagation constant needs to be in the interval
jw ∈ [^Õ�%, ^ò��%]; �% = 2�Å% (6.14)
The ray more oblique has the smaller value of βm, associated with the smaller value for the angle
θm, i.e., the situation of the critical angle. Therefore, the highest order mode, the one more
favorable for SPR operation, has:
βw �+ = ^�Eü�% = 2�Å% (6.15)
So, ideally the LPG should induce coupling between the most internal mode (with propagation
essentially along the fiber axis, âX ≈ 90°, jX ≈ ^ò��%) and the mode with βw �+ , the most external
one.
For a LPG induce coupling between two modes with propagation constants j, and j�, from
equation (6.6) the grating periodicity, Λ, must satisfy the condition:

Grating Assisted Optical Fiber Sensing Structures Supported by Plasmonics
- 115 -
Å% = 1�% (j, − j�)Λ (6.16)
In the present case, j, = jX = ^ò��% and j� = βw �+ = ^Õ�%, therefore
Λ = Å%^ò��� − ^�Eü (6.17)
For Å% = 1550 ^|, ^ò� = 1.450, ^Õ = 1, it results Λ = 3.3 -|. This is a rather small value,
eventually not possible to fabricate a LPG with a refractive index modulation with such
periodicity. Admitting it is feasible a value Λ = 300 -|, it turns out to be possible to couple light
to mode m with:
^w = ^ò� − Å%Λ = 1.450 − 1.55 × 10��300 = 1.445 ⇒ jw = 1.445 × 2�1.55 × 10�� = 5.854 × 10� |�X
The angle âw is
âw = arcsin �jw Å%2�^ò� = arcsin[0.99644] = 85.1° (6.18)
which is far from the critical angle âò = arcsin óå�/þå�� ù = 43.6°, therefore it is rather difficult to
induce plasmonic resonance with an acceptable Q-factor. As a matter of fact the situation is
alleviated in most situations because for biochemical sensing the external medium is aqueous,
meaning a refractive index close to 1.33.
This analysis indicates that to have effective LPG assisted SPR sensing operating at 1550 nm and
with an aqueous environment an external mode needs to be excited by the LPG. To achieve this
with LPGs showing a refractive index modulation amenable to standard fabrication techniques a
double metal + oxide layer needs to be considered.
From the results delivered in previous chapters it can be drawn the conclusion that the
combination of an internal layer of Ag and an oxide layer of TiO2 permits high performance SPR
sensing. Therefore, it was decided to apply this combination in the context of the analysis of LPG
assisted fiber optic SPR sensors.
Following this line, for a grating periodicity of Λ = 300 μm the study performed permitted to
conclude the best sensing performance compatible with operation at 1550 nm and an
environmental with refractive index ns = 1.33 is associated with layers of thicknesses of 70 nm
(for the internal layer of Ag) and 60 nm for the oxide layer of TiO2. For the same operating
conditions but now assuming a grating periodicity of Λ = 500 μm, these thickness values change
to 70 nm and 66 nm, respectively. For both cases the shape of the SPR resonance is shown in figure
6.15.

Grating Assisted Optical Fiber Sensing Structures Supported by Plasmonics
- 116 -
Figure 6.15 - Spectrum of the normalized transmitted optical power for the Ag-TiO2 sensing structure for different
grating periodicity (a) Λ = 300 -| and (b) Λ= 500 -| (when surrounding medium having a refractive index of 1.333).
The observation of these curves clearly indicates the left side at smaller wavelengths is better
defined than the right one at longer wavelengths, indicating an asymmetry of the resonance
Q- factor when evaluated from the perspective of each side. This indicates operation at the left
side is more favorable when the structure is configured as a sensor device and intensity
interrogation is adapted.
If the focus is phase (interferometric) interrogation, the best performance occurs at the resonance
wavelength. When this wavelength is fixed (1550 nm for the case) and the surrounding refractive
index changes, then the phase difference between the TE and TM polarizations also changes, as
illustrated in figure 6.16-a for both LPG modulating periods, from where derives the phase
sensitivity given at figure 6.16-b. It can be observed the phase difference between the two
polarizations becomes lower when the grating periodicity increases, i.e., by using a smaller grating
period the excited cladding mode is of higher order, so the penetration of the evanescent wave in
the external medium becomes deeper, therefore increasing the device refractive index sensitivity.

Grating Assisted Optical Fiber Sensing Structures Supported by Plasmonics
- 117 -
Figure 6.16 – (a) Phase difference (between p and s polarizations) and (b) phase sensitivity as function of the
refractive index of the surrounding medium for different grating periodicities Λ = 300 μm and Λ = 500 μm. The
interrogation wavelength is 1550 nm.
As pointed out in previous chapters, the sensor operation at resonance may bring reduced signal-
to-noise ratio due to the foreseeable low levels of optical power. Following the strategy outlined
before, this drawback can to some extent be attenuated by moving slightly the working
wavelength from the resonance. Doing so, the phase sensitivity is somehow degraded, but the
sensor resolution may improve because it also depends on the system signal-to-noise ratio.
6.5 Paths for Experimental Research
The work reported in this thesis is grounded on theoretical and computational analysis of fiber
optic SPR based sensing structures with particular emphasis on the study of the performance
associated with phase interrogation. As mentioned before, within the R&D strategy of the INESC
TEC optical sensing team, there are research paths more oriented to the theoretical analysis of the
behavior and performance of sensor devices and others more focused on experimental validation
and characterization, these two perspectives requiring a constant cross-fertilization. An
important example of this orientation is the study of the multiplexing of fiber optic SPR sensors
where both components interacted looking for the best configuration, generating a valuable

Grating Assisted Optical Fiber Sensing Structures Supported by Plasmonics
- 118 -
output that deserved publication in a prestigious international journal1. Targetting the work
reported in this thesis its experimental component did not proceed in parallel and will be tackled
in the near future. Some paths for its development are outlined here, again focusing on phase
interrogation of the SPR sensing structures. First, a general approach is outlined, applicable for
any type of fiber optic SPR sensing device. Then, it is proposed an experimental arrangement
oriented to LPG-assisted SPR based fiber optic sensors compatible with extreme resolutions in the
measurement of refractive index variations of the surrounding.
6.5.1 A General Technique for Phase Interrogation of SPR Fiber Sensors
The experimental study of the SPR sensing elements presented in this work can be done by
application of techniques developed along the years for the interrogation of polarimetric fiber
sensing interferometers illuminated by monochromatic light [240]. Following these approaches,
laser light is injected into the fiber at an angle such that it is excited the selected core mode. At the
input of the sensing head, a fiber polarizer element shall be included in order to have light in the
TE and TM polarizations, recombined at the output of the measurement region by means of a
second polarizer. This will generate an interferometric signal with a phase proportional to the
optical path difference accumulated by the propagation of the TE and TM polarizations, therefore
including the phase variations of the light in the TM polarization induced by changes of the
surrounding refractive index.
To recover the phase of this signal, a robust and sensitive technique involves adding a sine wave
component to the interferometric phase, which can be generated by sine wave modulation of the
wavelength of the laser light. After photodetection and incorporation of signal processing, which
includes a feedback loop to the laser source to tune the DC value of the light wavelength, the
information on the quasi-static phase of the polarimetric sensing interferometer, therefore on the
refractive index of the external medium, can be obtained from the feedback signal [241]. This
approach is compatible with a DC phase resolution of the order of 1 mrad, which from the results
presented in this thesis means refractive index measurement resolutions of the order 10-6 shall
be possible.
1 L. Coelho, H. Moayed, J. M. M. de Almeida, J. L. Santos, D. Viegas, Multiplexing of Surface Plasmon
Resonance Sensing Devices on Etched Single Mode Fiber, Journal of Lightwave Technology Journal
of Lightwave Technology, 33, 432 – 438, 2014.

Grating Assisted Optical Fiber Sensing Structures Supported by Plasmonics
- 119 -
6.5.2 High Performance Phase Interrogation of LPG Assisted SPR Fiber
Sensors
The interrogation of the modal interferometer associated with the operation mode of a LPG
assisted fiber optic SPR based sensing element illustrated in figure 6.9 can be achieved using the
general approach outlined in the previous section. However it is objective of INESC TEC optical
sensing group to research the application in this context of powerful techniques that have been
researched for gravitational wave detection with optical interferometry [242]. In general, they are
based on the exploitation of the Pound-Drever-Hall (PDH) frequency looking technique that
permits frequency noise performance compatible with pico-strain resolution [243, 244]. This is
an extremely powerful technique for both static and dynamic phase recovery in optical
interferometers. The configuration proposed to be studied is shown in figure 6.17.
⊗mV
⊗mV
outV
Figure 6.17 - Optical fibre SPR interferometric sensing configuration with PHD signal processing
The sine wave phase modulation of the laser light injected into the optical fiber system, when
coupled to the transfer function of the sensing interferometer, generates a complex electrical
spectrum at the photodetection output. After proper mixing and signal conditioning, an error
signal is generated that is applied to a piezoelectric where a fiber optic filter is fixed. It is proposed
Grating Assisted Optical Fiber Sensing Structures Supported by Plasmonics
- 120 -
this filter to be a chirp pi-shifted fibre Bragg grating with a very narrow transmission window (in
figure 6.17 it is shown a filter of this type fabricated in-house). A fraction of the light from the laser
goes through this filter, and a second error signal is generated to lock the laser wavelength to the
filter transmission line. Considering this line is also tuned by the first feedback loop to the sensing
interferometer, the laser is also locked to this interferometer. This double loop control
configuration shall permit to reduce the laser free-running frequency noise, which becomes now
determined by the stability of the fibre transmission filter. Maximum readout sensitivity is
obtained with adequate tuning of the electrical phase shifter. In the full bandwidth operation, the
system output signal can be derived from any one of the error signals.
We propose to study in detail this demodulation technique and apply it to phase readout of the
sensing interferometer. This phase will be affected by the temperature and by the external
medium refractive index, which is the measurand of interest. Considering the Plasmon excitation
is polarization sensitive, manipulation of the polarization of the input light shall permit to achieve
maximum and minimum sensitivities to refractive index, while the temperature sensitivity shall
be essentially constant. Therefore, this behaviour shall permit to measure the sensing head
temperature and, therefore, to correct its effects on the recovered phase, an essential procedure
when the objective is to have a highly sensitive refractive index measurement.
6.6 Conclusion
This chapter addressed the topic associated with the combination of fiber gratings with standard
fiber optic SPR sensing technology to bring it to the singlemode domain, therefore turning it
compatible with the vast field of fiber optic communication systems with its large portfolio of
advanced and cost effective components and devices. Concerning fiber Bragg gratings, a short
review was presented on developments reported in the literature showing how these structures
can upgrade the global performance of fiber SPR sensors, in particular to enlarge the range of
implementation possibilities for these sensors. The focus of the chapter was, however, to show
how long period gratings can be efficiently integrated in fiber optic SPR sensing structures
enabling novel configurations with intrinsic high performance when addressing the monitoring
of the refractive index of the surrounding medium. The analysis performed permitted to conclude
these LPG assisted SPR based fiber sensors are essentially interferometric in nature, therefore
requiring phase reading to recover the measurand information. This is to say the combination
(LPG + SPR) restricts the group of available interrogation techniques of SPR sensors to a single
one, the phase interrogation approach. The immediate consequence is that the domain of LPG
assisted SPR sensing is associated with high performance even when standard technics of
interferometric phase readout are considered. This topic is addressed in the Chapter in the

Grating Assisted Optical Fiber Sensing Structures Supported by Plasmonics
- 121 -
context of the notes delivered about how the experimental investigation of these sensing
structures could proceed, in particular it is proposed to research the applicability of the advanced
Pound-Drever-Hall interferometric interrogation technique, looking to reach new resolution
levels when targeting the measurement of refractive index and from it a large range of chemical
and biochemical entities.

7
Conclusions and Future Work
Conclusions and Future Work
- 123 -
The central objective of this thesis was the study of a number of fiber optic configurations showing
sensing functionalities supported by the phenomenon of plasmonic resonance. It proceeded along
the theoretical and computational components looking to understand their operation principles
and to derive their main characteristics, owing also to guide the experimental investigation and
to tailor the properties of a specific sensing device to a particular application.
The thesis was organized in seven chapters. Chapter 1 delivered an historical overview about the
phenomenon of plasmonic resonance in the optical domain and how it was configured to achieve
sensing functionalities, first in bulk optics platforms and later associated with the utilization of
optical fibers. Also, an effort was undertaken to contextualize this sensing approach within the
actual dynamics of Plasmonics which is continuously opening new horizons in science and in
technology. Chapter 2 presented the physical concepts behind the phenomenon of plasmonics,
particularly surface plasmonic resonance, and the conditions for their existence on dielectric-
metal-dielectric slabs. The propagation of an electromagnetic field into a multilayer structure was
also discussed, which later permitted to model surface plasmonic resonance based sensors.
Chapter 3 delivered a worked review of the different techniques reported to interrogate
plasmonic based sensors, addressing in particular the performance level that can be achieved with
each of the interrogation approaches, which include angular interrogation, spectral interrogation,
intensity interrogation and phase interrogation. Chapter 4 developed the study of SPR based
optical fiber sensing configurations integrating a single metal or a bimetallic layer. With the focus
on phase interrogation, it was analyzed the performance associated with the utilization of
different metals, namely silver, gold, copper, and aluminum when the tapered and the tip
(optrode) optical fiber geometric layouts were addressed. Chapter 5 presents a theoretical
investigation of optical fiber surface plasmonic resonance sensors incorporating an internal
metallic layer of silver covered with an oxide layer. The objective was to study how to shift the
resonance condition to longer wavelengths, more suited to benefit from a broad range of optical
fiber technologies developed along the years within the context of optical fiber communications
systems. Different oxide materials like titanium dioxide, silicon dioxide and aluminum oxide were
considered aiming to achieve enhanced sensitivity to refractive index variations of the external
medium, particularly when addressing phase interrogation. Chapter 6 dealt with the integration
of fiber gratings with standard fiber optic SPR sensing technology to bring it to the singlemode
domain, therefore turning it compatible with the fiber optic communication world with its large
portfolio of advanced and cost effective components and devices. In particular, emphasis was
allocated on the theoretical analysis of long period grating (LPG) assisted optical fiber sensing
structures supported by Plasmonics. It is concluded this (LPG + SPR) combination brings to the
forefront the phase interrogation of SPR sensors and, consequently, were outlined paths for the
Conclusions and Future Work
- 124 -
experimental investigation of interrogation techniques of this type, including advanced ones as
the Pound-Drever-Hall interferometric interrogation approach.
Behind its intrinsic value, this research activity fits the strategic objectives of the optical sensing
group of INESC TEC which, years ago, defined a R&D axis in plasmonics based fiber optic sensing.
Understandably, the theoretical analysis and performance evaluation of devices situated along
such axis are an important component of such strategy, for reasons that range from guiding their
experimental investigation to the tailored design of a sensing device projected to a specific
application. This means an always present component of future work is the continuous interaction
with the experimental counterpart of the group R&D activity in plasmonics based fiber sensing,
most in particular on the planned activity to test the performance of phase reading techniques
applied to the phase interrogation of LPG assisted fiber optic sensing supported by plasmonics.
Besides this future work component, others are programmed more oriented to the theoretical
investigation of fiber optic sensing supported by plasmonics. Some of them are:
• The theoretical studies performed used a model which is a hybrid of geometric optics (ray
propagation) and wave optics (application of Fresnel equations in the interface where
plasmons are excited). It is known this method works effectively when the waveguide
propagation is far away the singlemode regime. When it is approached a full wave optics
theory needs to be applied, which implies the consideration of other analytical tools and
methodologies.
• The configurations analyzed in the work reported in this thesis deals with relatively simple
fiber geometric layouts, situation that changes when the focus is oriented to photonic crystal
fibers. So, a natural topic of research is the extension of the models and methodologies
presented here to the more complex geometric reality associated with this type of fibers.
• A further expansion of the activity proposed in the previous entry is connected with the
metamaterials domain where, by adequate geometric modulation of a particular material
with spatial scales well below the optical wavelength, the refractive index of this structured
material as seen by the light can be tailored within a large range of values. In this way artificial
materials with enhanced properties for plasmonic interaction may be fabricated, which
opens vast horizons in what concerns plasmonic supported optical sensing. This is a rather
unexplored and huge domain requiring a multi-level approach, one of them associated with
the theoretical evaluation of the properties of sensing structures of this nature.

Conclusions and Future Work
- 125 -
• In Chapter 6 it was proposed the advanced Pound-Drever-Hall interrogation technique to
read with extreme sensitivity the interferometric phase of the LPG-assisted SPR supported
fiber optic modal interferometer. The evaluation of how “extreme” the readout sensitivity can
be and the identification of the factors that determine its value is an evident topic of research.
These are just some themes that justify a thoroughly theoretical investigation, in complement to
the laboratorial research, owing the objective of INESC TEC – Center of Applied Photonics to
develop the subject of plasmonics based fiber optic sensing, supported also by the evidence of the
relevance this field will have in the near future.

Annex
Symbols & Abbreviations
SPR Surface Plasmon Resonance RIU Refractive index unit
ε% Free-space permittivity θ�& Critical angle
μ Magnetic permeability S¦ Sensitivity
E Electric field χ Quality parameter
H Magnetic field k�� Propagation constant of SP
β Propagation constant θ&Á¥ Resonance angle
TM Transverse Magnetic λres Resonance wavelength
TE Transverse Electric ρY Radius of the core
SPP Surface Plasmon Polaritons ρ% Radius of the core in sensing region
l���,x skin depths into metal L Sensing region
l���,z skin depths into dielectric NA Numerical aperture
ATR Attenuated total reflection θ% Angle of incident
k. Wavevector of the incident light S¦,è Phase sensitivity
Λ Grating period λ Interrogation wavelength
δn Phase in the k® layer d1 Thickness of inner layer
dn Thickness of the k® layer d2 Thickness of outer layer
ηn Optical admittance FBG Fiber Bragg Grating
r¥ Reflection coefficient – s wave LPG Long Period Grating
r³ Reflection coefficient – P wave ^� Effective refractive index
θ Incident angle MMF Multi-mode fibers
N&ÁÂ(θ) Total number of reflections λú�Õw Resonance wavelength of the |ü�
cladding mode

References
[1] R.W. Wood, On a remarkable case of uneven distribution of light in a diffraction grating spectrum. Philosophical Magazine, 1902. 4(19-24): p. 396-402.
[2] L. Rayleigh, Note on the remarkable case of diffraction spectra described by Prof. Wood. Philosophical Magazine, 1907. 14(79-84): p. 60-65.
[3] A. Hessel, and A.A. Oliner, A New Theory of Woods Anomalies on Optical Gratings. Applied Optics, 1965. 4(10): p. 1275-&.
[4] R.W. Wood, Anomalous diffraction gratings. Physical Review, 1935. 48(12): p. 928-936. [5] R.W. Wood, Diffraction gratings with controlled groove form and abnormal distribution of intensity.
Philosophical Magazine, 1912. 23(133-8): p. 310-317. [6] C.H. Palmer, Parallel Diffraction Grating Anomalies. Journal of the Optical Society of America, 1952.
42(4): p. 269-276. [7] C.H. Palmer, Diffraction Grating Anomalies .2. Coarse Gratings. Journal of the Optical Society of
America, 1956. 46(1): p. 50-53. [8] Ritchie, R.H., Plasma Losses by Fast Electrons in Thin Films. Physical Review, 1957. 106(5): p. 874-
881. [9] C.J. Powell, and J.B. Swan, Effect of Oxidation on the Characteristic Loss Spectra of Aluminum and
Magnesium. Physical Review, 1960. 118(3): p. 640-643. [10] D. Bohm and D. Pines, A Collective Description of Electron Interactions .1. Magnetic Interactions.
Physical Review, 1951. 82(5): p. 625-634. [11] D. Pines and D. Bohm, A Collective Description of Electron Interactions .2. Collective Vs Individual
Particle Aspects of the Interactions. Physical Review, 1952. 85(2): p. 338-353. [12] D. Bohm and D. Pines, A Collective Description of Electron Interactions .3. Coulomb Interactions in a
Degenerate Electron Gas. Physical Review, 1953. 92(3): p. 609-625. [13] E. Burstein, et al., Surface Polaritons - Propagating Electromagnetic Modes at Interfaces. Journal of
Vacuum Science & Technology, 1974. 11(6): p. 1004-1019. [14] E. Kretschm and H. Raether, Radiative Decay of Non Radiative Surface Plasmons Excited by Light.
Zeitschrift Fur Naturforschung Part a-Astrophysik Physik Und Physikalische Chemie, 1968. A 23(12): p. 2135-&.
[15] E. Kretschm, Determination of Optical Constants of Metals by Excitation of Surface Plasmons. Zeitschrift Fur Physik, 1971. 241(4): p. 313-&.
[16] A. Otto, Excitation of Nonradiative Surface Plasma Waves in Silver by Method of Frustrated Total
Reflection. Zeitschrift Fur Physik, 1968. 216(4): p. 398-&. [17] H. Raether, Surface-Plasmons on Smooth and Rough Surfaces and on Gratings. Springer Tracts in
Modern Physics, 1988. 111: p. 1-133. [18] Boardman, A.D., Electromagnetic surface modes. John Wiley & Sons, New York, 1982. [19] D.W. Lubbers and N. Opitz, The pCO2-/pO2-optode: a new probe for measurement of pCO2 or pO
in fluids and gases. Zeitschrift Fur Naturforschung C-a Journal of Biosciences, 1975. 30(7-8): p. 532-533.
[20] I. Pockrand, et al., Surface-Plasmon Spectroscopy of Organic Monolayer Assemblies. Surface Science, 1978. 74(1): p. 237-244.
[21] B. Liedberg, I. Lundstrom, and E. Stenberg, Principles of Biosensing with an Extended Coupling Matrix
and Surface-Plasmon Resonance. Sensors and Actuators B-Chemical, 1993. 11(1-3): p. 63-72. [22] M.T. Flanagan and R.H. Pantell, Surface-Plasmon Resonance and Immunosensors. Electronics Letters,
1984. 20(23): p. 968-970. [23] C. Nylander, B. Liedberg, and T. Lind, Gas-Detection by Means of Surface-Plasmon Resonance. Sensors
and Actuators, 1982. 3(1): p. 79-88. [24] O.S. Wolfbeis, Optical Sensing Based on Analyte Recognition by Enzymes, Carriers and Molecular-
Interactions. Analytica Chimica Acta, 1991. 250(1): p. 181-201. [25] A. Brecht and G. Gauglitz, Optical Probes and Transducers. Biosensors & Bioelectronics, 1995. 10(9-
10): p. 923-936. [26] J.G. Gordon and S. Ernst, Surface-Plasmons as a Probe of the Electrochemical Interface. Surface
Science, 1980. 101(1-3): p. 499-506. [27] B. Liedberg, C. Nylander, and I. Lundstrom, Surface-Plasmon Resonance for Gas-Detection and
Biosensing. Sensors and Actuators, 1983. 4(2): p. 299-304.
References
- 128 -
[28] B. Liedberg, C. Nylander, and I. Lundstrom, Biosensing with Surface-Plasmon Resonance - How It All
Started. Biosensors & Bioelectronics, 1995. 10(8): p. R1-R9. [29] E.S. Forzani, et al., Detection of arsenic in groundwater using a surface plasmon resonance sensor.
Sensors and Actuators B-Chemical, 2007. 123(1): p. 82-88. [30] H. Tran, et al., Surface plasmon resonance detection of ricin and horticultural ricin variants in
environmental samples. Toxicon, 2008. 52(4): p. 582-588. [31] B.N., Feltis, et al., A hand-held surface plasmon resonance biosensor for the detection of ricin and other
biological agents. Biosensors & Bioelectronics, 2008. 23(7): p. 1131-1136. [32] M. Seifert, S. Haindl, and B. Hock, Development of an enzyme linked receptor assay (ELRA) for
estrogens and xenoestrogens. Analytica Chimica Acta, 1999. 386(3): p. 191-199. [33] B. Hock, M. Seifert, and K. Kramer, Engineering receptors and antibodies for biosensors. Biosensors
& Bioelectronics, 2002. 17(3): p. 239-249. [34] C. Mouvet, et al., Determination of simazine in water samples by waveguide surface plasmon
resonance. Analytica Chimica Acta, 1997. 338(1-2): p. 109-117. [35] E. Mauriz, et al., Determination of carbaryl in natural water samples by a surface plasmon resonance
flow-through immunosensor. Biosensors & Bioelectronics, 2006. 21(11): p. 2129-2136. [36] E. Mauriz, et al., Real-time detection of chlorpyrifos at part per trillion levels in ground, surface and
drinking water samples by a portable surface plasmon resonance immunosensor. Analytica Chimica Acta, 2006. 561(1-2): p. 40-47.
[37] E. Mauriz, et al., Determination of environmental organic pollutants with a portable optical
immunosensor. Talanta, 2006. 69(2): p. 359-364. [38] C. Boulart, et al., A novel, low-cost, high performance dissolved methane sensor for aqueous
environments. Optics Express, 2008. 16(17): p. 12607-12617. [39] T. Kang, et al., Fabrication of reusable sensor for detection of Cu2+ in an aqueous solution using a self-
assembled monolayer with surface plasmon resonance spectroscopy. Chemical Communications, 2005(29): p. 3721-3723.
[40] T.M. Chinowsky, et al., Portable 24-analyte surface plasmon resonance instruments for rapid,
versatile biodetection (vol 22, pg 9, 2007). Biosensors & Bioelectronics, 2007. 23(1): p. 149-149. [41] V. Koubova, et al., Detection of foodborne pathogens using surface plasmon resonance biosensors.
Sensors and Actuators B-Chemical, 2001. 74(1-3): p. 100-105. [42] S.J. Kim, et al., Novel miniature SPR immunosensor equipped with all-in-one multi-microchannel
sensor chip for detecting low-molecular-weight analytes. Biosensors & Bioelectronics, 2007. 23(5): p. 701-707.
[43] M. Palumbo, et al., Surface plasmon resonance sensing of liquids using polyelectrolyte thin films. Sensors and Actuators B-Chemical, 2003. 91(1-3): p. 291-297.
[44] E. Maciak, Z. Opilski, and T. Pustelny, Effect of humidity on nh3 gas sensitivity of
nafion/wo3 sensing structure of spr sensor. Molecular and Quantum Acoustics, 2001. 26: p. 205-2015. [45] D. Kitenge, et al., Nanostructured Silver Films for Surface Plasmon Resonance-Based Gas Sensors. Ieee
Sensors Journal, 2009. 9(12): p. 1797-1801. [46] A.S. El-Basaty, et al., Surface plasmon sensor for NO2 gas. Surface and Interface Analysis, 2008.
40(13): p. 1623-1626. [47] P. Tobiska, et al., An integrated optic hydrogen sensor based on SPR on palladium. Sensors and
Actuators B-Chemical, 2001. 74(1-3): p. 168-172. [48] X. Bevenot, et al., Surface plasmon resonance hydrogen sensor using an optical fibre. Measurement
Science & Technology, 2002. 13(1): p. 118-124. [49] J.L. Hu, et al., Smart and Reversible Surface Plasmon Resonance Responses to Various Atmospheres for
Silver Nanoparticles Loaded in Mesoporous SiO2. Journal of Physical Chemistry C, 2009. 113(44): p. 19039-19045.
[50] H. Nanto, et al. Odor sensor utilizing surface plasmon resonance for environmental monitoring. 2004. [51] N.M. Aguirre, et al., Development of a surface plasmon resonance n-dodecane vapor sensor. Sensors,
2007. 7(9): p. 1954-1961. [52] J. Homola, Surface plasmon resonance sensors for detection of chemical and biological species.
Chemical Reviews, 2008. 108(2): p. 462-493. [53] A. Leinse, et al. The life marker chip for the Exomars mission. in Information Photonics (IP), 2011 ICO
International Conference on. 2011. [54] J. Dakin, and B. Culshaw, Optical fiber sensors: applications, analysis, and future trends. 1997: Artech
House Publishers. [55] R.C. Jorgenson and S.S. Yee, A fiber-optic chemical sensor based on surface plasmon resonance.
Sensors and Actuators B: Chemical, 1993. 12(3): p. 213-220.
References
- 129 -
[56] A.J.C. Tubb, et al., Single-mode optical fibre surface plasma wave chemical sensor. Sensors and Actuators B: Chemical, 1997. 41(1–3): p. 71-79.
[57] J. Villatoro, D. Monzón-Hernández, and E. Mejía, Fabrication and modeling of uniform-waist single-
mode tapered optical fiber sensors. Applied Optics, 2003. 42(13): p. 2278-2283. [58] J. Homola and R. Slavik Fibre-optic sensor based on surface plasmon resonance. Electronics Letters,
1996. 32, 480-482. [59] R. Kashyap and G. Nemova, Surface Plasmon Resonance-Based Fiber and Planar Waveguide Sensors.
Journal of Sensors, 2009. 2009: p. 9. [60] B.D. Gupta and A.K. Sharma, Sensitivity evaluation of a multi-layered surface plasmon resonance-
based fiber optic sensor: a theoretical study. Sensors and Actuators B-Chemical, 2005. 107(1): p. 40-46.
[61] G. Nemova and R. Kashyap, Modeling of plasmon-polariton refractive-index hollow core fiber sensors
assisted by a fiber Bragg grating. Lightwave Technology, Journal of, 2006. 24(10): p. 3789-3796. [62] M. Skorobogatiy and A. Kabashin, Plasmon excitation by the Gaussian-like core mode of a photonic
crystal waveguide. Optics Express, 2006. 14(18): p. 8419-8424. [63] P.J.A. Sazio, et al., Microstructured optical fibers as high-pressure microfluidic reactors. Science, 2006.
311(5767): p. 1583-1586. [64] M. Hautakorpi, M. Mattinen, and H. Ludvigsen, Surface-plasmon-resonance sensor based on three-
hole microstructured optical fiber. Optics Express, 2008. 16(12): p. 8427-8432. [65] Y.T Zhang, et al., Wagon wheel fiber based multichannel plasmonic sensor. Optics Express, 2011.
19(23): p. 22863-22873. [66] I.R. Hooper, M. Rooth, and J.R. Sambles, Dual-channel differential surface plasmon ellipsometry for
bio-chemical sensing. Biosensors & Bioelectronics, 2009. 25(2): p. 411-417. [67] T. Allsop, et al., Generation of infared surface plasmon resonances with high refractive index
sensitivity utilizing titled fiber Bragg grafings. Applied Optics, 2007. 46(22): p. 5456-5460. [68] N. Díaz-Herrera, et al., Refractive index sensing of aqueous media based on plasmonic resonance in
tapered optical fibres operating in the 1.5 μm region. Sensors and Actuators B: Chemical, 2010. 146(1): p. 195-198.
[69] V. Singh, et al., Integrated Optical Sensors. Ieee Photonics Journal, 2012. 4(2): p. 638-641. [70] Manickam, G., et al., Protection and functionalisation of silver as an optical sensing platform for highly
sensitive SPR based analysis. Analyst, 2012. 137(22): p. 5265-71. [71] E. Hutter, and J.H. Fendler, Exploitation of localized surface plasmon resonance. Advanced Materials,
2004. 16(19): p. 1685-1706. [72] W. Fritzsche, and T.A. Taton, Metal nanoparticles as labels for heterogeneous, chip-based DNA
detection. Nanotechnology, 2003. 14(12): p. R63-R73. [73] S.M. Nie and S.R. Emery, Probing single molecules and single nanoparticles by surface-enhanced
Raman scattering. Science, 1997. 275(5303): p. 1102-1106. [74] K. Kneipp, et al., Single molecule detection using surface-enhanced Raman scattering (SERS). Physical
Review Letters, 1997. 78(9): p. 1667-1670. [75] Z.Q. Tian, B. Ren, and D.Y. Wu, Surface-enhanced Raman scattering: From noble to transition metals
and from rough surfaces to ordered nanostructures. Journal of Physical Chemistry B, 2002. 106(37): p. 9463-9483.
[76] A. Pucci, et al., Surface enhanced infrared spectroscopy using gold nanoantennas. Physica Status Solidi B-Basic Solid State Physics, 2010. 247(8): p. 2071-2074.
[77] C.D. Geddes, et al., Metal-enhanced fluorescence (MEF) due to silver colloids on a planar surface:
Potential applications of indocyanine green to in vivo imaging. Journal of Physical Chemistry A, 2003. 107(18): p. 3443-3449.
[78] J.A. Sanchez-Gil, J.V. Garcia-Ramos, and E.R. Mendez, Electromagnetic mechanism in surface-
enhanced Raman scattering from Gaussian-correlated randomly rough metal substrates. Optics Express, 2002. 10(17): p. 879-886.
[79] E. Prodan, et al., A hybridization model for the plasmon response of complex nanostructures. Science, 2003. 302(5644): p. 419-422.
[80] C.E. Talley, et al., Surface-enhanced Raman scattering from individual Au nanoparticles and
nanoparticle dimer substrates. Nano Letters, 2005. 5(8): p. 1569-1574. [81] P.K. Jain and M.A. El-Sayed, Plasmonic coupling in noble metal nanostructures. Chemical Physics
Letters, 2010. 487(4-6): p. 153-164. [82] K. Yoshida, et al., Quantitative evaluation of electromagnetic enhancement in surface-enhanced
resonance Raman scattering from plasmonic properties and morphologies of individual Ag
nanostructures. Physical Review B, 2010. 81(11).
References
- 130 -
[83] J. Grand, et al., Role of localized surface plasmons in surface-enhanced Raman scattering of shape-
controlled metallic particles in regular arrays. Physical Review B, 2005. 72(3). [84] H.Y. Chu, et al., A high sensitive fiber SERS probe based on silver nanorod arrays. Optics Express, 2007.
15(19): p. 12230-12239. [85] J. Homola, Electromagnetic Theory of Surface Plasmons, in Surface Plasmon Resonance Based Sensors,
J. Homola, Editor. 2006, Springer Berlin Heidelberg. p. 3-44. [86] P.P. Markowicz, et al., Phase-sensitive time-modulated surface plasmon resonance polarimetry for
wide dynamic range biosensing. Optics Express, 2007. 15(4): p. 1745-1754. [87] J.N. Anker, et al., Biosensing with plasmonic nanosensors. Nature Materials, 2008. 7(6): p. 442-453. [88] K.R., Li, et al., Surface plasmon amplification by stimulated emission in nanolenses. Physical Review
B, 2005. 71(11). [89] A.J. Haes, and R.P. Van Duyne, A unified view of propagating and localized surface plasmon resonance
biosensors. Analytical and Bioanalytical Chemistry, 2004. 379(7-8): p. 920-930. [90] S. Lal, S. Link, and N.J. Halas, Nano-optics from sensing to waveguiding. Nature Photonics, 2007.
1(11): p. 641-648. [91] R. Karlsson, SPR for molecular interaction analysis: a review of emerging application areas. Journal
of Molecular Recognition, 2004. 17(3): p. 151-161. [92] E. Popov, B. Bozkov, and M. Neviere, The inverted surface plasmon resonance: Phenomenological
explanation. Journal of Modern Optics, 1996. 43(6): p. 1101-1110. [93] A. Otto, Excitation of nonradiative surface plasma waves in silver by the method of frustrated total
reflection. European Physical Journal A, 1968. 216(4): p. 398-410. [94] J. Homola, H.B. Lu, and S.S. Yee, Dual-channel surface plasmon resonance sensor with spectral
discrimination of sensing channels using dielectric overlayer. Electronics Letters, 1999. 35(13): p. 1105-1106.
[95] G.G. Nenninger, et al., Reference-compensated biosensing using a dual-channel surface plasmon
resonance sensor system based on a planar lightpipe configuration. Sensors and Actuators B-Chemical, 1998. 51(1-3): p. 38-45.
[96] A. Snyder, and J. Love, Optical waveguide theory. 1983: Springer. [97] O. Esteban, et al., Simple model of compound waveguide structures used as fiber-optic sensors. Optics
and Lasers in Engineering, 2000. 33(3): p. 219-230. [98] P. Yeh, Optical waves in layered media. 1988: Wiley New York. [99] M. Kanso, S. Cuenot, and G. Louarn, Sensitivity of optical fiber sensor based on surface plasmon
resonance: Modeling and experiments. Plasmonics, 2008. 3(2-3): p. 49-57. [100] A.K. Sharma, and B.D. Gupta, On the sensitivity and signal to noise ratio of a step-index fiber optic
surface plasmon resonance sensor with bimetallic layers. Optics Communications, 2005. 245(1-6): p. 159-169.
[101] P. Mulvaney, Surface plasmon spectroscopy of nanosized metal particles. Langmuir, 1996. 12(3): p. 788-800.
[102] W. Tropf, M. Thomas, and T. Harris, Optical properties of crystals and glasses, in Handbook of Optics. 1995.
[103] B.D. Gupta, A. Sharma, and S.D. Singh, Int. J. Optoelectron, 1993. 8: p. 409. [104] C. Hu, and D. Liu, High-performance Grating Coupled Surface Plasmon Resonance Sensor Based on Al-
Au Bimetallic Layer. Mod. Appl. Sci., 2010. 4(6): p. 8. [105] A.K. Sharma, and B.D. Gupta, On the performance of different bimetallic combinations in surface
plasmon resonance based fiber optic sensors. Journal of Applied Physics, 2007. 101(9). [106] N. Díaz-Herrera, et al., Fibre-optic SPR sensor with a FBG interrogation scheme for readout
enhancement. Sensors and Actuators B: Chemical, 2010. 144(1): p. 226-231. [107] S. Lofas, et al., Bioanalysis with Surface-Plasmon Resonance. Sensors and Actuators B-Chemical,
1991. 5(1-4): p. 79-84. [108] E.C. Nice, and B. Catimel, Instrumental biosensors: new perspectives for the analysis of biomolecular
interactions. Bioessays, 1999. 21(4): p. 339-352. [109] C. Thirstrup, et al., Diffractive optical coupling element for surface plasmon resonance sensors.
Sensors and Actuators B-Chemical, 2004. 100(3): p. 298-308. [110] H.C. Pedersen, and C. Thirstrup, Design of near-field holographic optical elements by grating
matching. Applied Optics, 2004. 43(6): p. 1209-1215. [111] H.C. Pedersen, et al., Integrated holographic grating chip for surface plasmon resonance sensing.
Optical Engineering, 2004. 43(11): p. 2505-2510. [112] D.G. Hong, et al., Development of an immunosensor with angular interrogation-based SPR
spectroscopy. Measurement Science & Technology, 2007. 18(5): p. 1367-1371.
References
- 131 -
[113] J. Homola, I. Koudela, and S.S. Yee, Surface plasmon resonance sensors based on diffraction gratings
and prism couplers: sensitivity comparison. Sensors and Actuators B-Chemical, 1999. 54(1-2): p. 16-24.
[114] J. Homola, et al., Spectral surface plasmon resonance biosensor for detection of staphylococcal
enterotoxin B in milk. International Journal of Food Microbiology, 2002. 75(1-2): p. 61-69. [115] G.G. Nenninger, M. Piliarik, and J. Homola, Data analysis for optical sensors based on spectroscopy of
surface plasmons. Measurement Science & Technology, 2002. 13(12): p. 2038-2046. [116] J. Homola, et al., A novel multichannel surface plasmon resonance biosensor. Sensors and Actuators
B-Chemical, 2001. 76(1-3): p. 403-410. [117] J. Dostalek, H. Vaisocherova, and J. Homola, Multichannel surface plasmon resonance biosensor with
wavelength division multiplexing. Sensors and Actuators B-Chemical, 2005. 108(1-2): p. 758-764. [118] R.C. Jorgenson and S.S. Yee, A Fiberoptic Chemical Sensor-Based on Surface-Plasmon Resonance.
Sensors and Actuators B-Chemical, 1993. 12(3): p. 213-220. [119] L.A. Obando, et al., Manufacture of robust surface plasmon resonance fiber optic based dip-probes.
Sensors and Actuators B-Chemical, 2004. 100(3): p. 439-449. [120] M. Iga, A. Seki, and K. Watanabe, Hetero-core structured fiber optic surface plasmon resonance sensor
with silver film. Sensors and Actuators B-Chemical, 2004. 101(3): p. 368-372. [121] X. Zhao, et al., Improvement of the sensitivity of the surface plasmon resonance sensors based on multi-
layer modulation techniques. Optics Communications, 2015. 335(0): p. 32-36. [122] M.J. Jory, et al., A Surface-Plasmon-Based Optical Sensor Using Acoustooptics. Measurement Science
& Technology, 1995. 6(8): p. 1193-1200. [123] B. Sepulveda, et al., Highly sensitive detection of biomolecules with the magneto-optic surface-
plasmon-resonance sensor. Optics Letters, 2006. 31(8): p. 1085-1087. [124] C.E. Jordan, et al., Surface plasmon resonance imaging measurements of DNA hybridization
adsorption and streptavidin/DNA multilayer formation at chemically modified gold surfaces. Analytical Chemistry, 1997. 69(24): p. 4939-4947.
[125] C.E. Jordan and R.M. Corn, Surface plasmon resonance imaging measurements of electrostatic
biopolymer adsorption onto chemically modified gold surfaces. Analytical Chemistry, 1997. 69(7): p. 1449-1456.
[126] B.P. Nelson, et al., Near-infrared surface plasmon resonance measurements of ultrathin films. 1. Angle
shift and SPR imaging experiments. Analytical Chemistry, 1999. 71(18): p. 3928-3934. [127] B.P. Nelson, et al., Surface plasmon resonance imaging measurements of DNA and RNA hybridization
adsorption onto DNA microarrays. Analytical Chemistry, 2001. 73(1): p. 1-7. [128] E. Fu, J. Foley, and P. Yager, Wavelength-tunable surface plasmon resonance microscope. Review of
Scientific Instruments, 2003. 74(6): p. 3182-3184. [129] E. Fu, et al., Characterization of a wavelength-tunable surface plasmon resonance microscope. Review
of Scientific Instruments, 2004. 75(7): p. 2300-2304. [130] A.W. Wark, H.J. Lee, and R.M. Corn, Long-range surface plasmon resonance imaging for bioaffinity
sensors. Analytical Chemistry, 2005. 77(13): p. 3904-3907. [131] A. Zybin, et al., Double-wavelength technique for surface plasmon resonance measurements: Basic
concept and applications for single sensors and two-dimensional sensor arrays. Analytical Chemistry, 2005. 77(8): p. 2393-2399.
[132] J.S. Shumaker-Parry and C.T. Campbell, Quantitative methods for spatially resolved
adsorption/desorption measurements in real time by surface plasmon resonance microscopy. Analytical Chemistry, 2004. 76(4): p. 907-917.
[133] J.S. Shumaker-Parry, R. Aebersold, and C.T. Campbell, Parallel, quantitative measurement of protein
binding to a 120-element double-stranded DNA array in real time using surface plasmon resonance
microscopy. Analytical Chemistry, 2004. 76(7): p. 2071-2082. [134] C.T. Campbell and G. Kim, SPR microscopy and its applications to high-throughput analyses of
biomolecular binding events and their kinetics. Biomaterials, 2007. 28(15): p. 2380-2392. [135] M. Piliarik, J. Katainen, and J. Homola, Novel polarization control for high-throughput surface
plasmon resonance sensors. Optical Sensing Technology and Applications, 2007. 6585. [136] M. Piliarik, H. Vaisocherova, and J. Homola, A new surface plasmon resonance sensor for high-
throughput screening applications. Biosensors & Bioelectronics, 2005. 20(10): p. 2104-2110. [137] M. Piliarik, H. Vaisocherova, and J. Homola, Towards parallelized surface plasmon resonance sensor
platform for sensitive detection of oligonucleotides. Sensors and Actuators B-Chemical, 2007. 121(1): p. 187-193.
[138] P.I. Nikitin, et al., Surface plasmon resonance interferometry for biological and chemical sensing. Sensors and Actuators B-Chemical, 1999. 54(1-2): p. 43-50.
References
- 132 -
[139] P.I. Nikitin, et al., Surface plasmon resonance interferometry for micro-array biosensing. Sensors and Actuators a-Physical, 2000. 85(1-3): p. 189-193.
[140] A.G. Notcovich, V. Zhuk, and S.G. Lipson, Surface plasmon resonance phase imaging. Applied Physics Letters, 2000. 76(13): p. 1665-1667.
[141] C.M. Wu, et al., High-sensitivity sensor based on surface plasmon resonance and heterodyne
interferometry. Sensors and Actuators B-Chemical, 2003. 92(1-2): p. 133-136. [142] E. Alieva, and V.N. Konopsky, Biosensor based on surface plasmon interferometry independent on
variations of liquid's refraction index. Sensors and Actuators B-Chemical, 2004. 99(1): p. 90-97. [143] R. Naraoka and K. Kajikawa, Phase detection of surface plasmon resonance using rotating analyzer
method. Sensors and Actuators B-Chemical, 2005. 107(2): p. 952-956. [144] H.P. Ho, W.W. Lam, and S.Y. Wu, Surface plasmon resonance sensor based on the measurement of
differential phase. Review of Scientific Instruments, 2002. 73(10): p. 3534-3539. [145] S.Y. Wu, et al., Highly sensitive differential phase-sensitive surface plasmon resonance biosensor based
on the Mach-Zehnder configuration. Optics Letters, 2004. 29(20): p. 2378-2380. [146] H.P. Ho, et al., Real-time optical biosensor based on differential phase measurement of surface
plasmon resonance. Biosensors & Bioelectronics, 2005. 20(10): p. 2177-2180. [147] H.P. Ho, et al., Phase-sensitive surface plasmon resonance biosensor using the photoelastic modulation
technique. Sensors and Actuators B-Chemical, 2006. 114(1): p. 80-84. [148] W. Yuan, et al., Surface plasmon resonance biosensor incorporated in a Michelson interferometer with
enhanced sensitivity. Ieee Sensors Journal, 2007. 7(1-2): p. 70-73. [149] Y.C. Li, et al., Differential-phase surface plasmon resonance biosensor. Analytical Chemistry, 2008.
80(14): p. 5590-5595. [150] Y. Xinglong, et al., Immunosensor based on optical heterodyne phase detection. Sensors and Actuators
B: Chemical, 2001. 76(1–3): p. 199-202. [151] H.P. Chiang, J.L. Lin, and Z.W. Chen, High sensitivity surface plasmon resonance sensor based on phase
interrogation at optimal incident wavelengths. Applied Physics Letters, 2006. 88(14). [152] S.P. Ng, et al., White-light spectral interferometry for surface plasmon resonance sensing applications.
Optics Express, 2011. 19(5): p. 4521-4527. [153] T.T. Ehler, and L.J. Noe, Surface Plasmon Studies of Thin Silver/Gold Bimetallic Films. Langmuir, 1995.
11(10): p. 4177-4179. [154] S.A. Zynio, et al., Bimetallic layers increase sensitivity of affinity sensors based on surface plasmon
resonance. Sensors, 2002. 2(2): p. 62-70. [155] M. Mitsushio, K. Miyashita, and M. Higo, Sensor properties and surface characterization of the metal-
deposited SPR optical fiber sensors with Au, Ag, Cu, and Al. Sensors and Actuators A: Physical, 2006. 125(2): p. 296-303.
[156] R. Slavik, J. Homola, and J. Ctyroky, Miniaturization of fiber optic surface plasmon resonance sensor. Sensors and Actuators B-Chemical, 1998. 51(1-3): p. 311-315.
[157] B.D. Gupta and C.D. Singh, Evanescent-absorption coefficient for diffuse source illumination: uniform-
and tapered-fiber sensors. Appl. Opt., 1994. 33(13): p. 2737-2742. [158] B. Grunwald, and G. Holst, Fibre optic refractive index microsensor based on white-light SPR
excitation. Sensors and Actuators a-Physical, 2004. 113(2): p. 174-180. [159] Y.C. Kim, et al., Tapered fiber optic surface plasmon resonance sensor for analyses of vapor and liquid
phases. Optics Letters, 2005. 30(17): p. 2218-2220. [160] M. Niggemann, et al., Remote sensing of tetrachloroethene with a micro-fibre optical gas sensor based
on surface plasmon resonance spectroscopy. Sensors and Actuators B: Chemical, 1996. 34(1–3): p. 328-333.
[161] L.A. Obando, and K.S. Booksh, Tuning Dynamic Range and Sensitivity of White-Light, Multimode,
Fiber-Optic Surface Plasmon Resonance Sensors. Analytical Chemistry, 1999. 71(22): p. 5116-5122. [162] Y. Yuan, et al., Theoretical investigations for surface plasmon resonance based optical fiber tip sensor.
Sensors and Actuators B: Chemical, 2013. 188(0): p. 757-760. [163] P. Winsemius, et al., Temperature dependence of the optical properties of Au, Ag and Cu. Journal of
Physics F: Metal Physics, 1976. 6(8): p. 1583. [164] J.R. Devore, Refractive Indices of Rutile and Sphalerite. Journal of the Optical Society of America,
1951. 41(6): p. 416-417. [165] E.D. Palik, Handbook of optical constants of solids. 1985, Orlando: Academic Press. [166] I.H. Malitson, Interspecimen Comparison of the Refractive Index of Fused Silica. Journal of the Optical
Society of America, 1965. 55(10): p. 1205-1208. [167] O. Frazao, et al., Optical flowmeter using a modal interferometer based on a single nonadiabatic fiber
taper. Optics Letters, 2007. 32(14): p. 1974-1976.
References
- 133 -
[168] Z.B. Tian, et al., Refractive index sensing with Mach-Zehnder interferometer based on concatenating
two single-mode fiber tapers. Ieee Photonics Technology Letters, 2008. 20(5-8): p. 626-628. [169] T.A. Birks, Twist-Induced Tuning in Tapered Fiber Couplers. Applied Optics, 1989. 28(19): p. 4226-
4233. [170] F.J. Arregui, I.R. Matias, and M. Lopez-Amo, Optical fiber strain gauge based on a tapered single-mode
fiber. Sensors and Actuators a-Physical, 2000. 79(2): p. 90-96. [171] K.Q. Kieu, and M. Mansuripur, Biconical fiber taper sensors. Ieee Photonics Technology Letters,
2006. 18(21-24): p. 2239-2241. [172] S. Patane, et al., Polarization-maintaining near-field optical probes. Journal of Microscopy-Oxford,
2008. 229(2): p. 377-383. [173] G.J. Pendock, H.S. Mackenzie, and F.P. Payne, Dye-Lasers Using Tapered Optical Fibers. Applied
Optics, 1993. 32(27): p. 5236-5242. [174] A.J. Fielding, and C.C. Davis, Tapered single-mode optical fiber evanescent coupling. Ieee Photonics
Technology Letters, 2002. 14(1): p. 53-55. [175] M.J. Humphrey, et al., Calculation of optimal fiber radius and whispering-gallery mode spectra for a
fiber-coupled microsphere. Optics Communications, 2007. 271(1): p. 124-131. [176] J.M. Ward, P. Feron, and S.N. Chormaic, A taper-fused microspherical laser source. Ieee Photonics
Technology Letters, 2008. 20(5-8): p. 392-394. [177] T.A. Birks, W.J. Wadsworth, and P.S. Russell, Supercontinuum generation in tapered fibers. Optics
Letters, 2000. 25(19): p. 1415-1417. [178] J. Villatoro, D. Monzon-Hernandez, and E. Mejia, Fabrication and modeling of uniform-waist single-
mode tapered optical fiber sensors. Applied Optics, 2003. 42(13): p. 2278-2283. [179] O. Esteban, et al., Surface plasmon resonance sensors based on uniform-waist tapered fibers in a
reflective configuration. Applied Optics, 2006. 45(28): p. 7294-7298. [180] B.D. Gupta and C.D. Singh, Evanescent-Absorption Coefficient for Diffuse Source Illumination -
Uniform-Fiber and Tapered-Fiber Sensors. Applied Optics, 1994. 33(13): p. 2737-2742. [181] R. Jha, R.K. Verma, and B.D. Gupta, Surface Plasmon Resonance-Based Tapered Fiber Optic Sensor:
Sensitivity Enhancement by Introducing a Teflon Layer Between Core and Metal Layer. Plasmonics, 2008. 3(4): p. 151-156.
[182] A. Ankiewicz, C. Pask, and A.W. Snyder, Slowly Varying Optical Fibers. Journal of the Optical Society of America, 1982. 72(2): p. 198-203.
[183] J.L. Santos and F. Farahi, Handbook of Optical Sensors. 2014: CRC Press. [184] J., Janata, Principles of Chemical Sensing. 2009: Springer. [185] F.S. Ligler and C.R. Taitt, Optical Biosensors: Today and Tomorrow. 2011. [186] J.G. Webster and H. Eren, Measurement, Instrumentation and Sensors Handbook. 2014. [187] Y. Q. Yuan, et al., Theoretical investigations for surface plasmon resonance based optical fiber tip
sensor. Sensors and Actuators B-Chemical, 2013. 188: p. 757-760. [188] S. Enoch and N. Bonod, Plasmonics: from basics to advanced topics. 2012: Springer. [189] A.K. Sharma, R. Jha, and B.D. Gupta, Fiber-Optic Sensors Based on Surface Plasmon Resonance: A
Comprehensive Review. Sensors Journal, IEEE, 2007. 7(8): p. 1118-1129. [190] P. Bhatia and B.D. Gupta, Surface-plasmon-resonance-based fiber-optic refractive index sensor:
sensitivity enhancement. Applied Optics, 2011. 50(14): p. 2032-2036. [191] S. Patskovsky, et al., Near-infrared surface plasmon resonance sensing on a silicon platform. Sensors
and Actuators B: Chemical, 2004. 97(2): p. 409-414. [192] A. Dıez, M. Andres, and J. Cruz, In-line fiber-optic sensors based on the excitation of surface plasma
modes in metal-coated tapered fibers. Sensors and Actuators B: Chemical, 2001. 73(2): p. 95-99. [193] T. Allsop, et al., Generation of infrared surface plasmon resonances with high refractive index
sensitivity utilizing tilted fiber Bragg gratings. Applied optics, 2007. 46(22): p. 5456-5460. [194] R.C. Jorgenson and S.S. Yee, Control of the Dynamic-Range and Sensitivity of a Surface-Plasmon
Resonance Based Fiber Optic Sensor. Sensors and Actuators a-Physical, 1994. 43(1-3): p. 44-48. [195] J. Ctyroky, J. Homola, and M. Skalsky, Tuning of spectral operation range of a waveguide surface
plasmon resonance sensor. Electronics Letters, 1997. 33(14): p. 1246-1248. [196] H. Moayyed, et al., Analysis of Phase Interrogated SPR Fiber Optic Sensors With Bimetallic Layers.
Ieee Sensors Journal, 2014. 14(10): p. 3662-3668. [197] M. Born, and E. Wolf, Principles of Optics. 2003. [198] A.M. Vengsarkar, et al., Long-period fiber gratings as band-rejection filters. Journal of Lightwave
Technology, 1996. 14(1): p. 58-65. [199] T. Erdogan, Fiber grating spectra. Journal of Lightwave Technology, 1997. 15(8): p. 1277-1294.

References
- 134 -
[200] T.W. MacDougall, et al., Generalized expression for the growth of long period gratings. Ieee Photonics Technology Letters, 1998. 10(10): p. 1449-1451.
[201] Y.N. Zhu, et al., EDFA gain flattening using phase-shifted long-period grating. Microwave and Optical Technology Letters, 2003. 37(2): p. 153-157.
[202] O. Deparis, et al., Bandpass filters based on pi-shifted long-period fiber gratings for actively mode-
locked erbium fiber lasers. Optics Letters, 2001. 26(16): p. 1239-1241. [203] X.W. Dong, et al., Add/drop channel filter based on two parallel long-period fiber gratings coupler.
Optik, 2009. 120(16): p. 855-859. [204] H.J. Patrick, C.C. Chang, and S.T. Vohra, Long period fibre gratings for structural bend sensing.
Electronics Letters, 1998. 34(18): p. 1773-1775. [205] F.J. O'Flaherty, et al., Temperature characterisation of long-period gratings for sensor applications.
Microwave and Optical Technology Letters, 2004. 42(5): p. 402-405. [206] G. Ghosh, Temperature Dispersion of Refractive-Indexes in Some Silicate Fiber Glasses. Ieee Photonics
Technology Letters, 1994. 6(3): p. 431-433. [207] M. Chomat, et al., Temperature sensitivity of long-period gratings inscribed with a CO2 laser in optical
fiber with graded-index cladding. Sensors and Actuators B-Chemical, 2006. 119(2): p. 642-650. [208] A. van Brakel and P.L. Swart, Temperature-compensated optical fiber Michelson refractometer.
Optical Engineering, 2005. 44(2). [209] V. Bhatia, et al., Simultaneous strain and temperature measurement with long-period gratings. Optics
Letters, 1997. 22(9): p. 648-650. [210] J. Yang, et al., Long-period grating refractive index sensor with a modified cladding structure for large
operational range and high sensitivity. Applied Optics, 2006. 45(24): p. 6142-6147. [211] J.H. Chong, et al., Measurements of refractive index sensitivity using long-period grating
refractometer. Optics Communications, 2004. 229(1-6): p. 65-69. [212] G.M. Rego, J.L. Santos, and H.M. Salgado, Refractive index measurement with long-period gratings
arc-induced in pure-silica-core fibres. Optics Communications, 2006. 259(2): p. 598-602. [213] X. Chen, et al., Optical chemsensors utilizing long-period fiber gratings UV-Inscribed in D-Fiber with
enhanced sensitivity through cladding etching. Ieee Photonics Technology Letters, 2004. 16(5): p. 1352-1354.
[214] A. Trouillet, E. Marin, and C. Veillas, Fibre gratings for hydrogen sensing. Measurement Science & Technology, 2006. 17(5): p. 1124-1128.
[215] R. Falciai, A.G. Mignani, and A. Vannini, Long period gratings as solution concentration sensors. Sensors and Actuators B-Chemical, 2001. 74(1-3): p. 74-77.
[216] A.M. Vengsarkar, Long-period fiber gratings shape optical spectra. Laser Focus World, 1996. 32(6): p. 243-+.
[217] V. Bhatia and A.M. Vengsarkar, Optical fiber long-period grating sensors. Optics Letters, 1996. 21(9): p. 692-694.
[218] V. Bhatia, et al., Comparison of optical fiber long-period and Bragg grating sensors. Smart Structures and Materials 1996: Smart Sensing, Processing, and Instrumentation, 1996. 2718: p. 110-121.
[219] T. Erdogan, Cladding-mode resonances in short- and long-period fiber grating filters. Journal of the Optical Society of America a-Optics Image Science and Vision, 1997. 14(8): p. 1760-1773.
[220] E. Anemogiannis, E.N. Glytsis, and T.K. Gaylord, Transmission characteristics of long-period fiber
gratings having arbitrary azimuthal/radial refractive index variations. Journal of Lightwave Technology, 2003. 21(1): p. 218-227.
[221] C.D. Poole, H.M. Presby, and J.P. Meester, 2-Mode Fiber Spatial-Mode Converter Using Periodic Core
Deformation. Electronics Letters, 1994. 30(17): p. 1437-1438. [222] H. Kyung Jun, et al., Simultaneous measurement of strain and temperature incorporating a long-
period fiber grating inscribed on a polarization-maintaining fiber. Photonics Technology Letters, IEEE, 2004. 16(9): p. 2114-2116.
[223] G. Rego, et al., High-temperature stability of long-period fiber gratings produced using an electric arc. Journal of Lightwave Technology, 2001. 19(10): p. 1574-1579.
[224] S.T. Lee, et al., Long period gratings in multimode optical fibers: application in chemical sensing. Optics Communications, 2003. 224(4-6): p. 237-241.
[225] T.J. Eom, et al., Optical pulse multiplication and temporal coding using true time delay achieved by
long-period fiber gratings in dispersion compensating fiber. Optics Express, 2004. 12(26): p. 6410-6420.
[226] L. Dong, L. Reekie, and J.L. Cruz, Long period gratings formed in depressed cladding fibres. Electronics Letters, 1997. 33(22): p. 1897-1898.

References
- 135 -
[227] G. Humbert, et al., Long period grating filters fabricated with electric arc in dual concentric core
fibers. Optics Communications, 2003. 225(1-3): p. 47-53. [228] I. Allsop, D.J. Webb, and I. Bennion, Investigations of the spectral sensitivity of long period gratings
fabricated in three-layered optical fiber. Journal of Lightwave Technology, 2003. 21(1): p. 264-268. [229] A.A. Abramov, et al., Electrically tunable efficient broad-band fiber filter. Ieee Photonics Technology
Letters, 1999. 11(4): p. 445-447. [230] D.M. Costantini, et al., Tunable loss filter based on metal-coated long-period fiber grating. Ieee
Photonics Technology Letters, 1999. 11(11): p. 1458-1460. [231] M.A. van Eijkelenborg, W. Padden, and J.A. Besley, Mechanically induced long-period gratings in
microstructured polymer fibre. Optics Communications, 2004. 236(1-3): p. 75-78. [232] P. Steinvurzel, et al., Long period grating resonances in photonic bandgap fiber. Opt Express, 2006.
14(7): p. 3007-14. [233] P. Caldas, et al., Characterization of the response of a dual resonance of an arc-induced long-period
grating to various physical parameters. Applied Optics, 2010. 49(16): p. 2994-2999. [234] J. Ctyroky, et al., Modelling of the surface plasmon resonance waveguide sensor with Bragg grating.
Optical and Quantum Electronics, 1999. 31(9-10): p. 927-941. [235] G. Nemova and R. Kashyap, Fiber-Bragg-grating-assisted surface plasmon-polariton sensor. Optics
Letters, 2006. 31(14): p. 2118-2120. [236] G. Nemova and R. Kashyap, Theoretical model of a planar integrated refractive index sensor based on
surface plasmon-polariton excitation. Optics Communications, 2007. 275(1): p. 76-82. [237] G. Nemova, and R. Kashyap, A compact integrated planar-waveguide refractive-index sensor based
on a corrugated metal grating. Journal of Lightwave Technology, 2007. 25(8): p. 2244-2250. [238] Y.J. He, Y.L. Lo, and J.F. Huang, Optical-fiber surface-plasmon-resonance sensor employing long-period
fiber gratings in multiplexing. Journal of the Optical Society of America B-Optical Physics, 2006. 23(5): p. 801-811.
[239] A. Al-Azzawi, Fiber optics: principles and practices. 2016: CRC Press. [240] B. Culshaw, Interferometric optical fibre sensors. Journal of Optical Sensors, 1986. 1: p. 237-252. [241] C.J. Misas, et al., Interrogation of low-finesse Fabry-Perot cavities based on modulation of the transfer
function of a wavelength division multiplexer. Lightwave Technology, Journal of, 2001. 19(5): p. 673-681.
[242] Y. Chen, et al., Interferometers for displacement-noise-free gravitational-wave detection. Physical review letters, 2006. 97(15): p. 151103.
[243] E.D. Black, An introduction to Pound–Drever–Hall laser frequency stabilization. American Journal of Physics, 2001. 69(1): p. 79-87.
[244] J.H. Chow, et al., Demonstration of a passive subpicostrain fiber strain sensor. Optics letters, 2005. 30(15): p. 1923-1925.