
A wavelet-based variability model (WVM) for solar PV power plants
INTERNATIONAL JOURNAL of RENEWABLE ENERGY RESEARCH I.A. Odigwe et al. ,Vol.3, No. 3
Development of a software solution for solar-PV
power systems sizing and monitoring
I.A. Odigwe*‡, C.I. Nnadi*, A.F. Agbetuyi*, A.A. Awelewa*, F.E. Idachaba*
*Department of Electrical and Information Engineering, Covenant University, P.M.B 1023, Ota, Ogun State, Nigeria.
([email protected], [email protected], [email protected])
‡ Corresponding Author; I.A. Odigwe, Department of Electrical and Information Engineering, Covenant University, P.M.B
1023, Ota, Ogun State, Nigeria, Tel: +234 803 821 1387, [email protected]
Received: 30.07.2013 Accepted: 29.08.2013
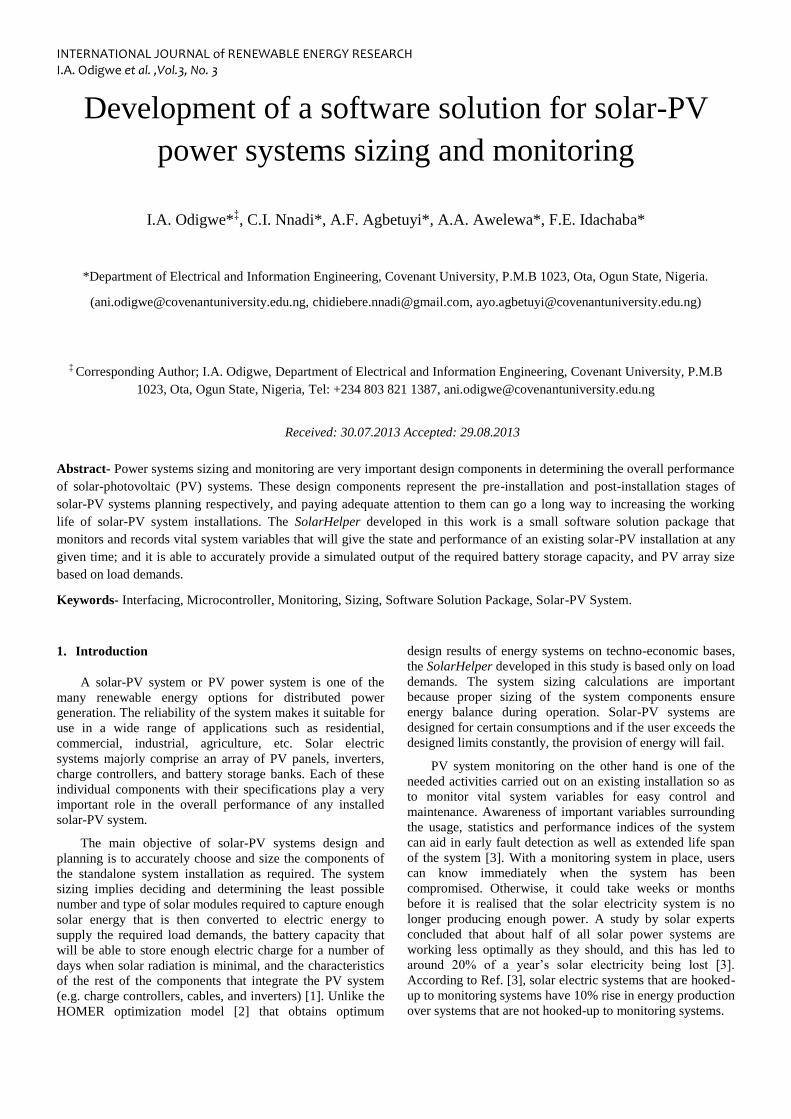
Abstract- Power systems sizing and monitoring are very important design components in determining the overall performance
of solar-photovoltaic (PV) systems. These design components represent the pre-installation and post-installation stages of
solar-PV systems planning respectively, and paying adequate attention to them can go a long way to increasing the working
life of solar-PV system installations. The SolarHelper developed in this work is a small software solution package that
monitors and records vital system variables that will give the state and performance of an existing solar-PV installation at any
given time; and it is able to accurately provide a simulated output of the required battery storage capacity, and PV array size
based on load demands.
Keywords- Interfacing, Microcontroller, Monitoring, Sizing, Software Solution Package, Solar-PV System.
1. Introduction
A solar-PV system or PV power system is one of the
many renewable energy options for distributed power
generation. The reliability of the system makes it suitable for
use in a wide range of applications such as residential,
commercial, industrial, agriculture, etc. Solar electric
systems majorly comprise an array of PV panels, inverters,
charge controllers, and battery storage banks. Each of these
individual components with their specifications play a very
important role in the overall performance of any installed
solar-PV system.
The main objective of solar-PV systems design and
planning is to accurately choose and size the components of
the standalone system installation as required. The system
sizing implies deciding and determining the least possible
number and type of solar modules required to capture enough
solar energy that is then converted to electric energy to
supply the required load demands, the battery capacity that
will be able to store enough electric charge for a number of
days when solar radiation is minimal, and the characteristics
of the rest of the components that integrate the PV system
(e.g. charge controllers, cables, and inverters) [1]. Unlike the
HOMER optimization model [2] that obtains optimum
design results of energy systems on techno-economic bases,
the SolarHelper developed in this study is based only on load
demands. The system sizing calculations are important
because proper sizing of the system components ensure
energy balance during operation. Solar-PV systems are
designed for certain consumptions and if the user exceeds the
designed limits constantly, the provision of energy will fail.
PV system monitoring on the other hand is one of the
needed activities carried out on an existing installation so as
to monitor vital system variables for easy control and
maintenance. Awareness of important variables surrounding
the usage, statistics and performance indices of the system
can aid in early fault detection as well as extended life span
of the system [3]. With a monitoring system in place, users
can know immediately when the system has been
compromised. Otherwise, it could take weeks or months
before it is realised that the solar electricity system is no
longer producing enough power. A study by solar experts
concluded that about half of all solar power systems are
working less optimally as they should, and this has led to
around 20% of a year’s solar electricity being lost [3].
According to Ref. [3], solar electric systems that are hooked-
up to monitoring systems have 10% rise in energy production
over systems that are not hooked-up to monitoring systems.
INTERNATIONAL JOURNAL of RENEWABLE ENERGY RESEARCH I.A. Odigwe et al. ,Vol.3, No. 3
699
This study presents the SolarHelper, a small software
solution package designed to tackle the two phases of Solar-
PV system design and monitoring to considerable levels
using available technology and a straight forward approach.
2. Methodology
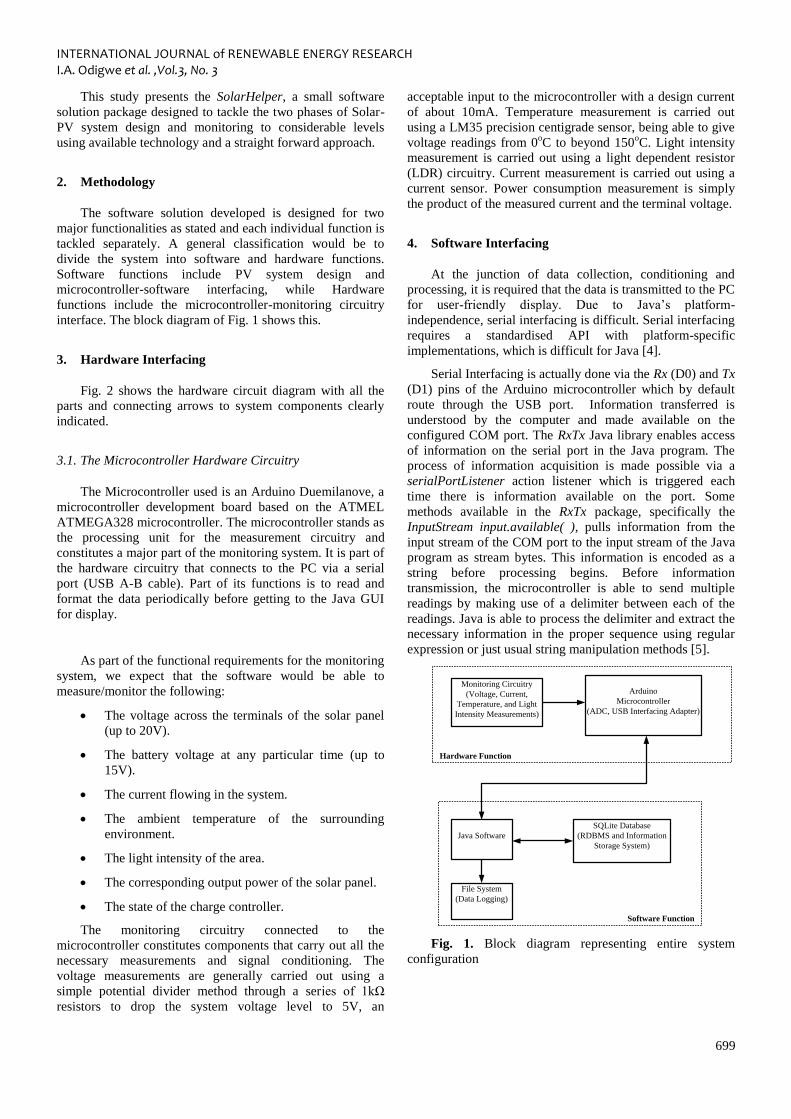
The software solution developed is designed for two
major functionalities as stated and each individual function is
tackled separately. A general classification would be to
divide the system into software and hardware functions.
Software functions include PV system design and
microcontroller-software interfacing, while Hardware
functions include the microcontroller-monitoring circuitry
interface. The block diagram of Fig. 1 shows this.
3. Hardware Interfacing
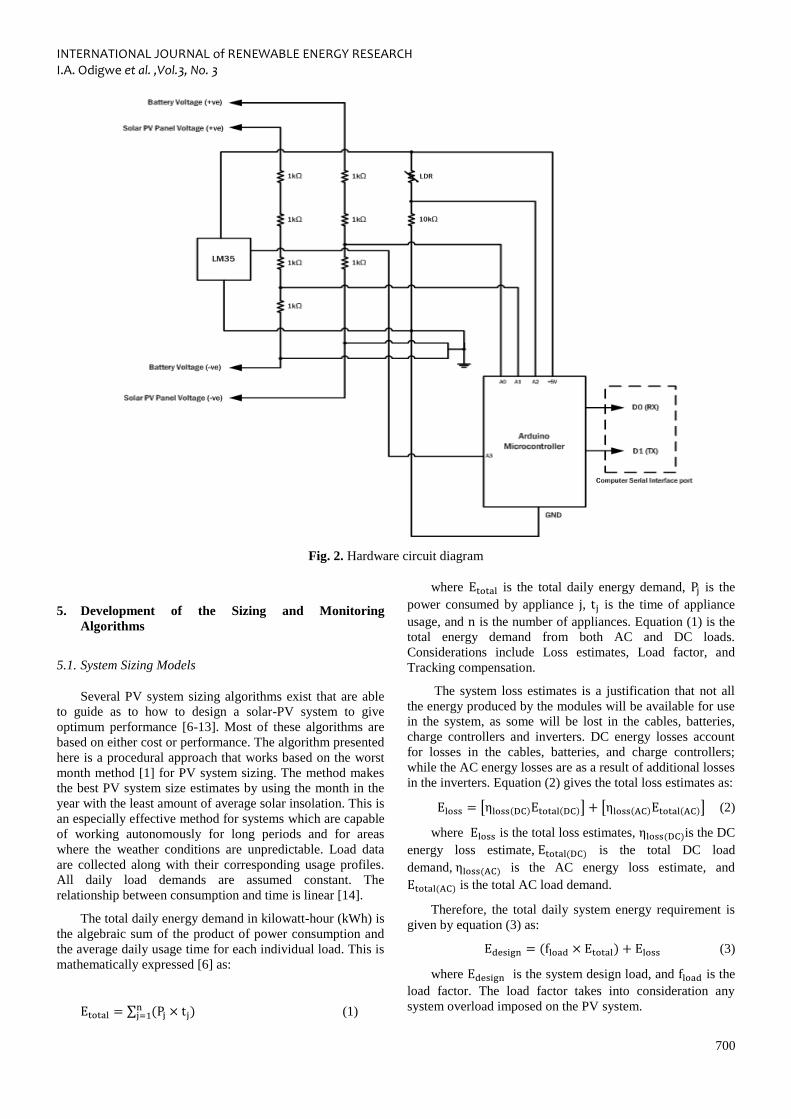
Fig. 2 shows the hardware circuit diagram with all the
parts and connecting arrows to system components clearly
indicated.
3.1. The Microcontroller Hardware Circuitry
The Microcontroller used is an Arduino Duemilanove, a
microcontroller development board based on the ATMEL
ATMEGA328 microcontroller. The microcontroller stands as
the processing unit for the measurement circuitry and
constitutes a major part of the monitoring system. It is part of
the hardware circuitry that connects to the PC via a serial
port (USB A-B cable). Part of its functions is to read and
format the data periodically before getting to the Java GUI
for display.
As part of the functional requirements for the monitoring
system, we expect that the software would be able to
measure/monitor the following:
The voltage across the terminals of the solar panel
(up to 20V).
The battery voltage at any particular time (up to
15V).
The current flowing in the system.
The ambient temperature of the surrounding
environment.
The light intensity of the area.
The corresponding output power of the solar panel.
The state of the charge controller.
The monitoring circuitry connected to the
microcontroller constitutes components that carry out all the
necessary measurements and signal conditioning. The
voltage measurements are generally carried out using a
simple potential divider method through a series of 1kΩ
resistors to drop the system voltage level to 5V, an
acceptable input to the microcontroller with a design current
of about 10mA. Temperature measurement is carried out
using a LM35 precision centigrade sensor, being able to give
voltage readings from 0oC to beyond 150
oC. Light intensity
measurement is carried out using a light dependent resistor
(LDR) circuitry. Current measurement is carried out using a
current sensor. Power consumption measurement is simply
the product of the measured current and the terminal voltage.
4. Software Interfacing
At the junction of data collection, conditioning and
processing, it is required that the data is transmitted to the PC
for user-friendly display. Due to Java’s platform-
independence, serial interfacing is difficult. Serial interfacing
requires a standardised API with platform-specific
implementations, which is difficult for Java [4].
Serial Interfacing is actually done via the Rx (D0) and Tx
(D1) pins of the Arduino microcontroller which by default
route through the USB port. Information transferred is
understood by the computer and made available on the
configured COM port. The RxTx Java library enables access
of information on the serial port in the Java program. The
process of information acquisition is made possible via a
serialPortListener action listener which is triggered each
time there is information available on the port. Some
methods available in the RxTx package, specifically the
InputStream input.available( ), pulls information from the
input stream of the COM port to the input stream of the Java
program as stream bytes. This information is encoded as a
string before processing begins. Before information
transmission, the microcontroller is able to send multiple
readings by making use of a delimiter between each of the
readings. Java is able to process the delimiter and extract the
necessary information in the proper sequence using regular
expression or just usual string manipulation methods [5].
Java Software
File System
(Data Logging)
Monitoring Circuitry
(Voltage, Current,
Temperature, and Light
Intensity Measurements)
Arduino
Microcontroller
(ADC, USB Interfacing Adapter)
Hardware Function
Software Function
SQLite Database
(RDBMS and Information
Storage System)
Fig. 1. Block diagram representing entire system
configuration
INTERNATIONAL JOURNAL of RENEWABLE ENERGY RESEARCH I.A. Odigwe et al. ,Vol.3, No. 3
700
Fig. 2. Hardware circuit diagram
5. Development of the Sizing and Monitoring
Algorithms
5.1. System Sizing Models
Several PV system sizing algorithms exist that are able
to guide as to how to design a solar-PV system to give
optimum performance [6-13]. Most of these algorithms are
based on either cost or performance. The algorithm presented
here is a procedural approach that works based on the worst
month method [1] for PV system sizing. The method makes
the best PV system size estimates by using the month in the
year with the least amount of average solar insolation. This is
an especially effective method for systems which are capable
of working autonomously for long periods and for areas
where the weather conditions are unpredictable. Load data
are collected along with their corresponding usage profiles.
All daily load demands are assumed constant. The
relationship between consumption and time is linear [14].
The total daily energy demand in kilowatt-hour (kWh) is
the algebraic sum of the product of power consumption and
the average daily usage time for each individual load. This is
mathematically expressed [6] as:
∑ (1)
where is the total daily energy demand, is the
power consumed by appliance , is the time of appliance
usage, and is the number of appliances. Equation (1) is the
total energy demand from both AC and DC loads.
Considerations include Loss estimates, Load factor, and
Tracking compensation.
The system loss estimates is a justification that not all
the energy produced by the modules will be available for use
in the system, as some will be lost in the cables, batteries,
charge controllers and inverters. DC energy losses account
for losses in the cables, batteries, and charge controllers;
while the AC energy losses are as a result of additional losses
in the inverters. Equation (2) gives the total loss estimates as:
[ ] [ ] (2)
where is the total loss estimates, is the DC
energy loss estimate, is the total DC load
demand, is the AC energy loss estimate, and
is the total AC load demand.
Therefore, the total daily system energy requirement is
given by equation (3) as:
(3)
where is the system design load, and is the
load factor. The load factor takes into consideration any
system overload imposed on the PV system.
INTERNATIONAL JOURNAL of RENEWABLE ENERGY RESEARCH I.A. Odigwe et al. ,Vol.3, No. 3
701
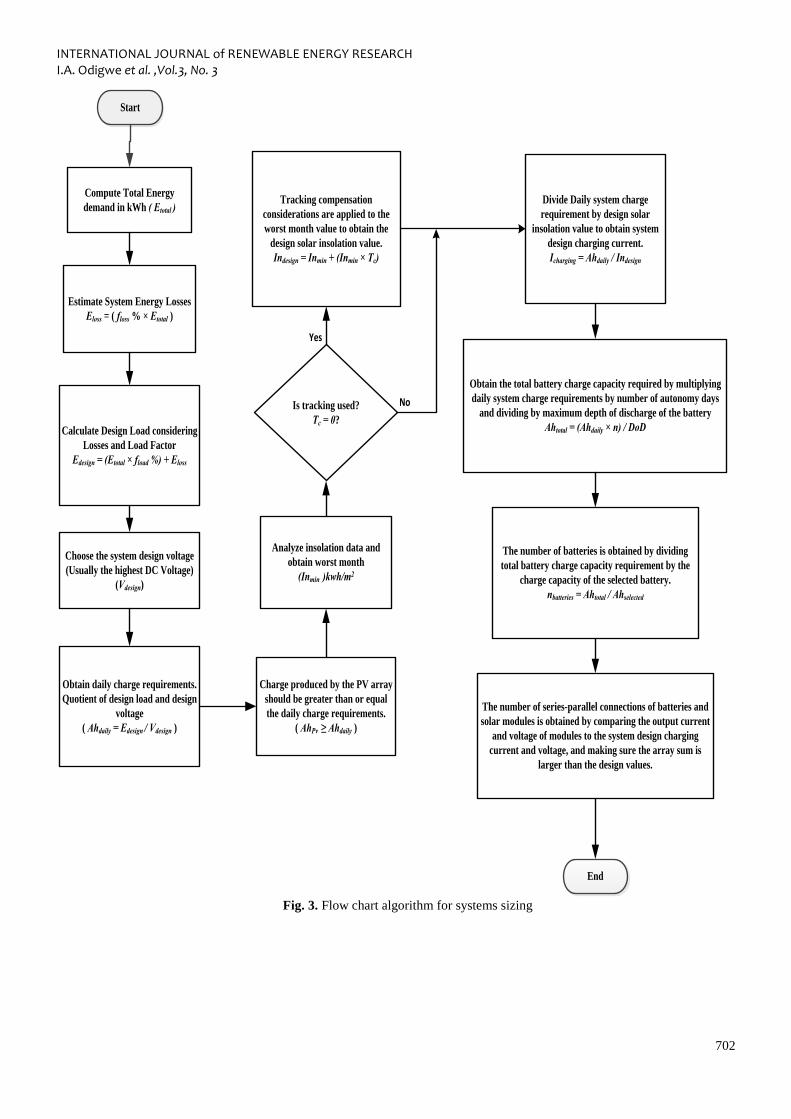
The entire algorithm is carried out in twelve simple steps
[15, 16] as enumerated below:
Step 1: Compute Total Energy Demand. Equation
(1) shows the mathematical expression.
Step 2: Estimate System Energy Losses.
Step 3: Calculate the System Design load using the
load factor and losses.
Step 4: Choose System Design Voltage for the
system (usually the highest DC voltage in the
system).
Step 5: Obtain daily charge requirements – this is
obtained using the system design load and the
system design voltage. It is a pointer to the size of
the battery bank and the number of solar panels
required.
Step 6: Charge produced by PV array per day must
equal or exceed daily charge requirements.
Step 7: Obtain worst month from the meteorological
data.
Step 8: Tracking compensation considerations are
applied to the worst month value if necessary to
obtain the design solar insolation value.
Step 9: Divide daily system charge requirement by
design solar insolation value to obtain system design
charging current.
Step 10: To obtain the total battery charge capacity
required, multiply daily system charge requirements
by number of autonomy days and divide by
maximum battery depth of discharge.
Step 11: The number of Batteries is obtained by
dividing total battery charge capacity requirement
by the charge capacity of the selected battery.
Step 12: The number of series-parallel connections
of batteries and solar modules is obtained by
comparing the output current and voltage of
modules to the system design charging current and
voltage, and making sure the array sum is larger
than the design values.
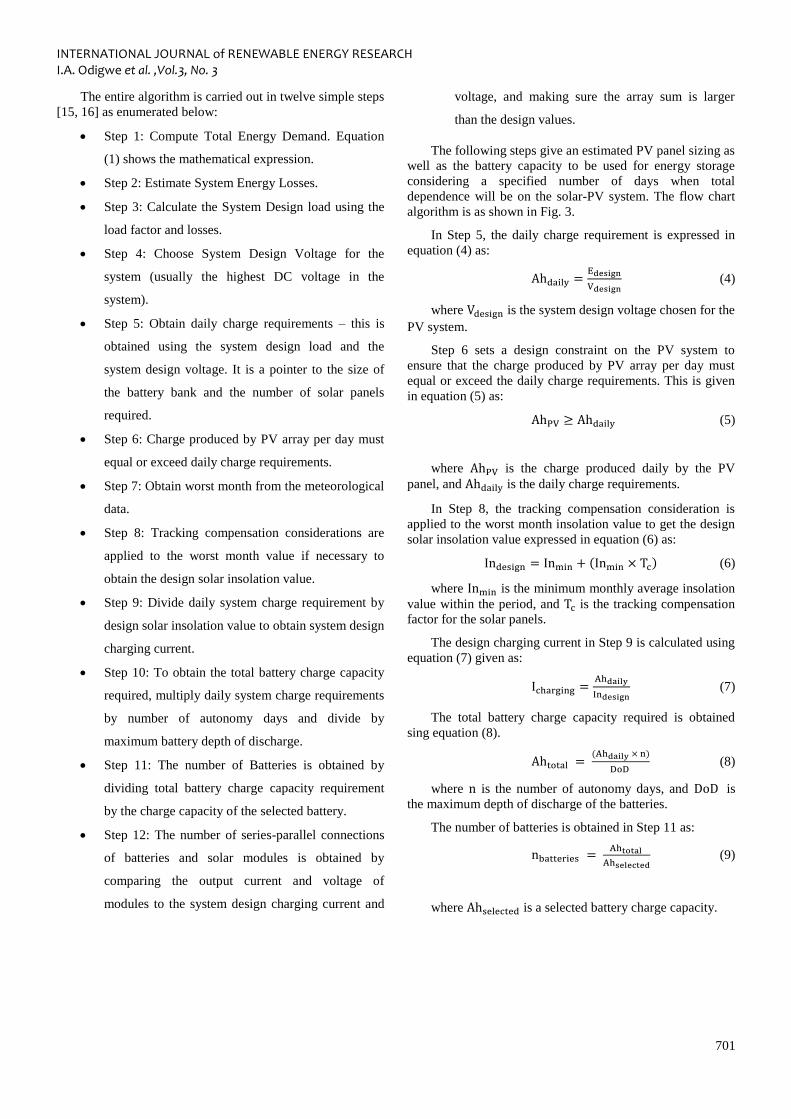
The following steps give an estimated PV panel sizing as
well as the battery capacity to be used for energy storage
considering a specified number of days when total
dependence will be on the solar-PV system. The flow chart
algorithm is as shown in Fig. 3.
In Step 5, the daily charge requirement is expressed in
equation (4) as:
(4)
where is the system design voltage chosen for the
PV system.
Step 6 sets a design constraint on the PV system to
ensure that the charge produced by PV array per day must
equal or exceed the daily charge requirements. This is given
in equation (5) as:
(5)
where is the charge produced daily by the PV
panel, and is the daily charge requirements.
In Step 8, the tracking compensation consideration is
applied to the worst month insolation value to get the design
solar insolation value expressed in equation (6) as:
(6)
where is the minimum monthly average insolation
value within the period, and is the tracking compensation
factor for the solar panels.
The design charging current in Step 9 is calculated using
equation (7) given as:
(7)
The total battery charge capacity required is obtained
sing equation (8).
(8)
where is the number of autonomy days, and is
the maximum depth of discharge of the batteries.
The number of batteries is obtained in Step 11 as:
(9)
where is a selected battery charge capacity.
INTERNATIONAL JOURNAL of RENEWABLE ENERGY RESEARCH I.A. Odigwe et al. ,Vol.3, No. 3
702
Compute Total Energy
demand in kWh ( Etotal )
Estimate System Energy Losses
Eloss = ( floss % × Etotal )
Calculate Design Load considering
Losses and Load Factor
Edesign = (Etotal × fload %) + Eloss
Choose the system design voltage
(Usually the highest DC Voltage)
(Vdesign)
Obtain daily charge requirements.
Quotient of design load and design
voltage
( Ahdaily = Edesign / Vdesign )
Charge produced by the PV array
should be greater than or equal
the daily charge requirements.
( AhPv ≥ Ahdaily )
Analyze insolation data and
obtain worst month
(Inmin )kwh/m2
Tracking compensation
considerations are applied to the
worst month value to obtain the
design solar insolation value.
Indesign = Inmin + (Inmin × Tc)
Divide Daily system charge
requirement by design solar
insolation value to obtain system
design charging current.
Icharging = Ahdaily / Indesign
Is tracking used?
Tc = 0?
Obtain the total battery charge capacity required by multiplying
daily system charge requirements by number of autonomy days
and dividing by maximum depth of discharge of the battery
Ahtotal = (Ahdaily × n) / DoD
The number of batteries is obtained by dividing
total battery charge capacity requirement by the
charge capacity of the selected battery.
nbatteries = Ahtotal / Ahselected
The number of series-parallel connections of batteries and
solar modules is obtained by comparing the output current
and voltage of modules to the system design charging
current and voltage, and making sure the array sum is
larger than the design values.
Start
End
Yes
No
Fig. 3. Flow chart algorithm for systems sizing
INTERNATIONAL JOURNAL of RENEWABLE ENERGY RESEARCH I.A. Odigwe et al. ,Vol.3, No. 3
703
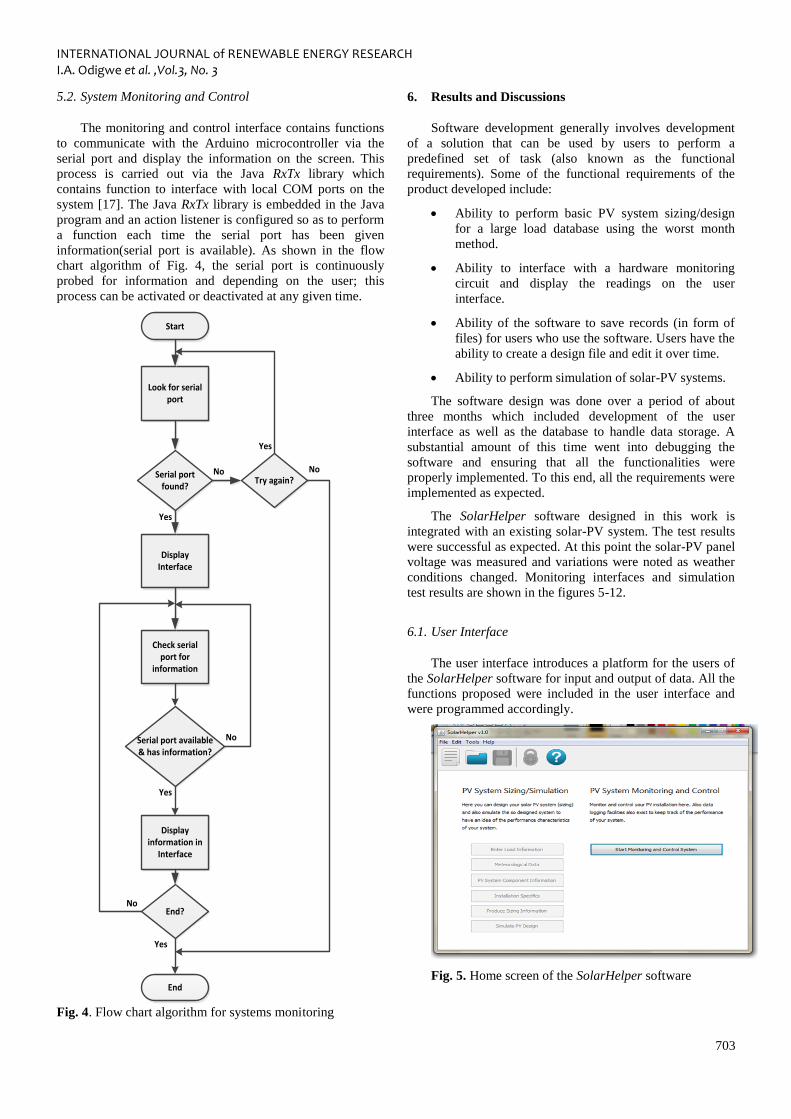
5.2. System Monitoring and Control
The monitoring and control interface contains functions
to communicate with the Arduino microcontroller via the
serial port and display the information on the screen. This
process is carried out via the Java RxTx library which
contains function to interface with local COM ports on the
system [17]. The Java RxTx library is embedded in the Java
program and an action listener is configured so as to perform
a function each time the serial port has been given
information(serial port is available). As shown in the flow
chart algorithm of Fig. 4, the serial port is continuously
probed for information and depending on the user; this
process can be activated or deactivated at any given time.
Start
Look for serial port
Serial port found?
Display Interface
Try again?
Check serial port for
information
Serial port available & has information?
Display information in
Interface
End?
End
Yes
Yes
Yes
Yes
No
No
No No
Fig. 4. Flow chart algorithm for systems monitoring
6. Results and Discussions
Software development generally involves development
of a solution that can be used by users to perform a
predefined set of task (also known as the functional
requirements). Some of the functional requirements of the
product developed include:
Ability to perform basic PV system sizing/design
for a large load database using the worst month
method.
Ability to interface with a hardware monitoring
circuit and display the readings on the user
interface.
Ability of the software to save records (in form of
files) for users who use the software. Users have the
ability to create a design file and edit it over time.
Ability to perform simulation of solar-PV systems.
The software design was done over a period of about
three months which included development of the user
interface as well as the database to handle data storage. A
substantial amount of this time went into debugging the
software and ensuring that all the functionalities were
properly implemented. To this end, all the requirements were
implemented as expected.
The SolarHelper software designed in this work is
integrated with an existing solar-PV system. The test results
were successful as expected. At this point the solar-PV panel
voltage was measured and variations were noted as weather
conditions changed. Monitoring interfaces and simulation
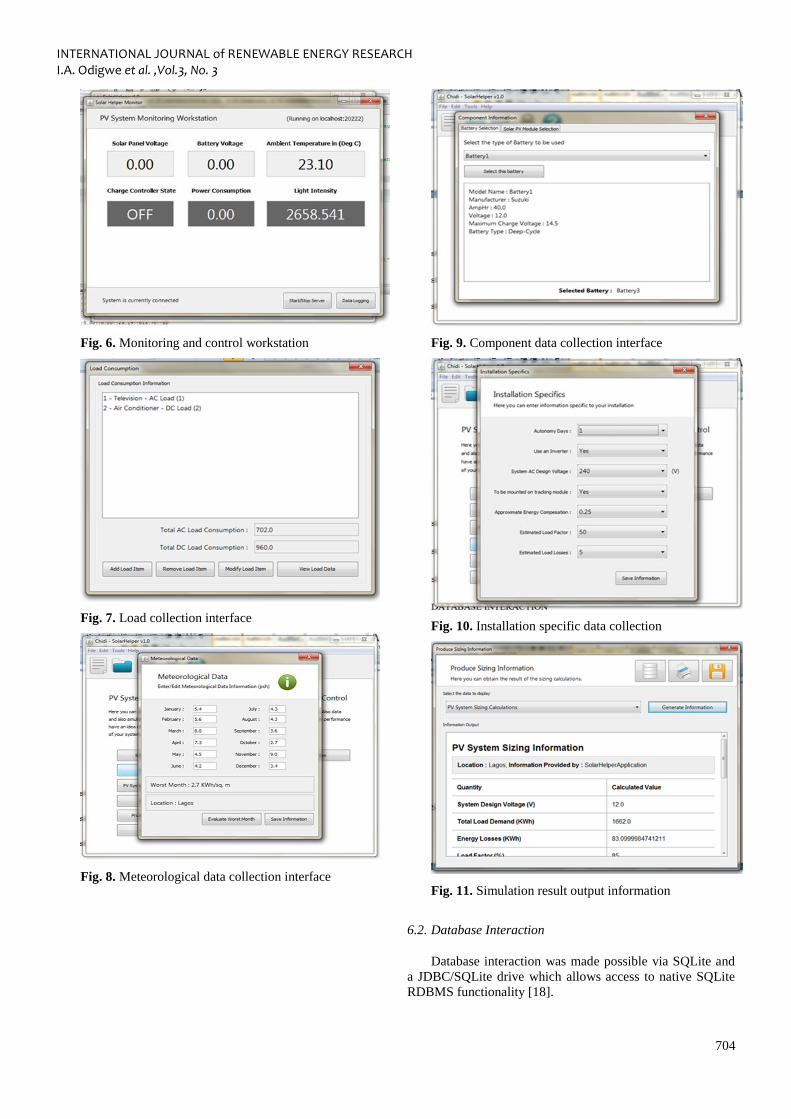
test results are shown in the figures 5-12.
6.1. User Interface
The user interface introduces a platform for the users of
the SolarHelper software for input and output of data. All the
functions proposed were included in the user interface and
were programmed accordingly.
Fig. 5. Home screen of the SolarHelper software
INTERNATIONAL JOURNAL of RENEWABLE ENERGY RESEARCH I.A. Odigwe et al. ,Vol.3, No. 3
704
Fig. 6. Monitoring and control workstation
Fig. 7. Load collection interface
Fig. 8. Meteorological data collection interface
Fig. 9. Component data collection interface
Fig. 10. Installation specific data collection
Fig. 11. Simulation result output information
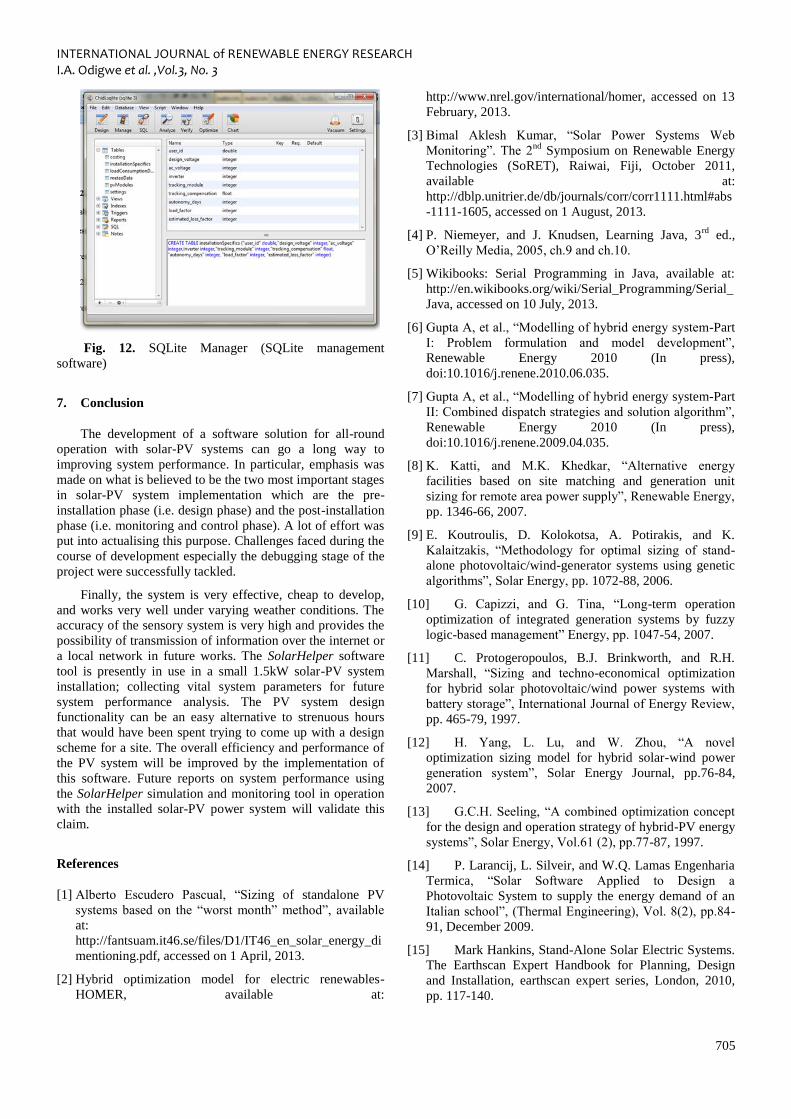
6.2. Database Interaction
Database interaction was made possible via SQLite and
a JDBC/SQLite drive which allows access to native SQLite
RDBMS functionality [18].
INTERNATIONAL JOURNAL of RENEWABLE ENERGY RESEARCH I.A. Odigwe et al. ,Vol.3, No. 3
705
Fig. 12. SQLite Manager (SQLite management
software)
7. Conclusion
The development of a software solution for all-round
operation with solar-PV systems can go a long way to
improving system performance. In particular, emphasis was
made on what is believed to be the two most important stages
in solar-PV system implementation which are the pre-
installation phase (i.e. design phase) and the post-installation
phase (i.e. monitoring and control phase). A lot of effort was
put into actualising this purpose. Challenges faced during the
course of development especially the debugging stage of the
project were successfully tackled.
Finally, the system is very effective, cheap to develop,
and works very well under varying weather conditions. The
accuracy of the sensory system is very high and provides the
possibility of transmission of information over the internet or
a local network in future works. The SolarHelper software
tool is presently in use in a small 1.5kW solar-PV system
installation; collecting vital system parameters for future
system performance analysis. The PV system design
functionality can be an easy alternative to strenuous hours
that would have been spent trying to come up with a design
scheme for a site. The overall efficiency and performance of
the PV system will be improved by the implementation of
this software. Future reports on system performance using
the SolarHelper simulation and monitoring tool in operation
with the installed solar-PV power system will validate this
claim.
References
[1] Alberto Escudero Pascual, “Sizing of standalone PV
systems based on the “worst month” method”, available
at:
http://fantsuam.it46.se/files/D1/IT46_en_solar_energy_di
mentioning.pdf, accessed on 1 April, 2013.
[2] Hybrid optimization model for electric renewables-
HOMER, available at:
http://www.nrel.gov/international/homer, accessed on 13
February, 2013.
[3] Bimal Aklesh Kumar, “Solar Power Systems Web
Monitoring”. The 2nd
Symposium on Renewable Energy
Technologies (SoRET), Raiwai, Fiji, October 2011,
available at:
http://dblp.unitrier.de/db/journals/corr/corr1111.html#abs
-1111-1605, accessed on 1 August, 2013.
[4] P. Niemeyer, and J. Knudsen, Learning Java, 3rd
ed.,
O’Reilly Media, 2005, ch.9 and ch.10.
[5] Wikibooks: Serial Programming in Java, available at:
http://en.wikibooks.org/wiki/Serial_Programming/Serial_
Java, accessed on 10 July, 2013.
[6] Gupta A, et al., “Modelling of hybrid energy system-Part
I: Problem formulation and model development”,
Renewable Energy 2010 (In press),
doi:10.1016/j.renene.2010.06.035.
[7] Gupta A, et al., “Modelling of hybrid energy system-Part
II: Combined dispatch strategies and solution algorithm”,
Renewable Energy 2010 (In press),
doi:10.1016/j.renene.2009.04.035.
[8] K. Katti, and M.K. Khedkar, “Alternative energy
facilities based on site matching and generation unit
sizing for remote area power supply”, Renewable Energy,
pp. 1346-66, 2007.
[9] E. Koutroulis, D. Kolokotsa, A. Potirakis, and K.
Kalaitzakis, “Methodology for optimal sizing of stand-
alone photovoltaic/wind-generator systems using genetic
algorithms”, Solar Energy, pp. 1072-88, 2006.
[10] G. Capizzi, and G. Tina, “Long-term operation
optimization of integrated generation systems by fuzzy
logic-based management” Energy, pp. 1047-54, 2007.
[11] C. Protogeropoulos, B.J. Brinkworth, and R.H.
Marshall, “Sizing and techno-economical optimization
for hybrid solar photovoltaic/wind power systems with
battery storage”, International Journal of Energy Review,
pp. 465-79, 1997.
[12] H. Yang, L. Lu, and W. Zhou, “A novel
optimization sizing model for hybrid solar-wind power
generation system”, Solar Energy Journal, pp.76-84,
2007.
[13] G.C.H. Seeling, “A combined optimization concept
for the design and operation strategy of hybrid-PV energy
systems”, Solar Energy, Vol.61 (2), pp.77-87, 1997.
[14] P. Larancij, L. Silveir, and W.Q. Lamas Engenharia
Termica, “Solar Software Applied to Design a
Photovoltaic System to supply the energy demand of an
Italian school”, (Thermal Engineering), Vol. 8(2), pp.84-
91, December 2009.
[15] Mark Hankins, Stand-Alone Solar Electric Systems.
The Earthscan Expert Handbook for Planning, Design
and Installation, earthscan expert series, London, 2010,
pp. 117-140.

INTERNATIONAL JOURNAL of RENEWABLE ENERGY RESEARCH I.A. Odigwe et al. ,Vol.3, No. 3
706
[16] Photovoltaic Design Assistance Center, Stand-
Alone Photovoltaic System. A Handbook of
Recommended design practices, Sandia National
Laboratories, March 1995, pp. 7-40.
[17] Massimo Banzi, Getting started with Arduino, 2nd
ed., O’Reilly Media, 2010, ch. 5.
[18] Michael Owens, The Definitive Guide SQLite, New
York: Springer-Verlag, 2006, pp. 171-423.
Copyright © 2022 FDOKUMEN