
Development of a job-exposure matrix for exposure to total and fine particulate matter in the...
11
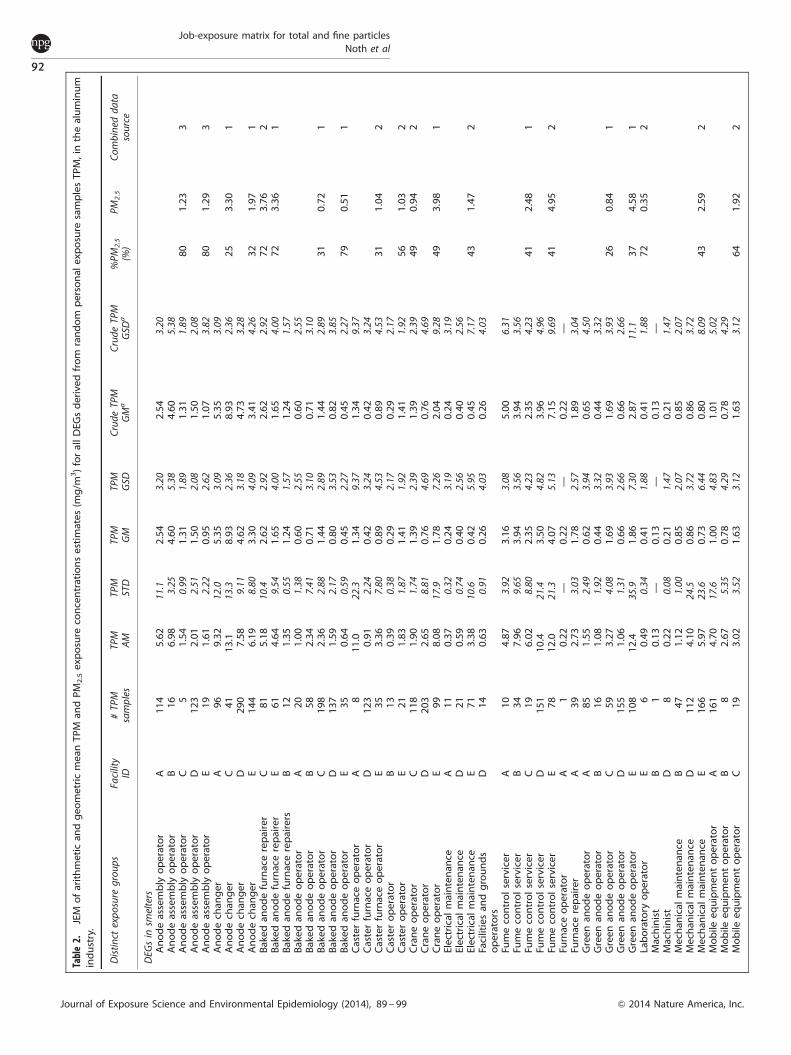
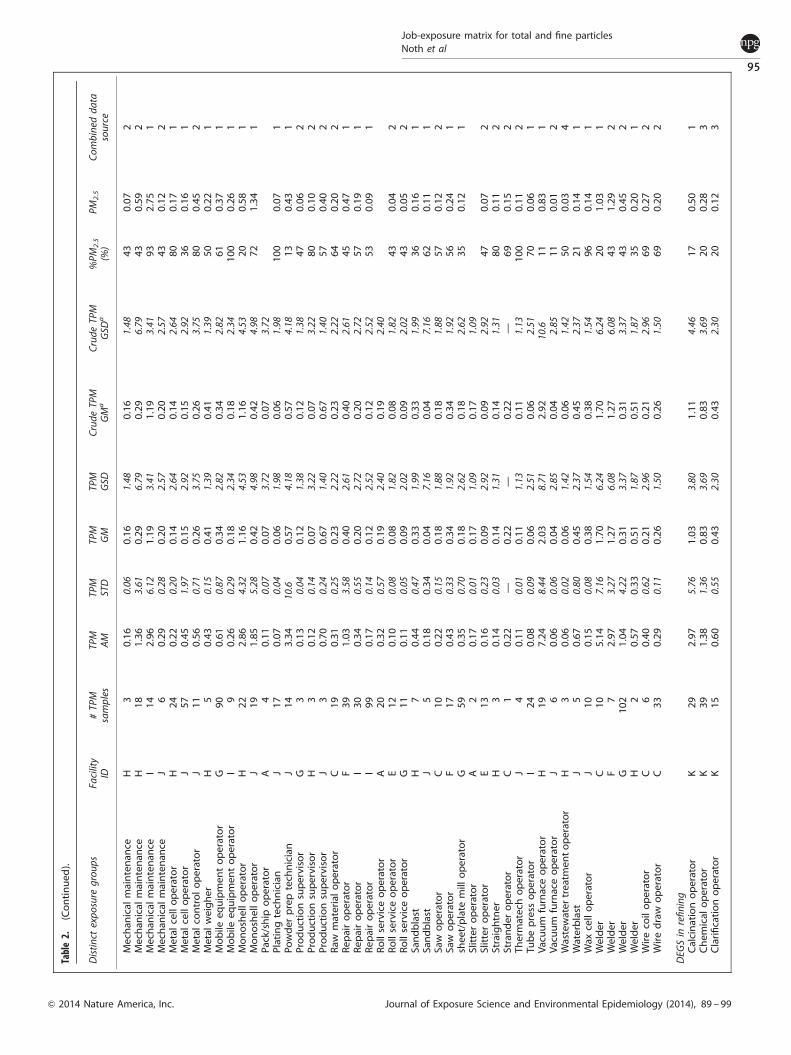
ORIGINAL ARTICLE Development of a job-exposure matrix for exposure to total and fine particulate matter in the aluminum industry Elizabeth M. Noth 1 , Christine Dixon-Ernst 2 , Sa Liu 1 , Linda Cantley 3 , Baylah Tessier-Sherman 3 , Ellen A. Eisen 1 , Mark R. Cullen 4 and S. Katharine Hammond 1 Increasing evidence indicates that exposure to particulate matter (PM) at environmental concentrations increases the risk of cardiovascular disease, particularly PM with an aerodynamic diameter of less than 2.5 mm (PM 2.5 ). Despite this, the health impacts of higher occupational exposures to PM 2.5 have rarely been evaluated. In part, this research gap derives from the absence of information on PM 2.5 exposures in the workplace. To address this gap, we have developed a job-exposure matrix (JEM) to estimate exposure to two size fractions of PM in the aluminum industry. Measurements of total PM (TPM) and PM 2.5 were used to develop exposure metrics for an epidemiologic study. TPM exposures for distinct exposure groups (DEGs) in the JEM were calculated using 8385 personal TPM samples collected at 11 facilities (1980–2011). For eight of these facilities, simultaneous PM 2.5 and TPM personal monitoring was conducted from 2010 to 2011 to determine the percent of TPM that is composed of PM 2.5 (%PM 2.5 ) in each DEG. The mean TPM from the JEM was then multiplied by %PM 2.5 to calculate PM 2.5 exposure concentrations in each DEG. Exposures in the smelters were substantially higher than in fabrication units; mean TPM concentrations in smelters and fabrication facilities were 3.86 and 0.76 mg/m 3 , and the corresponding mean PM 2.5 concentrations were 2.03 and 0.40 mg/m 3 . Observed occupational exposures in this study generally exceeded environmental PM 2.5 concentrations by an order of magnitude. Journal of Exposure Science and Environmental Epidemiology (2014) 24, 89–99; doi:10.1038/jes.2013.53; published online 11 September 2013 Keywords: particulate matter; exposure modeling; inhalation exposure; personal exposure INTRODUCTION This paper describes the development of a job-exposure matrix (JEM) created to quantify personal exposures to two size fractions of particulate matter (PM)—total PM (TPM) and PM with an aerodynamic diameter of less than 2.5 mm (PM 2.5 )—in the aluminum industry. Ultimately, the JEM provides the basis of an exposure assessment linked to an epidemiologic study of possible work-related health effects. To date, control of occupational exposure to particles has focused on the composition and specific toxicity of the constituents rather than the mass concentration or particle size. Occupational exposure limits (OELs) for ‘particulates not otherwise regulated,’ or PNORs, are orders of magnitude greater than daily environmental limits, which have evolved from total suspended particles (150 mg/m 3 , United States Environmental Protection Agency (USEPA), 1971) to PM 10 (65 mg/m 3 , USEPA 1987) to PM 2.5 (USEPA daily maximum 65 mg/m 3 in 1997 lowered to 35 mg/m 3 in 2006). By contrast, the Occupational Safety and Health Administration (OSHA) Permissible Exposure Limit for PNORs is 15,000 mg/m 3 . Increasing evidence indicates that exposure to particles at environmental concentrations increases the risk of cardiovascular disease. 1–11 The health impact of higher occupational exposures to PM, however, has rarely been evaluated. To address this research gap, an epidemiological study was undertaken to assess the health effects of exposure to airborne PM for workers at an aluminum manufacturing company. At each step of the modern aluminum manufacturing process, there is occupational exposure to airborne PM. 12 In mining the bauxite ore, workers are exposed to particles from bauxite dust and to a lesser extent crystalline silica dust. During refining, the PM exposures are primarily from inorganic dusts (bauxite, crystalline silica, alumina). Smelter workers are exposed to PM from many sources, including PM generated during the reduction of alumina to aluminum metal in the Hall-Heroult process. Although this reduction process takes place in carbon-lined steel pots that are hooded to decrease exposures to the mixture of dusts, metals, and fumes produced during smelting, these potroom exposures are among the highest PM exposures associated with aluminum manufacturing as employees work directly over the pots when replacing anodes. Following smelting, aluminum metal is fabricated into numerous diverse products, from aluminum used in can sheet to airplane parts, and workers may be exposed to metalworking fluids, lubricating oils, and metal particles. These work processes are generally conducted at separate facilities, although smelting and fabrication sometimes take place in the same location. Research on PM exposures to workers throughout many stages of aluminum production is scant. Most field measurements reported in the literature have been taken in smelter potrooms and focused on exposures to PM constituents (e.g., fluorides, coal tar pitch volatiles) or metal exposures during welding or silica exposures. 12–21 Within the limited literature on PM exposures across the aluminum industry, there is very little information about the particle size distributions. What does exist is focused either on particle morphology or particle aging in smelters. 22,23 Although respirable particulate, inhalable particulate, and total particulate concentrations have been reported, these have focused on a few 1 Division of Environmental Health Sciences, School of Public Health, University of California, Berkeley, CA, USA; 2 Alcoa, Pittsburgh, PA, USA; 3 Yale University School of Medicine, New Haven, CT, USA and 4 Department of Internal Medicine, Stanford University, Stanford, CA, USA. Correspondence to: Dr. Elizabeth M. Noth, Division of Environmental Health Sciences, School of Public Health, University of California, Berkeley, 50 University Hall, #7360, Berkeley, CA 94720-7360, USA. Tel.: +1 510 915 4907. Fax: +1 510 642 0000. E-mail: [email protected] Received 26 September 2012; revised 6 June 2013; accepted 18 June 2013; published online 11 September 2013 Journal of Exposure Science and Environmental Epidemiology (2014) 24, 89–99 & 2014 Nature America, Inc. All rights reserved 1559-0631/14 www.nature.com/jes
Transcript of Development of a job-exposure matrix for exposure to total and fine particulate matter in the...

ORIGINAL ARTICLE
Development of a job-exposure matrix for exposure to total andfine particulate matter in the aluminum industryElizabeth M. Noth1, Christine Dixon-Ernst2, Sa Liu1, Linda Cantley3, Baylah Tessier-Sherman3, Ellen A. Eisen1, Mark R. Cullen4 andS. Katharine Hammond1
Increasing evidence indicates that exposure to particulate matter (PM) at environmental concentrations increases the risk ofcardiovascular disease, particularly PM with an aerodynamic diameter of less than 2.5 mm (PM2.5). Despite this, the health impacts ofhigher occupational exposures to PM2.5 have rarely been evaluated. In part, this research gap derives from the absence ofinformation on PM2.5 exposures in the workplace. To address this gap, we have developed a job-exposure matrix (JEM) to estimateexposure to two size fractions of PM in the aluminum industry. Measurements of total PM (TPM) and PM2.5 were used to developexposure metrics for an epidemiologic study. TPM exposures for distinct exposure groups (DEGs) in the JEM were calculated using8385 personal TPM samples collected at 11 facilities (1980–2011). For eight of these facilities, simultaneous PM2.5 and TPM personalmonitoring was conducted from 2010 to 2011 to determine the percent of TPM that is composed of PM2.5 (%PM2.5) in each DEG.The mean TPM from the JEM was then multiplied by %PM2.5 to calculate PM2.5 exposure concentrations in each DEG. Exposures inthe smelters were substantially higher than in fabrication units; mean TPM concentrations in smelters and fabrication facilities were3.86 and 0.76 mg/m3, and the corresponding mean PM2.5 concentrations were 2.03 and 0.40 mg/m3. Observed occupationalexposures in this study generally exceeded environmental PM2.5 concentrations by an order of magnitude.
Journal of Exposure Science and Environmental Epidemiology (2014) 24, 89–99; doi:10.1038/jes.2013.53; published online 11 September 2013
Keywords: particulate matter; exposure modeling; inhalation exposure; personal exposure
INTRODUCTIONThis paper describes the development of a job-exposure matrix(JEM) created to quantify personal exposures to two size fractionsof particulate matter (PM)—total PM (TPM) and PM with anaerodynamic diameter of less than 2.5 mm (PM2.5)—in thealuminum industry. Ultimately, the JEM provides the basis of anexposure assessment linked to an epidemiologic study of possiblework-related health effects. To date, control of occupationalexposure to particles has focused on the composition and specifictoxicity of the constituents rather than the mass concentration orparticle size. Occupational exposure limits (OELs) for ‘particulatesnot otherwise regulated,’ or PNORs, are orders of magnitudegreater than daily environmental limits, which have evolved fromtotal suspended particles (150 mg/m3, United States EnvironmentalProtection Agency (USEPA), 1971) to PM10 (65 mg/m3, USEPA 1987)to PM2.5 (USEPA daily maximum 65 mg/m3 in 1997 lowered to35mg/m3 in 2006). By contrast, the Occupational Safety andHealth Administration (OSHA) Permissible Exposure Limit forPNORs is 15,000 mg/m3. Increasing evidence indicates thatexposure to particles at environmental concentrations increasesthe risk of cardiovascular disease.1–11 The health impact ofhigher occupational exposures to PM, however, has rarely beenevaluated. To address this research gap, an epidemiological studywas undertaken to assess the health effects of exposure toairborne PM for workers at an aluminum manufacturing company.
At each step of the modern aluminum manufacturing process,there is occupational exposure to airborne PM.12 In mining thebauxite ore, workers are exposed to particles from bauxite dust
and to a lesser extent crystalline silica dust. During refining, thePM exposures are primarily from inorganic dusts (bauxite,crystalline silica, alumina). Smelter workers are exposed to PMfrom many sources, including PM generated during the reductionof alumina to aluminum metal in the Hall-Heroult process.Although this reduction process takes place in carbon-lined steelpots that are hooded to decrease exposures to the mixture ofdusts, metals, and fumes produced during smelting, thesepotroom exposures are among the highest PM exposuresassociated with aluminum manufacturing as employees workdirectly over the pots when replacing anodes. Following smelting,aluminum metal is fabricated into numerous diverse products,from aluminum used in can sheet to airplane parts, and workersmay be exposed to metalworking fluids, lubricating oils, and metalparticles. These work processes are generally conducted atseparate facilities, although smelting and fabrication sometimestake place in the same location. Research on PM exposures toworkers throughout many stages of aluminum production is scant.Most field measurements reported in the literature have beentaken in smelter potrooms and focused on exposures to PMconstituents (e.g., fluorides, coal tar pitch volatiles) or metalexposures during welding or silica exposures.12–21
Within the limited literature on PM exposures across thealuminum industry, there is very little information about theparticle size distributions. What does exist is focused either onparticle morphology or particle aging in smelters.22,23 Althoughrespirable particulate, inhalable particulate, and total particulateconcentrations have been reported, these have focused on a few
1Division of Environmental Health Sciences, School of Public Health, University of California, Berkeley, CA, USA; 2Alcoa, Pittsburgh, PA, USA; 3Yale University School of Medicine,New Haven, CT, USA and 4Department of Internal Medicine, Stanford University, Stanford, CA, USA. Correspondence to: Dr. Elizabeth M. Noth, Division of Environmental HealthSciences, School of Public Health, University of California, Berkeley, 50 University Hall, #7360, Berkeley, CA 94720-7360, USA.Tel.: +1 510 915 4907. Fax: +1 510 642 0000.E-mail: [email protected] 26 September 2012; revised 6 June 2013; accepted 18 June 2013; published online 11 September 2013
Journal of Exposure Science and Environmental Epidemiology (2014) 24, 89–99& 2014 Nature America, Inc. All rights reserved 1559-0631/14
www.nature.com/jes

potroom jobs.14,16 There have been no studies that presentexposures of different particle sizes across multiple stages of thealuminum industry, nor with sufficient samples to construct a JEMfor epidemiology studies.
The research we present in this paper fills both gaps. Wemeasured concurrent personal PM2.5 and TPM exposure inaluminium workers and integrated these data with a largecompany database of IH measurements. Using an expert-basedapproach, we have developed a JEM with exposures for two sizesof PM—total PM (TPM) and PM2.5—at facilities performingmanufacturing operations as various as refining, smelting, andfabricating metal products.
METHODSThe exposure assessment focused on PM exposure in 11 manufacturingfacilities of a single aluminum manufacturing company in the UnitedStates (Table 1). Facilities were selected to encompass differentmanufacturing work processes throughout the company, from refiningthrough fabrication. Of these 11 facilities, 1 is a refinery, 5 have smelters (alluse the prebake technology), and 9 have fabrication units engaged invarious processes, including rolling, extrusion, forging, and casting as wellas lighter metalworking. Three facilities include both smelters andfabrication. Details of aluminum refining, smelting, and fabrication havebeen described elsewhere.12
Within the company, industrial hygiene data have been collected for 60years. Sampling conducted over the past 25 years has been compiled inan extensive industrial hygiene database, HYGenius (4300,000 samples).Samples were collected in each facility under the direction of certifiedindustrial hygienists and analyzed at an AIHA accredited IH laboratory(Clark Laboratories LLC, Jefferson Hills, PA, USA). Samples were collectedunder one of the following three strategies: random, diagnostic, or worstcase (as defined by the company). Random samples were meant to captureday-to-day regular work within the targeted job. Diagnostic and worst casesamples were collected to answer specific questions about job exposuresor to monitor exposures during specific tasks. The random samples formthe basis for the JEM. However, sampling was generally targeted only forthose jobs where 5% or more of the exposures were greater than 30% ofthe company’s OEL, of 10 mg/m3 throughout the company for the durationof sampling presented, as judged at each facility under the direction of thefacility IH. In general, sampling was not performed for jobs where, afterinspection by the facility IH, neither TPM nor any of the specific chemicalexposures (e.g., fluoride, oil mist, metals) was over 30% of the OEL, asjudged by the facility IH unless the toxicity of the agent of interestwarranted sampling at lower exposure levels.
The HYGenius database contains detailed information including agent,purpose of sampling, duration of sampling, location of sampling (facility,department, job, task), whether personal or area sample, use and type ofpersonal protective equipment, and sample result. The database containsover 100 agents of interest. Information in the database concerningparticle mass concentration is limited to TPM and respirable particles (farfewer). Because each of the 11 facilities in the study was acquired by thecompany at different times, the dates of the earliest samples in HYGeniusvary across facilities (Table 1).
The JEM was developed in the following five steps: standardization ofjob titles into distinct exposure groups (DEGs); categorization of DEGs intomajor manufacturing process categories; calculation of TPM from exposurefrom data in HYGenius; simultaneous PM2.5 and TPM measurement on asubset of workers at eight facilities to determine the percent of TPM ineach DEG that is composed of PM2.5 (%PM2.5); and calculation of PM2.5
from the TPM and the percent PM2.5 in each DEG. Each of these steps isdescribed in more detail below.
Creation of DEGsAs is true in many workplaces, hundreds to thousands of job title/department combinations existed in HYGenius database for each facility,and these did not readily correspond to the job titles in the various humanresources databases that track job changes for all employees. In order toreconstruct the job-exposure history of each individual in the epidemio-logic study, jobs judged to have qualitatively and quantitatively similarexposures were aggregated into DEGs and mappings developed betweenthe human resources databases and HYGenius.
A senior industrial hygiene manager (CDE) at the corporation led theaggregation effort. She created a team of site managers, industrialhygienists, and health and safety experts and worked closely with anotherresearcher (LC). This team of experts began by defining the core workprocesses within the company. Within each core process and facility, theteam created DEGs that aggregated jobs by department, job title, and jobtasks based on similarity of the work performed. The DEGs were chosen bythe team to be facility-specific, rather than pooled across facilities, becausethe organization of the tasks within similar jobs and departments was notalways comparable at different facilities. The final step linked these DEGs toover 10,000 different human resources job titles contained in the humanresources database across locations.24
Categorization into Major Manufacturing Process CategoriesIn addition to the quantitative values for TPM and PM2.5, each DEG wasassigned one of four qualitative major manufacturing process categories:smelting; fabricating; refining; or mixed smelting/fabrication (for DEGs inwhich an employee might work in either or both smelting and fabricationor be exposed to either operation type, e.g., electrician).
Generation of TPM Exposure for JEMTPM sampling data from the HYGenius database was used to construct DEG-specific exposures for the JEM. Inclusion criteria for the TPM data were thatsamples had to be valid personal samples collected randomly (rather than aspart of a specific diagnostic evaluation or as targeted worst case) for at least70% of an employee’s shift. We used only the random samples because theyrepresent the day-to-day exposures of the workers, rather than specificevents that diagnostic or worst case samples are designed to capture. TPMsamples were collected using 37 mm filters in traditional closed-face filtercassettes and analyzed gravimetrically (NIOSH Method 0500). Standardquality assurance methods were followed including calibrating pump flowbefore and after sampling, checking the integrity of the tubing andsamplers, as well as following laboratory analysis protocols outlined inNIOSH 0500.25 Samples analyzed before the first issue of NIOSH 0500 wereanalyzed in accordance with the NIOSH recommendations in the NIOSHManual of Analytical Methods. The exposure metric in each cell was the
Table 1. The 11 facilities in the study that span the aluminum manufacturing industry in the United States from refining to fabrication.
Facility Total # ofDEGs
#Smelter
DEGs
#Fabrication
DEGs
# Smelter/fabrication DEGs
#Refinery
DEGs
Years of historical industrial hygieneexposure data used in TPM JEM
Sampled PM2.5 in2010–2011
A 33 20 8 5 0 1984–2011 —B 16 16 0 0 0 1999–2008 —C 38 21 11 6 0 1980–2011 YesD 22 22 0 0 0 1981–2008 —E 30 19 9 2 0 1991–2011 YesF 17 0 17 0 0 1986–2011 YesG 22 0 22 0 0 1988–2010 YesH 40 0 40 0 0 2002–2011 YesI 21 0 21 0 0 1985–2011 YesJ 36 0 36 0 0 2002–2011 YesK 19 0 0 0 19 1983–2010 Yes
Job-exposure matrix for total and fine particlesNoth et al
90
Journal of Exposure Science and Environmental Epidemiology (2014), 89 – 99 & 2014 Nature America, Inc.

arithmetic mean value of all the samples for each DEG. Because theexposure estimates are meant to capture annual average concentrations,arithmetic rather than geometric means are most appropriate for the JEM.26
However, there were 134 samples (approximately 1% of the total samplesused, affecting a total of 42 DEGs) with extremely high values, 450 mg/m3.We considered three options for handling these extreme values in the JEM:include them without adjustment, omit them, or adjust them by somefactor. In the Supplementary Table S1 we show the comparison of thesethree methods for the 42 DEGs. As these samples are valid measurements,we chose to adjust them by the respirator used during the sample collectionas reported by the IH. Using the style and type of respirator, we applied theOSHA respirator protection factor27 as an adjustment. The OSHA respiratorprotection factor varies from 10 to 10,000, depending on the type of therespirator. Another way to include all values without the high measurementsoverly influencing the average exposure is to use the geometric mean of allof the samples; the geometric mean of the unadjusted samples are includedas part of the JEM as an alternative exposure metric.
If TPM samples were not available for a particular DEG, TPM samplesfrom a similar DEG at the same or comparable facility were used. Ifinformation at the same or a comparable facility did not exist for aparticular DEG, a default concentration of 0.10 mg/m3 was applied to theDEG cell of the JEM. We selected 0.10 mg/m3 as our default concentrationbecause it is higher than average environmental concentrations, in thelowest 5% of the TPM samples in our JEM, and is a simple number with onesignificant figure.
In order to preserve the information about the source of the data, eachDEG-TPM cell in the JEM was assigned a ranking reflecting confidence inthe source. The three categories of data sources for TPM were: measureddata; surrogate measurements from a comparable DEG; default value whenno other data were available. This information on data sources can be usedin sensitivity analyses to examine the impact of potential exposuremisclassification in an epidemiologic study and to guide future sampling.
Measurement of PM2.5 and %PM2.5
Personal sampling for PM2.5 and TPM was conducted in 2010 and 2011 at 8of the 11 facilities (Table 1); 3 facilities were not selected for sampling dueto partial curtailment of operations at the facility or closure at the time ofthe monitoring campaign. This exposure monitoring campaign wasdesigned both to measure personal exposures to PM2.5 and to derivethe percent of TPM that is PM2.5 across jobs at these facilities. Two types ofPM samplers were used to evaluate PM2.5 exposures: the traditional closed-face 37 mm cassettes (TPM) operated at 2 l/min and SKC Personal ModularImpactors (PMIs) operated at 3 l/min with 3 stages: 410 mm, 2.5—10mm,and o2.5mm (PM2.5). These samplers were paired and worn simulta-neously by each worker. Analysis of PMI filters was by NIOSH 0500, with thesame procedures and quality controls listed above.
The percent of PM2.5 in the TPM samples was calculated for each sampleby dividing the concentration of PM2.5 (from the PMI) by the concentrationof paired TPM sample (cassette) in order to use the historical TPM cassettevalues to calculate the historical PM2.5 exposures in each DEG. Thepercentages within each DEG were averaged to generate the %PM2.5 forthe JEM. For DEGs in which the percent of the total particles that arecomposed of fine particles (% PM2.5) was not measured, we used data fromsimilar jobs at other facilities or jobs judged to have similar size distribution(measurements from comparable jobs). If no such comparable measure-ments were available, we estimated the %PM2.5 from an understanding ofprocesses and associated particle size distribution; thus, some processes(e.g., welding, combustion) emit predominantly fine particles, whereasother processes (e.g., grinding) emit larger particles. Knowledge of thepredominant source of particles in each job informed estimations of the %PM2.5 particles in TPM for the remaining DEGs: those in which the sourceswere predominantly fine particles were assigned 80% PM2.5, those in whichthe sources emit predominantly larger particles were assigned 20% PM2.5
and those with mixed sources, or unknown size distributions wereassigned 50% PM2.5. In summary, the three methods used to assign%PM2.5: direct measurements in the DEG, measurements in comparablejobs, and estimations based on expert judgment. We did not estimateexposure at the three facilities that had no PM2.5 sampling.
Generation of PM2.5 Exposure Concentrations for JEMThe average TPM concentration for each DEG was multiplied by thecorresponding %PM2.5 to generate the PM2.5 concentration for the JEM. Inorder to preserve the information about the source of the data, rankedsource codes were generated for PM2.5 values; these combined the
rankings for the underlying TPM and %PM2.5 data. For the calculated PM2.5
concentration, we defined five ranks, with the highest (rank 1) defined asboth TPM and %PM2.5 derived from sample measurements (TPM fromHYGenius and %PM2.5 from 2010 to 2011 sampling campaign) in the givenDEG, and the lowest (rank 5) where TPM was default value (regardless of%PM2.5 data source).
Influence of Facility and DEG in PM Exposure in Smelters andFabrication FacilitiesTo evaluate any increase in precision of the exposure estimates achievedby using facility-specific exposure groups, that is, DEGs, rather thanexposure groups pooled across facilities, we systematically examined thesources of variability in the TPM measurement samples. To this end, welooked at the percent of total variance in TPM explained by facility andexposure group in a series of linear regression models. In models basedon the measurement samples included in the development of the TPMexposure concentration estimate in the JEM, facility, and exposure groupwere modeled as fixed effects. The coefficients of determination (r2) ofmodels with each fixed effect alone were compared with that of a modelwith both fixed effects, and then to the full model with both fixed effectsplus their interaction. The series of models were stratified by the two mainmanufacturing process categories—smelter and fabrication.
RESULTSDEG Creation and Categorization into Major ManufacturingProcessesIn the 11 facilities in this study, there were 2780 unique job titlesby department and facility in the industrial hygiene database andover 10,000 human resources job titles. These were reduced to294 DEGs. Of the 294 DEGs, 33% were assigned to smelting, 56%were assigned to fabricating, 7% to refining, and 4% to the mixedcategory of manufacturing processes (Table 1).
Generation of TPM Exposure for JEMA total of 8385 TPM personal samples were used to calculate TPMexposures for the DEGs. This represents 82% of personal TPMsamples collected in DEGs of interest, excluding either specificdiagnostic samples (15%) or worst case samples (3%). The TPMexposure estimates for most (210) of the 294 DEGs in the JEMwere calculated directly from TPM sample measurements, 55 werecalculated from comparable DEGs, and 29 DEGs were given thedefault value (Table 2). Samples were collected from 1983 to 2011,with 50% collected from 2000 to 2011, 38% from 1990 to 1999,and 12% from 1983 to 1989. Approximately half of the TPMsamples were collected in smelters (57%) and a third (36%) infabrication units. Overall, TPM concentrations in smelterswere higher than in fabrication units, with arithmetic means of3.86 mg/m3 (SD: 4.43 mg/m3) and 0.76 mg/m3 (SD: 1.25 mg/m3),respectively (Figure 1); and geometric means of 1.63 mg/m3
(GSD: 4.84) and 0.35 mg/m3 (GSD: 3.22), respectively.
Measurement of PM2.5 and %PM2.5
The PM2.5 personal sampling survey in 2010 and 2011 wasconducted in eight facilities; jobs in two facilities were resampledin a second season. There were 101 paired samples collected insmelter DEGs, 267 collected in fabrication DEGs, and 9 collected inrefinery DEGs. The arithmetic mean PM2.5 concentration for all 377paired PM2.5 and TPM personal samples was 0.50 mg/m3 (standarddeviation: 0.92 mg/m3) and the geometric mean was 0.18 mg/m3
(geometric standard deviation: 4.27). The fabrication facilities hadlower arithmetic mean PM2.5 concentrations than smelter orrefinery facilities (0.21, 1.19, and 1.24 mg/m3, respectively) andgeometric means (0.10, 0.73, and 0.54 mg/m3, respectively;Figure 1). The percent of TPM that is PM2.5 (%PM2.5) was highlyvariable among the DEGs and ranged from 1 to 100% for all 377paired samples; the interquartile range was 25–84%. Fabricationfacilities had higher mean %PM2.5 compared with either smelter or
Job-exposure matrix for total and fine particlesNoth et al
91
& 2014 Nature America, Inc. Journal of Exposure Science and Environmental Epidemiology (2014), 89 – 99
Tabl
e2.
JEM
ofarithmetic
andgeo
metricmeanTP
Man
dPM
2.5exposure
concentrationsestimates
(mg/m
3)forallDEG
sderived
from
random
personal
exposure
samplesTP
M,inthealuminum
industry.
Dis
tin
ctex
po
sure
gro
up
sFa
cilit
yID
#TP
Msa
mp
les
TPM
AM
TPM
STD
TPM
GM
TPM
GSD
Cru
de
TPM
GM
aC
rud
eTP
MG
SDa
%P
M2
.5
(%)
PM
2.5
Co
mb
ined
da
taso
urc
e
DEG
sin
smel
ters
Anodeassembly
operator
A11
45.62
11.1
2.54
3.20
2.54
3.20
Anodeassembly
operator
B16
6.98
3.25
4.60
5.38
4.60
5.38
Anodeassembly
operator
C5
1.54
0.99
1.31
1.89
1.31
1.89
801.23
3Anodeassembly
operator
D12
32.01
2.51
1.50
2.08
1.50
2.08
Anodeassembly
operator
E19
1.61
2.22
0.95
2.62
1.07
3.82
801.29
3Anodech
anger
A96
9.32
12.0
5.35
3.09
5.35
3.09
Anodech
anger
C41
13.1
13.3
8.93
2.36
8.93
2.36
253.30
1Anodech
anger
D29
07.58
9.11
4.62
3.18
4.73
3.28
Anodech
anger
E14
46.19
8.80
3.30
4.09
3.41
4.26
321.97
1Baked
anodefurnacerepairer
C81
5.18
10.4
2.62
2.92
2.62
2.92
723.76
2Baked
anodefurnacerepairer
E61
4.64
9.54
1.65
4.00
1.65
4.00
723.36
1Baked
anodefurnacerepairers
B12
1.35
0.55
1.24
1.57
1.24
1.57
Baked
anodeoperator
A20
1.00
1.38
0.60
2.55
0.60
2.55
Baked
anodeoperator
B58
2.34
7.41
0.71
3.10
0.71
3.10
Baked
anodeoperator
C19
82.36
2.88
1.44
2.89
1.44
2.89
310.72
1Baked
anodeoperator
D13
71.59
2.17
0.80
3.53
0.82
3.85
Baked
anodeoperator
E35
0.64
0.59
0.45
2.27
0.45
2.27
790.51
1Casterfurnaceoperator
A8
11.0
22.3
1.34
9.37
1.34
9.37
Casterfurnaceoperator
D12
30.91
2.24
0.42
3.24
0.42
3.24
Casterfurnaceoperator
E35
3.36
7.80
0.89
4.53
0.89
4.53
311.04
2Casteroperator
B13
0.39
0.38
0.29
2.17
0.29
2.17
Casteroperator
E21
1.83
1.87
1.41
1.92
1.41
1.92
561.03
2Craneoperator
C11
81.90
1.74
1.39
2.39
1.39
2.39
490.94
2Craneoperator
D20
32.65
8.81
0.76
4.69
0.76
4.69
Craneoperator
E99
8.08
17.9
1.78
7.26
2.04
9.28
493.98
1Electrical
maintenan
ceA
110.37
0.32
0.24
3.19
0.24
3.19
Electrical
maintenan
ceD
210.59
0.74
0.40
2.56
0.40
2.56
Electrical
maintenan
ceE
713.38
10.6
0.42
5.95
0.45
7.17
431.47
2Facilitiesan
dgrounds
operators
D14
0.63
0.91
0.26
4.03
0.26
4.03
Fumeco
ntrolservicer
A10
4.87
3.92
3.16
3.08
5.00
6.31
Fumeco
ntrolservicer
B34
7.96
9.65
3.94
3.56
3.94
3.56
Fumeco
ntrolservicer
C19
6.02
8.80
2.35
4.23
2.35
4.23
412.48
1Fu
meco
ntrolservicer
D15
110
.421
.43.50
4.82
3.96
4.96
Fumeco
ntrolservicer
E78
12.0
21.3
4.07
5.13
7.15
9.69
414.95
2Fu
rnaceoperator
A1
0.22
—0.22
—0.22
—Fu
rnacerepairer
A39
2.73
3.03
1.78
2.57
1.89
3.04
Green
anodeoperator
A85
1.55
2.49
0.62
3.94
0.65
4.50
Green
anodeoperator
B16
1.08
1.92
0.44
3.32
0.44
3.32
Green
anodeoperator
C59
3.27
4.08
1.69
3.93
1.69
3.93
260.84
1Green
anodeoperator
D15
51.06
1.31
0.66
2.66
0.66
2.66
Green
anodeoperator
E10
812
.435
.91.86
7.30
2.87
11.1
374.58
1Laboratory
operator
E6
0.49
0.34
0.41
1.88
0.41
1.88
720.35
2Machinist
B1
0.13
—0.13
—0.13
—Machinist
D8
0.22
0.08
0.21
1.47
0.21
1.47
Mechan
ical
maintenan
ceB
471.12
1.00
0.85
2.07
0.85
2.07
Mechan
ical
maintenan
ceD
112
4.10
24.5
0.86
3.72
0.86
3.72
Mechan
ical
maintenan
ceE
166
5.97
23.6
0.73
6.44
0.80
8.09
432.59
2Mobile
equipmen
toperator
A16
14.70
17.6
1.00
4.83
1.01
5.02
Mobile
equipmen
toperator
B8
2.67
5.35
0.78
4.29
0.78
4.29
Mobile
equipmen
toperator
C19
3.02
3.52
1.63
3.12
1.63
3.12
641.92
2
Job-exposure matrix for total and fine particlesNoth et al
92
Journal of Exposure Science and Environmental Epidemiology (2014), 89 – 99 & 2014 Nature America, Inc.

Tabl
e2.
(Continued
).
Dis
tin
ctex
po
sure
gro
up
sFa
cilit
yID
#TP
Msa
mp
les
TPM
AM
TPM
STD
TPM
GM
TPM
GSD
Cru
de
TPM
GM
aC
rud
eTP
MG
SDa
%P
M2
.5
(%)
PM
2.5
Co
mb
ined
da
taso
urc
e
Mobile
equipmen
toperator
D25
89.83
39.5
3.69
4.16
3.75
4.24
Mobile
equipmen
toperator
E91
9.31
33.4
1.64
5.16
1.82
6.55
565.23
1Po
tlinerepairer
A25
4.78
9.11
2.36
2.69
2.36
2.69
Potlinerepairer
B3
2.28
1.42
2.02
1.79
2.02
1.79
Potlinerepairer
C87
3.06
6.96
1.32
3.50
1.32
3.50
190.58
1Po
tlinerepairer
D10
34.23
17.7
1.33
3.19
13.6
3.51
Potlinerepairer
E77
13.6
67.0
2.68
5.05
2.91
5.75
476.42
1Po
troom
bakein
operator
A18
0.80
0.66
0.49
4.06
0.49
4.06
Potroom
bakein
operator
C41
1.34
1.05
0.99
2.41
0.99
2.41
500.67
4Po
troom
operator
A38
3.08
2.86
1.63
3.90
1.63
3.90
Potroom
operator
B54
6.94
5.47
4.81
2.70
4.81
2.70
Potroom
operator
C17
2.14
1.21
1.85
1.75
1.85
1.75
280.60
1Po
troom
operator
D26
44.92
6.82
2.72
3.02
2.72
3.02
Potroom
operator
E10
14.73
6.14
2.40
3.33
2.51
3.66
411.96
1Po
troom
serviceoperator
A49
15.0
52.6
2.37
4.78
2.37
4.78
Potroom
serviceoperator
C87
12.3
24.7
3.99
4.26
3.99
4.26
425.20
1Po
troom
serviceoperator
D18
1.35
0.71
1.18
1.74
1.18
1.74
Power
plantmaintenan
ceD
10.02
—0.02
—0.02
—Po
wer
plantoperator
C9
13.3
17.4
5.63
4.64
8.05
5.52
202.66
3Po
wer
plantoperator
D8
0.24
0.25
0.09
5.90
0.09
5.90
Productionsupervisor
A49
0.65
2.61
0.11
5.32
0.11
5.32
Productionsupervisor
D60
2.24
5.04
0.77
4.67
0.77
4.67
Raw
materialoperator
E19
4.73
8.64
1.25
5.83
1.41
7.37
643.01
2Reclamationfurnaceoperator
A95
11.9
58.0
1.29
5.17
1.40
6.44
Tapper
C29
4.63
9.52
2.44
2.59
2.44
2.59
381.75
1Tapper
E52
24.7
98.1
5.25
3.49
5.49
4.16
389.38
2Utilityservicer
A19
5.18
8.00
2.57
3.38
2.90
4.13
Utilityservicer
B22
6.60
4.72
4.99
2.27
5.54
2.78
Utilityservicer
C1
0.39
—0.39
—0.39
—50
0.20
4Utilityservicer
E7
0.22
0.12
0.20
1.66
0.20
1.66
500.11
4
DEG
sin
mix
edsm
elte
ra
nd
fab
rica
tio
nElectrical
maintenan
ceC
210.79
0.81
0.55
2.29
0.55
2.29
430.34
2Facilitiesan
dgroundsoperator
C1
1.07
—1.07
—1.07
—50
0.54
4Facilitiesan
dgrounds
operators
A4
0.31
0.13
0.28
1.84
0.28
1.84
Machinist
A27
0.82
1.19
0.32
4.32
0.32
4.32
Machinist
C6
0.33
0.19
0.28
1.91
0.28
1.91
430.14
2Machinist
E3
0.17
0.09
0.14
2.12
0.14
2.12
430.07
2Mechan
ical
maintenan
ceA
119
2.96
7.51
0.86
4.99
0.88
5.25
Mechan
ical
maintenan
ceC
554.13
6.44
1.64
4.32
1.64
4.32
431.79
2Po
wer
house
operator
A4
9.35
17.5
1.64
7.83
1.64
7.83
Railroad
enginee
rA
60.09
0.05
0.07
2.67
0.07
2.67
DEG
sin
fab
rica
tio
nAdministration
J1
0.20
—0.20
—0.20
—20
0.04
3Airmeltoperator
H19
0.72
0.76
0.44
2.83
0.44
2.83
300.22
2Allo
yco
ntroloperator
H20
0.43
0.40
0.35
1.79
0.35
1.79
300.13
1Axisgrinder
J55
0.76
1.71
0.36
3.11
0.36
3.11
690.52
1Casterfurnaceoperator
C47
1.07
1.06
0.79
2.19
0.79
2.19
310.33
2Casterfurnaceoperator
G22
0.96
1.22
0.70
2.04
0.70
2.04
220.21
1Casterfurnaceoperator
I15
3.82
9.12
1.03
4.60
1.03
4.60
542.07
1Casteroperator
H32
0.41
0.64
0.26
2.47
0.26
2.47
310.13
2
Job-exposure matrix for total and fine particlesNoth et al
93
& 2014 Nature America, Inc. Journal of Exposure Science and Environmental Epidemiology (2014), 89 – 99

Tabl
e2.
(Continued
).
Dis
tin
ctex
po
sure
gro
up
sFa
cilit
yID
#TP
Msa
mp
les
TPM
AM
TPM
STD
TPM
GM
TPM
GSD
Cru
de
TPM
GM
aC
rud
eTP
MG
SDa
%P
M2
.5
(%)
PM
2.5
Co
mb
ined
da
taso
urc
e
Casteroperator
I18
1.43
0.76
1.24
1.76
1.24
1.76
140.19
1Casteroperator
J19
0.22
0.18
0.16
2.78
0.16
2.78
310.07
2Chargeprep-operator
H3
0.36
0.06
0.36
1.17
0.36
1.17
640.23
2Chip
andtrim
operator
F52
2.98
5.32
0.74
7.01
0.74
7.01
551.63
2Coater
operator
E14
0.07
0.05
0.06
2.24
0.06
2.24
470.04
2Cold
mill
oilattendan
tG
10.07
—0.07
—0.07
—43
0.03
2Cold
mill
operator
A4
0.12
0.05
0.11
1.64
0.11
1.64
Cold
mill
operator
E43
0.15
0.11
0.12
1.88
0.12
1.88
470.07
2Cold
mill
operator
G26
0.29
0.62
0.17
2.37
0.17
2.37
470.14
1Craneoperator
A10
03.84
15.4
1.18
3.47
1.18
3.47
Craneoperator
F5
0.64
0.19
0.62
1.38
0.62
1.38
100
0.64
1Craneoperator
I9
0.19
0.23
0.11
3.33
0.11
3.33
940.18
1Crucible
man
ufacturing
operator
J3
0.28
0.07
0.28
1.26
0.28
1.26
500.14
3
Cutoff
H49
1.40
4.14
0.46
3.97
0.46
3.97
370.52
1Cutoff
J35
0.88
1.46
0.40
3.75
0.40
3.75
550.48
1CVD
furnaceoperator
J7
0.39
0.51
0.17
4.12
0.17
4.12
750.29
2Die
operator
C5
0.72
0.94
0.44
2.69
0.44
2.69
430.31
2Dip
operator
J9
0.14
0.12
0.09
3.44
0.09
3.44
500.07
4Draw
ben
choperator
I12
0.14
0.13
0.10
2.35
0.10
2.35
750.11
1Electrical
maintenan
ceF
230.39
0.30
0.30
2.23
0.30
2.23
430.17
2Electrical
maintenan
ceG
110.15
0.19
0.08
3.39
0.08
3.39
430.06
2Extrusionpress
operator
I39
0.21
0.20
0.16
2.28
0.16
2.28
750.16
1Facilitiesan
dgroundsoperator
G15
0.79
0.74
0.51
2.76
0.51
2.76
500.39
4Final
finishoperator
H13
0.34
0.46
0.17
3.48
0.17
3.48
480.16
1Fo
ilmill
operator
G27
0.27
0.70
0.13
2.77
0.13
2.77
470.13
2Fo
rgepress
operator
F24
20.40
0.45
0.29
2.23
0.29
2.23
550.22
1FP
Ioperator
H4
0.07
0.02
0.07
1.26
0.07
1.26
100
0.07
1FP
Ioperator
J3
0.11
0.01
0.48
1.02
0.48
1.02
300.03
1Fu
rnaceoperator
F34
0.32
0.28
0.25
1.97
0.25
1.97
910.29
1Fu
rnaceoperator
I34
0.28
0.23
0.19
2.60
0.19
2.60
670.19
1Fu
rnaceoperator
J48
0.22
0.36
0.13
2.67
0.13
2.67
910.20
2Fu
rnacerepairer
G23
6.92
10.7
2.60
4.24
2.60
4.24
725.02
2Han
dgrinding
J20
0.87
0.84
0.54
3.20
0.54
3.20
690.60
1Hotmill
furnaceoperator
E3
0.17
0.07
0.17
1.43
0.17
1.43
910.16
2Hotmill
oilattendan
tA
90.09
0.07
0.06
2.90
0.06
2.90
Hotmill
oilattendan
tE
40.11
0.04
0.10
1.39
0.10
1.39
690.07
2Hotmill
operator
A5
0.74
0.46
0.51
3.43
0.51
3.43
Hotmill
operator
E57
0.15
0.17
0.10
2.78
0.10
2.78
690.11
1Hotmill
operator
G13
0.36
0.27
0.28
2.12
0.28
2.12
690.25
2Injection
J9
0.16
0.05
0.15
1.47
0.15
1.47
100
0.16
1Inspectionoperator
F14
1.41
3.40
0.38
4.27
0.38
4.27
721.01
2Inspectionoperator
H10
0.15
0.06
0.13
1.84
0.13
1.84
550.08
1Inspectionoperator
I8
1.23
2.66
0.33
4.46
0.33
4.46
720.88
2Inspectionoperator
J10
0.16
0.12
0.42
1.18
0.42
1.18
880.14
1Inspection/pack/ship
operator
F5
1.67
2.38
0.70
4.32
0.70
4.32
641.06
2Laboratory
operator
G12
0.16
0.14
0.09
3.71
0.09
3.71
720.11
2Laboratory
operator
H1
0.11
—0.11
—0.11
—72
0.08
2Laboratory
operator
I1
0.28
—0.31
—0.31
—64
0.18
1Machinist
F14
0.56
0.62
0.41
2.05
0.41
2.05
430.24
2Machinist
F50
0.56
1.03
0.35
2.19
0.35
2.19
420.23
1Machinist
F38
1.27
3.16
0.37
4.55
0.37
4.55
520.66
1Machinist
G8
0.37
0.26
0.29
2.19
0.29
2.19
430.16
2
Job-exposure matrix for total and fine particlesNoth et al
94
Journal of Exposure Science and Environmental Epidemiology (2014), 89 – 99 & 2014 Nature America, Inc.
Tabl
e2.
(Continued
).
Dis
tin
ctex
po
sure
gro
up
sFa
cilit
yID
#TP
Msa
mp
les
TPM
AM
TPM
STD
TPM
GM
TPM
GSD
Cru
de
TPM
GM
aC
rud
eTP
MG
SDa
%P
M2
.5
(%)
PM
2.5
Co
mb
ined
da
taso
urc
e
Mechan
ical
maintenan
ceH
30.16
0.06
0.16
1.48
0.16
1.48
430.07
2Mechan
ical
maintenan
ceH
181.36
3.61
0.29
6.79
0.29
6.79
430.59
2Mechan
ical
maintenan
ceI
142.96
6.12
1.19
3.41
1.19
3.41
932.75
1Mechan
ical
maintenan
ceJ
60.29
0.28
0.20
2.57
0.20
2.57
430.12
2Metal
celloperator
H24
0.22
0.20
0.14
2.64
0.14
2.64
800.17
1Metal
celloperator
J57
0.45
1.97
0.15
2.92
0.15
2.92
360.16
1Metal
controloperator
J11
0.56
0.71
0.26
3.75
0.26
3.75
800.45
2Metal
weigher
H5
0.43
0.15
0.41
1.39
0.41
1.39
500.22
1Mobile
equipmen
toperator
G90
0.61
0.87
0.34
2.82
0.34
2.82
610.37
1Mobile
equipmen
toperator
I9
0.26
0.29
0.18
2.34
0.18
2.34
100
0.26
1Monoshelloperator
H22
2.86
4.32
1.16
4.53
1.16
4.53
200.58
1Monoshelloperator
J19
1.85
5.28
0.42
4.98
0.42
4.98
721.34
1Pa
ck/ship
operator
A4
0.11
0.07
0.07
3.72
0.07
3.72
Platingtech
nician
J17
0.07
0.04
0.06
1.98
0.06
1.98
100
0.07
1Po
wder
preptech
nician
J14
3.34
10.6
0.57
4.18
0.57
4.18
130.43
1Productionsupervisor
G3
0.13
0.04
0.12
1.38
0.12
1.38
470.06
2Productionsupervisor
H3
0.12
0.14
0.07
3.22
0.07
3.22
800.10
2Productionsupervisor
J3
0.70
0.24
0.67
1.40
0.67
1.40
570.40
2Raw
materialoperator
C19
0.31
0.25
0.23
2.22
0.23
2.22
640.20
2Rep
airoperator
F39
1.03
3.58
0.40
2.61
0.40
2.61
450.47
1Rep
airoperator
I30
0.34
0.55
0.20
2.72
0.20
2.72
570.19
1Rep
airoperator
I99
0.17
0.14
0.12
2.52
0.12
2.52
530.09
1Rollserviceoperator
A20
0.32
0.57
0.19
2.40
0.19
2.40
Rollserviceoperator
E12
0.10
0.08
0.08
1.82
0.08
1.82
430.04
2Rollserviceoperator
G11
0.11
0.05
0.09
2.02
0.09
2.02
430.05
2Sandblast
H7
0.44
0.47
0.33
1.99
0.33
1.99
360.16
1Sandblast
J5
0.18
0.34
0.04
7.16
0.04
7.16
620.11
1Saw
operator
C10
0.22
0.15
0.18
1.88
0.18
1.88
570.12
2Saw
operator
F17
0.43
0.33
0.34
1.92
0.34
1.92
560.24
1shee
t/plate
mill
operator
G59
0.35
0.70
0.18
2.62
0.18
2.62
350.12
1Slitteroperator
A2
0.17
0.01
0.17
1.09
0.17
1.09
Slitteroperator
E13
0.16
0.23
0.09
2.92
0.09
2.92
470.07
2Straightner
H3
0.14
0.03
0.14
1.31
0.14
1.31
800.11
2Strander
operator
C1
0.22
—0.22
—0.22
—69
0.15
2Th
ermatechoperator
J4
0.11
0.01
0.11
1.13
0.11
1.13
100
0.11
2Tu
bepress
operator
I24
0.08
0.09
0.06
2.51
0.06
2.51
700.06
1Vacuum
furnaceoperator
H19
7.24
8.44
2.03
8.71
2.92
10.6
110.83
1Vacuum
furnaceoperator
J6
0.06
0.06
0.04
2.85
0.04
2.85
110.01
2Wastewater
treatm
entoperator
H3
0.06
0.02
0.06
1.42
0.06
1.42
500.03
4Waterblast
J5
0.67
0.80
0.45
2.37
0.45
2.37
210.14
1Wax
celloperator
J10
0.15
0.08
0.38
1.54
0.38
1.54
960.14
1Welder
C10
5.14
7.16
1.70
6.24
1.70
6.24
201.03
1Welder
F7
2.97
3.27
1.27
6.08
1.27
6.08
431.29
2Welder
G10
21.04
4.22
0.31
3.37
0.31
3.37
430.45
2Welder
H2
0.57
0.33
0.51
1.87
0.51
1.87
350.20
1Wireco
iloperator
C6
0.40
0.62
0.21
2.96
0.21
2.96
690.27
2Wiredraw
operator
C33
0.29
0.11
0.26
1.50
0.26
1.50
690.20
2
DEG
Sin
refi
nin
gCalcinationoperator
K29
2.97
5.76
1.03
3.80
1.11
4.46
170.50
1Chem
ical
operator
K39
1.38
1.36
0.83
3.69
0.83
3.69
200.28
3Clarificationoperator
K15
0.60
0.55
0.43
2.30
0.43
2.30
200.12
3
Job-exposure matrix for total and fine particlesNoth et al
95
& 2014 Nature America, Inc. Journal of Exposure Science and Environmental Epidemiology (2014), 89 – 99

refinery facilities (59%, 38%, 25%, respectively; Figure 2). Therewas no significant seasonal difference in the observed PM2.5
concentrations or %PM2.5 when stratified by DEG.The %PM2.5 values for a third of the 223 DEGs at these eight
facilities were directly measured during the 2010–2011 samplingcampaign. An additional 48% of the DEGs were assigned valuesbased on comparable measurements within the same facility orcomparable facilities. Thus, the %PM2.5 values for 79% of the DEGsin the JEM were based on measurements, and 21% were based onmore qualitative assessment.
Generation of PM2.5 Exposure Concentrations for the JEMPM2.5 exposure concentrations for each of 223 DEGs at the eightfacilities were derived by multiplying the TPM mean of the DEG bythe corresponding %PM2.5 (Table 2). The TPM and PM2.5 exposures
Tabl
e2.
(Continued
).
Dis
tin
ctex
po
sure
gro
up
sFa
cilit
yID
#TP
Msa
mp
les
TPM
AM
TPM
STD
TPM
GM
TPM
GSD
Cru
de
TPM
GM
aC
rud
eTP
MG
SDa
%P
M2
.5
(%)
PM
2.5
Co
mb
ined
da
taso
urc
e
Digestionheater/cleaner
repairer
K11
0.46
0.15
0.43
1.51
0.43
1.51
210.10
2
Digestionoperator
K12
0.75
0.55
0.47
3.40
0.47
3.40
200.15
1Electrical
maintenan
ceK
160.43
0.39
0.27
2.93
0.27
2.93
430.18
2Machinist
K7
0.39
0.55
0.24
2.56
0.24
2.56
430.17
2Mechan
ical
maintenan
ceK
681.63
2.75
0.69
3.52
0.69
3.52
340.56
1Mobile
equipmen
toperator
K2
0.12
0.04
0.11
1.37
0.11
1.37
640.07
2Mudtankcleaner
K6
0.38
0.12
0.37
1.36
0.37
1.36
200.08
3Precipitationoperator
K24
2.31
4.12
0.67
4.59
0.67
4.59
210.49
2Raw
materialoperator
K59
4.65
8.80
1.38
4.91
1.49
5.54
160.76
1Utilityservicer
K24
7.31
9.08
3.05
4.47
3.05
4.47
503.66
4
No
te:C
ombined
datasourceforPM
2.5:1¼both
TPM
and%PM
2.5measured(30%
ofPM
2.5DEG
s);2¼TP
Mmeasuredan
d%PM
2.5estimated
(28%
ofPM
2.5DEG
s);3¼both
TPM
and%PM
2.5estimated
from
sameor
comparab
lefacilities(22%
ofPM
2.5DEG
s);4¼both
TPM
and%PM
2.5estimated
from
expertjudgmen
t(8%
ofPM
2.5DEG
s).N
otshownareDEG
swithrank5forwhichTP
Mwas
given
adefau
ltvaluean
d%PM
2.5
was
estimated
(12%
ofPM
2.5DEG
s).
aTP
Mco
ncentrationswithoutad
justmen
tforrespiratoruse.
Figure 1. Box-and-whiskers plot of the overall facility-wide distribu-tion of the arithmetic mean. (a) TPM (mg/m3) and (b) PM2.5 (mg/m3)by DEG in the three predominant aluminum manufacturing workprocesses (smelter, fabrication (note: abbreviated as Fab), andrefinery), plotted with a lognormal scale. The bottom and topedges of the box indicate the intra-quartile range. The diamondinside the box indicates the mean concentration, the line inside thebox indicates the median concentration.
Figure 2. Box-and-whiskers plot of the overall facility-wide distribu-tion of mean %PM2.5 by DEGs in the three predominant types ofDEGs for which %PM2.5 was determined (smelter, fabrication (note:abbreviated as Fab), and refinery), in the aluminum industry. Thebottom and top edges of the box indicate the intra-quartile range.The diamond inside the box indicates the mean concentration, theline inside the box indicates the median concentration.
Job-exposure matrix for total and fine particlesNoth et al
96
Journal of Exposure Science and Environmental Epidemiology (2014), 89 – 99 & 2014 Nature America, Inc.

in the JEM are highly correlated, with a Spearman rank correlationcoefficients of 0.93 in smelter DEGs and 0.82 in fabrication DEGs.Of the 223 DEGs at these eight facilities, 30% were calculateddirectly using measured %PM2.5 and measured TPM; an additional28% were calculated from TPM measured and %PM2.5 estimated.PM2.5 in DEGs with higher data source rankings had highermedian PM2.5 concentrations (median PM2.5 in source ranks 1–5 is,in order, 0.29, 0.20, 0.19, 0.15, 0.04 mg/m3).
Influence of Facility and DEG in PM Exposure in Smelters andFabrication FacilitiesThe 7531 samples used to calculate the TPM exposure for 187measured facility-specific exposure groups (DEGs) in the JEM wereused in linear models to evaluate the sources of variability in thesampling data. Exposure group explains more of the totalvariability than facility for both smelter and fabrication facility(Table 3). The full model, including the interaction (facility*expo-sure group), explained 27% of the variability in smelters and 36%in fabrication units. Because the r2 value increased 5% when theinteraction term was added into the model, we conclude thatthere are facility-specific differences within TPM exposure groups.This finding corroborates the qualitative information that moti-vated the development of facility-specific exposure groups, that is,DEGs, rather than pooling facilities within exposure groups.
DISCUSSIONThis paper presents a unique survey of personal exposures inaluminum manufacturing workers, specifically TPM and PM2.5. Fewstudies of PM exposures in manufacturing have presented sizedistribution data or distinguished PM2.5 from TPM. Moreover,these measurement-based PM2.5 and TPM exposures wereestimated across many parts of the industry, in contrast toprevious studies, which focused on smelters. The exposureassessments for TPM and PM2.5 presented here have significantstrengths. The TPM exposures in the JEM were based on 8385personal samples that were collected at 11 facilities and representrandom full-shift exposures. The PM2.5 exposures were basedadditionally on 377 pairs of personal PM2.5 and TPM samplescollected at eight facilities. These are the first measured personalPM2.5 exposure data reported in this industry.
The OELs set by both the company and OSHA are used asguidance for routine personal exposure sampling. Jobs that arelikely to exceed 30% of the OEL at least 5% of the time aretargeted for sampling. For TPM, with an OEL of 10 mg/m3, the 30%concentration is 3 mg/m3, however, more than three quarters ofthe TPM samples in this study are under 3 mg/m3. This is becauseTPM was rarely the focus of sampling. It was collected whensampling for other contaminants (e.g., fluorides, metals), but thisstill did not generally capture low TPM concentrations. Thus, inthis study, there was less sampling of jobs with very lowoccupational exposures, that is, less than 0.150 mg/m3 (the
highest environmental PM standard that USEPA ever issued) andtherefore more uncertainty in the lower exposure estimates. Thissampling strategy is reflected, in the fact only 13% of TPM samplesused in the TPM JEM were r0.150 mg/m3. Similarly, 21% of thePM2.5 samples used in the JEM were r0.035 mg/m3, the currentUSEPA daily PM2.5 standard. Although less important for industrialhygiene activities aimed at meeting OSHA regulations, thisuncertainty may be important in epidemiologic studies that seekto distinguish risk among employees exposed to the lower end ofthe exposure range. This uncertainty was reflected in our datasource rankings (based on the source of the exposure information,not the level of exposure), which indicated higher confidence inthe higher exposure estimates.
The focus of previous TPM research in the aluminum industryhas been on personal exposure in the potrooms. The personalexposures to TPM in smelters reported here are similar to thosereported previously. Donohogue et al.14 evaluated personalexposures to inhalable PM (similar to TPM) at six pre-bakesmelters in Australia and New Zealand. The range of medianvalues of the geometric mean exposure concentrations (mg/m3)from 1996 to 2006 was 2.17–4.50 mg/m3. This is comparable to thegeometric mean TPM in our five pre-bake smelters of 1.63 mg/m3,with an interquartile range TPM of 0.60–4.48 mg/m3. Personalexposures to TPM as measured in 15 personal samples in a pre-bakepotroom in Iran ranged from 0.1 to 5.90 mg/m3,16 which is alsocomparable to the range exposures we observed in our potrooms.Information on exposures in other departments in the smelters,fabrication units, refineries, and bauxite mines were unavailable inthe literature. Information on the size distribution of PM was limitedto research on constituents in different size fractions in potrooms.17
The three major limitations of this first assessment of PM2.5
exposure in aluminum manufacturing are lack of consideration oftemporal trends, respirator usage, or constituents. Although theTPM measurements available for this study had been collectedover a period of 30 years, there has been little change in thealuminum processes conducted in these facilities over the timeperiod of interest, from early 1980s until present. There may,however, have been temporal changes in exposure across thecompany as a whole, as well as for particular processes. Changesin TPM and PM2.5 over the more recent past will be the subject ofa subsequent, more formal, analysis. Second, we have not yettaken full advantage of information on respirator use. In thisanalysis, we applied a respirator protection factor only to sampleswith extreme values (over 50 mg/m3) with reported respirator use.A more thorough evaluation of reported respirator use will beforthcoming.
Third, this exposure assessment does not consider the composi-tion of PM2.5, which is likely to be relevant to the toxicity of theseexposures. Particles in the smelters are likely composed of inorganicmaterials, that is, fluorides, alumina dust, metals, and relatedfumes as well as coal tar pitch volatiles in some areas.13,18–21 ThePM exposures in fabrication are predominantly water-basedmetalworking fluids and metals. The composition of both the
Table 3. Percent of total variance in TPM (modeled as log-transformed TPM) explained by facility and exposure group in a series of linear regressionmodels, stratified by work process type in the aluminum industry.
Model Smelter (N¼ 5172) Fabrication (N¼ 2359)
ModelDF
ModelP-value
r2 Adjustedr2
AIC ModelDF
ModelP-value
r2 Adjustedr2
AIC
Facility only 4 0.0001 0.004 0.004 9737 8 o0.0001 0.10 0.10 3382Exposure group only 27 o0.0001 0.20 0.19 8681 60 o0.0001 0.27 0.25 2993Facilityþ exposure group 31 o0.0001 0.21 0.20 8623 68 o0.0001 0.31 0.29 2891Facilityþ exposure groupþ Facility*exposure group
79 o0.0001 0.27 0.26 8303 103 o0.0001 0.36 0.33 2785
Job-exposure matrix for total and fine particlesNoth et al
97
& 2014 Nature America, Inc. Journal of Exposure Science and Environmental Epidemiology (2014), 89 – 99

TPM and PM2.5 fractions is clearly an important aspect of thepersonal exposures to these individuals. Analyses of the constituentexposures in each DEG are underway to develop a JEM forchemical-specific exposures.
Despite these limitations, the exposure assessment for PM2.5
presented in this report reflects a thorough examination ofthousands of particle samples and contributes to our knowledgeabout the distribution of particle exposures in the US aluminummanufacturing industry. The ultimate objective of the exposureassessment described here was to provide the basis for anexposure-response analysis in an epidemiologic cohort study.Figure 3 presents the daily dose (mg) from a range of familiarsources of PM2.5, using a conversion method for transformingmg/m3 into units of daily dose (mg) recommended by Pope et al.to compare various epidemiologic studies of PM.8,28 Results fromthis study indicate that the range of PM2.5 exposures within the USaluminum manufacturing industry fill the important gap in PM2.5
intake identified by Pope between environmental air pollutionand active smoking. The highest exposures in our study wereequivalent to a daily PM2.5 dose slightly greater than activelysmoking 1.5 cigarettes/day, although the dose rates andcomposition would obviously be quite different.
In conclusion, we have presented information on exposure totwo fractions of PM—TPM and PM2.5—in 11 aluminum manu-facturing facilities with different manufacturing operations. Asanticipated, occupational exposures exceeded environmental PMand PM2.5 levels by an order of magnitude in most jobs. Inaddition, both TPM and PM2.5 are highest in smelters and bothvary significantly by DEG, even within the same facility. Thesedifferences underscore the importance of understanding the rolesthat different processes and sources may have in the PM exposureprofile for aluminum workers.
CONFLICT OF INTERESTDr. Noth, Dr. Liu, and Dr. Eisen declare no potential for conflict of interest. Ms. Dixon-Ernst is a senior industrial hygienist for Alcoa, Inc. Ms. Cantley and Ms. Tessier-Sherman receive salary support from Alcoa, Inc. through contracts with YaleUniversity. Dr. Cullen receives salary support from Alcoa, Inc. through contracts withStanford University. Dr. Hammond has received compensation as a member of thescientific advisory board for Alcoa, Inc. She has also consulted for Alcoa, Inc. andreceived compensation.
ACKNOWLEDGEMENTSWe acknowledge the contribution of the following people: the Alcoa industrialhygienists and employees who participated in the sampling campaigns at eachfacility and Linda Maillet, Judi Caldwell Kuntz, Regi Jennings, Ralph Krobot, Bob Barr,and Jill Abston. This work was supported by National Institutes of Health, Institute ofAging (5R01 AG026291–06 Disease, Disability and Death in an Aging Workforce: TheAlcoa Study), Center for Disease Control and Prevention, National Institute ofOccupational Safety and Health (5R01OH009939–02: Occupational Exposure to PM2.5
and Cardiovascular Disease), and by Alcoa, Inc.NIA Data Sharing: As an alternative to providing a de-identified data set to the publicdomain, we allow access for the purpose of re-analyses or appropriate ‘‘follow-on’’analyses by any qualified investigator willing to sign a contractual covenant with thehost Institution limiting use of data to a specific agreed upon purpose and observingthe same restrictions as are limited in our contract with Alcoa, such as 60-daymanuscript review for compliance purposes.
REFERENCES1 Brook RD, Rajagopalan S, Pope CA, Brook JR, Bhatnagar A, Diez-Roux AV et al.
Particulate matter air pollution and cardiovascular disease. an update to thescientific statement from the American heart association. Circulation 2010; 121:2331–2378.
2 Dockery DW, Pope CA, Xu X, Spengler JD, Ware JH, Fay ME et al. An associationbetween air pollution and mortality in six U.S. cities. N Engl J Med 1993; 329:1753–1759.
3 Gan WQ, Koehoorn M, Davies HW, Demers Pa, Tamburic L, Brauer M.Long-term exposure to traffic-related air pollution and the risk of coronaryheart disease hospitalization and mortality. Environ Health Perspect 2011; 119:501–507.
4 Law MR, Morris JK, Wald NJ. Environmental tobacco smoke exposure andischaemic heart disease: an evaluation of the evidence. BMJ 1997; 315:973–980.
5 Mills NL, Donaldson K, Hadoke PW, Boon Na, MacNee W, Cassee FR et al. Adversecardiovascular effects of air pollution. Nat Clin Pract. Cardiovasc Med 2009; 6:36–44.
6 Peters A, Dockery DW, Muller JE, Mittleman MA. Increased particulate air pollu-tion and the triggering of myocardial infarction. Circulation 2001; 103:2810–2815.
7 Peters A, Liu E, Verrier RL, Schwartz J, Gold DR, Mittleman M et al. Air pollutionand incidence of cardiac arrhythmia. Epidemiology (Cambridge, Mass.) 2000; 11:11–17.
8 Pope CA, Burnett RT, Krewski D, Jerrett M, Shi Y, Calle EE et al. Cardiovascularmortality and exposure to airborne fine particulate matter and cigarette smoke:shape of the exposure-response relationship. Circulation 2009; 120: 941–948.
9 Smith KR, Peel JL. Mind the gap. Environ Health Perspect 2010; 118:1643–1645.
10 The Health Consequences of Smoking: a report of the Surgeon General. [Atlanta,Ga]: Department of Health and Human Services, Centers for Disease Control andPrevention, National Center for Chronic Disease Prevension and Health Promo-tion, Office on Smoking And Health; Washington, DC: For sale by the Supt. ofDocs., US G.P.O., 2004.
11 U.S. Department of Health and Human Services. The Health Consequences ofSmoking: Cardiovascular Disease. A Report of the Surgeon GeneralU.S. Depart-ment of Health and Human Services, 1983.
12 Benke G, Abramson M, Sim M. Exposures in the alumina and primary aluminiumindustry: an historical review. Ann Occup Hyg 1998; 42: 173–189.
13 Fritschi L, Sim MR, Forbes A, Abramson MJ, Benke G, Musk AW et al. Respiratorysymptoms and lung-function changes with exposure to five substances in alu-minium smelters. Int Arch Occup Environ Health 2003; 76: 103–110.
14 Donoghue AM, Frisch N, Ison M, Walpole G, Capil R, Curl C et al. Occupationalasthma in the aluminum smelters of Australia and New Zealand: 1991–2006. Am JInd Med 2011; 54: 224–231.
15 Sim M, Benke G. World at work: hazards and controls in aluminium potrooms. AnnOccup Hyg 2003; 60: 989–993.
16 Akbar-khanzadeh F. Exposure to particulates and fluorides and respiratory healthof workers in an aluminum production potroom with limited control measures.Am Ind Hyg Assoc J 2010; 56: 1008–1015.
17 Weinbruch S, Benker N, Koch W, Ebert M, Drabløs PA, Skaugset NP et al. Hygro-scopic properties of the workroom aerosol in aluminium smelter potrooms: a casefor transport of HF and SO2 into the lower airways. J Environ Monit 2010; 12:448–454.
18 Kongerud J, Boe J, Suyseth V, Naalsund a, Magnus P. Aluminium potroom asthma:the Norwegian experience. Eur Resp J 1994; 7: 165–172.
19 Sunderman FW. Review: nasal toxicity, carcinogenicity, and olfactory uptake ofmetals. Ann Clin Lab Sci 2001; 31: 3–24.
Figure 3. Distribution of exposures to estimated daily PM2.5 (mgdaily dose equivalent, calculated using 10m3/day as the averagedaily breathing rate for a single-shift worker (Adams28)). Whitecolumns are environmental and SHS (second-hand smoke)exposures, black are aluminum manufacturing exposures, andblack and white columns are active smoking exposures. Figurebased on data from Pope et al.8 Title: Distribution of exposure toestimated daily PM2.5 in different settings.
Job-exposure matrix for total and fine particlesNoth et al
98
Journal of Exposure Science and Environmental Epidemiology (2014), 89 – 99 & 2014 Nature America, Inc.

20 Armstrong BG, Gibbs G. Exposure-response relationship between lung cancer andpolycyclic aromatic hydrocarbons (PAHs). Occup Environ Med 2009; 66: 740–746.
21 Armstrong BG, Tremblay CG, Cyr D, Theriault GP, Thsriault GP. Estimating therelationship between exposure to tar volatiles and the incidence of bladder cancerin aluminum smelter workers. Scand J Work Environ Health 1986; 12: 486–493.
22 Thomassen Y, Koch W, Dunkhorst W, Ellingsen DG, Skaugset N, Jordbekken L et al.Ultrafine particles at workplaces of a primary aluminium smelterw. J Environ Monit2006; 8: 127–133.
23 Hoflich BLW, Weinbruch S, Theissmann R, Gorzawski H, Ebert M, Ortner HM et al.Characterization of individual aerosol particles in workroom air of aluminiumsmelter potrooms. J Environ Monit 2005; 7: 419–424.
24 Cullen MR, Vegso S, Cantley L, Galusha D, Rabinowitz P, Taiwo O et al. Use ofmedical insurance claims data for occupational health research. J Occup EnvironMed 2006; 48: 1054–1061.
25 NIOSH Method of Analytical Methods, 4th edition. Methods. Cincinnati, Ohio 1994.26 Seixas NS, Robins TG, Moulton LH. The use of geometric and arithmetic mean
exposures in occupational epidemiology. Am J Ind Med 1988; 14: 465–477.27 Assigned Protection Factors for the Revised Respiratory Protection Standard,
OSHA. 3352-02. Occupational Saftey and Health Administration, US Departmentof Labour; OSHA Publications office, Washington DC, 2009.
28 Adams WC. Measurement of Breathing Rate and Volume in Routinely PerformedDaily Activities Sacramento, CA, 1993, p 185.
Supplementary Information accompanies the paper on the Journal of Exposure Science and Environmental Epidemiology website (http://www.nature.com/jes)
Job-exposure matrix for total and fine particlesNoth et al
99
& 2014 Nature America, Inc. Journal of Exposure Science and Environmental Epidemiology (2014), 89 – 99