Different Genes Interact with Particulate Matter and Tobacco Smoke Exposure in Affecting Lung...
11
Different Genes Interact with Particulate Matter and Tobacco Smoke Exposure in Affecting Lung Function Decline in the General Population Ivan Curjuric 1,2 , Medea Imboden 1,2 , Rachel Nadif 3,4 , Ashish Kumar 1,2,5 , Christian Schindler 1,2 , Margot Haun 6 , Florian Kronenberg 6 , Nino Ku ¨ nzli 1,2 , Harish Phuleria 1,2 , Dirkje S. Postma 7 , Erich W. Russi 8 , Thierry Rochat 9 , Florence Demenais 10,11,12 , Nicole M. Probst-Hensch 1,2 * 1 Department of Epidemiology and Public Health, Swiss Tropical and Public Health Institute SwissTPH, Basel, Switzerland, 2 University of Basel, Basel, Switzerland, 3 INSERM, U1018, CESP Centre for research in Epidemiology and Population Health, Respiratory and Environmental Epidemiology Team, Villejuif, France, 4 Universite ´ Paris- Sud 11, UMRS 1018, Villejuif, France, 5 Wellcome Trust Centre for Human Genetics, University of Oxford, Oxford, United Kingdom, 6 Division of Genetic Epidemiology, Department of Medical Genetics, Molecular and Clinical Pharmacology, Innsbruck Medical University, Innsbruck, Austria, 7 Department of Pulmonary Medicine and Tuberculosis, University Medical Center Groningen, University of Groningen, Groningen, The Netherlands, 8 Division of Pulmonary Medicine, University Hospital Zu ¨ rich, Zu ¨ rich, Switzerland, 9 Division of Pulmonary Medicine, Geneva University Hospitals, Geneva, Switzerland, 10 INSERM, U946, Genetic Variation and Human Diseases Unit, Paris, France, 11 Fondation Jean Dausset - Centre d’Etude du Polymorphisme Humain (CEPH), Paris, France, 12 Universite ´ Paris Diderot, Sorbonne Paris Cite ´, Institut Universitaire d’He ´matologie, Paris, France Abstract Background: Oxidative stress related genes modify the effects of ambient air pollution or tobacco smoking on lung function decline. The impact of interactions might be substantial, but previous studies mostly focused on main effects of single genes. Objectives: We studied the interaction of both exposures with a broad set of oxidative-stress related candidate genes and pathways on lung function decline and contrasted interactions between exposures. Methods: For 12679 single nucleotide polymorphisms (SNPs), change in forced expiratory volume in one second (FEV 1 ), FEV 1 over forced vital capacity (FEV 1 /FVC), and mean forced expiratory flow between 25 and 75% of the FVC (FEF 25-75 ) was regressed on interval exposure to particulate matter ,10 mm in diameter (PM10) or packyears smoked (a), additive SNP effects (b), and interaction terms between (a) and (b) in 669 adults with GWAS data. Interaction p-values for 152 genes and 14 pathways were calculated by the adaptive rank truncation product (ARTP) method, and compared between exposures. Interaction effect sizes were contrasted for the strongest SNPs of nominally significant genes (p interaction ,0.05). Replication was attempted for SNPs with MAF.10% in 3320 SAPALDIA participants without GWAS. Results: On the SNP-level, rs2035268 in gene SNCA accelerated FEV 1 /FVC decline by 3.8% (p interaction = 2.5 6 10 26 ), and rs12190800 in PARK2 attenuated FEV1 decline by 95.1 ml p interaction = 9.7 6 10 28 ) over 11 years, while interacting with PM10. Genes and pathways nominally interacting with PM10 and packyears exposure differed substantially. Gene CRISP2 presented a significant interaction with PM10 (p interaction = 3.0 6 10 24 ) on FEV 1 /FVC decline. Pathway interactions were weak. Replications for the strongest SNPs in PARK2 and CRISP2 were not successful. Conclusions: Consistent with a stratified response to increasing oxidative stress, different genes and pathways potentially mediate PM10 and tobacco smoke effects on lung function decline. Ignoring environmental exposures would miss these patterns, but achieving sufficient sample size and comparability across study samples is challenging. Citation: Curjuric I, Imboden M, Nadif R, Kumar A, Schindler C, et al. (2012) Different Genes Interact with Particulate Matter and Tobacco Smoke Exposure in Affecting Lung Function Decline in the General Population. PLoS ONE 7(7): e40175. doi:10.1371/journal.pone.0040175 Editor: Marie-Pierre Dube ´, Universite de Montreal, Canada Received October 28, 2011; Accepted June 6, 2012; Published July 6, 2012 Copyright: ß 2012 Curjuric et al. This is an open-access article distributed under the terms of the Creative Commons Attribution License, which permits unrestricted use, distribution, and reproduction in any medium, provided the original author and source are credited. Funding: The Swiss Study on Air Pollution and Lung and Heart Diseases in Adults (SAPALDIA) was supported by the Swiss National Science Foundation (grants no 33CS30_134276/1, 33CSCO-108796, 3247BO-104283, 3247BO-104288, 3247BO-104284, 3247-065896, 3100-059302, 3200-052720, 3200-042532, 4026-028099, 3233-054996, PDFMP3-123171), the Federal Office for Forest, Environment and Landscape, the Federal Office of Public Health, the Federal Office of Roads and Transport, the canton’s government of Aargau, Basel-Stadt, Basel-Land, Geneva, Luzern, Ticino, Valais, Zurich, the Swiss Lung League, the canton’s Lung League of Basel Stadt/Basel Landschaft, Geneva, Ticino, Valais and Zurich, Schweizerische Unfallversicherungsanstalt (SUVA), Freiwillige Akademische Gesellschaft, UBS Wealth Foundation, Talecris Biotherapeutics GmbH, and Abbott Diagnostics. Genotyping in the GABRIEL framework was supported by grants European Commission 018996 and Wellcome Trust WT 084703MA. Identification of pathways was supported by the French National Research Agency (Bio2nea project ANR- CES 2009). The funders had no role in study design, data collection and analysis, decision to publish, or preparation of the manuscript. Competing Interests: I have read the journal’s policy and have the following conflicts: The SAPALDIA study was supported by the UBS Wealth Foundation, Talecris Biotherapeutics GmbH, and Abbott Diagnostics in terms of unrestricted grants for personnel and genotyping. The support of these institutions did not influence the scientific work regarding study design, data collection, data analysis, interpretation of results, decision to publish, or preparation of the manuscript in any way. Also, this does not alter our adherence to all the PLoS ONE policies on sharing data and materials. * E-mail: [email protected] PLoS ONE | www.plosone.org 1 July 2012 | Volume 7 | Issue 7 | e40175
Transcript of Different Genes Interact with Particulate Matter and Tobacco Smoke Exposure in Affecting Lung...
Different Genes Interact with Particulate Matter andTobacco Smoke Exposure in Affecting Lung FunctionDecline in the General PopulationIvan Curjuric1,2, Medea Imboden1,2, Rachel Nadif3,4, Ashish Kumar1,2,5, Christian Schindler1,2,
Margot Haun6, Florian Kronenberg6, Nino Kunzli1,2, Harish Phuleria1,2, Dirkje S. Postma7, Erich W. Russi8,
Thierry Rochat9, Florence Demenais10,11,12, Nicole M. Probst-Hensch1,2*
1 Department of Epidemiology and Public Health, Swiss Tropical and Public Health Institute SwissTPH, Basel, Switzerland, 2 University of Basel, Basel, Switzerland,
3 INSERM, U1018, CESP Centre for research in Epidemiology and Population Health, Respiratory and Environmental Epidemiology Team, Villejuif, France, 4 Universite Paris-
Sud 11, UMRS 1018, Villejuif, France, 5 Wellcome Trust Centre for Human Genetics, University of Oxford, Oxford, United Kingdom, 6 Division of Genetic Epidemiology,
Department of Medical Genetics, Molecular and Clinical Pharmacology, Innsbruck Medical University, Innsbruck, Austria, 7 Department of Pulmonary Medicine and
Tuberculosis, University Medical Center Groningen, University of Groningen, Groningen, The Netherlands, 8 Division of Pulmonary Medicine, University Hospital Zurich,
Zurich, Switzerland, 9 Division of Pulmonary Medicine, Geneva University Hospitals, Geneva, Switzerland, 10 INSERM, U946, Genetic Variation and Human Diseases Unit,
Paris, France, 11 Fondation Jean Dausset - Centre d’Etude du Polymorphisme Humain (CEPH), Paris, France, 12 Universite Paris Diderot, Sorbonne Paris Cite, Institut
Universitaire d’Hematologie, Paris, France
Abstract
Background: Oxidative stress related genes modify the effects of ambient air pollution or tobacco smoking on lung functiondecline. The impact of interactions might be substantial, but previous studies mostly focused on main effects of singlegenes.
Objectives: We studied the interaction of both exposures with a broad set of oxidative-stress related candidate genes andpathways on lung function decline and contrasted interactions between exposures.
Methods: For 12679 single nucleotide polymorphisms (SNPs), change in forced expiratory volume in one second (FEV1),FEV1 over forced vital capacity (FEV1/FVC), and mean forced expiratory flow between 25 and 75% of the FVC (FEF25-75) wasregressed on interval exposure to particulate matter ,10 mm in diameter (PM10) or packyears smoked (a), additive SNPeffects (b), and interaction terms between (a) and (b) in 669 adults with GWAS data. Interaction p-values for 152 genes and14 pathways were calculated by the adaptive rank truncation product (ARTP) method, and compared between exposures.Interaction effect sizes were contrasted for the strongest SNPs of nominally significant genes (pinteraction,0.05). Replicationwas attempted for SNPs with MAF.10% in 3320 SAPALDIA participants without GWAS.
Results: On the SNP-level, rs2035268 in gene SNCA accelerated FEV1/FVC decline by 3.8% (pinteraction = 2.561026), andrs12190800 in PARK2 attenuated FEV1 decline by 95.1 ml pinteraction = 9.761028) over 11 years, while interacting with PM10.Genes and pathways nominally interacting with PM10 and packyears exposure differed substantially. Gene CRISP2presented a significant interaction with PM10 (pinteraction = 3.061024) on FEV1/FVC decline. Pathway interactions were weak.Replications for the strongest SNPs in PARK2 and CRISP2 were not successful.
Conclusions: Consistent with a stratified response to increasing oxidative stress, different genes and pathways potentiallymediate PM10 and tobacco smoke effects on lung function decline. Ignoring environmental exposures would miss thesepatterns, but achieving sufficient sample size and comparability across study samples is challenging.
Citation: Curjuric I, Imboden M, Nadif R, Kumar A, Schindler C, et al. (2012) Different Genes Interact with Particulate Matter and Tobacco Smoke Exposure inAffecting Lung Function Decline in the General Population. PLoS ONE 7(7): e40175. doi:10.1371/journal.pone.0040175
Editor: Marie-Pierre Dube, Universite de Montreal, Canada
Received October 28, 2011; Accepted June 6, 2012; Published July 6, 2012
Copyright: � 2012 Curjuric et al. This is an open-access article distributed under the terms of the Creative Commons Attribution License, which permitsunrestricted use, distribution, and reproduction in any medium, provided the original author and source are credited.
Funding: The Swiss Study on Air Pollution and Lung and Heart Diseases in Adults (SAPALDIA) was supported by the Swiss National Science Foundation (grantsno 33CS30_134276/1, 33CSCO-108796, 3247BO-104283, 3247BO-104288, 3247BO-104284, 3247-065896, 3100-059302, 3200-052720, 3200-042532, 4026-028099,3233-054996, PDFMP3-123171), the Federal Office for Forest, Environment and Landscape, the Federal Office of Public Health, the Federal Office of Roads andTransport, the canton’s government of Aargau, Basel-Stadt, Basel-Land, Geneva, Luzern, Ticino, Valais, Zurich, the Swiss Lung League, the canton’s Lung League ofBasel Stadt/Basel Landschaft, Geneva, Ticino, Valais and Zurich, Schweizerische Unfallversicherungsanstalt (SUVA), Freiwillige Akademische Gesellschaft, UBSWealth Foundation, Talecris Biotherapeutics GmbH, and Abbott Diagnostics. Genotyping in the GABRIEL framework was supported by grants EuropeanCommission 018996 and Wellcome Trust WT 084703MA. Identification of pathways was supported by the French National Research Agency (Bio2nea project ANR-CES 2009). The funders had no role in study design, data collection and analysis, decision to publish, or preparation of the manuscript.
Competing Interests: I have read the journal’s policy and have the following conflicts: The SAPALDIA study was supported by the UBS Wealth Foundation,Talecris Biotherapeutics GmbH, and Abbott Diagnostics in terms of unrestricted grants for personnel and genotyping. The support of these institutions did notinfluence the scientific work regarding study design, data collection, data analysis, interpretation of results, decision to publish, or preparation of the manuscriptin any way. Also, this does not alter our adherence to all the PLoS ONE policies on sharing data and materials.
* E-mail: [email protected]
PLoS ONE | www.plosone.org 1 July 2012 | Volume 7 | Issue 7 | e40175

Introduction
Lung function is an important determinant of respiratory health
and life expectancy [1,2,3,4]. Its longitudinal course is affected by
different environmental exposures such as active tobacco smoking,
environmental tobacco smoke exposure [5], possibly workplace
exposures to dusts and fumes [6,7,8,9] as well as ambient air
pollution [10]. Both air pollution and tobacco smoke are known to
contain free radicals and to induce their direct formation at the
tissue level causing damage of cell walls, proteins and DNA, and
chronic tissue inflammation and remodeling in the long run
[11,12]. Upon exposure, different protein systems including those
scavenging reactive oxygen species (ROS) are up-regulated, and
the level of response is influenced by variation in underlying genes.
Likewise, polymorphisms in oxidative stress related candidate
genes like gluthathione s-transferases (GSTs), microsomal epoxide hydrox-
ylase (EPHX), or heme-oxygenase 1 (HMOX-1), have been associated
with lung function decline and chronic obstructive pulmonary
disease (COPD), a disease characterized by accelerated, progres-
sive lung function loss [13,14,15,16]. But most of these candidate
genes have not been consistently replicated across studies and
populations according to a recent review [15]. Similarly, genome-
wide association studies (GWAS) of lung function partially
struggled with replication [17,18]. Further, in GWAS on lung
function level or COPD prevalence [17,18,19,20,21,22] associa-
tion signals in known oxidative-stress genes were not strong [23].
Reasons for non-replication could be genetic heterogeneity
across populations, or also sub-phenotypes of disease [24].
However, it is also possible that differences in environmental
factors, and hence presence of gene-environment interaction play
a role. To the best of our knowledge, only one published genome-
wide interaction study examining the effect of farming exposure on
childhood asthma has taken into account gene-environment
interaction in respiratory disease to date [25]. This gap in the
scientific literature is probably due to increased sample size
requirements when assessing gene-environment interactions with
classical analysis methods [26,27]. However, their importance in
respiratory disease has previously been shown in candidate gene
studies focusing on single genes and SNPs therein [28,29,30], as
well as follow-up studies of GWAS [31,32].
Analysis methods such as pathway- or gene-set analyses [33] can
at least partly overcome sample size restrictions by reducing the
dimensionality of the data, and thus offer a promising alternative
study approach. Based on biological knowledge of genes and their
organization into molecular pathways, the longitudinal course of
lung function might be better explained by accumulating
interaction signals between environmental exposures and multiple
SNPs of the same gene, or different genes involved in the same
canonical pathway contributing to a functional entity in the
organism.
We thus aimed to investigate to which extent oxidative-stress
related genes and pathways interact significantly with interval
exposure to ambient particulate matter of mean diameter ,10 mm
(PM10) or active tobacco smoking on natural lung function decline
using genome-wide data from non-asthmatic adults of the Swiss
Study on Air Pollution and Lung and Heart Diseases in Adults
(SAPALDIA). SNP-level interaction signals were integrated onto
upper biological levels to identify significantly interacting genes
and pathways. The impact of PM10 exposure on lung function
decline was contrasted to tobacco smoking by comparing patterns
of associations at the gene- and pathway level, as well as
interaction effect sizes for the strongest interacting SNP within
genes.
Methods
Ethics StatementAll participants gave written informed consent. The study was
approved by the Overall Regional Ethics Commission for Clinical
Medicine (Swiss Academy of Medical Sciences, Basel, Switzerland)
and the responsible cantonal ethics committees of each study
centre (Ethics Commissions of the cantons Aarau, Basel, Geneva,
Grisons, Ticino, Valais, Vaud, and Zurich).
Study PopulationSAPALDIA is a population-based cohort study established in
1991 to assess the effects of long-term exposure to ambient air
pollution on respiratory health, with a first follow-up examination
in 2002. Participants were residents from 8 communities
throughout Switzerland aged 18–60 years at baseline. Details of
the study design and methodology were published elsewhere
[10,34,35].
The current work is based on up to 669 non-asthmatic
participants with genome-wide data fulfilling quality control
criteria and complete data on sex, age, height, PM10- and
smoking exposure (see Figure S1). Participants without genome-
wide data served as replication sample.
Spirometric MeasurementsSpirometry was performed without bronchodilation. Identical
spirometry protocols and devices (Sensormedics model 2200,
Yorba Linda, USA) were used in 1991 and 2002 [36,37].
Participants were in an upright sitting position and performed
three to eight forced expiratory lung function maneuvers
according to American Thoracic Society quality criteria [38]. At
least two acceptable measurements of forced vital capacity (FVC)
and forced expiratory volume in the first second (FEV1) were
obtained. Forced expiratory flow between 25 and 75% of the FVC
(FEF25–75) was recorded.
In the present study we studied the decline of FEV1, the ratio
FEV1/FVC and FEF25–75 between 1991 and 2002, as measures of
airway obstruction, calculated by subtracting the first measure-
ment from the second (measurement at SAPALDIA2– measure-
ment at SAPALDIA1).
Health Questionnaire DataSmoking information was assessed by questionnaire. At each
examination, never smokers were defined as having smoked less
than 20 packs of cigarettes or 360 g of tobacco in their life, ex-
smokers as having quit smoking at least 30 days before the
interview, and current smokers as those who reported active
smoking [39]. Packyears smoked between baseline and follow-up
examination were used for comparison with interval PM10
exposure, and were calculated by dividing the number of cigarettes
per day by 20 (giving number of cigarette packs) and multiplying
the result with years of exposure.
Air pollution ExposureSimilarly to calculating packyears, interval PM10 exposure was
defined by summing individual average home outdoor exposure to
PM10 over each year of follow-up, giving estimates in (mg/m3) *
years. Annual average exposures were calculated by using
exposure estimates from Gaussian Dispersion models on a
200m6200m grid throughout Switzerland for years 1990 and
2000, and interpolating historical trends from fixed air pollution
monitoring stations. Participants were assigned individual annual
exposure estimates via their geo-referenced residence addresses,
PM10 and Tobacco Differently Affect Lung Function
PLoS ONE | www.plosone.org 2 July 2012 | Volume 7 | Issue 7 | e40175
taking account of residence changes during follow-up. Details on
exposure modeling are given elsewhere [40].
SNP Genotyping and ImputationBlood for DNA-analysis was drawn in 2002 in participants
giving consent to genetic analyses [34].
Genome-wide genotyping was done on the Illumina Human
610quad BeadChip in the framework of the EU-funded GABRI-
EL study [41], a large consortium aiming to uncover genetic and
environmental causes of asthma. The current work focused on the
non-asthmatic portion of participants.
5679589 successfully genotyped autosomal SNPs were imputed
to 2.5 Mio using MACH v 1.0 software [42] and the HapMap v22
CEPH reference panel of Utah residents with ancestry from
northern and western Europe [43].
Strict quality control (QC) was applied by excluding samples
with ,97% genotyping success rate, non-European origin, cryptic
relatedness or sex-inconsistencies, as well as SNPs with Hardy-
Weinberg equilibrium p-value,1024, call rate ,97%, minor
allele frequency (MAF) ,5% or low imputation quality (Rsq,0.5).
A total of 291689681 SNPs withstood QC, and genome-wide data
was finally available in 669 non-asthmatic individuals with
environmental exposure data.
Replication genotyping was attempted for two interacting SNPs
(rs360563 in gene CRISP2, and rs12190800 in PARK2) with
MAF.10%. Genotyping was done using the iPLEX Gold
MassARRAY (SEQUENOM, San Diego, USA) on the whole
SAPALDIA study population including the analysis sample, as the
costs for manual sample selection outweigh those of additional
genotyping. The replication sample consisted of 3320 successfully
genotyped participants with complete data for covariates and all
three lung function parameters (see Figure S1).
Definition of Oxidative-stress Genes and PathwaysOxidative stress related genes were defined as either coding
proteins that directly scavenge or endogenously produce ROS,
their immediate regulators, or key genes in cascades triggered by
oxidative stress. They were identified by searching the Gene
Ontology database [44] with the term ‘‘response to oxidative
stress’’ and GeneCards with ‘‘oxidative stress’’ in the pathway field
of the advanced search option (http://www.genecards.org/index.
php?path = /Search/Advanced/, accessed November 2010). Re-
sulting gene lists were further enriched by literature reviews
[45,46,47,48,49]. By feeding the gene lists into Ingenuity Pathway
Analysis (IngenuityH Systems, www.ingenuity.com), 14 molecular
pathways related to oxidative stress and environmental exposures
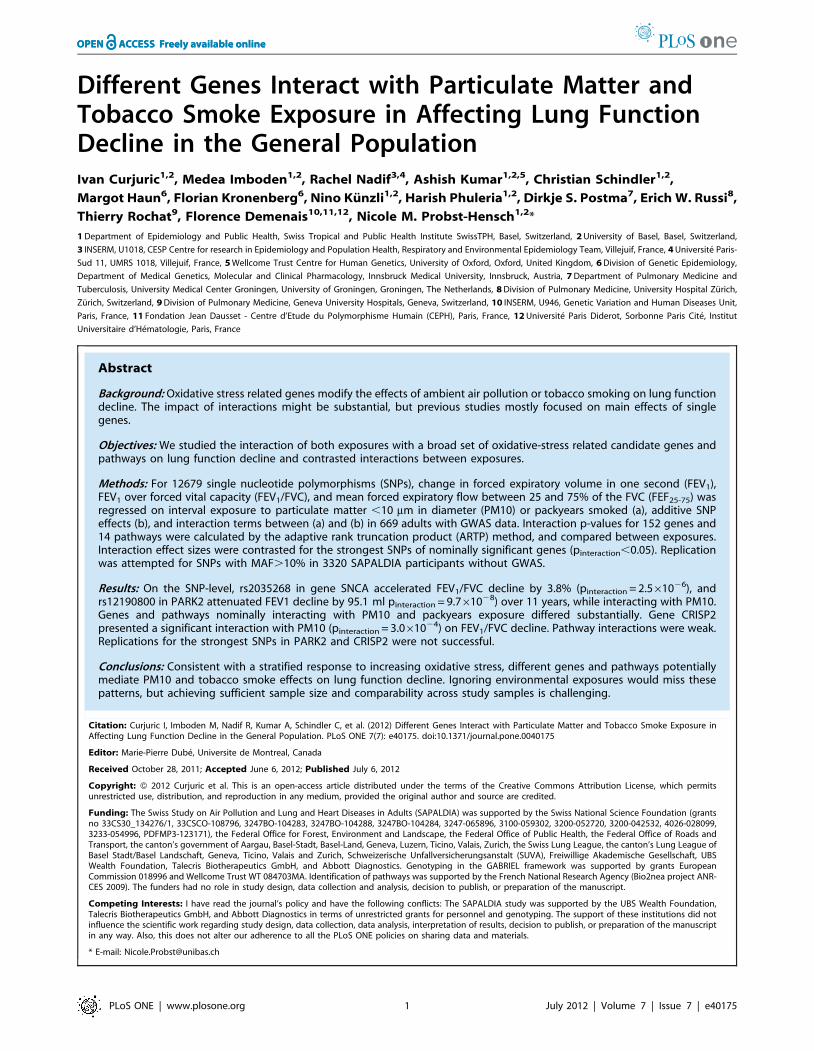
of interest were identified (Table 1).
Gene regions were defined by retrieving transcription start and
end positions in the ‘gene track’ of the UCSC browser (http://
genome.ucsc.edu/) [50], genome build 18 (March 2006), and
adding 20 kilo-bases to each end. Referring to dbSNP version 126,
available SNP data was matched to gene regions. Data was
available for 152 autosomal genes (Table 1), of which 46 mapped
once to a pathway, 33 twice, and 37 three times or more. Thirty-
six genes did not map to one of the 14 pathways, but were related
to oxidative stress based on their function. Details on gene size,
SNP-coverage and pathway mapping are given in Table S1 (see
Table 1. Mapping of candidate oxidative-stress genes to molecular pathways of interest.
PATHWAY GENES
Arachidonic AcidMetabolism
ALOX12 CYP1A1 CYP1A2 DHRS2 EPHX2 GPX1 GPX2 GPX3 GPX4 GPX5 GPX6 GPX7 GPX8 GSTK1 GSTT1 GSTZ1 MGST2 MGST3 PLA2G4APRDX6 PTGS1 PTGS2
Aryl Hydrocarbon ReceptorSignaling
ARNT CDKN1A CYP1A1 CYP1A2 EP300 FOS GSTK1 GSTM1 GSTM2 GSTM3 GSTM4 GSTM5 GSTO1 GSTO2 GSTP1 GSTT1 GSTT2 JUN MGST1MGST2 MGST3 NFE2L2 NFKB1 NQO1 NQO2 RELA TP53
fMLP Signaling inNeutrophils
MAP2K1 NCF2 NFKB1 NOX3 NOX4 PLCB1 PRKCA RAC1 RELA
Glutathione Metabolism GCLC GCLM GLRX GPX1 GPX2 GPX3 GPX4 GPX5 GPX6 GPX7 GPX8 GSR GSS GSTK1 GSTM1 GSTM2 GSTM3 GSTM4 GSTM5 GSTO1 GSTO2GSTP1 GSTT1 GSTT2 GSTZ1 IDH1 MGST1 MGST2 MGST3 PRDX6
IL-6 Signaling CHUK COL1A1 FOS GRB2 JAK2 JUN MAP2K1 MAPK14 NFKB1 RELA
Metabolism of Xenobioticsby Cytochrome P450
AKR1A1 CYP1A1 CYP1A2 DHRS2 EPHX1 GSTK1 GSTM1 GSTM2 GSTM3 GSTM4 GSTM5 GSTO1 GSTO2 GSTP1 GSTT1 GSTT2 GSTZ1 MGST1MGST2 MGST3
Methane Metabolism CAT EPX LPO MPO PRDX1 PRDX2 PRDX5 PRDX6 TPO
Mitochondrial Dysfunction CAT GLRX2 GPX4 GPX7 GSR NDUFA12 NDUFA13 NDUFA6 NDUFS1 NDUFS2 NDUFS3 NDUFS4 NDUFS8 PARK2 PARK7 PRDX3 PRDX5PSEN1 SNCA SOD2 TXN2 TXNRD2 UCP2
NF-kB Signaling CHUK EGFR EP300 INSR NFKB1 RAC1 RAC2 RELA RIPK1 TGFBR2 TLR4
NRF2-mediated OxidativeStress Response
ABCC1 AKR1A1 AKR7A2 AKR7A3 AOX1 CAT EP300 EPHX1 FOS FOSL1 GCLC GCLM GPX2 GSR GSTK1 GSTM1 GSTM2 GSTM3 GSTM4GSTM5 GSTO1 GSTO2 GSTP1 GSTT1 GSTT2 HMOX1 JUN KEAP1 MAP2K1 MAPK14 MGST1 MGST2 MGST3 NFE2L2 NQO1 NQO2 PRDX1PRKCA SOD1 SOD2 SOD3 TXN TXNRD1
OxidativePhosphorylation
NDUFA12 NDUFA13 NDUFA6 NDUFS1 NDUFS2 NDUFS3 NDUFS4 NDUFS8
Production of Nitric Oxideand Reactive OxygenSpecies in macrophages
CAT CHUK CYBA FOS JAK2 JUN MAP2K1 MAPK14 MPO NCF2 NFKB1 NOS2 PLCG1 PPP2CB PRKCA RAC1 RAC2 RELA STAT1 TLR4
Xenobiotic MetabolismSignaling
ARNT CAT CYP1A1 CYP1A2 EP300 FMO2 GCLC GSTK1 GSTM1 GSTM2 GSTM3 GSTM4 GSTM5 GSTO1 GSTO2 GSTP1 GSTT1 GSTT2 HMOX1KEAP1 MAP2K1 MAPK14 MGST1 MGST2 MGST3 NFE2L2 NFKB1 NOS2 NQO1 NQO2 PPP2CB PRKCA RELA SOD3
NOT MAPPED TOPATHWAY
AATF AGT AGTR1 ATOX1 CCL5 CP CRISP2 CYGB DHCR24 DUSP1 ERCC1 GLRX3 GLRX5 GSTCD HMOX2 HP MSRA MT2A NAPRT1 NOS1NOS3 NOX5 NOXO1 OGG1 OXR1 PNKP PSMB5 PTK2B PXDN PYCR1 SCARA3 SEPP1 SLC23A2 SRXN1 STK25 TXNIP
doi:10.1371/journal.pone.0040175.t001
PM10 and Tobacco Differently Affect Lung Function
PLoS ONE | www.plosone.org 3 July 2012 | Volume 7 | Issue 7 | e40175
Table S1). Gene specific allele dosage files in MACH format were
used for analysis.
Statistical AnalysisCharacterization of study population. The distribution of
sex, age, baseline lung function parameters, their change during
follow-up as well as packyears exposure during follow-up was
tabulated according to categories of smoking status (never, former
and current smokers) and interval PM10 exposure (high versus low
exposure, defined by the median value) (Table 2). To assess a
potential impact of loss to follow-up on our results, our study
population consisting of up to 669 non-asthmatic adults with high
quality genome-wide data and complete information on model
covariates was compared to non-asthmatic participants examined
at follow-up without genome-wide data (n = 3833), and to those
completing only baseline examination (n = 1299) by means of
descriptive tables and tests for independent samples (see Table S2).
Gene- and pathway-environment interaction
analysis. The interaction of genetic variation and exposure to
PM10 or tobacco smoke on lung function decline was assessed in
different stages.
First, SNP level analyses on decline in FEV1, FEV1/FVC and
FEF25–75 were done for each gene separately using multiple
linear regression in ProbABEL v0.1.3 (http://www.genabel.org)
[51] with robust sandwich-estimation of standard errors. Models
specified an additive SNP-effect, main effects for packyears
smoked and interval PM10 exposure between surveys, and an
interaction term between the SNP-variable and either exposure.
They adjusted for sex, age and height at follow-up, packyears
smoked up to baseline, principal components of population
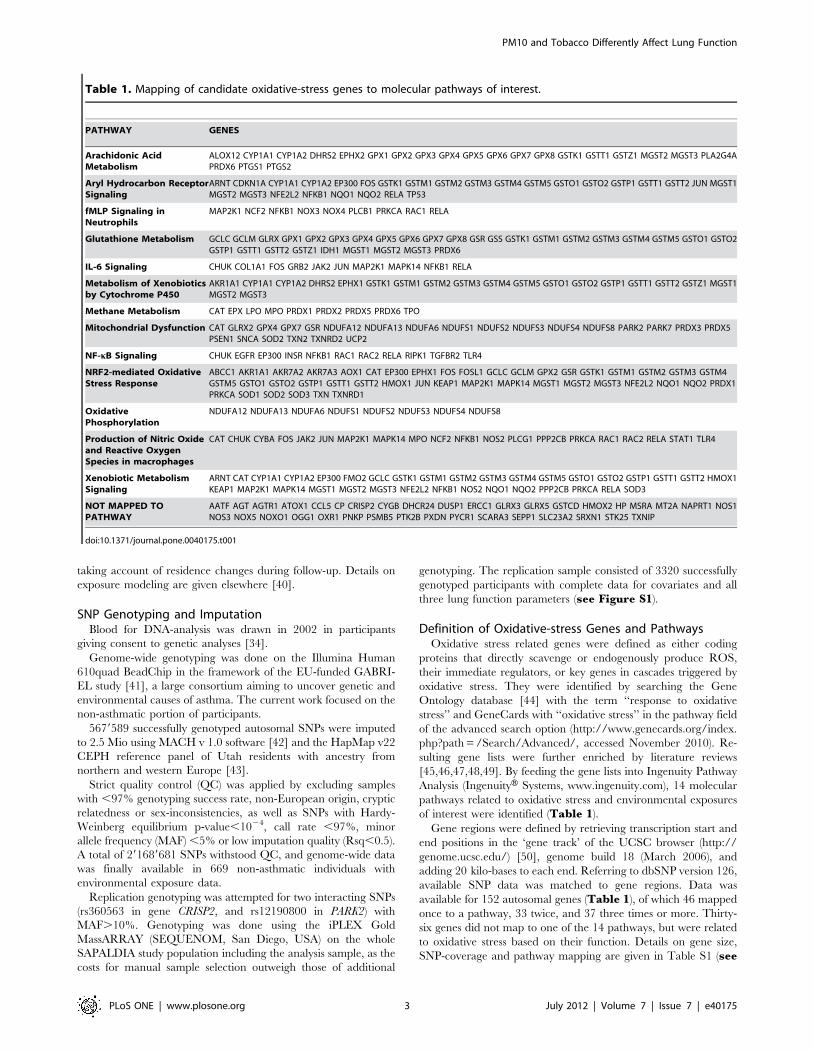
Table 2. Distribution of main characteristics by smoking status at follow-up and PM10 exposure during follow-up (N = 6501).
Interval PM10 EXPOSURE
(median:239.0 mg/m3*years)
SMOKING CATEGORY exposure , median exposure$ median
variable value2 range value2 range
Never n 152 145
Smoker female sex [%] 67.1 53.8
age at follow-up [years] 53.0 31.1 – 71.5 52.7 29.8 – 71.8
FEV1 [L] 3.4 2.0 – 5.2 3.6 2.4 – 6.0
FEV1 decline [L] 20.3 21.1 – 1.0 20.3 21.5 – 0.5
FEV1/FVC [%] 79.2 61.4 – 98.0 81.0 62.5 – 99.8
FEV1/FVC decline [%] 23.9 213.2 – 9.4 24.4 221.6 – 8.2
FEF25–75 [L/sec] 3.2 1.3 – 7.5 3.6 1.2 – 6.8
FEF25–75 decl. [L/sec] 20.7 22.5 – 2.1 20.8 23.7 – 0.6
pack years d. follow-up n.a. n.a.
Former n 98 102
Smoker female sex [%] 40.8 52.9
age at follow-up [years] 54.1 32.7 – 72.0 54.4 30.8 – 71.9
FEV1 [L] 3.8 2.2 – 5.4 3.6 2.3 – 5.6
FEV1 decline [L] 20.4 21.2 – 0.3 20.4 21.4 – 0.6
FEV1/FVC [%] 78.8 60.0 – 97.3 80.6 66.4 – 95.2
FEV1/FVC decline [%] 23.2 216.1 – 12.4 24.7 220.7 – 13.7
FEF25–75 [L/sec] 3.6 1.4 – 7.7 3.6 1.5 – 7.2
FEF25–75 decl. [L/sec] 20.8 22.8 – 1.7 20.8 23.6 – 1.6
pack years d. follow-up 0.0 0.0 – 25.0 0.0 0.0 – 35.0
Current n 75 78
Smoker female sex [%] 37.3 46.2
age at follow-up [years] 52.8 29.8 – 70.8 49.7 30.3 – 70.6
FEV1 [L] 3.6 2.4 – 5.7 3.7 1.8 – 6.8
FEV1 decline [L] 20.5 21.5 – 0.1 20.4 21.3 – 0.3
FEV1/FVC [%] 77.6 59.3 – 94.5 79.0 49.0 – 97.1
FEV1/FVC decline [%] 26.3 220.5 – 3.9 24.9 221.5 – 7.9
FEF25–75 [L/sec] 3.3 1.4 – 7.4 3.5 0.7 – 7.3
FEF25–75 decl. [L/sec] 21.0 23.0 – 0.4 20.8 22.4 – 0.7
pack years d. follow-up 10.9 0.0 – 27.3 9.0 0.0 – 24.0
1restricted to sample with complete data on all three lung function parameters. Regarding FEV1, sample size with complete covariate data would be n = 669.2means for age and lung function values, medians for pack years exposures.doi:10.1371/journal.pone.0040175.t002
PM10 and Tobacco Differently Affect Lung Function
PLoS ONE | www.plosone.org 4 July 2012 | Volume 7 | Issue 7 | e40175
ancestry, and study area. No adjustment for ageing during follow-
up was made, since follow-up time was 11 years for all
participants. Complete data including covariates and environ-
mental exposures was available on 669 participants for FEV1
decline, and on 650 for FEV1/FVC and FEF25–75 decline.
We used a slightly modified version of the Adaptive Rank
Truncation Product (ARTP) method described by Yu and
colleagues [52] to calculate gene- and pathway level p-values.
Briefly, according to the method, SNPs are sorted in ascending
order of interaction strength, and SNP-interaction p-values are
multiplied up to several pre-specified truncation points which
depend on the number of SNPs in the gene. The statistical
significance of these products is derived using the empirical
distribution of products observed in the original and permutated
datasets. For each gene, the strongest product p-value across all
truncation points is readjusted using again its empirical distribu-
tion, to result in the gene-level p-value. Using the gene-level p-
values in observed and permutated datasets, the same procedure
can be applied to calculate pathway-level p-values. Details on the
ARTP method, the applied modifications and truncation point
definitions are presented in Figure S2 and Methods S1.
SNP-level analyses were run 10000 times, always after having
newly permuted gene-specific SNP-allele-dosages across partici-
pants. SNP-level interaction p-values of the observed and
permutated datasets were used for calculating gene- and
pathway-level p-values. According to Yu et al. [52], results from
simulation studies suggest the ARTP-method yields type I error
rates close to 5%. We thus additionally corrected for 152 tests at
the gene and 14 tests at the pathway level in a first look. In a
second line of investigation, a non-stringent nominal threshold of
a= 0.05 was chosen for further exploring gene- and pathway-level
interaction signals due to our restricted sample size.
Comparing the impact of PM10 versus tobacco
smoking. Emerging patterns of interaction were compared
between exposures at the pathway- and gene-level. In pathways
with nominally significant interactions, gene-level p-values were
plotted against each other to identify the relative contributions to
the pathway signal.
For the SNP with the strongest interaction signal in each
nominally significant gene regression analyses were repeated with
exposure centered to the median. Effect estimates were scaled to
represent an exposure contrast of one interquartile range (IQR),
and interaction effect sizes were compared between PM10 and
tobacco smoke exposure. For SNP rs2035268 in gene SNCA,
which was one of the top interaction signals in FEV1/FVC
decline, genotype specific estimates for PM10 and packyears
exposure were calculated to exemplify the effect modification by
genotype. To this purpose, imputed allele dosages were coded as
genotypes as follows: dosage ,0.5 genotype TT, 0.5# dosage
,1.5 genotype GT, and dosage $1.5 genotype GG. Reparame-
trization of exposure variables into genotype specific ones was
employed to avoid model-overspecification and instable estimation
in small genotype strata (rs2035268: MAF 5%).
Statistical power. Power calculations were done using
QUANTO software [53] version 1.2 specifying a gene-environ-
ment study on independent individuals. Details of the power
calculation are given in Methods S1. The most important aspect of
the calculation was that a two-sided significance threshold of 5%
was used (i.e. no multiple testing correction was included), since all
12679 SNP-estimates were further processed for deriving gene-
and pathway level p-values without filtering by association
strength. In our first analysis with 650 subjects, we have at least
75% power to detect a SNP*environment interaction that
accounts for 1% of the total variance and that power increases
to 99% when the SNP*environment interaction accounts for 5%
of the total variance. In the replication analysis with n = 3320,
estimated power is 99% in both cases. Statistical power is expected
to be higher for the gene and pathway level analysis, but that
increase in power could not be quantified since p-values for
interaction at the gene (or pathway) level are obtained from
individual p-values for interactions with SNPs belonging to the
gene (or pathway), and the effect of interaction may vary among
SNPs.
Results
Characteristics of Study PopulationRegarding the distribution of sex, age and lung function
according to categories of smoking and PM10 exposure, our study
sample on average presented decreasing lung function values and
accelerated lung function decline with increased smoking
(Table 2). The percentage of females decreased with smoking
exposure. Compared to participants assessed only at baseline, our
study sample had slightly better lung function values, substantially
less current smokers, was slightly less exposed to PM10 and
tobacco smoke, and was older and leaner (see Table S2).
SNP-level AnalysisA SNP-level analysis correcting for 12679 tests (a= 0.05/
12679 = 3.961026) detected an interaction between SNP
rs2035268 in gene synuclein alpha (SNCA) on chromosome
4 q21 and PM10 on FEV1/FVC decline (pinteraction = 2.561026).
Compared to the baseline TT genotype, each G-allele was
associated with a 3.8% (95% confidence interval (95%-CI) 2.2 to
5.4%) higher decline per 83.4 mg/m3*year PM10 exposure (IQR)
over 11 years. Further, rs12190800 located in gene Parkinson
disease protein 2 (PARK2) on chromosome 6 q25.2 interacted with
PM10 on FEV1 decline. Compared to the TT-genotype each C-
allele entailed an attenuation of 95.1 ml (95%-CI 60.1 ml to
130.1 ml) in FEV1 decline per IQR of PM10 (pinterac-
tion = 9.861028). Exposure and outcome specific regression
estimates for all 12679 SNPs are given in Data S1.
Gene-level AnalysisIn the gene-level analysis, nominally interacting genes differed
between PM10 and packyears exposure across the parameters of
lung function decline (Table 3). Genes interacting with PM10
exposure partially overlapped for FEV1/FVC and FEF25–75
decline (genes CRISP2, ERCC1, LPO, MPO, and SNCA). After
correcting for performing 152 gene-level tests (aBonferroni = 0.05/
152 = 3.29*1024), the interaction between gene cysteine-richsecretory protein 2 (CRISP2) located on chromosome 6p12.3
and interval PM10 exposure on FEV1/FVC decline remained
significant (pinteraction = 3.061024). A marginally significant inter-
action was seen for gene SNCA on chromosome 4q21 with the
same outcome and exposure (pinteraction = 4.061024). Interactions
observed for packyears exposure did not withstand multiple testing
corrections.
P-values of interaction for all tested genes are given in TableS3.
Pathway-level AnalysisPathways ‘‘mitochondrial dysfunction’’ and ‘‘methane
metabolism’’ interacted nominally (a= 0.05) with PM10 on
FEV1/FVC decline (p = 0.017) and FEF25–75 decline (p = 0.029),
respectively. A further interaction signal was observed for pathway
‘‘apoptosis’’ and packyears exposure on FEV1-decline
(p = 0.051). Inspecting the interaction p-values of pathway-specific
PM10 and Tobacco Differently Affect Lung Function
PLoS ONE | www.plosone.org 5 July 2012 | Volume 7 | Issue 7 | e40175
genes revealed that the pathway signals mostly arose from single
genes (SNCA in pathway ‘‘mitochondrial dysfunction’’) or single
genomic loci (overlapping gene regions of genes eosinophil peroxidase,
EPX, lactoperoxidase, LPO, and myeloperoxidase, MPO in pathway
‘‘methane metabolism’’) (Figure 1, parts A–C). P-values of
interaction for all tested pathways are given in Table S3.
Comparison of Interactions with PM10 Versus PackyearsExposure
The comparison of interaction effect sizes for PM10 and
packyears exposure was based on regression estimates for the
strongest interacting SNP only within each nominally significant
gene. Table 4 presents estimates for FEV1/FVC decline, where
significant and marginally significant gene-level interactions have
been detected for genes CRISP2 and SNCA, respectively. Estimates
for decline in FEV1 and FEF25–75 are presented in Table S4 andTable S5.
The C-allele of SNP rs360563 in gene CRISP2 accelerated
FEV1/FVC decline by 1.1% per IQR change in PM10 exposure
over 11 years (Table 4). Similarly, the G-allele of SNP rs2035268
in SNCA was associated with an accelerated decline by 3,8% per
allele and IQR change in exposure. Genotype specific exposure
estimates were calculated for rs2035268. Within genotypes GT
and GG of SNP rs2035268, a change in IQR of PM10 was
associated with a signficant acceleration of FEV1/FVC decline by
3.9%, opposed to a small and non-signficiant acceleration by 0.2%
in baseline genotype TT (Table 5). In contrast, a change in IQR
of packyears smoked was associated with a significant acceleration
by 1.1% in the baseline TT genotype stratum, but not in the GT/
GG strata.
For FEV1- and FEF25–75 decline, interaction effect sizes for the
strongest interacting SNPs in nominally significant genes tended to
be considerably larger with packyears compared to PM10
exposure. Further, packyears exposure frequently presented
significant main effects besides the interaction with SNPs (TableS4 and Table S5).
In models including only main effects but no interaction
between SNPs and exposure, an IQR of 9.8 packyears was
significantly associated with accelerated decline in FEV1/FVC by
1%, and in FEV1 by 50 ml (data not shown). Respective estimates
for PM10 were non-significant. SNP main effects remained non-
significant and their beta estimates largely unaffected by the
exclusion of interaction terms.
Replication of Significant AssociationsReplication genotyping was done for CRISP2 SNP rs360563
(MAF of 49.8%) and rs12190800 in PARK2 (MAF 16%), but their
interaction with PM10 exposure on FEV1/FVC and FEV1 decline
could not be confirmed in the remainder of the SAPALDIA
population (pinteraction = 0.63 and 0.50 respectively, n = 3320 for
both). Thereby, MAFs in the replication sample corresponded to
those in the discovery sample, and both SNPs were in Hardy-
Weinberg equilibrium.
Discussion
To the best of our knowledge, this is the first study assessing
gene-environment interactions on lung function decline using
analysis methods that accumulate interaction effects along a
broadly defined set of candidate genes and pathways. Our results
suggest that different oxidative stress genes could be involved in
mediating the adverse effects of ambient air pollution and tobacco
smoke exposure on lung function decline.
We can currently only hypothesize about the reason for
observing different patterns of interaction between the two
environmental exposures. A possible explanation would be that
ambient particulate matter pollution and tobacco smoke, although
sharing many constituents, also differ in their composition, which
possibly affects the overall and relative relevance of the different
pathways. A probably more important explanation is that levels of
oxidative stress imposed by ambient PM10 exposure are much
lower than those induced by active tobacco smoking. Experimen-
tal studies have shown that different levels of oxidative stress
trigger dose-dependent, specific activations of pathways on the
cellular level in response to the oxidant burden [54]. Li and
colleagues delineated a stratified oxidative stress modelwhile studying the biological effects of particulate matter exposure
on human and mouse cell lines exposed to solutions of Diesel
exhaust particles (DEP) and concentrated ambient air particles
(CAP) sampled in a highly polluted area [55,56]. According to
their observations, at the lower end of exposure pivotal ROS-
scavenging enzymes like heme oxygenase-1 are induced, repre-
senting the activation of protective cell-mechanisms. Intermediate
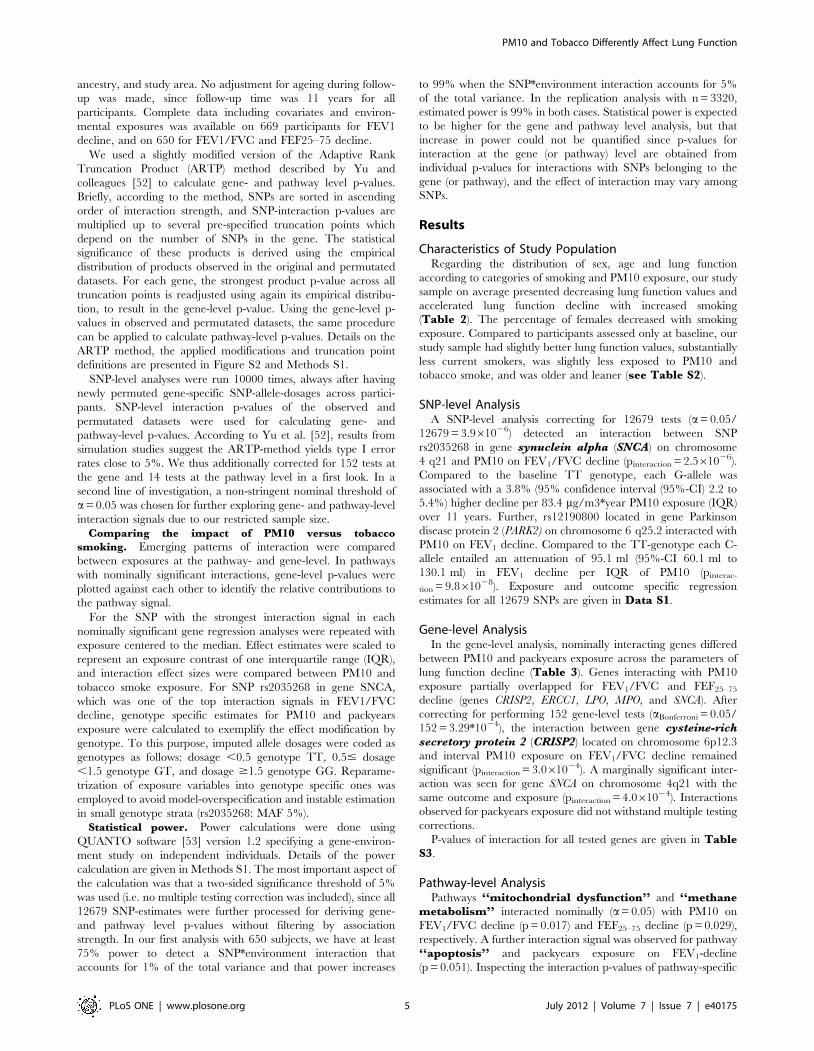
Table 3. Nominally significant gene-environment interactions by outcome and exposure.
Outcome decline FEV1 (n = 669) decline FEV1/FVC (n = 650) decline FEF25–75 (n = 650)
Exposure interval PM10 packyears interval PM10 packyears interval PM10 packyears
Gene (pinteraction) CP (0.005) BCL2 (0.003) CRISP2 (0.0003)a PSMB5 (0.003) LPO (0.008) TGFBR2 (0.006)
PRDX3 (0.010) PTK2B (0.017) SNCA (0.0004)b SOD2 (0.015) ERCC1 (0.014) PTK2B (0.033)
ERCC1 (0.014) PSEN1 (0.023) ERCC1 (0.007) MAP2K1 (0.019) MPO (0.018) TP53 (0.033)
RAC1 (0.027) NOXO1 (0.034) ALOX12 (0.012) NFKB1 (0.022) SLC23A2 (0.022) CASP6 (0.039)
CYP1A2 (0.028) AOX1 (0.044) LPO (0.018) HMOX2 (0.048) CRISP2 (0.023) OXR1 (0.045)
PSMB5 (0.038) MAP2K1 (0.046) CHUK (0.035) SNCA (0.025) TXNRD2 (0.047)
GLRX (0.046) GPX5 (0.039) GPX5 (0.026)
GLRX2 (0.048) MPO (0.039) COL1A1 (0.049)
EPX (0.040)
Genes are sorted in ascending order of interaction p-value within outcome-exposure strata.asignificant after Bonferroni-correction for testing 152 genes (a= .00033).bmarginally significant after Bonferroni-correction for testing 152 genes (a= .00033).doi:10.1371/journal.pone.0040175.t003
PM10 and Tobacco Differently Affect Lung Function
PLoS ONE | www.plosone.org 6 July 2012 | Volume 7 | Issue 7 | e40175

Figure 1. Distribution of interaction p-values across genes mapping to pathways with weak interaction signals. P-values of interactionon the gene-level are given on a minus log10 scale (y-axis), i.e. higher bars represent smaller interaction p-values. (A) Genes of the mitochondrial
PM10 and Tobacco Differently Affect Lung Function
PLoS ONE | www.plosone.org 7 July 2012 | Volume 7 | Issue 7 | e40175

exposure levels trigger inflammatory pathways via signal trans-
duction cascades (increased expression of interleukin-8 and Jun
kinase), while high exposure levels impact on mitochondrial
permeability, and result in cytotoxicity and apoptosis. Thereby
CAP were mostly representing the lower to mid-level of exposure,
inducing oxidative-stress enzymes and inflammation, but not
apoptosis (as observed with DEP). In contrast, tobacco smoke
exposure is known to induce the whole spectrum of cellular
reactions, from oxidative stress response and inflammation [57,58]
up to DNA-damage [58], apoptosis [59,60,61,62] as well as
cellular necrosis [61]. Although in the light of limited sample size,
we cannot provide statistical evidence of exposure-specific
interaction patterns with genes and pathways in our current
study, it is interesting to see that many of the top-ranking genes
interacting with packyears exposure are involved in signal
transduction or apoptosis (Table 3 BCL2, CASP6, MAP2K1,
NFkB1, TGFBR2, TP53). Only two such genes showed interaction
signals with PM10 exposure (CHUK, RAC1), and many of the
others related to scavenging or production of ROS (CRISP2,
CYP1A2, EPX, GLRX, GLRX2, GPX5, LPO, MPO, PRDX3). These
observations are consistent with the stratified oxidative stress
model. The observation of larger interaction effect sizes at the level
of SNPs for FEV1 and FEF25–75 decline, as well as the frequent
presence of significant main effects further support higher
oxidative stress levels induced by tobacco smoke than PM10
exposure.
Another important observation was that the effect of genetic
variation related to oxidative stress appeared to be mediated
predominantly by the interactions with environmental exposures,
as hardly any SNP main-effects were observed. This is in line with
the findings of genome-wide studies on lung function performed to
date [17,18,21], where oxidative-stress related candidate genes did
not produce strong signals. But their design was cross-sectional
and importantly, these analyses focused on SNP-main effects.
Exposure specific gene-effects might thus be missed as they can
cancel out when averaged over the whole population (which
happens in a gene main effect analysis). Disregarding gene-
environment interaction might also explain part of the missing
heritability in complex disease genetics.
Our studyhadseveral limitations.First, the limited numberofnon-
asthmatic adults with available genome-wide data restricted our
power to detect associations at the gene and pathway levels. In this
context, we faced the problem of finding studies with genome-wide
genotyping and comparable data on both phenotypes and environ-
mental exposures. This issue is particularly imminent regarding
ambient air pollution exposure. As a consequence, small sample size
did not allow us to identify further strong interaction signals to follow-
up, while the observed ones could not be replicated in the remainder
of thestudypopulation.Ourgeneandpathway level resultsare thusof
moreexploratorynature.Limitedpower isalsoknownto inflateeffect
estimates when the strongest association signals are selected for
further follow-up (so-called ‘‘winner’s curse’’ [63]), thus our
interaction effect estimates on the SNP-level are likely overestimated
for both exposures. But the relative difference in effect size between
exposures is probably less affected by this phenomenon. In case of
differential overestimation, the true difference would likely be larger,
as observed PM10 effects were smaller and therefore would be more
affected than packyears effects. Further, follow-up participants were
healthier than those completing only baseline examination. Our
results are thus applicable to an adult general population sample of
good health. Environmental exposure and genetic susceptibility
mightpossiblyhaveaffectedhealthandthusparticipationofourstudy
dysfunction pathway interacting with PM10 and packyears exposure between surveys on FEV1/FVC decline. (B) Genes of the methane metabolismpathway interacting with PM10 and packyears exposure between surveys on FEF25–75 decline. (C) Genes of the apoptosis signaling pathwayinteracting with PM10 and packyears exposure between surveys on FEV1 decline.doi:10.1371/journal.pone.0040175.g001
Table 4. Effect estimates of the strongest interacting SNP from each nominally significant gene on FEV1/FVC decline (n = 650).
Exposure Chrom Position Gene SNP type All1 All2 Freq All1 Betainteraction (SE), P BetaSNP (SE), P Betaexposure (SE), P
PM10 4 90975104 SNCA rs2035268 imp G T 0.05 23.8 (0.8), 2.54E-06* 20.7 (0.6), 0.254 20.2 (0.7), 0.786
(IQR. 83.4 6 49766228 CRISP2 rs360563 imp C T 0.50 21.1 (0.3), 3.78E-05 0.0 (0.3), 0.975 0.6 (0.7), 0.375
ug/m3 * y) 17 6840800 ALOX12 rs2073438 gen A G 0.26 1.0 (0.3), 2.38E-04 0.4 (0.3), 0.181 21.0 (0.7), 0.144
17 53675156 LPO rs8178290 imp A C 0.18 1.1 (0.3), 9.61E-04 20.2 (0.3), 0.582 21.0 (0.7), 0.153
17 53629132 EPX rs3785496 gen A G 0.80 21.1 (0.3), 0.001 20.1 (0.3), 0.773 1.1 (0.8), 0.140
17 53699864 MPO rs8178409 imp A G 0.18 1.1 (0.3), 0.001 20.2 (0.3), 0.523 21.0 (0.7), 0.158
19 50600888 ERCC1 rs1005165 imp C T 0.83 21.3 (0.4), 0.002 0.1 (0.4), 0.765 1.5 (0.9), 0.084
6 28629296 GPX5 rs393414 gen C T 0.79 20.9 (0.3), 0.003 0.3 (0.3), 0.385 1.0 (0.8), 0.219
10 101996416 CHUK rs4919438 imp C T 0.50 20.8 (0.3), 0.003 20.1 (0.2), 0.669 0.2 (0.7), 0.813
packyears 14 22552780 PSMB5 rs12590429 imp A G 0.09 23.8 (0.9), 1.06E-05 0.3 (0.5), 0.540 20.5 (0.5), 0.265
(IQR: 9.8 6 160020288 SOD2 rs7855 imp A G 0.94 2.7 (0.7), 2.17E-04 20.4 (0.8), 0.620 26.1 (1.4), 1.64E-05
PY) 15 64583032 MAP2K1 rs8043062 imp A G 0.15 1.9 (0.6), 0.001 20.1 (0.3), 0.741 21.6 (0.5), 0.003
4 103676616 NFKB1 rs230528 gen G T 0.38 21.7 (0.6), 0.003 0.1 (0.3), 0.775 0.2 (0.6), 0.693
16 4466293 HMOX2 rs2270363 imp A G 0.25 1.1 (0.4), 0.013 0.0 (0.3), 0.935 21.8 (0.6), 0.002
SNP-estimates are based on an additive model. Beta-estimates represent percentages of decline in FEV1/FVC over 11 years per effect allele and/or for an exposurecontrast of one interquartile range (IQR). All estimates are taken from the same interaction model. Positive values mean an attenuation, and negative ones anacceleration of FEV1/FVC decline. Rows are sorted according to ascending interaction p-values.*significant after Bonferroni correction for testing 12679 SNPs (a= 3.9610E-6).gen: genotyped SNP; imp: imputed SNP; All1: allele 1 (effect allele); All2: allele 2 (baseline allele); FreqAll1: frequency of allele 1.doi:10.1371/journal.pone.0040175.t004
PM10 and Tobacco Differently Affect Lung Function
PLoS ONE | www.plosone.org 8 July 2012 | Volume 7 | Issue 7 | e40175
subjects.But inthiscase, trueeffectswould likelybeunderestimated in
our present study [64]. Finally, SNP-coverage was low for certain
genes (see Table S1), and the well-known gene-deletions in
glutathione S-transferases are difficult to tag by SNP-genotyping as
they represent copy number variations. This makes it difficult to
interpret respective results. On the other side, a comparison of
imputed SNP data for rs360563 (gene CRISP2) with genotypes
measured during replication in the initial study sample showed a high
concordance indicatinghigh imputationquality (seeTableS6).The
absence of strong interactions on the pathway level is likely due to our
primary focus on function while selecting candidate genes, which
limitedpathwaycoverage.Butgenes inapathwaymayalsodifferently
interact with exposure, or compensate for each other. Further,
regulatory genomic regions could be located farer away than the
chosen flanking segments of 20 kilobases. Detecting interactions in
pathways is thus more challenging.
Strengths of our study were the population based design
comprising non-asthmatic adults of a wide age-spectrum, the
detailed data on individual tobacco smoke and particularly PM10
exposure, and the high quality of longitudinal lung function data.
Finally, the application of analysis methods which exploit
interaction signals below the significance threshold of a pure
SNP-level analysis provided new insight into a possible differential
involvement of genes according to exposure specific oxidative
stress levels.
ConclusionsApplying a gene- and pathway-level analysis, we observed that
PM10 and packyears exposure potentially interact with different
genes on lung function decline, consistent with a stratified response to
different oxidative stress levels. Our study thus points to the
importance of considering interactions with environmental factors
inthesearchformolecularpathwaysunderlying lungfunctiondecline
in response toexogenous inhalants.But it is alsoa goodexample of the
challenges faced by gene-environment interaction studies today:
While studies with partial genome-wide data, and hence often small
sample size, can beneficially use the remainder of the study
population as highly comparable replication sample, their potential
to identify sufficient variants to follow-up is limited. In contrast, large
studies or study consortia are more powerful in the discovery stage,
but suffer from data heterogeneity as finding suitable replication
studies with comparable phenotypic, genetic and environmental
exposure data is difficult. This results in a challenging trade-off
between sample size and data homogeneity.
Supporting Information
Figure S1 Follow-up of participants and selection ofstudy population.
(TIF)
Figure S2 Scheme of analysis steps in the ARTP-method. The ARTP method developed by Yu and colleagues
[52] assumes that an analysis at the SNP-level has been performed
on the originally observed data, followed by a reanalysis on
permutated datasets, i.e. p-values of association for original and
permutated datasets are available for each SNP. The ARTP
procedure then entails the following 4 steps: 1. Order p-values
from single SNP analysis in ascending order, 2. Calculate
products of ranked p-values at different truncation points
depending on gene length (light and dark green arrows in the
graph), 3. Adjust product p-values using permutation distribution
(1st and 2nd yellow arrow from the right), 4. Select the minimumof the adjusted products (red arrow) and readjust (1st yellow arrow
from the left). The readjusted product minimum represents
the gene-level p-value. For each permutated dataset, an
adjusted product minimum can be calculated as well. The
procedure can then be repeated using the resulting, original and
permutation gene-level p-values to yield p-values of the pathway.
(TIF)
Table S1 Characteristics of selected oxidative-stress related
genes and mapping to candidate pathways.
(XLS)
Table S2 Comparison of study sample to non-asthmatic
participants lost to follow-up, and those followed-up w/o
genome-wide data. PA-C p-value for comparisons of characteristics
between baseline and analysis sample; PB-C p-value for compar-
isons of characteristics between follow-up and analysis sample; a
Chi-squared tests for proportions, two sample T-tests for means,
and ranksum-test for medians, b n = 650 with complete baseline
and follow-up data, c in ever-smokers only.
(XLS)
Table S3 Interaction P-values by lung function decline param-
eter and exposure for a) all tested pathways and b) genes.
(XLS)
Table S4 Effect estimates of the strongest interacting SNP from
each nominally significant gene on FEV1-decline (n = 669). The
table shows the effect estimates of the strongest interacting SNP in
each nominally significant gene (i.e. with a gene p-value for
interaction ,0.05). SNP-estimates are based on an additive model.
Beta-estimates are in units of milliliters for FEV1, and represent
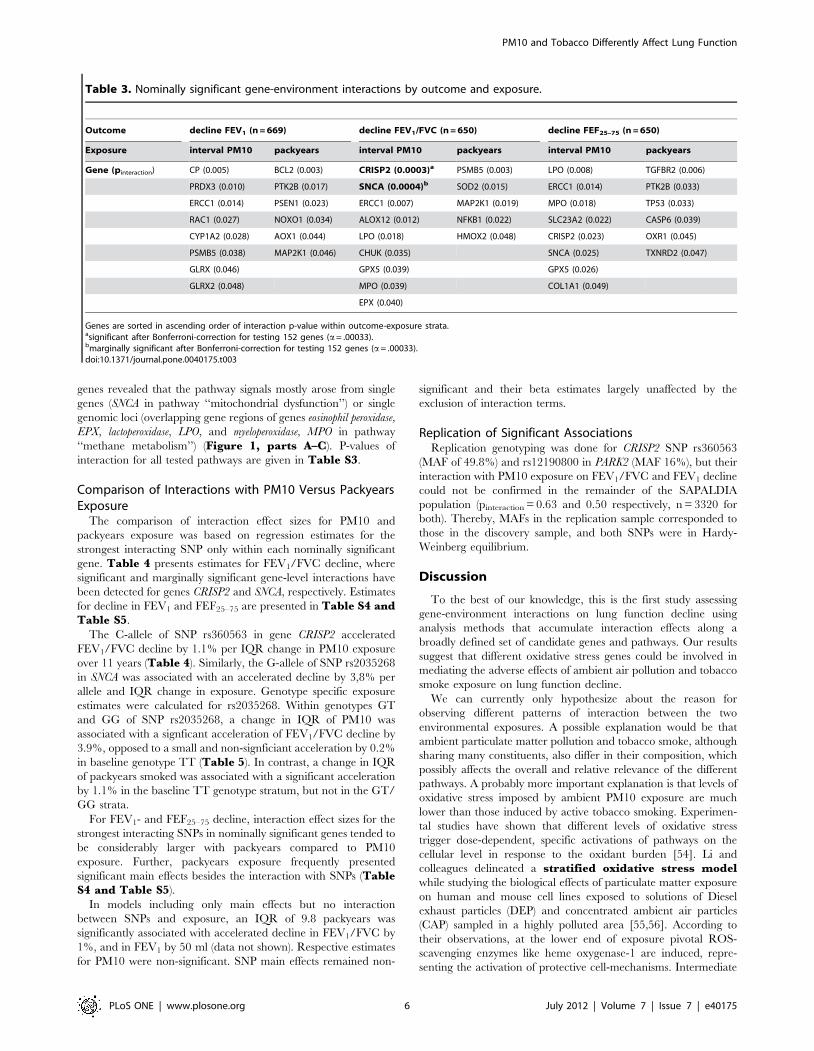
Table 5. rs2035268 genotype specific estimates of the effect of interval PM10 and pack years exposure on percentage decline inFEV1/FVC ratio during 11 years of follow-up.
exposure rs2035268 genotype effect estimatea (95%-confidence interval) p-value pinteractionb
interval PM10 wild-type (TT) 20.2 (21.7 to 1.4) 0.827 7.35E-07
(IQR 83.4ug/m3* y) mutant (GT/GG) 23.9 (25.9 to 21.8) 2.25E-04
packyears wild-type (TT) 21.1 (22.0 to 20.1) 0.024 0.909
(IQR 9,8 PY) mutant (GT/GG) 20.7 (22.3 to 1.0) 0.434
aEnvironmental effect estimates are based on a multiple linear model with sample size n = 650 adjusting for sex, age and height at follow-up, packyears smoked up tobaseline, population ancestry, and study area. PM10 and packyears exposure was reparametrized into genotype specific exposure variables to avoid modeloverspecification with instable estimates in the genotypic risk stratum (rs2035268 has minor allele frequency of 0.05). Estimates are in units of percentage decline inFEV1/FVC.bp-value of interaction between environmental exposure and genotypes of rs2035268 (TT vs GT/GG).doi:10.1371/journal.pone.0040175.t005
PM10 and Tobacco Differently Affect Lung Function
PLoS ONE | www.plosone.org 9 July 2012 | Volume 7 | Issue 7 | e40175
declines per effect allele and/or for an exposure contrast of one
interquartile range (IQR) over 11 years. All estimates are taken
from the same interaction model. Positive values mean that the
respective decline is attenuated, opposed to acceleration with
negative values. Rows are sorted according to ascending
interaction p-values. gen: genotyped SNP; imp: imputed SNP;
All1: allele 1 (effect allele), All2: allele 2 (baseline allele); FreqAll1:
frequency of allele 1.
(DOC)
Table S5 Effect estimates of the strongest interacting SNP from
each nominally significant gene on FEF25–75-decline (n = 650).
The table shows the effect estimates of the strongest interacting
SNP in each nominally significant gene (i.e. with a gene p-value for
interaction ,0.05). SNP-estimates are based on an additive model.
Beta-estimates are in units of milliliters per second, and represent
declines per effect allele and/or for an exposure contrast of one
interquartile range (IQR) over 11 years. Positive values mean that
the respective decline is attenuated, opposed to an acceleration
with negative values. gen: genotyped SNP; imp: imputed SNP;
All1: allele 1 (effect allele), All2: allele 2 (baseline allele); FreqAll1:
frequency of allele 1.
(DOC)
Table S6 Comparison of genotyped and imputed data for SNP
rs360563 in gene CRISP2. *imputed allele dosages have been rounded
to corresponding integer values of mutant alleles as follows:
dosage ,0.50 0
. = 0.5 and ,1.5 1
. = 1.5 2
N = 665 corresponds to the current analysis sample with available
genotyping data.
(DOC)
Methods S1 Details on the ARTP method specifications and
power calculations.
(DOC)
Text S1 Overview of the SAPALDIA study team as of July 2011.
(DOC)
Data S1 Outcome and exposure specific regression results of all
12679 SNPs. Effect estimates are derived from multiple linear
regression models specifying SNP main effects, interval PM10 and
packyears exposure (centered to the median) and an interaction
between SNP and either PM10 or packyears exposure. An additive
genetic model was assumed. Adjustments were made for sex, age
and height at follow-up, packyears smoked up to baseline,
population ancestry, and study area. Beta-estimates are in units
of milliliters for FEV1, percentages for FEV1/FVC, and milliliters
per second for FEF25–75, Betas represent declines per effect allele
and/or for an exposure contrast of one interquartile range (IQR)
over 11 years. All estimates are taken from the same interaction
model. Positive values mean that the respective decline is
attenuated, opposed to acceleration with negative values. Rows
are sorted according to chromosome and position. All1: allele 1
(effect allele), All2: allele 2 (baseline allele); FreqAll1: frequency of
allele 1, MAF: minor allele frequency. n: number of observations
in the model. Beta_int/se_int/p_int: beta estimate/standard
error/p-value of the SNP*environment interaction term.
(XLS)
Acknowledgments
The SAPALDIA study could not have been done without the help of the
study participants, technical and administrative support, scientific teams at
coordinating and local study sites, and the medical teams and field workers
at the local study sites. An overview of the SAPALDIA team as of July 2011
is given in the online appendix (Text S1).
SAPALDIA was part of the GABRIEL Consortium, a European 6th
Framework Research project on asthma genetics, which allowed us to
obtain the genotype information used in this analysis. We acknowledge Dr.Kai Yu, Division of Cancer Epidemiology and Genetics, National Cancer
Institute, Rockville MD, USA, and Prof. Roel Vermeulen, University
Medical Centre, Utrecht University, The Netherland for their help in
making the ARTP-method available. We also acknowledge PhilippeDessen, Plateforme de Biologie integree, Bioinformatique, Institut
Gustave Roussy IGR, Villejuif, France for his help with the work related
to Ingenuity Pathways AnalyisH.
Author Contributions
Analyzed the data: IC MI NMPH CS. Wrote the paper: IC NMPH MI.
Data collection and study design: NMPH MI CS NK TR. Analysis design:
IC MI NMPH CS RN. Critical revision and contribution to interpretation:
RN AK MH FK NK HP DSP EWR TR FD.
References
1. Burney PG, Hooper R (2011) Forced vital capacity, airway obstruction and
survival in a general population sample from the USA. Thorax 66: 49–54.
2. Stavem K, Aaser E, Sandvik L, Bjørnholt JV, Erikssen G, et al. (2005) Lung
function, smoking and mortality in a 26-year follow-up of healthy middle-aged
males. European Respiratory Journal 25: 618–625.
3. Schunemann HJ, Dorn J, Grant BJB, Winkelstein W, Trevisan M (2000)
Pulmonary Function Is a Long-term Predictor of Mortality in the General
Population. Chest 118: 656–664.
4. Lange P, Nyboe J, Appleyard M, Jensen G, Schnohr P (1990) Spirometric
findings and mortality in never-smokers. Journal of Clinical Epidemiology 43:
867–873.
5. Eisner MD, Wang Y, Haight TJ, Balmes J, Hammond SK, et al. (2007)
Secondhand Smoke Exposure, Pulmonary Function, and Cardiovascular
Mortality. Annals of Epidemiology 17: 364–373.
6. Carta P, Aru G, Barbieri MT, Avataneo G, Casula D (1996) Dust exposure,
respiratory symptoms, and longitudinal decline of lung function in young coal
miners. Occupational and Environmental Medicine 53: 312–319.
7. Kauffmann F, Drouet D, Lellouch J, Brille D (1982) Occupational exposure and
12-year spirometric changes among Paris area workers. British Journal of
Industrial Medicine 39: 221–232.
8. Johnsen HL, Hetland SM, Benth JS, Kongerud J, Soyseth V (2010) Dust
Exposure Assessed by a Job Exposure Matrix Is Associated with Increased
Annual Decline in FEV1: A 5-year Prospective Study of Employees in
Norwegian Smelters. American Journal of Respiratory and Critical Care
Medicine 181: 1234–1240.
9. Sunyer J, Zock JP, Kromhout H, Garcia-Esteban R, Radon K, et al. (2005)
Lung function decline, chronic bronchitis, and occupational exposures in young
adults. American Journal of Respiratory and Critical Care Medicine 172: 1139–
1145.
10. Downs SH, Schindler C, Liu LJ, Keidel D, Bayer-Oglesby L, et al. (2007)
Reduced exposure to PM10 and attenuated age-related decline in lung function.
New England Journal Medicine 357: 2338–2347.
11. Rahman I, Adcock IM (2006) Oxidative stress and redox regulation of lunginflammation in COPD. European Respiratory Journal 28: 219–242.
12. MacNee W (2005) Pulmonary and Systemic Oxidant/Antioxidant Imbalance inChronic Obstructive Pulmonary Disease. Proceedings of the American Thoracic
Society 2: 50–60.
13. Hall IP, Lomas DA (2010) The genetics of obstructive lung disease: big is
beautiful. Thorax 65: 760–761.
14. Silverman EK, Spira A, Pare PD (2009) Genetics and Genomics of Chronic
Obstructive Pulmonary Disease. Proceedings of the American Thoracic Society6: 539–542.
15. Smolonska J, Wijmenga C, Postma DS, Boezen HM (2009) Meta-analyses on
suspected chronic obstructive pulmonary disease genes: a summary of 20 years’
research. American Journal of Respiratory and Critical Care Medicine 180:618–631.
16. He JQ, Connett JE, Anthonisen NR, Pare PD, Sandford AJ (2004) Glutathione
S-transferase variants and their interaction with smoking on lung function.
American Journal of Respiratory and Critical Care Medicine 170: 388–394.
17. Hancock DB, Eijgelsheim M, Wilk JB, Gharib SA, Loehr LR, et al. (2010) Meta-
analyses of genome-wide association studies identify multiple loci associated withpulmonary function. Nature Genetics 42: 45–52.
18. Repapi E, Sayers I, Wain LV, Burton PR, Johnson T, et al. (2010) Genome-wide
association study identifies five loci associated with lung function. Nature
Genetics 42: 36–44.
PM10 and Tobacco Differently Affect Lung Function
PLoS ONE | www.plosone.org 10 July 2012 | Volume 7 | Issue 7 | e40175

19. Pillai SG, Ge D, Zhu G, Kong X, Shianna KV, et al. (2009) A genome-wide
association study in chronic obstructive pulmonary disease (COPD): identifica-tion of two major susceptibility loci. PLoS Genetics 5: e1000421.
20. Cho MH, Boutaoui N, Klanderman BJ, Sylvia JS, Ziniti JP, et al. (2010)
Variants in FAM13A are associated with chronic obstructive pulmonary disease.Nature Genetics 42: 200–202.
21. Wilk JB, Chen TH, Gottlieb DJ, Walter RE, Nagle MW, et al. (2009) A genome-wide association study of pulmonary function measures in the Framingham
Heart Study. PLoS Genetics 5: e1000429.
22. Artigas MS, Loth DW, Wain LV, Gharib SA, Obeidat M, et al. (2011) Genome-wide association and large-scale follow up identifies 16 new loci influencing lung
function. Nature Genetics. doi: 10.1038/ng.941.23. Obeidat Me, Wain LV, Shrine N, Kalsheker N, Artigas MS, et al. (2011) A
Comprehensive Evaluation of Potential Lung Function Associated Genes in theSpiroMeta General Population Sample. PLoS One 6: e19382.
24. Pillai SG, Kong X, Edwards LD, Cho MH, Anderson WH, et al. (2010) Loci
identified by genome-wide association studies influence different disease-relatedphenotypes in chronic obstructive pulmonary disease. American Journal of
Respiratory and Critical Care Medicine 182: 1498–1505.25. Ege MJ, Strachan DP, Cookson WO, Moffatt MF, Gut I, et al. (2011) Gene-
environment interaction for childhood asthma and exposure to farming in
Central Europe. The Journal of allergy and clinical immunology 127: 138–144,144 e131–134.
26. Thomas D (2010) Methods for Investigating Gene-Environment Interactions inCandidate Pathway and Genome-Wide Association Studies. Annual Review of
Public Health 31: 21–36.27. Le Marchand L, Wilkens LR (2008) Design Considerations for Genomic
Association Studies: Importance of Gene-Environment Interactions. Cancer
Epidemiology Biomarkers & Prevention 17: 263–267.28. Yang IA, Fong KM, Zimmerman PV, Holgate ST, Holloway JW (2008) Genetic
susceptibility to the respiratory effects of air pollution. Thorax 63: 555–563.29. Curjuric I, Imboden M, Schindler C, Downs SH, Hersberger M, et al. (2010)
HMOX1 and GST variants modify attenuation of FEF25–75% decline due to
PM10 reduction. European Respiratory Journal 35: 505–514.30. Siedlinski M, Postma DS, van Diemen CC, Blokstra A, Smit HA, et al. (2008)
Lung function loss, smoking, vitamin C intake, and polymorphisms of theglutamate-cysteine ligase genes. American Journal of Respiratory and Critical
Care Medicine 178: 13–19.31. Bouzigon E, Corda E, Aschard H, Dizier MH, Boland A, et al. (2008) Effect of
17q21 variants and smoking exposure in early-onset asthma. The New England
Journal of Medicine 359: 1985–1994.32. Van Durme YM, Eijgelsheim M, Joos GF, Hofman A, Uitterlinden AG, et al.
(2010) Hedgehog-interacting protein is a COPD susceptibility gene: theRotterdam Study. The European Respiratory Journal 36: 89–95.
33. Fridley BL, Biernacka JM (2011) Gene set analysis of SNP data: benefits,
challenges, and future directions. European Journal of Human Genetics 19:837–843.
34. Ackermann-Liebrich U, Kuna-Dibbert B, Probst-Hensch NM, Schindler C,Felber Dietrich D, et al. (2005) Follow-up of the Swiss Cohort Study on Air
Pollution and Lung Diseases in Adults (SAPALDIA 2) 1991–2003: methods andcharacterization of participants. Sozial- und Praventivmedizin 50: 245–263.
35. Martin BW, Ackermann-Liebrich U, Leuenberger P, Kunzli N, Stutz EZ, et al.
(1997) SAPALDIA: methods and participation in the cross-sectional part of theSwiss Study on Air Pollution and Lung Diseases in Adults. Sozial- und
Praventivmedizin 42: 67–84.36. Kunzli N, Ackermann-Liebrich U, Keller R, Perruchoud AP, Schindler C (1995)
Variability of FVC and FEV1 due to technician, team, device and subject in an
eight centre study: three quality control studies in SAPALDIA. Swiss Study onAir Pollution and Lung Disease in Adults. European Respiratory Journal 8: 371–
376.37. Kunzli N, Kuna-Dibbert B, Keidel D, Keller R, Brandli O, et al. (2005)
Longitudinal validity of spirometers–a challenge in longitudinal studies. Swiss
Medical Weekly 135: 503–508.38. American Thoracic Society (1995) Standardization of Spirometry, 1994 Update.
American Thoracic Society. American Journal of Respiratory and Critical CareMedicine 152: 1107–1136.
39. American Thoracic Society (1978) Epidemiology Standardization Project. e.c.American Thoracic Society. Recommended respiratory disease questionnaires
for use with adults and children in epidemiological research. The American
Review of Respiratory Disease 118: 7–52.40. Liu LJ, Curjuric I, Keidel D, Heldstab J, Kunzli N, et al. (2007) Characterization
of source-specific air pollution exposure for a large population-based Swisscohort (SAPALDIA). Environmental Health Perspectives 115: 1638–1645.
41. Moffatt MF, Gut IG, Demenais F, Strachan DP, Bouzigon E, et al. (2010) A
large-scale, consortium-based genomewide association study of asthma. TheNew England Journal of Medicine 363: 1211–1221.
42. Li Y, Willer CJ, Ding J, Scheet P, Abecasis GR (2010) MaCH: using sequence
and genotype data to estimate haplotypes and unobserved genotypes. GeneticEpidemiology 34: 816–834.
43. International HapMap Consortium (2005) A haplotype map of the humangenome. Nature 437: 1299–1320.
44. Ashburner M, Ball CA, Blake JA, Botstein D, Butler H, et al. (2000) Gene
ontology: tool for the unification of biology. The Gene Ontology Consortium.Nature Genetics 25: 25–29.
45. Elliott NA, Volkert MR (2004) Stress induction and mitochondrial localizationof Oxr1 proteins in yeast and humans. Molecular and Cellular Biology 24:
3180–3187.46. Kaimul Ahsan M, Nakamura H, Tanito M, Yamada K, Utsumi H, et al. (2005)
Thioredoxin-1 suppresses lung injury and apoptosis induced by diesel exhaust
particles (DEP) by scavenging reactive oxygen species and by inhibiting DEP-induced downregulation of Akt. Free Radical Biology & Medicine 39: 1549–
1559.47. Nickel C, Trujillo M, Rahlfs S, Deponte M, Radi R, et al. (2005) Plasmodium
falciparum 2-Cys peroxiredoxin reacts with plasmoredoxin and peroxynitrite.
Biological Chemistry 386: 1129–1136.48. Tomita M, Okuyama T, Katsuyama H, Hidaka K, Otsuki T, et al. (2006) Gene
expression in rat lungs during early response to paraquat-induced oxidativestress. International Journal of Molecular Medicine 17: 37–44.
49. Tseng CF, Huang HY, Yang YT, Mao SJ (2004) Purification of humanhaptoglobin 1–1, 2–1, and 2–2 using monoclonal antibody affinity chromatog-
raphy. Protein expression and Purification 33: 265–273.
50. Karolchik D, Hinrichs AS, Furey TS, Roskin KM, Sugnet CW, et al. (2004) TheUCSC Table Browser data retrieval tool. Nucleic Acids Research 32: D493–
496.51. Aulchenko Y, Struchalin M, van Duijn C (2010) ProbABEL package for
genome-wide association analysis of imputed data. BMC Bioinformatics 11:
134–134.52. Yu K, Li Q, Bergen AW, Pfeiffer RM, Rosenberg PS, et al. (2009) Pathway
analysis by adaptive combination of P-values. Genetic Epidemiology 33: 700–709.
53. Gauderman W, Morrison J (2006) QUANTO 1.1: A computer program forpower and sample size calculations for genetic-epidemiology studies. Available:
http://hydra.usc.edu/gxe. Accessed 2012 Jun 15.
54. Araujo JA, Nel AE (2009) Particulate matter and atherosclerosis: role of particlesize, composition and oxidative stress. Particle and Fibre Toxicology 6: 24.
55. Li N, Hao M, Phalen RF, Hinds WC, Nel AE (2003) Particulate air pollutantsand asthma. A paradigm for the role of oxidative stress in PM-induced adverse
health effects. Clinical Immunology 109: 250–265.
56. Li N, Kim S, Wang M, Froines J, Sioutas C, et al. (2002) Use of a stratifiedoxidative stress model to study the biological effects of ambient concentrated and
diesel exhaust particulate matter. Inhalation Toxicology 14: 459–486.57. Comandini A, Marzano V, Curradi G, Federici G, Urbani A, et al. (2010)
Markers of anti-oxidant response in tobacco smoke exposed subjects: a data-mining review. Pulmonary Pharmacology & Therapeutics 23(6): 482–92.
58. Faux SP, Tai T, Thorne D, Xu Y, Breheny D, et al. (2009) The role of oxidative
stress in the biological responses of lung epithelial cells to cigarette smoke.Biomarkers : Biochemical Indicators of Exposure, Response, and Susceptibility
to Chemicals 14 Suppl 1: 90–96.59. Aoshiba K, Tamaoki J, Nagai A (2001) Acute cigarette smoke exposure induces
apoptosis of alveolar macrophages. American Journal of Physiology - Lung
Cellular and Molecular Physiology 281: L1392–1401.60. Kim HP, Wang X, Chen ZH, Lee SJ, Huang MH, et al. (2008) Autophagic
proteins regulate cigarette smoke-induced apoptosis: protective role of hemeoxygenase-1. Autophagy 4: 887–895.
61. Slebos DJ, Ryter SW, van der Toorn M, Liu F, Guo F, et al. (2007)
Mitochondrial localization and function of heme oxygenase-1 in cigarettesmoke-induced cell death. American Journal of Respiratory Cell and Molecular
Biology 36: 409–417.62. van der Vaart H, Postma DS, Timens W, ten Hacken NH (2004) Acute effects of
cigarette smoke on inflammation and oxidative stress: a review. Thorax 59: 713–721.
63. Kraft P (2008) Curses–winner’s and otherwise–in genetic epidemiology.
Epidemiology 19: 649–651; discussion 657–648.64. Sacks JD, Stanek LW, Luben TJ, Johns DO, Buckley BJ, et al. (2011) Particulate
matter-induced health effects: who is susceptible? Environmental HealthPerspectives 119: 446–454.
PM10 and Tobacco Differently Affect Lung Function
PLoS ONE | www.plosone.org 11 July 2012 | Volume 7 | Issue 7 | e40175