Development and validation of two phantoms for quality ...
13
ISSSD 2016 September 24 to 28 th , 2016. Tuxtla Gutiérrez, Chiapas. México. _________________________________________________________________________________________________ 1 Proccedings of the ISSSD 2016 Vol. 2 Development and validation of two phantoms for quality control in cone-beam CT Wilson Otto Gomes Batista 1 1 Instituto Federal da Bahia Rua Emidio dos Santos s/n. Barbalho 40301-015 - Salvador, Bahia, Brasil [email protected] ABSTRACT The cone beam computed tomography (CBCT) was introduced into the market in the late 90s and being a relatively new technology, also no well-established quality control protocols. There are currently projects to standardize the use of CBCT. The SEDENTEXCT project was created with the goal of developing guidelines for CBCT, including the development of a phantom for quality control it is proposed. This study aimed at the development and validation of the models of phantom: CQ_IFBA_01 e CQ_IFBA_02, the first filled with water and the second fully with solid structure in PMMA. Both models allow, otherwise the European phantom - SEDENTEXCT, its use in various models of CBCT, independent of the size of the field of view. The two phantom used to evaluate seven parameters of quality control are: intensity or average value of pixels of five different plastics, signal to noise ratio, resolution, low contrast, spatial resolution, the accuracy of distances on the z axis, the geometric distortion and image uniformity. The spatial resolution is a critical parameter that differs significantly from the other types of scan, and in these two phantom can be evaluated by two different methods: MTF obtained by Fourier transformation of the function LSF (line spread function) and / or by analysis visual image to a pattern of bars up to 16 pl/cm. Validation was performed in three models CBCT: Kodak 9000, i-CAT Classical and Orthophos XG 3D. All imaging protocols were characterized dosimetrically with solid state sensors to correlate with the perfect operation. These models were selected by different manufacturers have different characteristics as FOV, maximum voltage, slice thickness and patient positioning mode. The two of phantom models were viable and also showed compliance with the specifications and data available in the literature. We conclude the feasibility of the two phantom models, and model option will be linked to the practicality positioning equipment. Keywords: Phantoms for quality control; Cone Beam CT.
-
Upload
khangminh22 -
Category
Documents
-
view
2 -
download
0
Transcript of Development and validation of two phantoms for quality ...
ISSSD 2016 September 24 to 28
th, 2016. Tuxtla Gutiérrez, Chiapas. México.
_________________________________________________________________________________________________
1 Proccedings of the ISSSD 2016 Vol. 2
Development and validation of two phantoms
for quality control in cone-beam CT
Wilson Otto Gomes Batista1
1 Instituto Federal da Bahia
Rua Emidio dos Santos s/n. Barbalho
40301-015 - Salvador, Bahia, Brasil
ABSTRACT
The cone beam computed tomography (CBCT) was introduced into the market in the late 90s and
being a relatively new technology, also no well-established quality control protocols. There are
currently projects to standardize the use of CBCT. The SEDENTEXCT project was created with the
goal of developing guidelines for CBCT, including the development of a phantom for quality control
it is proposed. This study aimed at the development and validation of the models of phantom:
CQ_IFBA_01 e CQ_IFBA_02, the first filled with water and the second fully with solid structure in
PMMA. Both models allow, otherwise the European phantom - SEDENTEXCT, its use in various
models of CBCT, independent of the size of the field of view. The two phantom used to evaluate
seven parameters of quality control are: intensity or average value of pixels of five different plastics,
signal to noise ratio, resolution, low contrast, spatial resolution, the accuracy of distances on the z
axis, the geometric distortion and image uniformity. The spatial resolution is a critical parameter that
differs significantly from the other types of scan, and in these two phantom can be evaluated by two
different methods: MTF obtained by Fourier transformation of the function LSF (line spread
function) and / or by analysis visual image to a pattern of bars up to 16 pl/cm. Validation was
performed in three models CBCT: Kodak 9000, i-CAT Classical and Orthophos XG 3D. All imaging
protocols were characterized dosimetrically with solid state sensors to correlate with the perfect
operation. These models were selected by different manufacturers have different characteristics as
FOV, maximum voltage, slice thickness and patient positioning mode. The two of phantom models
were viable and also showed compliance with the specifications and data available in the literature.
We conclude the feasibility of the two phantom models, and model option will be linked to the
practicality positioning equipment.
Keywords: Phantoms for quality control; Cone Beam CT.
ISSSD 2016 September 24 to 28
th, 2016. Tuxtla Gutiérrez, Chiapas. México.
_________________________________________________________________________________________________
2 Proccedings of the ISSSD 2016 Vol. 2
1. INTRODUCTION
Computerized Tomography technology Cone Beam - CBCT was introduced in the late
1990s in dental radiology (Sedentexct, 2012). However, this imaging modality was
introduced in dental radiology, unaccompanied tools destined to check service to image
quality standards (Bamba et al., 2013; Batista et al., 2013; Pauwels et al., 2011).
The Cone Beam Computed Tomography (CBCT) is a device that generates tomographic
images as consists in using a two-dimensional array of detectors, whereas the fan shaped
beam tomography uses a one-dimensional array detectors. Another fundamental
characteristic is the isotropy of the volume elements, Voxel. Thus, the images generated in
cone beam CT scanners allow geometrically accurate measurements on any plane.
The practice and periodic verification of radiology image quality are essential for the safety
of diagnosis. In this sense, all other modalities in radiology have protocols and tools for the
image quality control realization (Commission, 1999; Engen et al., 2005).
At present scientific publications and technical initiatives have suggested to some phantom
models for quality control in cone beam CT (Commission, 1999; Pauwels et al., 2011;
Torgersen et al., 2014). However, the variety of models and technological concepts between
the different manufacturers require the development of a phantom that meets all possibilities
including field of view of size, FOV; angle of rotation and FOVs combinations. An initiative
was presented in 2013 with a model consisting of objects inserted in a square block,
parallelepiped, of PMMA immersed in water (Batista et al., 2013). This format,
parallelepiped does not allow its use in combined FOVs.
Similarly tomography beam fan-shaped, MSCT, the minimum parameters necessary for
image quality assurance are: grayscale in different materials; image uniformity; resolution
low contrast; spatial resolution with high contrast; contrast scale (Commission, 1999). Here,
it is important to point out that the Hounsfield scale, important scale set to MSCT, is not
valid for cone beam tomography. In addition to CBCT is essential to check the geometric
distortion; linear measurements in three dimensions; angular measurements. And replacing
the Hounsfield scale, is evaluated, the intensity of the pixel value or as commonly referred
to, the average value of the pixel (MPV) (Suomalainen et al., 2009).
In this context the main objective of this study is to present two models of phantoms for the
quality control assessments in cone beam tomography. These phantoms enable the
evaluation of all the parameters mentioned above in any FOV size available.

ISSSD 2016 September 24 to 28
th, 2016. Tuxtla Gutiérrez, Chiapas. México.
_________________________________________________________________________________________________
3 Proccedings of the ISSSD 2016 Vol. 2
2. MATERIALS AND METHODS
Two phantoms were developed with modular characteristics and essentially the means of
support. In the first objects, modules are fixed, stacked and positioned immersed in water.
The second model modules are positioned on PMMA and these disks are stacked to form the
simulator. Both modular phantoms to assess the following parameters associated with the
evaluation of image quality: (i) pixel value of the intensity or average pixel value (MPV);
(ii) grayscale range in five different materials; (iii) uniformity of the image; (iv) resolution at
low contrast; (v) spatial resolution in high contrast: visually and analytically through the
MTF; (vi) geometric distortion; (vii) evaluation of linear measurements in three dimensions
and angular measurements; (viii) contrast scale. Figure 1 shows the pattern 1, CQ-01-IFBA
with body acrylic tube and fill with water.
Figure 1 – Phantom CQ-01-IFBA model with filling of water. (a) mounted phantom showing the
structure and the bottom disk for evaluation grayscale FOV large diameter and geometric
distortion; (b) set of assessment modules; (c) evaluation module grayscale; (d) module for spatial
resolution evaluation with bar patterns

ISSSD 2016 September 24 to 28
th, 2016. Tuxtla Gutiérrez, Chiapas. México.
_________________________________________________________________________________________________
4 Proccedings of the ISSSD 2016 Vol. 2
Figure 2 – Phantom of solid structure CQ-02-IFBA model. (a) disk for evaluation grayscale FOV of large diameter and geometric distortion; (b) evaluation module grayscale; (c) module for evaluation of resolution in low contrast, geometric distortion and dimension in direão Z and obtaining the transfer of modulation function; (d) evaluation module mounted contrast scale; (e) Resolution evaluation module mounted in low contrast uiniforme disk PMMA and (f) Resolution assessment module in high contrast mounted in uniform disk of PMMA.
2.1- Structure of phantoms
Both have cylindrical body. The IFBA-CQ-01 model has structure of tube PMMA with outside
diameter 150 mm with 5.0 mm of wall. The IFBA-CQ-02 model has a solid structure PMMA with
150 mm diameter. Also, both have base with support for attachment to tripod and standard thread ¼
inch.
Evaluation modules
Module for evaluation of VMP and image uniformity
Homogeneous cross section PMMA or water area can be used to evaluate image uniformity
and PMV in PMMA or water.
The uniformity of the image is calculated according to the following expression, Equation 1.
∑
(1)
(a)
(b)
(c)
(d)
(e)
(f)

ISSSD 2016 September 24 to 28
th, 2016. Tuxtla Gutiérrez, Chiapas. México.
_________________________________________________________________________________________________
5 Proccedings of the ISSSD 2016 Vol. 2
Other settings for image uniformity can be applied, as an example the image uniformity in
CT can be obtained from the grayscale profile assessment in a uniform area, Equations 2 and
3.
(2)
(3)
Figure 3 shows typical image evaluation for uniformity as defined by Equation 1, Figure 3
(a) and using the Integral Uniformity definitions and non-integral, equations 2 and 3, Figure
3 (b).
Figure 3 – Module for evaluation of image uniformity. This section can be a homogeneous area of
water or PMMA
Module for evaluation scale grayscale
This module consists of a disc PMMA, Figure 1 (c) and Figure 2 (b), containing five
different materials: polypropylene, nylon, Delrin, PTFE and PVC. In this module you can
(a) (b)

ISSSD 2016 September 24 to 28
th, 2016. Tuxtla Gutiérrez, Chiapas. México.
_________________________________________________________________________________________________
6 Proccedings of the ISSSD 2016 Vol. 2
evaluate the intensity of the pixel in terms of shades of gray, verify that the value with the
manufacturer's specifications and establish the baseline.
Low contrast resolution
PMMA cylindrical module, Figure 2 (c) with a face containing grooves with a depth of 2
mm and equal to 5 mm in diameter; 4 mm; 3 mm; 2 mm; 1.5 mm; 1 mm and 0.5 mm. These
grooves are filled with material with linear attenuation coefficient close to the linear
attenuation coefficient of PMMA for the energy range used in cone beam tomography.
Spatial resolution in high contrast: visually and analytically through the MTF
There are three alternatives for evaluation of the spatial resolution (i) visually by evaluating
the image of a pattern of bars machined in the face of a PMMA disc with the following sets,
Figure 1 (d): 5 pl / cm; 6 pl / cm; 8 pl / cm; 10 pl / cm; 12 pl / cm; 13 pl / cm; 14 pl / cm; 15
pl / cm and 16 pl / cm; (ii) analytically by obtaining the EFS function (Edge Spread
Function), Figure 2 (c) and calculate the MTF (Modulation Transfer Function). EFS is
obtained by evaluating the image on a PMMA / PTFE interface disposed on one of the discs
of PMMA (iii) analytically by obtaining the PFS function (Point Spread Function) and
calculate the MTF (Modulation Transfer Function). PFS is obtained by evaluating the image
of a copper wire placed inside a silicone billet in PMMA disk.
The profile obtained from the discontinuity (steel wire / PMMA) can be adjusted by a
Gaussian function using, for example, the equation, Equation 4.
( )
√
(4)
Where is a parameter associated with the width of the curve and is the parameter to be
adjusted. And x is the position in centimeters. In practical terms, as the profile obtained is
not centered at x = 0 and not the Gaussian curve is normalized, the adjustment may be
effected using the expression below Equation 5.
( ) ( ) ( )
(5)
ISSSD 2016 September 24 to 28
th, 2016. Tuxtla Gutiérrez, Chiapas. México.
_________________________________________________________________________________________________
7 Proccedings of the ISSSD 2016 Vol. 2
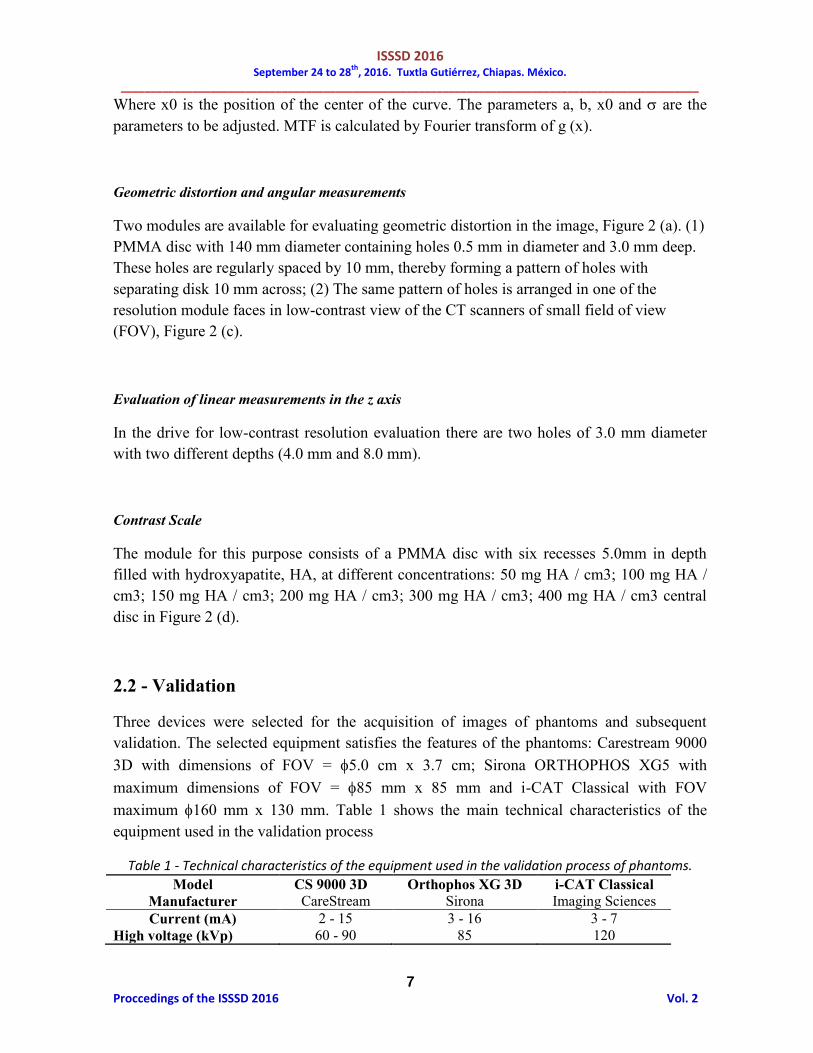
Where x0 is the position of the center of the curve. The parameters a, b, x0 and are the
parameters to be adjusted. MTF is calculated by Fourier transform of g (x).
Geometric distortion and angular measurements
Two modules are available for evaluating geometric distortion in the image, Figure 2 (a). (1)
PMMA disc with 140 mm diameter containing holes 0.5 mm in diameter and 3.0 mm deep.
These holes are regularly spaced by 10 mm, thereby forming a pattern of holes with
separating disk 10 mm across; (2) The same pattern of holes is arranged in one of the
resolution module faces in low-contrast view of the CT scanners of small field of view
(FOV), Figure 2 (c).
Evaluation of linear measurements in the z axis
In the drive for low-contrast resolution evaluation there are two holes of 3.0 mm diameter
with two different depths (4.0 mm and 8.0 mm).
Contrast Scale
The module for this purpose consists of a PMMA disc with six recesses 5.0mm in depth
filled with hydroxyapatite, HA, at different concentrations: 50 mg HA / cm3; 100 mg HA /
cm3; 150 mg HA / cm3; 200 mg HA / cm3; 300 mg HA / cm3; 400 mg HA / cm3 central
disc in Figure 2 (d).
2.2 - Validation
Three devices were selected for the acquisition of images of phantoms and subsequent
validation. The selected equipment satisfies the features of the phantoms: Carestream 9000
3D with dimensions of FOV = 5.0 cm x 3.7 cm; Sirona ORTHOPHOS XG5 with
maximum dimensions of FOV = 85 mm x 85 mm and i-CAT Classical with FOV
maximum 160 mm x 130 mm. Table 1 shows the main technical characteristics of the
equipment used in the validation process
Table 1 - Technical characteristics of the equipment used in the validation process of phantoms.
Model CS 9000 3D Orthophos XG 3D i-CAT Classical
Manufacturer CareStream Sirona Imaging Sciences
Current (mA) 2 - 15 3 - 16 3 - 7
High voltage (kVp) 60 - 90 85 120

ISSSD 2016 September 24 to 28
th, 2016. Tuxtla Gutiérrez, Chiapas. México.
_________________________________________________________________________________________________
8 Proccedings of the ISSSD 2016 Vol. 2
Size of FOV (mm) 50 x 37 85 x 85 160 x 130
Options of voxel (mm) 0.076; 0.1; 0.2 0.160 0.2; 0.25; 0.3; 0.4

ISSSD 2016 September 24 to 28
th, 2016. Tuxtla Gutiérrez, Chiapas. México.
_________________________________________________________________________________________________
9 Proccedings of the ISSSD 2016 Vol. 2
3. RESULTS MPV Evaluation
The results for all parameters, when possible, are compared with some national regulations
(Public Health England, 2010) and with manufacturers' specifications.
In Table 2 is shown the data concerning the evaluation of the intensity value of the pixel or
MPV the five different materials. These results reflect average values for the different voxel
sizes.
Table 2 – Pixel value of intensity or MPV for five different materials.
Materials Orthophos XG 3D CS 9000 3D i-CAT Classical
PVC 604 975 700
Teflon 431 427 577
Delrin 182 -29 81
Nylon 55 -20 -141
Polypropylene -26 23 -297
This parameter is dependent on the value of kVp and quality of the radiation beam, HVL, so
no reference values for comparison or compliance check. This check has the main purpose
to verify compliance on the manufacturer's specification when exist and establish a baseline.
Figure 4 shows an example of the regions of interest, ROI, used in the measurements.
Figure 4 – Selection of ROIs for pixel intensity measurement on different materials.
Spatial resolution in high-contrast and low-contrast resolution
The evaluation of spatial resolution with high contrast presented below refers to visual
assessment of the bar pattern. Other analytical options and based on obtaining the MTF are
not presented here. And there is no limit specification for detection capability, resolution in
low contrast.

ISSSD 2016 September 24 to 28
th, 2016. Tuxtla Gutiérrez, Chiapas. México.
_________________________________________________________________________________________________
10 Proccedings of the ISSSD 2016 Vol. 2
Table 3 – Spatial resolution evaluation in high contrast lp / cm.
Equipment Orthophos XG 3D CS 9000 3D i-CAT Classical
Voxel size Spatial resolution evaluation in high contrast máximum lp/cm
0.076 15 (n/a)
0.100 14 (n/a) 10 (No)
0.160 14 (Yes)
0.200 14 (n/a) 10 (No)
0.250
0.300 8 (No)
Low-contrast resolution
Smaller diameter
visualized 1.0 mm (n/a) 0.5 mm (n/a) 1.0 mm (n/a)
Yes - in accordance with the manufacturer's specifications; No - not as and n / a - not
applicable.
Figure 5 shows an image with purpose to illustrate the visual interpretation of bar patterns.
Figure 5 – Image obtained with Carestream CS 9000 3D of module containing standard bars.
Geometric distortion and linear dimensions along the direction z.
All this equipment meets the specifications of the manufacturers and the accuracy of
measurements of distances along the z axis and the geometric distortion in the xy plane of
the image. The tolerance established by manufacturers and rules of the Uunited Kingdom
(Public Health England, 2010) is 0.5 mm for geometrical distortion and linear dimension
along the z axis. Figure 6 (a) shows in detail the holes with a depth of 4.0 mm and 8.0 mm
for the evaluation of linear dimensions and Figure 6 (b) illustrates the geometric distortion
evaluation.

ISSSD 2016 September 24 to 28
th, 2016. Tuxtla Gutiérrez, Chiapas. México.
_________________________________________________________________________________________________
11 Proccedings of the ISSSD 2016 Vol. 2
Image Uniformity
Particularly for small FOVs, 50 mm x 37 mm uniformity has not been evaluated. So just for
the images acquired in i-CAT Classical equipment and Sirona ORTHOPHOS XG5 it was
assessed. Table 4 shows the values of evaluation of the image uniformity, the uniformity and
non-integral uniformity. And, in Figure 7 (a) is an example of the ROIs and Figure 7 (b) a
profile for the evaluation of uniformity and non-integral uniformity.
Table 4 – Evaluation of uniform, non-uniform integral and integral uniformity.
Equipment Orthophos XG 3D i-CAT Classical1
Uniformity 11% (Yes) 43% (Yes)
non-integral uniformity 8% (Yes) 27% (Yes)
integral uniformity 92% (Yes) 73% (Yes)
Yes - according to the UK's recommendations. 1 only in accordance with the manufacturer's
specifications.
Figure 6 – Image exemplifying measuring distances along the z axis and geometric distortion module.
Figure 7 - Example of evaluation of image uniformity.

ISSSD 2016 September 24 to 28
th, 2016. Tuxtla Gutiérrez, Chiapas. México.
_________________________________________________________________________________________________
12 Proccedings of the ISSSD 2016 Vol. 2
4. CONCLUSION
On the results, i.e. the images acquired and evaluated in three models of CT scanners can be
concluded that the developed phantoms models are suitable for use in quality control checks
in dental radiology with cone beam CT.
REFERENCES
Bamba, J., Araki, K., Endo, A., Okano, T., 2013. Image quality assessment of three cone
beam CT machines using the SEDENTEXCT CT phantom. Dentomaxillofacial
Radiology 42. doi:10.1259/dmfr.20120445
Batista, W.O., Navarro, M.V.T., Maia, A.F., 2013. Development and implementation of a
low-cost phantom for quality control in cone beam computed tomography. Radiation
protection dosimetry 157, 552–60. doi:10.1093/rpd/nct177
Commission, E., 1999. European Guidelines on Quality Criteria for Computed Tomography
European Guidelines on Quality Criteria. Europe 1–71.
Engen, R. Van, Young, K.C., Bosmans, H., 2005. The European protocol for the quality
control of the physical and technical aspects of mammography screening. Part B:
Digital mammography 1–114.
Pauwels, R., Stamatakis, H., Manousaridis, G., Walker, A., Michielsen, K., Bosmans, H.,
Bogaerts, R., Jacobs, R., Horner, K., Tsiklakis, K., SEDENTEXCT Project
Consortium, 2011. Development and applicability of a quality control phantom for
dental cone-beam CT. Journal of applied clinical medical physics / American College
of Medical Physics 12, 3478. doi:10.1120/jacmp.v12i4.3478
Public Health England, 2010. Radiation: protection and safety guidance for dental cone
beam CT equipment. London.

ISSSD 2016 September 24 to 28
th, 2016. Tuxtla Gutiérrez, Chiapas. México.
_________________________________________________________________________________________________
13 Proccedings of the ISSSD 2016 Vol. 2
Sedentexct, 2012. Cone Beam CT for Dental and Maxillofacial Radiology (Evidence-based
Guidelines). Radiation protection. European commission 156.
Suomalainen, A., Kiljunen, T., Käser, Y., Peltola, J., Kortesniemi, M., 2009. Dosimetry and
image quality of four dental cone beam computed tomography scanners compared with
multislice computed tomography scanners. Dentomaxillofacial Radiology 38, 367–378.
doi:10.1259/dmfr/15779208
Torgersen, G.R., Hol, C., M??ystad, A., Hell??n-Halme, K., Nilsson, M., 2014. A phantom
for simplified image quality control of dental cone beam computed tomography units.
Oral Surgery, Oral Medicine, Oral Pathology and Oral Radiology 118, 603–611.
doi:10.1016/j.oooo.2014.08.003