Juvenile Justice Policy and Oversight Committee - University ...
Development and validation of a bioenergetics model for
juvenile and adult burbot
J.-P. J. PAAKKONEN*, O. TIKKANEN AND J. KARJALAINEN
Department of Biological and Environmental Science, University of Jyvaskyla,P. O. Box 35, Jyvaskyla FIN-40351, Finland
(Received 2 July 2002, Accepted 23 July 2003)
Oxygen consumption of juvenile and adult burbot Lota lota was measured in an intermittent-flow
respirometer to determine the effect of temperature and fish body mass on metabolic rate. These
results were combined with data from earlier experiments and the ‘Wisconsin bioenergetics’ model
was constructed. The model was validated under laboratory conditions by comparing observed
and predicted food consumption and growth of burbot fed on dead vendace Coregonus albula.
There was a good correspondence between observed and estimated growth and food consumption
under experimental conditions: the mean absolute per cent errors of growth and food consumption
were 4�8 and 24�0%. Estimated values with the new model were an improvement over the Atlantic
cod Gadus morhuamodel previously used for burbot. In the field, the reliability of food consump-
tion estimates was verified by using polychlorinated biphenyls (PCB) accumulation as an indirect
indicator of the food consumption rate. The total PCB concentration of nine out of 13 burbot was
estimated accurately. Thus, the burbot model produced good estimates of food consumption, even
under field conditions. # 2003 The Fisheries Society of the British Isles
Key words: bioenergetics; burbot; Lota lota; oxygen consumption; PCB.
INTRODUCTION
The burbot Lota lota L., the only true freshwater gadoid, is distributed through-out the Holarctic region (McPhail & Paragamian, 2000). The burbot is anocturnal bottom dwelling fish that is often found at temperatures <13� Cand is the top predator in several environments. The biology of burbot is stillpoorly understood, although several studies on juvenile and adult burbot haveexamined their physiology (Paakkonen & Marjomaki, 1997, 2000; Johnsonet al., 1999) and ecology (Carl, 1995; Wang & Appenzeller, 1998; Fischer,1999, 2000a, b; Paragamian et al., 1999; Hofmann & Fischer, 2001). Since thediet of burbot overlaps that of other piscivorous species, a question has beenraised whether the burbot competes for food with economically valuable fishspecies (Carl, 1992, 1995; Edsall et al., 1993; Rudstam et al., 1995; Fratt et al.,1997; Tolonen et al., 1999). Due to the lack of information on burbot feed-ing processes and the effect of temperature on its physiology, estimates of food
*Author to whom correspondence should be addressed. Tel.: þ358 142602338; fax: þ358 142602321;
email: [email protected]
Journal of Fish Biology (2003) 63, 956–969
doi:10.1046/j.1095-8649.2003.00203.x,availableonlineathttp://www.blackwell-synergy.com
956# 2003TheFisheries Society of theBritish Isles
consumption rates have been based on the physiological variables of marinegadoids (Rudstam et al., 1995). Therefore, a bioenergetics model based on physio-logical variables determined for this widespread species is needed to estimate foodconsumption of burbot populations in freshwater food webs.Bioenergetics quantifies the exchanges and transformations of energy and
matter between organisms and their environment. With fish bioenergeticsmodels, food consumption can be estimated from the growth rates of individualfish. Modelling has proven useful in estimating the food consumption of severalfish species (Kitchell et al., 1977; Stewart et al., 1983; Hewett & Johnson, 1992;Rudstam et al., 1995; Karjalainen et al., 1997).In this study, a bioenergetics model was constructed for burbot using the
‘Wisconsin-type model’ developed by Kitchell et al. (1977) and Hewett &Johnson (1992). Construction of the model requires the experimental derivationof the main components (rate of metabolism, waste production and maximumfood consumption) of the balanced energy budget of fishes (Winberg, 1956;Kitchell et al., 1977). Information from previous work (Paakkonen & Lyytikainen,2000; Paakkonen & Marjomaki, 2000) was combined with new measure-ments of the metabolism and temperature tolerance of adult and juvenileburbot. After model construction, predictions of food consumption derivedfrom observed growth by the new and previous (Rudstam et al., 1995) burbotmodel were compared with food consumption observed under experimentalconditions. The experiments were independent of those used for variabledevelopment, thereby allowing the assessment of model performance and its suit-ability for estimating food consumption in the burbot, a sedentary, piscivorous fishspecies. The reliability of food consumption estimates was also verified in the fieldby using polychlorinated biphenyls (PCB) accumulation as an indirect indicator ofthe individual food consumption rate. Multiple approaches, including field andexperimental testing, can allow for a reasonably thorough evaluation of fishbioenergetics models (Madenjian et al., 2000).
MATERIALS AND METHODS
RESPIROMETRY
Juvenile burbot (fresh mass 5�9–12�3 g, n¼ 37) were electrofished from Lake Konnevesi(62�370 N; 26�210 E), central Finland, in August and September 2000. Captured fish weretransported to the laboratory at the University of Jyvaskyla, where they were held inaquaria and fed on earthworms before experiments. For oxygen consumption meas-urements, one fish was placed in each respirometry chamber. Oxygen consumption ofjuvenile burbot was studied at 10, 12, 14, 16, 18, 20 and 22� C. Water temperature fromthe rearing temperature to the experimental temperature was changed at a maximum of2� Cday�1. Fish were held for 24 h at the experimental temperature prior to measure-ments being taken and no long-term acclimation to the experimental temperature wascarried out. All measurement sessions lasted 24 h and fish were killed with an overdose ofanaesthetic (MS-222) and weighed after the sessions. Fish age was determined from theotoliths: two of the fish were 0 years and the rest were 1 year.Adult burbot (fresh mass 75�2–856�6 g, n¼ 12) were caught by trap nets from Lake
Paijanne (62�100 N; 25�450 E), central Finland, during the spawning season in February–March. The burbot were held in the laboratory at the University of Jyvaskyla in 1m3
steel tanks at 2–4� C and were fed once a week on dead vendace Coregonus albula (L.).Prior to the experiment, the fish were moved to acclimation tanks where they were
BIOENERGETICS OF BURBOT 957
# 2003TheFisheries Society of theBritish Isles, Journal of FishBiology 2003, 63, 956–969
acclimated for 2–3 days to the initial experimental temperature. Food was offered to theburbot during acclimation, but only some fish ate. Burbot were weighed individuallybefore transfer to the respirometry chambers (one fish per chamber). Oxygen consump-tion measurements were taken at 7, 13, 18 and 25� C. The measurement session at 7� Clasted 120 h and the remaining sessions took 48 h each. After a measurement session theburbot were transferred to the acclimation tank and were allowed to acclimate to the nextexperimental temperature for 2–3 days. The maximum rate of temperature change was3� Cday�1. Two burbot which escaped and died during the acclimation were replacedwith new individuals. In addition, data from a previous investigation (Paakkonen &Lyytikainen, 2000) of oxygen consumption of adult burbot at 2�1� C (n¼ 19) werereanalysed and used in this study.
Oxygen consumption of burbot was measured in an intermittent-flow respirometerequipped with a polarographic oxygen sensor (YSI 5750). The respirometer system includedthree acrylic chambers with two different volumes of 147–148 and 3980–8780ml for juvenileand adult burbot, respectively. Oxygen consumption in each chamber was recorded for 15minevery hour and the average rate during this period extrapolated to obtain an hourly value. Theoxygen electrode chamber and the fish chambers were flushed with fully aerated water for 15and 45min, respectively, every hour. The oxygen consumption of the empty respirometerchambers (without fish) were measured before and after fish measurements and the bacterialconsumption was subtracted from the total oxygen decline. The routine rate of oxygenconsumption (Rr; mmolg�1 h�1) was the average of all hourly measurements (n¼ 18), exclud-ing the three highest and three lowest values during experiment which were used to calculatemaximum andminimum rates of oxygen consumption (Rmax andRmin, respectively). The flowrate of water in the chambers was low and in this respect the system was almost static.
CONSTRUCTION OF THE BURBOT MODEL
A bioenergetics model was constructed for burbot in the framework of the Fish Bio-energetics 3.0 software (Wisconsin-type model originally developed by Hewett & Johnson,1992). The Wisconsin model requires the mass and temperature dependence of three maincomponents (maximum food consumption, metabolism and production of wastes) to beformulated mathematically from experimental data. The present maximum food con-sumption functions were based on earlier experiments examining the feeding of burbot atdifferent temperatures (Paakkonen & Marjomaki, 2000). Water temperatures rangedfrom 2�4 to 23�4� C and fresh masses of fish from 104 to 353 g. These experimentaldata were used to fit the maximum consumption (Cmax) function for burbot:Cmax¼ aMbf(T), where M is the mass of burbot (g), a is intercept of the allometric massfunction, b is the slope of the allometric mass function and f(T) is dome-shaped tem-perature dependence function (Kitchell et al., 1977). The f(T) is defined as:
fðTÞ¼ ðTmaxC�TÞðTmaxC�ToptCÞ�1h i 0�0025 z2
ffiffiffiffiffiffiffiffiffiffiffiffiffiffiffiffið1þ40y�1Þ
p� �2n o0�0025 z2
ffiffiffiffiffiffiffiffiffiffiffiffiffiffiffiffið1þ40y�1Þ
p� �2n oðTmaxC�TÞðTmaxC�ToptCÞ�1½ �
������
e ,
where TmaxC is the maximum water temperature above which consumption ceases, ToptC isthe optimum water temperature and T is water temperature. A ToptC temperature of 14� Cfrom previous feeding experiment was used (Paakkonen & Marjomaki, 2000).
Parameters Z and Y are defined as: Z¼ ln(CQ)(TmaxC�ToptC) and Y¼ ln(CQ)(TmaxC�ToptCþ2), where CQ is theQ10 rate.
Metabolic cost functions were derived from the respirometry data by the equation:Rrtm¼ aMbf(T)ACT, where Rrtm is the mass-specific respiration rate (gO2g
�1day�1), M is fishmass (g), f(T) is the temperature dependence function, ACT is an activity multiplier and a and bare fitted constants. The temperature dependence function [f(T), Kitchell et al., 1977] is defined
as: fðTÞ ¼ ðTlethal �TÞðTlethal �ToptRÞ�1h i 0�0025 z2
ffiffiffiffiffiffiffiffiffiffiffiffiffiffiffiffið1þ40y�1Þ
p� �2n o0�0025 z2
ffiffiffiffiffiffiffiffiffiffiffiffiffiffiffiffið1þ40y�1Þ
p� �2n oðTlethal�TÞðTlethal�ToptRÞ�1½ �
������
e ,
where Tlethal is the lethal water temperature (� C), ToptR is the optimum watertemperature for respiration and T is water temperature. Parameters Z and Y are definedas: Z¼ ln(RQ)(Tlethal�ToptR) and Y¼ ln(RQ)(Tlethal�ToptRþ 2), where RQ is the Q10
rate for respiration.
958 J . -P . J . P A AKKONEN ET AL .
# 2003TheFisheries Society of theBritish Isles, Journal of FishBiology 2003, 63, 956–969
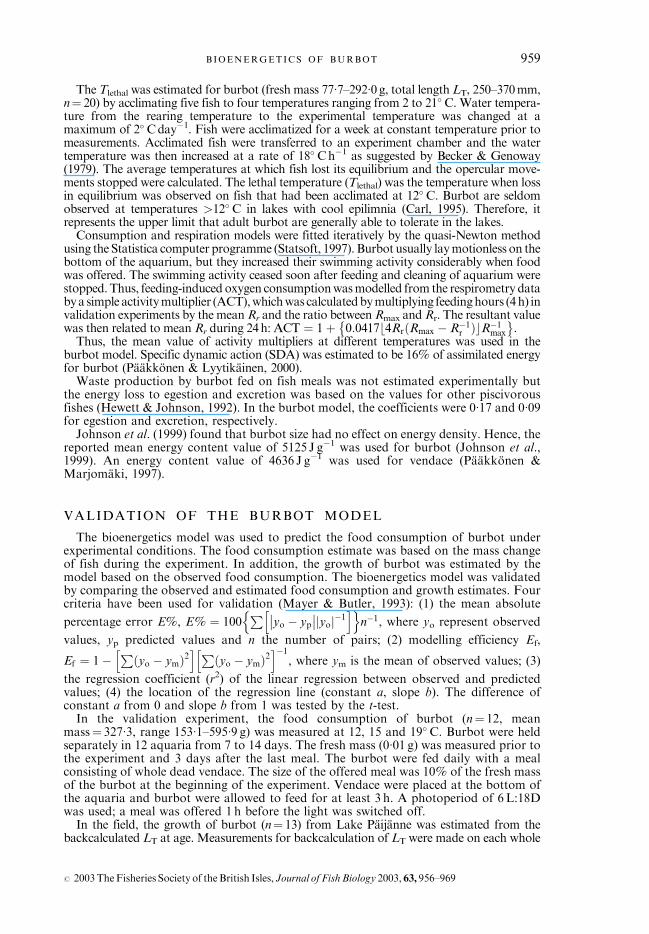
The Tlethal was estimated for burbot (fresh mass 77�7–292�0g, total length LT, 250–370mm,n¼ 20) by acclimating five fish to four temperatures ranging from 2 to 21� C. Water tempera-ture from the rearing temperature to the experimental temperature was changed at amaximum of 2� Cday�1. Fish were acclimatized for a week at constant temperature prior tomeasurements. Acclimated fish were transferred to an experiment chamber and the watertemperature was then increased at a rate of 18� Ch�1 as suggested by Becker & Genoway(1979). The average temperatures at which fish lost its equilibrium and the opercular move-ments stopped were calculated. The lethal temperature (Tlethal) was the temperature when lossin equilibrium was observed on fish that had been acclimated at 12� C. Burbot are seldomobserved at temperatures >12� C in lakes with cool epilimnia (Carl, 1995). Therefore, itrepresents the upper limit that adult burbot are generally able to tolerate in the lakes.Consumption and respiration models were fitted iteratively by the quasi-Newton method
using the Statistica computer programme (Statsoft, 1997). Burbot usually laymotionless on thebottom of the aquarium, but they increased their swimming activity considerably when foodwas offered. The swimming activity ceased soon after feeding and cleaning of aquarium werestopped.Thus, feeding-induced oxygen consumptionwasmodelled from the respirometry databya simple activitymultiplier (ACT),whichwas calculatedbymultiplying feedinghours (4h) invalidation experiments by the meanRr and the ratio betweenRmax andRr. The resultant valuewas then related to mean Rr during 24h:ACT ¼ 1þ 0:0417b4RrðRmax � R�1
r ÞcR�1max
� �.
Thus, the mean value of activity multipliers at different temperatures was used in theburbot model. Specific dynamic action (SDA) was estimated to be 16% of assimilated energyfor burbot (Paakkonen & Lyytikainen, 2000).Waste production by burbot fed on fish meals was not estimated experimentally but
the energy loss to egestion and excretion was based on the values for other piscivorousfishes (Hewett & Johnson, 1992). In the burbot model, the coefficients were 0�17 and 0�09for egestion and excretion, respectively.Johnson et al. (1999) found that burbot size had no effect on energy density. Hence, the
reported mean energy content value of 5125 J g�1 was used for burbot (Johnson et al.,1999). An energy content value of 4636 J g�1 was used for vendace (Paakkonen &Marjomaki, 1997).
VALIDATION OF THE BURBOT MODEL
The bioenergetics model was used to predict the food consumption of burbot underexperimental conditions. The food consumption estimate was based on the mass changeof fish during the experiment. In addition, the growth of burbot was estimated by themodel based on the observed food consumption. The bioenergetics model was validatedby comparing the observed and estimated food consumption and growth estimates. Fourcriteria have been used for validation (Mayer & Butler, 1993): (1) the mean absolute
percentage error E%, E% ¼ 100P
yo � yp�� �� yoj j�1h in o
n�1, where yo represent observed
values, yp predicted values and n the number of pairs; (2) modelling efficiency Ef,
Ef ¼ 1�P
ðyo � ymÞ2h i P
ðyo � ymÞ2h i�1
, where ym is the mean of observed values; (3)
the regression coefficient (r2) of the linear regression between observed and predictedvalues; (4) the location of the regression line (constant a, slope b). The difference ofconstant a from 0 and slope b from 1 was tested by the t-test.In the validation experiment, the food consumption of burbot (n¼ 12, mean
mass¼ 327�3, range 153�1–595�9 g) was measured at 12, 15 and 19� C. Burbot were heldseparately in 12 aquaria from 7 to 14 days. The fresh mass (0�01 g) was measured prior tothe experiment and 3 days after the last meal. The burbot were fed daily with a mealconsisting of whole dead vendace. The size of the offered meal was 10% of the fresh massof the burbot at the beginning of the experiment. Vendace were placed at the bottom ofthe aquaria and burbot were allowed to feed for at least 3 h. A photoperiod of 6L:18Dwas used; a meal was offered 1 h before the light was switched off.In the field, the growth of burbot (n¼ 13) from Lake Paijanne was estimated from the
backcalculated LT at age. Measurements for backcalculation of LT were made on each whole
BIOENERGETICS OF BURBOT 959
# 2003TheFisheries Society of theBritish Isles, Journal of FishBiology 2003, 63, 956–969
otolith along the proximal axis from the focus to each annulus and the edge. Length at age wasbackcalculated from the equation: LTn¼ (snstot
�1)0�737LT, where LTn is length at age n, sn is
radius of the nth annulus from focus of otolith, stot is total radius of the otolith. Thebioenergetics model was used for each fish to determine the food consumption required forannual growth. Temperature regimes were set to resemble the environment in the deep basinsof large lake (i.e. 2–4� C during October–April and 5–8� C during March–September).
The food of burbot was divided into invertebrates (Mysis relicta Loven) and fishes (perchPerca fluviatilis L and vendace, categories of the latter based on the burbot diet datacollected from Lake Paijanne; Paakkonen, 2000). The PCB concentration of vendace andperch in Lake Paijanne was 5�0 and 4�9ng g�1 in the 1970s and 1990s (Hattula et al., 1978;Kiviranta et al., 2000; Korhonen, 2000). Sarkka et al. (1978) measured a PCB concentrationof 4�4ng g�1 for zoobenthos predators in Lake Paijanne. Kucklick & Baker (1998) analyseda minimum PCB concentration of 5�6ng g�1 in small M. relicta in Lake Superior, NorthAmerica. Hence, an average PCB concentration of 5�0ng g�1 (wet mass) was assumed forboth prey categories. The total PCB concentration (mgg�1 wet mass) of burbot wasanalysed by GC-ECD (sum of congeners PCB 18, 28, 44, 52, 101, 105, 118, 128, 137, 138,153, 156, 159, 169, 180 and 209). The mean PCB assimilation efficiency of burbot wasestimated experimentally as 0�71 in a 4 week exposure test to four different PCB congeners(PCB 18, PCB 44, PCB 137 and PCB 169) (J.-P. Paakkonen, unpubl. data). The total foodconsumption of 5 to 7 year-old burbot, the mean PCB concentration of prey and theassimilation efficiency were used to calculate total lifetime PCB accumulation value (PCBtot)by using the bioenergetics model. The observed PCB concentrations of individual burbotwere then compared with those estimated from the model on the basis of food consumption.
RESULTS
RESPIROMETRY
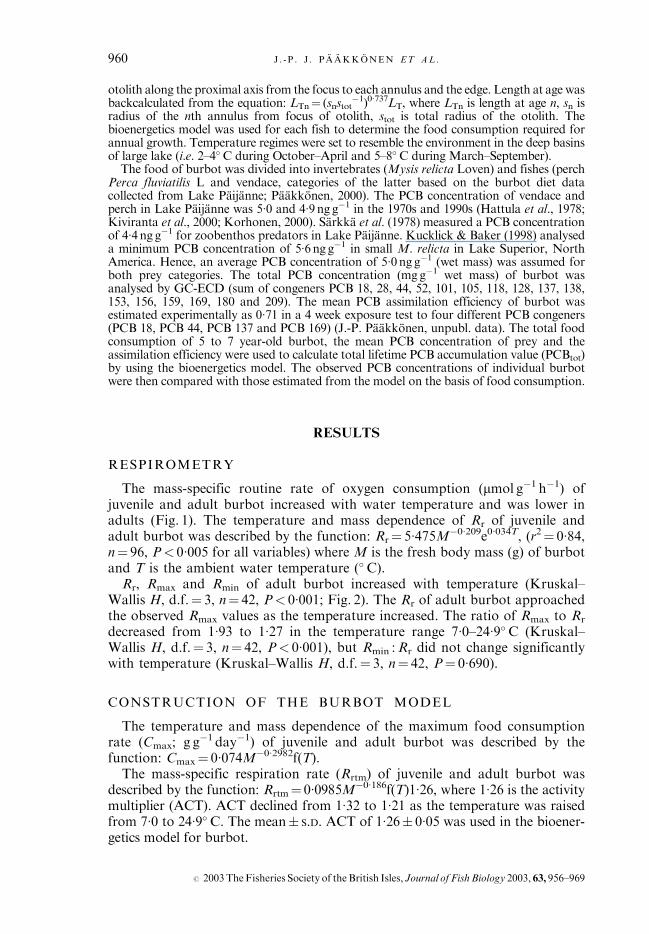
The mass-specific routine rate of oxygen consumption (mmol g�1 h�1) ofjuvenile and adult burbot increased with water temperature and was lower inadults (Fig. 1). The temperature and mass dependence of Rr of juvenile andadult burbot was described by the function: Rr¼ 5�475M�0�209e0
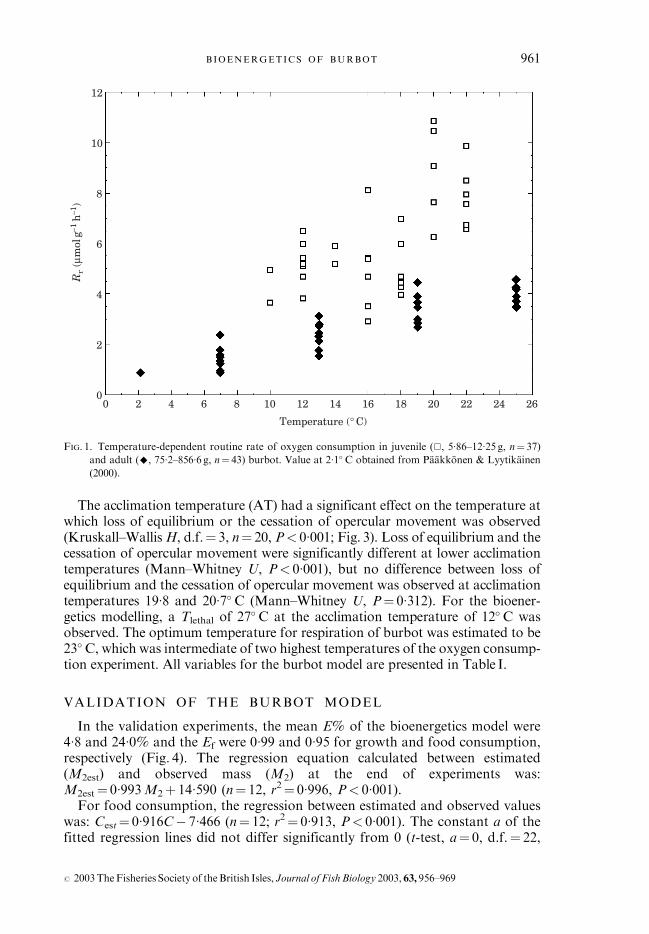
�034T, (r2¼ 0�84,n¼ 96, P< 0�005 for all variables) where M is the fresh body mass (g) of burbotand T is the ambient water temperature (� C).Rr, Rmax and Rmin of adult burbot increased with temperature (Kruskal–
Wallis H, d.f.¼ 3, n¼ 42, P< 0�001; Fig. 2). The Rr of adult burbot approachedthe observed Rmax values as the temperature increased. The ratio of Rmax to Rr
decreased from 1�93 to 1�27 in the temperature range 7�0–24�9� C (Kruskal–Wallis H, d.f.¼ 3, n¼ 42, P< 0�001), but Rmin :Rr did not change significantlywith temperature (Kruskal–Wallis H, d.f.¼ 3, n¼ 42, P¼ 0�690).
CONSTRUCTION OF THE BURBOT MODEL
The temperature and mass dependence of the maximum food consumptionrate (Cmax; g g�1 day�1) of juvenile and adult burbot was described by thefunction: Cmax¼ 0�074M�0�2982f(T).The mass-specific respiration rate (Rrtm) of juvenile and adult burbot was
described by the function: Rrtm¼ 0�0985M�0�186f(T)1�26, where 1�26 is the activitymultiplier (ACT). ACT declined from 1�32 to 1�21 as the temperature was raisedfrom 7�0 to 24�9� C. The mean� S.D. ACT of 1�26� 0�05 was used in the bioener-getics model for burbot.
960 J . -P . J . P A AKKONEN ET AL .
# 2003TheFisheries Society of theBritish Isles, Journal of FishBiology 2003, 63, 956–969
The acclimation temperature (AT) had a significant effect on the temperature atwhich loss of equilibrium or the cessation of opercular movement was observed(Kruskall–WallisH, d.f.¼ 3, n¼ 20, P< 0�001; Fig. 3). Loss of equilibrium and thecessation of opercular movement were significantly different at lower acclimationtemperatures (Mann–Whitney U, P< 0�001), but no difference between loss ofequilibrium and the cessation of opercular movement was observed at acclimationtemperatures 19�8 and 20�7� C (Mann–Whitney U, P¼ 0�312). For the bioener-getics modelling, a Tlethal of 27
� C at the acclimation temperature of 12� C wasobserved. The optimum temperature for respiration of burbot was estimated to be23� C, which was intermediate of two highest temperatures of the oxygen consump-tion experiment. All variables for the burbot model are presented in Table I.
VALIDATION OF THE BURBOT MODEL
In the validation experiments, the mean E% of the bioenergetics model were4�8 and 24�0% and the Ef were 0�99 and 0�95 for growth and food consumption,respectively (Fig. 4). The regression equation calculated between estimated(M2est) and observed mass (M2) at the end of experiments was:M2est¼ 0�993M2þ 14�590 (n¼ 12, r2¼ 0�996, P< 0�001).For food consumption, the regression between estimated and observed values
was: Cest¼ 0�916C� 7�466 (n¼ 12; r2¼ 0�913, P< 0�001). The constant a of thefitted regression lines did not differ significantly from 0 (t-test, a¼ 0, d.f.¼ 22,
0 2 4 6 8 10 12 14 16 18 20 22 24 26
Temperature (° C)
0
2
4
6
8
10
12
Rr
(µm
ol g
–1 h
–1)
FIG. 1. Temperature-dependent routine rate of oxygen consumption in juvenile (&, 5�86–12�25 g, n¼ 37)
and adult (^, 75�2–856�6 g, n¼ 43) burbot. Value at 2�1� C obtained from Paakkonen & Lyytikainen
(2000).
B IOENERGETICS OF BURBOT 961
# 2003TheFisheries Society of theBritish Isles, Journal of FishBiology 2003, 63, 956–969
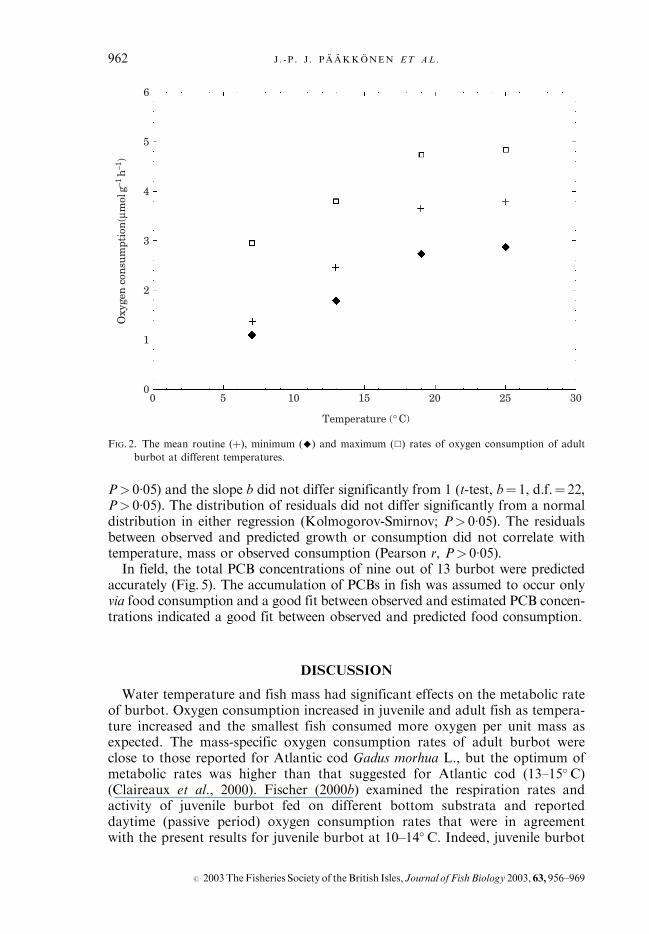
P> 0�05) and the slope b did not differ significantly from 1 (t-test, b¼ 1, d.f.¼ 22,P> 0�05). The distribution of residuals did not differ significantly from a normaldistribution in either regression (Kolmogorov-Smirnov; P> 0�05). The residualsbetween observed and predicted growth or consumption did not correlate withtemperature, mass or observed consumption (Pearson r, P> 0�05).In field, the total PCB concentrations of nine out of 13 burbot were predicted
accurately (Fig. 5). The accumulation of PCBs in fish was assumed to occur onlyvia food consumption and a good fit between observed and estimated PCB concen-trations indicated a good fit between observed and predicted food consumption.
DISCUSSION
Water temperature and fish mass had significant effects on the metabolic rateof burbot. Oxygen consumption increased in juvenile and adult fish as tempera-ture increased and the smallest fish consumed more oxygen per unit mass asexpected. The mass-specific oxygen consumption rates of adult burbot wereclose to those reported for Atlantic cod Gadus morhua L., but the optimum ofmetabolic rates was higher than that suggested for Atlantic cod (13–15� C)(Claireaux et al., 2000). Fischer (2000b) examined the respiration rates andactivity of juvenile burbot fed on different bottom substrata and reporteddaytime (passive period) oxygen consumption rates that were in agreementwith the present results for juvenile burbot at 10–14� C. Indeed, juvenile burbot
0 5 10 15 20 25 30
Temperature (° C)
0
1
2
3
4
5
6
Oxy
gen
con
sum
ptio
n(µ
mol
g–1
h–1
)
FIG. 2. The mean routine (þ), minimum (^) and maximum (&) rates of oxygen consumption of adult
burbot at different temperatures.
962 J . -P . J . P A AKKONEN ET AL .
# 2003TheFisheries Society of theBritish Isles, Journal of FishBiology 2003, 63, 956–969

were passive in respirometry chambers and exhibited no stress-induced increasein metabolic rates.In critical maximum temperature (CMT) studies water must be heated fast
enough to allow deep-body temperatures to parallel test temperatures without asignificant time lag and the test organism must not acclimate upward. Anincrease rate of 18� Ch�1 is appropriate for routine CMT determinations andpermits accurate determination of loss of equilibrium and death times andtemperatures (Becker & Genoway, 1979). The observed CMT of burbot werehigh for a cold water fish species. Burbot that were adapted to cold water(<10� C) were able to survive at the temperatures >20� C. In lakes, adult burbotprefer cool water areas (<13� C) and are usually below the thermocline (Edsallet al., 1993; Carl, 1995). The preferred temperatures recorded in lakes are wellbelow the observed critical temperatures in this study. The wide temperaturetolerance of the burbot enables it to utilize larger water volumes, if necessary, toseek food in shallow water areas or the epilimnion. The burbot also lives inrivers and shallow reservoirs, where water temperatures during summer can beconsiderably higher (>15� C) than in the profundal areas of lakes and wherethere are no cool water refuges (Vogt, 1978; Breeser et al., 1988). Tolerance ofhigh water temperatures also enables short visits to warmer waters (>20� C), asobserved in Lake Opeongo (Carl, 1995). The burbot is able to feed at arelatively high temperature (Paakkonen & Marjomaki, 2000). The Rr
approached the maximum rate of oxygen consumption (Rmax) at the highest
0 5 10 15 20 25
Acclimation temperature (° C)
20
25
30
35
Tem
pera
ture
(° C
)
FIG. 3. The loss of equilibrium (---, y¼ 0�371xþ 22�48, r2¼ 0�916; P< 0�001) and end of operculum move-
ments ( , y¼ 0�255xþ 25�05, r2¼ 0�858, P> 0�001) in relation to the acclimation temperatures.
B IOENERGETICS OF BURBOT 963
# 2003TheFisheries Society of theBritish Isles, Journal of FishBiology 2003, 63, 956–969

experimental temperature (25� C), suggesting harmful effects on the metabolismof burbot and thus a lower maximum aerobic performance. At high watertemperatures, however, the metabolic costs may exceed the energy obtainedfrom food, which leads to a decrease in growth. Gut blood flow in fishes areknown to decrease as a result of blood redistribution to support other activities,which may result in food conversion and growth that are sub-optimal (Farrellet al., 2001).The diet of adult burbot varies seasonally: in the winter, and in cool water, it is
dominated by fishes [vendace, smelt Osmerus eperlanus (L.), ruffe Gymnocephaluscernuus (L.)], but in warmer summer months, invertebrates (M. relicta and PallaseaquadrispinosaG.O. Sars) become common in burbot diet, their occurrence decreas-ing towards the winter (Paakkonen, 2000). The lipid concentration is dependent onthe type of diet. Hop et al. (1997) observed differences in the energy content ofanother gadoid, the Arctic cod Boreogadus saida (Lepechin), between fish andinvertebrate meals. A lipid concentration of 7�0% has been recorded for M. relicta(Morrison et al., 1999) and 3�6% for the vendace (J.-P. Paakkonen, unpubl. data).Burbot may compensate for an increase inmetabolism by increasing the proportionof species in the diet that have a higher energy content (i.e. invertebrates). Its highcritical maximum temperature, high optimum temperature for metabolism andability to feed at high temperatures, however, enables the burbot to succeed in avariety of environments.The bioenergetics model developed for burbot in this study accurately pre-
dicted the food consumption and growth of fish under experimental conditions,having modelling efficiencies (Ef) of >0�95. In previous studies, the
TABLE I. Equations and parameter values used in the bioenergetics model for burbot
Symbol Description Value
Consumption (C) C¼PaMbf(T)
P Fitted parametera Intercept for 1 g fish at ToptC 0�0747b Coefficient of the mass dependence �0�2682TmaxC Maximum temperature (� C) 28ToptC Optimum temperature (� C) 14CQ Q10 value for consumption 2�53Metabolism (R) R¼ aMbf(T)ACT; RSDA¼SDA (C�F)
a Intercept for 1 g fish at RTO (g g�1 day�1) 0�00985b Coefficient of the mass dependence �0�186Tlethal Maximum lethal temperature (� C) 27ToptR Optimum temperature (� C) 23RQ Q10 value for respiration 1�52ACT Activity multiplier 1�26SDA Specific dynamic action 0�16Egestion (F) and excretion (U), F¼ fC; U¼ e(C�F)f Proportion of consumed food egested 0�17e Proportion of consumed food excreted 0�09
964 J . -P . J . P A AKKONEN ET AL .
# 2003TheFisheries Society of theBritish Isles, Journal of FishBiology 2003, 63, 956–969

bioenergetics model variable values adapted from Atlantic cod experiments havebeen used as a substitute for burbot (Rudstam et al., 1995). The Atlantic codvariable values were also used to predict the consumption and growth of burbot
0 100 200 300 400 500 600 700
Observed mass (g)
700
600
500
400
300
200
100
0
Est
imat
ed m
ass
(g)
0 50 100 150
Observed consumption (g)
150
100
50
0
Est
imat
ed c
onsu
mpt
ion
(g)
(a)
(b)
FIG. 4. The observed and bioenergetics model estimated (a) masses and (b) food consumptions of burbot
in the validation experiment. , the estimated and observed values are equal. ---, the fitted
regression line (see text for regression equations).
B IOENERGETICS OF BURBOT 965
# 2003TheFisheries Society of theBritish Isles, Journal of FishBiology 2003, 63, 956–969

in the validation experiments and the Ef and E% for the ‘cod’ model were 0�89and 42�8% for consumption and 0�99 and 6�3% for growth, respectively. Thus,the ‘cod’ model predicted the consumption and growth of burbot well, althoughfood consumption under experimental conditions was underestimated morethan in the model developed for burbot.Validation of the food consumption predictions of bioenergetics models
under field conditions has rarely been performed. Where validation has beencarried out it has generally been based on a comparison between two models,typically between an evacuation rate model and a bioenergetics model (Hanssonet al., 1996; Schaeffer et al., 1999). In the present study highly resistant andlipophilic PCBs were used as ‘label compounds’ in the validation of the foodconsumption of burbot in Lake Paijanne. Madenjian et al. (2000) used a similarapproach when they compared the PCB accumulation efficiency of lake troutSalvelinus namaycush (Walbaum) under experimental and field conditions. InLake Paijanne, the total PCB concentration of nine of 13 burbot was predictedwell. Furthermore, all those four individuals, whose observed values were higherthan the predicted ones, were males. The sexual difference in contaminantaccumulation rates of burbot has been also observed in walleye Stizostedionvitreum (Mitchill) (Madenjian et al., 1998).One of the major benefits of bioenergetic model construction is that the
development work identifies gaps in the scientific knowledge, and this was
280 320 360 400 440 480
Length (mm)
0.10
0.09
0.08
0.07
0.06
0.05
0.04
0.03
0.02
0.01
0
Tot
al P
CB
con
cen
trat
ion
(m
g kg
–1)
FIG. 5. The observed (^) and estimated (h) total PCB concentrations at total length of burbot (n¼ 13)
captured from Lake Paijanne. Total PCB concentrations were estimated by the bioenergetics
model.
966 J . -P . J . P A AKKONEN ET AL .
# 2003TheFisheries Society of theBritish Isles, Journal of FishBiology 2003, 63, 956–969
true here. Future studies should focus on why burbot inhabits the cool parts oflakes, where temperatures are clearly below its physiological temperature opti-mum. One explanation may be connected to the ability of burbot to ingest largeamounts of food. Also, the morphology of the burbot heart has recently beenshown to differ from what of other teleost freshwater fishes and these differ-ences have been suggested to be structural adaptations to the cold water (Tiitu& Vornanen, 2002). Furthermore, the increased blood flow from intestine toliver may affect the ability of burbot to tolerate higher temperatures. A secondimportant issue is to estimate the variation in assimilation efficiencies and otherphysiological variables between burbot individuals. Individual variation mayexplain the weaker model fit between the observed and predicted food con-sumptions than between growth estimates. In summary, the burbot modelpresented in this study seems to produce good estimates of food consumptioneven under field conditions and hence can be used as a tool to incorporate therole of burbot into lake food web studies.
All experimental protocols were inspected and approved by the laboratory animalcommittee of the University of Jyvaskyla. We thank A.-L. Rantalainen for the PCBanalysis and R. Siddall for checking the English. This work was financially supported bythe Maj and Tor Nessling Foundation.
References
Becker, C. D. & Genoway, R. G. (1979). Evaluation of the critical thermal maximum fordetermining thermal tolerance for freshwater fish. Environmental Biology of Fishes4, 245–256.
Breeser, S. W., Stearns, F. D., Smith, M. W., West, R. L. & Reynolds, J. B. (1988).Observations of movements and habitat preferences of burbot in an Alaskanglacial river system. Transactions of the American Fisheries Society 117, 506–509.
Carl, L. M. (1992). The response of burbot (Lota lota) to change in lake trout (Salvelinusnamaycush) abundance in Lake Opeongo, Ontario. Hydrobiologia 243/244,229–235.
Carl, L. M. (1995). Sonic tracking of burbot in Lake Opeongo, Ontario. Transactions ofthe American Fisheries Society 124, 77–83.
Claireaux, G., Webber, D. M., Lagardere, J.-P. & Kerr, S. R. (2000). Influence of watertemperature and oxygenation on the aerobic metabolic scope of Atlantic cod(Gadus morhua). Journal of Sea Research 44, 257–265.
Edsall, T. A., Kennedy, G. W. & Horns, W. H. (1993). Distribution, abundance, andresting microhabitat of burbot on Julian’s Reef, southwestern Lake Michigan.Transactions of the American Fisheries Society 122, 560–574.
Farrell, A. P., Thorarensen, H., Axelsson,M., Crocker, C. E., Gamperl, A. K. & Cech, J. J. Jr(2001). Gut blood flow in fish during exercise and severe hypercapnia. ComparativeBiochemistry and Physiology A 128, 551–563.
Fischer, P. (1999). Otolith microstructure during the pelagic, settlement and benthic phasesin burbot. Journal of Fish Biology 54, 1231–1243. doi: 10.1006/jfbi.1999.0956.
Fischer, P. (2000a). Test of competitive interactions for space between two benthic fishspecies, burbot Lota lota, and stone loach Barbatula barbatula. EnvironmentalBiology of Fishes 58, 439–446.
Fischer, P. (2000b). An experimental test of metabolic and behavioural responses ofbenthic fish species to different types of substrate. Canadian Journal of Fisheriesand Aquatic Sciences 57, 2333–2344.
B IOENERGETICS OF BURBOT 967
# 2003TheFisheries Society of theBritish Isles, Journal of FishBiology 2003, 63, 956–969
Fratt, T. W., Coble, D. W., Copes, F. & Bruesewitz, R. E. (1997). Diet of burbot in GreenBay and western Lake Michigan with comparison to other waters. Journal of GreatLakes Research 23, 1–10.
Hansson, S., Rudstam, L. G., Kitchell, J. F., Hilden, M., Johnson, B. L. & Peppard, P. E.(1996). Predation rates by North Sea cod (Gadus morhua) – predictions frommodels on gastric evacuation and bioenergetics. ICES Journal of Marine Science53, 107–114.
Hattula, M.-L., Janatuinen, J., Sarkka, J. & Paasivirta, J. (1978). A five-year monitoringstudy of the chlorinated hydrocarbons in the fish of a Finnish lake ecosystem.Environmental Pollution 15, 121–139.
Hewett, S. W. & Johnson, B. L. (1992). A generalized bioenergetics model of fish growthfor microcomputers. Sea Grant Technical Report WIS-SG-92-250. Madison, WI:University of Wisconsin Sea Grant Institute.
Hofmann, N. & Fischer, P. (2001). Seasonal changes in abundance and age structure ofburbot Lota lota (L.) and stone loach Barbatula barbatula (L.) in the littoral zoneof a large pre-alpine lake. Ecology of Freshwater Fish 10, 21–25.
Hop, H., Tonn, W. M. & Welch, H. E. (1997). Bioenergetics of Arctic cod (Boreogadussaida) at low temperatures. Canadian Journal of Fisheries and Aquatic Sciences 54,1772–1784.
Johnson, T. B., Mason, D. M., Schram, S. T. & Kitchell, J. F. (1999). Ontogenic andseasonal patterns in the energy content of piscivorous fishes in Lake Superior.Journal of Great Lakes Research 25, 275–281.
Karjalainen, J.,Miserque, D. &Huuskonen, H. (1997). The estimation of food consumptionin larval and juvenile fish: experimental evaluation of bioenergetics models. Journalof Fish Biology 51, 39–51.
Kitchell, J. F., Stewart, D. J. & Weininger, D. (1977). Applications of a bioenergeticsmodel to yellow perch (Perca fluviatilis) and walleye (Stizostedion vitreum vitreum).Journal of the Fisheries Research Board of Canada 34, 1922–1935.
Kiviranta, H., Korhonen, M., Hallikainen, A. & Vartiainen, T. (2000). Kalojendioksiinien ja PCB: iden kulkeutuminen ihmiseen. Ymparisto ja Terveys-lehti 3,65–69 (in Finnish).
Korhonen, M. (2000). Ymparistomyrkyt sisavesien ja rannikon kaloissa. Ymparisto 7,22–23 (in Finnish).
Kucklick, J. R. & Baker, J. E. (1998). Organochlorines in Lake Superior’s food web.Environmental Science & Technology 32, 1192–1198.
Madenjian, C. P., Noguchi, G. E., Haas, R. S. & Schrouder, K. S. (1998). Sexualdifferences in polychlorinated accumulation rates of walleye (Stizostedion vitreum).Canadian Journal of Fisheries and Aquatic Sciences 55, 1085–1092.
Madenjian, C. P., O’Connor, D. V. & Nortrup, D. A. (2000). A new approach towardevaluation of fish bioenergetics models. Canadian Journal of Fisheries and AquaticSciences 57, 1025–1032.
Mayer, D. G. & Butler, D. G. (1993). Statistical validation. Ecological Modelling 68,21–23.
McPhail, J. D. & Paragamian, V. L. (2000). Burbot biology and life history. In Burbot,Biology, Ecology, and Management (Paragamian, V. L. & Willis, D. W., eds),pp. 11–23. Bethesda, MD: American Fisheries Society.
Morrison, H. A., Whittle, D. M., Metcalfe, C. D. & Niimi, A. J. (1999).Application of a food web bioaccumulation model for the prediction ofpolychlorinated biphenyl, dioxin, and furan congener concentrations inLake Ontario aquatic biota. Canadian Journal of Fisheries and AquaticSciences 56, 1389–1400.
Paakkonen, J.-P. J. (2000). Feeding biology of burbot, Lota lota (L.): adaptation toprofundal lifestyle? Doctoral Thesis. Biological Research Reports from theUniversity of Jyvaskyla 87.
Paakkonen, J.-P. J. & Lyytikainen, T. (2000). Oxygen consumption of burbot (Lota lota)fed different rations of vendace (Coregonus albula). Journal of Applied Ichthyology16, 262–265.
968 J . -P . J . P A AKKONEN ET AL .
# 2003TheFisheries Society of theBritish Isles, Journal of FishBiology 2003, 63, 956–969

Paakkonen, J.-P. J. & Marjomaki, T. J. (1997). Gastric evacuation rate of burbot fedsingle-meals at different temperatures. Journal of Fish Biology 50, 555–563.
Paakkonen, J.-P. J. & Marjomaki, T. J. (2000). Feeding of burbot, Lota lota, at differenttemperatures. Environmental Biology of Fishes 56, 109–112.
Paragamian, V. L., Powell, M. S. & Faler, J. C. (1999). Mitochondrial analysis of burbotstocks in the Kootenai river basin of British Columbia, Montana, and Idaho.Transactions of the American Fisheries Society 128, 868–874.
Rudstam,L.G., Peppard, P.E., Fratt, T.W.,Bruesewitz,R.E.,Coble,D.W.,Copes,F.A.&Kitchell, J. F. (1995). Prey consumption by the burbot (Lota lota) population inGreenBay, Lake Michigan, based on a bioenergetics model. Canadian Journal of Fisheriesand Aquatic Sciences 52, 1074–1082.
Sarkka, J., Hattula, M.-L., Paasivirta, J. & Janatuinen, J. (1978). Mercury andchlorinated hydrocarbons in the food chain of Lake Paijanne, Finland. HolarcticEcology 1, 326–332.
Schaeffer, J. S., Haas, R. C., Diana, J. S. & Breck, J. E. (1999). Field test of two energeticmodels for yellow perch. Transactions of the American Fisheries Society 128,414–435.
StatSoft (1997). STATISTICA for Windows. Tulsa, OK: StatSoft, Inc.Stewart, D. J., Weininger, D., Rottiers, D. V. & Edsall, T. A. (1983). An energetics model
for lake trout, Salvelinus namaycush: Application to the Lake Michigan population.Canadian Journal of Fisheries and Aquatic Sciences 40, 681–698.
Tiitu, V. & Vornanen, M. (2002). Morphology and fine structure of the heart of theburbot, a cold stenothermal fish. Journal of Fish Biology 61, 106–121. doi: 10.1006/jfbi.2002.2021.
Tolonen, A., Kjellman, J. & Lappalainen, J. (1999). Diet overlap between burbot(Lota lota (L.)) and whitefish (Coregonus lavaretus (L.)) in a subarctic lake. AnnalesZoologici Fennici 36, 206–214.
Vogt, H. (1978). An ecological and environmental survey of the humic man-made lakes inFinland. Aqua Fennica 8, 12–24.
Wang, N. & Appenzeller, A. (1998). Abundance, depth distribution, diet composition andgrowth of perch (Perca fluviatilis) and burbot (Lota lota) larvae and juveniles in thepelagic zone of Lake Constance. Ecology of Freshwater Fish 7, 176–183.
Winberg, G. G. (1956). Rate of Metabolism and Food Requirements of Fishes. Minsk:Byelorussian University.
B IOENERGETICS OF BURBOT 969
# 2003TheFisheries Society of theBritish Isles, Journal of FishBiology 2003, 63, 956–969
Copyright © 2022 FDOKUMEN