Amounts of litter fall in some pine forests in a European transect, in particular Scots pine
Upload
khangminh22Category
view
0download
0
UNIVERSITY OF STIRLING
DOCTORAL THESIS
Development and maintenance of genetic
diversity in Scots pine, Pinus sylvestris (L.)
Patricia González Díaz
BIOLOGICAL AND ENVIRONMENTAL SCIENCES
SCHOOL OF NATURAL SCIENCES
UNIVERSITY OF STIRLING
A thesis submitted for the degree of Doctor of Philosophy
January 2018


i
Acknowledgements
Firstly, I would like to thank my supervisors, Prof. Alistair S. Jump and Dr. Stephen
Cavers, for enabling me to realise my potential as a research scientist and providing
me with guidance during my PhD. Thank you for the useful and rewarding
discussions, for being patient and for continuously supporting me throughout my
PhD. Without you both, this would have been really difficult!
Thank you to all those from other Universities who have hosted me during my PhD:
Luis Matías from the IRNAS (CSIC), Miguel A. Zavala from the University of Alcalá
and Beppe Vendramin and Francesca Bagnoli from the Institute of Biosciences and
Bioresourses (CNR). I have learned a lot with you all.
I would also like to express my gratitude to colleagues in the Faculty of Natural
Sciences at the University of Stirling who have always been open to providing help
when needed. In particular, thanks to the folks from the 4V2 office, María E. Aulló,
Emma Bush, Izzy Jones, Karen Zapata, Chris Pollard, Rebekah Mayhew, Kenneth
Porter, Jonathan Fletcher and Emma Sheard, for sharing the journey with me and
making the daily work and coffee breaks more enjoyable. Thank you also for
receiving Lur and me with such a kindness.
Many thanks to all people who have contributed in one way or another to this PhD.
Special thanks to Paloma Ruiz-Benito and Albert Vilá-Cabrera for the inmense R
support; Jennifer Sjölund, Mohamed Abdelaziz and Gill Flint for introducing me in
the molecular analysis; Sofie Meeus, Sarah Greenwood, Pete Morley, Pauline Pantoja
and Enrico Tordoni for help in field and chamber work, Mario Vallejo and Tim Paine
for providing good ideas during the lab-meetings; James Weir, Scott Jackson and
Ronnie Balfour for technical support; Allan Booth for statistical advice. Thank you
also to Ron Summers for the immense help in Abernethy; Glen Iason, Joanne Russel,
Alan Booth, Annika Perry, Elena Lapshina and Witold Wackowiak for providing

ii
molecular samples and Richard Ennos and Joan Cottrell for their useful comments.
And a lot of thanks to my flat and climbing mates who help me to not became crazy
in research these four years!
A very special thank to my parents and sister who have always supported me in my
decisions. Thank you to my grandparents, in special to “guelito Sin”, I am who I am
thanks to you. Finally, thanks to my partner, friend, college and field assistant,
David García for accompanying me all this time, and make me laugh even in the
worst days. I don´t forget you Lur, thank you for your constant happiness and for
always having an excuse to go outdoors!
This project has been funded by the University of Stirling, Scottish Forestry Trust
and the Centre of Ecology and Hydrology in Edinburgh.

iii
Thesis abstract
Forests are among the most important repositories of terrestrial biodiversity and
provide a broad range of ecosystem services. During millennia, forests have
changed, adapted and evolved under changing conditions. However, in the present
century, forests are facing environmental changes at rates with no precedents. A
major concern is the risk of declining forest genetic diversity, since genetic variation
as the raw material underpinning adaptation is key in maintaining the resilience of
forest ecosystems against environmental changes. Understanding the different
processes responsible for developing and maintaining the genetic diversity of tree
species is essential to better predict tree responses under new conditions. Therefore,
this thesis aimed to determine how different forces interact to shape and maintain
within and among population genetic diversity of Scots pine and what the
implications are for conservation and management under forthcoming
environmental conditions. From local to continental scales, we followed a multilevel
approach, and found that (i) historic climate changes and geographical barriers have
played an important role in shaping the extent and spatial distribution of current
genetic diversity of Scots pine. Despite contemporary habitat reduction and
fragmentation we found that (ii) high levels of neutral genetic diversity remain in the
Scottish populations of Scots pine, with gene flow and specifically wind-driven gene
flow dominating over genetic drift and preventing differentiation among the Scottish
populations. However, (iii) considerable impacts in the spatial distribution of genetic
variation have occurred as a consequence of intensive historical forest management
practices. Furthermore, we found that (iv) substantial levels of adaptive genetic
variation are present in the Scottish populations of Scots pine, likely a result of
selective processes resulting from the different environments they live in, with
highly heritable traits, although similar capacity for response through phenotypic
plasticity to warming. Our results help to further disentangle the forces maintaining

iv
genetic diversity in one of most widespread conifers in the world, and improving
predictions of likely range shifts and adaptation of the species in response to
contemporary changes. We provide some recommendations to conservation and
management practices.

v
Contents
Acknowledgements ............................................................................................................... i
Thesis abstract ..................................................................................................................... iii
List of Tables ......................................................................................................................... xi
List of Figures ...................................................................................................................... xv
List of Supplementary Material ...................................................................................... xix
Chapter 1: General introduction ........................................................................................ 1
1.1. Forest genetic diversity in a changing environment ............................................... 3
1.2. Processes influencing forest genetic diversity .......................................................... 6
Environmental variation- Variation in geography ..................................................... 9
Environmental variation- Variation in climate ......................................................... 10
Human influence ........................................................................................................... 13
1.3. The study case: Scots pine ........................................................................................ 14
1.4. Thesis outline ............................................................................................................. 22
1.5. References ................................................................................................................... 26
Chapter 2: Interacting impacts of past climate and geography in migration patterns
and consequent genetic structure of Scots pine ............................................................ 37
2.1. Abstract ........................................................................................................................ 39
2.2. Introduction ................................................................................................................. 41
2.3. Material and methods ................................................................................................ 45
2.3.1. Genetic datasets and markers ........................................................................... 45
2.3.2. Population structure and spatial patterns of genetic diversity at European
scale.................................................................................................................................. 48
2.3.3. Analysis of demographic history ...................................................................... 50
2.3.3.1. Identification of glacial refugia and migration routes ............................ 51
2.3.3.2. Changes in population size ......................................................................... 54
2.3.4. Species distribution modelling .......................................................................... 56

Contents
vi
2.4. Results .......................................................................................................................... 58
2.4.1. Genetic diversity and populations structure at European scale ................... 58
2.4.2. Demographic history .......................................................................................... 66
2.4.2.1. Identification of glacial refugia and colonization in Europe and
Scotland ..................................................................................................................... 66
2.4.2.2. Changes in population size ........................................................................ 68
2.4.2. Species distribution modelling .......................................................................... 68
2.5. Discussion .................................................................................................................... 71
2.5.1. Spatial distribution of genetic diversity at the continental scale .................. 71
2.5.2. The role of peninsular glacial refugia in Holocene colonization .................. 73
2.5.3. Likely sources of the North-Western populations .......................................... 77
2.5.4. Conclusions .......................................................................................................... 79
2.6. Acknowledgements .................................................................................................... 80
2.7. References .................................................................................................................... 80
2.8. Supplementary material ............................................................................................ 90
Chapter 3: Weak isolation by distance and geographic diversity gradients persist
in Scottish relict pine forest ............................................................................................... 93
3.1. Abstract ........................................................................................................................ 95
3.2. Introduction ................................................................................................................. 97
3.3. Material and methods .............................................................................................. 103
3.3.1. Study species ...................................................................................................... 103
3.3.2. Study sites and microsatellite analysis ........................................................... 103
3.3.3. Data analysis ...................................................................................................... 106
3.3.3.1. Genetic diversity......................................................................................... 106
3.3.3.2. Population differentiation and Bayesian clustering .............................. 107
3.3.3.3. Isolation by distance and directional relative migration routes .......... 108
3.4. Results ........................................................................................................................ 109

Contents
vii
3.4.1. Genetic diversity ............................................................................................... 109
3.4.2. Population differentiation and Bayesian clustering .................................... 112
3.4.3. Isolation by distance and asymmetric migration ......................................... 114
3.5. Discussion .................................................................................................................. 116
3.5.1. High levels of genetic variation and low population differentiation ....... 116
3.5.2. Weak isolation by distance .............................................................................. 118
3.5.3. Geographic diversity gradients and predominant patterns of gene flow 120
3.5.4. Conclusions ....................................................................................................... 123
3.6. Acknowledgements .................................................................................................. 124
3.7. References .................................................................................................................. 124
3.8. Supplementary material .......................................................................................... 137
Chapter 4: Ecology and management history drive spatial genetic structure in
Scots pine ............................................................................................................................ 139
4.1. Abstract ...................................................................................................................... 141
4.2. Introduction ............................................................................................................... 143
4.3. Material and methods .............................................................................................. 147
4.3.1. Study species ...................................................................................................... 147
4.3.2. Study sites and history of forest management .............................................. 147
4.3.3. Sample collection, life stages and stand structure ........................................ 151
4.3.4. Microsatellite analyses ...................................................................................... 153
4.3.5. Genetic diversity and spatial genetic structure analysis ............................. 154
4.4. Results ........................................................................................................................ 156
4.4.1. Stand structure ................................................................................................... 156
4.4.2. Genetic diversity ................................................................................................ 158
4.4.3. Spatial genetic structure ................................................................................... 160
4.5. Discussion .................................................................................................................. 162
4.5.1. Impact of historical forest management practices ........................................ 163
4.5.2. Impact of contemporary forest management practices .............................. 167
4.5.3. Conclusions ........................................................................................................ 169

Contents
viii
4.6. Acknowledgements .................................................................................................. 170
4.7. References .................................................................................................................. 171
4.8. Supplementary material .......................................................................................... 181
Chapter 5: Nearby Scots pine populations from contrasting climates show
substantial population variability but consistent response to warming ............... 183
5.1. Abstract ...................................................................................................................... 185
5.2. Introduction ............................................................................................................... 187
5.3. Material and methods .............................................................................................. 192
5.3.1. Study populations and seed collection ........................................................... 192
5.3.2. Experimental design ......................................................................................... 193
5.3.3. Data analysis ...................................................................................................... 198
5.3.3.1. Seeds and seedling emergence ................................................................. 198
5.3.3.2. Intra-specific variation of early growth traits and response to
temperature ............................................................................................................. 199
5.4. Results ........................................................................................................................ 202
5.4.1. Seeds and seedling emergence .................................................................... 202
5.4.2. Intraspecific variation of early growth tratis ............................................. 204
5.4.3. Response to temperature of early growth traits ...................................... 210
5.4.4. Relationship among traits ........................................................................... 214
5.5. Discussion .................................................................................................................. 214
5.5.1. Intra-specific adaptive variation ................................................................. 215
5.5.1.1. Seeds and emergence ..................................................................... 215
5.5.1.2. Biomass and functional traits ....................................................... 216
5.5.1.3. Heritabilities and genetic components ........................................ 219
5.5.2. Response to temperature .............................................................................. 220
5.5.2.1. Advance of germination ................................................................ 221
5.5.2.2. Biomass and above and below ground traits ............................. 222
5.5.2.3. Impacts of genetic variation .......................................................... 225
5.5.3. Conclusions .................................................................................................... 226

Contents
ix
5.6. Acknowledgements .................................................................................................. 227
5.7. References .................................................................................................................. 227
5.8. Supplementary material .......................................................................................... 235
Chapter 6: General discussion ........................................................................................ 237
6.1. Overwiew .................................................................................................................. 238
6.2. From legacies of the past to predictions for the future ....................................... 238
The processes shaping historical migration and colonization .......................... 238
The role and processes shaping contemporary gene flow ................................ 241
The role and processes shaping regeneration and establishment at the local
scale ........................................................................................................................... 242
The role and processes shaping natural selection .............................................. 244
6.3. General synthesis ...................................................................................................... 246
6.4. Future research and conclusions ............................................................................ 248
6.5. References .................................................................................................................. 251

x

List of Tables
Table 1.1 Overview of neutral genetic diversity studies with Scots pine.
Table 1.2 General overview of the thesis, specifying objectives, methods and results
in form of publications resulted from each of the thesis chapter.
Table 2.1 A graphical overview of the two step approach for each dataset (European
nSSR and SNP) used for the identification of glacial refugia, migration patterns and
source of colonization in Central-Northern European populations (step 1, model 1 &
3) and Scottish populations (step 2, model 2 & 4). Population names are coded as
follows: Italy (ITA), Iberia (IBE), Balkan (BAL), Asia Minor (AMI), Central-Northern
Europe (CNE), Scotland (SCO) and ancestral population (ANC).
Table 2.2 Genetic estimators for Europe nSSR and cpSSR for each population . nAR
was rarefied for 19 individuals at the population level and for 38 individuals at the
regional level.
Table 2.3 Genetic estimators for Europe SNP data.
Table 2.4 Hierarchical analysis of molecular variance (AMOVA) for nuclear and
chloroplast markers at the individual, population and region level (using five
regions: three STRUCTURE clusters and two admixed clusters). The degrees of
freedom (df), sum of squares (SS), percentage of variation explained by each level
(Variation (%)), and the relevant P-values are indicated.
Table 2.5 FST values for regions of nSSR (below the diagonal) and cpSSR (above the
diagonal).
Table 3.1 Studies assessing neutral genetic variation of Scots pine in Scotland using
variable molecular markers: RFLP, Random Fragment Length Polymorphism; SSR,
Simple Sequence Repeat or microsatellite; SNP, Single Nucleotide Polymorphism,

List of tables
xii
indicating No. pop., number of studied populations; No. ind., number of genotyped
individuals.
Table 3.2 Detail of study sites. Population area was obtained from Mason et al.
(2004).
Table 3.3 Genetic diversity estimators for nuclear (nSSR) and chloroplast (cSSR)
markers.
Table 3.4 Hierarchical analysis of molecular variance (AMOVA) for nuclear (nSSR)
and chloroplast (cSSR) markers at the individual, population and cluster of
populations. The degrees of freedom (df), percentage of variation explained by each
level (Variation (%)), and the relevant P-values are indicated.
Table 4.1 Summary of multilocus genetic diversity and SGS estimators for each
study site and life stage.
Table 5.1 Location of study sites and altitudinal ranges where the mother trees were
sampled, as well as mean temperature and precipitation in each location.
Table 5.2 Parameters of the Logistic Regression of cumulative emergence of Scots
pine.
Table 5.3 Summary of early growth traits analyses by treatment and region. Model
subsets were generated and compared by AICc to assess the importance of
Treatment, Region, and their interaction as fixed effects. The best models were
determined by AICc, and the presence (+) or absence (-) of fixed effects are indicated
for each of the traits listed. ∆AICc values represent the difference in AICc between
the null model and the best.
Table 5.4 Genetic components for the current and future temperature model: the
proportion of variance attributable to region, population, family within population,
block and residual which refer to the individual; heritabilities (h2) with their
associate error, and evolvabilities of the traits (CVA). Model subsets were generated

List of tables
xiii
and compared by AICc to assess the importance of Population. The best models
were determined by AICc, and the presence (+) or absence (-) of fixed effects are
indicated for each of the traits listed. ∆AICc values represent the difference in AICc
between the null model and the best (a value of zero indicates that the null model
was the most parsimonious)

xiv

List of Figures
Figure 1.1 Processes and forces (in red) influencing neutral and adaptive genetic
variation.
Figure 1.2 Temperature anomaly at Last Glacial Maximum (LGM) (taken from
(Annan & Hargreaves 2013)).
Figure 1.3 Observed change in surface temperature from 1901 until 2012 (IPCC,
2013).
Figure 1.4 Scots pine global distribution. Presence data obtained from EUFORGEN
database. Green areas represent natural presence of Scots pine.
Figure 1.5 Example of some Scots pine populations from Scotland studied in the
present thesis.
Figure 2.1 Study sites for European nuclear and chloroplast microsatellite markers
(European SSR, green dots) and single nucleotide polymorphism markers (European
SNP, red dots), and the study sites for Scottish nuclear and chloroplast SSR markers
(Scottish SSR, blue dots). Shaded area represents contemporary Scots pine
distribution (EUFORGEN, http://www.euforgen.org/species/). See Table S1 for
further description of the European SSR sites.
Figure 2.2 Colonization scenarios of Scots pine tested using the European nSSR data.
Population names correspond to Iberia (IBE), Balkan (BAL), Asia Minor (AMI),
Central-Northern Europe (CNE), Scotland (SCO) and ancestral population (ANC).
t1, t2 and t3 correspond to the divergence times in generations. More details on each
scenario (indicated by a label) can be found in Table 1; Step2, model 2 section.
Figure 2.3 Colonization scenarios of Scots pine tested using the European SNP data.
Population names correspond to Italy (ITA), Iberia (IBE), Central-Northern Europe

List of figures
xvi
(CNE), Scotland (SCO) and ancestral population (ANC). t1, t2 and t3 correspond to
the divergence times in generations. More details on each scenario (indicated by a
label) can be found in Table 1; Step2, model 2 section.
Figure 2.4 Scenarios of changes in population size of Scots pine tested, that assume
(i) constant (i.e. no change in population size), (ii) expansion, (iii) decline, or (iv)
bottleneck . Parameters N1, Na, Nb, Nc and Nd refers to effective population sizes, t2 is
the time in generations at which the change in population size occurred and db is the
duration of the bottleneck.
Figure 2.5 Diversity estimated using different markers: (a) nuclear (nSSR diversity),
(b) chloroplast (cpSSR diversity), and (c) SNP (SNP diversity) for European
populations of Scots pine.
Figure 2.6 Optimal number of genetic clusters (K=3) obtained for (a) European nSSR
and (b) European SNP datasets of Scots pine. Pie charts show the average values of
10 different runs for the proportion of membership to each genetic cluster. Different
colours indicate different genetic clusters independently for each figure.
Figure 2.7 Projection of species under current climatic conditions (a,b,c), past
condition in the last glacial maximum using CCSM global circulation model (i.e.
LGC-CCSM; d,e,f), and MIROC global circulation model (i.e. LGC-MIROC; g,h,i),
and past climatic conditions in the Last Interglacial Period (i.e. LIG (j,k,l) using
different occurrence data sources: EUFORGEN and TSDE (purples), adult
individuals from NFI (oranges) and regenerated individuals from NFI (greens).
Figure 3.1 Study populations for nSSR and cSSR analyses.
Figure 3.2 Genetic diversity parameters for nSSR (above) and cSSR (below). (a)
Genetic diversity for nSSR (nHE); (b) Rarefied allele richness for nSSR (nAR), (c) Gene
diversity corrected for sample size for cSSR (cHE); (d) no. of haplotypes for cSSR
(cHN).

List of figures
xvii
Figure 3.3 Isolation by distance. Black line represent the slope of the correlation of
the natural log of the linear spatial distance (Ln(Spatial Distance (km)) against FST/(1-
FST) after 10,000 permutations of sites among locations.
Figure 3.4 Relative migration networks for nSSR with populations sorted in seed
groups. Seed group codes correspond to the following group of populations (see
table 2 for population details): NE= ALT, GLT; SC= CCC, MEG, GLW; EC= ABE,
ROT; SW= COG, GLL, CRA; NC= GLA, AMA; NW= LOC, SHI, BEE; N= GLE, STO,
RHI. (a) No using a threshold, (b) using a threshold of 0.5.
Figure 4.1 Tree diameter (d.b.h.) distribution in the three stands: Abernethy (ABE),
Glen Affric (GLA) and the unmanaged stand (UNM). Juvenile stem diameter was
measured at 10 cm height. Data are presented in intervals of 5 cm.
Figure 4.2 Relationship between d.b.h. and age for the managed site of Abernethy
(ABE) and the unmanaged site (UNM). Lines of best fit are represented by solid lines
and 95% CI by dashed lines. Dots represent observed values.
Figure 4.3 Spatial autocorrelograms for each stand: Abernethy (ABE), Glen Affric
(GLA) and the unmanaged stand (UNM); and life stage (adult and juvenile) based
on the kinship coefficient Fij estimated from 12 microsatellite and consecutive 10 m
distance classes (note that for the unmanaged stand distance classes were combined
between 30 to 60 metres). Shaded areas represent 95% confident intervals obtained
from 10,000 permutations of genotypes among locations. Black bars around mean
kinship Fij values represent standard errors derived through jackknifing over loci.
Figure 5.1 Predicted cumulative emergence over time across temperature treatments
(Current Temperature, Future Temperature) and population (ED, ET, WB, WS) using
a binomial error distribution. Grey dots represent observed data.
Figure 5.2 Total dry biomass (a) and root mass fraction RMF (b) of Scots pine
seedlings from the four studied populations across the temperature treatment

List of figures
xviii
(Current T, Future T). Refer to table 1 for population code key. Error bars represent±
SE.
Figure 5.3 Below-ground traits: root average diameter (a), Specific Root Length SRL
(b) and branching intensity (c) of Scots pine seedlings from the four studied
populations across the temperature treatment (Current T, Future T). Refer to table 1
for population code key. Error bars represent ± SE.
Figure 5.4 Above-ground traits: number of stomata rows (a) and mean needle length
(b) of Scots pine seedlings from the four studied populations across the temperature
treatment (Current T, Future T). Refer to table 1 for population code key. Error bars
represent ± SE.
Figure 5.5 Plasticity to change of the coefficient of genetic variation (CVA) of Scots
pine seedlings across the temperature treatment (Current CT, Future FT). Refer to
table 5.1 for population code key. Grey symbols represent above ground traits,
whereas black symbols represent below ground traits. Symbols above the dashed 0:0
line indicate higher CVA under future conditions (FT).

xix
List of supplementary material
S2.1 Continental study sites for the SSR (nuclear and chloroplast microsatellite
markers) European datasets
S2.2 Worldclim variables used as environmental predictors
S2.3 Scots pine occurrence data from the three sources: (a) TSDE Database filtered by
EURFORGEN, (b) Adult presence from national inventory dataset, and (c)
regeneration presence (seedlings) from national inventory dataset.
S3.1 Pairwise population differentiation (FST) (below diagonal) and differentiation
index D (above diagonal).
S3.2 Percentage of differentiated sites within Scotland using nSSR.
S3.3 Number of genetic clusters (K=2) identified by STRUCTURE for nSSR.
S3.4 Relative migration networks for nSSR with populations sorted in seed groups.
Seed group codes correspond to the following group of populations (see Tab. 2 for
population details): NE= ALT, GLT; SC= CCC, MEG, GLW; EC= ABE, ROT; SW=
COG, GLL, CRA; NC= GLA, AMA; NW= LOC, SHI, BEE; N= GLE, STO, RHI. (a) No
using a threshold, (b) using a threshold of 0.5.
S4.1 Genetic diversity estimators for each locus, study site and life stage.
S4.2 Pairwise FST values (below diagonal) and differentiation index D (Jost, 2008)
(above diagonal) among study sites and life stages.
S5.1 Traits and indexes used in the analysis.

xx

Chapter 1
General introduction

2

Introduction
3
1.1 Forest genetic diversity in a changing environment
Forests are among the most important repositories of terrestrial biodiversity, and
currently they cover the 30 percent of the global land area (FAO 2010). They provide a
broad range of ecosystem services, including providing habitat for many species,
watershed protection, erosion prevention and acting as carbon sinks, as well as
providing a wide range of livelihoods for people (Milennium Ecosystem Assessment,
2005). The enormous range of goods and services provided by trees and forests is both a
function of and testimony to the genetic diversity contained within them (FAO 2014a).
Forest genetic diversity can be expressed as any variation in all aspects of the tree
structure and represents the genetic variation among trees (Ennos et al. 1998). Forest
genetic diversity plays an essential role in underpinning forest resilience by facilitating
evolutionary processes, and it is key in forest responses to environmental changes and
disturbances, such as habitat loss, fragmentation or pathogen attack (DeSalle & Amato
2004, Schaberg et al. 2008, Alfaro et al. 2014, Cavers & Cottrell 2014, Ellegren & Ellegren
2016, Fady, Aravanopoulos, et al. 2016). In particular, the existence of a high level of
genetic diversity within stands is a prerequisite for forest trees to adapt and be resilient
to the unpredictable effects of a changing environment. Conversely, reduced levels of
variability are seen as limiting a species' ability to respond to these changes in both the
long and short term (Jump & Penuelas 2005).

Chapter 1
4
Over time forests have changed, adapted and evolved under changing conditions, and
those changes have shaped the levels of genetic variation found within them. For
instance, historical migrations as a consequence of past climate changes had a strong
effect in shaping spatial patterns of genetic diversity (Petit et al. 2003). Trees are
generally long-lived and have developed natural mechanisms to maintain high levels of
genetic variation (i.e. high rates of outcrossing or long-distance gene flow and the
resultant reproduction among unrelated distant individuals). These mechanisms,
combined with the fact that trees, as well as most other organisms, live in contrasting
environments, and usually undergo differential selective pressures, will set up the
context for adaptation to occur and determine the levels and extent of genetic variation.
Genetic variability will be crucial for adaptation to climatic regimes different from those
in which they have evolved (FAO 2014a).
In the present century, European forests are facing numerous threats, including habitat
destruction, fragmentation, pollution, climate change, poor silvicultural practices or the
use of low quality of poorly adapted forest reproductive material (Koskela & Buck
2007). Furthermore, those environmental changes are occurring at an unprecedented
rate and magnitude (IPCC 2013) which is predicted to intensify in the future with major
effects on biodiversity (Alfaro et al. 2014). It has been estimated that over 15 billion trees
are cut down each year (Crowther et al. 2015), which means that approximately 13
million hectares of natural forest are lost every year worldwide (FAO, 2010). However,

Introduction
5
the rate of net forest loss has been cut by over 50 percent during the last 25 years, due to
sustainable forest management, trees establish due to land abandonment. All those
environmental changes might challenge the adaptability of long-living forest tree
species. Some studies have already shown the impact that intensive forest management
practices can have on forest genetic diversity, such us changes in gene frequencies
(Schaberg et al. 2008), loss of alleles (Adams et al., 1998; Rajora et al., 2000; Kettle et al.,
2007; Ortego et al., 2010), or changes in the spatial organisation of genetic variation
(Piotti et al. 2013, Sjölund & Jump 2015). Global change is also altering growth and
mortality patterns (e.g. Galiano et al. 2010, Vilà-Cabrera et al. 2012), thereby likely
altering species distribution ranges over the coming decades (e.g. Thuiller et al. 2005).
Species distribution ranges might be altered even when genetic diversity is considered
(Benito Garzón et al. 2011, Oney et al. 2013). Furthermore, global change might have
unpredictable changes in the adaptive capacity of species which might result in
decreasing their ability to resist and recover from further environmental perturbations
(Jump & Penuelas 2005). Consequently, reductions in diversity due to environmental
changes or human activities might impact species resilience and increase the threat
from pest and diseases or maladaptation (Cavers & Cottrell 2014).
The importance of including genetic diversity features in sustainable forest
management has therefore been widely argued in recent years (Lefèvre et al. 2013, FAO
2014a, Alfaro et al. 2014, Cavers & Cottrell 2014, Fady, Cottrell, et al. 2016) particularly

Chapter 1
6
for marginal populations (Fady, Aravanopoulos, et al. 2016). Accordingly, several
schemes have been proposed for monitoring genetic diversity at the European
(Aravanopoulos et al. 2015) and international levels (Graudal et al. 2014), including the
quantification of both adaptive and neutral genetic diversity in forest trees. Maintaining
high levels of genetic variation will be essential for global change mitigation and
adaptation. As a consequence, forest practices that maintain genetic diversity over the
long term will be required as an integral component of sustainable forest management
(FAO 2014a).
Given almost universal recognition of the importance of including genetic variability in
forest management, it is crucial to understand which processes shape and maintain
forest genetic diversity and how the major forces of these processes interact. Therefore,
understanding the different processes responsible for the development and
maintainance of the genetic diversity of tree populations is essential to better predict
tree responses under new conditions.
1.2 Processes influencing forest genetic diversity
To monitor forest genetic resources and support the development of conservation
strategies it is important to understand the amount and distribution of neutral and
adaptive genetic diversity. Neutral and adaptive genetic diversity do not necessary
show the same diversity pattern, nor provide the same information, as they are shaped

Introduction
7
by different processes. Neutral variation has little or no effect on the phenotype of the
tree or on its performance (Ennos et al. 1998). It is characterized by a slower rate of
evolution of neutral sites and can reveal information about, for example, the breeding
system of the species, gene flow among and within populations, and the history of
populations. However, neutral diversity cannot inform about natural selection (Mason,
2004). Adaptive genetic variation underlies differences in the phenotype and thus,
performance and fitness of trees (Ennos et al. 1998). It is selectively important, and it
manifests variation in ecologically important characters such as phenology, growth,
morphology or pest resistance (Ennos et al. 1998). In contrast with neutral evolution,
adaptive variation can appear within one or a few generations (Petit et al. 2008), and
traditionally is detected in provenance and progeny trials and reciprocal transfer
experiments, where environmental variation can be controlled, thereby exposing the
genetic contribution to phenotypic variation.
The levels and distribution of genetic variation results from the joined action of
migration, mutation, selection and drift (Loveless & Hamrick 1984). Thus, neutral
variation may be governed mostly by mutation, migration and drift, whereas variation
at quantitative traits, or adaptive variation, should depend on a balance between
mutation, migration and selection (Karhu 2001). However, other factors might also
shape genetic variation, such us the breeding system, dispersal mode (i.e. wind or
Chapter 1
8
animal dispersed, etc), mode of reproduction (i.e. sexual, asexual) or the effective
population size.
Fluctuations in the numbers of alleles in a population between generations, are referred
to as genetic drift. Typically, genetic drift occurs in small populations, where
infrequently-occurring alleles face a greater chance of being lost. The ultimate
consequence of continuous genetic drift is that alleles are either lost from a population
or driven to fixation. Both possibilities decrease the genetic diversity of a population.
Migration is the movement of genes or organisms from one location to another. Since
tree individuals are non-motile, migration happens through seed and pollen flow. If the
migrating genes mate with the destination individuals, they can alter the existing
proportion of alleles in the destination population. Mutation refers to the permanent
alteration of the nucleotide sequence of the genome as a consequence of errors during
DNA duplication or other types of DNA damage (e.g. due to environmental factors
such us ultraviolet radiation or chemicals). Selection indicates the differential survival
and reproduction of individuals due to differences in the phenotype.
There is a more developed understanding of the links between such evolutionary
processes and the levels and maintenance of genetic variation than the external forces
governing those processes. However, as rapid anthropogenic environmental change is
altering selection pressures on natural plant populations, some additional external

Introduction
9
pressures, such us environmental variation (i.e. variation in geography or presence of
fragmentation), changes in climate or changes in management, might influence such
evolutionary processes and therefore the levels and maintenance of genetic variation at
different temporal and spatial scales (Figure 1.1).
Figure 1.1 Processes influencing neutral and adaptive genetic variation.
Environmental variation- Variation in geography
The genetic diversity and genetic structure of tree populations, and the forces shaping
gene flow within and between populations, are influenced by the landscapes they occur
within. Geographic heterogeneity exists everywhere within nature and the landscapes
they occur in, and are distributed neither uniformly nor randomly but structured in
space and time (Loveless & Hamrick 1984, Legendre 1993). Geographic heterogeneity

Chapter 1
10
occurs over a range of spatial and temporal scales and may imply different selection
pressures resulting in diverse adaptations. Geographic heterogeneity can also imply
physical barriers, such us mountains (Naydenov et al. 2011) or oceans, or fragmentation
(Provan et al. 2007, Cuartas-Hernández et al. 2010) that may even restrict gene flow.
However, in some cases, increases of pollen flow counteract diversity loss resulting
from fragmentation (White et al. 2002, Petit & Hampe 2006, Wang et al. 2012, Davies et
al. 2013). Geographic heterogeneity may be also accompanied by different levels of
competition, predation, or pathogen prevalence.
Environmental variation- Variation in climate
Climate changes over time. Climatic fluctuations over the Earth´s surface have
modelled actual distribution of trees, and therefore patterns of genetic composition of
trees. Specifically, climatic conditions in the Late Quaternary, which peaked with the
major cold event 26,000-19,000 years ago (Chiverrell & Thomas 2010), caused a large
part of the Northern Hemisphere to be covered by ice or become otherwise
uninhabitable (Willis 2000a). Temperatures in some areas of Northern Europe were 10-
20°C cooler than the present (Barron & Pollard 2002, Annan & Hargreaves 2013)
(Figure 1.2). These conditions restricted most tree species to patchy, discontinuous and
climatically constrained areas designated as glacial refugia (Cheddadi et al. 2006). Such
conditions in climate and the following migrations once conditions became favorable

Introduction
11
have influenced subsequent levels and distribution of genetic variation (Hewitt 1996,
2000)
Figure 1.2 Temperature anomaly at Last Glacial Maximum (LGM) (taken from (Annan & Hargreaves
2013))
Climatic changes and species range shifts have been a recurrent phenomenon
throughout the history of Earth (Hampe & Jump 2011). Recent changes in climate may
also impose different selection pressures on plant species resulting in diverse
adaptations to new conditions. During the last century, global mean temperature has
increased substantially (Figure 1.3) and, if greenhouse gas emissions continue at current
rates, it is predicted to continue to rise through the 21st Century (IPCC, 2013).
Furthermore, these changes will be accompanied by an alteration of precipitation
patterns and an increase on the frequency of extreme events (i.e. torrential rainfall or

Chapter 1
12
severe drought) (IPCC, 2013). Changes in global climate are therefore likely to have
important consequences for species persistence and for forest population dynamics at
different scales (Peñuelas & Boada 2003, van Mantgem et al. 2009, Matías & Jump 2015,
Matías et al. 2016). Forecasting the impact of a particular change in climate on
individual tree species has been complex, as the local outcome of global changes is hard
to predict. Furthermore, the rate of climate changes or the presence of extreme events,
might lead to rapid and directional changes in allele frequency within populations,
whose outcome is difficult to anticipate (Jump et al. 2009).
Figure 1.3 Observed change in surface temperature from 1901 until 2012 (IPCC, 2013).
Climate also changes over space. The existence of genetic variability associated with
climatic variation, such as temperature, light, wind or water availability, at the
intraspecific level has been detected for many species both among and within
populations (e.g. (Martínez-Vilalta et al. 2009, Matías et al. 2014)). Furthermore, climate

Introduction
13
might also influence genetic variation by limiting migration, or even promoting
contrasting flowering timing in some areas and leading to mating asynchronies (Whittet
et al. 2017).
Human influence
Anthropogenic impacts remain the leading cause of deforestation, with changes in land
use being the primary driver. Deforestation, fragmentation and forest exploitation
through forest practices such us logging or thinning have promoted a widespread
modification of Europe’s forests, impacting genetic diversity within and among
populations (FAO 2014a). It is thought that intensive forest exploitation influences the
evolutionary processes of selection, drift, gene flow and mutation, sometimes increasing
diversity, as in the case of domestication, but often reducing it (Ledig 1992), promoting
changes in gene frequencies (Schaberg et al. 2008) or losses of alleles (Adams et al., 1998;
Rajora et al., 2000; Kettle et al., 2007; Ortego et al., 2010). However, we lack a clear
understanding of the genetic impacts of forest exploitation and fragmentation (Young et
al. 1996, Rajora & Pluhar 2003, Bradshaw 2004, Schaberg et al. 2008, García-Gil et al.
2015). Therefore, a better knowledge of the effects of forest practices on forest genetic
diversity is needed.

Chapter 1
14
1.3 The study case: Scots pine
Pinus sylvestris L. is a wind-pollinated outcrossing conifer with the most widespread
distribution of the genus. Its range covers Eurasia from the northern Fennoscandia in
the North in Norway to the South of Spain and South of Turkey and from the West of
Scotland, to Asia in the East (Carlisle & Brown 1968) (Figure 1.4). It is a very valuable
species, both economically and ecologically. Its strong timber is frequently used in
construction and industry. Scots pine forest provides a range of habitat for numerous
species, as the case of the endangered capercaillie (Tetrao urogallus) or twinflower
(Linnea borealis). Scots pine is a monoecious species, with male and female flowers
found on the same tree. Male inflorescences appear in large groups, and their colour
varies from yellow to violet-yellow, usually in the lower branches, whereas female
flowers are small, red-purple and globular, usually in the upper branches. The
reproductive system of pines is exclusively sexual and both pollen and seeds possess
adaptations for wind dispersal.

Introduction
15
Figure 1.4 Scots pine global distribution. Presence data obtained from EUFORGEN database. Green areas
represent natural presence of Scots pine.
At global scales, a considerable amount of prior research has focussed on the levels of
neutral genetic variation in this species (Table 1.1). Most of these studies involve two
approaches, either separately or in combination: (a) descriptive analyses of the levels
and/or structure of genetic variation and/or (b) phylogeographical analysis.
Most studies of diversity have shown that, in general, Scots pine populations are not
genetically impoverished (Provan et al. 1998, Robledo-Arnuncio et al. 2005, Wachowiak
et al. 2011, 2013, Pavia et al. 2014, García-Gil et al. 2015) and that the partitioning of
neutral genetic variation is most often found within populations, with a much smaller
component due to differences between them (Provan et al. 1998, Robledo-Arnuncio et

Chapter 1
16
al. 2005, González-Díaz et al. 2017, Tóth et al. 2017). Several studies addressing
phylogeographical analysis have proposed that Scots pine retreated to the southern
European peninsulas during the Last Glacial Maximum (LGM) (Prus-Glowacki &
Stephan 1994, Sinclair et al. 1999, Soranzo et al. 2000, Cheddadi et al. 2006, Labra et al.
2006, Naydenov et al. 2007, Bilgen & Kaya 2007, Scalfi et al. 2009, Belletti et al. 2012,
Prus-Glowacki et al. 2012, Dering et al. 2017). However, an increasing body of evidence
suggests that not only southern but also sparse and mid-northern refugia might have
contributed to the Holocene expansion of Scots pine (Willis et al. 2000, Willis & van
Andel 2004, Cheddadi et al. 2006, Naydenov et al. 2007, Pyhäjärvi et al. 2008, Prus-
Glowacki et al. 2012, Parducci et al. 2012, Buchovska et al. 2013, Bernhardsson et al.
2016, Dering et al. 2017, Tóth et al. 2017). Consequently, several migration routes have
been proposed which might have crossed the continent in several fronts, a western
(Pyhäjärvi et al. 2008, Dering et al. 2017, Tóth et al. 2017) and an eastern font (Naydenov
et al. 2007, Buchovska et al. 2013, Tzedakis et al. 2013).

Introduction
17
Table 1.1 Overview of neutral genetic diversity studies with Scots pine Genome
region Molecular
marker Location Nm Np Ni Diversity H FST or GST Reference
Allozyme
Sweeden 11 5 - 0.307 - - Rudin et al., 1974
Poland 12 - 22 0.321 - - Krzakowa et al. 1997
Poland, German, Hungary, Turkey 3 19 - 0.313 - - Mejnartowicz 1979
Sweeden 9 3 - 0.303 - - Gullberg et al. 1982
Sweeden 11 9 - 0.31 - - Gullberg et al. 1985
Scotland 16 14 - 0.309 - - Kinloch et al. 1986
Sweeden 13 3 - 0.283 - - Muona & Harju 1989
Sweeden, China 14 7 - 0.211 - - Wang et al. 1991
Sweeden, Turkey 14 16 - 0.235 - - Szmidt & Wang 1993
Switzerland 11 3 - 0.271 - - Neet-Sarqueda 1994
Latvia, Ukraine, Russia 21 18 - 0.273 - - Goncharenko et al. 1994
Eastern Europe, Turkey 8 13 - 0.356 - - Prus-Glowacki & Bernard 1994
Poland 7 5 - 0.344 - - Szweykowski et al 1994
Poland - - - - - - Chybicki et al. 2008
North Europe 14 2 494 0.371-0.374 - - Prus-Glowacki et al. 1993
Isoenzymes
Spain, E and N Europe 8+16 - - - 0.040 Prus-Glowacki & Stpehan 1994
Spain, France - 14&2 - 0.302-0.311 - 0.042 Prus-Glowacki et al. 2003
Europe 10 51 - - - - Prus-Glowacki et al. 2012
Turkey 10 6 - - - - Bilgen & Kaya 2007
Monoterpene
Scotland 41 6705 - - - Forrest et al. 1980
Norway, Sweeden, Poland, Cz, Scotland 6 - - - - Forrest et al. 1982
Scotland - - - - - Kinloch et al. 1986
Turkey 9 - - - - Semiz et al. 2007
Bulgaria 12 432 - 11 0.088 Naydenov et al. 2005
cpD
NA
SSR
Greece, Italy 1 7 - 0.411 - 0.222 Powel et al. 1995
Scotland 13 15 330 0.969 174 - Provan et al. 1998
Bulgaria 6 12 432 40.93 134 0.049/0.064 Naydenov et al. 2005
Spain 6 13 322 0.978 139 0.024 Robledo-Arnuncio et al. 2005
Europe 7 35 1380 - 178 0.060 Chedaddi et al. 2006
Italy 2 4 96 0.92 17 0.140 Scalfi et al. 2009
Spain 6 30 706 - 307 0.070/0.191 Soto et al., 2010
Portugal, Spain, Central Europe 5 6 96 - 56 - Pavia et al. 2014
Sweeden 11 3 571 0.56 - - Garcia-Gil et al. 2015
Romania 14 13 326 0.44 - 0.120 Bernhardsson et al. 2016
Scotland 5 18 469 0.931 64 - Gonzalez-Diaz et al. under review
Carpathian rerion 4 20 421 0.546 141 0.074 Toth et al. 2017
Europe 13 92 1384 0.786 73 0.015 Dering et al., 2017

Chapter 1
18
mtD
NA
RFLP
Scotland - 20 466 0.12 3 0.37 Sinclair et al., 1998
Europe - 38 762 4 - Sinclair et al., 1999
Sequence
polimorphism
Scotland 1 region 23 747 2 0.59 Soranzo et al. 2000
Italy 1 region 10 87 - 2 - Labra et al. 2006
Europe 1 region 106 1380 - 3 0.80 Chedaddi et al. 2006
Eurasia 2 region 54 986 0.141 3 0.657 Naydenov et al. 2007
Europe 2 region 37 714 0.200 4 0.655 Pyhajarvi et al. 2008
Eastern Europe, Ural mountains 2 region 54 474 0.300 2 0.239 Bukovska 2013
Sweeden 1 region 3 554 0.240 - - Garcia-Gil, 2015
Romania 2 region 13 326 0.200 3 0.196 Bernhardsson, 2016
Europe 2 region 92 1384 0.131 5 0.628 Dering et al., 2017
SNP Scotland 2 region 12 120 1 - Wachowiak et al., 2013
nD
NA
ISSR Italy 8 10 87 0.264 - - Labra et al 2006
SSR
Italy 3 4 96 0.810 - 0.080 Scalfi et al. 2009
Bulgaria 6 12 36 0.622 - 0.154 Naydenov et al. 2011
Italy 9 21 449 0.847 - 0.058 Belleti et al. 2012
Norway 3 1 57 0.853 - - Nowakowska et al., 2014
Portugal, Spain, Central Europe 4 6 96 0.910
0.100 Pavia et a., 2014
Sweeden 8 3 581 0.790 - - Garcia-Gil et al. 2015
Romania 10 13 324 0.550 - 0.056 Bernhardsson et al. 2016
Scotland 6 18 540 0.607 - 0.019 Gonzalez-Diaz et al., under review
Carpathian region 8 20 421 0.586 - 0.071 Toth et al. 2017
Scotland and Siberia 3 3 777 0.574/0.579
0.004/0.035 Gonzalez-Diaz et al., 2017
SNP
Europe 16 8 40 - - -0.030 - 0.140 Pyhajarvi et al. 2007
Scotland 12 21 42 0.0078 - - Wachowiak et al., 2011
Scotland - 12 120 0.0098 - 0.010 Wachowiak et al., 2013
Nm refers to Number of markers / loci (region with variation/region tested), Np refers to number of populations, Ni refers to number of individuals, Diversity refers to (He or
nucleotide diversity). H refers to Number of haplotypes / terpenes.

Introduction
19
Furthermore, studies focussing on adaptive variation in Scots pine were developed as
early as the beginning of the 20th Century by researchers associated with the
International Union of Forest Research Organisations (IUFRO), where provenance trails
from Eurasia were performed (Giertych 1979). Differences were found among
provenances in height growth, resistance to frost or diseases, anatomical structures or
wood quality, among others (Giertych & Oleksyn 1992). For many years, extensive
studies have documented variation between populations throughout its distribution.
Thus, numerous studies found differences among latitudinal populations in traits
related to timing of growth (Notivol et al. 2007, Garcia-Gil et al. 2003, Clapham et al.
2002), cold resistance (Wachowiak et al. 2009, Hurme et al. 1997, Aho 1994), light spectra
(Ranade & García-Gil 2013) or drought response (Matías et al. 2014). But also differences
in relation to frost hardiness have been found between populations separated on a
longitudinal gradient (Andersson & Fedorkov 2004).
In Britain, native Scots pine populations are restricted to Scotland. Here, Scots pine is
the iconic species of the Caledonian pinewoods, which are recognized as descendants of
the original forests that once occupied the British Isles after the last Ice Age, covering a
total area of 18,000 ha. Nowadays, native Scots pine forests in Scotland occupy only 1%
of the area that they used to cover in the past, scattered over 84 fragments (Mason, 2004)
(Figure 1.5) where they represent the North-West limit of the species distribution.
Several millennia of isolation with respect to continental European populations raise the

Chapter 1
20
possibility that these Scottish forests might harbor local adaptations and constitute
valuable forest genetic resources. Scots pine is unlikely to face extinction at species level
across its distribution as a result of predicted climate change. Nevertheless, small or
fragmented populations, such as those in Scotland, might be at risk of decline.
Furthermore, several questions remain about the origins of Scots pine populations in
Scotland (UK), for which multiple colonisation sources have been suggested (Forrest
1980, Bennett 1984, 1995, Kinloch et al. 1986, Sinclair et al. 1998, Provan et al. 1998).
The differential contribution of processes determining distribution of genetic variation
in Scots pine (i.e. migration, mutation, selection and drift) and the external forces
shaping such processes (i.e. geographic variation, climatic variation and human
interference) at different temporal and spatial scales remain poorly understood.
Understanding the different processes responsible for developing and maintaining the
genetic diversity of Scots pine will be essential to better predict tree responses under
new conditions.

Introduction
21
Figure 1.5 Example of some Scots pine populations from Scotland studied in the present thesis. Top left:
Beinn Eighe; top right: Shieldaig; middle left: Glenn Affric; middle right: Abernethy; bottom left: Glen
Derry; bottom right: Glen Tanar. [Photographs by P. González-Díaz]

Chapter 1
22
1.4 Thesis outline
The general aim of this thesis is to determine how different forces interact to shape and
maintain within and among population genetic diversity of Scots pine and what the
implications are for conservation and management under forthcoming environmental
conditions.
After this first introductory chapter, four research-based chapters are presented (see
Table 1.2 for details of research-based chapters), each in manuscript format before a
concluding general discussion (Chapter 6). The focus of these chapters is as follows:
Chapter 2: Understanding the role of past climate changes and geographical barriers in the
genetic structure of Scots pine
The aim of this chapter is to disentangle how historic climate changes and geographical
barriers have influenced past demographic processes and consequent genetic structure
of Scots pine at the European scale. We combined genetic and palaeoenviromental data
to assess past demographic processes and consequent genetic structure. Firstly, we used
an approximate Bayesian computation framework to determine the role of refugial
populations to subsequent Holocene migration and main colonisation sources for
central and northern European populations. Secondly, we used a species distribution
modelling approach to determine the most likely suitable areas for the survival of the
species during the historical climate changes (i.e. Last Glacial Maximum).

Introduction
23
Chapter 3: Weak isolation by distance and geographic diversity gradients persist in Scottish
relict pine forest, potentially linked to flowering asynchrony and effective gene flow
The aim of this chapter is to assess how gene flow and genetic drift interact to maintain
genetic diversity at a regional scale. We examined patterns of genetic diversity within
and among populations across Scotland to investigate the levels of diversity and the
existence of trend of isolation by distance. We used gene flow networks to investigate
any directionality in the patterns.
Chapter 4: Ecology and management history drive spatial genetic structure in Scots pine
The aim of this chapter is to investigate the effects of historical and contemporary
forest management, characterized by intense felling and natural regeneration
respectively, on genetic diversity and fine-scale SGS in adult and juvenile cohorts. We
examined patterns of genetic diversity, both levels and structure, of fragmented Scots
pine stands in the Scottish Highlands, and compared them with a remote, unmanaged
stand. We also compared the forest age structure by using core data.
Chapter 5: Scots pine from a heterogeneous Scottish landscape grown under controlled
environment conditions show substantial intra-population adaptive diversity but a consistent
response to a simulated warmer climate.
The aim of this chapter is to characterize the intraspecific adaptive variation in Scots
pine early growth traits (seed mass, seedling emergence, biomass accumulation and key

Chapter 1
24
above & below traits) among and within populations, relate this to spatial variation in
home site environment, and estimate the likely response of those populations to
projected climate change. We used a common garden approach under strictly-
controlled conditions with two temperature treatments, current temperature and
increased temperature. We used linear mixed models to assess the level and extent of
traits variation and linear regression to analyse germination ratios.

Introduction
25
Table 1.2 General overview of the thesis, specifying objectives, methods and results in form of publications resulted from each of the thesis
chapter.
Chapter Objective
Methods
Result Study
area Data Type
Statistical
method
Temporal
scale
Spatial
scale
2
To dissentangle how historic
climate changes and
geographical barriers have
influenced past demographic
processes and consequent
genetic structure
Europe
&
Scotland
nSSR Approximate
Bayesian
Computation Past &
Present
González-Díaz et al.
(under preparation)
Expected to be sent to
Molecular Ecology
cpSSR
Continental
SNP
Ocurrence data
(EUFORGEN,
TSDE, IFN)
Species
distribution
models
3
To assess how gene flow and
genetic drift interact to
maintain genetic diversity
Scotland
nSSR Common test,
bayesian
clustering, gene
flow networks
Present Regional González-Díaz et al.
(under review) iForest cpSSR
4
To understand the effects of
historical and contemporary
forest management practices
in the spatial distribution and
levels of genetic variation
Scotland
&
Siberia
nSSR
Common test,
spatial
autocorrelograms
Past &
Present Local
González-Díaz et al., 2017.
Forest Ecology and
Managment
DOI:
10.1016/j.foreco.2017.05.035
d.b.h. and trunk
cores Linear model
5
To characterize the
intraspecific adaptive
variation in Scots pine early
growth traits among and
within populations, relate this
to spatial variation in home
site environment, and
estimate the likely response of
those populations to projected
climate change
Scotland
Germination Logisitic
regresssion
Present &
Future
Local &
Regional
González-Díaz et al.
(under preparation)
Expected to be sent to Tree
Physiology Other adaptive traits
Mixed effect
models
Published papers are indicated with relevant DOI numbers

Chapter 1
26
1.5 References
Adams WT, Zuo J, Shimizu JY, Tappeiner JC (1998) Impact of alternative regeneration
methods on genetic diversity in coastal Douglas-fir. For Sci 44:390–396
Alfaro RI, Fady B, Vendramin GG, Dawson IK, Fleming RA, Sáenz-Romero C, Lindig-
Cisneros RA, Murdock T, Vinceti B, Navarro CM, Skrøppa T, Baldinelli G, El-
Kassaby YA, Loo J (2014) The role of forest genetic resources in responding to biotic
and abiotic factors in the context of anthropogenic climate change. For Ecol Manage
333:76–87
Andersson B, Fedorkov A (2004) Longitudinal Differences in Scots pine Frost
Hardiness. Silvae Genet 53:76–80
Annan JD, Hargreaves JC (2013) A new global reconstruction of temperature changes at
the Last Glacial Maximum. Clim Past 9:367–376
Aravanopoulos FA, Tollefsrud MM, Kätzel R, Soto A, Graudal L, Nagy L, Koskela J,
Bozzano M, Pilipovic A, Zhelev P, Boži G (2015) Development of genetic
monitoring methods for genetic conservation units of forest trees in Europe
(European Forest Genetic Resources Programme (EUFORGEN), Ed.). Biodiversity
International, Rome, Italy
Barron E, Pollard D (2002) High-Resolution Climate Simulations of Oxygen Isotope
Stage 3 in Europe. Quat Res 58:296–309
Belletti P, Ferrazzini D, Piotti A, Monteleone I, Ducci F (2012) Genetic variation and
divergence in Scots pine (Pinus sylvestris L.) within its natural range in Italy. Eur J
For Res 131:1127–1138
Benito Garzón M, Alía R, Robson TM, Zavala M a. (2011) Intra-specific variability and
plasticity influence potential tree species distributions under climate change. Glob
Ecol Biogeogr 20:766–778

Introduction
27
Bennett KD (1984) The post-glacial history of Pinus sylvestris in the British Isles.
Quaternaty Sci Rev 3:133–155
Bennett KD (1995) Post-glacial dynamics of pine (Pinus sylvestris L. and pinewoods in
Scotland. In: Aldhous JR (ed) Our pinewood heritage, Forestry C.
Bernhardsson C, Floran V, Ganea SL, García-gil MR (2016) Present genetic structure is
congruent with the common origin of distant Scots pine populations in its
Romanian distribution. For Ecol Manage 361:131–143
Bilgen BB, Kaya N (2007) Allozyme variations in six natural populations of scots pine
(Pinus sylvestris) in Turkey. Biologia (Bratisl) 62:697–703
Bradshaw RHW (2004) Past anthropogenic influence on European forests and some
possible genetic consequences. For Ecol Manage 197:203–212
Buchovska J, Danusevičius D, Baniulis D, Stanys V, Šikšnianiene JB, Kavaliauskas D
(2013) The location of the Northern glacial refugium of scots pine based on
mitochondrial DNA markers. Balt For 19:2–12
Carlisle A, Brown AHF (1968) Pinus sylvestris L. J Ecol 56:269–307
Cavers S, Cottrell JE (2014) The basis of resilience in forest tree species and its use in
adaptive forest management in Britain. Forestry 88:13–26
Cheddadi R, Vendramin GG, Litt T, Kageyama M, Lorentz S, Laurent J, Beaulieu J De,
Sadori L, Jost A, Lunt D (2006) Imprints of glacial refugia in the modern genetic
diversity of Pinus sylvestris. Glob Ecol Biogeogr:271–282
Chiverrell RC, Thomas GSP (2010) Extent and timing of the Last Glacial Maximum
(LGM) in Britain and Ireland: a review. J Quat Sci 25:535–549
Clapham DH, Ekberg I, Eriksson G, Norell L, Vince-prue D (2002) Requirement for far-
red light to maintain secondary needle extension growth in northern but not
southern populations of Pinus sylvestris ( Scots pine ). :207–212
Crowther TW, Glick HB, Covey KR, Bettigole C, Maynard DS, Thomas SM, Smith JR,
Hintler G, Duguid MC, Amatulli G, Tuanmu M-N, Jetz W, Salas C, Stam C, Piotto

Chapter 1
28
D, Tavani R, Green S, Bruce G, Williams SJ, Wiser SK, Huber MO, Hengeveld GM,
Nabuurs G-J, Tikhonova E, Borchardt P, Li C-F, Powrie LW, Fischer M, Hemp A,
Homeier J, Cho P, Vibrans a. C, Umunay PM, Piao SL, Rowe CW, Ashton MS,
Crane PR, Bradford M a. (2015) Mapping tree density at a global scale. Nature
525:201–206
Cuartas-Hernández S, Núñez-Farfán J, Smouse PE (2010) Restricted pollen flow of
Dieffenbachia seguine populations in fragmented and continuous tropical forest.
Heredity (Edinb) 105:197–204
Davies SJ, Cavers S, Finegan B, White A, Breed MF, Lowe AJ (2013) Pollen flow in
fragmented landscapes maintains genetic diversity following stand-replacing
disturbance in a neotropical pioneer tree, Vochysia ferruginea Mart. Heredity
(Edinb) 115:125–129
Dering M, Kosiński P, Wyka TP, Pers E, Boratyński A, Boratyńska K, Reich PB, Romo A,
Zadworny M, Żytkowiak R, Oleksyn J (2017) Tertiary remnants and Holocene
colonizers: Genetic structure and phylogeography of Scots pine reveal higher
genetic diversity in young boreal than in relict Mediterranean populations and a
dual colonization of Fennoscandia. Divers Distrib:540–555
DeSalle R, Amato G (2004) The expansion of conservation genetics. Nat Rev Genet
5:702–712
Ellegren H, Ellegren N (2016) Determinants of genetic diversity. Nat Publ Gr 17:422–433
Ennos RA, Worrell R, Malcolm DC (1998) The genetic management of native species in
Scotland. Forestry 71:1–23
Fady B, Aravanopoulos FA, Alizoti P, Mátyás C, Wühlisch G von, Westergren M,
Belletti P, Cvjetkovic B, Ducci F, Huber G, Kelleher CT, Khaldi A, Kharrat MBD,
Kraigher H, Kramer K, Mühlethaler U, Peric S, Perry A, Rousi M, Sbay H, Stojnic S,
Tijardovic M, Tsvetkov I, Varela MC, Vendramin GG, Zlatanov T (2016) Evolution-
based approach needed for the conservation and silviculture of peripheral forest

Introduction
29
tree populations. For Ecol Manage 375:66–75
Fady B, Cottrell J, Ackzell L, Alía R, Muys B, Prada A, González-Martínez SC (2016)
Forests and global change: what can genetics contribute to the major forest
management and policy challenges of the twenty-first century? Reg Environ Chang
16:927–939
FAO (2010) Global forest resources assessment 2010. Food and agriculture organization
of the united nations, Rome, Italy
FAO (2014a) The state of the world’s forest genetic resources. Commission on genetic
resources for food and agriculture, Rome, Italy
FAO (2014b) The state of the world’s forest genetic resources. Commission on genetic
resources for food and agriculture, Rome, Italy
Forrest GI (1980) Genotypic variation among native Scots pine populations in Scotland
based on monoterpene analysis. Forestry 53:101–128
Galiano L, Martínez-Vilalta J, Lloret F (2010) Drought-Induced Multifactor Decline of
Scots Pine in the Pyrenees and Potential Vegetation Change by the Expansion of
Co-occurring Oak Species. Ecosystems 13:978–991
García-Gil MR, Floran V, Östlund L, Mullin TJ, Gull BA (2015) Genetic diversity and
inbreeding in natural and managed populations of Scots pine. Tree Genet Genomes
11:28
García-Gil MR, Mikkonen M, Savolainen O (2003) Nucleotide diversity at two
phytochrome loci along a latitudinal cline in Pinus sylvestris. Mol Ecol 12:1195–
1206
Giertych M (1979) Summary of results on Scots pine (Pinus sylvestris L.) height growth
in IUFRO provenance experiments. Silvae Genet 28:136–152
Giertych M, Oleksyn J (1992) Studies on genetic variation in Scots pine (Pinus sylvestris
L.) coordinated by IUFRO. Silvae Genet 41:133–143
González-Díaz P, Jump AS, Perry A, Wachowiak W, Lapshina E, Cavers S (2017)

Chapter 1
30
Ecology and management history drive spatial genetic structure in Scots pine. For
Ecol Manage 400:68–76
Graudal L, Aravanopoulos F, Bennadji Z, Changtragoon S, Fady B, Kjær ED, Loo J,
Ramamonjisoa L, Vendramin GG (2014) Global to local genetic diversity indicators
of evolutionary potential in tree species within and outside forests. For Ecol
Manage 333:35–51
Hampe A, Jump AS (2011) Climate Relicts: Past, Present, Future. Annu Rev Ecol Evol
Syst 42:313–333
Hewitt GM (1996) Some genetic consequences of ice ages, and their role, in divergence
and speciation. Biol J Linn Soc:247–276
Hewitt GM (2000) The genetic legacy of the Quaternary ice ages. Nature 405:907–13
Hurme P, Repo T, Savolainen O, Pääkkönen T (1997) Climatic adaptation of bud set and
frost hardiness in Scots pine ( Pinus sylvestris ). Can J For Res 27:716–723
IPCC (2013) Climate change 2013: the physical science basis. Contribution of Working
Group I to the Fifth Assessment Report of the Intergovernmental Panel on Climate
Change (eds Stocker TF, Qin D, Plattner G-K, Tignor M, Allen SK, Boschung J,
Nauels A, Xia Y, Bex V, Midgley PM), Cambridge University Press, Cambridge and
New York, NY
Jump AS, Marchant R, Peñuelas J (2009) Environmental change and the option value of
genetic diversity. Trends Plant Sci 14:51–8
Jump AS, Penuelas J (2005) Running to stand still: adaptation and the response of plants
to rapid climate change. Ecol Lett 8:1010–1020
Karhu A (2001) EVOLUTION AND APPLICATIONS OF PINE MICROSATELLITES.
Kettle CJ, Hollingsworth PM, Jaffré T, Moran B, Ennos R a (2007) Identifying the early
genetic consequences of habitat degradation in a highly threatened tropical conifer,
Araucaria nemorosa Laubenfels. Mol Ecol 16:3581–3591
Kinloch B, Westfall RD, Forrest GI (1986) Caledonian Scots pine: origins and genetic

Introduction
31
structure. New Phytol 104:703–729
Koskela J, Buck A (2007) Climate change and forest genetic diversity.
Labra M, Grassi F, Sgorbati S, Ferrari C (2006) Distribution of genetic variability in
southern populations of Scots pine (Pinus sylvestris L.) from the Alps to the
Apennines. Flora - Morphol Distrib Funct Ecol Plants 201:468–476
Ledig FT (1992) Human impacts on genetic diversity in forest ecosystems. Oikos 63:87–
108
Lefèvre F, Koskela J, Hubert J, Kraigher H, Longauer R, Olrik DC, Schüler S, Bozzano
M, Alizoti P, Bakys R, Baldwin C, Ballian D, Black-Samuelsson S, Bednarova D,
Bordács S, Collin E, Cuyper B De, Vries SMG De, Eysteinsson T, Frýdl J,
Haverkamp M, Ivankovic M, Konrad H, Koziol C, Maaten T, Notivol Paino E,
Öztürk H, Pandeva ID, Parnuta G, Pilipovič A, Postolache D, Ryan C, Steffenrem
A, Varela MC, Vessella F, Volosyanchuk RT, Westergren M, Wolter F, Yrjänä L,
ZariEngA I (2013) Dynamic Conservation of Forest Genetic Resources in 33
European Countries. Conserv Biol 27:373–384
Legendre P (1993) Spatial autocorrelation : trouble or new paradigm? Ecol Soc Am
74:1659–1673
Loveless MD, Hamrick JL (1984) Ecological determinants of genetic structure in plant
populations. Annu Rev Ecol Syst 15:65–95
Mantgem PJ van, Stephenson NL, Byrne JC, Daniels LD, Franklin JF, Fulé PZ, Harmon
ME, Larson AJ, Smith JM, Taylor AH, Veblen TT (2009) Widespread Increase of
Tree Mortality Rates in the Western United States. Science (80- ):521–524
Martínez-Vilalta J, Cochard H, Mencuccini M, Sterck F, Herrero a, Korhonen JFJ,
Llorens P, Nikinmaa E, Nolè a, Poyatos R, Ripullone F, Sass-Klaassen U, Zweifel R
(2009) Hydraulic adjustment of Scots pine across Europe. New Phytol 184:353–64
Mason, W.L., Hampson, A. and Edwards, C., 2004 Managing the pinewoods of
Scotland. Forestry Commission, Edinburgh.

Chapter 1
32
Matías L, González-Díaz P, Jump AS (2014) Larger investment in roots in southern
range-edge populations of Scots pine is associated with increased growth and
seedling resistance to extreme drought in response to simulated climate change.
Environ Exp Bot 105:32–38
Matías L, González-Díaz P, Quero JL, Camarero JJ, Lloret F, Jump AS (2016) Role of
geographical provenance in the response of silver fir seedlings to experimental
warming and drought. Tree Physiol 0:1–11
Matías L, Jump AS (2015) Asymmetric changes of growth and reproductive investment
herald altitudinal and latitudinal range shifts of two woody species. Glob Chang
Biol 21:882–96
Millennium Ecosystem Assessment (2005) Ecosystems and Human Well-Being: Current
State and Trends. Island Press, Washington, DC.
Naydenov KD, Naydenov MK, Tremblay F, Alexandrov A, Aubin-Fournier LD (2011)
Patterns of genetic diversity that result from bottlenecks in Scots Pine and the
implications for local genetic conservation and management practices in Bulgaria.
New For 42:179–193
Naydenov KD, Senneville S, Beaulieu J, Tremblay F, Bousquet J (2007) Glacial vicariance
in Eurasia: mitochondrial DNA evidence from Scots pine for a complex heritage
involving genetically distinct refugia at mid-northern latitudes and in Asia Minor.
BMC Evol Biol 7:233
Notivol E, García-Gil MR, Alía R, Savolainen O (2007) Genetic variation of growth
rhythm traits in the limits of a latitudinal cline in Scots pine. Can J For Res 37:540–
551
Oney B, Reineking B, O’Neill G, Kreyling J (2013) Intraspecific variation buffers
projected climate change impacts on Pinus contorta. Ecol Evol 3:437–49
Ortego J, Bonal R, Muñoz A (2010) Genetic consequences of habitat fragmentation in
long-lived tree species: the case of the mediterranean Holm Oak (Quercus ilex, L.). J

Introduction
33
Hered 101:717–726
Parducci L, Jørgensen T, Tollefsrud MM, Elverland E, Alm T, Fontana SL, Bennett KD,
Haile J, Matetovici I, Suyama Y, Edwards ME, Andersen K, Rasmussen M,
Boessenkool S, Coissac E, Brochmann C, Taberlet P, Houmark-Nielsen M, Larsen
NK, Orlando L, Gilbert MTP, Kjær KH, Alsos IG, Willerslev E (2012) Glacial
survival of boreal trees in northern Scandinavia. Science 335:1083–6
Pavia I, Gaspar MJ, Carvalho A, Heinze B, Lima-Brito J (2014) Preliminary evidence of
two potentialy native populations of Pinus sylvestris L . in Portugal based on
nuclear and ... Austrian J For Sci
Peñuelas J, Boada M (2003) A global change-induced biome shift in the Montseny
mountains ( NE Spain ). Glob Chang Biol:131–140
Petit RJ, Aguinagalde I, Beaulieu J-L de, Bittkau C, Brewer S, Cheddadi R, Ennos R,
Fineschi S, Grivet D, Lascoux M, Mohanty A, Müller-Starck G, Demesure-Musch B,
Palmé A, Martín JP, Rendell S, Vendramin GG (2003) Glacial refugia: hotspots but
not melting pots of genetic diversity. Science (80- ) 300:1563–1565
Petit RJ, Hampe A (2006) Some evolutionary consequences of being a tree. Annu Rev
Ecol Evol Syst 37:187–214
Petit RJ, Hu FS, Dick CW (2008) Forests of the past: a window to future changes. Science
320:1450–2
Piotti A, Leonardi S, Heuertz M, Buiteveld J, Geburek T, Gerber S, Kramer K, Vettori C,
Vendramin GG (2013) Within-population genetic structure in beech (Fagus
sylvatica L.) Stands characterized by different disturbance histories: does forest
management simplify population substructure? PLoS One 8:e73391
Provan J, Beatty GE, Hunter AM, McDonald R a., McLaughlin E, Preston SJ, Wilson S
(2007) Restricted gene flow in fragmented populations of a wind-pollinated tree.
Conserv Genet 9:1521–1532
Provan J, Soranzo N, Wilson NJ, McNicol JW, Forrest GI, Cottrell JE, Powell W (1998)

Chapter 1
34
Gene-pool variation in caledonian and European Scots pine (Pinus sylvestris L.)
revealed by chloroplast simple-sequence repeats. Proc Biol Sci 265:1697–1705
Prus-Glowacki W, Stephan BR (1994) Genetic variation of Pinus sylvestris from Spain in
relation to other European populations. Silvae Genet 43:7–14
Prus-Glowacki W, Urbaniak L, Bujas E, Curtu AL (2012) Genetic variation of isolated
and peripheral populations of Pinus sylvestris (L.) from glacial refugia. Flora -
Morphol Distrib Funct Ecol Plants 207:150–158
Pyhäjärvi T, Salmela MJ, Savolainen O (2008) Colonization routes of Pinus sylvestris
inferred from distribution of mitochondrial DNA variation. Tree Genet Genomes
4:247–254
Rajora OP, Pluhar SA (2003) Genetic diversity impacts of forest fires, forest harvesting,
and alternative reforestation practices in black spruce (Picea mariana). Theor Appl
Genet 106:1203–1212
Rajora OP, Rahman MH, Buchert GP, Dancik BP (2000) Microsatellite DNA analysis of
genetic effects of harvesting in old-growth eastern white pine (Pinus strobus) in
Ontario, Canada. Mol Ecol 9:339–348
Ranade SS, García-Gil MR (2013) Ecotypic variation in response to light spectra in Scots
pine (Pinus sylvestris L.). Tree Physiol 33:195–201
Robledo-Arnuncio JJ, Collada C, Alía R, Gil L (2005) Genetic structure of montane
isolates of Pinus sylvestris L. in a Mediterranean refugial area. J Biogeogr 32:595–
605
Scalfi M, Piotti A, Rossi M, Piovani P (2009) Genetic variability of Italian southern Scots
pine (Pinus sylvestris L.) populations: the rear edge of the range. Eur J For Res
128:377–386
Schaberg PG, DeHayes DH, Hawley GJ, Nijensohn SE (2008) Anthropogenic alterations
of genetic diversity within tree populations: Implications for forest ecosystem
resilience. For Ecol Manage 256:855–862
Introduction
35
Sinclair WT, Morman JD, Ennos RA (1998) Multiple origins for Scots pine (Pinus
sylvestris L.) in Scotland: evidence from mitochondrial DNA variation. Heredity
(Edinb) 80:233–240
Sinclair WT, Morman JD, Ennos RA (1999) The postglacial history of Scots pine ( Pinus
sylvestris L .) in western Europe : evidence from mitochondrial DNA variation. Mol
Ecol 8:83–88
Sjölund MJ, Jump AS (2015) Coppice management of forests impacts spatial genetic
structure but not genetic diversity in European beech (Fagus sylvatica L.). For Ecol
Manage 336:65–71
Soranzo N, Alia R, Provan J, Powell W (2000) Patterns of variation at a mitochondrial
sequence-tagged-site locus provides new insights into the postglacial history of
European Pinus sylvestris populations. Mol Ecol 9:1205–11
Thuiller W, Lavorel S, Araújo MB, Sykes MT, Prentice IC (2005) Climate change threats
to plant diversity in Europe. Proc Natl Acad Sci U S A 102:8245–8250
Tóth EG, Vendramin GG, Bagnoli F, Cseke K (2017) High genetic diversity and distinct
origin of recently fragmented Scots pine (Pinus sylvestris L.) populations along the
Carpathians and the Pannonian Basin. Tree Genet Genomes 13:1–12
Tzedakis PC, Emerson BC, Hewitt GM (2013) Cryptic or mystic? Glacial tree refugia in
northern Europe. Trends Ecol Evol 28:696–704
Vilà-Cabrera A, Martínez-Vilalta J, Galiano L, Retana J (2012) Patterns of Forest Decline
and Regeneration Across Scots Pine Populations. Ecosystems 16:323–335
Wachowiak W, Balk P a., Savolainen O (2009) Search for nucleotide diversity patterns of
local adaptation in dehydrins and other cold-related candidate genes in Scots pine
(Pinus sylvestris L.). Tree Genet Genomes 5:117–132
Wachowiak W, Iason GR, Cavers S (2013) Among population differentiation at nuclear
genes in native Scots pine (Pinus sylvestris L.) in Scotland. Flora 208:79–86
Wachowiak W, Salmela MJ, Ennos RA, Iason G, Cavers S (2011) High genetic diversity

Chapter 1
36
at the extreme range edge: nucleotide variation at nuclear loci in Scots pine (Pinus
sylvestris L.) in Scotland. Heredity (Edinb) 106:775–787
Wang R, Compton SG, Shi Y-S, Chen X-Y (2012) Fragmentation reduces regional-scale
spatial genetic structure in a wind-pollinated tree because genetic barriers are
removed. Ecol Evol 2:2250–2261
White GM, Boshier DH, Powell W (2002) Increased pollen flow counteracts
fragmentation in a tropical dry forest: An example from Swietenia humilis
Zuccarini. Proc Natl Acad Sci U S A 99:2038–2042
Whittet R, Cavers S, Cottrell J, Rosique-Esplugas C, Ennos R (2017) Substantial variation
in the timing of pollen production reduces reproductive synchrony between distant
populations of Pinus sylvestris L. in Scotland. Ecol Evol 7:5754–5765
Willis KJ, Andel T van (2004) Trees or no trees? The environments of central and eastern
Europe during the Last Glaciation. Quat Sci Rev 23:2369–2387
Willis KJ, Rudner E, Sümegi P (2000) The full-glacial forests of central and southeastern
Europe. Quat Res 53:203–213
Young A, Boyle T, Brown T (1996) The population genetic consequences of habitat
fragmentation for plants. Tree 11:413–418

Chapter 2
Understanding the role of past climate
changes and geographical barriers in the
genetic structure of Scots pine
Authors: Patricia González-Díaz, Alistair S. Jump, Giuseppe G.
Vendramin, Francesca Bagnoli, Miguel A. Zavala, Paloma Ruiz-Benito,
Glenn Iason, Joanne Russell, Witold Wachowiak and Stephen Cavers.
Intention to submit: Molecular Ecology

38
Photos in Chapter 2 main page taken from, left: https://treesforlife.org.uk/ and right: Birks,
1989.

The processes shaping historical migration and colonisation
39
2.1 Abstract
Migrations patterns of tree species in response to past climate changes have been a
subject of increased debate during the last decades. However, traditional refugia
during glacial maximum and subsequent migrations are likely to have been an
oversimplification as environmental heterogeneity and geographic complexity might
have created complex species persistence and migration scenarios. Persistence of the
species in small northern refugia would have significant implications for subsequent
patterns of colonization, and more rigorous testing of hypothesis on the location of
glacial refugia, Holocene migration routes and associated demographic events is
needed. Here, we investigated migration and colonization routes and the main
processes shaping such migrations of European Scots pine, which is one of the most
widespread tree species in the world and has high ecological and economic value.
We use a complementary use of phylogeographic reconstructions and Species
Distribution Models (SDM), which can deliver a robust analysis of past colonization
ranges and the putative locations of refugial populations. Our results supported (1)
similar and even greater diversity in northern populations of Scots pine in
comparison with southern peninsular refugia; (2) a differentiated role of peninsular
glacial refugia in contributing to Holocene colonisation: Italian and Asia Minor
peninsulas might have not contributed to Holocene migrations whereas Iberian and
Balkan peninsulas might have, being the latter the most likely source for central-
northern European populations, and (3) North-Western populations likely derived

Chapter 2
40
from two genetic pools and underwent a significant bottleneck event around the
time of the LGM. Our findings provide a greater resolution in the role of refuge
areas into Holocene migrations of Scots pine and likely sources of colonization and
suggest that historic climate changes and geographical barriers have played an
important role in the spatial distribution of current genetic diversity of Scots pine.
Furthermore, our results suggest that cryptic refugia might have contributed to post
glacial population expansion. These results have implications for studies of
migration, estimation of range shifts and the role of microclimates under changing
conditions. As new markers with greater resolution are currently developed (e.g.
SNP based on a large panel of transcriptome variants), it may be possible in the near
future to add more evidences of specific location from northern refugia of Scots pine
populations and its role in subsequent migrations.

The processes shaping historical migration and colonisation
41
2.2 Introduction
Migrations patterns of tree species in response to past climate changes have been a
subject of increased debate during the last decades (Comes & Kadereit 1998, Davis &
Shaw 2001, Cornille et al. 2013, Souto et al. 2015). Traditionally, it had become
widely accepted that, in Europe, tree species retreated to the Iberian, Italian or
Balkan peninsulas (Bennett et al. 1991, Petit et al., 2003) during the Last Glacial
Maximum (LGM, around 26,000 - 19,000 yrs (Chiverrell & Thomas 2010)) and
expanded North as the ice sheet melted during the Holocene warming. However
this is likely to have been an oversimplification as environmental heterogeneity and
geographic complexity might have created complex species persistence and
migration scenarios. Although a large part of the Northern hemisphere was covered
by ice with temperatures 10-20°C cooler than the present (Barron & Pollard 2002),
increasing amounts of evidences suggest that areas located north of the peninsular
refugia might have been suitable for some sparse populations to survive (Willis et al.
2000, Magri et al. 2006, Bhagwat & Willis 2008, Svenning et al. 2008, Birks & Willis
2010, Parducci et al. 2012, Tzedakis et al. 2013, Daneck 2016). Where these refugial
areas were located continuous to excite scientific interest, as both the location of
glacial refugia and patterns of subsequent migrations might have shaped the present
day distribution of trees and therefore influenced current patterns of genetic
diversity (Hewitt 2000). Understanding the structure and mode of the postglacial

Chapter 2
42
colonization of Europe by trees is of particular interest for improving predictions of
likely range shifts and adaptation of tree species in response to climate change.
Scots pine is one of the most widespread tree species in the world and has high
ecological and economic value. Several studies based on fossil, pollen or genetic
data, have investigated the existence of northern glacial refugia and postglacial
migrations of this species and suggest that not only southern but also northern
refugia might have contributed to contemporary patterns of European genetic
diversity of Scots pine (Stewart & Lister 2001, Cheddadi et al. 2006, Donnelly et al.
2016). Several areas have been proposed to have harboured sparse populations of
Scots pine during the LGM, such as the Eastern Alps, Hungarian plain and Danube
region (Willis et al. 2000, Willis & van Andel 2004, Cheddadi et al. 2006), Eastern
Carpathians (Tóth et al. 2017), Asia Minor (Naydenov et al. 2007), southern
Scandinavia and other sites at mid-European latitudes (Pyhäjärvi et al. 2008, Prus-
Glowacki et al. 2012, Parducci et al. 2012, Dering et al. 2017) or even southern of
Russia (i.e. south east of Moscow) (Buchovska et al. 2013). Persistence of the species
in small northern refugia would have significant implications for subsequent
patterns of colonization, and more rigorous testing of hypothesis on the location of
glacial refugia, Holocene migration routes and associated demographic events is
needed.
According to the most recent studies, the likely pathways of Scots pine Holocene
migrations in Europe would have crossed the continent in several fronts. In Western

The processes shaping historical migration and colonisation
43
Europe, Scots pine would have migrated north via the English Channel into Britain
and via Danish Straits into Norway and the source of this front might have been
located in dispersed central European or Balkan populations (i.e. considering the
Balkan region delimited by the Danube river limit approximately) (Pyhäjärvi et al.
2008, Dering et al. 2017, Tóth et al. 2017). In Eastern Europe, Scots pine would have
migrated towards Eastern Fennoscandinavia (i.e. Finland) and Central Europe from
a refugia located somewhere in the NW Russian Plain (Buchovska et al. 2013,
Tzedakis et al. 2013) or from the Ural Mountains (Naydenov et al. 2007). Iberian,
Italian and Asia Minor peninsulas would have harboured Scots pine populations
during the LGM, however they might have play no role in the subsequent Holocene
colonization (Naydenov et al. 2007, Pyhäjärvi et al. 2008, Donnelly et al. 2016, Piotti
et al. 2017).
An outstanding question remains regarding the origins of Scots pine populations in
Scotland (UK), for which multiple colonization sources have been suggested. Pollen
data have shown that Scots pine reached southern Britain via central Europe after
the LGM, approximately 9000 years ago (Birks 1989) and from there colonized
northward. However, pollen data indicated an independent glacial refugia in 8500
years ago well ahead of the main colonizing front likely located in the south of
Britain by that time (Birks 1989, Bennett 1984, 1995). Fossil pine stomata recorded in
western Scotland up to 1600 yrs ago prior to the arrival times indicated by
traditional palynological methods, support this finding (Froyd 2006). Additional

Chapter 2
44
studies have added evidence in support of the multiple centre of origin idea, such as
a unique mitotype (Sinclair et al. 1998), unique cpDNA variation (Provan et al. 1998),
and significant differences among monoterpene composition in western Scotland
when comparing them with other populations from Scotland (Forrest 1980, Kinloch
et al. 1986), although none have been conclusive. Alternative hypotheses have been
proposed to explain the second origin, as due to colonization via a Westerly route
originating in Southern Europe (Ennos et al. 1997) or the existence of an endemic
Western refugium in the Western Isles (Kinloch et al. 1986), perhaps on now-
submerged continental shelf, or in the south of Britain (Birks 1989). Recently,
Donnelly et al. (2016) found that Scottish populations of Scots pine were highly
related to Polish populations by the study of new variants of the mitochondrial
genome, and Wójkiewicz & Wachowiak (2016) and Wójkiewicz, Litkowiec, et al.
(2016) found similarities with populations from Central Europe but also with the
north of the Iberian Peninsula and the Massif Central in France.
Phylogeographic approaches based on genetic information can be used to search for
common ancestors (i.e. lineages) and to help to identify patterns of recolonisation
during expansion phases (Provan & Bennett 2008). Although pollen and fossil data
are the strongest indications of the location of a species in the past, hindcasting using
species distribution models (SDM) based on inferences of past climate data can
increase resolution by identifying potentially suitable areas even in the absence of
physical evidence. Complementary use of phylogeographic reconstructions and

The processes shaping historical migration and colonisation
45
SDM, can deliver a robust analysis of past colonization ranges and the putative
locations of refugial populations (Knowles & Alvarado-Serrano 2010). For instance,
this novel combined approach has been successfully used to identify the direction of
past European migrations of English yew (Taxus baccata) (Mayol et al. 2015) and to
investigate the contribution of alternative refugia and postglacial migrations in the
southernmost silver fir (Abies alba) populations (Piotti et al. 2017).
In this study we combined genetic and palaeoenviromental data to assess how past
demographic processes have led to the present day distribution of genetic diversity
of Scots pine at the European scale and, in particular, to better understand the
unresolved origins of the North-Western populations of Scots pine. Specifically we
sought to determine: (1) the differences between northern populations and
peninsular refugial populations of Scots pine in Europe, (2) the role of peninsular
refugial populations to subsequent Holocene migration and main sources for central
and northern European populations, and (3) the contribution of single or multiple
sources that originate North-Western populations of Scots pine which have been
subject to much debate in the literature. Our results help to further disentangle the
demographic history of Scots pine and the controversial origin of the North-Western
populations.
2.3 Material and methods
2.3.1 Genetic datasets and markers

Chapter 2
46
We examined nuclear (nSSR) and chloroplast microsatellite markers (cpSSR) and
single nucleotide polymorphism (SNP) data from populations across Europe
(European SSR and European SNP hereafter, see Fig. 2.1 and supplementary
material S2.1) (Wachowiak et al. 2011, Wójkiewicz & Wachowiak 2016, Wójkiewicz
et al. 2016) to estimate genetic diversity and population structure, and to test for
likely source populations and subsequent routes of colonization. Additionally, we
used SSR data from approximately 25% of all remaining indigenous populations in
Scotland (both nSSR and cpSSR) (Scottish SSR, hereafter, see Fig 2.1) (González-Díaz
et al., in review) to test for likely sources, population size changes and patterns of
assembly. The use of multiple genetic data can provide additional interpretations of
demographic events than either alone. Although each marker type has a different
mode of evolution, concordance in patterns inferred from them secures the inference
against bias due to data type. All markers were used for understanding current
spatial distribution of genetic diversity at European scale, but only the nuclear ones
(nSSR and SNP) for subsequent historical demographic modelling.
Thirteen European nSSR were obtained from 637 individuals and thirteen European
cpSSR from 633 individuals, both from 23 sites along the continent (Fig. 2.1, green
dots). Specifically we used nSSR: psyl2, psyl18, psyl25, psyl36, psyl42, psyl44, psyl57
(Sebastiani et al. 2011), SPAC7.14, SPAC11.4 (Soranzo et al. 1998), PtTX2146,
PtTX3107, PtTX3025 and PtTX4011 (Aukland et al., 2002); and cpSSR: PCP1289,
PCP26106, PCP30277, PCP36567, PCP41131, PCP45071, PCP87314, PCP102652

The processes shaping historical migration and colonisation
47
(Provan et al. 1998), Pt15169, Pt26081, Pt36480 and Pt71936 (Vendramin et al., 1996)
(see Wójkiewicz et al. (2016) for nSSR genotyping protocol and Wójkiewicz &
Wachowiak (2016) for cpSSR protocol). In addition we used a dataset comprising
1650 haplotypic European SNPs from 135 individuals from 14 populations (Fig. 2.1,
red dots) (See Wachowiak et al. (2011) for SNP genotyping protocol).
Figure 2.1: Study sites for European nuclear and chloroplast microsatellite markers (European
SSR, green dots) and single nucleotide polymorphism markers (European SNP, red dots), and the
study sites for Scottish nuclear and chloroplast SSR markers (Scottish SSR, blue dots). Shaded
area represents contemporary Scots pine distribution (EUFORGEN,
http://www.euforgen.org/species/). See supplementary material S2.1 for further description of the
European SSR sites.
For Scotland-focussed analysis, we used a dataset comprising six Scottish nSSR and
five Scottish cpSSR from 540 individuals from 18 populations across Scotland (Fig.
2.1, blue dots). Specifically the nSSR loci were: PSAJ223770/SPAC11.14,
PSAJ223766/SPAC11.8 (Soranzo et al. 1998), Ptx2146 (Aukland et al. 2002),

Chapter 2
48
SsrPt_ctg4698, SsrPt_ctg9249 (Chagné et al. 2004) and LOP3 (Liewlaksaneeyanawin
et al. 2004); and cpSSR, PCP26106, PCP30277, PCP36567, PCP45071, PCP87314
(Provan et al. 1998) (see González-Díaz et al. (in review) for microsatellite analysis
specification).
2.3.2 Population structure and spatial patterns of genetic diversity at
European scale
To measure genetic diversity at the European scale we calculated genetic estimators
for nSSR and cpSSR, within and among populations and regions using FSTAT 2.9.3.2
(Goudet 1995) and Arlequin v3.5 (Excoffier & Lischer 2010). Regions were
determined according to the results of STRUCTURE which supported three genetic
clusters (K=3) for both datasets (Fig. 2.6) and highly admixed populations as distinct
groups (see section 2.4.1 for detailed information about the regions). Specifically for
nSSR, we estimated mean number of alleles per locus (nA), rarefied allelic richness
(nAR), observed heterozygosity (nHO), expected heterozygosity (nHE) and inbreeding
coefficient (nFIS). Rarefaction of allelic richness controls for differences in sample size
(El Mousadik & Petit 1996) allowing comparison among sites and studies. For the
remaining cpSSR estimators, alleles were combined to create a unique chloroplast
haplotype for each individual. We estimated number of haplotypes (cHN), number of
private haplotypes (cHP) and gene diversity corrected for sample size (cHE) (Nei,
1978). Genetic diversity estimators for SNP data within and among genetic clusters

The processes shaping historical migration and colonisation
49
were estimated using DnaSP (Librado & Rozas 2006). We calculated the number of
haplotypes (sHN), number of polymorphic sites (S), number of mutations (M),
nucleotide diversity (π), Tajima´s D (D), Theta per site (T) and haplotype diversity
(sHE). Multilocus haplotypic and neutral diversity of individual populations for
nSSR (nHE), cpSSR (cHE) and SNP (π) were mapped using ARCMAP 10 (ESRI,
Redlands, CA, USA).
To quantify genetic differentiation we conducted permutation tests (10,000
permutations) in FSTAT in nAR, nHO, nHE and nFIS between regions. Additionally we
used both nSSR and cpSSR markers in Arlequin v3.5 (Excoffier & Lischer 2010) to
estimate nFST and cFST among regions, using nSSR and cpSSR respectively and to
assess the distribution of variation. xFST is used as a measure of population
differentiation by estimating differences in allele frequencies. Significance values
were determined for a 5% nominal level after Bonferonni correction. To quantify the
distribution of variation of nuclear genetic diversity and chloroplast haplotypes, we
tested both markers in a hierarchical analysis of molecular variance (AMOVA) from
the level of individual, population and region.
To determine population structure, an individual-based Bayesian assignment
method was used using data from nuclear loci (nSSR and SNP) in STRUCTURE
2.3.4. (Pritchard et al. 2000). We used a model with correlated allele frequencies
(Falush et al. 2003) and admixtured ancestry. We included the site location a priori
(LOCPRIOR option) to improve the detection of weak population structure (Hubisz

Chapter 2
50
et al. 2009). K, which is the more likely number of genetic clusters, was set from 1 to
20, with 10 runs performed for each number of K. Runs consisted of 500,000 Markov
Chain Monte Carlo (MCMC) iterations with a burn-in period of 100,000. We used
STRUCTURE HARVESTER (Earl & VonHoldt 2011), an online application that uses
the Evanno method (Evanno et al. 2005) for assessing and visualizing likelihood
values across multiple values of K and detecting the number of genetic groups that
best fit the data.
2.3.3 Analysis of demographic history
We used an approximate Bayesian computation (ABC) framework implemented in
DIYABC v2.1.0 (Cornuet et al. 2014) to explore scenarios of demographic history that
were likely to have generated current genetic structure of Scots pine across the
continent and in Scotland only, according to the results obtained from analyses of
genetic structure. We carried out two sets of demographic analyses using nuclear
markers. The first analysis aimed to identify source populations (i.e. likely glacial
refugia) and migration routes at the continental scale. For these analyses we used
European SSR (nSSR) and European SNP data (see Fig. 2.1, red and green dots). The
second analysis explored changes in population size during and since colonization at
a finer scale in Scotland and we used Scottish SSR (nSSR) data (Fig. 2.1, blue dots).

The processes shaping historical migration and colonisation
51
2.3.3.1 Identification of glacial refugia and migration routes
We followed a two step approach within each dataset. The first step, which included
models 1 & 3 (see Table 2.1), aimed to identify putative refugia and source
populations of Central-Northern European population; and the second step, which
included models 2 & 4 (see Table 2.1 and Fig. 2.2&2.3), aimed to identify the source
of Scottish populations. For the second step, we compared the two scenarios that
showed comparably high posterior probability in the first step 1.
Table 2.1. A graphical overview of the two step approach for each dataset (European nSSR and SNP)
used for the identification of glacial refugia, migration patterns and source of colonization in Central-
Northern European populations (step 1, model 1 & 3) and Scottish populations (step 2, model 2 & 4).
Population names are coded as follows: Italy (ITA), Iberia (IBE), Balkan (BAL), Asia Minor (AMI),
Central-Northern Europe (CNE), Scotland (SCO) and ancestral population (ANC).
Dataset
Step
and
model
Scenario
Glacial refugia and source of
colonization of Central-Northern
Europe population (step 1)
Source of colonization of
Scotland (step 2)
European
nSSR
Step 1,
model 1
1a IBE
1b BAL
1c AMI
1d Admixture IBE-BAL
1e Admixture BAL-AMI
1f Established previous to the LGM
Step 2,
model 2
2a Admixture IBE-BAL Admixture IBE-CNE
2b Admixture IBE-BAL CNE
2c Admixture IBE-BAL IBE
2d BAL Admixture IBE-CNE
2e BAL CNE
2f BAL IBE
Step 1,
model 3
3a IBE
3b ITA
3c Admixture IBE-ITA
European
SNP
3d Established previous to the LGM
Step 2,
model 4
4a IBE CNE
4b IBE IBE
4c IBE Admixture IBE-CNE
4d Established previous to the LGM CNE
4e Established previous to the LGM Iberian
4f Established previous to the LGM Admixture IBE-CNE
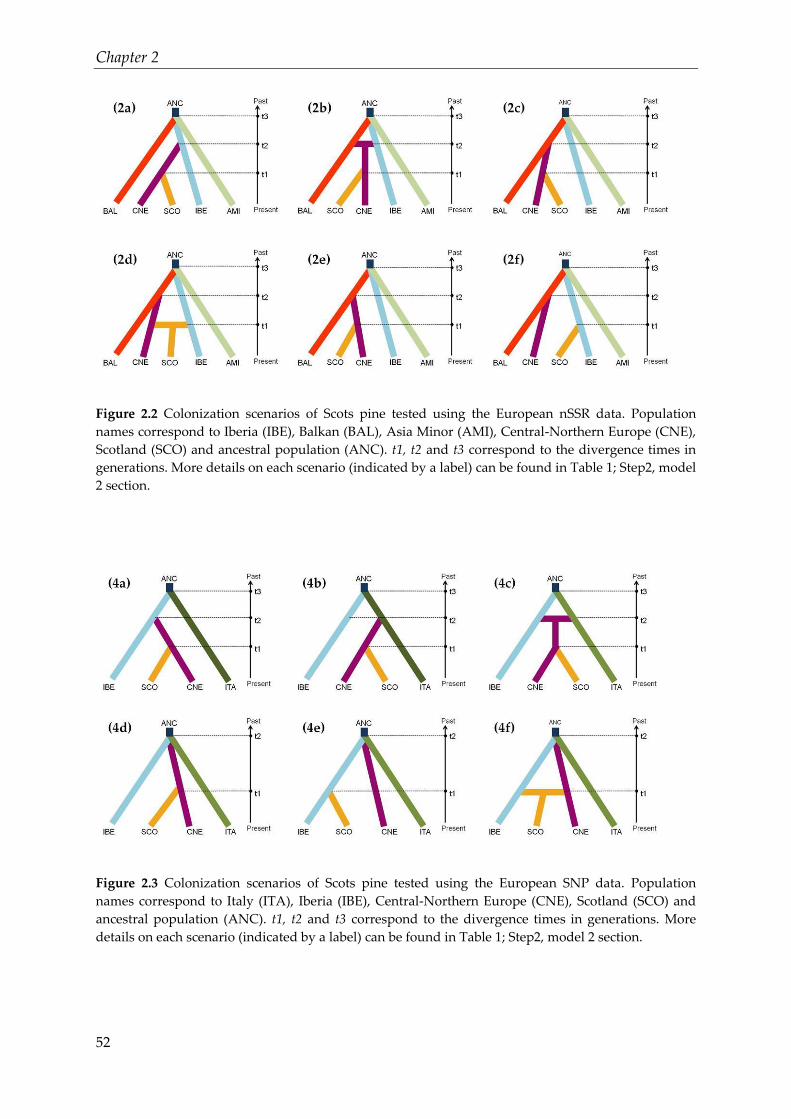
Chapter 2
52
Figure 2.2 Colonization scenarios of Scots pine tested using the European nSSR data. Population
names correspond to Iberia (IBE), Balkan (BAL), Asia Minor (AMI), Central-Northern Europe (CNE),
Scotland (SCO) and ancestral population (ANC). t1, t2 and t3 correspond to the divergence times in
generations. More details on each scenario (indicated by a label) can be found in Table 1; Step2, model
2 section.
Figure 2.3 Colonization scenarios of Scots pine tested using the European SNP data. Population
names correspond to Italy (ITA), Iberia (IBE), Central-Northern Europe (CNE), Scotland (SCO) and
ancestral population (ANC). t1, t2 and t3 correspond to the divergence times in generations. More
details on each scenario (indicated by a label) can be found in Table 1; Step2, model 2 section.

The processes shaping historical migration and colonisation
53
Prior parameters for effective population sizes (NX) and timing of events (tX) were
defined based on knowledge of Scots pine colonization dynamics from
palynological, historical and genetic information. Prior parameter distributions for
the SSR model were uniform and bounded between 10-15×104 for the effective
population size for Asia Minor (NAMI), Balkans (NBAL), Iberia (NIBE), Central-Northern
Europe (NMEU), Scotland (NSCO) and the ancestral population (NANC). Population
divergence time priors ranged between 10-5000 generations for t1, 10-10×103 for t2
and t3, and 10-10×104 for t4, with the additional setting t4>t3, t3>t2, and t2>t1. Prior
parameter distributions for the SNP model were also uniform and ranged between
10-10×104 for the effective population size for Italy (NITA), NIBE, NSCO, and NANC, and
between 10-10×105 for NMEU. Population divergence time priors ranged between 10-
5000 for t1, 10-10×104 for t2, t3 and t4, with the additional setting t4>t3, t3>t2, and t2>
t1. Priors for admixture rates for both SSR and SNP models ranged between 0.01 and
0.99.
Nuclear microsatellite loci (nSSR) were assumed to follow a Generalized Stepwise
Mutation model and a uniform prior was assumed for the mean microsatellite
mutation rate bounded between 10-3 and 10-4. Thirty-six summary statistics were
used for the ABC analysis. Three single sample statistics were used (mean number of
alleles, mean Nei’s genetic diversity index (Nei, 1987) and mean allele size variance),
and three between-sample statistics (mean allele size variance, FST, and mean index
of classification (Rannala & Mountain 1997, Pascual et al. 2007). For the SNP data

Chapter 2
54
four one-sample statistics were used (proportion of zero values, mean of non-zero
values, variance of non-zero values and mean of complete distribution).
Additionally, four two-sample statistics were also used (FST distances based on the
proportion of zero values and the variance of non-zero values, and Nei´s distances
based on the proportion of zero values and the variance of non-zero values).
Following the methods outlined by Cornuet et al. (2010), type I and type II errors
were estimated to evaluate the power in both SSR and SNP models. Type I error
(wrongly accepting false scenario) was computed for as the proportion of simulated
scenarios generated under the focal scenario that support other scenarios, and type II
error (wrongly rejecting true scenario) as the proportion of datasets simulated under
all other scenarios that was assigned to the focal scenario (Lepais et al., 2013). The
most favoured scenario was used to estimate posterior distribution of demographic
parameters.
2.3.3.2 Changes in population size
In addition, we performed a demographic history analysis of the Scottish population
using the scottish SSR (nSSR) data to determine changes in population size during
and since colonisation. We considered Scottish populations as a single unstructured
group. Four scenarios were tested (Fig. 2.4): the first scenario assumed no change in
population size (constant); the second assumed a population expansion; the third
assumed a decline in the populations and the last assumed a bottleneck in
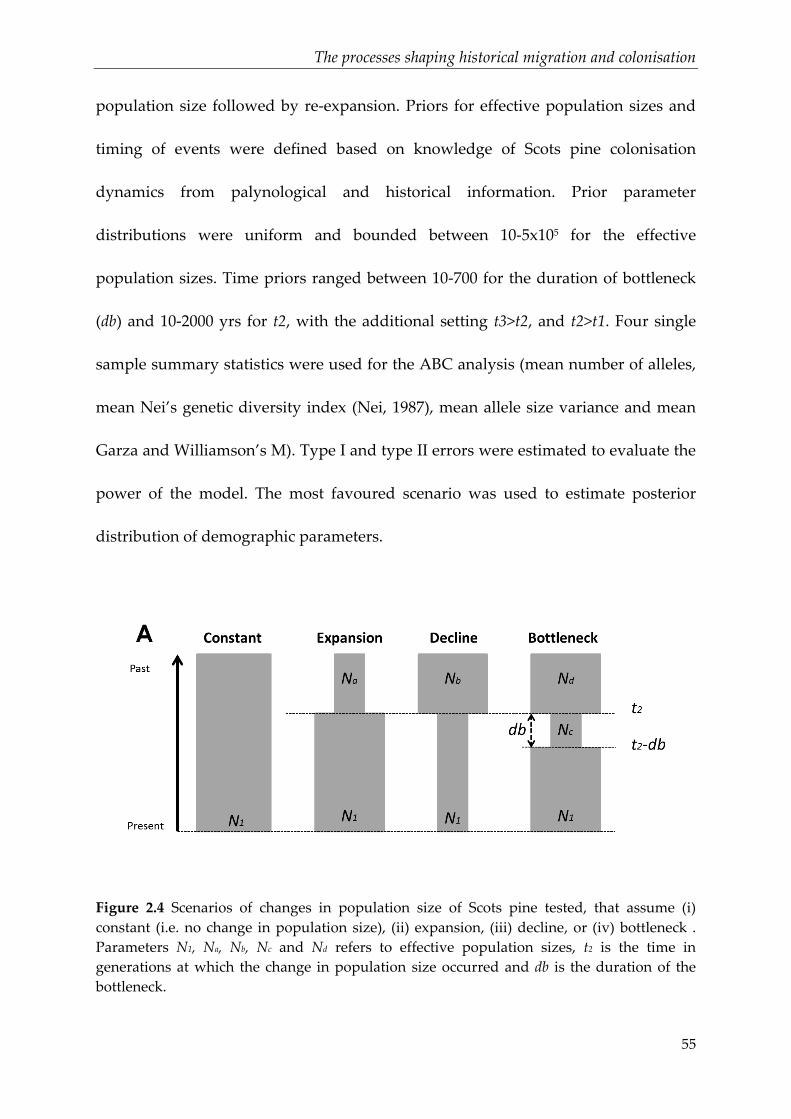
The processes shaping historical migration and colonisation
55
population size followed by re-expansion. Priors for effective population sizes and
timing of events were defined based on knowledge of Scots pine colonisation
dynamics from palynological and historical information. Prior parameter
distributions were uniform and bounded between 10-5x10⁵ for the effective
population sizes. Time priors ranged between 10-700 for the duration of bottleneck
(db) and 10-2000 yrs for t2, with the additional setting t3>t2, and t2>t1. Four single
sample summary statistics were used for the ABC analysis (mean number of alleles,
mean Nei’s genetic diversity index (Nei, 1987), mean allele size variance and mean
Garza and Williamson’s M). Type I and type II errors were estimated to evaluate the
power of the model. The most favoured scenario was used to estimate posterior
distribution of demographic parameters.
Figure 2.4 Scenarios of changes in population size of Scots pine tested, that assume (i)
constant (i.e. no change in population size), (ii) expansion, (iii) decline, or (iv) bottleneck .
Parameters N1, Na, Nb, Nc and Nd refers to effective population sizes, t2 is the time in
generations at which the change in population size occurred and db is the duration of the
bottleneck.

Chapter 2
56
2.3.4 Species distribution modelling
The distribution of Scots pine for the present, the Last Glacial Maximum (LGM) and
the Last Interglacial period (LIG) was estimated. Scots pine occurrence data were
obtained from three different sources (see supplementary material S2.3): (1) the
EUFORGEN database from the European forest genetic resources network
(http://www.euforgen.org/distribution _maps.html), (2) the Tree Species Distribution
for Europe (TSDE; (Köble & Seufert 2001)) from the Joint Research Centre’s AFOLU
data portal (http://forest.jrc.ec.europa.eu/activities/climate-change/species-
distribution/), and (3) the European National Forest Inventory (NFI) data.
EUFORGEN delivers a distribution shapefile that, while spatially less accurate,
includes the whole species range within Europe, and excludes planted populations.
On the other hand, TSDE maps tree species occurrence in Europe at a 1-km grid level
(30 arc sec.), but it does not differentiate between native and planted populations.
Therefore, by filtering TSDE occurrences with EUFORGEN, we obtained a good
approximation of the native range of species (Serra-Varela et al. 2015). For the
combination of TSDE and EUFORGEN occurrence data, a total of 23,840 presences
were used for the calibration of the model at 2.5 min resolution. As recommended by
Barbet-Massin et al. (2012) a large number of pseudo-absences were used.
Specifically we used 10,000 pseudo-absences randomly selected within the study
area within those cells where TSDE data reported 0% occupancy. Regarding the

The processes shaping historical migration and colonisation
57
occurrence data from the European inventory data, which provides information on
adult individuals and regeneration, we used a total of 3,998 presences for the adult
data and a total of 243 presences for regeneration (seedlings) again at 2.5 min
resolution. We used 2000 pseudo-absences for adults and 200 for regeneration.
Firstly, we performed a variable selection over the bioclim dataset of 19 climatic
variables (See supplementary material S2.2). As the variables were highly correlated
we applied a principal components analysis (PCA) and correlation coefficients on all
19 highly correlated climatic predictors, but also taking into account those biological
factors limiting the growth and regeneration of the species (i.e. low water
availability). We used the resultant selection of variables under current and past
conditions (paleoenvironmental data), the latter representing conditions at the Last
Glacial Maximum (LGM) and the Last Interglacial period (LIG). For the LGM period,
we used both the CCSM and MIROC General Circulation Models (GCMs).
Five statistical algorithms were used to calibrate the species distribution models
individually. Specifically, we used general linear models (GLMs; McCullagh &
Nelder, 1989), generalized additive models (GAMs; Hastie & Tibshirani, 1990),
random forest (RF; (Breiman 2001)), classification tree analysis (CTA; Breiman et al.,
1984) and MaxEnt (Phillips et al. 2006). All models were processed using the package
‘biomod2’ (Thuiller et al. 2009) in R 3.3.1 (R Development Core Team 2011). The
performance of the model was assessed by means of the true skill statistic (TSS) and
the area under the receiver operating characteristic curve (ROC). We averaged the

Chapter 2
58
predictions from the five individual algorithms to create an ensemble model (e.g.
refs). We evaluated the model on 20% of the set-aside evaluation records.
2.4 Results
2.4.1 Genetic diversity and population structure at European scale
Across the thirteen nuclear loci (nSSR) analysed for the continental sample, the
number of alleles per locus (nA) ranged from 3 to 40, with a multilocus average of
12.231 ± 10.256 for all populations combined. For rarefied allelic richness (nAR),
multilocus estimates ranged from values of 4.565 to 6.176, based on a minimum
number of 19 diploid individuals, with a multilocus average of 12.211 for all
populations combined (based on minimum number of 651 individuals) (see Table 2.2
for detailed information of each population and for each region). The multilocus
expected (nHE) and observed heterozygosity (nHO) were 0.527 ± 0.298 and 0.446 ±
0.267 respectively for all populations combined (Table 2.2). A general significant
homozygote excess was found (overall FIS=0.154, P < 0.001) (Table 2.2). Among the
thirteen chloroplast loci (cpSSR) analysed in the continental sample, the number of
alleles per locus (cA) ranged from 3 to 11, with a multilocus average of 6.308 ± 2.359
for all populations combined. Gene diversity (cHE) ranged between 0.970 and 1, with
a slight increase of diversity towards the north (Table 2.2, Fig. 2.5a). The number of
haplotypes (cHN) within populations ranged from 19 to 42 (Table 2.2 and Fig. 2.5b),
with 468 haplotypes recorded, of which 73% (342 haplotypes) were private (i.e.

The processes shaping historical migration and colonisation
59
unique of a particular population, Table 2.2). In the European SNP dataset, there
were 135 haplotypes and 510 polymorphic sites, with an overall nucleotide diversity,
Pi: 0.08762 when all sites were combined (Table 2.3 and Fig. 2.5c). Tajima's D for all
samples combined was -1.62047 with no statistical significance using the total
number of mutations and -1.52635 with no statistical significance using the total
number of segregating sites, with an estimated recombination rate R, between
adjacent sites of 0.0271 (excluding sites with gaps or missing data) (Table 2.3). When
populations were grouped into genetic clusters, significant differences in nAR and
nHE (p-values < 0.05) occurred between genetic clusters after 10,000 permutations, but
not in nHO and FIS (p-values > 0.05).
After accounting for the population structure the most likely number of clusters
identified, for both nSSR and SNP markers, was three (Fig. 2.6). Populations from
Iberia, Asia Minor and Italy constituted independent genetic clusters, and Scotland
and Balkan populations as highly admixed populations. Regions were determined
according to the population structure results which supported three genetic clusters
(K=3) for both datasets (Fig. 2.6) and highly admixed populations as distinct groups.
In total, for the SSR dataset we considered five regions (Iberian, Balkan Peninsula,
Asia Minor, Central-Northern Europe and Scotland, Fig. 2.2) and for the SNP dataset
we considered four regions (Iberian, Italian peninsula, Central-Northern Europe and
Scotland, Fig. 2.3).

Chapter 2
60
Distribution of SSR (nSSR and cpSSR) variation from the AMOVA results showed
that although most of the variation in the continental sample was found within
populations, among cluster variability was greater and more significant than among
population within cluster (Table 2.4). FST estimates from European SSR data showed
Asia Minor to be the most differentiated (greatest FST values for both nSSR and
cpSSR), whereas the lowest differentiation occurred among the Balkans and Central-
Northern Europe (i.e. although significant, nFST was one order of magnitude lower
than other pairwise comparisons: cFST was not significant and again one order of
magnitude lower, Table 2.5).
Across the six nuclear loci (nSSR) analysed for the Scottish sample, the multilocus
estimates for rarefied allelic richness (nAR) ranged from values of 5.42 ± 2.92 to 7.55 ±
3.15, based on a minimum number of 28 diploid individuals, with a multilocus
average of 5.84 for all populations combined. The multilocus expected (nHE) and
observed heterozygosity (nHO) ranged from 0.46 ± 0.21 to 0.61 ± 0.06 and from 0.51 ±
0.27 to 0.66 ± 0.16 respectively. Among the five chloroplast loci (cSSR) analysed, gene
diversity (cHE) ranged between 0.83 and 0.96 and the number of haplotypes (cHN)
within populations ranged from 13 to 19, with a total of 64 haplotypes recorded, of
which 42% (27 haplotypes) were private (unique to a particular population) (see
Chapter 3, Table 3.3 for more detailed information about Scottish nSSR and cSSR)

The processes shaping historical migration and colonisation
61
Table 2.2 Genetic estimators for Europe nSSR and cpSSR for each population and region. nAR was rarefied for 19 individuals at the population level and for
38 individuals at the regional level.
Population/ Region nSSR cpSSR
nN nA nAR nHO nHE nFIS cN cHN cHP cHE
Turkey1 25 5.462 (4.013) 5.185 (3.672) 0.477 (0.297) 0.525 (0.302) 0.094** 25 23 10 0.993
Turkey2 25 5.769 (4.146) 5.374 (3.716) 0.423 (0.288) 0.510 (0.324) 0.175*** 25 24 15 0.997
Turkey3 25 5.538 (3.178) 5.338 (3.001) 0.456 (0.259) 0.518 (0.282) 0.122*** 25 21 10 0.983
Turkey4 25 5.769 (4.438) 5.479 (4.053) 0.418 (0.276) 0.513 (0.276) 0.189*** 25 23 9 0.993
Turkey5 25 6.231 (5.134) 5.828 (4.544) 0.483 (0.249) 0.532 (0.259) 0.094** 25 19 8 0.977
Ukraine 25 4.692 (3.966) 4.565 (3.736) 0.467 (0.290) 0.507 (0.287) 0.080* 25 19 8 0.970
Greece 31 6.615 (5.173) 5.858 (4.073) 0.494 (0.273) 0.544 (0.286) 0.094*** 31 28 13 0.994
Bulgaria 25 6.308 (4.131) 5.876 (3.933) 0.490 (0.272) 0.540 (0.294) 0.095** 25 22 13 0.990
Serbia 26 6.154 (4.120) 5.680 (3.836) 0.481 (0.283) 0.525 (0.307) 0.086** 26 24 17 0.991
Spain1 29 6.538 (5.093) 5.840 (4.167) 0.494 (0.261) 0.591 (0.230) 0.166*** 25 22 7 0.990
Spain2 31 5.846 (5.194) 5.274 (4.233) 0.460 (0.279) 0.532 (0.276) 0.136*** 31 29 19 0.996
Spain3 29 5.769 (4.850) 5.260 (4.106) 0.452 (0.288) 0.509 (0.282) 0.113*** 29 25 11 0.990
Spain4 32 5.923 (5.008) 5.318 (4.139) 0.494 (0.300) 0.530 (0.278) 0.068*** 32 30 20 0.996
Andorra 32 6.308 (4.956) 5.529 (4.063) 0.452 (0.265) 0.538 (0.284) 0.161* 32 32 16 1.000
France 25 6.308 (4.956) 5.934 (4.392) 0.481 (0.293) 0.539 (0.273) 0.109*** 25 23 15 0.993
Poland1 33 7.077 (6.357) 6.176 (5.132) 0.406 (0.246) 0.566 (0.273) 0.286*** 33 30 15 0.994
Poland2 45 7.000 (6.110) 5.663 (4.666) 0.470 (0.242) 0.553 (0.278) 0.151*** 45 42 25 0.996
Poland3 22 5.462 (4.977) 5.281 (4.695) 0.401 (0.289) 0.486 (0.342) 0.179*** 22 22 16 1.000
Poland4 28 6.231 (5.418) 5.655 (4.808) 0.443 (0.253) 0.524 (0.308) 0.156*** 28 28 16 1.000
Finland1 25 6.385 (5.546) 5.793 (4.875) 0.510 (0.312) 0.540 (0.301) 0.057 25 24 15 0.997
Finland2 25 6.385 (5.268) 5.854 (4.757) 0.491 (0.335) 0.500 (0.321) 0.019 25 25 13 1.000
Finland3 25 5.923 (4.804) 5.436 (4.161) 0.477 (0.254) 0.539 (0.296) 0.117*** 25 24 11 0.997
Finland4 24 5.769 (4.512) 5.427 (4.127) 0.497 (0.278) 0.520 (0.297) 0.046 24 23 15 0.996
Scotland 39 6.750 (4.751) 5.342 (3.760) 0.473 (0.226) 0.538 (0.237) 0.123*** 39 39 25 1.000
Asia Minor 125 8.538 (6.691) 7.136 (5.249) 0.452 (0.259) 0.534 (0.290) 0.153 125 94 52 0.9932

Chapter 2
62
Balkan peninsula 107 8.846 (7.636) 7.347 (5.794) 0.485 (0.263) 0.536 (0.292) 0.096 107 91 51 0.9963
Iberian peninsula 178 9.692 (8.430) 7.147 (5.504) 0.442 (0.282) 0.515 (0.286) 0.143 174 134 88 0.9961
Central-Northern EU 227 10.385 (9.474) 7.375 (6.341) 0.430 (0.278) 0.501 (0.320) 0.142 227 183 126 0.9976
Scotland 39 6.750 (4.751) 6.284 (4.619) 0.473 (0.226) 0.538 (0.237) 0.123 39 39 25 1.000
Data from Table 2.2 include genetic estimators for (1) nSSR: nN, no. of samples; nA, no. of alleles; nAR rarefied allelic richness; HO, observed heterozygosity;
HE, expected heterozygosity; FIS, inbreeding coefficient, and (2) cpSSR: cN, no. of samples; cHN, no. of haplotypes; cHP, no. of private haplotypes and cHE, gene
diversity corrected for sample size (Nei, 1978). Significant P-values are indicated as *P < 0.05; **P < 0.01; ***P < 0.001. P-values for FIS were obtained after 1,000
permutations of gene copies within individuals of each stand. Standard errors are reported in brackets.
Table 2.3 Genetic estimators for Europe SNP data
Population sN sHN S M π D T sHE
Scotland1 10 10 227 230 0.07714 0.04289 0.07648 1
Scotland2 10 10 234 237 0.0793 -0.15359 0.08181 1
Scotland3 10 10 290 292 0.08758 0.40931 0.08096 1
Scotland4 10 10 217 217 0.07813 0.01621 0.07787 1
Scotland5 10 10 262 264 0.0907 0.23873 0.08657 1
Austria 10 10 320 321 0.08675 0.00382 0.08668 1
Spain1 10 10 278 280 0.07386 -0.06389 0.07481 1
Spain2 10 10 287 289 0.08604 0.16306 0.08333 1
Finland1 10 10 259 262 0.09543 -0.3065 0.10166 1
Finland2 10 10 105 106 0.06847 -0.04743 0.06913 1
Poland 10 10 141 141 0.08096 -0.35237 0.08714 1
Sweden1 8 8 205 207 0.08629 0.17054 0.08368 1
Sweden2 7 7 222 223 0.09583 0.14311 0.09355 1
Italy 10 10 88 88 0.04366 1.37144 0.03418 1
Data from Table 3 include genetic estimators for SNP data: sN, no. of samples; sHN, no. of haplotypes; S, no. of polymorphic sites; M, no. of mutations; π,
nucleotide diversity; D, Tajima´s D ; T, Theta per site; sHE, haplotype diversity.

The processes shaping historical migration and colonisation
63
Table 2.4 Hierarchical analysis of molecular variance (AMOVA) for nuclear and chloroplast markers at the individual, population and region level (using
five regions: three STRUCTURE clusters and two admixed clusters). The degrees of freedom (df), sum of squares (SS), percentage of variation explained by
each level (Variation (%)), and the relevant P-values are indicated.
nSSR
cpSSR
Source of variation d.f. SS Variation
(%) p-value
d.f. SS Variation (%) p-value
Among regions 4 106.941 2.33 <0.001
4 26.525 1.02 <0.001
Among populations within
regions 19 123.343 1.78 <0.001
19 57.227 0.34 0.115
Within populations 1328 4258.717 95.89 <0.001 648 1783.753 98.63 <0.001
Table 2.5 FST values for regions of nSSR (below the diagonal) and cpSSR (above the diagonal).
Asia Minor Balkans Iberia C-N Europe Scotland
Asia Minor - 0.00554 0.01443*** 0.01016*** 0.00354
Balkans 0.02334*** - 0.01875*** -0.00047 -0.00409
Iberia 0.05027*** 0.02183*** - 0.02132*** 0.00679
C-N Europe 0.04207 *** 0.00893*** 0.02242*** - -0.00153
Scotland 0.04634*** 0.02138*** 0.01360*** 0.01605*** -

Chapter 2
64
Figure 2.5 Diversity
estimated using different
markers: (a) nuclear (nSSR
diversity), (b) chloroplast
(cpSSR diversity), and (c)
SNP (SNP diversity) for
European populations of
Scots pine.

The processes shaping historical migration and colonisation
65
Figure 2.6 Optimal number of genetic clusters (K=3) obtained for (a) European nSSR and (b) European
SNP datasets of Scots pine. Pie charts show the average values of 10 different runs for the proportion
of membership to each genetic cluster. Different colours indicate different genetic clusters
independently for each figure.

Chapter 2
66
2.4.2 Demographic history
2.4.2.1 Identification of glacial refugia and colonization in Europe
and Scotland
Model-based inference using ABC analyses for the nSSR dataset indicated that
scenario 1.2 (see Table 2.1), was supported with almost 60% probability compared to
30% of scenario 1.4 and almost no support for the other scenarios. This result suggest
that Scots pine colonisation to the central-northern European sites comes at least
partially from the Balkans and with lower probability from the Iberian Peninsula. In
the second step, the scenario 2.4 was supported with 60% probability compared to
30% of scenario 2.1, 2.2, 2.3, 2.5 and 2.6, which is an indicative of Scottish
populations having arisen from admixture between colonising fronts originating in
south western Europe (Iberian glacial refugia and/or southern France areas) and
central-northern Europe (see Fig. 2.2 for step 2 scenarios of European SSR). The
confidence in the best scenario is high, with low error rates in both Type I and Type
II: (Table S3). For the scenario 2.4, median values of the effective population size
were 67300, 112000, 101000, 1250000 and 47500 for N1 (Asia Minor), N2 (Balkan
peninsula), N3 (Spain and South France), N4 (Central and Northern Europe) and N5
(UK). The median values for divergence events corresponded to 673, 2600 and 6650
number of generations for t2, t3 and t4, which could be translated into
approximately 13460, 52000 and 133000, considering Scots pine reach maturity at the
age of 20 years (Carlisle & Brown 1968). The rate of admixture (ra) corresponded to
0.430.

The processes shaping historical migration and colonisation
67
Model-based inference using ABC for the European SNP dataset indicated that
scenario 3.4 was supported with 80% compared to other scenarios, which indicate
that central-northern European populations where established prior to the LGM and
did not derive from Iberia or Italian. In the second step, scenario 4.6 was supported
with almost 100% probability compared to almost no support for other scenarios (see
Fig. 2.3 for step 2 scenarios of European SNP). This result suggests that Scottish
populations have arisen through admixture of colonisation fronts from south
western Europe (i.e. Iberian glacial refugia or central massif of France) and central
Europe. In addition, some central European populations might have inhabited those
areas prior to the LGM, as it can be seen in the timing of the formation of Central-
Northern European population by approximately 96,000 years. The degree of
confidence in the best scenario is high, with low error rates Type I: 0.07-0.29 and
Type II: 0.04-0.27 (see supplementary material S2.4). For scenario 4.6, median values
for effective population sizes were 46500, 6450, 48000 and 630000 for N1 (Spain), N2
(Italy), N3 (Britain) and N4 (Continental Europe). The median values for divergence
events corresponded to 616 and 4800 number of generations for t3 and t4, which
could be translated into approximately 12320 and 96000 years, considering Scots
pine reach maturity at the age of 20 years (Carlisle & Brown 1968). The rate of
admixture (ra) corresponded to 0.747.

Chapter 2
68
2.4.2.2 Changes in population size
Nuclear markers showed the most likely scenario is a bottleneck, dated between
1160 and 570 generations ago. Average generation time of Scots pine have been
estimated at 20-25 years, therefore the bottleneck dates would correspond to 23,000-
29,000 and 11,000-14,000 years ago respectively, which is an indicative of a drastic
reduction of the population size during the LGM period. Although currently those
populations are currently located in Scotland, glaciology, pollen and fossil data
make clear that ancestral populations must have been located either well to the south
or on land now submerged on the continental shelf.
2.4.3 Species distribution modelling
All five statistical algorithms had high predictive ability and did not overfit presence
data (ROC = 0.9). SDMs predicted that suitable climatic conditions for Scots pine
during the LGM occurred in Iberia, Italy, the Mediterranean coast of France, the
Balkans and some areas in central Europe. However, highly suitable conditions
(habitat suitability > 0.7) existed mainly in the areas near the Pyrenees, Alps and the
Danube plain (Fig. 2.7d,e,f,g,h,i). Suitable conditions persisted in Iberia, southern
France, Italy and Danube area from the LGM until the present but between the LIG
and the LGM they might have been limited to Iberia, western coast of France and the

The processes shaping historical migration and colonisation
69
British Isles, suggesting that these areas had potential to act as refugia across
Pleistocene glaciation cycles (Fig. 2.7). Past projections showed large differences for
the CCSM and MIROC circulation models, but also varied among models with
different occurrence data sources (Fig. 2.7), with EUFORGEN data being the one that
showed largest suitable area under past conditions (Fig. 2.7a,d,g,j) and adult NFI
information the lowest (Fig. 2.7b,e,h,k).
Areas in south and mid Europe (i.e. Alps, Pyrenees, Apennines or Carpathians)
appear as some of the most suitable areas for the survival of the species during the
LGM. Surprisingly, however, the Danube plain, north of the widely recognised
refugial areas, was indiciated as one of the largest suitable areas among all others. It
is noteworthy that some areas in central Europe were also indicated as suitable (~
50% suitability value) and even some sites on the continental western coast, near to
the current coast of Ireland. Although areas in northern Europe appeared suitable
regarding temperature and precipitation patterns, those areas are likely, by that
time, to have had permanent ice cover sufficient to prevent tree growth

Chapter 2
70
Figure 2.7 Projection of species under current climatic conditions (a,b,c), past condition in the last
glacial maximum using CCSM global circulation model (i.e. LGC-CCSM; d,e,f), and MIROC global
circulation model (i.e. LGC-MIROC; g,h,i), and past climatic conditions in the Last Interglacial Period
(i.e. LIG (j,k,l) using different occurrence data sources: EUFORGEN and TSDE (purples), adult
individuals from NFI (oranges) and regenerated individuals from NFI (greens).

The processes shaping historical migration and colonisation
71
2.5 Discussion
Our study combined phylogeographic analysis under a Bayesian framework
together with species distribution models to better understand the contribution of
refugia and subsequent Holocene migrations to contemporary patterns of Scots pine
distribution and genetic diversity. Our results supported (1) similar and even greater
diversity in northern populations of Scots pine in comparison with southern
peninsular refugia; (2) a differentiated role of peninsular glacial refugia in
contributing to Holocene colonisation: Italian and Asia Minor peninsulas might have
not contributed to Holocene migrations whereas Iberian and Balkan peninsulas
might have, being the latter the most likely source for central-northern European
populations, and (3) North-Western populations are likely derived from two genetic
pools and underwent a significant bottleneck event around the time of the LGM.
2.5.1 Spatial distribution of genetic diversity at the continental scale
Our results indicated that Scots pine genetic diversity across the continent was
relatively high in both nuclear and chloroplast genomes for SSR markers (nHE=0.527
and cHE=0.970 respectively). Such diversity estimates agree with previous studies of
Scots pine through Europe (Provan et al. 1998, Robledo-Arnuncio et al. 2004,
Naydenov et al. 2011, González-Díaz et al. 2017) although in some mainland
European population have been reported higher (nHE: 0.74-0.85; Scalfi et al. 2009,
Nowakowska et al. 2014, García-Gil et al. 2015) and lower values (cHE: 0.56, García-

Chapter 2
72
Gil et al. 2015). We expected greater values of diversity for cpSSR compared with
nSSR as a result of the nature of these markers (e.g. ploidy and inheritance mode).
We observed greater genetic diversity in central-northern European populations (i.e.
Scotland, Central Europe & Fennoscandinavia) in comparison with southern
peninsular populations, that was statistically significant for cpSSR (p=0.0112) but not
for nSSR. This difference was in contrast to the south-north diversity model (Hewitt
1999), which suggest that generally, populations from refugial areas will harbour
greater genetic diversity than areas that have been colonized postglacilly (Hewitt
2000, Tzedakis et al. 2013) and mirrored results obtained by Dering et al. (2017) and
agree with (Petit et al., 2003). In Dering et al. (2017) study they attributed this
departure from model south-north patterns of diversity as a consequence of the
existence of contact zones from cryptic refugia in northern Europe. Accordingly, the
relatively greater levels of genetic diversity, especially in cpSSR, in the Scottish and
central-northern European populations from our study, might have arised from an
admixture event of different genetic pools. In contrast and amongst the 23 (for
European SSR) and 13 studied populations (for European SNP), Asia Minor and
Italian populations respectively displayed the lowest levels of genetic diversity.
Three genetic groups were clearly distinguished through Bayesian clustering,
despite that genetic differentiation was not high through the continent in terms of
heterozygosity or allele richness, likely a consequence of extensive gene flow among
populations. Bayesian clustering detects differences in allele frequencies and assigns

The processes shaping historical migration and colonisation
73
individuals to sub-populations based on analysis of likelihoods (Porras-Hurtado et
al. 2013). We found marked genetic differences in the Iberian, Italian and Asia Minor
peninsula, which broadly match the previously recognised refugial areas (Bennett et
al. 1991, Petit et al. 2003, Naydenov et al. 2007). Notably, although the Balkan
peninsula did not appear as a unique genetic cluster itself and was more related to
the central-northern European group than to any of the other groups, it has also been
well-recognised as a glacial refugia (Prus-Glowacki et al. 2012).
2.5.2 The role of peninsular glacial refugia in Holocene colonization
All SDM calibrated with different dataset confirmed habitat suitability for the
survival of Scots pine under the LGM in areas of southern peninsulas (Fig. 2.7),
although areas in Asia Minor obtained a low value of suitability. Asia Minor
represents a different genetic cluster, likely carrying specific adaptations that might
not be present in the other genetic lineages from our sample. Previous studies have
shown that when considering aspects of local adaptation or genetic lineages in the
calibration of SDM, the area suitable for the species is enlarged and usually group
differentiated (Benito Garzón et al. 2011, Mayol et al. 2015, Serra-Varela et al. 2015).
The lack of calibration of our models with samples from the differentiated genetic
lineage of Asia Minor might have restricted the habitat suitability of the species in
this area.

Chapter 2
74
Phylogeographic models also supported the presence of glacial refugia in southern
peninsulas, but with a different role in the subsequent colonization. Therefore, the
Bayesian model suggested that refugial populations in the Italian peninsula and Asia
Minor did not contribute to the Holocene colonization of Europe after the LGM,
which is in agreement with previous studies. Those refugia populations faced major
physical barriers, namely the Alps and Anatolian mountains, which would have
limited tree dispersal and enforced stronger genetic isolation of tree populations
after the LGM. This argument was also supported by the strong differentiation (see
STRUCTURE cluster in Fig. 2.6 and FST values in Table 2.5) and lower values of
diversity for both refugia (see nSSR and cpSSR diversity for Asia Minor in Table 2.2
and Fig. 2.5a&b, and SNP diversity for Italy in Table 2.3 and Fig. 2.5c). Previous
studies have already confirmed that Italian Scots pine populations from the
Apennine region are differentiated and genetically impoverished in comparison
with populations from the Italian Alps populations due to their progressive isolation
since the LGM (Labra et al. 2006, Scalfi et al. 2009, Belletti et al. 2012). Similarly,
populations from Asia Minor, which are spatially restricted, might have been kept
trapped after the LGM by the Anatolian diagonal (mountain range extending from
the Anti- Taurus Mountains towards to the eastern Black Sea) (Naydenov et al. 2007,
Bilgen & Kaya 2007, Dering et al. 2017), which is recognized as an important
biogeographic barrier (Ansell et al. 2011). The long-term isolation of Asia Minor
populations within geo- graphically separate refugia might have lead to genetic
differentiation due to drift (Provan & Bennett 2008). However, some long distance

The processes shaping historical migration and colonisation
75
gene flow between Asia Minor and the Balkan populations might have occurred
(Wójkiewicz & Wachowiak 2016).
On the other hand, we detected an Iberian contribution to Scots pine Holocene
colonization. Iberian populations of Scots pine have been previously suggested to
have not played role in Holocene migrations (Prus-Glowacki & Stephan 1994,
Cheddadi et al. 2006, Dering et al. 2017), as the Pyrynees may have acted as an
important barrier limiting gene flow of species (Razgour et al. 2013). However the
possibility of some Iberian populations contributing northwards after climate
ameliorated is not surprising, as although some North Eastern high elevated Iberian
populations present unique mitotypes (Sinclair et al. 1999, Soranzo et al. 2000,
Naydenov et al. 2007) which might indicate isolation after LGM, some other
populations still retain the mitotype that dominates the remaining European forests.
In fact, contribution of Iberian haplotypes to north-western populations have been
already suggested in others species such as oaks (Cottrell et al. 2002, Kelleher et al.
2014). We also detected a contribution to the Balkan populations to the European
Holocene colonization and in particular to the central-northern European
populations. Despite being relatively isolated from the rest of the continent by
mountain ranges (i.e. Balkan mountains), this result was also supported by the
lowest FST estimates between Balkan and Central-Northern European populations
(nFST= 0.00893, P>0.001; cpFST= -0.00047, n.s., Table 2.5) and agrees with Prus-
Glowacki et al. (2012) and Cheddadi et al. (2006) who described recolonisation of

Chapter 2
76
central and western European populations from Balkan populations. The argument
to explain why some glacial refugia contributed to northern European colonization
and others no, remain unclear. However, the specific characteristics of their
surrounding mountain barriers might help to explain this difference. Pyrenees and
Balkan mountains, with altitudes bounding between 2000-3000 m.a.s.l., represent
lower barriers than the Alps and Anatolian mountains, almost double in altitude.
Given the capacity for long distance gene flow of Scots pine (i.e. by both pollen and
seed mediated gene flow) (Steven and Carlisle 1959, Robledo-Arnuncio et al. 2011),
and that usually competition forces Scots pine to forest edges and onto poor quality
sites (i.e. higher and colder conditions), it seems feasible that gene flow moved
northwards across the lower barriers.
Furthermore, our Bayesian modelling with European SNP and SSR data suggested
that some Central-Northern European populations might have been established
prior to the LGM (i.e. timing of SSR data for the central European populations).
Several studies have also suggested that not only southern but northern refugia of
Scots pine survived during the LGM (Cheddadi et al. 2006, Naydenov et al. 2007,
Buchovska et al. 2013, Donnelly et al. 2016, Dering et al. 2017 based on genetic
marker, and Kullman 1998, Willis et al. 2000 based in pollen and fossil data). It seems
likely that Scots pine formed a set of patchily distributed populations at mid-
latitudes that were connected by gene flow extensive enough to prevent strong
genetic divergence (Cheddadi et al. 2006). These patchily distributed populations

The processes shaping historical migration and colonisation
77
might have played an important role in recolonization (Dering et al. 2017). Given the
simplicity of the scenarios tested, and as complex scenarios are limited in the ABC
framework, a scenario including contributions from sparse populations at mid-
latitudes could not be tested but cannot be ruled out. The existence of northern
refugia was also supported by the SDM, as they showed habitat suitability not only
in the southern peninsulas, but also in northern areas (i.e. northern to the Pyrenees
and the Alps and the Danube plain).
2.5.3 Likely sources of the North-Western populations
Historical models with both marker types agree and strongly support the hypothesis
of multiple origins for the Scottish populations. A multiple genetic pool in Scotland
has been previously suggested by several authors (Forrest 1980, Kinloch et al. 1986,
Ennos et al. 1997, Sinclair et al. 1998, Provan et al. 1998) but the origin of the sources
were uncertain. Within the bounds of our sample and the scenarios tested, our
model suggest that the Scottish populations have their origins in an admixture event
between colonising fronts originating from central-northern and south western
European populations (i.e. northern Iberian or southern France) previous to the
subsequent British migration. In agreement, the high values of diversity for the
Scottish populations (nHE: 0.51-0.66; cHE: 0.83-0.97), comparable to other Scottish and
Eurasian populations (Provan et al. 1998, Robledo-Arnuncio et al. 2004, Naydenov et
al. 2011, González-Díaz et al. 2017), are likely a result of multiple genetic pools.

Chapter 2
78
These results do not exclude the possibility of the survival of some relict populations
in the region of the southern British Isles or on now-submerged areas of western
continental shelf, which has been previously suggested (Kinloch et al. 1986). To date,
such a scenario has not been possible to test, as there are no living candidate
indigenous southern British populations and very limited Scots pine pollen
information from this area (Kelly et al. 2010). However, recent discoveries of native
populations in Ireland might hint this finding (McGeever & Mitchell 2016) and shed
more light in the origins of the most northwestern populations of Scots pine.
The latest reconstructions of the extent of British–Irish ice sheet show that Ireland
was totally covered by the ice up to 21 ka BP, while southern Britain of
approximately (between 52° and 53° North) was never covered by ice during the last
glaciation (Hughes et al. 2016), suggesting the persistence of free-ice areas during the
LGM. In agreement, SDM indicated some suitable areas for the species in southern
Britain, especially under the EUFORGEN model. Nevertheless, it is important to
bear in mind that existence of suitable habitat does not imply that habitat was all
occupied by the species. We also found evidence of a bottleneck at the time of the
LGM, with a subsequent expansion of the population, which suggest that Scots pine
population size would have been reduced at this time. As expected, ecological
conditions during the harsh cold and dry LGM conditions might have dramatically
reduced population size and subsequently genetic variation. However, subsequent
changing conditions during recolonization are also likely to have induced a series of

The processes shaping historical migration and colonisation
79
sequential founder effects and bottlenecks as the species moves (Provan & Bennett
2008). Therefore, the bottleneck signal detected in this study could be the result of
both, the LGM itself and the subsequent colonization by a small number of
individuals from southwestern and central Europe, that meet and admix.
2.5.4 Conclusions
In summary our results provide a greater resolution in the role of refuge areas into
Holocene migrations of Scots pine and likely sources of colonization and suggest
that historic climate changes and geographical barriers have played an important
role in the spatial distribution of current genetic diversity of Scots pine. Using a
combination of phylogeographic analysis together with species distribution models
we were able to provide some light in the Holocene migrations. Although we agree
with most previous studies in the absence of contribution from populations
originated in Italy and Asia Minor, we suggest some contribution from Balkan and
from the unexpected Iberian populations and likely contribution from northern
refugia. In addition, we also found evidences of the multiple origins of the most
northwestern populations of Scots pine. The use of multiple data sources in both
phylogeographic and SDM secures the inference against bias due to data type. This
has implications for studies of migration, estimation of range shifts and the role of
microclimates under changing conditions. Although cryptic refugia signals are likely
to have contributed to population expansion, we caution against using this evidence

Chapter 2
80
as a means to classify stand origins. As new markers with greater resolution are
currently developed (e.g. SNP based on a large panel of transcriptome variants), it
may be possible in the near future to add more evidences of specific location from
northern refugia of Scots pine populations and its role in subsequent migrations.
2.6 Acknowledgements
We thank the Scottish Forestry Trust, University of Stirling and Centre for Ecology
and Hydrology for co-funding this research. We are grateful to COST action FP1102
MaP-FGR (http://map-fgr.entecra.it/) and Santander Doctoral Travel Award for
supporting researcher mobility during this project.
2.7 References
Ansell SW, Stenøien HK, Grundmann M, Russell SJ, Koch MA, Schneider H, Vogel
JC (2011) The importance of Anatolian mountains as the cradle of global
diversity in Arabis alpina, a key arctic–alpine species. Ann Bot 108:241–252
Auckland LD, Bui T, Zhou Y, Shepard M, Williams CG, (2002) Conifer
microsatellite handbook. Corporate Press, Raleigh, N.C.
Barbet-Massin M, Jiguet F, Albert CH, Thuiller W (2012) Selecting pseudo-absences
for species distribution models: how, where and how many? Methods Ecol Evol
3:327–338
Barron E, Pollard D (2002) High-Resolution Climate Simulations of Oxygen Isotope
Stage 3 in Europe. Quat Res 58:296–309
Belletti P, Ferrazzini D, Piotti A, Monteleone I, Ducci F (2012) Genetic variation and

The processes shaping historical migration and colonisation
81
divergence in Scots pine (Pinus sylvestris L.) within its natural range in Italy.
Eur J For Res 131:1127–1138
Benito Garzón M, Alía R, Robson TM, Zavala M a. (2011) Intra-specific variability
and plasticity influence potential tree species distributions under climate
change. Glob Ecol Biogeogr 20:766–778
Bennett KD (1984) The post-glacial history of Pinus sylvestris in the British Isles.
Quaternaty Sci Rev 3:133–155
Bennett KD (1995) Post-glacial dynamics of pine (Pinus sylvestris L. and pinewoods
in Scotland. In: Aldhous JR (ed) Our pinewood heritage, Forestry C.
Bennett KD, Tzedakis PC, Willis KJ (1991) Quaternary refugia of north European
trees. J Biogeogr 18:103–115
Bhagwat SA, Willis KJ (2008) Species persistence in northerly glacial refugia of
Europe: a matter of chance or biogeographical traits? J Biogeogr 35:464–482
Bilgen BB, Kaya N (2007) Allozyme variations in six natural populations of scots
pine (Pinus sylvestris) in Turkey. Biologia (Bratisl) 62:697–703
Birks HJB (1989) Holocene isochrone maps and patterns of tree-spreading in the
British Isles. J Biogeogr 16:503–540
Birks HJB, Willis KJ (2010) Alpines , trees , and refugia in Europe. Plant Ecol Divers
1:147–160
Breiman, L., Friedman, J.H., Olshen, R.A. & Stone, C.J. (1984) Classification and
regression trees. Wadsworth & Brooks/Cole Advanced Books &
Software,Monterey, CA
Buchovska J, Danusevičius D, Baniulis D, Stanys V, Šikšnianiene JB, Kavaliauskas D
(2013) The location of the Northern glacial refugium of scots pine based on
mitochondrial DNA markers. Balt For 19:2–12
Carlisle A, Brown AHF (1968) Pinus sylvestris L. J Ecol 56:269–307
Chagné D, Chaumeil P, Ramboer A, Collada C, Guevara A, Cervera MT, Vendramin
GG, Garcia V, Frigerio J-M, Echt C, Richardson T, Plomion C (2004) Cross-
species transferability and mapping of genomic and cDNA SSRs in pines. Theor

Chapter 2
82
Appl Genet 109:1204–1214
Cheddadi R, Vendramin GG, Litt T, Kageyama M, Lorentz S, Laurent J, Beaulieu J
De, Sadori L, Jost A, Lunt D (2006) Imprints of glacial refugia in the modern
genetic diversity of Pinus sylvestris. Glob Ecol Biogeogr:271–282
Chiverrell RC, Thomas GSP (2010) Extent and timing of the Last Glacial Maximum
(LGM) in Britain and Ireland: a review. J Quat Sci 25:535–549
Comes HP, Kadereit JW (1998) The effect of Quaternary climatic changes on plant
distribution and evolution. Trends Plant Sci 3:432–438
Cornille a, Giraud T, Bellard C, Tellier a, Cam B Le, Smulders MJM, Kleinschmit J,
Roldan-Ruiz I, Gladieux P (2013) Postglacial recolonization history of the
European crabapple (Malus sylvestris Mill.), a wild contributor to the
domesticated apple. Mol Ecol 22:2249–63
Cornuet J, Pudlo P, Veyssier J, Dehne-garcia A, Leblois R, Marin J, Estoup A, Cbgp
UMR, Montpellier U, Cnrs UMR (2014) DIYABC v2 . 0 : a software to make
approximate Bayesian computa- tion inferences about population history using
single nucleotide polymorphism , DNA sequence and microsatellite data.
Bioinformatics:1–2
Cornuet JM, Ravigné V, Estoup A (2010) Inference on population history and model
checking using DNA sequence and microsatellite data with the software
DIYABC ( v1.0 ).
Cottrell J, Munro RC, Tabbener HE, Gillies, A. C. M., Forrest, G. I., Deans, J. D., &
Lowe, A. J. (2002). Distribution of chloroplast DNA variation in British oak
(Quercus robur and Q. petraea): The influence of postglacial colonisation and
human management. Forest Ecology and Management, 156, 181–195.
Daneck H (2016) Glacial survival in northern refugia ? Phylogeography of the
temperate shrub Rosa pendulina L . ( Rosaceae ): AFLP vs . chloroplast DNA ...
Biol J Linn Soc
Davis MB, Shaw RG (2001) Range shifts and adaptive responses to Quaternary
climate change. Science 292:673–9

The processes shaping historical migration and colonisation
83
Dering M, Kosiński P, Wyka TP, Pers E, Boratyński A, Boratyńska K, Reich PB,
Romo A, Zadworny M, Żytkowiak R, Oleksyn J (2017) Tertiary remnants and
Holocene colonizers: Genetic structure and phylogeography of Scots pine reveal
higher genetic diversity in young boreal than in relict Mediterranean
populations and a dual colonization of Fennoscandia. Divers Distrib:540–555
Donnelly K, Cottrell J, Ennos RA, Vendramin GG, Hara SA, King S, Perry A,
Wachowiak W, Cavers S (2016) Reconstructing the plant mitochondrial genome
for marker discovery: a case study using Pinus. Mol Ecol Resour:1–12
Earl DA, VonHoldt BM (2011) STRUCTURE HARVESTER: a website and program
for visualizing STRUCTURE output and implementing the Evanno method.
Conserv Genet Resour 4:359–361
Ennos RA, Sinclair WT, Perks MT (1997) Genetic insights into the evolution of Scots
pine, Pinus sylvestris L., in Scotland. Bot J Scotl 49:257–265
Evanno G, Regnaut S, Goudet J (2005) Detecting the number of clusters of
individuals using the software STRUCTURE: a simulation study. Mol Ecol
14:2611–2620
Excoffier L, Lischer HEL (2010) Arlequin suite ver 3.5: a new series of programs to
perform population genetics analyses under Linux and Windows. Mol Ecol
Resour 10:564–567
Falush D, Stephens M, Pritchard JK (2003) Inference of population structure using
multilocus genotype data: linked loci and correlated allele frequencies. Genetics
164:1567–1587
Forrest GI (1980) Genotypic variation among native Scots pine populations in
Scotland based on monoterpene analysis. Forestry 53:101–128
Froyd CA (2006) Long-term ecology of native pinewood communities in East Glen
Affric, Scotland. Forestry 79:279–291
García-Gil MR, Floran V, Östlund L, Mullin TJ, Gull BA (2015) Genetic diversity and
inbreeding in natural and managed populations of Scots pine. Tree Genet
Genomes 11:28

Chapter 2
84
González-Díaz P, Cavers S, Iason GR, Booth A, Russell J and Jump AS (under
review). Weak isolation by distance and geographic diversity gradients persist in
Scottish relict pine forest, linked to flowering asynchrony and effective gene
flow. iForest
González-Díaz P, Jump AS, Perry A, Wachowiak W, Lapshina E, Cavers S (2017)
Ecology and management history drive spatial genetic structure in Scots pine.
For Ecol Manage 400:68–76
Goudet J (1995) FSTAT (version 1.2): A computer program to calculate F-statistics. J
Hered 86:485–486
Hastie, T.J. & Tibshirani, R. (1990) Generalized additive models. Chapman &
Hall/CRC, Boca Raton, FL.
Hewitt GM (2000) The genetic legacy of the Quaternary ice ages. Nature 405:907–13
Hubisz MJ, Falush D, Stephens M, Pritchard JK (2009) Inferring weak population
structure with the assistance of sample group information. Mol Ecol Resour
9:1322–1332
Hughes ALC, Gyllencreutz R, Lohne ØYS, Mangerud JAN, Inge J (2016) The last
Eurasian ice sheets – a chronological database and time-slice reconstruction,
DATED-1. Boreas:1–45
Kelly A, Charman DJ, Newnham RM (2010) A Last Glacial Maximum pollen record
from Bodmin Moor showing a possible cryptic northern refugium in southwest
England. J Quat Sci 25:296–308
Kinloch B, Westfall RD, Forrest GI (1986) Caledonian Scots pine: origins and genetic
structure. New Phytol 104:703–729
Köble R, Seufert G (2001) Novel maps for forest tree species in Europe. In:
Proceedings of the 8th European Symposium on the physico-chemical
behabiour pf air pollutants: “a changing atmosthere.” Torino (IT), p 1–6
Kullman L (1998) Non-analogous tree flora in the Scandes Mountains, Sweden,
during the early Holocene - macrofossil evidence of rapid geographic spread
and response to palaeoclimate. Boreas 27:153–161

The processes shaping historical migration and colonisation
85
Labra M, Grassi F, Sgorbati S, Ferrari C (2006) Distribution of genetic variability in
southern populations of Scots pine (Pinus sylvestris L.) from the Alps to the
Apennines. Flora - Morphol Distrib Funct Ecol Plants 201:468–476
Librado P, Rozas J (2006) DnaSP v5: A software for comprehensive analysis of DNA
poly- morphism data. Genet Popul Anal:1–2
Liewlaksaneeyanawin C, Ritland CE, El-Kassaby Y a, Ritland K (2004) Single-copy,
species-transferable microsatellite markers developed from loblolly pine ESTs.
Theor Appl Genet 109:361–369
Magri D, Vendramin GG, Comps B, Dupanloup I, Geburek T, Gömöry DS, Litt T,
Paule L, Roure JM, Tantau I (2006) A new scenario for the Quaternary history of
European beech populations: palaeobotanical evidence and genetic
consequences. New Phytol 171:199–221
Mayol M, Riba M, Gonz SC, Bagnoli F, Beaulieu J De, Berganzo E, Burgarella C,
Dubreuil M, Krajmerov D, Paule L, Rom I, Vettori C, Vincenot L, Vendramin
GG (2015) Adapting through glacial cycles: insights from a long-lived tree
(Taxus baccata). New Phytol:1–14
McCullagh, P. & Nelder, J.A. (1989) Generalized linear models. Chapman and Hall,
London.
McGeever AH, Mitchell FJG (2016) Re-defining the natural range of Scots Pine
(Pinus sylvestris L.): a newly discovered microrefugium in western Ireland. J
Biogeogr 43:2199–2208
Mousadik A El, Petit RJ (1996) High level of genetic differentiation for allelic richness
among populations of the Argan Tree [Arganiaspinosa spinosa (L.) Skeels]
endemic to Morocco. Theor Appl Genet 92:832–839
Naydenov KD, Naydenov MK, Tremblay F, Alexandrov A, Aubin-Fournier LD
(2011) Patterns of genetic diversity that result from bottlenecks in Scots Pine and
the implications for local genetic conservation and management practices in
Bulgaria. New For 42:179–193
Naydenov KD, Senneville S, Beaulieu J, Tremblay F, Bousquet J (2007) Glacial

Chapter 2
86
vicariance in Eurasia: mitochondrial DNA evidence from Scots pine for a
complex heritage involving genetically distinct refugia at mid-northern latitudes
and in Asia Minor. BMC Evol Biol 7:233
Nowakowska JA, Zachara T, Konecka A (2014) Genetic variability of Scots pine
(Pinus sylvestris L.) and Norway spruce (Picea abies L. Karst.) natural
regeneration compared with their maternal stands. For Res Pap 75:47–54
Parducci L, Jørgensen T, Tollefsrud MM, Elverland E, Alm T, Fontana SL, Bennett
KD, Haile J, Matetovici I, Suyama Y, Edwards ME, Andersen K, Rasmussen M,
Boessenkool S, Coissac E, Brochmann C, Taberlet P, Houmark-Nielsen M,
Larsen NK, Orlando L, Gilbert MTP, Kjær KH, Alsos IG, Willerslev E (2012)
Glacial survival of boreal trees in northern Scandinavia. Science 335:1083–6
Pascual M, Chapuis MP, Mestres F, Balanyà J, Huey RB, Gilchrist GW, Serra L,
Estoup A (2007) Introduction history of Drosophila subobscura in the New
World: a microsatellite-based survey using ABC methods. Mol Ecol 16:3069–
3083
Petit RJ, Aguinagalde I, Beaulieu J-L de, Bittkau C, Brewer S, Cheddadi R, Ennos RA,
Fineschi S, Grivet D, Lascoux M, Mohanty A, Müller-Starck G, Demesure-
Musch B, Palmé A, Martín JP, Rendell S, Vendramin GG (2003) Glacial refugia:
hot spots but not melting pots of genetic diversity. Science (80- ) 300:1563–1565
Piotti A, Leonarduzzi C, Postolache D, Bagnoli F, Spanu I, Brousseau L, Urbinati C,
Leonardi S, Vendramin GG, Urfm UR (2017) Unexpected scenarios from
Mediterranean refugial areas : disentangling complex demographic dynamics
along the Apennine distribution of silver fir. J Biogeogr
Porras-Hurtado L, Ruiz Y, Santos C, Phillips C, Carracedo A, Lareu MV (2013) An
overview of STRUCTURE: applications, parameter settings, and supporting
software. Front Genet 4:1–13
Pritchard JK, Stephens M, Donnelly P (2000) Inference of population structure using
multilocus genotype data. Genetics 155:945–959
Provan J, Bennett KD (2008) Phylogeographic insights into cryptic glacial refugia.

The processes shaping historical migration and colonisation
87
Trends Ecol Evol 23:564–71
Provan J, Soranzo N, Wilson NJ, McNicol JW, Forrest GI, Cottrell JE, Powell W
(1998) Gene-pool variation in caledonian and European Scots pine (Pinus
sylvestris L.) revealed by chloroplast simple-sequence repeats. Proc Biol Sci
265:1697–1705
Prus-Glowacki W, Stephan BR (1994) Genetic variation of Pinus sylvestris from
Spain in relation to other European populations. Silvae Genet 43:7–14
Prus-Glowacki W, Urbaniak L, Bujas E, Curtu AL (2012) Genetic variation of isolated
and peripheral populations of Pinus sylvestris (L.) from glacial refugia. Flora -
Morphol Distrib Funct Ecol Plants 207:150–158
Pyhäjärvi T, Salmela MJ, Savolainen O (2008) Colonization routes of Pinus sylvestris
inferred from distribution of mitochondrial DNA variation. Tree Genet
Genomes 4:247–254
R Development Core Team R (2011) R: A Language and Environment for Statistical
Computing (RDC Team, Ed.). R Found Stat Comput 1:409
Rannala B, Mountain J (1997) Detecting immigration by using multilocus genotypes.
Proc Natl Acad Sci U S A 94:9197–9201
Razgour O, Juste J, Ibáñez C, Kiefer A, Rebelo H, Puechmaille SJ, Arlettaz R, Burke
T, Dawson D a, Beaumont M, Jones G (2013) The shaping of genetic variation in
edge-of-range populations under past and future climate change. Ecol Lett
16:1258–66
Robledo-Arnuncio JJ, Alia R, Gil L (2004) High levels of genetic diversity in a long-
term European glacial refugium of Pinus sylvestris L. For Genet 11:239–248
Robledo-Arnuncio JJ (2011). Wind pollination over mesoscale distances: an
investigation with Scots pine. New Phytol. 190, 222–233.
Scalfi M, Piotti A, Rossi M, Piovani P (2009) Genetic variability of Italian southern
Scots pine (Pinus sylvestris L.) populations: the rear edge of the range. Eur J For
Res 128:377–386
Sebastiani F, Pinzauti F, Kujala ST, González-Martínez SC, Vendramin GG (2011)

Chapter 2
88
Novel polymorphic nuclear microsatellite markers for Pinus sylvestris L.
Conserv Genet Resour 4:231–234
Serra-Varela MJ, Grivet D, Vincenot L, Broennimann O, Gonzalo-Jiménez J,
Zimmermann NE (2015) Does phylogeographical structure relate to climatic
niche divergence? A test using maritime pine (Pinus pinasterAit.). Glob Ecol
Biogeogr 24:1302–1313
Sinclair WT, Morman JD, Ennos RA (1998) Multiple origins for Scots pine (Pinus
sylvestris L.) in Scotland: evidence from mitochondrial DNA variation. Heredity
(Edinb) 80:233–240
Sinclair WT, Morman JD, Ennos RA (1999) The postglacial history of Scots pine (
Pinus sylvestris L .) in western Europe : evidence from mitochondrial DNA
variation. Mol Ecol 8:83–88
Soranzo N, Alia R, Provan J, Powell W (2000) Patterns of variation at a mitochondrial
sequence-tagged-site locus provides new insights into the postglacial history of
European Pinus sylvestris populations. Mol Ecol 9:1205–11
Soranzo N, Provan J, Powell W (1998) Characterization of microsatellite loci in Pinus
sylvestris L. Mol Ecol 7:1260–1261
Souto CP, Kitzberger T, Arbetman MP, Premoli AC (2015) How do cold-sensitive
species endure ice ages? Phylogeographic and paleodistribution models of
postglacial range expansion of the mesothermic drought-tolerant conifer
Austrocedrus chilensis. New Phytol
Steven HM, Carlisle A (1959). The native pinewoods of Scotland. GC Book
Publishers, Edinburgh.
Stewart JR, Lister AM (2001) Cryptic northern refugia and the origins of the modern
biota. Trends Ecol Evol 16:608–613
Svenning J-C, Normand S, Kageyama M (2008) Glacial refugia of temperate trees in
Europe: insights from species distribution modelling. J Ecol 96:1117–1127
Tóth EG, Vendramin GG, Bagnoli F, Cseke K (2017) High genetic diversity and
distinct origin of recently fragmented Scots pine (Pinus sylvestris L.)

The processes shaping historical migration and colonisation
89
populations along the Carpathians and the Pannonian Basin. Tree Genet
Genomes 13:1–12
Tzedakis PC, Emerson BC, Hewitt GM (2013) Cryptic or mystic? Glacial tree refugia
in northern Europe. Trends Ecol Evol 28:696–704
Vendramin GG, Lelli L, Rossi P, Morgante M (1996). A set of primers for the
amplification of 20 chloroplast microsatellites in Pinaceae. Mol Ecol 5: 595–598.
Wachowiak W, Salmela MJ, Ennos RA, Iason G, Cavers S (2011) High genetic
diversity at the extreme range edge: nucleotide variation at nuclear loci in Scots
pine (Pinus sylvestris L.) in Scotland. Heredity (Edinb) 106:775–787
Willis KJ, Andel T van (2004) Trees or no trees? The environments of central and
eastern Europe during the Last Glaciation. Quat Sci Rev 23:2369–2387
Willis KJ, Rudner E, Sümegi P (2000) The full-glacial forests of central and
southeastern Europe. Quat Res 53:203–213
Wójkiewicz B, Litkowiec M, Wachowiak W (2016) Contrasting patterns of genetic
variation in core and peripheral populations of highly outcrossing and wind
pollinated forest tree species. AoB Plants:1–13
Wójkiewicz B, Wachowiak W (2016) Substructuring of Scots pine in Europe based on
polymorphism at chloroplast microsatellite loci. Flora 220:142–149

Chapter 2
90
2.8 Supplementary material
S2.1 Continental study sites for the SSR (nuclear and chloroplast microsatellite markers)
European datasets
Code
Location of study site Longitude Latitude Altitude
(m a.s.l.) Country Site name
T1
Turkey
Şavşat- Ardahan E 42.43 N 41.23 1700
T2
Sakaltutan Geçidi. S from
Şiran E 39.05 N 39.87 2010
T3 Tokat-Yıldızeli E 36.52 N 39.96 1579
T4 Çatacık E 31.11 N 39.96 1619
T5 Bayabat-Sinop E 34.83 N 41.64 1228
U Ukraine Crimea. Yalta E 34.20 N 44.55 1380
G Greece Ano Vrandou E 23.65 N 41.31 1350
B Bulgaria Pirin. Bansko-Razlog E 23.36 N 41.88 1076
S Serbia Divčibare Mts E 19.99 N 44.10 957
SP1
Spain
- W 2.42 N 37.01 -
S2 - W 3.42 N 37.17 -
H1 Sierra de Gúdar. Valldelinares W 00.61 N 40.38 1950
H2 Sierra de Neila W 03.01 N 42.05 1400
H3 Puerto de Navafría W 03.81 N 40.98 1800
H4 Pyrenees. Tunel de Viella E 01.57 N 42.52 1500
A Andorra St. Miguel d’Engolasters E 00.77 N 42.67 1550
F France Forêt Domaniale E 02.02 N 45.66 800
IT Italy - E 13.03 N 42.44 -
AU Austria - E 14.55 N 47.52 -
PO
- E 17.50 N 51.97 -
PL1
Poland
Chojnik E 15.64 N 50.83 600
Szczeliniec E 16.34 N 50.48 900
PL2
Rezerwat "Pusta Wielka" E 20.82 N 49.40 1000
Tatry. Koryciska Wielkie E 19.83 N 49.27 1000
Pieniński Park Narodowy E 20.36 N 49.42 800
Torfowiska Tarnawa E 22.49 N 49.10 650
PL3 Hajnówka E 23.58 N 52.74 165
Rezerwat Liski E 22.82 N 51.95 150
PL4
WDN Woziwoda E 17.91 N 53.67 120
Rezerwat Tabórz E 20.04 N 53.77 115
Miłomłyn E 19.84 N 53.76 100
FI1
Finland
- E 29.39 N 61.76 -
FI2 - E 23.78 N 67.33 -
F1 Joutsa E 26.14 N 61.74 125

The processes shaping historical migration and colonisation
91
F2
Area near Temmes and
Tyrnävä E 25.71 N 64.69 64
F3 Area near Rovaniemi E 26.21 N 66.57 120
F4 Area near Kielajoki E 29.07 N 69.65 100
SW1 Sweeden
- E 20.73 N 64.61 -
SW2 - E 13.68 N 62.70 -
SC
Scotland
Abernethy W 3.62 N 57.21
SC1 - W 5.65 N 57.52 -
SC2 - W 2.84 N 57.06 -
SC3 - W 3.81 N 57.17 -
SC4 - W 4.76 N 57.34 -
SC5 - W 4.35 N 56.67
S2.2 Worldclim variables used as environmental predictors
Variable Description
BIO1 Annual Mean Temperature
BIO2 Mean Diurnal Range (Mean of monthly (max temp - min temp))
BIO3 Isothermality (BIO2/BIO7) (* 100)
BIO4 Temperature Seasonality (standard deviation *100)
BIO5 Max Temperature of Warmest Month
BIO6 Min Temperature of Coldest Month
BIO7 Temperature Annual Range (BIO5-BIO6)
BIO8 Mean Temperature of Wettest Quarter
BIO9 Mean Temperature of Driest Quarter
BIO10 Mean Temperature of Warmest Quarter
BIO11 Mean Temperature of Coldest Quarter
BIO12 Annual Precipitation
BIO13 Precipitation of Wettest Month
BIO14 Precipitation of Driest Month
BIO15 Precipitation Seasonality (Coefficient of Variation)
BIO16 Precipitation of Wettest Quarter
BIO17 Precipitation of Driest Quarter
BIO18 Precipitation of Warmest Quarter
BIO19 Precipitation of Coldest Quarter

Chapter 2
92
S2.3 Scots pine occurrence data from the
three sources: (a) TSDE Database filtered
by EURFORGEN, (b) Adult presence
from national inventory dataset, and (c)
regeneration presence (seedlings) from
national inventory dataset.

Chapter 3
Weak isolation by distance and geographic
diversity gradients persist in Scottish relict
pine forest
Authors: Patricia González-Díaz, Stephen Cavers, Glenn Iason, Alan
Booth, Joanne Russell, and Alistair S. Jump
Under review in iForest

Photos in Chapter 3 main page taken from; left: http://www.woodlandtrust.org.uk/ (R.
Whittet) and right: P. González-Díaz.

The role and processes shaping contemporary gene flow
95
3.1 Abstract
Gene flow is one of the main factors shaping genetic diversity within and among tree
populations, and occurs through pollen and seed dispersal. Recent findings of
pollen-release asynchronies in distant populations of Scots pine (Pinus sylvestris L.)
within Scotland suggest that gene dispersal among more distant populations might
be less effective than previously thought. Limited gene dispersal is one of the major
factors causing genetic structure for neutral markers, and pollen-release asynchrony
could have driven isolation by distance (IBD) among Scottish populations. Previous
studies of neutral markers found little differentiation among Scottish populations of
Scots pine, however they did not consider IBD over the full Scottish range. We
analysed data from 6 nuclear simple sequence repeats (SSR) and 5 chloroplast SSR
loci in a total of 540 individuals of Scots pine from 18 populations across Scotland.
Our aim was to assess contemporary levels and distribution of genetic variation and
to test if the distribution of genetic diversity was consistent with IBD. We also
analysed patterns of gene flow that could have contributed to the observed patterns
of variation. Levels of genetic diversity were high, for both nuclear and chloroplast
markers within populations, and there was no significant differentiation among
populations. A weak signal of IBD was present. We found an increase in nuclear
diversity towards the East along with greater gene flow in a West – East direction
commensurate with the prevailing winds. Our findings suggest that this wind-
driven gene flow is dominant over genetic drift and prevents differentiation among

Chapter 3
96
the Scottish populations. It may also counteract any pollen-release asynchronies
among populations.

The role and processes shaping contemporary gene flow
97
3.2 Introduction
Genetic diversity provides the fundamental basis for the evolution of forest tree
species and for their adaptation to change (FAO 2014). The importance of including
genetic factors in sustainable forest management has been strongly supported in
recent years (Lefèvre et al. 2013, FAO 2014, Alfaro et al. 2014, Cavers & Cottrell 2014,
Fady et al. 2016b) particularly in marginal populations (Fady et al. 2016a).
Accordingly, several schemes have been proposed for monitoring genetic diversity
at the European (Aravanopoulos et al. 2015) and international levels (Graudal et al.
2014), including the quantification of both adaptive and neutral genetic diversity in
forest trees.
Neutral genetic diversity, which has little or no effect on the phenotype, is valuable
for studying the effects of historical events such as population size changes,
dispersal and vicariance, and of contemporary processes affecting gene flow, such as
pollen and seed dispersal (Holderegger et al. 2006). Characterisation of the level and
structure of neutral genetic diversity is considered an appropriate first step to
designate conservation units (Rodríguez-Quilón et al. 2016). The amount of neutral
genetic diversity and how it is partitioned within and among populations typically
results from the balance between gene flow and random genetic drift (Burczyk et al.
2004, Steinke et al. 2008). Gene flow can counteract genetic differentiation through
genetic homogenization, whereas genetic drift (the random changes of allele
frequencies over generations) is expected to lead to differentiation among

Chapter 3
98
populations (Slatkin 1985). Determining levels and structure of neutral genetic
diversity of tree populations should be an essential step in the design of sustainable
forest management plans, as well as to better understand the processes that are
likely responsible for the maintenance of such diversity.
Gene flow occurs through pollen and seed dispersal (Savolainen et al. 2007), and in
wind-pollinated trees is usually more extensive by pollen than by seeds (e.g. pollen
flow in pines was up to approximately 60 times greater than seed flow (Ennos 1994)).
Although declining gene flow with distance is expected given that most pollen
deposition, pollination events and seedling establishment occur near the parent
plant (Deacon & Cavender-Bares 2015), genes and especially pollen can travel long
distances, resulting in large pollen-mediated gene flow (Ouborg et al. 1999). Pollen
dispersal is, therefore, expected to shape the level and structure of genetic variation
within and among tree populations at local and regional scales (Burczyk et al. 2004).
For example, Scots pine pollen from southern and central Finland contributes to
populations located hundreds of km further north (Lindgren et al. 1995, Varis et al.
2009).
Multiple ecological factors can restrict pollen-mediated gene flow among wind-
pollinated tree populations, and hence lead to temporal or spatial increases in
genetic drift. Physical barriers (e.g. mountains) (Naydenov et al. 2011) and
fragmentation (Provan et al. 2007, Cuartas-Hernández et al. 2010) may restrict pollen
flow. However, in some cases, increases of pollen flow counteract diversity loss

The role and processes shaping contemporary gene flow
99
resulting from fragmentation (White et al. 2002, Petit & Hampe 2006, Wang et al.
2012, Davies et al. 2013). Other significant barriers to pollen flow, that have received
less attention, can be due to asynchrony in reproductive phenology (e.g. timing of
pollen or flower production) (Aitken et al. 2008, Whittet et al. 2017), which may limit
the randomness of mating (Gutierrez & Sprague 1959). Indeed, there is evidence that
plants mate with phenologically similar individuals more frequently than random
(Gutierrez & Sprague 1959, Ennos & Dodson 1987). Consequently, differences in
timing of reproductive phenology in nearby tree populations are expected to favour
mating between physically closer individuals by mating incompatibility among tree
populations, thereby reinforcing isolation by distance (IBD). In addition, wind
patterns might also influence the levels and direction of gene flow, such as the
significant contribution to directional pollen flow in Scots pine populations from
Scandinavia (Lindgren et al. 1995).
The fragmented natural Scots pine (Pinus sylvestris L.) forests of Scotland represent
the westernmost extreme of the species’ native range, separated by at least 500 km
from natural stands in mainland Europe (Ennos et al. 1997b). Despite their
geographical marginality, previous studies on the Scottish Scots pine populations
found high levels of neutral genetic variation but little differentiation among
populations (Provan et al. 1998, Sinclair et al. 1998, Wachowiak et al. 2011) (Tab. 3.1).
The westernmost populations have previously been found to be somewhat distinct

Chapter 3
100
from the others (Forrest 1980, Kinloch et al. 1986, Sinclair et al. 1998) (Table 3.1), on
the basis of allele frequency differences.
A recent study found mismatches in timing of pollen release between a Western and
an Eastern population from Scotland. Pollen was released first in the west, between
9.8 to 15.8 days earlier than in the east (Whittet et al. 2017). Consistent asynchrony in
pollen production among populations will limit gene flow; where the extent of
asynchrony reflects geographic distance, a pattern of IBD will be established.
Although several studies have addressed genetic variation in Scots pine from
Scotland (Table 3.1), these studies have not investigated patterns of IBD in the full
Scottish range. Forrest (1980) found a trend of gradually increasing genetic similarity
from the southwest of the Scottish range toward the northeast. Other studies
included estimates of FST (Kinloch et al. 1986, Sinclair et al. 1998, Wachowiak et al.
2011, Wachowiak et al. 2013), which indicate the extent of genetic differentiation
(genetic structure) among populations, regardless of the distance. Measures of IBD
indicate the relationships between geographic and genetic distance, and can help us
to identify where restricted gene dispersal may relate to geographic factors.
Based on the previous evidence, we hypothesised that, despite extensive pollen
dispersal by wind, the presence of an East-West asynchrony in pollen production
might result in IBD due to a higher probability that more synchronous populations
will mate with each other. Alternatively, the absence of identifiable IBD would
suggest that despite the presence of pollen asynchrony, effective gene flow at the

The role and processes shaping contemporary gene flow
101
regional scale, might have prevented differentiation. To test this hypothesis we
characterised genetic diversity along the full East-West gradient of Scots pine within
Scotland with two sets of neutral molecular markers, nuclear and chloroplast
microsatellites (SSR). The use of both markers can allow greater understanding of
the factors driving differentiation than based on either alone (Zinck & Rajora, 2016,
Sjölund et al. 2017); chloroplast DNA is paternally inherited in conifers via
dispersing pollen, and nuclear DNA is bi-parentally inherited via both pollen and
seed dispersal. In addition, the coverage of the full native range of Scots pine in
Scotland, allows much greater resolution of geographical structuring of gene flow,
including IBD, since most other SSR-based studies of this species incorporated
relatively few Scottish populations (Provan et al. 1998, González-Díaz et al. 2017) or
did not focus on these aspects of the species’ biology (e.g. Salmela et al. 2011).
Specifically, we sought to answer the following questions, (1) what are the
contemporary levels and structure of genetic variation of the Scots pine populations
across Scotland, (2) is there any evidence of IBD and (3) what are the gene flow
patterns among the studied populations?

Chapter 3
102
Table 3.1 Studies assessing neutral genetic variation of Scots pine in Scotland using variable molecular markers: RFLP, Restriction Fragment Length
Polymorphism; SSR, Simple Sequence Repeat or microsatellite; SNP, Single Nucleotide Polymorphism, indicating No. pop., number of studied populations;
No. ind., number of genotyped individuals.
Marker
Location No.
pop.
No.
ind. No. markers
Population
differenciation
Gst*/Fst**/
AMOVA#/
Diversity Reference Main conclusions
Monoterpene Scotland 41 6705 11 Similarity matrix:
0-24 over 30 - Forrest et al., 1980
Variation between sites allowed divide the natural range into several
areas of biochemical similarity, the most distinct being a north-western
group of sites with Shieldaig as its most distinctive site. A trend of
gradually decreased of similarity from the north east from Scotland in a
south westerly direction.
Monoterpene
Europe 6 953 11 Similarity matrix:
3-24 over 30 -
Forrest 1982
Northern European populations were similar to each other but the three
from middle and southern Europe showed large differences from them
and from each other. Western region from Scotland showed similarity
to middle Europe and south western populations to northern Europe.
Scotland
(from Forrest
et al., 1980)
41 953 11 Similarity matrix:
0-24 over 30 -
Monoterpene Scotland
40 5765 6 0.045* 0.272 - 0.378
Kinloch et al., 1986
High genetic diversity. Several populations in the Western region from
Scotland were distinct from all others and each other. Scottish Scots
pine forest originated from more than one refugium after the last
glaciation. Izozymes 14 2177 9 0.028* 0.291 - 0.311
RFLP
(mtDNA) Scotland 20 466
Coxl
mitochondrial
gene
0.37** - Sinclair et al., 1998 Two mitotypes were present: mitotype a is present at all sites, but that
mitotype b is confined to three western populations
SSR (cpDNA)
Scotland 7 330 17 0.032# 0.950 - 0.987
Provan et al. 1998
Higher levels of diversity for the Scottish populations than those for
European population. A mutation in one loci occurred in the Western
region of Scotland. Europe 8 185 17 Scot vs Eur
0.0148# 0.908 - 0.976
SNP (nDNA) Scotland 21 42 16 -0.017 - 0.023
0.754 - 0.819
(0.831 at 8 loci) Wachowiak et al.,
2011
High genetic diversity
Europe 7 40 10 0.071 - 0.079 (0.795 at 8 loci)
SSR (nDNA) Scotland 21 1680 3 - - Salmela et al., 2011 High levels of outcrossing in Scottish populations
SNP (nDNA) Scotland 12
120
0.009**
0.67
0.81
Wachowiak et al.,
2013 High levels of nucleotide diversity within populations
SNP (mtDNA) Scotland
SSR (nDNA) Scotland 2 647 12 0.004** 0.56-0.58 González-Díaz et al.
2017
High levels of genetic diversity and presence of moderate fine-scale
spatial genetic structure

The role and processes shaping contemporary gene flow
103
3.3 Material and methods
3.3.1 Study species
Scots pine (Pinus sylvestris L.) in Scotland is a foundation species of the remnant
Caledonian pine forests. It is typically a pioneer species that readily regenerates after
major natural or human disturbances, if competition and grazing pressure are low
(Mátyás et al. 2004). It grows well on most soils, nevertheless, due to low tolerance of
shade and competition, it is often restricted to poor soils (Steven & Carlisle 1959).
Based on fossil data, this species reached its maximum extent in Scotland around
8000 years ago, covering approximately 1.5 million ha (Bennett 1984, Birks 1989,
Froyd 2006). Nowadays, 84 fragments of the ancient native pine forest remain in this
area, scattered over a total area of 17,882 ha (Mason et al. 2004).
3.3.2 Study sites and microsatellite analysis
Eighteen populations were selected to cover the full native range of Scots pine
within Scotland (Table3.2, Fig. 3.1). We sampled a total of 30 randomly selected trees
within each population. Sampled trees were old adults, thereby avoiding potential
effects of gene flow from more recent Scots pine plantations that might otherwise
obscure patterns of genetic diversity and divergence in the native stands.

Chapter 3
104
Figure 3.1 Study populations for nSSR and cSSR analyses.
Table 3.2 Details of study sites. Population area was obtained from Mason et al. (2004).
Population name Population
code
Seed
zone
Population
pine area Latitude Longitude Altitude
Cona Glen COG SW 189 56.78 5.33 148
Glen Loy GLL SW 74 56.91 5.13 170
Crannach CRA SW 70 56.5 4.77 296
Coille Coire Chuilc CCC SC 67 56.41 4.71 257
Meggernie MEG SC 277 56.58 4.35 306
Black Wood of Rannoch BWR SC 1011 56.67 4.32 275
Abernethy ABE EC 2452 57.24 3.66 341
Rothiemurchus ROT EC 1744 57.15 3.77 318
Allt Cul ALT NE 13 57.11 3.33 476
Glen Tanar GLT NE 1564 57.05 2.86 334
Glen Affric GLA NC 1532 57.27 4.92 256
Amat AMA NC 181 57.87 4.59 137
Loch Clair LOC NW 126 57.56 5.34 132
Shieldaig SHI NW 103 57.51 5.64 81
Beinn Eighe BEE NW 182 57.63 5.35 63
Glen Einig GLE N 27 57.95 4.76 55
Strath Oykell STO N 14 57.95 4.64 103
Rhidorroch RHI N 103 57.93 4.97 182

The role and processes shaping contemporary gene flow
105
Total genomic DNA was extracted from 50 mg silica gel-dried needles using a
QIAGEN DNeasy plant extraction kit (QIAGEN Ltd. Crawley, UK) following the
manufacturer’s protocol. All individuals from the eighteen Scottish populations
were genotyped at six nuclear (nSSR) and five chloroplast (cSSR) microsatellite
markers. We used six nSSR: PSAJ223770/SPAC11.14, PSAJ223766/SPAC11.8 (Soranzo
et al. 1998), Ptx2146 (Aukland et al. 2002), SsrPt_ctg4698, SsrPt_ctg9249 (Chagné et al.
2004) and LOP3 (Liewlaksaneeyanawin et al. 2004); and five cSSR: PCP26106,
PCP30277, PCP36567, PCP45071, PCP87314 (Provan et al. 1998). Reactions were
carried out in a final volume of 10 µl with 1 µM fluorescently-labelled forward
primer, 1 µM reverse primer, 200 µM each dNTPs, 0.5 units Taq polymerase (Roche
Applied Science), 1X PCR buffer (supplied with Taq) and 25 ng of template DNA.
Annealing temperature was 56°C. Polymerase chain reactions (PCR) were performed
in a Gene Amp PCR System 9700 thermo cycler (Applied Biosystems, Bleiswijk,
Netherlands), with the following programme: 1 cycle at 95°C for 4 min followed by
35 cycles at 95°C for 45 s, 56°C for 45 s, 72°C for 45 s, and a final step at 72°C for 5
min. Fragment analysis was performed by Genome Technology at James Hutton
Institute, Dundee, UK, using a 3730 DNA Sequencer (Applied Biosystems) with
reference to a ROX 500 size standard. Fragments were scored using GeneMarker
V.2.6.0. (SoftGenetics, State College, PA, USA). Null allele frequencies at nuclear loci
for each locus and each population were checked by using the software Micro-
Checker (Van Oosterhout et al. 2004). PSAJ223770/SPAC11.14 showed evidence of
null alleles, however the frequency was below 0.2, which is the threshold over which

Chapter 3
106
null alleles can result in a significant underestimate of expected heterozygosity HE
(Chapuis & Estoup, 2007, Belletti et al. 2012), therefore it was kept for further
analysis.
3.3.3 Data analysis
3.3.3.1 Genetic diversity
Genetic diversity estimators within populations were estimated using FSTAT 2.9.3.2
(Goudet 1995) and Arlequin v3.5 (Excoffier & Lischer 2010). For nSSR, we estimated
mean number of alleles per locus (nA), rarefied allelic richness (nAR), number of
private alleles (nAp), observed heterozygosity (nHO), expected heterozygosity (nHE)
and inbreeding coefficient (nFIS). Rarefaction of allelic richness controls for
differences in sample size (El Mousadik & Petit 1996) allowing comparison among
sites and studies. For cSSR, we estimated mean number of alleles (cA). For the
remaining cSSR estimators, alleles were combined to compose a unique chloroplast
haplotype for each individual. Individuals with missing data were discarded from
the inference of multilocus haplotypes. We estimated number of haplotypes (cHN),
number of private haplotypes (cHP) and gene diversity (cHE), the latter based on
haplotype frequencies (Nei, 1987).

The role and processes shaping contemporary gene flow
107
3.3.3.2 Population differentiation and Bayesian clustering
To estimate population differentiation, we calculated nFST among populations using
nSSR in Arlequin v3.5 (Excoffier & Lischer 2010), and the differentiation index D
(Jost 2008) implemented in the R package DEMEtics (Gerlach et al. 2010). In both
cases, significance values were determined for a 5% nominal level after Bonferonni
correction. Multilocus haplotypic and genetic estimators for both nSSR and cSSR
(nHE, nAR, cHE and cHN) were mapped using ARCMAP 10 (ESRI, Redlands, CA, USA),
using inverse distance weight methods available on the spatial analyst interpolation
tool. To map nuclear genetic differentiation, for each site we calculated the
percentage of total sites that it was significantly differentiated from (e.g. percentage
of differentiated sites, nDS (%)), based on nFST values (Weir & Cockerham 1984). To
quantify the distribution of variation of nuclear genetic diversity and chloroplast
haplotypes, we tested both marker sets in an hierarchical analysis of molecular
variance (AMOVA) from the level of individual, population and cluster of
populations (see directional relative migration rates section), performed in Arlequin
3.5 (Excoffier & Lischer 2010).
We performed individual-based Bayesian assignment methods using data from
nuclear loci in STRUCTURE 2.3.4. (Pritchard et al. 2000). We used a model assuming
correlated allele frequencies (Falush et al. 2003) and admixed ancestry. We included
the site location a priori (LOCPRIOR option) to improve the detection of weak
population structure (Hubisz et al. 2009). K was set from 1 to 20, with 10 runs

Chapter 3
108
performed for each value of K. Runs consisted of 500,000 Markov Chain Monte Carlo
(MCMC) iterations with a burn-in period of 100,000. We used STRUCTURE
HARVESTER (Earl & VonHoldt 2011), an application that uses the Evanno method
(Evanno et al. 2005) for assessing and visualizing likelihood values across multiple
values of K and detecting the number of genetic groups that best fit the data.
3.3.3.3 Isolation by distance and directional relative migration rates
For testing isolation by distance we used nuclear markers in SPAGeDi 1.4 (Hardy &
Vekemans 2002) with significance determined by permuting site locations among
populations 10,000 times. Following Rousset (1997), we used the FST /(1- FST) ratio as a
measure of genetic distance as it is expected to vary linearly with the natural log of
the geographical distance.
To reduce the number of sites to an analytically tractable set for estimating migration
patterns, we grouped sites with their nearest neighbours to give seven site clusters,
corresponding to the biochemical zones described by Forrest (1980) and used as a
seed zones (Table 2). Directional relative migration rates between site clusters were
estimated using nuclear markers and the function DIVMIGRATE from the R-
package DIVERSITY (Keenan et al. 2013) using JOST’S D (Jost 2008) as a measure of
genetic differentiation. To test whether relative migration is significantly higher in
one direction than the other (e.g. asymmetric), 95% confidence intervals were
calculated from 1,000 bootstrap iterations.

The role and processes shaping contemporary gene flow
109
3.4 Results
3.4.1 Genetic diversity
Among the six nuclear loci analysed, the number of alleles per locus (nA) ranged
from 2 to 14, with a multilocus average of 11.5 ± 7.34 for all populations combined. In
total we obtained 9 private alleles. For rarefied allelic richness (nAR), multilocus
estimates ranged from values of 5.42 to 7.55, based on a minimum number of 28
diploid individuals, with a multilocus average of 5.84 for all populations combined
(Table 3.3 and Fig. 3.2b). The multilocus expected (nHE) and observed heterozygosity
(nHO) was 0.62 ± 0.03 and 0.54 ± 0.04 respectively for all populations combined (Table
3.3, and Fig. 3.2a for nHE). A general trend of lower nuclear diversity (nHE) in the
western sites and relatively higher diversity in the eastern sites was observed (Fig.
3.2a). This trend was positively correlated with longitude (F=6.703, R2=0.25, p<0.05),
but not for nAR. A general significant homozygote excess was found (overall
FIS=0.121, p < 0.05) (Table 3.3).
Among the five chloroplast loci analysed, the number of alleles per locus (cA)
ranged from 2 to 6, with a multilocus average of 3.08 for all populations combined.
Gene diversity (cHE) ranged between 0.83 and 0.96 (Table 3.3 and Fig. 3.2c). The
number of haplotypes (cHN) within populations ranged from 13 to 19 (Table 3.3 and
Fig. 3.2d), with a total of 64 haplotypes recorded, of which 42% (27 haplotypes) were
private (unique to a particular population) (Table 3.3). Although most western sites
showed high levels of chloroplast gene diversity (cHE), some of the eastern sites

Chapter 3
110
showed also high levels of diversity and the spatial trend was not as clear as for
nSSR (Fig. 3.2c). No significant correlation with longitude was found for chloroplast
diversity.

The role and processes shaping contemporary gene flow
111
Table 3.3 Genetic diversity estimators for nuclear (nSSR) and chloroplast (cSSR) markers.
Population nSSR cSSR
nN nA nAR nAp nHO nHE nFIS cN cA cHN cHP cHE
COG 30 6.1670 (3.3120) 6.0992 (2.9791) 1 0.4944 (0.2352) 0.5779 (0.2402) 0.1460*** 28 3.2 (1.095) 13 4 0.9339 (0.0227)
GLL 30 5.8330 (2.9270) 5.7860 (2.6523) 0 0.4944 (0.1500) 0.5801 (0.2743) 0.1500*** 25 2.8 (0.837) 14 1 0.9400 (0.0280)
CRA 30 6.3330 (3.1410) 6.2860 (2.8557) 1 0.5151 (0.1960) 0.6389 (0.1990) 0.1960*** 25 3.0 (1.225) 14 1 0.8967 (0.0431)
CCC 30 6.6670 (4.2270) 6.5777 (3.7589) 0 0.5722 (0.0460) 0.5995 (0.2201) 0.0460 23 2.8 (1.304) 14 1 0.9565 (0.0220)
MEG 30 5.5000 (2.8110) 5.4753 (2.5497) 0 0.5556 (0.1570) 0.6573 (0.1552) 0.1570*** 28 3.4 (1.673) 15 3 0.9048 (0.0420)
BWR 30 6.3330 (2.9440) 6.2638 (2.6361) 0 0.5860 (0.0560) 0.6200 (0.1885) 0.0560 23 3.2 (1.304) 14 3 0.9368 (0.0331)
ABE 30 7.1670 (3.7640) 7.0532 (3.3582) 1 0.6111 (0.0590) 0.6490 (0.2224) 0.0590 27 2.8 (1.304) 13 0 0.8291 (0.0684)
ROT 30 5.8330 (2.3170) 5.7767 (2.0727) 1 0.5935 (0.0500) 0.6240 (0.2063) 0.0500 27 3.4 (1.140) 17 3 0.9487 (0.0257)
ALT 30 6.3330 (3.0770) 6.2532 (2.7636) 1 0.5937 (0.0120) 0.6006 (0.2542) 0.0120 25 2.8 (0.837) 14 0 0.9433 (0.0240)
GLT 30 7.1670 (2.9270) 7.0615 (2.5983) 0 0.5556 (0.1100) 0.6228 (0.2215) 0.1100* 25 3.4 (1.140) 13 1 0.9167 (0.0349)
GLA 30 7.3330 (4.2270) 7.1470 (3.7213) 0 0.4925 (0.1170) 0.5565 (0.2660) 0.1170** 22 3.4 (0.241) 15 2 0.9524 (0.0291)
AMA 30 6.5000 (3.6740) 6.4505 (3.3049) 0 0.5444 (0.1160) 0.6149 (0.2604) 0.1160** 21 3.2 (0.837) 15 1 0.9667 (0.0236)
LOC 30 6.6670 (3.4450) 6.5968 (3.0930) 0 0.5803 (0.0690) 0.6226 (0.2130) 0.0690 27 3.0 (1.000) 13 0 0.9373 (0.0220)
SHI 30 5.5000 (3.2710) 5.4198 (2.9151) 0 0.4944 (0.0330) 0.5110 (0.2737) 0.0330 29 3.0 (0.707) 13 2 0.9458 (0.0173)
BEE 30 6.6670 (3.7240) 6.6082 (3.3824) 1 0.5500 (0.1040) 0.6128 (0.2978) 0.1040* 29 3.2 (1.304) 14 0 0.9335 (0.0228)
GLE 30 6.5000 (2.8810) 6.3923 (2.5723) 2 0.4571 (0.2140) 0.5794 (0.2517) 0.2140*** 28 2.8 (0.837) 16 2 0.9497 (0.0214)
STO 30 7.3330 (3.5020) 7.1848 (3.1003) 0 0.5222 (0.1450) 0.6095 (0.2079) 0.1450*** 27 2.8 (1.304) 14 1 0.9145 (0.0334)
RHI 30 7.6670 (3.5020) 7.5522 (3.1469) 1 0.5714 (0.1130) 0.6430 (0.2847) 0.1130* 30 3.2 (1.304) 19 2 0.9586 (0.0209)
All
populations 540 11.5000 (7.3420) 5.8400 (3.1362) 9 0.5434 (0.2068) 0.6179 (0.2327) 0.121***
469 4.6 (1.140) 64 27 -
Overall
mean 30 6.5278 (3.3152) 6.4435 (2.9700) 0.5 0.5456 (0.1101) 0.6067 (0.2334) 0.1052
26.05 3.1 (1.077) 14.44 1.5 0.9315 (0.0298)
nN, no. of samples genotyped with nSSR; nA, no. of alleles; nAR rarefied allelic richness for 28 diploid individuals; nAp no. of private alleles; HO, observed
heterozygosity; HE, expected heterozygosity; FIS, inbreeding coefficient; cN, no. of samples genotyped with cSSR; cA, no. of alleles; cHN, no. of haplotypes; cHP,
no. of private haplotypes and cHE, gene diversity corrected for sample size (Nei, 1978). Significant P-values are indicated as *P < 0.05; **P < 0.01; ***P < 0.001.
P-values for FIS are obtained after 1,000 permutations of gene copies within individuals of each stand. Standard errors are reported in brackets.

Chapter 3
112
Figure 3.2 - Genetic diversity parameters for nSSR (above) and cSSR (below). (a) Genetic diversity
for nSSR (nHE); (b) Rarefied allele richness for nSSR (nAR), (c) Gene diversity corrected for sample
size for cSSR (cHE); (d) no. of haplotypes for cSSR (cHN).
3.4.2 Population differentiation and Bayesian clustering
When testing differences among populations, multilocus nFST values ranged from -
0.005 (ROT and GLT) to 0.065 (SHI and MEG), being significant (p<0.05) in most
cases (see supplementary material S3.1). Thus, for instance, of the most
differentiated populations, SHI was significantly different from all populations and
BWR from all but GLA (see supplementary material S3.1 and S3.2). RHI, BEE, CCC,
MEG and ALT significantly differed from all but two or three populations (see
supplementary material S3.1 and S3.2). Jost´s D values were in agreement but

The role and processes shaping contemporary gene flow
113
greater than FST values and ranged between -0.012 (ROT and GLT) to 0.127 (SHI and
MEG). Interestingly, the populations with the greatest asynchrony in pollen release
(Whittet et al. 2017), BEE and ALT, had some of the largest FST values (FST=0.05,
p<0.05) (see supplementary material S3.1). The AMOVA results showed that
although most of the variation was found within populations, among-population
variability is greater within groups than between them for both sets of molecular
markers (Table 3.4).
Table 3.4. Hierarchical analysis of molecular variance (AMOVA) for nuclear (nSSR) and chloroplast
(cSSR) markers at the individual, population and cluster of populations. The degrees of freedom (df),
percentage of variation explained by each level (Variation (%)), and the relevant P-values are
indicated.
Source of variation
nSSR cSSR
d.f. Variation
(%) p-value d.f.
Variation
(%) p-value
Among cluster of
populations 6 0.17 0.25 6 0.25 0.11
Among populations 11 1.79 <0.001 11 1.89 <0.001
Within populations 1062 98.04 <0.001 453 97.86 <0.001
Structure identified K=2, as the more likely number of clusters (red and blue
clusters hereafter), however, these clusters were not related to the East-West
location of the individuals (see supplementary material S3.3). Most sites contained
highly admixed individuals; however, the site SHI had more than 75% of
individuals in the less common blue cluster. In addition, four sites had between 60
and 75% of individuals in the blue cluster STO, COG, BWR, ROT, ALT, followed by

Chapter 3
114
LOC, GLA and GLT with more than 50%. All the other sites had a majority of the
red cluster.
3.4.3 Isolation by distance and asymmetric migration
Although weak, IBD was significant in the Scottish populations (slope = 0.0038, R2 =
0.035, P < 0.05) (Fig. 3.3), indicating that when geographic distance increases,
populations became more differentiated. Expressing geographic and/or genetic
distance on a logarithmic scale did not improve the model fit (data not shown).
Figure 3.3 - Isolation by distance. Black line represent the slope of the correlation of the natural log of
the linear spatial distance (Ln(Spatial Distance (km)) against FST/(1-FST) after 10,000 permutations of
sites among locations.

The role and processes shaping contemporary gene flow
115
The relative migration network (see supplementary material S3.4a) shows all
relative migration rates between site clusters of Scottish populations of Scots pine.
Those rates indicate that gene flow was, in most cases, greater in the West-East
direction than in the East-West direction, although it was not significantly
asymmetric. In Fig. 3.4 and supplementary material S3.4b, directional relative
migration rates below 0.50 were filtered out to emphasize the major gene flow
networks.
Figure 3.4 - Relative migration networks for nSSR with populations sorted in seed groups (see Table
3.2 for population details) using a threshold of 0.5. Arrows in black denote greater gene flow pattern
in the W-E direction, whereas arrows in red denote greater gene flow in the E-W or S-N direction.
Thicker arrows mean stronger gene flow in such direction.

Chapter 3
116
3.5 Discussion
Our study presents a detailed genetic survey of a subset of the remaining natural
populations of Scots pine from Scotland using both bi-parentally inherited nuclear
SSR and paternally inherited chloroplast SSR. Three main results were obtained: i)
high levels of genetic variation and low population differentiation, ii) a weak
pattern of isolation by distance, and iii) an increase of nuclear diversity towards the
East. While we detected some discrepancies (e.g. SHI), our findings suggest that the
effects of gene flow dominate those of genetic drift and prevent differentiation in
the Scottish populations. Our results suggest greater gene flow in the West-East
direction, likely influenced by prevailing wind patterns.
3.5.1 High levels of genetic variation and low population
differentiation
In agreement with other molecular markers (Forrest 1980, Kinloch et al. 1986,
Sinclair et al. 1998, Provan et al. 1998, Wachowiak et al. 2011), our results indicated
relatively high levels of genetic variation across the Scottish native populations of
Scots pine for both nuclear and chloroplast microsatellite markers. This is counter to
expectations given their marginal distribution in global terms and the severe
reduction in the extent of forest, and its fragmentation in recent centuries. Values of
multilocus nuclear SSR diversity (nHE: 0.51-0.66) were comparable to those found in
other Scottish and Eurasian populations (nHE: 0.50-0.69) (Naydenov et al. 2011,

The role and processes shaping contemporary gene flow
117
Bernhardsson et al. 2016, Toth et al. 2017, González-Díaz et al. 2017), although lower
than in some mainland European populations (nHE: 0.74-0.85) (Scalfi et al. 2009,
Nowakowska et al. 2014, García-Gil et al. 2015). In addition, the often high levels of
chloroplast SSR diversity (cHE: 0.83- 0.97) were similar to those reported for other
Scottish, Iberian and Italian populations (cHE: 0.92-0.99) (Provan et al. 1998,
Robledo-Arnuncio et al. 2004a, Scalfi et al. 2009) although somewhat higher than
those reported from Finland (cHE: 0.56) (García-Gil et al. 2015). Some authors have
hypothesised multiple origins for the Scottish Scots pine population (e.g. through
contribution of cryptic glacial refugia) (Forrest 1980, Kinloch et al. 1986, Ennos et al.
1997b, Sinclair et al. 1998, Provan et al. 1998). If true, this might help to explain the
high levels of diversity we observed, reflecting a process of admixture following
secondary contact.
We detected low levels of population differentiation, which represented less than
2% of the genetic variation among populations for both nuclear and chloroplast
markers (Table 3.4). Outcrossing, long-lived trees with wind-mediated gene
dispersal mechanisms usually harbour more diversity within populations than
among them (Hamrick et al. 1992). High gene flow among populations counteracts
differentiation due to drift and maintains levels of diversity (Slatkin 1985). Levels of
differentiation among populations were very similar for both marker types (1.89%
vs. 1.79% for chloroplast and nuclear markers respectively). Although chloroplast
loci are expected to show greater differentiation than nuclear loci due to

Chapter 3
118
uniparental inheritance, smaller effective population size and higher susceptibility
to genetic drift (Lendvay et al. 2014). However, the extensive pollen flow
characteristic of conifers is likely to smooth such differences (Ribeiro et al. 2002).
Despite evidence of extensive gene flow and consequently weak overall genetic
structure, some significant differentiation among populations was apparent. In
particular, the most western population SHI was most differentiated from other
populations (greatest FST). The distinctiveness of this population has been reported
by other authors (Forrest 1980, Kinloch et al. 1986, Sinclair et al. 1998), although the
basis for the difference remains uncertain. Some authors have observed unique, low
frequency organelle haplotypes in western populations (Kinloch et al. 1986),
suggesting contributions from a western refugium and possibly accounting for its
distinctiveness. However, other local factors could explain the difference and
resolution of the question awaits markers with sufficient power to conclusively
characterise the postglacial colonisation patterns within Scotland.
3.5.2 Weak isolation by distance
Our results showed a weak but significant pattern of IBD across Scotland. IBD
occurs as a consequence of limited gene dispersal such that populations close to
each other tend to be more genetically similar than populations farther apart
(Wright 1943). Several factors are likely to limit seed and pollen flow among the
Scottish populations of Scots pine. Firstly, the recently characterised asynchrony in

The role and processes shaping contemporary gene flow
119
pollen phenology between eastern and western populations within Scotland
(Whittet et al. 2017) might limit gene transfer among populations even if pollen
dispersal is physically possible across the distances concerned. Secondly, the drastic
reduction in the effective population sizes and increased population isolation
resulting from widespread deforestation in Scotland (Mason et al. 2004) may simply
have reduced pollen availability to individual populations. Thirdly, the prevailing
wind direction at the time of pollen release in Scotland is from the southwest (Dore
et al. 2006). The resulting directional bias in pollen flow may enforce pollen
limitation in populations to the west. Given the weak magnitude of IBD and since
the described factors might probably contribute simultaneously to the observed
pattern, we cannot unambiguously ascribe IBD patterns to a particular mechanism.
On the other hand, if the weak magnitude of the IBD signal is driven by relatively
recent pollen-release mismatches, then IBD might be expected to be exacerbated in
future generations. Gene flow is nevertheless clearly effective in minimising
isolation, and IBD is limited.
Some of the Scottish populations showed significant levels of inbreeding (FIS= 0.11-
0.21), indicating an excess of homozygotes. Other studies obtaining similar
inbreeding values for Scots pine populations (0.07-0.22 ) (Scalfi et al. 2009, García-
Gil et al. 2015), attributed the homozygote excess to the presence of null alleles
(Scalfi et al. 2009). In our study, only one locus showed evidence of null alleles with
a low frequency, therefore this seems unlikely to explain our FIS estimates.

Chapter 3
120
Homozygote excess can be also the result of assortative mating, selection against
heterozygotes, the Wahlund effect (subpopulation structure) (Wahlund 1928,
García-Gil et al. 2015), or drastic reduction in effective population sizes (Bagnoli &
Buonamici 2009). However, as nearby populations obtained very different levels of
inbreeding (e.g. 0.196 and 0.046 for CRA and CCC respectively), assortative mating
might not be the reason as it is unlikely to occur in adjacent populations because
most trees flower at the same time. Furthermore, it seems unlikely to be selection
against heterozygotes or a Wahlund effect given that nothing in our data or recent
population history point to the existence of unrecognised population substructure.
Therefore, the most likely explanation would be a drastic reduction in effective
population sizes, as has been previously noted (Mason et al. 2004, González-Díaz et
al. 2017)
3.5.3 Geographic diversity gradients and predominant patterns of
gene flow
Our results indicated increased nuclear genetic diversity towards the East. This
West-East (W-E) trend does not fit theoretical expectations based on inferred
patterns of post-glacial colonisation, which for Scots pine, and most other native
species in Britain, has occurred from south to north (Birks, 1989). Such a pattern of
colonization is expected to leave greater levels of genetic diversity in the south than
in the more recently colonised north (Hewitt 1999), and has been found in Fagus

The role and processes shaping contemporary gene flow
121
sylvatica in Britain (Sjolund et al., 2017), and in other tree species in Ireland (Kelleher
et al. 2004) and mainland Europe (King & Ferris 1998; Petit et al., 2002; Cottrell et
al., 2005). Equally, the W-E diversity trend does not follow the “central-marginal”
hypothesis, which predicts reduced neutral genetic diversity and higher
population differentiation towards distribution limits (Eckert et al. 2008). Where
the S-N model predicts greater diversity in southern areas, the central-marginal
model predicts greater diversity in the centre of the distribution, as populations
located further from the centre (even in the south) are less connected. Levels of
diversity from our populations, which represent the north-western distribution
limit of Scots pine, were similar to those in mainland populations (Naydenov et al.
2011, Provan et al. 1998, Robledo-Arnuncio et al. 2004a), and no signatures of
migration were observed (i.e. a S-N or SE-NW trend ). Therefore, it may be that the
observed W-E diversity trend reflects more recent gene flow process. On the W-E
axis, a predominant driver of gene flow in a species with wind-mediated gene
dispersal (seed and pollen) is likely to be wind direction. In Scotland the
predominant wind direction is west-south-westerly (Dore et al. 2006), and this
would seem to be a likely explanation for the observed pattern.
While levels of diversity will be substantially dependent on past population sizes,
asymmetric gene dispersal due to prevailing wind direction can also play an
important role in shaping the current distribution of genetic diversity (Ennos
1997a). Gene flow patterns were not statistically asymmetric given that gene flow in

Chapter 3
122
Scots pine is extensive and can occur over substantial distances (Lindgren et al.
1995, Robledo-Arnuncio et al. 2004b, 2011). As there is no reason to suggest the
existence of geographical or topographical barriers to gene dispersal, gene flow is
likely to link nearby populations in any direction. However a strongly dominant
wind direction (Dore et al. 2006) would likely favour consistent gene flow from
western to eastern populations but not the converse, resulting over time in a
gradient of diversity with lower levels in the populations to which gene flow is
more restricted. This effect would be reinforced by the fact that western populations
are at the very edge of the distribution, with only ocean beyond them, preventing
gene input from upwind. The lack of West-East pattern in allele richness might be
explained by the diverging trend in some populations, such us CRA, BWR, MEG
and ROT, which showed low allele richness but high nuclear diversity. The
explanation for this diverging trend might be due to selection or local bottlenecks
(i.e. due to a substantial reduction in population size), which are characterized by
large losses in allelic richness but only slight decrease of diversity if population size
rebounds rapidly (Comps et al. 2001). Since no West-East pattern was observed in
chloroplast haplotype diversity, seed dispersal may be more important than pollen
in driving any such directionality in gene flow, an implication that tallies with the
likely mobility of the two propagule types.

The role and processes shaping contemporary gene flow
123
3.6 Conclusions
Native pine forest in Scotland suffered a very substantial historic reduction in
abundance. Despite this reduction and the resulting geographical isolation of
populations, high levels of genetic variation and low levels of population
differentiation persist, suggesting that effective population size, together with
extensive gene flow, has been high enough to limit the effects of genetic drift. This
finding highlights the importance of maintaining large effective population sizes,
especially in geographically marginal populations, to increase the probability of
forest persistence (FAO 2014).
Despite potential barriers to gene flow such as population fragmentation (White et
al. 2002, Petit & Hampe 2006, Wang et al. 2012, Davies et al. 2013) or phenological
asynchrony, gene flow among populations can still be sufficient to counteract their
genetic isolation. However a weak signal of isolation by distance was detectable
among the Scottish populations, suggesting that some spatial limitation of gene
dispersal occurs, although gene flow is extensive. The detected gene flow patterns
and geographic distribution of genetic variation were consistent with gene dispersal
limitation due to prevailing wind patterns. From a practical point of view, taking
into account such landscape impacts on genetic diversity is important when
designing afforestation strategies or determining priorities in conservation and
management plans.

Chapter 3
124
Although western populations had relatively lower nuclear diversity, and there was
greater differentiation and directional bias of gene flow towards the East, there was
no evidence to suggest that any of the populations analysed here are genetically at
risk. However, over recent decades, there has been extensive establishment of Scots
pine plantations throughout the country and it would be interesting to understand
the impact such plantations might have on the diversity and structure of
subsequent generations of native Scots pine.
3.7 Acknowledgements
We thank the Scottish Forestry Trust, University of Stirling and Centre for Ecology
and Hydrology for co-funding this research. We are grateful to COST action FP1102
MaP-FGR (http://map-fgr.entecra.it/) for supporting researcher mobility during this
project.
3.8 References
Aitken SN, Yeaman S, Holliday JA, Wang T, Curtis-McLane S (2008). Adaptation,
migration or extirpation: climate change outcomes for tree populations.
Evolutionary Applications 1:95–111.
Alfaro RI, Fady B, Vendramin GG, Dawson IK, Fleming RA, Sáenz-Romero C,
Lindig-Cisneros RA, Murdock T, Vinceti B, Navarro CM, Skrøppa T, Baldinelli
G, El-Kassaby YA, Loo J (2014). The role of forest genetic resources in
responding to biotic and abiotic factors in the context of anthropogenic climate
change. Forest Ecology and Management 333:76–87.

The role and processes shaping contemporary gene flow
125
Aravanopoulos FA, Tollefsrud MM, Kätzel R, Soto A, Graudal L, Nagy L, Koskela J,
Bozzano M, Pilipovic A, Zhelev P, Boži G (2015). Development of genetic
monitoring methods for genetic conservation units of forest trees in Europe.
European Forest Genetic Resources Programme (EUFORGEN), Biodiversity
International, Rome, Italy, pp. 46.
Auckland, LD, Bui T, Zhou Y, Shepard M, Williams CG (2002). Conifer
Microsatellite Handbook. Corporate Press, Raleigh, N.C.
Bagnoli F, Buonamici A (2009). Is Cupressus sempervirens native in Italy? An answer
from genetic and palaeobotanical data. Molecular Ecology 18:2276–2286.
Belletti P, Ferrazzini D, Piotti A, Monteleone I, Ducci F (2012). Genetic variation and
divergence in Scots pine (Pinus sylvestris L.) within its natural range in Italy.
European Journal of Forest Research 131:1127–1138.
Bennett KD (1984). The post-glacial history of Pinus sylvestris in the British Isles.
Quaternaty Science Reviews 3:133–155.
Bernhardsson C, Floran V, Ganea SL, García-Gil MR (2016). Present genetic
structure is congruent with the common origin of distant Scots pine
populations in its Romanian distribution. Forest Ecology and Management
361:131–143.
Birks HJB (1989). Holocene isochrone maps and patterns of tree-spreading in the
British Isles. Journal of Biogeography 16:503–540.
Born C, Le Roux PC, Spohr C, McGeoch MA, Van Vuuren BJ (2012). Plant dispersal
in the sub-Antarctic inferred from anisotropic genetic structure. Molecular
Ecology 21:184–194.
Burczyk J, Difazio SP, Adams WT (2004). Gene flow in forest trees: How far do
genes really travel?. Forest genetics 11:179–192.
Cavers S, Cottrell JE (2014). The basis of resilience in forest tree species and its use
in adaptive forest management in Britain. Forestry 88:13–26.
Chagné D, Chaumeil P, Ramboer A, Collada C, Guevara A, Cervera MT,
Vendramin GG, Garcia V, Frigerio J-M, Echt C, Richardson T, Plomion C

Chapter 3
126
(2004). Cross-species transferability and mapping of genomic and cDNA SSRs
in pines. Theoretical and Applied Genetics 109:1204–1214.
Chapuis MP, Estoup A (2007). Microsatellite null alleles and estimation of
population differentiation. Molecular Biology and Evolution 24:621–631.
Comps B, Gömöry D, Letouzey J, Thiébaut B, Petit RJ (2001). Diverging trends
between heterozygosity and allelic richness during postglacial colonization in
the European Beech. Genetics Society of America 157:389–397.
Cottrell JE, Krystufek V, Tabbener HE, Milner AD, Connolly T, Sing L, Fluch S,
Burg K, Lefèvre F, Achard P, Bordács S, Gebhardt K, Vornam B, Smulders
MJM, A.H. VB, Slucken J Van, Storme V, Boerjan W, Castiglione S, Fossati T,
Alba N, Agúndez D, Maestro C, Notivol E, Bovenschen J, Dam B van (2005).
Postglacial migration of Populus nigra L.: lessons learnt from chloroplast DNA.
Forest Ecology and Management 219:293–312.
Cuartas-Hernández S, Núñez-Farfán J, Smouse PE (2010). Restricted pollen flow of
Dieffenbachia seguine populations in fragmented and continuous tropical forest.
Heredity 105:197–204.
Davies SJ, Cavers S, Finegan B, White A, Breed MF, Lowe AJ (2013). Pollen flow in
fragmented landscapes maintains genetic diversity following stand-replacing
disturbance in a neotropical pioneer tree, Vochysia ferruginea Mart. Heredity
115:125–129.
Deacon NJ, Cavender-Bares J (2015). Limited pollen dispersal contributes to
population genetic structure but not local adaptation in Quercus oleoides forests
of Costa Rica. PLoS One:1–25.
Dore AJ, Vieno M, Fournier N, Weston KJ, Sutton MA (2006). Development of a
new wind-rose for the British Isles using radiosonde data, and application to
an atmospheric transport model. Quarterly Journal of the Royal
Meteorological Society 132:2769–2784.
Earl DA, VonHoldt BM (2011). STRUCTURE HARVESTER: a website and program
for visualizing STRUCTURE output and implementing the Evanno method.

The role and processes shaping contemporary gene flow
127
Conservation Genetics Resources 4:359–361.
Ennos AR (1997a). Wind as an ecological factor. Trends in Ecology and Evolution
12:108–111.
Ennos RA, Sinclair WT, Perks MT (1997b). Genetic insights into the evolution of
Scots pine, Pinus sylvestris L., in Scotland. Botanical Journal of Scotland 49:257–
265.
Ennos RA (1994). Estimating the relative rates of pollen and seed migration among
plant populations. Heredity 72:250–259.
Ennos RA, Dodson RK (1987). Pollen success, functional gender and assortative
mating in an experimental plant population. Heredity 58:119–126.
Evanno G, Regnaut S, Goudet J (2005). Detecting the number of clusters of
individuals using the software STRUCTURE: a simulation study. Molecular
Ecology 14:2611–2620.
Excoffier L, Lischer HEL (2010). Arlequin suite ver 3.5: a new series of programs to
perform population genetics analyses under Linux and Windows. Molecular
Ecology Resources 10:564–567.
Fady B, Aravanopoulos FA, Alizoti P, Mátyás C, von Wühlisch G, Westergren M,
Belletti P, Cvjetkovic B, Ducci F, Huber G, Kelleher CT, Khaldi A, Kharrat
MBD, Kraigher H, Kramer K, Mühlethaler U, Peric S, Perry A, Rousi M, Sbay
H, Stojnic S, Tijardovic M, Tsvetkov I, Varela MC, Vendramin GG, Zlatanov T
(2016a). Evolution-based approach needed for the conservation and
silviculture of peripheral forest tree populations. Forest Ecology and
Management 375:66–75.
Fady B, Cottrell J, Ackzell L, Alía R, Muys B, Prada A, González-Martínez SC
(2016b). Forests and global change: What can genetics contribute to the major
forest management and policy challenges of the twenty-first Century?
Regional Environmental Change 16:927–939.
Falush D, Stephens M, Pritchard JK (2003). Inference of population structure using
multilocus genotype data: linked loci and correlated allele frequencies.

Chapter 3
128
Genetics 164:1567–1587.
FAO (2014). The state of the world’s forest genetic resources. Commission on
genetic resources for food and agriculture, Rome, Italy, pp. 276.
Forrest GI (1980). Genotypic variation among native Scots pine populations in
Scotland based on monoterpene analysis. Forestry 53:101–128.
Forrest GI (1982) Relationship of some european Scots pine populations to native
Scottish woodlands based on monoterpene analysis. Forestry 55:19–37
Froyd CA (2006). Long-term ecology of native pinewood communities in East Glen
Affric, Scotland. Forestry 79:279–291.
García-Gil MR, Floran V, Östlund L, Mullin TJ, Gull BA (2015). Genetic diversity
and inbreeding in natural and managed populations of Scots pine. Tree
Genetics & Genomes 11:28.
Gerlach G, Jueterbock A, Kraemer P, Deppermann J & Harmand P (2010)
Calculations of population differentiation based on GST and D: Forget GST
but not all of statistics. Molecular Ecology 19:3845–3852.
González-Díaz P, Jump AS, Perry A, Wachowiak W, Lapshina E, Cavers S (2017).
Ecology and management history drive spatial genetic structure in Scots pine.
Forest Ecology and Management 400:68–76.
Goudet J (1995). Computer Note. Journal of Heredity 86:485–486.
Graudal L, Aravanopoulos F, Bennadji Z, Changtragoon S, Fady B, Kjær ED, Loo J,
Ramamonjisoa L, Vendramin GG (2014). Global to local genetic diversity
indicators of evolutionary potential in tree species within and outside forests.
Forest Ecology and Management 333:35–51.
Gutierrez M, Sprague GF (1959). Randomness of mating in isolated polycross
planting of maize. Genetics 44:1075–1082.
Hamrick JL, Godt MJW, Sherman-Broyles SL (1992). Factors influencing levels of
genetic diversity in woody plant species. New Forests 6:95–124.
Hardy OJ, Vekemans X (2002). Spagedi: a versatile computer program to analyse
spatial genetic structure at the individual or population levels. Molecular

The role and processes shaping contemporary gene flow
129
Ecology Notes 2:618–620.
Holderegger R, Kamm U, Gugerli F (2006). Adaptive vs. neutral genetic diversity:
implications for landscape genetics. Landscape Ecology 21:797–807.
Hubisz MJ, Falush D, Stephens M, Pritchard JK (2009). Inferring weak population
structure with the assistance of sample group information. Molecular Ecology
Resources 9:1322–1332.
Jost L (2008). GST and its relatives do not measure differentiation. Molecular
Ecology 17:4015–4026.
Keenan K, Mcginnity P, Cross TF, Crozier WW, Prodöhl PA (2013). DiveRsity: An R
package for the estimation and exploration of population genetics parameters
and their associated errors. Methods in Ecology and Evolution 4:782–788.
Kelleher CT, Hodkinson TR, Kelly DL, Douglas GC (2004). Characterisation of
chloroplast DNA haplotypes to reveal the provenance and genetic structure of
oaks in Ireland. Forest Ecology and Management 189:123–131.
King RA, Ferris C (1998). Chloroplast DNA phylogeography of Alnus glutinosa (L.)
Gaertn. Molecular Ecology 7:1151–1161.
Kinloch B, Westfall RD, Forrest GI (1986). Caledonian Scots pine: origins and
genetic structure. New Phytologist. 104:703–729.
Lefèvre F, Koskela J, Hubert J, Kraigher H, Longauer R, Olrik DC, Schüler S,
Bozzano M, Alizoti P, Bakys R, Baldwin C, Ballian D, Black-Samuelsson S,
Bednarova D, Bordács S, Collin E, De Cuyper B, De Vries SMG, Eysteinsson T,
Frýdl J, Haverkamp M, Ivankovic M, Konrad H, Koziol C, Maaten T, Notivol
Paino E, Öztürk H, Pandeva ID, Parnuta G, Pilipovič A, Postolache D, Ryan C,
Steffenrem A, Varela MC, Vessella F, Volosyanchuk RT, Westergren M, Wolter
F, Yrjänä L, Zarina AI (2013). Dynamic conservation of forest genetic resources
in 33 European countries. Conservation Biology 27:373–384.
Lendvay B, Hohn M, Brodbeck S, Mindrescu M, Gugerli F (2014). Genetic structure
in Pinus cembra from the Carpathian mountains inferred from nuclear and
chloroplast microsatellites confirms post-Glacial range contraction and

Chapter 3
130
identifies introduced individuals. Tree Genetics and Genomes 10:1419–1433.
Liewlaksaneeyanawin C, Ritland CE, El-Kassaby YA, Ritland K (2004). Single-copy,
species-transferable microsatellite markers developed from loblolly pine ESTs.
Theoretical and Applied Genetics 109:361–369.
Lindgren D, Paule L, Xihuan S, Yazdani R, Segerström U, Wallin J-E, Lejdebro ML
(1995). Can viable pollen carry Scots pine genes over long distances? Grana
34:64–69.
Mason WL, Hampson A, Edwards C (2004). Managing the pinewoods of Scotland.
Forestry Commission, Edinburgh, UK, pp. 234.
Mátyás C, Ackzell L, Samuel CJA (2004). EUFORGEN Technical Guidelines for
genetic conservation and use for Scots pine (Pinus sylvestris). International
Plant Genetic Resources Institute, Rome, Italy, pp. 6.
El Mousadik A, Petit RJ (1996). High level of genetic differentiation for allelic
richness among populations of the Argan Tree [Arganiaspinosa spinosa (L.)
Skeels] endemic to Morocco. Theoretical and Applied Genetics 92:832–839.
Naydenov KD, Naydenov MK, Tremblay F, Alexandrov A, Aubin-Fournier LD
(2011). Patterns of genetic diversity that result from bottlenecks in Scots Pine
and the implications for local genetic conservation and management practices
in Bulgaria. New Forests 42:179–193.
Nei M. (1987). Molecular evolutionary genetics. USA: Columbia University Press.
Nowakowska JA, Zachara T, Konecka A (2014). Genetic variability of Scots pine
(Pinus sylvestris L.) and Norway spruce (Picea abies L. Karst.) natural
regeneration compared with their maternal stands. Forest Research Papers
75:47–54.
Van Oosterhout C, Hutchinson WF, Wills DPM, Shipley P (2004). Micro-Checker:
software for identifying and correcting genotyping errors in microsatellite
data. Molecular Ecology Notes 4:535–538.
Ouborg NJ, Piquot Y, Van Groenendael JM (1999). Population genetics, molecular
markers and the study of dispersal in plants. Journal of Ecology 87:551–568.

The role and processes shaping contemporary gene flow
131
Petit J, Csaikl UM, Bordács S, Burg K, Coart E, Cottrell J, Dam B van, Deans JD,
Dumolin-Lapègue S, Fineschi S, Finkeldey R, Gillies A, Glaz I, Goicoechea P,
Jensen J, König A, Lowe AJ, SF M, G M, Munro RC, Olalde M, Pemonge M-H,
Popescu F, Slade D, Tabbener H, Taurchini D, Vries S de, Ziegenhagen B,
Kremer A (2002). Chloroplast DNA variation in European white oaks.
Phylogeography and patterns of diversity based on data from over 2600
populations. For Ecol Manage 156:5–26.
Petit RJ, Hampe A (2006). Some evolutionary consequences of being a tree. Annual
Review of Ecology, Evolution, and Systematics 37:187–214.
Pritchard JK, Stephens M, Donnelly P (2000). Inference of population structure
using multilocus genotype data. Genetics 155:945–959.
Provan J, Beatty GE, Hunter AM, McDonald RA., McLaughlin E, Preston SJ, Wilson
S (2007). Restricted gene flow in fragmented populations of a wind-pollinated
tree. Conservation Genetics 9:1521–1532.
Provan J, Soranzo N, Wilson NJ, McNicol JW, Forrest GI, Cottrell JE, Powell W
(1998). Gene-pool variation in caledonian and European Scots pine (Pinus
sylvestris L.) revealed by chloroplast simple-sequence repeats. Proceedings of
the The Royal Society, Biological sciences 265:1697–1705.
Ribeiro MM, Mariette S, Vendramin GG, Szmidt AE, Plomion C, Kremer A (2002).
Comparison of genetic diversity estimates within and among populations of
maritime pine using chloroplast simple-sequence repeat and amplified
fragment length polymorphism data. Molecular Ecology 11:869–877.
Robledo-Arnuncio JJ (2011). Wind pollination over mesoscale distances: an
investigation with Scots pine. The New Phytologist 190:222–233.
Robledo-Arnuncio JJ, Alia R, Gil L (2004a). High levels of genetic diversity in a
long-term European glacial refugium of Pinus sylvestris L. Forest Genetics
11:239–248.
Robledo-Arnuncio JJ, Smouse PE, Gil Al a R (2004b) Pollen movement under
alternative silvicultural practices in native populations of Scots pine (Pinus

Chapter 3
132
sylvestris L.) in central Spain. Forest Ecology and Management 197:245–255.
Rodríguez-Quilón I, Santos-Del-Blanco L, Serra-Varela MJ, Koskela J, González-
Martínez SC, Alía R (2016). Capturing neutral and adaptive genetic diversity
for conservation in a highly structured tree species. Ecological Applications
26:2254–2266.
Rousset F (1997). Genetic differentiation and estimation of gene flow from F-
Statistics under isolation by distance. Genetics Society of America 145:1219–
1228.
Salmela MJ (2011). Adaptive genetic variation in Scots pine (Pinus sylvestris L.) in
Scotland Phd Thesis, The University of Edinburgh, Edinburgh, UK, pp. 159.
Savolainen O, Pyhäjärvi T, Knürr T (2007). Gene flow and local adaptation in trees.
Annual Review of Ecology, Evolution, and Systematics 38:595–619.
Scalfi M, Piotti A, Rossi M, Piovani P (2009). Genetic variability of Italian southern
Scots pine (Pinus sylvestris L.) populations: the rear edge of the range.
European Journal of Forest Research 128:377–386.
Sinclair WT, Morman JD, Ennos RA (1998). Multiple origins for Scots pine (Pinus
sylvestris L.) in Scotland: evidence from mitochondrial DNA variation.
Heredity 80:233–240.
Sjölund MJ, González-Díaz P, Moreno-Villa JJ, Jump AS (2017). Understanding the
legacy of widespread population translocations on the post-glacial genetic
structure of the European beech, Fagus sylvatica L. Journal of Biogeography
44:2475–2487.
Slatkin M (1985). Gene flow in natural populations. Annual Review of Ecology,
Evolution, and Systematics 16:393–430.
Soranzo N, Provan J, Powell W (1998). Characterization of microsatellite loci in
Pinus sylvestris L. Molecular Ecology 7:1260–1261.
Steinke LR, Premoli AC, Souto CP, Hedrén M (2008). Adaptive and neutral
variation of the resprouter Nothofagus antarctica growing in distinct habitats in
north-western Patagonia. Silva Fennica 42:177–188.

The role and processes shaping contemporary gene flow
133
Steven HM, Carlisle A (1959). The native pinewoods of Scotland. GC Book
Publishers, Edinburgh, UK, pp. 368.
Varis S, Pakkanen A, Galofré A, Pulkkinen P (2009). The extent of south-north
pollen transfer in finnish Scots pine. Silva Fennica 43:717–726.
Wachowiak W, Iason GR, Cavers S (2013). Among population differentiation at
nuclear genes in native Scots pine (Pinus sylvestris L.) in Scotland. Flora
208:79–86.
Wachowiak W, Salmela MJ, Ennos RA, Iason G, Cavers S (2011). High genetic
diversity at the extreme range edge: nucleotide variation at nuclear loci in
Scots pine (Pinus sylvestris L.) in Scotland. Heredity 106:775–787.
Wahlund S (1928). The combination of populations and the appearance of
correlation examined from the standpoint of the study of heredity. Hereditas
11:65–106.
Wang R, Compton SG, Shi Y-S, Chen X-Y (2012). Fragmentation reduces regional-
scale spatial genetic structure in a wind-pollinated tree because genetic
barriers are removed. Ecology and Evolution 2:2250–2261.
Wang ZF, Lian JY, Ye WH, Cao HL, Zhang QM, Wang ZM (2016). Pollen and seed
flow under different predominant winds in wind-pollinated and wind-
dispersed species Engelhardia roxburghiana. Tree Genetics and Genomes 12:1–
16.
Weir BS, Cockerham CC (1984). Estimating F-statistics for population structure.
Evolution 38:1358–1370.
White GM, Boshier DH, Powell W (2002). Increased pollen flow counteracts
fragmentation in a tropical dry forest: An example from Swietenia humilis
Zuccarini. Proceedings of the National Academy of Sciences of the United
States of America 99:2038–2042.
Whittet R, Cavers S, Cottrell J, Rosique-Esplugas C, Ennos R (2017). Substantial
variation in the timing of pollen production reduces reproductive synchrony
between distant populations of Pinus sylvestris L. in Scotland. Ecol Evol

Chapter 3
134
7:5754–5765.
Wright S (1943). Isolation by distance. Genetics 28:114–138.
Zinck JWR, Rajora OP (2016). Post-glacial phylogeography and evolution of a
wide-ranging highly-exploited keystone forest tree, eastern white pine (Pinus
strobus) in North America: single refugium, multiple routes. BMC
Evolutionary Biology 16:56.

The role and processes shaping contemporary gene flow
135
3.8 Supplementary material
S3.1 Pairwise population differentiation (FST) (below diagonal) and differentiation index D (above diagonal).
COG GLL CRA CCC MEG BLW ABE ROT ALT GLT GLA AMA LOC SHI BEE GLE STO RHI
COG - 0.096 0.048 0.052 0.076 0.058 0.063 0.019 0.074 0.029 0.021 0.039 -0.008 0.043 0.053 0.040 0.024 0.064
GLL 0.034 - 0.050 0.055 0.028 0.049 0.005 0.057 0.059 0.020 0.040 0.015 0.079 0.085 0.041 0.066 0.063 0.071
CRA 0.019 0.014 - 0.031 0.021 0.058 0.042 0.047 0.092 0.038 0.028 0.020 0.037 0.121 0.025 0.051 0.073 0.087
CCC 0.025 0.013 0.007 - 0.026 0.057 0.068 0.081 0.126 0.085 0.040 0.054 0.066 0.116 0.038 0.093 0.123 0.026
MEG 0.035 0.016 0.006 0.013 - 0.043 0.014 0.045 0.060 0.044 0.025 0.045 0.077 0.127 0.037 0.078 0.074 0.068
BLW 0.023 0.021 0.023 0.018 0.016 - 0.043 0.041 0.031 0.037 0.023 0.048 0.065 0.055 0.084 0.092 0.033 0.116
ABE 0.022 0.005 0.012 0.019 0.002 0.015 - 0.027 0.039 0.000 0.014 -0.003 0.057 0.096 0.029 0.013 0.015 0.019
ROT 0.007 0.021 0.022 0.028 0.019 0.011 0.009 - 0.012 -0.012 0.010 0.015 0.014 0.062 0.085 0.033 0.012 0.052
ALT 0.029 0.026 0.044 0.045 0.029 0.013 0.018 0.006 - 0.018 0.020 0.035 0.074 0.070 0.123 0.090 0.030 0.091
GLT 0.009 0.005 0.014 0.025 0.017 0.012 0.002 -0.005 0.008 - 0.007 0.003 0.021 0.064 0.053 0.010 -0.001 0.034
GLA 0.006 0.010 0.015 0.011 0.017 0.009 0.008 0.007 0.010 0.003 - 0.011 0.040 0.048 0.059 0.021 0.022 0.061
AMA 0.015 0.005 0.012 0.015 0.018 0.013 -0.001 0.005 0.013 0.004 0.002 - 0.023 0.069 0.040 0.016 0.033 0.024
LOC -0.001 0.022 0.010 0.023 0.026 0.024 0.014 0.003 0.032 0.005 0.016 0.007 - 0.064 0.029 0.029 0.026 0.056
SHI 0.023 0.036 0.053 0.046 0.065 0.028 0.046 0.031 0.038 0.032 0.019 0.029 0.035 - 0.132 0.095 0.049 0.135
BEE 0.025 0.014 0.012 0.021 0.020 0.040 0.009 0.033 0.050 0.020 0.026 0.017 0.012 0.067 - 0.042 0.077 0.061
GLE 0.018 0.019 0.017 0.031 0.031 0.041 0.004 0.020 0.046 0.009 0.013 0.006 0.009 0.048 0.010 - 0.021 0.047
STO 0.009 0.022 0.024 0.042 0.026 0.014 0.001 0.004 0.017 0.001 0.011 0.008 0.006 0.027 0.024 0.007 - 0.064
RHI 0.027 0.023 0.029 0.033 0.028 0.041 0.007 0.020 0.036 0.015 0.025 0.008 0.017 0.057 0.013 0.016 0.019 -
Numbers in bold indicate significant P-values P<0.05.
For the Differentiation index D, numbers in bold indicate significant P-values P<0.05 after Bonferroni correction, and number in italics indicate significant P-
values P<0.05 without Bonferroni correction. P-values for the differentiation index D were obtained by bootstrapping 10,000 times.

Chapter 3
136
S3.2 Percentage of differentiated sites within Scotland using nSSR

The role and processes shaping contemporary gene flow
137
S3.3 Number of genetic clusters (K=2) identified by STRUCTURE for nSSR.

Chapter 3
138
S3.4 Relative migration networks for nSSR with populations sorted in seed groups. Seed
group codes correspond to the following group of populations (see Table 2 for population
details): NE= ALT, GLT; SC= CCC, MEG, BWR; EC= ABE, ROT; SW= COG, GLL, CRA; NC=
GLA, AMA; NW= LOC, SHI, BEE; N= GLE, STO, RHI. (a) No using a threshold, (b) using a
threshold of 0.5.

Chapter 4
Ecology and management history drive
spatial genetic structure in Scots pine
Authors: P. González-Díaz, A.S. Jump, A. Perry, W. Wachowiak, E.
Lapshina and S. Cavers
Published as: González-Díaz P, Jump AS, Perry A, Wachowiak W, Lapshina E,
Cavers S (2017) Ecology and management history drive spatial genetic structure in
Scots pine. Forest Ecology and Management 400:68–76. DOI:
10.1016/j.foreco.2017.05.035

140
Photos in Chapter 4 main page taken from; left: http://www.forestry-memories.org.uk and
right: L. Matías.

The role and processes shaping regeneration and establishment at the local scale
141
4.1 Abstract
Forest management practices that remove trees from stands can promote substantial
changes in the distribution of genetic diversity within and among populations at
multiple spatial scales. In small and isolated populations, elevated inbreeding levels
might reduce fitness of subsequent generations and threaten forest resilience in the
long term. Comparing fine-scale spatial genetic structure (SGS) between life stages
(e.g. adult and juvenile cohorts) can identify when populations have undergone
disturbance, even in species with long generation times. Here, we studied the effects
of historical and contemporary forest management, characterized by intense felling
and natural regeneration respectively, on genetic diversity and fine-scale SGS in
adult and juvenile cohorts. We examined fragmented Scots pine (Pinus sylvestris L.)
stands in the Scottish Highlands, and compared them with a remote, unmanaged
stand. A total of 777 trees were genotyped using 12 nuclear microsatellite markers.
No difference was identified in allelic richness or gene diversity among stands or life
stages, suggesting that historical and contemporary management have not impacted
levels of genetic variation. However, management appears to have changed the
spatial distribution of genetic variation. Adult genotypes from managed stands were
more spatially structured than in the unmanaged stand, a difference mediated by
contrasts in tree density, degree of fragmentation of stands at the time of
establishment and rate of gap creation. Surprisingly, juveniles were less spatially
structured than adults in the managed stands, suggesting an historical erosion of the
structure of the adult cohort but contemporary recovery to natural dynamics, and

Chapter 4
142
indicating a high capacity of the species to recover after disturbance. Here we
showed that using the spatial component of genetic diversity can help to detect both
historical and contemporary effects of disturbance in tree populations. Evaluation of
successional change is important to adequately detect early responses of tree
populations to forest management practices. Overall, our study suggests that
combining sustainable management with forest conservation practices that ensure
larger effective population sizes is key to successfully maintaining genetic diversity
in Scots pine.

The role and processes shaping regeneration and establishment at the local scale
143
4.2 Introduction
A prolonged history of forest exploitation based on the harvesting of trees has
resulted in widespread modification of Europe’s forests, impacting genetic diversity
within and among populations (FAO, 2014). Currently, over 70% of European forests
(representing some 15% of European forest area) are subject to a management plan
or its equivalent (Forest Europe, 2015) but, despite a substantial shift toward
sustainable practices over the past 25 years (FAO, 2015), the consequences of
historical management practices such as extensive felling on the distribution of
genetic diversity in tree species remain largely uncertain. Genetic diversity plays an
essential role in underpinning forest resilience by facilitating evolutionary processes,
and it is key in forest responses to disturbances, such as habitat loss, fragmentation
or pathogen attack (Schaberg et al., 2008; Cavers and Cottrell, 2014). Consequently,
understanding how historical and contemporary forest management have shaped
patterns of genetic diversity allows evaluation of the potential resilience of European
forests and informs the development of adaptive management plans.
The impact that tree removal can have on population genetics has been addressed
through exploration of levels of neutral genetic variation, revealing changes in gene
frequencies (Schaberg et al., 2008) and loss of alleles (Adams et al., 1998; Rajora et al.,
2000; Kettle et al., 2007; Ortego et al., 2010), yet many studies have failed to detect
significant effects (Bradshaw, 2004; García-Gil et al., 2015; Rajora and Pluhar, 2003;
Schaberg et al., 2008; Young et al., 1996). Some authors attribute the lack of effect to

Chapter 4
144
the long generation time in trees, because changes in genetic diversity after
disturbance may take many generations (Lowe et al., 2005). However, changes in
tree distribution and age structures can alter the spatial organisation of genetic
variation, even when overall levels of variation are maintained, allowing us to
explore the genetic legacy of forest management (Piotti et al., 2013; Sjölund and
Jump, 2015).
In naturally regenerated tree populations, genotypes are not distributed randomly.
Typically, individuals become less genetically similar as the distance between them
increases (Jump and Peñuelas, 2007; Paffetti et al., 2012; Vekemans and Hardy, 2004),
causing a phenomenon known as spatial genetic structure (SGS). Restricted dispersal
results in offspring being more likely to establish close to the mother tree (Jump et
al., 2012; Pandey et al., 2012). Consequently, the pollen and seed dispersal
mechanism will strongly influence the extent and magnitude of SGS within a
species. For example, plants with animal dispersed pollen usually show greater SGS
than those with wind dispersed pollen (Vekemans and Hardy 2004). Furthermore,
individual density is usually inversely correlated with SGS. For example, the extent
of SGS in low density populations of Acer pseudoplatanus is nine times greater than in
high density populations (Vekemans and Hardy 2004).
The ecological determinants of SGS (such as recruitment frequency, seed and pollen
dispersal distance, and individual density) are commonly modified by forest
management practices that remove trees. Consequent changes in SGS may alter local

The role and processes shaping regeneration and establishment at the local scale
145
mating patterns and the distribution of genetic diversity in subsequent generations
(Smouse and Peakall, 1999). Furthermore, different forest management practices,
such as felling, coppicing or thinning, will differentially impact selection of
individuals and seedling establishment potentially leading to a broad range of
genetic impacts (Cottrell et al., 2003; Paffetti et al., 2012; Piotti et al., 2013; Sjölund
and Jump, 2015). Distinguishing the effects of forest management on SGS is,
therefore, a challenging task.
SGS of plant populations is dynamic and can change across life stages. In individuals
that reproduce sexually, seedlings might be affected by compensatory mortality and
competitive thinning, post dispersal, thereby altering spatial distribution patterns
with age (Ng et al., 2004). Most studies have found greater SGS in early regeneration
stages than in mature individuals (González-Martínez et al., 2002; Hardesty et al.,
2005; Ng et al., 2004; Soto et al., 2007; Troupin et al., 2006). The successional
component of SGS (e.g. comparing SGS between adult and juvenile cohorts) has
mainly been studied in order to understand the natural development of SGS (Berens
et al., 2014; González-Martínez et al., 2002; Jones and Hubbell, 2006). Such changes in
SGS have rarely been used to assess the influence of forest management practices
(but see Jones et al., 2006; Leclerc et al., 2015; Troupin et al., 2006).
This study focuses on the remaining fragmented Scots pine (Pinus sylvestris L.)
forests of the Scottish Highlands (known as Caledonian pine forests), which are
believed to be the only native pine forests in the UK. These fragmented remnants

Chapter 4
146
represent a valuable system in which to study the impacts of historical forest
management practices because numerous records of management history exist. To
understand the effects of historical and contemporary forest management practices,
we investigated genetic diversity and fine-scale SGS in adult and juvenile cohorts in
two native managed pine forests and compared these with a remote, unmanaged
stand. We selected two life stages that were established in distinct periods with
contrasting forest management systems: (1) adult trees that established during 19th
Century, characterised by high browsing pressure by deer and after a period of
intense felling (hereafter historical management); and (2) juveniles that established
during the last two decades, characterised by conservation policies promoting
natural regeneration (hereafter contemporary management). Specifically we sought
to determine: 1) did historical management practice impact genetic diversity and
SGS – comparing mature managed and unmanaged stands? and 2) how has
contemporary management practice affected diversity and SGS – comparing adults
and juveniles from managed stands? We hypothesised that in the absence of effects
of historical management, mature managed stands would display similar values of
genetic diversity and SGS as those in an unmanaged stand, while in the absence of
effects of contemporary management, stronger SGS would be found in the juvenile
stages, and similar values of genetic diversity will be evident in both juvenile and
adult cohorts.

The role and processes shaping regeneration and establishment at the local scale
147
4.3 Material and methods
4.3.1 Study species
Scots pine is a wind-pollinated outcrossing conifer and is the most widely distributed
pine species in the world, with a range that spans Eurasia, from the Arctic circle in
Norway in the north to the south of Spain and south of Turkey and from the west
coast of Scotland to the far east of Russia (Carlisle and Brown, 1968). Populations
from southern Europe, Scotland and Asia Minor generally represent isolated
occurrences. In Scotland this species occurs at the western limit of its global
distribution and constitutes the iconic species of the Caledonian pine forest. Scots
pine is typically a pioneer species (together with birch and aspen) that readily
regenerates after natural or human disturbances, if competition and grazing pressure
are low (Mátyás et al., 2004). It grows well on most soils, nevertheless, due to shade
and competition intolerance, it is often restricted to poor soils (Steven and Carlisle,
1959). It is a monoecious species, and female flowering can start at the age of 15 to 30
years, in open to closed stands respectively (Mátyás et al., 2004). Pollen movement is
predominantly over tens of metres within a stand (Robledo-Arnuncio et al., 2004b),
but it may reach 100 km (Robledo-Arnuncio, 2011). Seeds are primarily wind and
gravity dispersed, and typically travel up to 100 metres (McVean, 1963).

Chapter 4
148
4.3.2 Study sites and history of forest management
From a peak distribution around 6,000 years ago, Scots pine in Scotland has been in
decline for millennia, with a major retreat 4,000 years ago, initially attributed to a
climate shift to wetter conditions (Bennett, 1984), although human and grazing
pressures may have also played a significant role (Tipping et al., 2008). The
exploitation and reduction in Scots pine extent has been particularly intense from the
18th Century onwards (Hobbs, 2009), mainly characterized by felling and selective
logging to provide construction timber (Smout, 2003). The general decrease in forest
extent, together with poor natural regeneration in the Caledonian pine forest (due to
extensive browsing pressure by deer and sheep), kept this forest at low tree density
for many years (McVean, 1963) and has strongly suppressed regeneration during the
last 200 years (Steven and Carlisle, 1959). During the last few decades, however,
forest management has moved to protect and expand the remaining Caledonian pine
forest (Forestry Commission, 2016).
We selected two study sites in Scotland, Abernethy (57°20’N, 3°61’W) and Glen
Affric (57°15’N, 5°00’W). Nowadays, these sites constitute some of the largest ancient
pine forest in Scotland covering areas of 2452 ha and 1532 ha, respectively (Mason et
al., 2004). In each site, an old open native stand was selected, where trees are
expected to have been established through natural regeneration of native
provenance. Hereafter these stands will be referred to as managed stands. The fire
regime in the UK is largely human driven (Davies et al., 2008), but tree mortality

The role and processes shaping regeneration and establishment at the local scale
149
through large fires is uncommon in Scotland. In addition, wind-blow and snow can
cause some casualties through the year, and fungi and insects will be minor effects.
However, intense forest disturbance in recent centuries can be attributed mainly to
forest management practices.
The study site in Abernethy is located at 370 m a.s.l., with south westerly prevailing
winds and densities of 160 stems ha-1. Stand composition is formed by Scots pine,
with presence of Juniperus communis. The understory is predominantly Calluna
vulgaris, Vaccinium myrtillus and small patches of V. vitis-idaea. Historical exploitation
at Abernethy has taken place over millennia and high felling and browsing pressure
during the 18th Century are reflected in the progressive contraction of the extent of
Abernethy forest in historical maps from 1750 until 1830 (Smout et al., 2005,
Summers et al. 2008). By 1858, the forest was represented only by scattered trees in
the study site and followed by enclosure of the forest as deer forest occurred in 1869
(O’Sullivan, 1973). In the 1980s the area was designated a National Natural Reserve.
Seasonal grazing by sheep was stopped in 1990 and deer fences were removed
(Beaumont et al., 1995). Since then, culling of deer has kept the population stable and
compatible with forest regeneration. By 1992 the percentage of seedlings with
evidence of browsing had fallen from 72% to 43% with an increase of 20% in the
number of established seedlings and saplings (Beaumont et al., 1995).
The study site in Glen Affric is located at 260 m a.s.l., south west of Loch Affric,
where the prevailing winds are south westerly, and stand density is 103 stems ha-1.

Chapter 4
150
Stand composition is dominated by Scots pine and the vegetation layer is
predominantly C. vulgaris with small patches of V. vitis-idaea and V. myrtillus.
Evidence from pollen records from west Glen Affric, where our stand is located,
show a sustained low tree cover around these sites for several thousand years as a
result of prolonged human impact, with the recent expansion of the forest when the
present tree cohort developed around 1880 (Shaw, 2006). Historical documents
report felling of trees during the 18th and 19th Centuries (Smout et al., 2005) with the
decline evident in pollen records. Following a period of intensive sheep and deer
grazing in the late 20th Century a major effort was made to protect and restore the
remaining native pine forest (Bain, 2013). Glen Affric was initially declared as a
Caledonian Forest Reserve in 1961 by the Forestry Commission (Bain, 2013) and
later, in 1984, a National Natural Reserve.
To compare our heavily managed stands with an unmanaged case, and since
unmanaged stands do not exist in Scotland, pre-existing samples from a boreal site
in Western Siberia were used (60°54’N, 68°42’E). These samples were taken from
within a continuous population with extensive areas of natural forest, with a stand
density of 470 stems ha-1. These forests have never been altered by humans, but are
subject to regular natural disturbance by fire on roughly 50 year timescales. In these
boreal forests, competition forces Scots pine to forest edges and onto poor quality
sites such as sandy soils or bogs, and it is outcompeted on better soils by Pinus

The role and processes shaping regeneration and establishment at the local scale
151
sibirica, Larix sibirica and Populus tremula. As a result even mature individuals may be
small. Hereafter this stand will be referred to as the unmanaged stand.
In Scots pine, genetic variation is partitioned predominantly within rather than
among populations, and levels of within-population genetic diversity across the
range of Scots pine are similarly high (Wachowiak et al., 2014, 2011). Previous
studies of diversity across the range of this species have shown that genetic
differentiation among even distant populations of Scots pine is low (Naydenov et al.,
2007; Provan et al., 1998; Prus-Glowacki and Stephan, 1994; Wang et al., 1991) but see
(Forrest, 1982; Prus-Glowacki et al., 2012). Some authors attribute this homogeneity
to common ancestry, as well as extensive gene flow (Chybicki et al., 2008) and lack of
major physical barriers (Naydenov et al., 2007). As absolute genetic diversity levels
in the managed and unmanaged stands are of similar magnitude, and the physical
capacity for gene movement should be similar in each, we can assume that the
primary driver of genetic structure will have been the presence or absence of
significant human intervention. Therefore, this comparison can be informative
regarding the processes that are likely responsible for the observed spatial pattern of
genetic diversity at fine scales.
4.3.3 Sample collection, life stages and stand structure
We selected stands of 200 m × 200 m in Abernethy and Glen Affric, respectively.
Sampling strategy was designed to account for short distance classes in order to

Chapter 4
152
detect fine-scale SGS, choosing individuals randomly and assuring sufficient
numbers of pairwise comparisons in each distance class, as recommended by Cavers
et al. (2005). We sampled needles from two life stages, juveniles and adults. Sample
size per stand in each life stage varied from 131 to 181 (Table 1). All individuals were
mapped using a GARMIN 62s handheld GPS and diameter was measured at breast
height (d.b.h.). The d.b.h. was used as a proxy of age, defining juveniles as
individuals with d.b.h. below 10 cm. Existing data from trunk cores from nearby
adult pines in Abernethy (Summers et al., 2008) were used to calibrate the
relationship between d.b.h. and age.
The unmanaged study site was sampled in three sub-stands of 50 x 50 m along a
linear transect of 300 m, which were combined to give a single stand sample for
subsequent analysis. All sampled individuals were mapped, measured for d.b.h. and
tree height classified as short (<2m) or tall (>2m). Juveniles were defined as short
individuals with d.b.h. below 10 cm. Sample size in each life stage varied from 57 to
73 (Table 1). Thirty random trunk sections from adult pines were taken from the
unmanaged site to calibrate the d.b.h.-age relationship. We evaluated the
relationship between d.b.h. and tree age, and whether this relationship varied among
sites using a linear model in R 3.0.1 (R Core Team, 2013). We chose d.b.h. as the
response variable and tree age and site (Abernethy and unmanaged) were the
predictor variables. The interaction between the predictor variables was tested and

The role and processes shaping regeneration and establishment at the local scale
153
compared with a model without interactions by using the Akaike Information
Criterion.
4.3.4 Microsatellite analyses
Total genomic DNA was extracted from 50 mg silica gel dried needles using
QIAGEN DNeasy 96 Plant Kit (QIAGEN Ltd. Crawley, UK) following the
manufacturer’s protocol. All individuals were genotyped at twelve nuclear
microsatellite markers (SSR): psyl2, psyl16, psyl17, psyl36, psyl42, psyl44, psyl57
(Sebastiani et al., 2011), SPAC7.14, SPAC12.5 (Soranzo et al., 1998), PtTX4001,
PtTX4011 (Auckland et al., 2002) and SsrPt_ctg4698 (Chagné et al., 2004), combined
in two multiplexes of six loci each. Multiplex 1 consisted of primers psyl2, psyl17,
psyl42, psyl44, PtTX4001 and PtTX4011 at concentrations of 3 µl, 2 µl, 2 µl, 2 µl, 3 µl
and 2 µl respectively. Multiplex 2 consisted of primers psyl16, psyl36, psyl57,
SPAC7.14, SPAC12.5 and SsrPt_ctg4698 at concentrations of 2 µl each. Reactions
were carried out in a final volume of 10 µl with 1X of QIAGEN Type-it Multiplex
PCR Master Mix, 1 µM of each multiplex and 25 ng of template DNA. Annealing
temperature for both multiplexes was 56°C. Polymerase chain reactions (PCR) were
performed in Veriti™ Thermal cycler (Applied Biosystems, Bleiswijk, Netherlands),
with the following programme: 1 cycle at 95°C for 4 min followed by 35 cycles at
95°C for 45 s, 56°C for 45 s, 72°C for 45 s, and a final step at 72°C for 5 min. PCR
products were analysed by DNA Sequencing and Services, Dundee, UK, using an

Chapter 4
154
Applied Biosystems 3730 DNA Sequencer with reference to a LIZ 500 size standard.
Fragment analysis results were scored using GENEMARKER V.2.6.0. (SoftGenetics,
State College, PA, USA). FLEXIBIN (Amos et al., 2007) was used to check discrete
classes of raw allele sizes and MICRO-CHECKER (Van Oosterhout et al., 2004) to
check genotyping errors and null allele frequencies. Several markers showed
evidence of null alleles at very low frequencies (maximum frequency of 0.04, data
not shown), which is far below to the threshold at which null alleles can result in a
significant underestimate of expected heterozygosity, estimated as 0.2 (Belletti et al.,
2012; Chapuis and Estoup, 2007). Therefore, all markers were kept for further
analysis.
4.3.5 Genetic diversity and spatial genetic structure analysis
Genetic diversity estimators within stands and life stages were estimated using
FSTAT 2.9.3.2 (Goudet, 1995): mean number of alleles per locus (A), rarefied allelic
richness (AR) (rarefied to 57 individuals for each stand and life stage), expected
heterozygosity (HE) and inbreeding coefficient (FIS). We conducted ANOVAs to test
for differences in A, AR, and HE between stands and life stages in R 3.0.1 (R Core
Team 2013). We calculated FST among stands and life stages in ARLEQUIN v3.5
(Excoffier and Lischer, 2010), and the differentiation index D (Jost, 2008)
implemented in the R package DEMEtics (Gerlach et al., 2010). In both cases,
significance values were determined for a 5% nominal level after Bonferonni

The role and processes shaping regeneration and establishment at the local scale
155
correction. FST estimates differences in allele frequencies among stands, whereas
differentiation index D measures the fraction of allelic variation among them.
We implemented fine scale SGS analyses in SPAGeDi 1.4b (Hardy and Vekemans,
2002). In order to test for significance in genetic relatedness, the Kinship coefficient of
Loiselle et al. (1995) (Fij) was estimated as Fij=(Qij-Qm)/(1-Qm), where Qij is the
probability of identity in state for random gene copies from two individuals i and j,
and Qm is the average probability of identity by state for gene copies coming from
random individuals from the sample. A regression between the Kinship coefficient Fij
and the logarithm of pairwise geographic distances of individuals was computed
(bF). Standard errors of the regression slope were computed using a jackknife
procedure over loci. The significance of the slope of the regression was tested using
10,000 permutations of locations among individuals. To visualize the SGS, we plotted
average pairwise estimates of genetic relatedness as a function of distance to generate
spatial autocorrelograms. Analyses were conducted for each stand and life stage
separately across the full distance range. SGSMAX was also calculated for each stand
and life stage, which is the greatest distance at which the Kinship coefficient of a
given distance class F(d) is significant at p<0.05 (Jump et al., 2012). We also calculated
the Sp statistic, as suggested by Vekemans and Hardy (2004), to allow comparability
among stands and life stages with other studies. The Sp statistic was determined as -
bF/ (1 - F1), where bF is the regression slope of kinship coefficient estimate (F) on

Chapter 4
156
distance classes and F1 is the kinship coefficient for adjacent individuals in the first
distance interval.
Because the number of pairs within each distance class should ideally exceed 50 pairs
of individuals, we set the distance intervals of at least 10 metres (Cavers et al., 2005;
Jump and Peñuelas, 2007). Overall, we established 10 distance classes for the
managed stands (0-10, 10-20, 20-30, 30-40, 40-50, 50-60, 60-70, 70-80, 80-90, 90-100),
and 8 distances classes in the unmanaged stand (0-10, 10-20, 20-30, 30-60, 60-70, 70-
80, 80-90, 90-100). Distance classes between 30 and 60 metres were combined in the
unmanaged stand to ensure sufficient numbers of pairs in the class. We also tested
other distance class options and longer final distances up to 200 metres, and found
they revealed similar and no more informative results. In addition, in the
unmanaged stand, analysis of each sub-stand was also conducted separately, and the
same results were obtained.
4.4 Results
4.4.1 Stand structure
Tree diameter distribution for managed stands was bimodal, with the highest
frequencies for juvenile individuals at diameters between 0 and 10 cm (Fig. 4.1). A
gap of adult individuals with diameter classes between 10 to 30 cm and 10 to 25 cm
occurred in Abernethy and Glen Affric, respectively (Fig. 4.1). Contrastingly, tree
diameter distribution in unmanaged stand was more skewed towards smaller

The role and processes shaping regeneration and establishment at the local scale
157
diameters. There was no gap in the distribution in this case, instead there was a
gradual decrease in the numbers of individuals with increasing diameter class (Fig.
4.1).
Figure 4.1 Tree diameter (d.b.h.) distribution in the three study sites: Abernethy (ABE), Glen Affric
(GLA) and the unmanaged site (UNM). Juvenile stem diameter was measured at 10 cm height. Data
are presented in intervals of 5 cm.
We found that d.b.h. was dependent on age and site (F=29.85, R2=0.31), showing
strong differences among age (t=3.81, p<0.001), and among sites (t=-6.03, p<0.001).
However, we did not find significant interactions between age and study site (Fig.
4.2). The relationship between d.b.h. and age suggested that differences in age
profiles in the two sites were smaller than differences in tree size (e.g. trees with
different d.b.h. could have a similar age).

Chapter 4
158
Figure 4.2 Relationship between d.b.h. and age for the managed site of Abernethy (ABE) and the
unmanaged site (UNM). Lines of best fit are represented by solid lines and 95% CI by dashed lines.
Dots represent observed values.
4.4.2 Genetic diversity
Genetic diversity parameters did not significantly differ between managed and
unmanaged stands (Table 4.1). Among the twelve nuclear loci analysed, the number
of alleles (A) in the managed stands ranged from 3 to 31 and 4 to 29 per locus for
Abernethy and Glen Affric respectively for both life stages combined (multilocus
average of 9.92 for each site). A ranged from 3 to 31 in the unmanaged stand, with a
multilocus average of 9.83 again for both life stages combined. For rarefied allele
richness (AR) in the managed stands, multilocus estimates obtained mean values of

The role and processes shaping regeneration and establishment at the local scale
159
8.99 and 8.83 for Abernethy and Glen Affric respectively and 8.95 for the unmanaged
stand both life stages combined, based on a minimum number of 126 individuals.
Expected heterozygosity levels (HE) showed multilocus estimates of 0.58 in
Abernethy and 0.56 in Glen Affric, and similar values of 0.58 for the unmanaged
stand for both life stages combined (See supplementary material S4.1 for genetic
diversity estimators on each site and life stage and for detailed information of each
microsatellite). Neither A, AR or HE significantly differed between managed vs.
unmanaged stands (all p-values > 0.05). However, some differences appeared in the
inbreeding coefficient (FIS) which was significant and higher for both managed
stands, indicating significant departure from Hardy–Weinberg equilibrium, whereas
it was not significant for the unmanaged stand (Table 4.1). FST values indicated low
but significant differences among the two managed stands (FST=0.004, p<0.001), and
higher differences when comparing them with the unmanaged stand (FST=0.03 and
FST=0.04, p<0.001, for Abernethy vs. unmanaged and Glen Affric vs. unmanaged
respectively), indicating that despite remarkably similar overall levels of genetic
diversity, their genetic composition differs to some extent.
When comparing life stages within stands, neither A, AR or HE significantly differed
(all p-values > 0.05). FST values indicated no significant differences among life stages
in Abernethy and the unmanaged stand, however low but significant FST occurred
among life stages in Glen Affric. In agreement, differentiation index D showed the

Chapter 4
160
same pattern, although values were consistently larger (See supplementary material,
S4.2).
Table 4.1: Summary of multilocus genetic diversity and SGS estimators for each study site and life
stage.
Study site Life stage
Genetic diversity estimators
Spatial genetic structure estimators
N A AR HE FIS
F(1) SGSMAX
(m) bF ± SE Sp ± SE
Abernethy
Adult 181
9.50 7.11 0.587 0.052***
0.0291*** 20 -0.0044 ± 0.0006*** 0.0045 ± 0.0028
Juvenile 170
9.25 6.72 0.583 0.080***
0.0183*** 18 -0.0028 ± 0.0009** 0.0029 ± 0.0023
Glen Affric
Adult 165
8.92 6.79 0.568 0.063***
0.0298*** 40 -0.0097 ± 0.0023*** 0.0098 ± 0.0010
Juvenile 131
9.25 6.74 0.561 0.049**
0.0156*** 20 -0.0118 ± 0.0027*** 0.0119 ± 0.0006
Unmanaged
Adult 57
7.58 6.51 0.576 0.012
-0.0033 0 0.0006 ± 0.0005 -0.0006 ± 0.0005
Juvenile 73 8.17 6.94 0.582 0.021 0.0067 5 -0.0017 ± 0.0010* 0.0018 ± 0.0011
N, sample size; A, mean number of alleles per locus; AR, rarefied allelic richness; HE, expected
heterozygosity; FIS, inbreeding coefficient. F(1), Kinship coefficient for first distance class (0-10m);
SGSMAX, greatest distance at which the Kinship coefficient of a given distance class F(d) is significant at
p<0.05; bF ± SE, regression slope of the Kinship coefficient Fij computed among all individuals against
geographical distances ± standard error; Sp ± SE, Sp statistic ± standard error. Significant P-values are
indicated as *P < 0.05; **P < 0.01; ***P < 0.001. P-values for FIS are obtained after 10,000 permutations of
gene copies within individuals of each stand.
4.4.3 Spatial genetic structure
We found significant SGS in all managed stands for both life stages which extended
up to 40 metres further than the unmanaged stand (Table 4.1 and Fig. 4.3). The
kinship coefficient for the first distance class F(1) and the Sp statistic also reflected the
relationship between the extent of SGS and historical management, which was larger
for managed than for unmanaged stands (Table 4.1).

The role and processes shaping regeneration and establishment at the local scale
161
When comparing SGS among life stages within stands, both SGSMAX and F(1) were
larger for adult than for juvenile stages in the managed stands (e.g. SGSMAX extended
up to 20 metres further in adults than juveniles) (Table 4.1 and Fig. 4.3). In contrast,
SGS was larger for juveniles than for adults for the unmanaged stand, with
significant SGS only at distances of less than 10 metres in the juvenile stage (Table 4.1
and Fig. 4.3). In the managed site of Glen Affric, we found that at 50-80 m trees were
less genetically similar than expected compared with a random distribution of
genotypes (see significant negative values of Kinship coefficient at distances between
50 and 80 metres in Glen Affric in Fig. 4.2). The minimum number of pairwise
comparisons per distance class in the managed stands for each life stage was 106
individuals, whereas it was 63 individuals in the unmanaged stand. The Sp values
did not reflect the same relationship between the extent of SGS with contemporary
management as SGSMAX and F(1) did. Thus, of the managed stands, Sp value was not
significantly different between adults and juveniles in Abernethy, whereas it
increased from adults to juveniles in Glen Affric (Table 4.1).

Chapter 4
162
Fig. 4.3: Spatial autocorrelograms for each study site: Abernethy (ABE), Glen Affric (GLA) and the
unmanaged site (UNM); and life stage (adult and juvenile) based on the kinship coefficient Fij,
estimated from 12 microsatellite loci, and consecutive 10 m distance classes (note that for the
unmanaged stand distance classes were combined between 30 to 60 metres). Shaded areas represent
95% confident intervals obtained from 10,000 permutations of genotypes among locations. Black bars
around mean Fij values represent standard errors derived through jackknifing over loci.
4.5 Discussion
We found two main results: 1) although overall levels of genetic diversity were
strikingly similar, more extensive spatial structuring of genetic diversity was found
in the mature managed stands when compared with the unmanaged one; 2) in
contrast to expectations, a reduced extent of spatial genetic structure was found in
the early stages of regeneration of the managed stands compared with the adult

The role and processes shaping regeneration and establishment at the local scale
163
cohorts, again despite no difference in overall levels of genetic diversity between life
stages. These patterns suggest that both historical and contemporary management
can significantly alter spatial genetic structure of Scots pine. Here, we combine
ecological information with historical data on the stands to better understand the
mechanisms that are likely responsible for these differences in spatial genetic
structure.
4.5.1 Impact of historical forest management practices
Notable differences in size profiles appeared between managed and unmanaged
stands, (e.g. mean d.b.h. generally bigger in managed stands (Fig. 4.1)). However, the
d.b.h.-age relationship was different among managed and unmanaged stands (Fig.
4.2), linked to the growth-retarding effect of the bog habitat of the latter. Hence, the
contrast in age profiles –a more important comparison for SGS analysis– was much
smaller than for size profiles (e.g. small trees from the unmanaged stand often had
similar ages to much larger trees from the managed one). The age profile of the
stands was strongly reflective of their distinct histories, with large, old trees present
in the managed sites plus a pulse of recent regeneration, whilst a much wider range
of ages was present in the unmanaged one, with fewer very old trees. The structure
in the unmanaged site is likely to reflect the natural fire disturbance dynamics to
which it is exposed. These dynamics are likely in turn to affect genetic structure, with
a higher turnover in the unmanaged stand –shown by the diverse, but generally

Chapter 4
164
young age profile– indicating a higher potential for gene dispersal and therefore
erosion of spatial structure.
Genetic diversity of both mature managed sites, as indicated by allelic richness and
expected heterozygosity, did not differ significantly from the unmanaged stand but
instead was remarkably similar (e.g. HE: 0.57-0.59 vs. HE: 0.58, respectively). Although
average diversity levels were lower than those reported in mainland European
populations of Scots pine using nuclear SSR (HE: 0.62-0.85) (Scalfi et al. 2009;
Naydenov et al. 2011; Nowakowska et al. 2014; García-Gil et al. 2015) differences
might be explained by the number of markers used and their specific levels of
polymorphism. Thus, for example, selecting two of the three markers used by Scalfi
et al. (2009), SPAC 7.41 and SPAC 12.5, the mean value of genetic diversity in our
study (0.9) would be higher than previously reported. Also, the markers with the
lowest values of diversity in our study, psy144 and psy12, had very similar low
values in mainland European populations (Sebastiani et al., 2011) (see supplementary
material S4.1). Previous studies in Scottish populations of Scots pine have also
reported relatively high levels of genetic variation using other molecular markers
(Forrest, 1982, 1980; Kinloch et al., 1986; Provan et al., 1998; Sinclair et al., 1998;
Wachowiak et al., 2013, 2011).
High levels of genetic variation at the population level suggests that effective
population size has been sufficiently high to restrict effects of genetic drift despite

The role and processes shaping regeneration and establishment at the local scale
165
intensive management and geographical isolation of populations. Scots pine is a
wind-pollinated tree with wind-dispersed seed, and achieves high levels of gene
flow by: (1) long seed wings, up to four times as long as the seed (Steven and
Carlisle, 1959), (2) low seed mass (Castro, 1999) (here 2.9 to 12.64 mg), on average
smaller than other pine species (9.1 to 233 mg) (Vander Wall, 2003), and (3) extensive
pollen flow, from 17-22 m (Robledo-Arnuncio et al., 2004b) and up to 100 km in small
fragments (Robledo-Arnuncio, 2011) (similar to other wind-pollinated tree species).
Therefore, it appears that gene flow has been sufficient to prevent erosion of genetic
diversity. FIS values, an indirect measure of inbreeding, were not high in the
managed sites although they were significantly higher than in the unmanaged site
(0.05-0.06 vs. 0.01 respectively), suggesting that although gene flow has prevented
loss of genetic diversity at the population level, fine scale alterations to gene flow
might have taken place. Drastic reduction of population sizes can induce higher rates
of selfing and mating between relatives (Robledo-Arnuncio et al., 2004a). The small
size of the population at the time of establishment of the current adult cohorts, as
indicated by historical data (Shaw, 2006; Summers et al., 2008), might explain this
pattern.
Consistent differences in SGS were found in the mature managed stands which
showed greater extent and magnitude of structure, as indicated by SGSMAX up to 40
metres and higher F(1), compared with the unmanaged one. The extent of SGS of the
mature managed stands was also larger than the values reported for Scots pine

Chapter 4
166
(Chybicki et al., 2008) and other Pinus species, which typically had values below 15
metres (De-Lucas et al., 2009; González-Martínez et al., 2002; Jones et al., 2006;
Marquardt and Epperson, 2004; Parker et al., 2001; Troupin et al., 2006; Williams et
al., 2007). It should be noted, however, that SGS estimates in Parker et al. 2001 and
Jones et al. 2006 were based on allozyme markers, and the need for caution when
comparing SGS extent with different molecular markers has been previously
highlighted (Jump and Peñuelas, 2007).
Values of SGS extent more comparable to those in our managed stands were
observed in fragmented populations of Pinus pinaster (~ 20 metres) (De-Lucas et al.,
2009). The high values of SGSMAX in the managed stands are likely a consequence of
the drastic reductions in the number of seed and pollen donors, which are two of the
main drivers of SGS (e.g. due to felling practices). The larger extent of SGS observed
in Glen Affric may arise from local differences in historical management, with a
prolonged limited tree cover due to human activities (Shaw, 2006), which is also
reflected in the lower density of the site. The very short spatial scale of genetic
structure in the mature unmanaged stand was remarkably similar to that in
undisturbed continuous populations of P. pinaster which displayed either weak or no
relatedness, with maximum values of SGSMAX of 10 metres (De-Lucas et al. 2009). As
these populations have contrasting local contexts, the unmanaged stand being part of
the extensive core Eurasian population whereas the undisturbed population of P.
pinaster being a distributional edge population, the similarity in SGS values observed

The role and processes shaping regeneration and establishment at the local scale
167
seems likely to be due to their common unmanaged state. Therefore, it seems clear
that tree density, degree of fragmentation of stands at the time of establishment and
rate of gap creation play a major role in the formation of SGS in populations. Sp
values for the mature managed stands (0.0045 and 0.0098) were remarkably higher
than for the non-managed stand (-0.0006). Similarly, De-Lucas et al. (2009) found
differences in the Sp values between fragmented and continuous populations of P.
pinaster, although they were generally higher than the values reported in this study.
4.5.2 Impact of contemporary forest management practices
In the managed stands, there were no differences among life stages in the levels of
allelic richness or gene diversity, suggesting contemporary management has not
impacted genetic variation. However, we found higher relatedness – as higher SGS
intensity and extent – in adults than in juveniles, with a greater discrepancy in the
Glen Affric site. In contrast, the unmanaged site had stronger relatedness in the
juvenile stage than in adults, as is usually found in natural tree populations. Natural
populations often show greater SGS in the early stages of regeneration, due to the
higher spatial aggregation of trees (Rozas et al., 2009; Szwagrzyk and Czerwczak,
1993). This pattern has been reported in other species of Pinus (González-Martínez et
al., 2002), in Quercus (Hampe et al., 2010), tropical trees (Hardesty et al., 2005; Ng et
al., 2004) and other plant species (Yamagishi et al., 2007). Nevertheless, a few studies
have found greater SGS in adult life stages, such as in Jacaranda copaia (Jones and

Chapter 4
168
Hubbell, 2006), where it was attributed to very low recruitment and high mortality
rates, or in the tropical tree Dicorynia guianensis, linked to overlapping of generations
in the adult cohort (Latouche-Hallé et al. 2003). A subsequent study of the latter
species found stronger SGS in saplings (Leclerc et al., 2015), suggesting that earlier
observations were probably specific to the particular study cohort. Stronger SGS in
adults than in late juveniles was also found for Prunus africana and it was attributed
to a reduction in gene flow due to past logging (Berens et al., 2014). In our study, the
most probable explanation seems to be the influence of changes in contemporary
management. In the managed populations of Scots pine investigated here, high
felling pressure at the time of establishment of the adult cohort, together with high
browsing pressure, has suppressed regeneration for decades, which is also reflected
in the absence of individuals estimated between 25 and 100 years old (Fig. 2). In the
last 25 years, there has been a deliberate policy to encourage regeneration in the pine
forest (Mason et al., 2004), with a consequent increase in forest density. This
increment in forest density appears to have maintained diversity levels, increased
gene flow and produced a more randomized distribution of genotypes in the new
generation.
The observed reduction in juvenile SGS shows an erosion of the structure present in
the adult cohort and contemporary recovery to natural dynamics, reflecting the high
capacity of the species to recover after disturbance. Overall, Sp was higher in Glen
Affric than in Abernethy, as for SGS. Although the spatial extent of SGS was higher

The role and processes shaping regeneration and establishment at the local scale
169
in adults at Glen Affric, Sp was slightly higher in the juvenile stage. This means more
distant pairs of juveniles were less related than they would be by chance (juveniles
showed a lack of relatedness among individuals at 50-80 m separation). The
biological cause of this trend is not clear but, together with FST values that showed a
small but significant difference among juveniles and adults, it may indicate
introgression from populations not present in our sample.
4.5.3 Conclusions
In this study we investigated how historical and contemporary forest management
have shaped patterns of genetic diversity and spatial distribution of genotypes of
Scots pine. We provide evidence to show that although overall levels of genetic
diversity in historically managed populations can be similar to unmanaged
populations and as high as continental populations, spatial genetic structure can be
considerably altered. Our results suggest that intense management practices that
remove trees from the stand, such as felling, could alter fine-scale patterns of gene
flow and increase genetic relatedness of individuals at fine scales with implications
for inbreeding levels and, potentially, long-term adaptability. As a consequence, the
extent of family clusters can be modified, as for instance in our study which
increased up to 40 metres in managed sites. From a practical point of view, to ensure
a broad sample of genetic variability, guidelines for seed collection should aim for
minimum sampling distances between mother trees of at least 40m.

Chapter 4
170
The reduction of SGS observed in juveniles following contemporary management to
promote regeneration, indicates a high capacity of the species to recover after intense
forest management. Here, we suggest that combining sustainable management with
forest conservation practices that ensure larger effective population sizes is key to
successfully maintaining genetic diversity in Scots pine. This capacity of the early
stages of regeneration to capture gene flow might have implications for forest
resilience and will be particularly important in the context of climate change (Alfaro
et al., 2014; Fady et al., 2015; Hoffmann and Sgrò, 2011; Millar et al., 2007) under
which selection pressures are expected to change.
Here we showed how investigating the spatial component of genetic diversity
alongside tree demographic structure can help to detect both historical and
contemporary effects of disturbances in tree populations. The effects of forest
management were not reflected in overall levels of genetic diversity, but they were
manifested in SGS, as has been seen in previous studies (Paffetti et al. 2012; Leclerc et
al. 2015; Sjölund and Jump 2015). Therefore, incorporating a spatial component
when evaluating the effects of forest management practices is highly recommended.
The evaluation of successional change is also essential to properly assess genetic
dynamics within populations and to adequately detect early responses to forest
management practices.

The role and processes shaping regeneration and establishment at the local scale
171
4.6 Acknowledgments
We would like to thank D. García-Martínez and E. Tordoni for help in fieldwork; R.
Summers for help with selection of sampling site and for providing ring data from
Abernethy; J. Sjölund and P. Ruiz-Benito for support with data analysis. This project
was funded by Scottish Forestry Trust, the University of Stirling and the Centre for
Ecology and Hydrology. Sampling and collection in Siberia was supported by
INTERACT (grant agreement No262693) under the European Union's Seventh
Framework Programme.
4.7 References
Adams, W.T., Zuo, J., Shimizu, J.Y., Tappeiner, J.C., 1998. Impact of alternative
regeneration methods on genetic diversity in coastal Douglas-fir. For. Sci. 44,
390–396.
Alfaro, R.I., Fady, B., Vendramin, G.G., Dawson, I.K., Fleming, R.A., Sáenz-Romero,
C., Lindig-Cisneros, R.A., Murdock, T., Vinceti, B., Navarro, C.M., Skrøppa, T.,
Baldinelli, G., El-Kassaby, Y.A., Loo, J., 2014. The role of forest genetic resources
in responding to biotic and abiotic factors in the context of anthropogenic
climate change. For. Ecol. Manage. 333, 76–87.
Amos, W., Hoffman, J.I., Frodsham, A., Zhang, L., Best, S., Hill, A.V.S., 2007.
Automated binning of microsatellite alleles: Problems and solutions. Mol. Ecol.
Notes 7, 10–14.
Auckland L.D., Bui T., Zhou Y., Shepard M., Williams C.G., 2002. Conifer
microsatellite handbook. Corporate Press, Raleigh, N.C.
Bain C., 2013. The Ancient pinewoods of Scotland. A traveller’s guide. Sandstone
press Ltd., Scotland.

Chapter 4
172
Beaumont, D., Dugan, D., Evans, G., Taylor, S., 1995. Deer management and tree
regeneration in the RSPB reserve at Abernethy forest. Scott. For. 49, 155-161.
Belletti, P., Ferrazzini, D., Piotti, A., Monteleone, I., Ducci, F., 2012. Genetic variation
and divergence in Scots pine (Pinus sylvestris L.) within its natural range in Italy.
Eur. J. For. Res. 131, 1127–1138.
Bennett, K.D., 1984. The post-glacial history of Pinus sylvestris in the British Isles.
Quaternaty Sci. Rev. 3, 133–155.
Berens, D.G., Braun, C., González-Martínez, S.C., Griebeler, E.M., Nathan, R.,
Böhning-Gaese, K., 2014. Fine-scale spatial genetic dynamics over the life cycle
of the tropical tree Prunus africana. Heredity (Edinb). 113, 401–407.
Bradshaw, R.H., 2004. Past anthropogenic influence on European forests and some
possible genetic consequences. For. Ecol. Manage. 197, 203–212.
Carlisle, A., Brown, A.H.F., 1968. Pinus sylvestris L. J. Ecol. 56, 269–307.
Castro, J., 1999. Seed mass versus seedling performance in Scots pine: a maternally
dependent trait. New Phytol. 144, 153–161.
Cavers, S., Cottrell, J.E., 2014. The basis of resilience in forest tree species and its use
in adaptive forest management in Britain. Forestry 88, 13–26.
Cavers, S., Degen, B., Caron, H., Lemes, M.R., Margis, R., Salgueiro, F., Lowe, A.J.,
2005. Optimal sampling strategy for estimation of spatial genetic structure in
tree populations. Heredity (Edinb). 95, 281–289.
Chagné, D., Chaumeil, P., Ramboer, A., Collada, C., Guevara, A., Cervera, M.T.,
Vendramin, G.G., Garcia, V., Frigerio, J.M., Echt, C., Richardson, T., Plomion, C.,
2004. Cross-species transferability and mapping of genomic and cDNA SSRs in
pines. Theor. Appl. Genet. 109, 1204–1214.
Chapuis, M.P., Estoup, A., 2007. Microsatellite null alleles and estimation of
population differentiation. Mol. Biol. Evol. 24, 621–631.
Chybicki, I.J., Dzialuk, A., Trojankiewicz, M., Slawski, M., Burczyk, J., 2008. Spatial
genetic structure within two contrasting stands of Scots pine (Pinus sylvestris L.).
Silvae Genet. 57, 193–200.

The role and processes shaping regeneration and establishment at the local scale
173
Cottrell, J.E., Munro, R.C., Tabbener, H.E., Milner, A.D., 2003. Comparison of fine-
scale genetic structure using nuclear microsatellites within two British
oakwoods differing in population history. For. Ecol. Manage. 176, 287–303.
Davies, G.M., Gray, A., Hamilton, A., Legg, C.J., 2008. The future of fire management
in the British uplands. Int. J. Biodivers. Sci. Manag. 4, 127–147.
De-Lucas, A.I., González-Martínez, S.C., Vendramin, G.G., Hidalgo, E., Heuertz, M.,
2009. Spatial genetic structure in continuous and fragmented populations of
Pinus pinaster Aiton. Mol. Ecol. 18, 4564–4576.
DeSalle, R., Amato, G., 2004. The expansion of conservation genetics. Nat. Rev.
Genet. 5, 702–712.
Excoffier, L., Lischer, H.E.L., 2010. Arlequin suite ver 3.5: a new series of programs to
perform population genetics analyses under Linux and Windows. Mol. Ecol.
Resour. 10, 564–567.
Fady, B., Cottrell, J., Ackzell, L., Alía, R., Muys, B., Prada, A., González-Martínez,
S.C., 2016. Forests and global change: what can genetics contribute to the major
forest management and policy challenges of the twenty-first century? Reg.
Environ. Chang. 16, 927-939.
FAO, 2015. Global forest resources assessment 2015: How are the world’s forest
changing? Food and agriculture organization of the united nations, Rome, Italy.
FAO, 2014. The state of the world’s forest genetic resources. Commission on genetic
resources for food and agriculture, Rome, Italy.
Forest Europe, 2015. State of Europe’s forest 2015.
Forestry Commission, 2016. The UK forestry standard. The governments’ approach
to sustainable forestry. Forestry Commission, Edinburgh.
Forrest, G.I., 1982. Relationship of some european Scots pine populations to native
Scottish woodlands based on monoterpene analysis. Forestry 55, 19–37.
Forrest, G.I., 1980. Genotypic variation among native Scots pine populations in
Scotland based on monoterpene analysis. Forestry 53, 101–128.
García-Gil, M.R., Floran, V., Östlund, L., Mullin, T.J., Gull, B.A., 2015. Genetic

Chapter 4
174
diversity and inbreeding in natural and managed populations of Scots pine.
Tree Genet. Genomes 11, 28.
Gerlach, G., Jueterbock, A., Kraemer, P., Deppermann, J., Harmand, P., 2010.
Calculations of population differentiation based on GST and D: Forget GST but
not all of statistics. Mol. Ecol. 19, 3845–3852.
González-Martínez, C., Gerber, S., Cervera, T., Martínez-Zapater, M., Gil, L., Alía, R.,
2002. Seed gene flow and fine-scale structure in a Mediterranean pine (Pinus
pinaster Ait.) using nuclear microsatellite markers. Theor. Appl. Genet. 104,
1290–1297.
Goudet, J., 1995. Computer Note. J. Hered. 86, 485–486.
Hampe, A., El Masri, L., Petit, R.J., 2010. Origin of spatial genetic structure in an
expanding oak population. Mol. Ecol. 19, 459–471.
Hardesty, B.D., Dick, C.W., Kremer, A., Hubbell, S., Bermingham, E., 2005. Spatial
genetic structure of Simarouba amara Aubl. (Simaroubaceae), a dioecious, animal-
dispersed Neotropical tree, on Barro Colorado Island, Panama. Heredity
(Edinb). 95, 290–297.
Hardy, O.J., Vekemans, X., 2002. Spagedi: a versatile computer program to analyse
spatial genetic structure at the individual or population levels. Mol. Ecol. Notes
618–620.
Hobbs, R., 2009. Woodland restoration in Scotland: Ecology, history, culture,
economics, politics and change. J. Environ. Manage. 90, 2857–2865.
Hoffmann, A.A., Sgrò, C.M., 2011. Climate change and evolutionary adaptation.
Nature 470, 479–485.
Jones, F.A., Hamrick, J.L., Peterson, C.J., Squiers, E.R., 2006. Inferring colonization
history from analyses of spatial genetic structure within populations of Pinus
strobus and Quercus rubra. Mol. Ecol. 15, 851–861.
Jones, F.A., Hubbell, S.P., 2006. Demographic spatial genetic structure of the
Neotropical tree, Jacaranda copaia. Mol. Ecol. 15, 3205–3217.
Jost, L., 2008. GST and its relatives do not measure differentiation. Mol. Ecol. 17,

The role and processes shaping regeneration and establishment at the local scale
175
4015–4026.
Jump, A.S., Peñuelas, J., 2007. Extensive spatial genetic structure revealed by AFLP
but not SSR molecular markers in the wind-pollinated tree, Fagus sylvatica. Mol.
Ecol. 16, 925–936.
Jump, A.S., Rico, L., Coll, M., Peñuelas, J., 2012. Wide variation in spatial genetic
structure between natural populations of the European beech (Fagus sylvatica)
and its implications for SGS comparability. Heredity (Edinb). 108, 633–639.
Kettle, C.J., Hollingsworth, P.M., Jaffré, T., Moran, B., Ennos, R.A, 2007. Identifying
the early genetic consequences of habitat degradation in a highly threatened
tropical conifer, Araucaria nemorosa Laubenfels. Mol. Ecol. 16, 3581–3591.
Kinloch, B., Westfall, R.D., Forrest, G.I., 1986. Caledonian Scots pine: origins and
genetic structure. New Phytol. 104, 703–729.
Latouche-Hallé, C., Ramboer, A., Bandou, E., Caron, H., Kremer, A., 2003. Nuclear
and chloroplast genetic structure indicate fine-scale spatial dynamics in a
neotropical tree population. Heredity (Edinb). 91, 181–190.
Leclerc, T., Vimal, R., Troispoux, V., Périgon, S., Scotti, I., 2015. Life after disturbance
(I): changes in the spatial genetic structure of Jacaranda copaia (Aubl.) D. Don
(Bignonianceae) after logging in an intensively studied plot in French Guiana.
Ann. For. Sci. 509–516.
Loiselle, B.A., Sork, V.L., Nason, J., Graham, C., 1995. Spatial genetic structure of a
tropical understory shrub, Psychotria officinales (Rubiaceae). Am. J. Bot. 82, 1420–
1425.
Lowe, A.J., Boshier, D., Ward, M., Bacles, C.F.E., Navarro, C., 2005. Genetic resource
impacts of habitat loss and degradation; reconciling empirical evidence and
predicted theory for neotropical trees. Heredity (Edinb). 95, 255–273.
Marquardt, P.E., Epperson, B.K., 2004. Spatial and population genetic structure of
microsatellites in white pine. Mol. Ecol. 13, 3305–3315.
Mason, W.L., Hampson, A. and Edwards, C., 2004 Managing the pinewoods of
Scotland. Forestry Commission, Edinburgh.

Chapter 4
176
Mátyás, C., Ackzell, L., Samuel, C.J.A., 2004. EUFORGEN Technical guidelines for
genetic conservation and use for Scots pine (Pinus sylvestris). International Plant
Genetic Resources Institute, Rome, Italy.
McVean, D.N., 1963. Ecology of Scots pine in the Scottish Highlands. J. Ecol. 51, 671–
686.
Millar, C.I., Stephenson, N.L., Stephens, S.L., 2007. Climate change and forest of the
future: managing in the face of uncertainty. Ecol. Appl. 17, 2145–2151.
Naydenov, K.D., Naydenov, M.K., Tremblay, F., Alexandrov, A., Aubin-Fournier,
L.D., 2011. Patterns of genetic diversity that result from bottlenecks in Scots pine
and the implications for local genetic conservation and management practices in
Bulgaria. New For. 42, 179–193.
Naydenov, K.D., Senneville, S., Beaulieu, J., Tremblay, F., Bousquet, J., 2007. Glacial
vicariance in Eurasia: mitochondrial DNA evidence from Scots pine for a
complex heritage involving genetically distinct refugia at mid-northern latitudes
and in Asia Minor. BMC Evol. Biol. 7, 233.
Ng, K.K.S., Lee, S.L., Koh, C.L., 2004. Spatial structure and genetic diversity of two
tropical tree species with contrasting breeding systems and different ploidy
levels. Mol. Ecol. 13, 657–669.
Nowakowska, J.A., Zachara, T., Konecka, A., 2014. Genetic variability of Scots pine
(Pinus sylvestris L.) and Norway spruce (Picea abies L. Karst.) natural
regeneration compared with their maternal stands. For. Res. Pap. 75, 47–54.
O’Sullivan, P.E., 1973. Land-use changes in the forest of Abernethy, Inverness-shire,
1750 - 1900. Scott. Geogr. Mag. 89, 95–106.
Ortego, J., Bonal, R., Muñoz, A., 2010. Genetic consequences of habitat fragmentation
in long-lived tree species: the case of the mediterranean holm oak (Quercus ilex,
L.). J. Hered. 101, 717–726.
Paffetti, D., Travaglini, D., Buonamici, A., Nocentini, S., Vendramin, G.G., Giannini,
R., Vettori, C., 2012. The influence of forest management on beech (Fagus
sylvatica L.) stand structure and genetic diversity. For. Ecol. Manage. 284, 34–44.

The role and processes shaping regeneration and establishment at the local scale
177
Pandey, M., Gailing, O., Hattemer, H.H., Finkeldey, R., 2012. Fine-scale spatial
genetic structure of sycamore maple (Acer pseudoplatanus L.). Eur. J. For. Res.
131, 739–746.
Parker, K.C., Hamrick, J.L., Parker, A.J., Nason, J.D., 2001. Fine-scale genetic
structure in Pinus clausa (Pinaceae) populations: effects of disturbance history.
Heredity (Edinb). 87, 99–113.
Piotti, A., Leonardi, S., Heuertz, M., Buiteveld, J., Geburek, T., Gerber, S., Kramer, K.,
Vettori, C., Vendramin, G.G., 2013. Within-population genetic structure in beech
(Fagus sylvatica L.) Stands characterized by different disturbance histories: does
forest management simplify population substructure? PLoS One 8, e73391.
Provan, J., Soranzo, N., Wilson, N.J., McNicol, J.W., Forrest, G.I., Cottrell, J.E.,
Powell, W., 1998. Gene-pool variation in caledonian and European Scots pine
(Pinus sylvestris L.) revealed by chloroplast simple-sequence repeats. Proc. Biol.
Sci. 265, 1697–1705.
Prus-Glowacki, W., Stephan, B.R., 1994. Genetic variation of Pinus sylvestris from
Spain in relation to other European populations. Silvae Genet. 43, 7–14.
Prus-Glowacki, W., Urbaniak, L., Bujas, E., Curtu, A.L., 2012. Genetic variation of
isolated and peripheral populations of Pinus sylvestris (L.) from glacial refugia.
Flora - Morphol. Distrib. Funct. Ecol. Plants 207, 150–158.
R Core Team, 2013. R: A language and environment for statistical computing. R
Foundation for Statistical Computing, Vienna, Austria. URL http://www.R-
project.org/.
Rajora, O.P., Pluhar, S.A., 2003. Genetic diversity impacts of forest fires, forest
harvesting, and alternative reforestation practices in black spruce (Picea
mariana). Theor. Appl. Genet. 106, 1203–1212.
Rajora, O.P., Rahman, M.H., Buchert, G.P., Dancik, B.P., 2000. Microsatellite DNA
analysis of genetic effects of harvesting in old-growth eastern white pine (Pinus
strobus) in Ontario, Canada. Mol. Ecol. 9, 339–348.
Robledo-Arnuncio, J.J., 2011. Wind pollination over mesoscale distances: an

Chapter 4
178
investigation with Scots pine. New Phytol. 190, 222–233.
Robledo-Arnuncio, J.J., Alía, R., Gil, L., 2004a. Increased selfing and correlated
paternity in a small population of a predominantly outcrossing conifer, Pinus
sylvestris. Mol. Ecol. 13, 2567–2577.
obledo-Arnuncio, . ., Smouse, P.E., Gil, L., Al a, R., 2004b. Pollen movement under
alternative silvicultural practices in native populations of Scots pine (Pinus
sylvestris L.) in central Spain. For. Ecol. Manage. 197, 245–255.
Rozas, V., Zas, R., Solla, A., 2009. Spatial structure of deciduous forest stands with
contrasting human influence in northwest Spain. Eur. J. For. Res. 128, 273–285.
Scalfi, M., Piotti, A., Rossi, M., Piovani, P., 2009. Genetic variability of Italian
southern Scots pine (Pinus sylvestris L.) populations: the rear edge of the range.
Eur. J. For. Res. 128, 377–386.
Schaberg, P.G., DeHayes, D.H., Hawley, G.J., Nijensohn, S.E., 2008. Anthropogenic
alterations of genetic diversity within tree populations: Implications for forest
ecosystem resilience. For. Ecol. Manage. 256, 855–862.
Sebastiani, F., Pinzauti, F., Kujala, S.T., González-Martínez, S.C., Vendramin, G.G.,
2011. Novel polymorphic nuclear microsatellite markers for Pinus sylvestris L.
Conserv. Genet. Resour. 4, 231–234.
Shaw, H., 2006. Recent pine woodland dynamics in east Glen Affric, northern
Scotland, from highly resolved palaeoecological analyses. Forestry 79, 331–340.
Sinclair, W.T., Morman, J.D., Ennos, R.A., 1998. Multiple origins for Scots pine (Pinus
sylvestris L.) in Scotland: evidence from mitochondrial DNA variation. Heredity
(Edinb). 80, 233–240.
Sjölund, M.J., Jump, A.S., 2015. Coppice management of forests impacts spatial
genetic structure but not genetic diversity in European beech (Fagus sylvatica L.).
For. Ecol. Manage. 336, 65–71.
Smouse, P.E., Peakall, R.O.D., 1999. Spatial autocorrelation analysis of individual
multiallele and multilocus genetic structure 82, 561–573.

The role and processes shaping regeneration and establishment at the local scale
179
Smout, T. C., 2003. People and Woods in Scotland: a History, Edinburgh University
Press, Edinburgh.
Smout, T. C., MacDonald, A.R., Watson, F., 2005. A history of the native woodland of
Scotland 1500-1920, Edinburgh University Press, Edinburgh
Soranzo, N., Provan, J., Powell, W., 1998. Characterization of microsatellite loci in
Pinus sylvestris L. Mol. Ecol. 7, 1260–1261.
Soto, A., Lorenzo, Z., Gil, L., 2007. Differences in fine-scale genetic structure and
dispersal in Quercus ilex L. and Q. suber L.: consequences for regeneration of
mediterranean open woods. Heredity (Edinb). 99, 601–607.
Steven, H.M., Carlisle, A., 1959. The native pinewoods of Scotland. GC Book
Publishers, Edinburgh.
Summers, R.W., Wilkinson, N.I., Wilson, E.R., 2008. Age structure and history of
stand types of Pinus sylvestris in Abernethy Forest, Scotland. Scand. J. For. Res.
23, 28–37.
Szwagrzyk, J., Czerwczak, M., 1993. Spatial patterns of trees in natural forests of
East-Central Europe. J. Veg. Sci. 4, 469–476.
Tipping, R., Ashmore, P., Davies, A.L., Haggart, B.A., Moir, A., Newton, A., Sands,
R., Skinner, T., Tisdall, E., 2008. Prehistoric Pinus woodland dynamics in an
upland landscape in northern Scotland: the roles of climate change and human
impact. Veg. Hist. Archaeobot. 17, 251–267.
Troupin, D., Nathan, R., Vendramin, G.G., 2006. Analysis of spatial genetic structure
in an expanding Pinus halepensis population reveals development of fine-scale
genetic clustering over time. Mol. Ecol. 15, 3617–3630.
Vander Wall, S.B., 2003. Effects of seed size of wind-dispersed pines (Pinus) on
secondary seed dispersal and the caching behavior of rodents. Oikos 100, 25–34.
Van Oosterhout, C., Hutchinson, W.F., Wills, D.P.M., Shipley, P., 2004. Micro-
Checker: software for identifying and correcting genotyping errors in
microsatellite data. Mol. Ecol. Notes 4, 535–538.
Vekemans, X., Hardy, O.J., 2004. New insights from fine-scale spatial genetic

Chapter 4
180
structure analyses in plant populations. Mol. Ecol. 13, 921–935.
Wachowiak, W., Iason, G.R., Cavers, S., 2013. Among population differentiation at
nuclear genes in native Scots pine (Pinus sylvestris L.) in Scotland. Flora 208, 79–
86.
Wachowiak, W., Salmela, M.J., Ennos, R.A, Iason, G., Cavers, S., 2011. High genetic
diversity at the extreme range edge: nucleotide variation at nuclear loci in Scots
pine (Pinus sylvestris L.) in Scotland. Heredity (Edinb). 106, 775–787.
Wachowiak, W., Wόjkiewicz, B., Cavers, S., Lewandowski, A., 2014. High genetic
similarity between Polish and North European Scots pine (Pinus sylvestris L.)
populations at nuclear gene loci. Tree Genet. Genomes 10, 1015–1025.
Wang, X.R., Szmidt, A.E., Lindgren, D., 1991. Allozyme differentiation among
populations of Pinus sylvestris (L.) from Sweden and China. Hereditas 114, 219–
226.
Williams, D.A., Wang, Y., Borchetta, M., Gaines, M.S., 2007. Genetic diversity and
spatial structure of a keystone species in fragmented pine rockland habitat. Biol.
Conserv. 138, 256–268.
Yamagishi, H., Tomimatsu, H., Ohara, M., 2007. Fine-scale spatial genetic structure
within continuous and fragmented populations of Trillium camschatcense. J.
Hered. 98, 367–372.
Young, A., Boyle, T., Brown, T., 1996. The population genetic consequences of
habitat fragmentation for plants. Tree 11, 413–418.

The role and processes shaping regeneration and establishment at the local scale
181
4.8 Supplementary material
S4.1 Genetic diversity estimators for each locus, study site and life stage.
Locus Life stage Abernethy Glen Affric
Unmanaged
N A AR HE FIS N A AR HE FIS N A AR HE FIS
PtTX4001 Adult 181 11 9.28 0.8306 -0.028 165 9 7.59 0.7783 0.03 57 7 6.22 0.5951 -0.002
Juvenile 170 12 9.32 0.8430 -0.06 131 11 8.79 0.8074 0.054 73 9 6.22 0.5073 0.028
PtTX4011 Adult 181 7 4.61 0.5920 0.099* 165 7 5.12 0.5423 0.213*** 57 6 5.66 0.6717 0.204*
Juvenile 170 6 4.73 0.6144 0.22*** 131 6 5.05 0.6094 0.097 73 5 4.96 0.6922 0.3*
psy144 Adult 181 5 3.08 0.1166 -0.042 165 5 3.12 0.1380 -0.054 57 2 1.88 0.0517 -0.018
Juvenile 170 5 2.88 0.0804 -0.024 131 5 3.2 0.1581 -0.067 73 3 2.39 0.1293 -0.06
psy117 Adult 181 8 6.32 0.7820 0.054 165 10 6.97 0.7907 -0.004 57 8 7.03 0.8224 -0.065
Juvenile 170 8 5.98 0.7600 0.133** 131 8 6.56 0.7580 0.016 73 7 6.8 0.8247 -0.025
psy142 Adult 181 5 4.15 0.6466 0 165 6 5.22 0.6669 0.019 57 4 3.51 0.6479 -0.084
Juvenile 170 6 4.34 0.6632 0.104* 131 6 5.07 0.6551 0.01 73 5 4.32 0.6411 -0.155*
psy12 Adult 181 3 2.17 0.3193 0.163* 165 3 2.18 0.2727 -0.096 57 2 2 0.3354 0.059
Juvenile 170 3 2.17 0.3539 0.087 131 3 2.23 0.2386 0.393*** 73 2 2 0.2314 -0.017
psy116 Adult 181 7 5.95 0.7862 -0.03 165 6 5.5 0.7736 0.011 57 6 5.5 0.7399 -0.092
Juvenile 170 8 5.95 0.7720 0.063 131 7 5.42 0.7512 -0.024 73 6 5.87 0.7598 -0.01
psy157 Adult 181 5 4.23 0.3652 0.002 165 6 4.52 0.3483 -0.009 57 4 3.99 0.3892 -0.128
Juvenile 170 5 4.19 0.3517 0.064 131 5 4.05 0.2984 -0.024 73 5 4.39 0.5168 -0.087
CTG4698 Adult 181 8 6.24 0.6044 0.019 165 8 5.17 0.5635 -0.043 57 5 5 0.6500 0.049
Juvenile 170 6 5.34 0.6124 -0.034 131 6 5.27 0.5721 -0.068 73 5 4.64 0.6065 -0.016
SPAC7.14 Adult 181 29 19.08 0.9174 0.194*** 165 26 18.6 0.9150 0.236*** 57 22 17.95 0.9023 0.09*
Juvenile 170 28 17.13 0.9093 0.179*** 131 28 17.83 0.9072 0.21*** 73 28 22.47 0.9513 0.097**
SPAC12.5 Adult 181 21 16.15 0.8989 -0.007 165 17 14.62 0.9058 0.098*** 57 22 16.58 0.8475 0.048
Juvenile 170 19 15.33 0.8956 0.054* 131 22 14.58 0.8814 0.005 73 19 15.85 0.8629 0.032
psy136 Adult 181 5 4.06 0.1877 0.438*** 165 4 2.82 0.1166 0.216*** 57 3 2.76 0.2607 -0.01
Juvenile 170 5 3.23 0.1451 0.108 131 4 2.82 0.0897 -0.029 73 4 3.35 0.2578 -0.01

Chapter 4
182
N, sample size; A, mean number of alleles per locus; AR, rarefied allelic richness; HE, expected heterozygosity; FIS, inbreeding coefficient. Significant P-values
are indicated as *P < 0.05; **P < 0.01; ***P < 0.001. P-values for FIS are obtained after 10,000 permutations of gene copies within individuals of each stand.
S4.2 Pairwise FST values (below diagonal) and differentiation index D (Jost, 2008) (above diagonal) among study sites and life stages.
ABE Adults ABE Juveniles GLA Adults GLA Juveniles UNM Adults UNM Juveniles
ABE Adults - -0.00134 0.01367*** 0.01694*** 0.09089*** 0.08407***
ABE Juveniles -0.00085 - 0.01925*** 0.01836*** 0.09777*** 0.09615***
GLA Adults 0.00531*** 0.00504*** - 0.01223** 0.08486*** 0.08469***
GLA Juveniles 0.00794*** 0.00712*** 0.00514*** - 0.09852*** 0.09642***
UNM Adults 0.04973*** 0.05174*** 0.04434*** 0.05228*** - 0.00843
UNM Juveniles 0.04923*** 0.05132*** 0.04586*** 0.05382*** -0.00254 -
ABE refers to Abernethy, GLA refers to Glen Affric, UNM refers to the unmanaged site. Significant P-values are indicated as *P < 0.05; **P < 0.01; ***P < 0.001.

Chapter 5
Nearby Scots pine populations from
contrasting climates show substantial
population variability but consistent
response to warming
Authors: P. González-Díaz, S. Cavers, L. Matías, R.A. Ennos, J. Cottrell
and A.S. Jump
Intention to submit to Tree Physiology

184
Photos in Chapter 5 main page taken from P. González-Díaz.

The role and processes shaping natural selection
185
5.1 Abstract
Natural tree populations consist on individuals that exhibit intraspecific adaptive
variation at different geographic scales, as a result of the balance between gene flow
and selection. The extent and magnitude of such variation will influence the
adaptive capacity of trees under forthcoming changing environmental conditions.
Scots pine in Scotland is the iconic species of the remnant Caledonian forest and
appear in a relatively narrow geographic area with a steep East-West environmental
gradient, increasing in rainfall and temperature. We hypothesised that western
populations could be better adapted to warmer conditions and, as a consequence,
could perform differently to predicted increased temperature. We performed an
experiment under strictly-controlled conditions with a nested hierarchical design
including region (west of east), population and families. We used two temperature
scenarios, current temperature and increased temperature, and analysed
germination and growth of above and below-ground traits. The largest amount of
variation occurred at the family level. Nevertheless, regional and population
differences were detected, where eastern populations invested more in roots and
western populations had a greater number of stomata rows and thicker roots. In
addition, increased temperature had strong effects on early growth similar in the
two regions, with advanced germination, enhanced growth and biomass about 10
times, but it was not accompanied by shifts in biomass partitioning. Despite the
intra-specific variation found in Scots pine populations, our results reveal consistent

Chapter 5
186
effects of increased temperature on growth and germination, and that the level of
cryptic genetic variation did not vary among regions.

The role and processes shaping natural selection
187
5.2 Introduction
Variation in selective pressures across the distribution of a species means fitness
optima shift according to local environment. Over time populations should tend
towards higher frequencies of genotypes near the local fitness optimum. However,
gene flow acts in opposition to selection (Kawecki & Ebert 2004) and as a
consequence populations show variation around the optimum, with a magnitude
determined by the strength of selection. This intraspecific genetic variation, which
determines adaptive potential, is a key part of plant functional ecology and as such
has been the subject of increasing research particularly in the context of climate
change (Hoffmann & Sgrò 2011, Alberto et al. 2013, Savolainen et al. 2013, Anderson
2016). In tree species, which are predicted to be highly exposed to rapid climate
change due to long generation times, an understanding of adaptive variation will be
crucial as we plan strategies to manage their resilience to the changes ahead.
During the last century global mean temperature has increased substantially and, if
greenhouse gas emissions continue at current rates, it is predicted to continue to rise
through the 21st Century (IPCC, 2013). Temperature plays an important role in seed
germination, growth and survival (Arft et al. 1999, Chidumayo 2007, Walck et al.
2011), an effect that is particularly apparent at altitudinal limits (Harsch et al. 2009,
Greenwood et al. 2015, Matías et al. 2017) or in cold areas where temperature-
induced drought is not a limiting factor (Wilmking et al. 2004). Increases in global

Chapter 5
188
temperature are therefore likely to have important consequences for species
persistence and for forest population dynamics at different scales (Peñuelas & Boada
2003, van Mantgem et al. 2009, Matías & Jump 2015, Matías et al. 2016). Forecasting
the impact of warming on individual tree species has been complex, as the local
outcome of global changes is hard to predict. Furthermore, it is often assumed that
species will respond homogeneously to warming but this discounts differences in
the extent of local intraspecific adaptive potential, which may result in very distinct
responses among populations. Studies at continental scales that have taken
intraspecific variation into consideration have found that this aspect of diversity may
be key to buffering the negative impacts of climate changes on the distribution of a
species (Reich & Oleksyn 2008, Benito Garzón et al. 2011, Oney et al. 2013, Matías &
Jump 2014, Valladares et al. 2014, Matías et al. 2017). However, adaptive responses
to warming at local scales have received substantially less attention (but see
Wilmking et al. 2004; Benito Garzón et al. 2011).
Adaptive divergence has been found among tree populations at relatively small
geographic scales, most probably due to spatial heterogeneity in local selection
pressure (Salmela et al. 2013, Donnelly et al. 2016). However, much genetic diversity
is of low adaptive significance in the home environment or involves genes that may
only become selectively important in novel environments and is therefore ‘cryptic’
until exposed to new conditions. The release of this cryptic variation by a shift in
environment such as climate change, can provide additional variation on which

The role and processes shaping natural selection
189
selection can act and may facilitate adaptive tracking of the environment by the
population. Therefore, there is a need to understand both the extent of individual
population adaptive variation and how variation in adaptive traits might interact
with warming in order to improve our ability to predict the response of particular
tree populations under global warming conditions.
In plants, natural selection acts very strongly on the seedling life stage, and is when
the greatest proportion of a generational cohort is lost (Schupp 1995). Their size and
fragility makes them particularly susceptible to disturbances, such as competition,
browsing, extreme climatic events, and insect or disease infestation, compared to
adult plants (Vizcaíno-Palomar et al. 2014), and they may respond more rapidly to
environmental changes than adult trees (Lloret et al. 2009). Consequently,
consideration of germination and establishment, which are key fitness traits, will be
critical to understanding the response of a tree to novel environments and to identify
the abiotic drivers to which populations are locally adapted (Alberto et al. 2013).
Assessment of the differential contribution of above and below ground traits can
provide a useful way to characterize plant growth and resource use strategies, and
has been shown to vary considerably within species (Hajek et al. 2013, Donnelly et
al. 2016). Above ground traits, such as leaf morphology and stomatal abundance can
provide useful information as leaves are key organs for photosynthesis, carbon
assimilation and exchange of gas and water with the atmosphere, and the stomatal
density influences rates of gas exchange and water loss (Donnelly et al. 2016).

Chapter 5
190
Similarly, below-ground traits, which show large variation among species (Comas &
Eissenstat 2009), can also be informative regarding intraspecific responses, as
temperature has an important role in regulating belowground physiology and soil
temperature can influence root growth, cell elongation, root length and diameter
extension, initiation of new lateral roots and root branching patterns (Pregitzer et al.
2000).
Scots pine (Pinus sylvestris L.) is one of the most widely distributed tree species in the
world and at a continental scale shows strong patterns of intraspecific adaptive
variation (Andersson & Fedorkov 2004, Matías & Jump 2014, Matías et al. 2014). In
Scotland, Scots pine represents the north-western limit of the species distribution
and a globally important peripheral population, which might contain unique genetic
resources. Several millennia of isolation with respect to the mainland populations
have not led to the loss of genetic diversity in the Scottish populations, and they
usually show high levels of neutral (Sinclair et al. 1998, Wachowiak et al. 2011), and
adaptive genetic variation (Perks & Mckay 1997, Salmela et al. 2011, 2013, Perry et al.
2016, Donnelly et al. 2016) among and within populations. The remnant native pine
forest in Scotland experience a generally temperate and oceanic climate, but are
scattered over heterogeneous sites, which vary in aspect and altitude, and increase in
mean temperature and rainfall patterns from East to West, with markedly different
climatic conditions (namely temperature, precipitation and growing season length)
at the extremes (Salmela et al. 2010). Therefore, the population constitutes a valuable

The role and processes shaping natural selection
191
system in which to study underlying processes of intraspecific adaptive variation
and to test whether populations are all likely to respond equally to novel forecasted
environmental conditions.
Controlled environmental studies designed to mimic environmental conditions
and/or predictions under climate change constitute an appropriate way to evaluate
intraspecific variation in trait responses in young trees and to disentangle the
underlying processes (environmental vs. genetic) of such responses to current and
novel pressures (e.g. warming). This is possible, because by using common
environmental conditions, environment is controlled which allow to assign any
differences in the phenotype to the genotype alone. The main objective of this study
was to characterize the intraspecific adaptive variation in Scots pine early growth
traits (seed mass, seedling emergence, biomass accumulation and key above & below
traits) among and within populations, relate this to spatial variation in home site
environment, and estimate the likely response of those populations to projected
climate change. Specifically, we sought to address the following questions: (1) do
early growth traits under current temperatures differ in populations from western
compared to eastern Scotland – is adaptive genetic divergence evident? (2) does the
extent of variation in response to warming differ in populations from the west
compared to the east of Scotland – does the level of cryptic genetic variation vary
among populations? if so, does this correlate with historical exposure to stress (e.g.
do populations from colder conditions show greater variation?). We hypothesized

Chapter 5
192
that (1) early growth traits will differ in populations from the west compared to
those in the east as a consequence of the steep longitudinal climatic gradient under
current conditions, and (2) response to temperature warming on early growth traits
will be stronger in populations from the eastern range, as cold temperatures are
currently more limiting in populations from those areas, which also will show a
greater amount of cryptic genetic variation.
5.3 Material and methods
5.3.1 Study populations and seed collection
Cones were collected in the winter of 2015 from mother trees growing in four natural
populations representing two of the most westerly and two of the most easterly
populations in Scotland (Table 5.1). With the objective of capturing maximum
variation within each population, mature cones were collected from mother trees
located in transects at three altitudinal levels, covering the whole altitudinal range of
each population (Table 5.1). Four families were sampled in each altitudinal level (12
families per population in total), from mother trees separated by at least 40 metres,
as family clusters of Scots pine can occur at distances of less than this in Scottish
pinewoods (González-Díaz et al. 2017). The term family here will refer to a group of
individuals who share a maternal parent (half sib families). Altitude was
subsequently found not to explain significant variation in the studied traits, and is
not dealt with further here. Therefore, to summarize, the sampling design was: 2

The role and processes shaping natural selection
193
regions x 2 populations per region x 12 families per population, resulting in 4
populations and 48 families sampled in total.
Table 5.1 Location of study sites and altitudinal ranges where the mother trees were sampled, as well
as mean temperature and precipitation in each location.
Population Code Latitude Longitude Altitudinal
Range
Altitude range of transect per site Mean
annual
Temp
Mean
annual
Rainfall Low Medium High
Glen Tanar GT(E) 57.02 2.86 276-418 276-278 323-350 404-418 7.40 780
Glen Derry GD(E) 57.03 3.58 438-525 438-464 466-493 508-525 6.80 932
Benn Eighe BE(W) 57.63 5.40 9-222 9-20 41-140 196-222 8.53 2282
Shieldaig SH(W) 57.50 5.63 6-242 6-49 111-144 230-242 8.40 1467
Seeds were extracted after cones were oven dried at 45°C for 3-4 days. Cone size was
classified as big, medium or small and seeds were pooled within a maternal
progeny. Number of viable and non-viable seeds was visually evaluated and
recorded, using full seeds as a proxy of viability in contrast to empty seeds. Viability
was defined as the proportion of viable seeds present in the total set of seeds (viable
plus non-viable). Viable seeds were weighed to estimate mean seed biomass per
family within each population.
5.3.2 Experimental design
Ten replicates of each of the 48 families were sown on June 2015 at the Controlled
Environmental Facilities of the University of Stirling (UK) in individual pots, and the
experiment was conducted over the course of one growing season. Tubular pots (6.5
cm diameter, 45 cm height), were filled with a 2:1 mixture of peat and river sand. A
bottom layer of gravel was used to improve drainage. Before sowing each pot was
irrigated with 200 ml of soil microbial inoculum resulted from the maceration of

Chapter 5
194
roots and soil beneath adult Scots pine trees growing at the University of Stirling, in
central Scotland, to favour formation of mycorrhizas (Matías & Jump 2014). Three
seeds were surface sown in each pot, thinning to one when multiple seedlings
emerged, and retaining the first one to emerge. In total 480 pots were randomized in
blocks inside four Snijders Scientific MC1750E (Tilburg, Netherlands) controlled
environment chambers (inner space 1.8 m length × 0.75 m wide × 1.2 m high),
resulting in 120 pots in each chamber. Since we applied two temperature treatments,
two chambers were used for each of the treatments, each containing 5 replicates of
the 48 families (240 pots in each treatment).
The experimental design was constructed with a nested structure to examine families
within populations. Two temperature treatments were applied during the
experiment: half of the samples (48 families belonging to the four populations with 5
individual replicates) were grown in current temperature (CT) and the other half in
predicted future temperature (FT). Temperature for the CT treatment was set up by
calculating the mean daily and night values for each month of the growing season
using weather stations located near to the sampled populations for the period 1981-
2010: Kinlochewe (57.613N, -5.308W, 25 m.a.s.l.) and Aultbea (57.859N, -5.636W, 11
m.a.s.l.) nearest to the western populations, and Aboyne (57.077N, -2.836W, 140
m.a.s.l.) and Braemar (57.006N, -3.397W, 339 m.a.s.l.) nearest to the eastern
populations, available at http://metoffice.gov.uk. The FT treatment was set up with
an increase of 5°C over that of CT, at both day and night temperatures (Table 5.2),

The role and processes shaping natural selection
195
which is the likely increase in mean temperature under the UKCP09 high emission
scenario by 2080 at the 50% probability level
(http://ukclimateprojections.metoffice.gov.uk/). This high emission scenario is based
on the SRES A1F1 emission scenario (IPCC, 2013). Day and night temperatures were
set up with a constant duration of 16 and 8 hours respectively (experimental
temperature values are summarised at Table 5.2). Light intensity was fixed for 16 h
with a photosynthetic photon flux density of 210 mol m2 s−1, rising progressively at
dawn and decreasing at dusk for 1 h, which is the value representative for forest
understory (Valladares et al., 2004). The appropriate watering was estimated by
calculating the mean rainfall value for each weather station during the growing
season (May to September), for the period 1981-2010, resulting in monthly
precipitation levels of 86.225 l/m2. Watering was applied twice per week, assuming
therefore that water availability was not a limitation in our study. Air relative
humidity and CO2 concentration were kept constant at 70% and 891 mg m−3 (460
ppm) respectively. To minimise any possible chamber effect, all pots were rotated
between the different chambers, spending at least one month in each chamber after
programming for the appropriate treatment conditions, whilst also randomising
block position within chambers. However, block composition was kept constant
during all the experiment. Soil moisture was measured every ten days during the
experiment in all pots over the surface 5 cm by the time-domain reflectometry
method (SM300; Delta-T devices, Cambridge, UK), and values were recorded two

Chapter 5
196
days after irrigation. Monitoring of emergence was carried out every two days until
the last seedling emerged.
Table 5.2 Temperature (day/night) during the experiment for the two treatments: Current
Temperature (CT) and Future Temperature (FT).
Week Equivalent
CT
FT
Day Temp. (16h.) Night Temp. (8h.)
Day Temp. (16h.) Night Temp. (8h.)
1-4 May 14° C 6° C 19° C 11° C
5-8 June 16° C 8° C 21° C 13° C
9-13 July 18° C 10° C 23° C 15° C
14-17 August 17° C 9° C 22° C 14° C
18-22 September 15° C 7° C 20° C 12° C
On 26th November 2015 after 22 weeks in the controlled environment chambers
plants were harvested and cut at the root collar to divide each plant into above and
belowground parts. Roots were washed gently but thoroughly taking care to keep
loss of root tissue to a minimum, and measurements of maximum root and shoot
length and fresh biomass were taken. Five needles were collected from each
seedling, two from the upper part, two from the lower and one from the middle of
the plant. The number of stomatal rows at midway along the needle on its adaxial
(upper) surface was counted with the aid of a stereo microscope Leica light
microscope (x10 objective). Stomatal rows were used as a proxy of stomatal
densities. After measurements, needles were scanned using a scanner at 300 d.p.i.
and placed together with the rest of its seedling. Data measurement of scanned
needle dimensions was done using ImageJ software, v.1.36b. (Abramoff et al., 2004).
Clean fresh roots were placed flat on a sheet of paper and also scanned. The obtained
images were edited manually with Adobe Photoshop® in order to remove any

The role and processes shaping natural selection
197
shadows that would cause spurious measurements to be recorded. Data acquisition
for structural and morphological analysis of scanned roots was done using
WinRhizo (Regent Instruments Inc., Quebec, Canada, 2000), obtaining the following
morphological parameters of roots, which are averaged for every root (e.g.
considering all main and fine roots): total root area, total root length, root diameter,
root volume, number of root tips and forks. Dry biomass (g) was recorded after both
roots and shoots were dried in the oven for a minimum of 3 days at 45°C.
In total, nineteen early growth traits subject to differing natural selection were
considered for the following statistical analysis (Supplementary S5.1) of which two
refer to the seed stage, mean viable seed weight (SEW) (mg) and seed viability (SEV)
(%). Seedling emergence (EME) was recorded as soon as the seeds were observed at
the substrate surface within pots, and survival (SUR) (%) was checked every two
days and recorded over the duration of the experiment. All the remaining traits were
recorded at the end of the experiment: Total dry biomass (TDB), which is the sum of
shoot dry and root dry biomass (g); plant height (SHL) (mm); maximum root depth
(ROL) (mm); root mass fraction (RMF) which is the ratio of root dry biomass to total
dry biomass. It is worth noting that RMF was used instead root : shoot (R:S) ratio,
commonly used in other studies, as RMF values lie between 0 and 1, which makes
comparisons between plants of different sizes easier compared to R:S which is
unconstrained and can vary from a tiny to a very large number (Pérez-
Harguindeguy et al. 2013). Other below-ground traits: total root length (TRL), which

Chapter 5
198
represents the sum of the lengths of all the fine roots (cm); average root diameter
(AVD) (mm); root volume (ROV) (cm3); number of tips (TIP); number of forks (FOR);
branching intensity (BRI), which is the ratio of the number of tips to the total root
length (cm-1); specific root area (SRA), which is the ratio of surface area to root dry
biomass (m2 g-1) and the specific root length (SRL), which is the ratio of total root
length to the root dry biomass (m g-1). Finally, above-ground traits, needle length
(NEL) (mm), needle width at its midpoint (NEW) (mm) and the mean number of
stomatal rows (STO) were measured in five needles per individual. Mean values are
given ± Standard deviation.
5.3.3 Data analysis
5.3.3.1 Seeds and seedling emergence
A nested analysis of variance (ANOVA) was used to test differences in seed biomass
and viability among and within populations. To analyse differences in emergence,
only the date of emergence of the first of the three seeds shown per pot was
considered, and the emergence ratio on each experimental day was calculated. A
cumulative binary logistic regression was used to evaluate the effect of temperature,
population and experimental day of emergence in the emergence ratio with the glm
function, using a binomial error distribution. Experimental day, temperature,
population and the interaction between the three factors were considered as the

The role and processes shaping natural selection
199
predictor variables. Survival was estimated as the proportion of emerged seedlings
that survived to the end of the experiment.
5.3.3.2 Intraspecific variation of early growth traits and response to
temperature
Mixed effect models were used to analyse the genetic variance components of the
response of early growth traits and to test the effect of temperature with the
statistical package “lme4”. To identify the best-supported model we constructed all
possible combinations of alternative models, from the maximal model considering
both the main effects and the pair-wise interactions between the fixed effects. Models
were fitted by Maximum Likelihood (ML) and model selection was performed using
backward stepwise selection to minimize the corrected Akaike Information Criterion
(AICc). The selected model included temperature and region as fixed factors (and
the interaction of both for few traits) and population, family and block as a random
factor, and it was fitted with a Restricted Maximum Likelihood (REML) algorithm to
obtain parameter estimates.
(1)
This model (1) was applied for two data-sets: (i) all data containing the source of
variation “temperature”, and (ii) data separately by temperature treatment,
removing the source of variation “temperature” from the Eq. (1). Residuals were

Chapter 5
200
tested for normality and homoscedasticity, and log transformation of the variables
was applied when necessary.
(i) The model containing all data, which included the temperature treatment,
was analysed in order to detect the variance explained for each of the factors. To
estimate the variance of the trait of interest associated with a specific fixed effect, the
k-th, we used the Eq. 2.
( )
(
)
(2)
Where xij is the explanatory variable data for variables j 1, … , p, and k is the
estimated fixed effect.
(ii) The models for the individual temperature treatments were analysed in order
to calculate the variance explained for each of the factors and to estimate additive
genetic variation, heritability and evolvability of the trait of interest in each
treatment. Narrow-sense heritability (h2), which corresponds to the proportion of
total phenotypic variation attributed to additive genetic variation, proportional to
the rate of short-term responses to selection (Bolnick et al. 2011), were estimated as
indicated in Eq. 3
4
(3)
Where VA is the additive genetic variance and VP is the phenotypic variance; Vfam,
Vblock, Vres.

The role and processes shaping natural selection
201
Standard errors (SE) for heritabilities (h2) were estimated as suggested by (Visscher
1998), indicated in Eq. 4.
E
4 (1
4 )
1 1
4
( 1)( 1)
(4)
Where s is the number of individuals per family, and f is the number of families.
The genetic coefficient of variation CVA was estimated according to (Houle 1992)
following Eq. 5, and is a standardised measure of variation normalised by the trait
mean. It provides a measure of the evolvability of a trait.
rait
1 (5)
Where µTrait is the mean of the trait of interest.
Differences among regions for each temperature treatment were evaluated by
comparing pairs of models by AICC for each of the studied traits. The model with the
same formula as equation (1) without the temperature factor, with region as a fixed
effect, was compared to a null model which did not include the region effect.
To detect differences in soil moisture among the different treatments and regions (or
populations), repeated measures ANOVA was used. All statistical analyses were
carried out in R (http://www.R-project.org/) in order to assess the level of
intraspecific variability at different levels (region or population and family) and the
effect of the predicted increase of temperature.

Chapter 5
202
5.4 Results
5.4.1 Seeds and seedling emergence
Viability of seeds differed significantly among regions (F= 1.56, d.f.=1, p=0.04) and
populations (F= 4.00, d.f.=3, p=0.01) which ranged from the lowest viability at BE(W)
(61.73% ± 18.79) and SH(W) (62.08% ± 11.55) followed by GD(E) (65.35% ± 5.36), and
the highest seed viability was at GT(E) (70.62% ± 9.47). Those differences were not
accompanied by differences in seed biomass among regions nor among populations,
whose mean values were similar for SH(W) (5.99 mg ± 0.95), BE(W) (5.66 mg ± 1.14),
GD(E) (5.25 mg ± 1.24) and GT(E) (5.88 mg ± 1.06). In addition, and as expected, seed
biomass differed among cone sizes (F=5.98, d.f.=2, p=0.006) (i.e. larger cones had
heavier seeds).
A total of 478 seedlings emerged during the experiment (99.6%), considering only
the seedling that was kept from the initial three, with the first day of germination
nine days after sowing. Temperature had a strong effect in controlling the emergence
ratio (z=-3.84, p=0.00123), with the warmer temperature advancing the date of
emergence by approximately 10 days (mean time to emergence, CT= 26.23 ±8.39,
FT=15.32 ± 4.08) (Table 5.3, Fig. 5.1). Day of emergence had a significant effect on the
emergence ratio of a seedling in a population (z=32.51, p<0.001), indicating that the
rank order of emergence for populations changed over time. Day of emergence had a
significant interaction with population, indicating that the change over time of the
emergence rate differed among populations, and a significant interaction with

The role and processes shaping natural selection
203
treatment, indicating that emergence of the first seedling occurred earlier under FT
but subsequent seedlings also emerged faster than under CT. Furthermore,
significant differences among populations were detected, which were greater among
the both eastern populations GT(E) and DG(E) than among western and eastern
populations. Treatment x population interaction was only significant for BE(W).
Furthermore, triple interactions between population, day and treatment were also
observed (Table 5.3, Fig. 5.1). Survival was 100% on both treatments during the
experiment.
Figure 5.1 Predicted cumulative emergence ratio over time (experimental day) across temperature
treatments (Current Temperature, C and Future Temperature, F) and population (GD(E) GT(E),
BE(W), SH(W)) using a binomial error distribution. Grey dots represent observed data.

Chapter 5
204
Table 5.3: Parameters of the Logistic Regression of cumulative emergence of Scots pine
Variables Estimate SE z value Pr(>|z|)
(Intercept) -3.92 0.14 -27.11 <0.0001***
DAY 0.16 0.00 30.14 <0.0001***
TreatmentF -0.91 0.25 -3.59 0.000327**
PopulationET -3.72 0.36 -10.21 <0.0001***
PopulationBE(W) -2.10 0.26 -7.95 <0.0001***
PopulationSH(W) -2.03 0.26 -7.60 <0.0001***
DAY:TreatmentF 0.12 0.01 10.24 <0.0001***
DAY:PopulationET 0.16 0.01 11.43 <0.0001***
DAY:PopulationBE(W) 0.07 0.01 7.44 <0.0001***
DAY:PopulationSH(W) 0.07 0.01 7.21 <0.0001***
TreatmentF:PopulationET -0.98 0.70 -1.38 ns
TreatmentF:PopulationBE(W) 0.96 0.46 2.1 0.035705*
TreatmentF:PopulationSH(W) 0.49 0.46 1.07 ns
DAY:TreatmentF:PopulationET 0.22 0.04 5.07 <0.0001***
DAY:TreatmentF:PopulationBE(W) 0.06 0.02 2.55 0.010775*
DAY:TreatmentF:PopulationSH(W) 0.07 0.02 2.71 0.006769**
Significant P-values are indicated as *P < 0.05; **P < 0.01; ***P < 0.001; ns, non significant
5.4.2 Intraspecific variation of early growth traits
All traits showed substantial intraspecific adaptive variation, and the largest
proportion of genetic variation was partitioned within the populations (among
families) rather than among regions or populations for most traits. Family variance
was relatively large for most traits (VFAM, CT: 0-17.43 %) (Table 5.4), and those values
were reflected in the high estimates of narrow-sense heritability (h2, CT: 0-0.77). Also
the estimates of evolvability were relatively large (CVA, CT: 0-48.31). Although
variance attributable to region was smaller than that for family in the majority of
cases, it was nevertheless significant for different traits (VREG, CT: 1.61-4.99 %), as
was indicated by the adequate support for the inclusion of region as a fixed effect for
those traits in C (∆AIC, C 1.68-5.15) (Table 5.4). Furthermore, differences among

The role and processes shaping natural selection
205
populations were also present in most of the traits (VPOP, CT: 0.61-9.01 %) (but see
RMF, BRI, SRA, SRL).

Chapter 5
206
Table 5.4 Genetic components for the current and future temperature model: the proportion of variance attributable to population, family within population,
block and residual which refer to the individual; heritabilities (h2) with their associate error, and evolvabilities of the traits (CVA). Model subsets were
generated and compared by AICc to assess the importance of Population. The best models were determined by AICc, and the presence (+) or absence (-) of
fixed effects are indicated for each of the traits listed. ∆AICc values represent the difference in AICc between the null model and the best (a value of zero
indicates that the null model was the most parsimonious). Treatment Trait
Trait
code Region df ∆AIC AIC VREG (%) VPOP (%) VFAM (%) VBLOCK (%) VRES (%) h2 (SE) CVA
CT
Total Dry Biomass TDB - 5 0.00 344.62 - 9.01 17.43 3.61 69.96 0.77 (0.26) 15.44
Shoot Height SHL - 5 0.00 447.46 - 4.73 0.88 13. 67 80.71 0.04 (0.19) 4.52
Root Depth ROL - 5 0.00 185.33 - 4.13 5.99 0.62 89.25 0.25 (0.21) 3.08
Root Mass Fraction RMR + 6 5.15 -611.78 4.99 0.00 0.00 1.83 93.18 0.00 0.00
Total Root Length TRL - 5 0.00 383.94 - 6.05 9.48 4.62 79.84 0.40 (0.18) 8.59
Average Diameter AVD + 6 1.71 -651.39 4.46 4.04 4.05 25.92 59.86 0.18 (0.18) 6.89
Root Volume ROV - 5 0.00 462.09 - 7.28 9.10 8.27 75.34 0.39 (0.18) 16.82
Tips TIP - 5 0.00 449.03 - 5.77 9.25 4.94 79.61 0.39 (0.18) 7.84
Forks FOR - 5 0.00 442.55 - 5.61 7.22 20.41 66.75 0.31 (0.18) 6.96
Branching intensity BRI - 5 0.00 416.62 - - 9.10 0.62 90.29 0.36 (0.18) 12.35
Specific Root Area SRA + 6 1.68 -1250.11 1.61 - 9.11 10.62 78.65 0.37 (0.18) 23.21
Specific Root Length SRL + 6 4.38 1640.12 5.61 - 10.04 9.62 74.72 0.43 (0.18) 22.08
Needle Length NEL - 5 0.00 -121.97 - 5.73 11.58 4.94 77.75 0.49 (0.18) 5.93
Needle Width NEW + 6 2.30 -1117.63 2.19 0.61 11.4 3.27 82.49 0.47 (0.18) 48.31
Stomatal Rows STO + 6 3.28 -116.60 6.55 1.97 16.03 0.96 74.27 0.70 (0.26) 11.62
FT
Total Dry Biomass TDB + 6 0.35 704.23 1.95 0.00 12.79 7.94 77.32 0.52 (0.24) 66.58
Shoot Height SHL - 5 0.00 568.22 - 2.90 5.95 3.77 87.37 0.25 (0.21) 9.90
Root Depth ROL - 5 0.00 172.08 - 2.44 0 3.74 93.81 0.00 0
Root MassFraction RMR - 5 0.00 -534.06 - 1.58 6.59 4.45 87.39 0.27 (0.22) 9.24
Total Root Length TRL - 5 0.00 658.07 - 1.60 13.55 8.04 75.66 0.55 (0.18) 12.78
Average Diameter AVD + 6 2.69 -573.97 5.75 0.91 0 6.20 87.14 0.00 0
Root Volume ROV + 6 0.10 743.48 2.27 0.93 10.14 7.05 79.62 0.42 (0.23) 14.52
Tips TIP - 5 0.00 605.86 - 1.04 14.20 8.26 76.50 0.57 (0.25) 10.09
Forks FOR - 5 0.00 678.20 - 1.64 13.33 14.78 70.25 0.53 (0.24) 10.93
Branching intensity BRI + 6 2.90 418.89 3.56 0 1.14 1.21 94.08 0.07 (0.19) 5.91

The role and processes shaping natural selection
207
Specific Root Area SRA - 5 0.00 -1430.23 - 0.62 0.00 2.95 96.42 0.00 0
Specific Root Length SRL + 6 1.47 1621.58 4.10 1.27 0.52 3.99 90.13 0.02 (0.19) 3.72
Needle Length NEL - 5 0.00 888.49 - 1.81 19.74 2.27 76.18 0.80 (0.26) 9.91
Needle Width NEW - 5 0.00 -161.09 - 0.37 12.94 3.45 83.24 0.52 (0.24) 66.08
Stomatal Rows STO + 6 2.02 -51.92 2.88 - 15.46 1.69 79.96 0.68 (0.25) 11.71
Data from table 6 include variance components for region (VREG), population (VPOP), family (VFAM), block (VBLOCK) and residual (VRES).

Chapter 5
208
Regional differences were evident for some early growth traits, where the western
populations displayed smaller biomass allocated to roots (RMF) compared to the
eastern ones in CT (Fig 5.2b). Remarkable differences were evident among regions in
other root traits, with western populations having thicker roots (AVD) (Fig. 5.3a),
shorter specific root length (SRL) (Fig. 5.3b) and lower specific root area (SRA). The
number of root tips was greater in the eastern population GT(E) for CT but did not
show any trend in the W-E range. Branching intensity was higher in SH(W) followed
by BE(W), compared with eastern populations, however differences among regions
were only significant under the temperature treatment FT (Fig. 5.3c). Regarding
above ground traits, western populations had significantly greater number of
stomatal rows (Fig. 5.4a) and thicker needles in CT (Fig. 5.4b). Needle length
changed among populations, with SH(W) and GT(E) having the longest needles in
CT, whilst GD(E) had the shortest ones, but no regional differences were present.
Population differences were also evident for some early growth traits, where the
western population SH(W) displayed greater biomass (TDB) and longer roots (ROL)
and shoots (SHL) at CT whereas both eastern populations GT(E) and GD(E) had the
lowest values (Fig. 5.2a and 5.3a), however, no regional differences were observed in
those traits.

The role and processes shaping natural selection
209
Figure 5.2 Total dry biomass (a) and root mass fraction RMF (b) of Scots pine seedlings from the four
studied populations across the temperature treatment (Current T, Future T). Refer to table 1 for
population code key. Error bars represent± SE.
Figure 5.3 Below-ground traits: root average diameter (a), Specific Root Length SRL (b) and branching
intensity (c) of Scots pine seedlings from the four studied populations across the temperature
treatment (Current T, Future T). Refer to table 1 for population code key. Error bars represent ± SE.

Chapter 5
210
Figure 5.4: Above-ground traits: number of stomata rows (a) and mean needle length (b) of Scots pine
seedlings from the four studied populations across the temperature treatment (Current T, Future T).
Refer to table 1 for population code key. Error bars represent ± SE.
5.4.3 Response to temperature of early growth traits
Soil moisture availability was different among treatments (F=101.14, d.f.=1, p<0.0001),
due to the different temperature levels imposed during the experiment, however no
significant differences were observed among regions or populations within
treatments (F=1.968, d.f.=3, p=0.1179).
Overall, no temperature x region interactions were found for the majority of the
traits assessed in the study, which means that all populations responded consistently
under current and increased temperature (but see TRL and FOR in Table 5.5).
Temperate had a strong effect on most of the measured traits, and explained up to
49.33% of the variance (Table 5.5). The temperature treatment (FT) resulted in

The role and processes shaping natural selection
211
significantly greater total biomass (TDB, CT: 0.069 g ± 0.049, FT: 0.49 g ± 0.37) (Fig.
2a), taller shoots (SHL, CT: 17.16 mm ± 9.35, FT: 64.15 mm ± 34.85) and deeper roots
(ROL, CT: 300.26 mm ± 91.43, FT: 435.57 mm ± 99.55) (we did not observe root
growth limitation due to pot height). However, with the exception of population
BE(W) which invested relatively more into roots in the FT treatment, there was no or
little change in biomass allocation (RMF, CT: 0.42 ± 0.067, FT: 0.43 ± 0.078), (Fig. 2b).
Most of the below ground traits were highly influenced by the warmer temperature
treatment, which resulted in longer (e.g. considering the total length) (TRL, CT: 86.63
cm ± 60.04, FT: 608.36 cm ± 420.23), thicker (AVD, CT: 0.36 mm ± 0.061, FT: 0.43 mm ±
0.07) (Fig.3a), and more voluminous roots (ROV, CT: 0.1 cm3 ± 0.071, FT: 0.99 cm3 ±
0.83), with more forks (FOR, CT: 370.54 ± 305.88, FT: 2976.11 ± 2434.58) and more
root tips (TIP, CT: 267.24 ± 186.80, FT: 1449.04 ± 905.84). However, the warmer
temperature reduced the branching intensity of roots (BRI, CT: 3.04 cm-1 ± 0.622, FT:
2.63 cm -1 ± 0.60) (Fig. 3c), and had little or no effect on SRA, (SRA, CT: 0.04 mg2 g-1 ±
0.013, FT: 0.04 mg2 g-1 ± 0.01) and SRL (SRL, CT: 31.79 mg g-1 ± 10.89, FT: 31.89 mg g-1
± 8.39) (Fig. 3b) respectively. Warmer temperature also had a strong effect on the
above ground traits, resulting in greater numbers of stomatal rows (STO, CT: 3.99 ±
0.79, FT: 4.73 ± 1.01) (Fig. 4a) and longer (NEL, CT: 17.9 mm ± 4.57, FT: 33.37 mm ±
11.29) and thicker needles (NEW, CT: 0.81 mm ± 0.13, FT: 1.001 mm ± 0.23) (Fig. 4b).
Predicted warming (FT) diminished the differences among populations, which is
reflected in the reduction of the VPOP (CT: 0.61-9.01 %, FT: 0-2.90 %) for all traits

Chapter 5
212
except for RMF, SRL and SRA (see Table 5.4). However, the west-east regional
differences (VREG), were increased under the FT treatment for some traits (TDB, AVD,
ROV and BRI), while they were decreased for others (RMF, SRA, SRL and TWN)
(See Table 5.4). Neither narrow sense heritability showed consistency in the direction
in which it shifted in response to the warmer temperature treatment (Table 5.4).
However, for most of the traits not related with roots CVA was increased (Figure 5.5)
under warmer temperatures.
Figure 5.5 Plasticity to change of the coefficient of genetic variation (CVA) of Scots pine seedlings
across the temperature treatment (Current CT, Future FT). Refer to table 5.1 for population code key.
Grey symbols represent above ground traits, whereas black symbols represent below ground traits.
Symbols above the dashed 0:0 line indicate higher CVA under future conditions (FT).

The role and processes shaping natural selection
213
Table 5.5 Summary of early growth traits analyses by treatment and region. Model subsets were generated and compared by AICc to assess the importance
of Treatment, Region, and their interaction as fixed effects. The best models were determined by AICc, and the presence (+) or absence (-) of fixed effects are
indicated for each of the traits listed. ∆AICc values represent the difference in AICc between the null model and the best.
Trait Mean
CT
Mean
FT
Treat
ment Region
Treatmen
t X
Region
df ∆AIC AIC VTREAT
(%) VREG (%)
VTREAT
X REG
(%)
VPOP (%) VFAM (%) VBLOCK (%) VRES (%)
Total Biomass (g) 0.05 0.38 + - - 6 36.47 1150.87 49.33 - - 2.01 7.42 3.98 37.26
Shoot Length (mm) 17.16 64.15 + - - 6 33.00 1017.88 44.02 - - 1.42 3.94 3.87 46.75
Root Length (mm) 300.26 435.57 + - - 6 28.70 343.71 37.45 - - 2.83 4.22 1.86 68.04
Root Mass Fraction 0.42 0.43 - + - 6 2.24 -1141.74 - 1.78 - 0.78 0.00 3.67 93.81
Total Root Length (cm) 86.63 608.36 + + + 8 38.58 1089.16 22.74 0.096 27.83 2.29 6.14 3.69 37.21
Average Diameter (mm) 0.36 0.43 + + - 7 13.37 -1221.839 18.32 4.11 - 3.73 1.47 12.49 59.88
Root Volume (cm3) 0.1 0.99 + - - 6 36.29 1255.13 49.63 - - 2.40 5.23 3.94 38.79
Tips 267.24 1449.04 + - - 6 36.41 1054.13 48.27 - - 1.43 6.71 3.76 39.83
Forks 370.54 2976.11 + + + 8 29.73 1147.13 21.35 0.15 26.81 2.15 6.19 8.68 34.67
Branching int. (cm-1) 3.04 2.63 + + - 7 23.61 829.05 9.97 1.93 - 0 0.84 1.01 86.24
Specific Root Area (m2*g-1) 0.04 0.04 + + - 8 5.83 -2674 5.43 0.90 - 0.93 0.80 7.28 84.65
Specific Root Length (m*g-
1) 31.79 31.89 - + - 7 3.83 3264.37 - 4.73 - 1.40 2.67 6.85 84.35
Needle Length (mm) 17.9 33.37 + + - 7 46.64 979.25 45.12 - - 1.84 7.46 1.81 43.76
Needle Width (mm) 0.81 1.001 + - - 8 29.18 -1084.23 19.12 1.41 - 7.92 2.45 69.10
Stomata Rows 3.99 4.73 + + - 7 26.64 -194.20 13.66 3.88 - 0.03 16.14 1.07 65.20

Chapter 5
214
5.4.4 Relationship among traits
The number of stomatal rows was highly correlated with the total biomass (R2=0.37,
p<0.001) and the needle width (R2=0.34, p<0.001), suggesting that the increase in
stomata could be related to the increase in biomass in each of the plants. When we
explored the relationship between the mean biomass of seeds and the mean biomass
of seedlings at the end of the experiment (Fresh biomass) a small but positive
correlation was detected (R2=0.02, d.f.=4, p<0.01), but no differences among
populations were found (all p-values >0.05).
5.5 Discussion
Despite the fact that our sampled populations were located in a relatively small
geographic area at the north-western limit of the distribution of Scots pine, we were
able to detect a substantial amount of intra-specific adaptive variation within and
among populations and regions of this species, for which most traits were highly
heritable. Although warmer conditions had strong effects on early growth traits by
advancing germination and enhancing above and below-ground biomass by up to a
factor of ten, there was a consistent response to warmer temperature in populations
from both western and eastern Scotland, which was in contrast to our initial
hypothesis. In addition, although cryptic genetic variation was present in the

The role and processes shaping natural selection
215
majority of the traits under the novel warmer conditions, populations showed that
the level of cryptic genetic variation did not vary among regions or populations.
5.5.1 Intra-specific adaptive variation
5.5.1.1 Seeds and emergence
Notable intra-specific variation among regions and populations was observed in
seed viability and their emergence rates in our study populations. Although seed
viability was high (between 61% and 70%) for all our Scots pine populations, it was
lower for populations originating from the west compared to the east of Scotland,
consistent with previous results (Mcvean, 1963). Seed viability, which is the primary
factor determining the success of recruitment in forest tree populations, is believed
to be controlled to a large degree by the temperature at the home environment
(Reyes & Casal 2002), and the two are usually positively correlated (Kullman 2007).
However, populations originating from western coastal areas of Scotland, which had
lower values of viability, experience a significantly greater mean temperature in
comparison with the eastern areas, which might be expected to favour seed viability,
and the cause of this difference remains unclear.
Seed size is also believed to contribute substantially to seedling development, as it is
generally accepted that seed size reflects the amount of nutrient reserves available to
the embryo (Reich et al. 1994, Seiwa & Kikuzawa 1996). However, a contrast in the

Chapter 5
216
contribution of seed size to development has been found in southern and northern
populations of Scots pine. In Central and Southern European populations of Scots
pine, a significant positive correlation was found between seed mass and seedling
development (Reich et al. 1994), believed to be possibly only a temporary effect
(Castro 1999; Righter, 1945), but the effect was not observed in northern populations
(>55º in latitude; Reich et al. 1994). In our populations, however, we found a small
but significant correlation among seed and seedling mass, suggesting that seed size
might contribute to seedling development to some degree. Overall, Scottish seeds
weighed less (5.63 ± 1.11mg) than those from the southern limit of the species
distribution (9.21 ± 3.08 mg) (Castro 1999), which is assumed to be due to the shorter
growing season and lower nutrient availability in northern populations (Reich et al.
1994). In addition, variation in the emergence ratio was observed among West and
East populations, but variation within eastern populations (separated only by few
kilometres) was greater.
5.5.1.2 Biomass and early growth traits
Overall, the proportion of total variation accounted for by within-population
variation (variation among families) in biomass and above and below ground traits
was greater than that attributable to among-region and among-population variation
for most traits, but the latter were also significant. At the regional level, populations
from the east showed a greater carbon allocation to roots (higher RMF) in

The role and processes shaping natural selection
217
comparison to those from the west. Biomass allocation patterns are generally found
to be influenced by local climate, particularly temperature and water availability.
Thus, in natural conditions, cold and aridity have generally been found to promote
greater biomass investment into roots (Luo et al. 2012), thereby enhancing the
uptake of water and nutrients, which are more limited in such environments.
Although a recent meta-analysis at a global scale attributed allocation shifts only to
temperature (Reich et al. 2014), common garden trials indicate that plants that invest
a greater proportion of biomass in their roots might have a selective advantage in
arid conditions (Matías et al. 2014). Eastern Scottish populations experience both
colder and drier conditions than those in the west. Therefore, our results suggest that
individuals from colder conditions may achieve a selective advantage by being
genetically predisposed to allocate more biomass to roots. Furthermore, under
common garden conditions eastern populations not only invested more biomass in
roots, they also developed a root system with a greater specific root length (higher
SRL) based on thinner (lower average diameter) and more highly branched roots
which would likely satisfy the need to explore deeper into the soil fraction. Similar
results were reported by Comas & Eissenstat (2004) who found higher SRL, lower
diameter and greater branching capacity in species needing stronger soil exploration
and root defences, in this case in fast growing species. However, in our study,
branching intensity of roots showed significant regional differences only during
novel warming conditions (FT). Another very important selective force in Scotland is
exposure to wind. In our trial, western populations had thicker roots than

Chapter 5
218
populations from the east, a trait that has been shown to provide a better anchorage
for the plant (Alvarez-Uria & Körner 2007). In the west, trees may be more exposed
to strong west-south-westerly winds (Dore et al. 2006) coming directly from the
Atlantic Ocean. Western populations could therefore be under selective pressure to
produce individuals with a stronger anchorage system whilst the need to penetrate
soil to find water is lower in populations originating from the west than the east. It is
worth mentioning that we did not explore soil properties at the home sites, which
may help to explain the results found. Other traits, such as SRA did not show
significant variation between populations.
We also found consistent differences in some of the above-ground traits at the
regional level. Therefore, populations from the west had greater numbers of
stomatal rows than populations from the east. Similar results were found by
Donnelly et al. (2016), who reported that stomatal density increased towards the
West. The density of stomata on leaf surfaces in situ has been interpreted as a
response to differences in moisture availability (Hogan et al. 1994, Brewer & Nuñez
2007) decreasing with reduced rainfall as an adaptation to conserve water in areas
where there is less available. The density of stomata has also been suggested to
decrease with increasing altitude (Hultine & Marshall 2000), presumably also
assumed to be a water availability adaptation. Therefore, the differences observed in
our common garden trial might indicate that the exposure of populations from the
East to drier, higher altitude conditions may have driven adaptation in the form of

The role and processes shaping natural selection
219
fewer stomatal rows. In addition, western populations showed also thicker needles
in the CT, which showed a small but significant positive correlation with the number
of stomatal rows.
5.5.1.3 Heritabilities and genetic components
All the differences that we observed in the phenotype during the experiment
(described in the previous section) are due to the genotype, as we removed the
environment by using common environmental conditions. The larger extent of
within-population variation (family variation), which typically accounted between
the 4 and 18% of the variance under current conditions (CT) with few exceptions
(Table 5.4), was reflected in the substantial heritability values for most traits.
Therefore, we observed moderate to high values of heritabilities (0.18<h2<0.49 for CT)
(but see SHL and RMR for CT), that were particularly large for total biomass or
number of stomatal rows (0.77 ± 0.26 and 0.70 ± 0.26 respectively for CT), which
indicate a significant variance in the phenotype is heritable, with the exception of
RMF that showed no heritability under current conditions. Heritability estimates
reflect the component of the phenotypic variation of the population that can be
assigned to its genetic composition and is inherited from parental trees, and this can
provide an indication about how much the trait can respond to selection.
Furthermore, large estimates of heritability are usually associated with fluctuating
natural selection (Bell, 2010; Donnelly et al. 2016). Therefore, temporal or spatial

Chapter 5
220
variation (e.g. seasonal climatic variation or spatial heterogeneities) might have
caused fluctuation in the selective forces acting on the studied Scottish populations,
especially for stomatal rows and total biomass. We cannot disregard considerable
standard errors - since high accuracy on those estimates can only be achieved with a
very large sample size (Donnelly et al. 2016). Furthermore, some maternal effects
might be present in our estimates (denoted by the small but positive correlation of
seed mass vs. seedling mass), it seems that on balance the evidence indicates that
growth traits are likely to retain substantial heritable adaptive capacity.
5.5.2 Response to temperature
As stated previously, temperature is an important factor influencing plant
development (Hatfield & Prueger 2015) and is critical to all metabolic processes
involved in uptake, release, and storage of carbon (McMahon et al., 2010). Therefore,
earlier germination and increased growth under warming conditions is common for
species inhabiting areas which are temperature-limited, as they are usually restricted
by cold (Overdieck et al. 2007, Milbau et al. 2009, Pulkkinen et al. 2013). As expected,
in our study we detected a strong role of temperature in substantially advancing
seedling emergence by 10 days and dramatically enhancing biomass and above and
below ground traits up to 10 fold, which was consistent in both west and east
populations for most traits. The strong effect of the warmer temperature suggests
temperature limitation for early growth in the study areas under current conditions.

The role and processes shaping natural selection
221
Although the lowest temperature simulated in our experiment remained above the
minimum temperature required for root growth (4-6ºC) (Alvarez-Uria & Körner
2007), it is likely that current temperatures (CT) are sufficiently low to slow the
growth of both below and above ground traits. If this temperature limitation
disappears as a consequence of predicted warming, it is likely to have consequences
for the recruitment of the species in its northern distribution. Below, we discuss
some of them.
5.5.2.1 Advance of germination
Emergence has been recognized to be a key stage that will set the context for
subsequent development and natural selection (Verdú & Traveset 2005, Donohue et
al. 2010). Therefore, earlier emergence in response to warmer future temperatures
may result in a longer growing season providing seedlings with more time for
development and establishment before the onset of adverse autumn conditions
(Jones et al. 1997, Castro 2006, Richter et al. 2012a, Matías & Jump 2014). In addition,
if warming is linked to adequate precipitation and does not cause resource
limitation, it could increase tree metabolic processes in the subsequent seedling
stages that, in turn, would lead to higher biomass accumulation (McMahon et al.,
2010). Hence, our results, together with the predictions for Scotland, where increase
of temperature is not expected to exceed the optimal and water availability is not
predicted to decrease, suggest that warming and its consequent advancement of

Chapter 5
222
emergence might have a consistent positive effect in early recruitment across the
Scottish distribution. As a counterpoint, this positive effect does not remove the risk
of late spring frost at higher latitudes, so seedlings emerging earlier in the growing
season may be vulnerable to cold damage. The interaction between population and
warming in emergence for BE(W), which germinated faster than the rest of the
populations, could potentially be site-specific.
5.5.2.2 Biomass and above & below ground traits
The effect of warming was not only observed in emergence, but in most of the traits.
However, warming did not cause shifts in carbon allocation biomass (RMF), except
for the population BE(W), which shifted towards belowground biomass. Contrasting
sensitivity of carbon allocation in response to temperature has been described
previously, where greater biomass was allocated to shoots (Cerasoli et al. 2014),
roots (Delucia et al. 1994, Domisch et al. 2001, Pumpanen et al. 2012, Matías et al.
2016) or with no change (Overdieck et al. 2007). Furthermore, for Scots pine, when
the increase in temperature was combined with low water availability, a greater
investment in roots was usually found (Richter et al. 2012b, Matías et al. 2016).
Therefore, the lack of shift in biomass allocation for most populations in our study
could be related to the absence of water limitation. However, it remains unclear why
BE(W) was the only population that shifted towards belowground biomass,

The role and processes shaping natural selection
223
although interestingly it was also the only population that showed an interaction for
emergence under warming conditions.
Warmer temperatures had a strong effect on the below-ground system, with an
increase in the length of roots, greater number of tips and forks as well as an increase
in the root diameter. The growth of fine roots, which are primary organs for water
and nutrient acquisition and are responsible for transferring resources between
below-ground and above-ground parts, is usually positively correlated with
temperature -below suboptimal limits- and also with nutrient uptake, root
respiration and root mortality (Pregitzer et al. 2000). Hence, an increase in the root
system under warmer conditions is not unusual. However, the amount of root
length that was built per unit of root mass, as indicated by SRL did not change
(except for BE(W)). This is in agreement with the results found by Alvarez-Uria &
Körner (2007) who also reported a marked effect of temperature on root growth but
lack of response of root quality, as reflected by SRL. This indicated that there was no
short-term change in dry matter investment per unit of root length for soil
exploration in cold vs. warm soil and is likely to be a reflection of the uniform
nutrient supply provided to all plants. Interestingly, branching intensity, which
governs exploration through the soil matrix and thus may also affect nutrient
acquisition, was reduced under warmer conditions. Some authors have previously
attributed the relation of higher root branching (Alvarez-Uria & Körner 2007) and
higher root growth (Reich et al., 2014) with greater tolerance of cold environments.

Chapter 5
224
Thus, the simulated warmer conditions (FT) might have favoured the reduction of
root branching, which is in agreement with the adaptive response of investing less in
roots and reducing branching in warmer western populations in comparison to
eastern ones (significantly different at FT for BRI).
In terms of above-ground organs, an increase of stomata rows was observed under
warmer conditions, and this was positively correlated with the increase in needle
width. In contrast, some previous results have mentioned that warmer temperatures
resulted in a reduction in stomatal numbers in recently collected individuals
compared with those collected many years before and preserved as herbarium
specimens (Beerling & Chaloner 1993) although this was also usually associated with
an increase of CO2 over recent decades. Levels of CO2 were kept constant in our
experiment. Number of stomata should be governed by a trade-off between
obtaining sufficient CO2 and water loss: higher CO2 would imply less need for
apertures so stomata density can be reduced. As CO2 is stable in the control
environmental facilities, warmer temperature but no changes in CO2 might explain
the increase in the number of stomatal rows. If the opportunity to reduce stomatal
number is not provided, then there is still an impetus to increase numbers to obtain
more CO2 as metabolic potential (more tissue building possible) rises with
temperature. Nevertheless, it seems plausible that confounding effects of
temperature and CO2 might be expected under more realistic warming conditions.

The role and processes shaping natural selection
225
5.5.2.3 Impacts of genetic variation
Our results showed that the CVA estimates shifted under the warmer temperature
treatment, however, traits did not respond homogenously to novel environments
(i.e. FT in our experiment). In particular, CVA estimates increased in the majority of
the traits under FT, but it declined for some root traits. Exposure to stress or novel
conditions have the potential to release cryptic genetic variation (Hoffmann & Merilä
1999, Gibson & Dworkin 2004, Donnelly et al. 2016). The FT conditions might have
therefore promoted the release of cryptic variation. However, the opposite response
was found for some root traits and the reason for such trend remains unclear. We
also found that western and eastern populations responded consistently to
experimental warming (no interaction between temperature and region for most
traits), which indicates that the level of cryptic genetic variation did not vary among
regions or populations and similar capacities for phenotypic plasticity. Only RMF
and FOR showed some interaction, but in the case of RMF it was the result of the
shift of only one population BE(W). Similarly, the shift in heritabilities was not
consistent, as it shifted either downward or upward for given traits under the
warmer temperature treatment.
Overall, the results reported in this study suggest that a decline of the Scottish
populations of Scots pine under a warmer climate due to poor seedling recruitment –
emergence and early growth traits- seems unlikely. Although our results are

Chapter 5
226
informative regarding the extent of phenotypic plasticity and adaptive potential in
the populations, it is not possible to draw conclusions at the community level. Along
with Scots pine, other species might benefit from warming, and the overall increase
in success of Scots pine may not be realised if other species in the community also
thrive. Furthermore, common garden trials and experimental set ups might prevent
some natural disturbances, such us wind, spring forest, humidity diurnal variation
or herbivore and pathogen attack, which might result in additional trade-offs not
detected here (e.g. bigger early growth might be more vulnerable to wind and
herbivores). Therefore, our results must be taken with caution, and more research is
needed to better understand how adaptive responses in Scots pine might be
modulated by interactions with other species and environmental factors not tested
here.
5.5.3 Conclusions
In this study we investigated adaptive variation in early growth traits from western
and eastern Scottish populations of Scots pine, and its response to projected climate
conditions. We provide evidence to show that substantial levels of adaptive genetic
variation are present in populations of Scots pine from both western and eastern
Scotland. Adaptive genetic variation was usually larger within than among
populations and regions, resulting in most traits being highly heritable, which might
allow populations to genetically adapt to warmer conditions. We found some

The role and processes shaping natural selection
227
evidence of cryptic genetic variation, especially in above ground traits, although all
traits did not respond homogenously to novel environments. We found no evidence
of differential response to warming among western and eastern populations -
revealing that the level of cryptic genetic variation did not vary among regions or
populations and a similar capacity for phenotypic plasticity under experimental
warming. Therefore, if temperature predictions are met, it seems that early stages of
Scottish populations of Scots pine are likely to benefit from warmer conditions.
However, the added response of other species in the community and associated
trade-offs, might determine the future of the adult populations of Scots within the
community.
5.6 Acknowledgements
We would like to thank S. Meeus, E. Bush, M. Aulló, P. Ruiz-Benito, S. Greenwood, P.
Oliveira & K. Zapata for help in field work and data collection; A. Vilá-Cabrera and
A. Butler for advice on statistical analysis. We thank the Scottish Forestry Trust,
University of Stirling and Centre for Ecology and Hydrology for co-funding this
research. We are grateful to COST action FP1102 MaP-FGR (http://map-
fgr.entecra.it/) for supporting researcher mobility during this project.
5.7 References
Abramoff M, Magalhaes P, and Ram S (2004) Image processing with imageJ.
Biophotonics International, 11:36–42.

Chapter 5
228
Alberto FJ, Aitken SN, Alía R, González-Martínez SC, Hänninen H, Kremer A,
Lefèvre F, Lenormand T, Yeaman S, Whetten R, Savolainen O (2013) Potential
for evolutionary responses to climate change - evidence from tree populations.
Glob Chang Biol 19:1645–61
Alvarez-Uria P, Körner C (2007) Low temperature limits of root growth in deciduous
and evergreen temperate tree species. Funct Ecol 21:211–218
Anderson JT (2016) Plant fitness in a rapidly changing world. New Phytol 210:81–87
Andersson B, Fedorkov A (2004) Longitudinal differences in Scots pine frost
hardiness. Silvae Genet 53:76–80
Arft AM, Walker MD, Gurevitch J, Alatalo JM, Bret-Harte MS, Dale M, Diemer M,
Gugerli F, G.H.G. H, Jones MH, Hollister RD, Jonsdittir IS, Laine K, Levesque E,
Marion GM, Molau U, Molgaard P, Nordenhall U, Raszhivin V, Robinson CH,
Starr G, Stenstrom A, Stenstrom M, Totland O, Turner PL, Walker LJ, Webber
PJ, Welker JM, Wookey PA (1999) Responses of tundra plants to experimental
warming: meta-analysis of the intenational tundra experiment. Ecol Monogr
69:491–511
Beerling DJ, Chaloner WG (1993) The impact of atmospheric CO2 and temperature
change on stomatel density: Observations from Quercus robus Lammas leaves.
Ann Bot 71:231–235
Benito Garzón M, Alía R, Robson TM, Zavala M a. (2011) Intra-specific variability
and plasticity influence potential tree species distributions under climate
change. Glob Ecol Biogeogr 20:766–778
Bolnick DI, Amarasekare P, Araújo MS, Bürger R, Levine JM, Novak M, Rudolf
VHW, Schreiber SJ, Urban MC, Vasseur D a (2011) Why intraspecific trait
variation matters in community ecology. Trends Ecol Evol 26:183–92
Brewer CA, Nuñez CI (2007) Patterns of leaf wettability along an extreme moisture
gradient in Western Patagonia , Argentina. Int J Plant Sci 168:555–562
Castro J (1999) Seed mass versus seedling performance in Scots pine: a maternally
dependent trait. New Phytol 144:153–161

The role and processes shaping natural selection
229
Castro J (2006) Short delay in timing of emergence determines establishment success
in Pinus sylvestris across microhabitats. Ann Bot 98:1233–40
Cerasoli S, Wertin T, McGuire MA, Rodrigues A, Aubrey DP, Pereira JS, Teskey RO
(2014) Poplar saplings exposed to recurring temperature shifts of different
amplitude exhibit differences in leaf gas exchange and growth despite equal
mean temperature. AoB Plants 6:1–9
Chidumayo EN (2007) Implications of climate warming on seedling emergence and
mortality of African savanna woody plants. Plant Ecol 198:61–71
Comas LH, Eissenstat DM (2004) Linking fine root traits to maximum potential
growth rate among 11 mature temperate tree species. Funct Ecol 18:388–397
Comas LH, Eissenstat DM (2009) Patterns in root trait variation among 25 co-existing
North American forest species. New Phytol 182:919–928
Delucia EH, Callaway RM, Schlesinger WH (1994) Offsetting changes in biomass
allocation and photosynthesis in ponderosa pine (Pinus ponderosa) in response to
climate change. Tree Physiol 14:669–677
Domisch T, Finér L, Lehto T (2001) Effects of soil temperature on biomass and
carbohydrate allocation in Scots pine (Pinus sylvestris) seedlings at the beginning
of the growing season. :465–472
Donnelly K, Cavers S, Cottrell JE, Ennos R a. (2016) Genetic variation for needle
traits in Scots pine (Pinus sylvestris L.). Tree Genet Genomes 12:40
Donohue K, Rubio de Casas R, Burghardt L, Kovach K, Willis CG (2010)
Germination, postgermination, adaptation, and species ecological ranges. Annu
Rev Ecol Evol Syst 41:293–319
Dore AJ, Vieno M, Fournier N, Weston KJ, Sutton MA (2006) Development of a new
wind-rose for the British Isles using radiosonde data, and application to an
atmospheric transport model. Q J R Meteorol Soc 132:2769–2784
Gibson G, Dworkin I (2004) Uncovering cryptic genetic variation. Nat Rev 5:681–690
González-Díaz P, Jump AS, Perry A, Wachowiak W, Lapshina E, Cavers S (2017)
Ecology and management history drive spatial genetic structure in Scots pine.

Chapter 5
230
For Ecol Manage 400:68–76
Greenwood S, Chen JC, Chen CT, Jump AS (2015) Temperature and sheltering
determine patterns of seedling establishment in an advancing subtropical
treeline. J Veg Sci 26:711–721
Hajek P, Hertel D, Leuschner C (2013) Intraspecific variation in root and leaf traits
and leaf-root trait linkages in eight aspen demes (Populus tremula and P.
tremuloides). Front Plant Sci 4:415
Harsch MA, Hulme PE, McGlone MS, Duncan RP (2009) Are treelines advancing? A
global meta-analysis of treeline response to climate warming. Ecol Lett 12:1040–
1049
Hatfield JL, Prueger JH (2015) Temperature extremes: Effect on plant growth and
development. Weather Clim Extrem 10:4–10
Hoffmann AA, Merilä J (1999) Heritable variation and evolution under favourable
and unfavourable conditions. Tree 14:96–101
Hoffmann AA, Sgrò CM (2011) Climate change and evolutionary adaptation. Nature
470:479–485
Hogan KP, Smith AP, Saavedra A (1994) Ecotypic differentiation of gas exchange
responses and leaf anatomy in a tropical forest understory shrub from areas of
contrasting rainfall regimes. Tree Physiol 14:819–831
Houle D (1992) Comparing evolvability and variability of quantitative traits.
Hultine AKR, Marshall JD (2000) Altitude trends in conifer leaf morphology and
stable carbon isotope composition. Oecologia 123:32–40
Jones RH, Allen BP, Sharitz RR (1997) Why do early-emerging tree seedlings have
survival advantages?: A test using Acer rubrum (Aceraceae). Am J Bot 84:1714–
1718
Kawecki TJ, Ebert D (2004) Conceptual issues in local adaptation. Ecol Lett 7:1225–
1241
Kullman L (2007) Tree line population monitoring of Pinus sylvestris in the Swedish
Scandes, 1973-2005: implications for tree line theory and climate change ecology.

The role and processes shaping natural selection
231
J Ecol 95:41–52
Lloret F, Peñuelas J, Prieto P, Llorens L, Estiarte M (2009) Plant community changes
induced by experimental climate change: Seedling and adult species
composition. Perspect Plant Ecol Evol Syst 11:53–63
Luo Y, Wang X, Zhang X, Booth H, Lu F ( 1 ) Root:shoot ratios across China’s
forests: Forest type and climatic effects. For Ecol Manage 269:19–25
Mantgem PJ van, Stephenson NL, Byrne JC, Daniels LD, Franklin JF, Fulé PZ,
Harmon ME, Larson AJ, Smith JM, Taylor AH, Veblen TT (2009) Widespread
increase of tree mortality rates in the Western United States. Science (80- ):521–
524
Matías L, González-Díaz P, Jump AS (2014) Larger investment in roots in southern
range-edge populations of Scots pine is associated with increased growth and
seedling resistance to extreme drought in response to simulated climate change.
Environ Exp Bot 105:32–38
Matías L, González-Díaz P, Quero JL, Camarero JJ, Lloret F, Jump AS (2016) Role of
geographical provenance in the response of silver fir seedlings to experimental
warming and drought. Tree Physiol 0:1–11
Matías L, Jump AS (2014) Impacts of predicted climate change on recruitment at the
geographical limits of Scots pine. J Exp Bot 65:299–310
Matías L, Jump AS (2015) Asymmetric changes of growth and reproductive
investment herald altitudinal and latitudinal range shifts of two woody species.
Glob Chang Biol 21:882–96
Matías L, Linares JC, Sánchez-Miranda A, Jump AS (2017) Contrasting growth
forecasts across the geographical range of Scots pine due to altitudinal and
latitudinal differences in climatic sensitivity. Glob Chang Biol:1–11
McVean DN (1963) Ecology of Scots pine in the Scottish Highlands. J Ecol 51:671–686
Milbau A, Graae BJ, Shevtsova A, Nijs I (2009) Effects of a warmer climate on seed
germination in the subarctic. Ann Bot 104:287–96
Oney B, Reineking B, O’Neill G, Kreyling J ( 13) Intraspecific variation buffers

Chapter 5
232
projected climate change impacts on Pinus contorta. Ecol Evol 3:437–49
Overdieck D, Ziche D, Böttcher-jungclaus K (2007) Temperature responses of growth
and wood anatomy in European beech saplings grown in different carbon
dioxide concentrations. Tree Physiology 27:261–268
Peñuelas J, Boada M (2003) A global change-induced biome shift in the Montseny
mountains (NE Spain). Glob Chang Biol:131–140
Pérez-Harguindeguy N, Díaz S, Garnier E, Lavorel S, Poorter H, Jaureguiberry P,
Bret-Harte MS, Cornwell WK, Craine JM, Gurvich DE, Urcelay C, Veneklaas EJ,
Reich PB, Poorter L, Wright IJ, Ray P, Enrico L, Pausas JG, Vos AC de,
Buchmann N, Funes G, Quétier F, Hodgson JG, Thompson K, Morgan HD,
Steege H ter, Heijden MGA van der, Sack L, Blonder B, Poschlod P, Vaieretti M
V, Conti G, Staver AC, Aquino S, Cornelissen JHC (2013) New handbook for
standardised measurement of plant functional traits worldwide. Aust J Bot
61:167–234
Perks MP, Mckay HM (1997) Morphological and physiological differences in Scots
pine seedlings of six seed origins. Forestry 70:223–232
Perry A, Wachowiak W, Brown A V., Ennos RA, Cottrell JE, Cavers S (2016)
Substantial heritable variation for susceptibility to Dothistroma septosporum
within populations of native British Scots pine (Pinus sylvestris). Plant Pathol
65:987–996
Pregitzer K, King JS, Burton AJ, Brown SE (2000) Responses of tree fine roots to
temperature. New Phytol 147:105–115
Pulkkinen P, Vaario L-M, Koivuranta L, Stenvall N (2013) Elevated temperature
effects on germination and early growth of European aspen (Populus tremula),
hybrid aspen (P. tremula × P. tremuloides) and their F2-hybrids. Eur J For Res
132:791–800
Pumpanen J, Heinonsalo J, Rasilo T, Villemot J, Ilvesniemi H (2012) The effects of
soil and air temperature on CO2 exchange and net biomass accumulation in
Norway spruce, Scots pine and silver birch seedlings. Tree Physiol 32:724–36

The role and processes shaping natural selection
233
Reich PB, Luo Y, Bradford JB, Poorter H, Perry CH, Oleksyn J (2014) Temperature
drives global patterns in forest biomass distribution in leaves, stems, and roots.
Proc Natl Acad Sci U S A 111:13721–13726
Reich PB, Oleksyn J (2008) Climate warming will reduce growth and survival of
Scots pine except in the far north. Ecol Lett 11:588–97
Reich PB, Oleksyn J, Tjoelker MG (1994) Seed mass effects on germination and
growth of diverse European Scots pine populations. Can J For Res 24:306–320
Reyes O, Casal M (2002) Effect of high temperatures on cone opening and on the
release and viability of Pinus pinaster and P. radiata seeds in NW Spain. Ann For
Sci 59:327–334
Righter FI (1945) Pinus: the relationship of seed size and seedling size to inherent
vigor. J. For. 43(2): 131-137.
Richter S, Kipfer T, Wohlgemuth T, Calderón Guerrero C, Ghazoul J, Moser B
(2012a) Phenotypic plasticity facilitates resistance to climate change in a highly
variable environment. Oecologia 169:269–79
Richter S, Kipfer T, Wohlgemuth T, Calderón Guerrero C, Ghazoul J, Moser B
(2012b) Phenotypic plasticity facilitates resistance to climate change in a highly
variable environment. Oecologia 169:269–79
Salmela MJ, Cavers S, Cottrell JE, Iason GR, Ennos R a. (2011) Seasonal patterns of
photochemical capacity and spring phenology reveal genetic differentiation
among native Scots pine (Pinus sylvestris L.) populations in Scotland. For Ecol
Manage 262:1020–1029
Salmela MJ, Cavers S, Cottrell JE, Iason GR, Ennos RA (2013) Spring phenology
shows genetic variation among and within populations in seedlings of Scots
pine (Pinus sylvestris L.) in the Scottish Highlands. Plant Ecol Divers 6:523–536
Salmela MJ, Cavers S, Wachowiak W, Cottrell JE, Iason GR, Ennos R a. (2010)
Understanding the evolution of native pinewoods in Scotland will benefit their
future management and conservation. Forestry 83:535–545
Savolainen O, Lascoux M, Merilä J (2013) Ecological genomics of local adaptation.

Chapter 5
234
Nat Rev Genet 14:807–20
Schupp EW (1995) Seed-seedling conflicts, habitat choice , and patterns of plant
recruitment. Am J Bot 82:399–409
Seiwa K, Kikuzawa K (1996) Importance of seed size for the establishment of
seedlings of five deciduous broad-leaved tree species. Vegetatio 123:51–64
Sinclair WT, Morman JD, Ennos RA (1998) Multiple origins for Scots pine (Pinus
sylvestris L.) in Scotland: evidence from mitochondrial DNA variation. Heredity
(Edinb) 80:233–240
Valladares F, Matesanz S, Guilhaumon F, Araújo MB, Balaguer L, Benito-Garzón M,
Cornwell W, Gianoli E, Kleunen M van, Naya DE, Nicotra AB, Poorter H,
Zavala M a. (2014) The effects of phenotypic plasticity and local adaptation on
forecasts of species range shifts under climate change (W Thuiller, Ed.). Ecol
Lett 17:1351–1364
Verdú M, Traveset A (2005) Early emergence enhances plant fitness: a
phylogenetically controlled meta-analysis. Ecology 86:1385–1394
Visscher PM (1998) On the sampling variance of intraclass correlations and genetic
correlations. 1614:1605–1614
Vizcaíno-Palomar N, Revuelta-Eugercios B, Zavala MA, Alía R, González-Martínez
SC (2014) The role of population origin and microenvironment in seedling
emergence and early survival in Mediterranean maritime pine (Pinus pinaster
Aiton). PLoS One 9:e109132
Wachowiak W, Salmela MJ, Ennos RA, Iason G, Cavers S (2011) High genetic
diversity at the extreme range edge: nucleotide variation at nuclear loci in Scots
pine (Pinus sylvestris L.) in Scotland. Heredity (Edinb) 106:775–787
Walck JL, Hidayati SN, Dixon KW, Thompson K, Poschlod P (2011) Climate change
and plant regeneration from seed. Glob Chang Biol 17:2145–2161
Wilmking M, Juday GP, Barber V a., Zald HSJ (2004) Recent climate warming forces
contrasting growth responses of white spruce at treeline in Alaska through
temperature thresholds. Glob Chang Biol 10:1724–1736

The role and processes shaping natural selection
235
5.8 Supplementary material
S5.1 Traits and indexes used in the analysis.
TRAIT/INDEX ABBREVIATION DESCRIPTION
Seed viability SEV Percentage of viable seeds (full seeds as a proxy of viable seeds) (%)
Seed weight SEW Mean weight of seeds (mg)
Emergence EME Day of emergence (day)
Survival SUR Percentage of survival (%)
Total Dry Biomass TDB Shoot Dry biomass + Root Dry biomass (g)
Shoot Height SHL Length of shoot (mm)
Root Depth ROL Depth of root (mm)
Root Mass Fraction RMF Root Dry biomass/Total Dry biomass
Total Root Length TRL Total root length (cm-1)
Average diameter AVD Average root diameter (mm)
Root Volume ROV Total Root Volume (cm3)
Tips TIP Number of tips
Forks FOR Number of forks
Branching intensity BRI Number of tips/ Total root length (cm-1)
Specific Root Area SRA Surface area (winrhizo) / Root dry biomass (m2*g-1)
Specific Root Length SRL Total root length (winrhizo) / dry biomass root (m*g-1)
Needle Length NEL Length of needle (mm)
Needle Width NEW Width of needle (mm)
Stomata rows STO Mean number of stomata rows in 5 needles

Chapter 5
236

Chapter 6
General discussion

237
Photos in Chapter 6 main page taken from P. González-Díaz

General discussion
237
6.1 Overview
The research presented in this thesis focuses on the ecologically and economically
important tree species, Scots pine (Pinus sylvestris L.), the most widely distributed
pine species in the world and a keystone species in areas of its distribution, such us
in Britain. The aim of this research was to determine how different forces interact to
shape and maintain within and among population genetic diversity of Scots pine
from local to continental scales and how these might be impacted by future
environmental changes. Two key approaches shaped the research undertaken.
Firstly, we assessed neutral and adaptive genetic variation of Scots pine and the
forces influencing such variation. In particular, we assessed historical and
contemporary forces, such us climate and geographical variation together with
human management that influence gene flow and selection and impact genetic
diversity. Secondly, the study was undertaken at a range of spatial scales,
investigating continental processes to regional and fine-scale within-population
effects on the structure of Scots pine populations.
6.2 From legacies of the past to predictions for the future
The processes shaping historical migration and colonisation
Historical changes in climate influence the presence and absence of species over time
(Davis 1986, Hewitt 2004) while recolonisation processes determine the amount and
distribution of diversity in post-glacial populations (Hewitt 2003). The research in

Chapter 6
238
chapter 2 has advanced our understanding of the dynamics of Scots pine historical
migration and colonisation. In particular, chapter 2 used a novel approach
combining genetic and palaeoenviromental data to cast light on the Holocene
migrations and the forces shaping such migrations. The research presented in this
chapter improves our understanding of both the spatial and temporal occurrence
and associated genetic structure of Scots pine at the continental scale.
In chapter 2 we observed how historic climate changes and geographical barriers
have played an important role determining migration and colonisation routes and,
as a consequence, in shaping the extent and spatial distribution of current genetic
diversity of Scots pine at the continental scale. Our results provide greater resolution
of the role of refuge areas in Holocene migrations of Scots pine and likely sources of
colonisation. In particular, we agreed with most previous studies in the absence of
contribution from populations originated in Italy and Asia Minor (Labra et al. 2006,
Naydenov et al. 2007, Bilgen & Kaya 2007, Provan & Bennett 2008, Scalfi et al. 2009,
Belletti et al. 2012, Dering et al. 2017) and confirm the contribution from Balkan
populations to the central and northern European colonisation (Cheddadi et al. 2006,
Prus-Glowacki et al. 2012). However, our results prompt a change in the view of the
contribution of Iberian populations. We found some evidence to suggest a likely
contribution of some Iberian populations to European colonisation, which in turn,
might have contributed to the multiple origins of the most north-western
populations, likely based on an admixture event between colonising fronts

General discussion
239
originating from central-northern and south western European populations (i.e.
northern Iberian or southern France) previous to the subsequent British migration.
The research in chapter 2 benefitted from a robust approach using multiple data
sources in both species distribution modelling and phylogeographic analysis.
Furthermore, the combination of both data analyses allowed us to dissentagle the
effect of different climatic periods on spatial genetic structure, as the observed
patterns may result from the interplay among processes acting at different temporal
scales (Mayol et al. 2015). Specifically, each data analysis contributed in a different
way, (i) palaeoenviromental data allow us to evaluate the effect of specific climatic
conditions on neutral genetic diversity in a given period by testing each period
separately, and (ii) phylogeographic analysis through a Bayesian framework allows
us to estimate the time of the inferred demographic processes.
As species ranges have been and continue to be highly dynamic, the study of past
forest change provides necessary historical context for evaluating the outcome of
human-induced climate change and biological invasions (Petit et al. 2008). Therefore,
the results obtained in chapter 2 have further developed our understanding about
the historical forces shaping colonisation and its resultant genetic consequences.
Those forces, such us geographic barriers and climate which determined the speed
of migration, the existence of climate relicts, the likely existence of cryptic refugia,
the presence of admixture events or successive bottlenecks, provide a better
understanding to evaluate likely consequences of novel forthcoming conditions.

Chapter 6
240
The role and processes shaping contemporary gene flow
Population structure isn´t static but dependent on changes in population size and
connectivity over time and space (Hamrick et al. 1992). The research in chapter 3
aimed to assess how gene flow and genetic drift interact to shape and maintain
genetic diversity at a regional scale in the remaining natural fragments of Scots pine
in the British Isles, which represent here the north-western limit of the vast Eurasian
distribution.
Habitat fragmentation and destruction is recognized as one of the major threats to
forest biodiversity (Lowe et al. 2005, Kramer et al. 2008). However, in chapter 3 we
found that, despite historic reduction in abundance and the resulting geographical
isolation of populations, high levels of neutral genetic diversity and low levels of
population differentiation remain in the Scottish populations of Scots pine, with no
evidence to suggest that any of the populations analysed here are genetically at risk.
These findings suggest that effective population size, together with extensive gene
flow and specifically wind-driven gene flow, has been high enough to limit the
effects of range fragmentation and genetic drift. It has been previously argued that
forest trees might show high genetic resilience in fragmented habitats (Hamrick
2004), and that despite potential barriers to gene flow such as population
fragmentation (White et al. 2002, Petit & Hampe 2006, Wang et al. 2012, Davies et al.
2013) or phenological asynchrony, gene flow among populations can still be
sufficient to counteract their genetic isolation. Our results confirmed such proposals.

General discussion
241
In the context of recent findings of pollen asynchronies, we also detected that, gene
flow patterns and geographic distribution of genetic variation were consistent with
gene dispersal limitation due to prevailing wind patterns. This finding, together
with the weak signal of isolation by distance among the Scottish populations,
suggested that although some spatial limitation of gene dispersal occurs, gene flow
is extensive and with a directional bias towards the East.
The role and processes shaping regeneration and establishment at the
local scale
Anthropogenic impacts must be considered alongside geographical and climatic
drivers in order to understand current population structures. Chapter 4 presents the
first study in Scots pine addressing impacts of historic forest management practices
on fine-scale spatial genetic structure. Our results provide evidence to show that
although overall levels of genetic diversity in historically managed populations can
be similar to unmanaged populations and as high as continental populations, spatial
genetic structure can be considerably altered. Our research suggests that intense
management practices that remove trees from the stand, such as felling, could alter
fine-scale patterns of gene flow and increase genetic relatedness of individuals at
fine scales with implications for inbreeding levels and, potentially, long-term
adaptability. As a consequence, the extent of family clusters can be modified, as for
instance in our study which increased up to 40 metres in managed sites compared

Chapter 6
242
with almost no structure in unmanaged sites. Those results have implications for
forest management strategies, such as seed collection strategies or spatial
configuration of tree planting and selective felling.
Research in chapter 4 has developed our understanding of the early dynamics of
Scots pine populations. The reduction of spatial genetic structure observed in
juveniles following contemporary management to promote regeneration, indicates a
high capacity of the species to recover after intense forest management. Those results
highlight that ensuring large effective population sizes is key to successfully
maintaining genetic diversity in Scots pine.
The use of a medium-high number of individuals within populations and cohorts
(N=57-181 in our study) provided power in our research to detect fine-scale spatial
genetic structure, which has been previously acknowledge as a prerequisite to obtain
reliable inferences in these spatial analysis (Cavers et al. 2005, Jump & Peñuelas
2007). However, an in-depth representation within stand and cohort was a trade off
against the capability to increase site replication. Although we obtained a consistent
pattern in managed stands, and a pattern in unmanaged stands comparable with
natural stands in other studies, ideally a greater representation of sites would be
assess in the future to generalize the genetic spatial trend of Scots pine in a wider
context.

General discussion
243
The role and processes shaping natural selection
Implicit in the idea of changes on distribution over time is that, individuals are
subject to different conditions over space. Given high diversity, selection is also a
fundamentally important component of contemporary population structure. The
research in chapter 5 aimed to characterize the intraspecific adaptive variation in
Scots pine early growth traits at a regional scale, from populations originating from
contrasting environmental conditions within Scotland and to estimate the likely
response of those populations to projected climate change.
In chapter 5 we found that substantial levels of adaptive genetic variation are
present in the Scottish populations of Scots pine within and among populations and
regions. This finding is likely a result of selective processes resulting from the
different environments they live in, in combination with high trait heritability.
Previous studies have shown that a very large proportion of variability lies within
populations, both at neutral (Forrest 1980, Kinloch et al. 1986, Provan et al. 1998,
Wachowiak et al. 2011) and at the adaptive variation levels (Perks & Mckay 1997,
Salmela et al. 2013, Donnelly et al. 2016) and our findings confirmed this pattern.
Chapter 5 presents the most comprehensive research of Scots pine adaptive diversity
response to predicted temperature conditions in Britain. We observed that warmer
conditions had strong effects on early growth traits by advancing germination and
enhancing above and below-ground biomass by up to a factor of ten. However, we

Chapter 6
244
observed that there was a consistent response to warmer temperature in populations
from both western and eastern Scotland. Therefore, our results did not support
differential levels of cryptic genetic variation among western and eastern Scots pine
populations. Consequently, if temperature predictions are met, it seems that early
stages of Scottish populations of Scots pine are all likely to benefit from warmer
conditions.
Using controlled environment experiments enabled us to exclude environmental
variation, and determine how much variation is genetically determined. However,
controlled environment studies also exclude other factors, such us the added
response of other species in the community and associated trade-offs which, if
included, might determine the future of the adult populations of Scots within the
community. In the future, it would be desirable to explore other factors influencing
the response of early traits under forthcoming environmental conditions.
The large within-population representation was again a trade off against the
capability to increase site number. This compromise was determined to represent an
in-depth sampling scheme within populations, to have a greater resolution to
explore processes acting at local or regional scales (Donnelly et al. 2016).

General discussion
245
6.3 General synthesis
In this thesis a combination of observational and experimental approaches has
shown that within population diversity (both neutral and adaptive) is high in the
studied Scots pine populations, and higher than levels of among population
variation, which is usual in trees (Forrest 1980, Kinloch et al. 1986, Provan et al. 1998,
Wachowiak et al. 2011, Perks & Mckay 1997, Salmela et al. 2013, Donnelly et al.
2016). Taken together these findings from adaptive variation (Chapter 5) and neutral
genetic variation (Chapters 2, 3 and 4), show that although gene flow may counteract
genetic drift and restrict local adaptation, adaptive divergence may still take place
under strong selective pressure. This assumption agrees with previous assumptions
(Savolainen et al. 2007) and supports previous studies that suggest that adaptive
divergence might have occurred in the Scottish populations of Scots pine (Salmela et
al. 2013, Donnelly et al. 2016).
The research presented in this thesis has shown that the movement of Scots pine
through the continent and at a regional scale has been largely driven by natural
processes (Chapter 2, 3 and 5). However, long-standing human impacts have
modified the spatial configuration of populations with no changes in overall levels
of genetic variation (Chapter 3 and 4), but modification of local patterns of genetic
variation (Chapter 4).
By using data from different spatial scales, we were able to observe patterns

Chapter 6
246
resulting from the interplay among processes acting at different temporal scales.
Therefore, in chapter 2, continental data and the combined used of
palaenvironmental and phylogeographic analysis allowed us to detect historical
forces acting during the last period of major climate change. Complementary to this
work, regional genetic data in Chapter 3 allowed us to detect contemporary
processes influencing neutral genetic diversity. Furthermore, the use of different
cohorts in Chapter 4 also allowed us to disentangle processes acting at different
temporal scales. Adults showed processes acting in the recent past (i.e. when they
first established, approximately 200 years ago), whereas juveniles served as
interpreters of the present. As a consequence, adults identified that historical forest
management practices have influenced fine-scale spatial genetic structure of Scots
pine stands, whereas juveniles showed a high capacity to recover after disturbance.
Finally, by using experimental conditions, we were able to project future conditions,
and to evaluate the effect of current and likely predicted climate on early growth at
regional scales.
Contemporary local dynamics shaped the genetic layout of regeneration in managed
stands in chapter 4, suggesting a high capacity of Scots pine to recover after
disturbances. This finding, together with the strong effects of predicted temperature
on early growth shown in chapter 5, might have implications for forest resilience
and establishment such as the creation of abundant and diverse recruitment banks
which might maximize their potential to adapt to a changed environment. This

General discussion
247
potential will be particularly important in the context of climate change (Millar et al.
2007, Hoffmann & Sgrò 2011, Alfaro et al. 2014, Fady et al. 2016) under which
selection pressures are expected to change and highlights the importance of the
conservation of genetic sources.
6.4 Future research and conclusions
By exploring interactions between climate, geographical variation and human
activity, our results help to further disentangle the forces maintaining genetic
diversity in one of the most widespread conifers in the world. The research in this
thesis improves our understanding of impacts of migration and selection on Scots
pine and will allow us to refine predictions of the impact of future range shifts in
response to contemporary climate changes. Our findings have practical application
for forest management and implications for future research, as outlined below.
(1) This research highlights the importance of maintaining large effective population
sizes (Chapter 3 & 4), especially in geographically marginal populations, to increase
the probability of forest persistence.
(2) Bias in gene dispersal due to prevailing wind patterns and the likely landscape
impacts on genetic diversity in the Scottish populations should be taken into account
when designing afforestation strategies or determining priorities in conservation and
management plans.

Chapter 6
248
(3) Although there was no evidence to suggest that any of the populations analysed
here are genetically at risk, the extensive establishment of Scots pine plantations, at
least in Scottish lands, based upon a system of clear felling and artificial regeneration
(Mason 2000) might alter local patterns of gene flow leading to impacts in the
diversity and structure of subsequent generations of native Scots pine.
Consequently, future monitoring of both neutral and adaptive genetic diversity
should focus on addressing levels and structure of genetic variation in Scots pine
plantations and surroundings. The monitoring of genetic diversity could follow the
schemes mentioned in chapter 1 (Graudal et al. 2014, Aravanopoulos et al. 2015).
(4) Guidelines for Scots pine seed collection should aim for minimum sampling
distances between mother trees of at least 40 metres, in order to ensure a broad
sample of genetic variability.
(5) The study of the spatial component of genetic diversity alongside tree
demographic structure can help to detect both historical and contemporary effects of
disturbances in tree populations, which is highly recommended when evaluating the
effects of forest management practices. The evaluation of successional change is also
essential to properly assess genetic dynamics within populations and to adequately
detect early responses to forest management practices.
(6) Although chapter 5 suggested that, if temperature predictions are met, early
stages of Scottish populations of Scots pine are likely to benefit from warmer
conditions, the added response of other species in the community and associated

General discussion
249
trade-offs, might determine the future of the adult populations of Scots within the
community. Therefore, we recommend exploration of other forces and processes that
might influence early growth.
(7) In chapter 5 we evaluated early growth traits during the first growing season,
however, long-term experiments among native Scots pine forest from Scotland to
explore the likely consequences of climate change and the evidence and extent of
adaptive divergence would be desirable.
In summary, although a considerable amount of prior research has focussed on
phylogeography and descriptive analyses of the levels and structure of neutral
genetic variation, together with provenance trials, the work presented here makes a
specific advance in the following areas: (i) continental processes during Holocene
migrations (ii) contemporary fine-scale processes, (iii) historical and recent
management practices influence, (iv) processes acting within and among
populations and (iv) potential responses to forthcoming environmental conditions.
These findings leave us with a better understanding not only into the evolutionary
aspects of Scots pine but the potential consequences of the combination of
contemporary human and environmental factors. The findings of this thesis can help
to make better management decisions in the future of Scots pine, with the aim to
preserve both neutral and adaptive variation at global and local scales and safeguard
Scots pine forest diversity for future generations.

Chapter 6
250
6.5 References
Alfaro RI, Fady B, Vendramin GG, Dawson IK, Fleming RA, Sáenz-Romero C,
Lindig-Cisneros RA, Murdock T, Vinceti B, Navarro CM, Skrøppa T, Baldinelli
G, El-Kassaby YA, Loo J (2014) The role of forest genetic resources in
responding to biotic and abiotic factors in the context of anthropogenic climate
change. For Ecol Manage 333:76–87
Aravanopoulos FA, Tollefsrud MM, Kätzel R, Soto A, Graudal L, Nagy L, Koskela J,
Bozzano M, Pilipovic A, Zhelev P, Boži G (2015) Development of genetic
monitoring methods for genetic conservation units of forest trees in Europe
(European Forest Genetic Resources Programme (EUFORGEN), Ed.).
Biodiversity International, Rome, Italy
Belletti P, Ferrazzini D, Piotti A, Monteleone I, Ducci F (2012) Genetic variation and
divergence in Scots pine (Pinus sylvestris L.) within its natural range in Italy.
Eur J For Res 131:1127–1138
Bilgen BB, Kaya N (2007) Allozyme variations in six natural populations of scots
pine (Pinus sylvestris) in Turkey. Biologia (Bratisl) 62:697–703
Cavers S, Degen B, Caron H, Lemes MR, Margis R, Salgueiro F, Lowe AJ (2005)
Optimal sampling strategy for estimation of spatial genetic structure in tree
populations. Heredity (Edinb) 95:281–289
Cheddadi R, Vendramin GG, Litt T, Kageyama M, Lorentz S, Laurent J, Beaulieu J
De, Sadori L, Jost A, Lunt D (2006) Imprints of glacial refugia in the modern
genetic diversity of Pinus sylvestris. Glob Ecol Biogeogr:271–282
Davies SJ, Cavers S, Finegan B, White A, Breed MF, Lowe AJ (2013) Pollen flow in
fragmented landscapes maintains genetic diversity following stand-replacing
disturbance in a neotropical pioneer tree, Vochysia ferruginea Mart. Heredity
(Edinb) 115:125–129
Davis MB (1986) Climatic instability, time lags, and community disequilibrium. In:
Diamon J, Case TJ (eds) Community ecology. Harper & Row, New York, p 269–

General discussion
251
284
Dering M, Kosiński P, Wyka TP, Pers E, Boratyński A, Boratyńska K, Reich PB,
Romo A, Zadworny M, Żytkowiak R, Oleksyn J (2017) Tertiary remnants and
Holocene colonizers: Genetic structure and phylogeography of Scots pine reveal
higher genetic diversity in young boreal than in relict Mediterranean
populations and a dual colonization of Fennoscandia. Divers Distrib:540–555
Donnelly K, Cavers S, Cottrell JE, Ennos R a. (2016) Genetic variation for needle
traits in Scots pine (Pinus sylvestris L.). Tree Genet Genomes 12:40
Fady B, Cottrell J, Ackzell L, Alía R, Muys B, Prada A, González-Martínez SC (2016)
Forests and global change: what can genetics contribute to the major forest
management and policy challenges of the twenty-first century? Reg Environ
Chang 16:927–939
Forrest GI (1980) Genotypic variation among native Scots pine populations in
Scotland based on monoterpene analysis. Forestry 53:101–128
Graudal L, Aravanopoulos F, Bennadji Z, Changtragoon S, Fady B, Kjær ED, Loo J,
Ramamonjisoa L, Vendramin GG (2014) Global to local genetic diversity
indicators of evolutionary potential in tree species within and outside forests.
For Ecol Manage 333:35–51
Hamrick JL (2004) Response of forest trees to global environmental changes. For Ecol
Manage 197:323–335
Hamrick JL, Godt MJW, Sherman-Broyles SL (1992) Factors influencing levels of
genetic diversity in woody plant species. New For 6:95–124
Hewitt, G. M. 2003 Ice ages: their impact on species distri- butions and evolution. In
Evolution on planet Earth (ed. L. J. Rothschild & A. M. Lister), pp. 339–361. New
York: Academic Press
Hewitt GM (2004) Genetic consequences of climatic oscillations in the Quaternary.
Philos Trans R Soc Lond B Biol Sci 359:183–95; discussion 195
Hoffmann AA, Sgrò CM (2011) Climate change and evolutionary adaptation. Nature
470:479–485

Chapter 6
252
Jump AS, Peñuelas J (2007) Extensive spatial genetic structure revealed by AFLP but
not SSR molecular markers in the wind-pollinated tree, Fagus sylvatica. Mol
Ecol 16:925–936
Kinloch B, Westfall RD, Forrest GI (1986) Caledonian Scots pine: origins and genetic
structure. New Phytol 104:703–729
Kramer AT, Ison JL, Ashley M V, Howe HF (2008) The Paradox of Forest
Fragmentation Genetics. Conserv Biol 22:878–885
Labra M, Grassi F, Sgorbati S, Ferrari C (2006) Distribution of genetic variability in
southern populations of Scots pine (Pinus sylvestris L.) from the Alps to the
Apennines. Flora - Morphol Distrib Funct Ecol Plants 201:468–476
Lowe AJ, Boshier D, Ward M, Bacles CFE, Navarro C (2005) Genetic resource
impacts of habitat loss and degradation; reconciling empirical evidence and
predicted theory for neotropical trees. Heredity (Edinb) 95:255–273
Mayol M, Riba M, Gonz SC, Bagnoli F, Beaulieu J De, Berganzo E, Burgarella C,
Dubreuil M, Krajmerov D, Paule L, Rom I, Vettori C, Vincenot L, Vendramin
GG (2015) Adapting through glacial cycles: insights from a long-lived tree
(Taxus baccata). New Phytol:1–14
Millar CI, Stephenson NL, Stephens SL (2007) Climate change and forest of the
future: managing in the face of uncertainty. Ecol Appl 17:2145–2151
Naydenov KD, Senneville S, Beaulieu J, Tremblay F, Bousquet J (2007) Glacial
vicariance in Eurasia: mitochondrial DNA evidence from Scots pine for a
complex heritage involving genetically distinct refugia at mid-northern latitudes
and in Asia Minor. BMC Evol Biol 7:233
Perks MP, Mckay HM (1997) Morphological and physiological differences in Scots
pine seedlings of six seed origins. Forestry 70:223–232
Petit RJ, Hampe A (2006) Some evolutionary consequences of being a tree. Annu Rev
Ecol Evol Syst 37:187–214
Petit RJ, Hu FS, Dick CW (2008) Forests of the past: a window to future changes.
Science 320:1450–2

General discussion
253
Provan J, Bennett KD (2008) Phylogeographic insights into cryptic glacial refugia.
Trends Ecol Evol 23:564–71
Provan J, Soranzo N, Wilson NJ, McNicol JW, Forrest GI, Cottrell JE, Powell W
(1998) Gene-pool variation in caledonian and European Scots pine (Pinus
sylvestris L.) revealed by chloroplast simple-sequence repeats. Proc Biol Sci
265:1697–1705
Prus-Glowacki W, Urbaniak L, Bujas E, Curtu AL (2012) Genetic variation of isolated
and peripheral populations of Pinus sylvestris (L.) from glacial refugia. Flora -
Morphol Distrib Funct Ecol Plants 207:150–158
Salmela MJ, Cavers S, Cottrell JE, Iason GR, Ennos RA (2013) Spring phenology
shows genetic variation among and within populations in seedlings of Scots
pine (Pinus sylvestris L.) in the Scottish Highlands. Plant Ecol Divers 6:523–536
Savolainen O, Pyhäjärvi T, Knürr T (2007) Gene Flow and Local Adaptation in Trees.
Annu Rev Ecol Evol Syst 38:595–619
Scalfi M, Piotti A, Rossi M, Piovani P (2009) Genetic variability of Italian southern
Scots pine (Pinus sylvestris L.) populations: the rear edge of the range. Eur J For
Res 128:377–386
Wachowiak W, Salmela MJ, Ennos RA, Iason G, Cavers S (2011) High genetic
diversity at the extreme range edge: nucleotide variation at nuclear loci in Scots
pine (Pinus sylvestris L.) in Scotland. Heredity (Edinb) 106:775–787
Wang R, Compton SG, Shi Y-S, Chen X-Y (2012) Fragmentation reduces regional-
scale spatial genetic structure in a wind-pollinated tree because genetic barriers
are removed. Ecol Evol 2:2250–2261
White GM, Boshier DH, Powell W (2002) Increased pollen flow counteracts
fragmentation in a tropical dry forest: An example from Swietenia humilis
Zuccarini. Proc Natl Acad Sci U S A 99:2038–2042
Copyright © 2022 FDOKUMEN