Interim financial statements, nine months 2006/07 - Coloplast
Upload
independentCategory
view
0download
0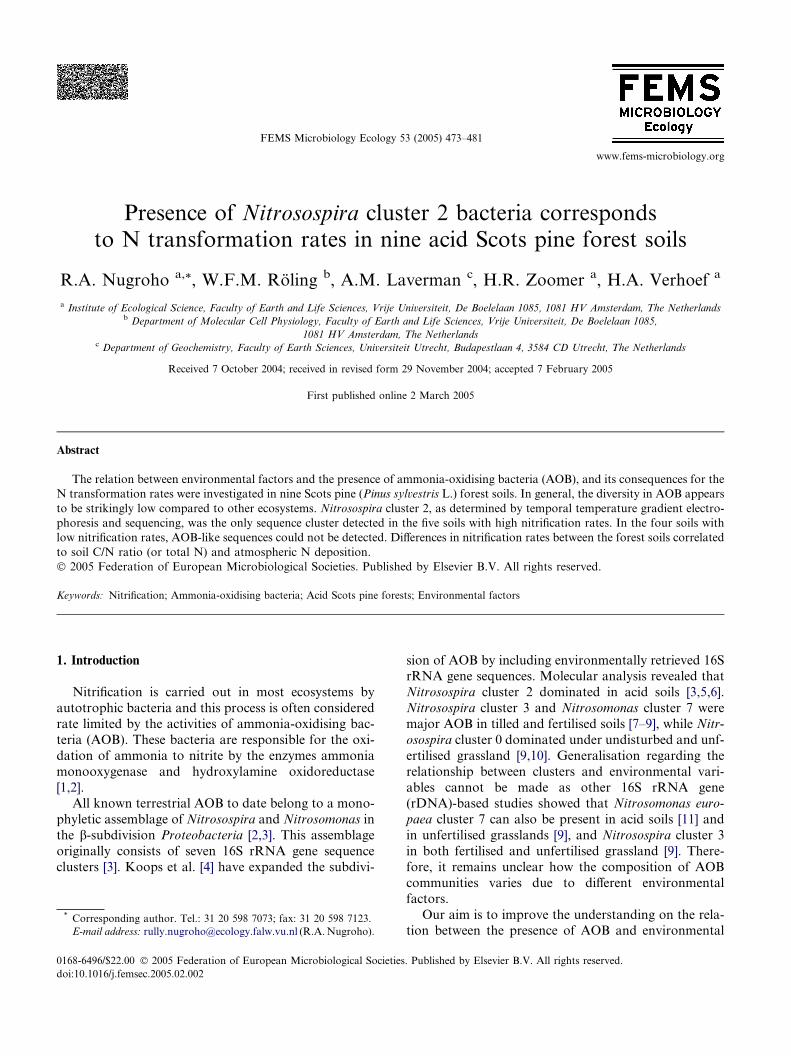
www.fems-microbiology.org
FEMS Microbiology Ecology 53 (2005) 473–481
Presence of Nitrosospira cluster 2 bacteria correspondsto N transformation rates in nine acid Scots pine forest soils
R.A. Nugroho a,*, W.F.M. Roling b, A.M. Laverman c, H.R. Zoomer a, H.A. Verhoef a
a Institute of Ecological Science, Faculty of Earth and Life Sciences, Vrije Universiteit, De Boelelaan 1085, 1081 HV Amsterdam, The Netherlandsb Department of Molecular Cell Physiology, Faculty of Earth and Life Sciences, Vrije Universiteit, De Boelelaan 1085,
1081 HV Amsterdam, The Netherlandsc Department of Geochemistry, Faculty of Earth Sciences, Universiteit Utrecht, Budapestlaan 4, 3584 CD Utrecht, The Netherlands
Received 7 October 2004; received in revised form 29 November 2004; accepted 7 February 2005
First published online 2 March 2005
Abstract
The relation between environmental factors and the presence of ammonia-oxidising bacteria (AOB), and its consequences for the
N transformation rates were investigated in nine Scots pine (Pinus sylvestris L.) forest soils. In general, the diversity in AOB appears
to be strikingly low compared to other ecosystems. Nitrosospira cluster 2, as determined by temporal temperature gradient electro-
phoresis and sequencing, was the only sequence cluster detected in the five soils with high nitrification rates. In the four soils with
low nitrification rates, AOB-like sequences could not be detected. Differences in nitrification rates between the forest soils correlated
to soil C/N ratio (or total N) and atmospheric N deposition.
� 2005 Federation of European Microbiological Societies. Published by Elsevier B.V. All rights reserved.
Keywords: Nitrification; Ammonia-oxidising bacteria; Acid Scots pine forests; Environmental factors
1. Introduction
Nitrification is carried out in most ecosystems by
autotrophic bacteria and this process is often considered
rate limited by the activities of ammonia-oxidising bac-
teria (AOB). These bacteria are responsible for the oxi-
dation of ammonia to nitrite by the enzymes ammonia
monooxygenase and hydroxylamine oxidoreductase
[1,2].All known terrestrial AOB to date belong to a mono-
phyletic assemblage of Nitrosospira and Nitrosomonas in
the b-subdivision Proteobacteria [2,3]. This assemblage
originally consists of seven 16S rRNA gene sequence
clusters [3]. Koops et al. [4] have expanded the subdivi-
0168-6496/$22.00 � 2005 Federation of European Microbiological Societies
doi:10.1016/j.femsec.2005.02.002
* Corresponding author. Tel.: 31 20 598 7073; fax: 31 20 598 7123.
E-mail address: [email protected] (R.A.Nugroho).
sion of AOB by including environmentally retrieved 16SrRNA gene sequences. Molecular analysis revealed that
Nitrosospira cluster 2 dominated in acid soils [3,5,6].
Nitrosospira cluster 3 and Nitrosomonas cluster 7 were
major AOB in tilled and fertilised soils [7–9], while Nitr-
osospira cluster 0 dominated under undisturbed and unf-
ertilised grassland [9,10]. Generalisation regarding the
relationship between clusters and environmental vari-
ables cannot be made as other 16S rRNA gene(rDNA)-based studies showed that Nitrosomonas euro-
paea cluster 7 can also be present in acid soils [11] and
in unfertilised grasslands [9], and Nitrosospira cluster 3
in both fertilised and unfertilised grassland [9]. There-
fore, it remains unclear how the composition of AOB
communities varies due to different environmental
factors.
Our aim is to improve the understanding on the rela-tion between the presence of AOB and environmental
. Published by Elsevier B.V. All rights reserved.
ÞNO
� 3–N
ðlgg�1dwÞ
Ndeposition
(kgN
ha�1yr�
1)
Presence
ofNitrosospira
cluster
2
0.3
(0.08)
<1
No
0.4
(0.06)
14–21
No
0.4
(0.03)
21–35
No
0.7
(0.03)
14–21
No
12.8
(0.20)
35–49
Yes
14.7
(0.11)
21–35
Yes
15.9
(0.22)
14–21
Yes
17.7
(0.32)
>49
Yes
21.2
(0.24)
35–49
Yes
474 R.A. Nugroho et al. / FEMS Microbiology Ecology 53 (2005) 473–481
factors in acid Scots pine forest soils and the conse-
quences for the in situ N transformation process. We,
therefore, (i) quantified the N transformation rates, i.e.
net mineralisation, net nitrification and net ammonifica-
tion rates in nine Scots pine forest soils with different
NHþ4 –N concentrations; (ii) established correlations be-
tween soil properties, i.e. total C, total N, C/N ratio, Ca
content, pH, initial NO�3 –N and NHþ
4 –N concentrations
and N transformation rates and (iii) tested the hypothe-
sis that soils with different NHþ4 –N concentrations con-
tain different autotrophic AOB and that this difference
correlates to N transformation rates.
A culture-independent method was used to examine
the presence of AOB in nine acid Scots pine forest soilsthat have been subjected to different levels of N deposi-
tion for many years. Molecular biological approaches
have significant advantages for analysis of in situ AOB
communities [12], as analysis can be carried out without
enrichment and isolation of pure cultures.
Table
1
Soilcharacteristics
oftheninesitesstudied.Meansofthreereplicatesper
site
are
presented(w
ithSD)
Sitenamea
Latitude,longitude
TotalN
b
(%)
TotalCb
(%)
C/N
ratio
Calcium
(lmolg�1dw)c
pH
(KCl)
NH
þ 4–N
ðlgg�1dw
Nastola
60�560 N
,26�530 E
1.2
(0.00)
38.6
(0.11)
32.3
(0.02)
60.9
(1.50)
3.2
(0.01)
5.1
(0.26)
Bentveld
52�220 N
,4�340 E
1.6
(0.00)
42.6
(0.16)
26.0
(0.05)
68.0
(0.02)
3.4
(0.08)
48.3
(0.47)
Appelscha
53�050 N
,6�400 E
1.8
(0.01)
47.8
(0.08)
27.1
(0.15)
23.6
(1.78)
2.9
(0.02)
28.5
(0.25)
Schoorl
52�430 N
,4�400 E
1.6
(0.00)
49.4
(0.03)
31.5
(0.06)
44.9
(0.27)
2.9
(0.01)
38.5
(0.19)
Hulshorst
52�210 N
,5�440 E
1.8
(0.00)
44.2
(0.23)
24.5
(0.11)
30.4
(0.92)
3.0
(0.02)
26.7
(0.30)
Roggebotzand
52�030 N
,5�500 E
1.7
(0.00)
43.2
(0.06)
25.4
(0.06)
96.0
(1.29)
3.4
(0.06)
28.4
(0.22)
Asbak
52�230 N
,4�340 E
1.7
(0.00)
43.1
(0.07)
25.0
(0.08)
76.3
(1.93)
3.4
(0.02)
38.5
(0.22)
Ysselsteyn
51�300 N
,5�550 E
2.2
(0.01)
45.3
(0.01)
20.3
(0.05)
35.6
(2.08)
2.9
(0.02)
29.1
(0.89)
Wekerom
52�060 N
,5�410 E
1.8
(0.01)
44.5
(0.36)
24.9
(0.10)
27.7
(0.04)
2.9
(0.04)
39.6
(0.45)
aSites
wereranked
basedonNO
� 3–N
initialconcentration.
bPercentageoftotalN
andtotalC
expressed
onadry
soilbasis.
cdw,dry
weight.
2. Materials and methods
2.1. Field site and forest floor collection
Eight sites located in the Netherlands and one site in
Finland (Table 1) were chosen to represent a large range
in NHþ4 –N concentrations. The forest floor (fragmenta-
tion (F) layer) of Scots pine (Pinus sylvestris L.) stand
utilized in this study was collected in June 2002. At eachsite, ten samples (15 · 20 cm) of the F layer were col-
lected randomly from an area of approximately
5 · 5 m, then pooled in a clean plastic bag and returned
to the laboratory. Pooling was necessary to make the
soil more homogeneous. The field-moist soils were
immediately passed through a 4-mm sieve in the labora-
tory and homogenized by hand. Sieving through 2-mm
sieves has hardly any effect on mineralisation [13].Sub-samples of 30 g of the sieved material were stored
at �20 �C until molecular analysis (Section 2.4). The
remaining sieved material was kept at 5 �C, to minimise
changes in initial conditions across the soils, for less
than a week until further analysis on soil characteristics
(Section 2.2) and N transformation rates (Section 2.3).
In this study, the F layer was chosen, as in this layer,
compared to the litter (L) layer and mineral soil, lessspatial variation was observed in mineralisation and
nitrification rates and temporal variation in these rates
was not significant [14]. In addition to that, denitrifying
capacity was lowest in the F layer [6].
2.2. Soil characteristics analysis
Sub-samples of the sieved material were analysed fortotal N and total C on a Carlo Erba Strumentazione ele-
mental analyser (model 1106) and Ca content on AAS
R.A. Nugroho et al. / FEMS Microbiology Ecology 53 (2005) 473–481 475
(Perkin Elmer, model 1100B). Moisture contents of the
soils were determined by drying fresh samples at 50 �Cfor 3 days. Other sub-samples were extracted with 1 M
KCl (15 g field-moist soil:100 ml of 1 M KCl) on a sha-
ker at 200 · g for 1.5 h and filtered through filter paper
(Schleicher and Schuell, 595.5). Extractable NHþ4 –N and
NO�3 –N concentrations were measured on an autoanaly-
ser (Skalar SA-40), and pH was measured using a Con-
sort P907 pH meter.
2.3. N transformation rate determination
N transformation rates were determined using the
method described by Laverman et al. [14]. Before theN transformations experiment, sub-samples for incuba-
tion were brought to 65% moisture content by adding
demineralised water. Two 250-ml screw-cap bottles were
filled with 15 g fresh material each. One bottle was
capped with a regular cap and the other with a sep-
tum-contained cap. Acetylene 0.1% (vol/vol) was added
to a septum-capped bottle and was present throughout
the incubation time as acetylene was still detectable inthe headspace at the end of the incubation (data not
shown). Acetylene was purified by passage through
5 N H2SO4, 5 N NaOH, and water [15]. Both bottles
were incubated for three weeks at 25 �C in the dark. This
assay was done in triplicate for each soil. At the end of
incubation, 1 M KCl-extractable NHþ4 –N and NO�
3 –N
concentrations, and pHKCl were determined. This ap-
proach was chosen to indicate the in situ N transforma-tion rates.
Concentrations of extractable NO�3 –N in soil at time
zero and after three weeks were used to calculate net
nitrification rate. The net ammonification rate and net
N mineralization rate were calculated in the same man-
ner; subtracting initial concentrations of NHþ4 –N and
ðNHþ4 þNO�
3 –NÞ, respectively, from those measured
at the end of the incubation. All N transformations wereexpressed on dry weight basis. The percent contribution
of net ammonification and nitrification rates to net min-
eralization rate were calculated as net ammonification
and net nitrification rates divided by net mineralization
rate, respectively.
2.4. DNA extraction from soil and nested PCR
DNA was extracted from approximately 0.3 g sub-
samples of soil (at field moisture content) using the
FastDNA� SPIN Kit for Soil (FastPrep� FP120 Cell
Disrupter). The extracted DNA was cleaned three times
with the Wizard DNA clean-up system (Promega, Mad-
ison, WI, USA). Independent DNA extractions were
done in triplicate. A nested PCR was then carried out
for all samples. Universal bacterial-specific 16S rDNAdirected primers pAf/pHr [16] were used in the primary
amplification. PCR products were amplified from each
DNA preparation in 50 ll reactions, 400 nM pAf/pHr,
0.2 mM dNTPs, 10 lg BSA, Taq DNA polymerase
(2.5 unit, Promega), the buffer conditions recommended
by the manufacturer, and 5 ll of each soil DNA extrac-
tion as template source. Reactions were carried out in aT3 thermocycler (Whatman Biometra�). The PCR ther-
mocycling regime was as follows: 3 min at 95 �C, fol-lowed by 30 cycles consisting of 1 min at 95 �C, 1 min
at 55 �C, and 1 min at 72 �C and a final cycle consisting
of 10 min at 72 �C. The PCR products were diluted 100
times and used as template in the second amplification
using AOB specific primers, CTO189f-GC/CTO654r
[12]. The secondary amplifications used the same reac-tion volume, reagent concentrations and buffer condi-
tions as described for the primer set of pAf/pHr. The
PCR amplifications were performed at 95 �C for 3 min
after which 30 cycles were performed at 95 �C for
1 min, 57 �C for 1 min, 72 �C for 1 min and a final cycle
consisting of 10 min at 72 �C. PCR products were exam-
ined by agarose gel electrophoresis.
2.5. TTGE analysis, cloning and sequencing
The PCR products were then profiled on TTGE using
a Biorad Protein II Electrophoresis Unit (BIO-RAD
Dcodee systems, Hercules, CA, USA) as described by
Laverman et al. [6]. Gels (8% polyacrylamide, 1· TAE,
37.5:1 acrylamide:bisacrylamide, 8 M ureum) were run
for 16 h at 60 V over temperature range 59.6–64.4 �C,increasing at 0.3 �C h�1. Laverman et al. [6] have com-
pared TTGE and DGGE profiling of AOB and found
that TTGE banding patterns are similar to those pro-
duced by DGGE. TTGE gels were stained with ethidium
bromide, washed in distilled water and digitally re-
corded using the Imagere system (Appligene, Inc., Ill-
kirch, France). To optimise the sensitivity of DNA
detection, we also stained TTGE gel using SYBR gold,one of the most sensitive dyes, and the results were iden-
tical to those used ethidium bromide stain (data not
shown). Independent DNA extractions and PCRs on
the same soil sample revealed similar TTGE patterns
(data not shown).
To determine the nucleotide sequence of TTGE
bands, the centre of the band was cut out and incubated
overnight in 50 ll TE at 4 �C. This solution was used forPCR with primers CTO189f/CTO654r. The products
were cleaned using Wizard PCR preps. (Promega, Mad-
ison, WI, USA), ligated to the pGEM-T vector, and
transformed into Escherichia coli JM109 competent cells
(Promega, Madison, WI, USA) as specified by the man-
ufacturer. Transformed colonies were screened for in-
serts of the correct size by PCR amplification with
CTO primer set. The selected clones were amplified withvector primer M13f (Promega, Madison, WI, USA) and
analysed on an ALF Express II (Amersham Pharmacia
25
30
35
40
Biotech.) according to the manufacturer�s instruction.These selected clones were tested for correspondence
with the original TTGE bands to make sure that the se-
quences were the target bands.
0
5
10
15
20
Sc BeNa Ap Ys Hu We Ro As
2.6. Data analysis
Non-parametric tests were used as homogeneity of
variances of the data was not ensured. Mann–Whitney
U non-parametric tests were used to analyse differences
in environmental factors and N transformation rates be-
tween two groups of sites, one group containing all sites
that showed the presence of a particular 16S rRNA se-
quence, the other group containing the sites that didnot show this sequence. Correlations between net nitrifi-
cation rate, net ammonification rate and environmental
factors were determined using Spearman�s correlations.All statistical analyses were done using SPSS 11.5 for
Windows.
Recovered 16S rDNA sequences were compared to se-
quences deposited in the GenBank DNA database by
using BLAST algorithm [17]. Sequence alignments wereperformed using ClustalW Multiple sequence alignment
program version 1.8 (http://clustalw.genome.jp). Only
nucleotide positions that were unambiguously aligned
were used in the subsequent phylogenetic analysis.
Distance analysis of 427 nucleotide positions of the
alignment was performed with Treecon version 1.3b
software [18]. Gaps were not taken into account in the
analysis. The bootstrap analysis was based on 100replicates.
2.7. Nucleotide sequence accession numbers
The nucleotide sequences have been deposited in
GenBank under accession numbers AY683621–
AY683629.
3. Results
3.1. Study sites properties
Table 1 shows the soil characteristics of all study
sites. The chosen sites show a large range in initial
NHþ4 –N, NO�
3 –N and Ca concentrations, total C, totalN and pH. NHþ
4 –N was the predominant form of inor-
ganic-N, and NO�3 –N concentrations were very low in
Schoorl, Nastola, Bentveld and Appelscha, accounting
for less than 6% of inorganic N. In the other sites
NO�3 –N concentrations were much greater, accounting
for 29–38% of inorganic N. Comparisons across all sites
revealed that soil from Nastola has the lowest values of
the initial NHþ4 –N and NO�
3 –N contents, total C and to-tal N compared to other soils, while other sites have
shown no consistent trends concerning within site soil
properties.
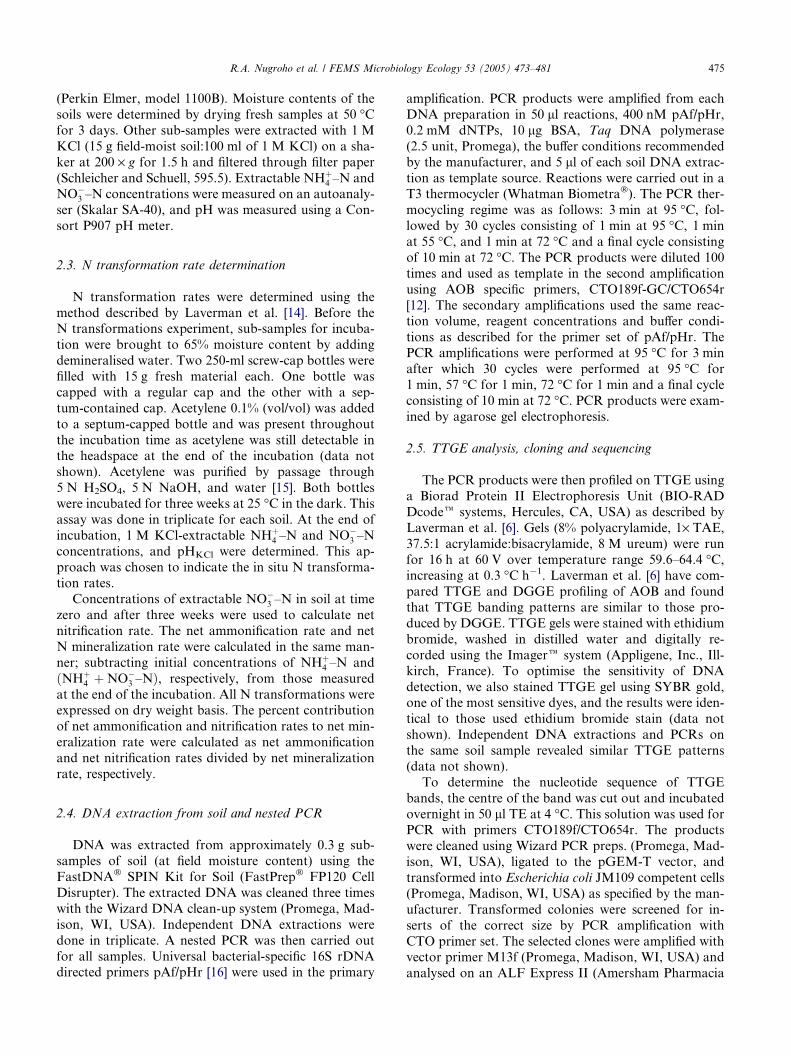
3.2. N transformation rates
The N transformation rates in nine forest soils after 3
weeks of incubation are shown in Fig. 1. At all sites,
acetylene treatment resulted in a complete inhibition ofnet nitrification rate, suggesting that autotrophic nitrifi-
cation was the dominant process. Concerning the net
nitrification rate (Fig. 1(a)), the rates in Schoorl, Nast-
ola, Bentveld and Appelscha were relatively low, less
than 0.5 lg g�1 dry soil wk�1. The rates in Ysselsteyn,
Hulshorst and Wekerom were considerable higher at
11.0–14.4 lg g�1 dry soil wk�1. The highest rate com-
R.A. Nugroho et al. / FEMS Microbiology Ecology 53 (2005) 473–481 477
prises soils from Roggebotzand and Asbak (29.4–
31.6 lg g�1 dry soil wk�1).
Net ammonification rates differed between sites (Fig.
1(b)). The lowest net ammonification rates were in Rog-
gebotzand and Asbak (2.6–3.7 lg g�1 dry soil wk�1).
Nastola has a higher rate (8.0 lg g�1 dry soil wk�1) thanRoggebotzand and Asbak, while Schoorl, Ysselsteyn,
Hulshorst and Wekerom have higher (a factor three)
rates than Nastola. The highest rates were found in
Bentveld and Appelscha (35.0–37.3 lg g�1 dry
soil wk�1).
Furthermore, net mineralization rates in all soils were
comparable with the exception of soils from Schoorl and
Nastola (Fig. 1(c)). The net mineralization rates inSchoorl and Nastola were lower than other in sites,
22.1 and 8.2 lg g�1 dry soil wk�1, respectively. More-
over, the percent contribution of ammonification and
nitrification to net mineralization rates in Schoorl, Nast-
ola, Bentveld and Appelscha are around 99% and 1%,
respectively. The percent contribution of these two pro-
cesses to net mineralization rates in Ysselsteyn, Huls-
horst and Wekerom are around 64% and 36%,respectively, and in Roggebotzand and Asbak around
9% and 91%, respectively.
3.3. Correlation between soil properties and N
transformation rates
Table 2 shows Spearman�s correlations between dif-
ferent soil properties. Positive correlations were foundbetween pH and Ca content, initial NO�
3 –N concentra-
tion and total N, N deposition rate and total N, and
N deposition rate and initial NO�3 –N concentration.
Negative correlations were found between C/N ratio
Table 2
Spearman�s correlation coefficients between net nitrification, ammonificat
significant correlations are shown)
Total C Total N C/N Ca pH
Total C
Total N
C/N �0.895**
Ca �0.608** �0.525*
pH �0.713** 0.748**
NO�3 –N 0.670** �0.761**
NHþ4 –N
N dep. 0.841** �0.738**
NNR 0.482* �0.612**
NAR �0.674** �0.401*
NMR 0.682** �0.484* �0.600**
a Ndep., N deposition rate.b NNR, Net nitrification rate.c NAR, Net ammonification rate.d NMR, Net mineralisation rate.* P 6 0.05.
** P 6 0.01.
and total N, Ca content and total C, Ca content and to-
tal N, pH and total C, initial NO�3 –N concentration and
C/N ratio, and N deposition rate and C/N ratio.
A weak negative correlation was observed between
net ammonification rate and net nitrification rate.
Net mineralisation was positively correlated to netammonification rate. Moreover, these rates were also
correlated to some soil properties (Table 2). Net nitri-
fication rate was negatively correlated to C/N ratio,
and positively correlated to total N, initial NO�3 –N
concentration and N deposition rate. Net ammonifica-
tion rate was negatively correlated to Ca content and
pH. Net mineralisation rate was positively correlated
to total N and N deposition rate, and negatively cor-related to C/N ratio, Ca content and initial NHþ
4 –N
concentration.
3.4. b-subdivision AOB-like 16S rDNA
Fig. 2 shows that very similar AOB TTGE banding
patterns were recovered for soil samples from Yssels-
teyn, Hulshorst, Wekerom, Roggebotzand and Asbak(Fig. 2). These doublet bands co-migrated with products
from cloned standards representing Nitrosospira clusters
2 and 3. The TTGE bands apparent for the Schoorl,
Nastola, Bentveld and Appelscha samples did not
clearly co-migrate with any of the cloned standards
(Fig. 2). TTGE patterns of PCR products from indepen-
dent PCRs on the same sample and from independent
DNA extractions showed no variation in the numberof bands and migration position (results not shown).
These findings confirmed the reproducibility of the
PCR-TTGE method. In both reference clone and envi-
ronmental TTGE patterns, bands often occurred in dou-
blets, which is consistent with previous results which
ion, and mineralisation rates and soil properties among sites (only
NO�3 –N NHþ
4 –N Ndep.a NNRb NARc NMRd
0.603**
0.680** 0.419*
�0.455*
�0.407* 0.494** 0.615**
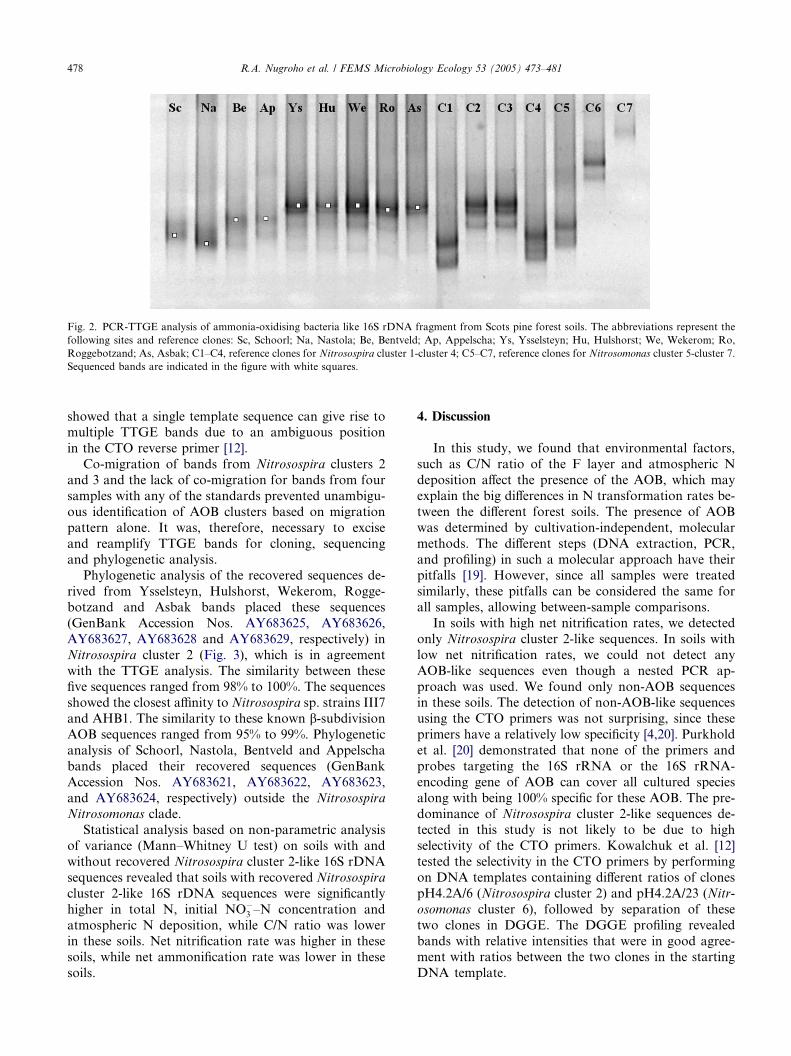
Fig. 2. PCR-TTGE analysis of ammonia-oxidising bacteria like 16S rDNA fragment from Scots pine forest soils. The abbreviations represent the
following sites and reference clones: Sc, Schoorl; Na, Nastola; Be, Bentveld; Ap, Appelscha; Ys, Ysselsteyn; Hu, Hulshorst; We, Wekerom; Ro,
Roggebotzand; As, Asbak; C1–C4, reference clones for Nitrosospira cluster 1-cluster 4; C5–C7, reference clones for Nitrosomonas cluster 5-cluster 7.
Sequenced bands are indicated in the figure with white squares.
478 R.A. Nugroho et al. / FEMS Microbiology Ecology 53 (2005) 473–481
showed that a single template sequence can give rise tomultiple TTGE bands due to an ambiguous position
in the CTO reverse primer [12].
Co-migration of bands from Nitrosospira clusters 2
and 3 and the lack of co-migration for bands from four
samples with any of the standards prevented unambigu-
ous identification of AOB clusters based on migration
pattern alone. It was, therefore, necessary to excise
and reamplify TTGE bands for cloning, sequencingand phylogenetic analysis.
Phylogenetic analysis of the recovered sequences de-
rived from Ysselsteyn, Hulshorst, Wekerom, Rogge-
botzand and Asbak bands placed these sequences
(GenBank Accession Nos. AY683625, AY683626,
AY683627, AY683628 and AY683629, respectively) in
Nitrosospira cluster 2 (Fig. 3), which is in agreement
with the TTGE analysis. The similarity between thesefive sequences ranged from 98% to 100%. The sequences
showed the closest affinity to Nitrosospira sp. strains III7
and AHB1. The similarity to these known b-subdivisionAOB sequences ranged from 95% to 99%. Phylogenetic
analysis of Schoorl, Nastola, Bentveld and Appelscha
bands placed their recovered sequences (GenBank
Accession Nos. AY683621, AY683622, AY683623,
and AY683624, respectively) outside the Nitrosospira
Nitrosomonas clade.
Statistical analysis based on non-parametric analysis
of variance (Mann–Whitney U test) on soils with and
without recovered Nitrosospira cluster 2-like 16S rDNA
sequences revealed that soils with recovered Nitrosospira
cluster 2-like 16S rDNA sequences were significantly
higher in total N, initial NO�3 –N concentration and
atmospheric N deposition, while C/N ratio was lowerin these soils. Net nitrification rate was higher in these
soils, while net ammonification rate was lower in these
soils.
4. Discussion
In this study, we found that environmental factors,
such as C/N ratio of the F layer and atmospheric N
deposition affect the presence of the AOB, which may
explain the big differences in N transformation rates be-
tween the different forest soils. The presence of AOB
was determined by cultivation-independent, molecular
methods. The different steps (DNA extraction, PCR,
and profiling) in such a molecular approach have theirpitfalls [19]. However, since all samples were treated
similarly, these pitfalls can be considered the same for
all samples, allowing between-sample comparisons.
In soils with high net nitrification rates, we detected
only Nitrosospira cluster 2-like sequences. In soils with
low net nitrification rates, we could not detect any
AOB-like sequences even though a nested PCR ap-
proach was used. We found only non-AOB sequencesin these soils. The detection of non-AOB-like sequences
using the CTO primers was not surprising, since these
primers have a relatively low specificity [4,20]. Purkhold
et al. [20] demonstrated that none of the primers and
probes targeting the 16S rRNA or the 16S rRNA-
encoding gene of AOB can cover all cultured species
along with being 100% specific for these AOB. The pre-
dominance of Nitrosospira cluster 2-like sequences de-tected in this study is not likely to be due to high
selectivity of the CTO primers. Kowalchuk et al. [12]
tested the selectivity in the CTO primers by performing
on DNA templates containing different ratios of clones
pH4.2A/6 (Nitrosospira cluster 2) and pH4.2A/23 (Nitr-
osomonas cluster 6), followed by separation of these
two clones in DGGE. The DGGE profiling revealed
bands with relative intensities that were in good agree-ment with ratios between the two clones in the starting
DNA template.

Cluster 8
Cluster 6b
Cluster 6a
Cluster 7
Cluster 9
Cluster 4
Cluster 0
Cluster 3
Cluster 2
distance 0.1
Escherichia coli (Z83205)
Nitrosomonas sp. Nm143 (AY123794)
Asbak (AY683629)
Nitrosomonas cryotolerans Nm55 (AJ298738)
Nitrosospira sp. Nsp65 (AY123813)
Hulshorst (AY683626)
Nitrosomonas communis Nm2 (Z46981)
Nitrosomonas aestuarii Nm36 (AJ298734)
Nitrosospira sp. D11 (X84660)
Nitrosomonas ureae Nm10 (Z46993)
Nitrosospira multiformis NL13 (AY123807)
Roggebotzand (AY683628)
Nitrosospira sp. III7 (AY123809) Nitrosospira sp. O13 (AJ012108)Nitrosospira sp. O4 (AJ012107)Nitrosospira sp. AHB1, (X90820)Nitrosospira sp. B6, (X84657)Nitrosospira sp. T7, (X84661)
Ysselsteyn (AY683625) Wekerom (AY683627)
Nitrosospira briensis Nsp10 (AY123800) Nitrosospira tenuis Nv1 (AJ298746)
Nitrosospira sp. AF (X84658)Nitrosospira sp. L115 (X84662)
Nitrosospira sp. Nsp57 (AY123791) Nitrosospira sp. Nsp58 (AY123789)
Nitrosospira sp. Ka4 (AJ012106) Nitrosospira sp. Ka3 (AY123806)
Nitrosospira sp. 40KI (X84656) Nitrosospira sp. GM4 (X84659)
Nitrosomonas sp. F5 (AJ005546) Nitrosomonas eutropha Nm57 (AJ298739)
Nitrosomonas sp. Nm41 (AJ298735) Nitrosomonas nitrosa Nm90 (AJ298740)
Nitrosomonas mobilis Nc2 (AJ298728)Nitrosomonas halophila Nm1 (AJ298731)
Nitrosomonas sp. Nm51 (AJ298737)Nitrosomonas marina Nm22 (Z16990)
Nitrosomonas sp. Nm84 (AY123797) Nitrosomonas oligotropha Nm45 (AJ298736)
100
95
100
85
94
88
97
98
100
99
79
78
N. cryotolerans lineage
Fig. 3. Neighbour-joining tree of partial 16S rDNA sequences (427 informative positions) recovered from five forest soil samples (in bold) using
CTO primers, showing the similarity between the retrieved sequences and their placement in Nitrosospira cluster 2. Cluster designations are those
used by Koops et al. [4]. Bootstrap values are given at nodes when they exceed 75% of replicates.
R.A. Nugroho et al. / FEMS Microbiology Ecology 53 (2005) 473–481 479
We also do not expect that the predominance of Nitr-
osospira cluster 2-like sequences is due to a failure of
FastDNA Spin Kit to extract DNA of several types of
highly abundant AOB. Nitrosospira clusters 3 [21] and
4 [21,22] and Nitrosospira multiformis and Nitrosomonas
europaea [23] could also be detected in soil systems usingthe FastDNA Spin Kit. Furthermore, Laverman et al.
[6] previously used a modified mechanistic cell disrup-
tion method to extract DNA from two forest soils, Wek-
erom and Roggebotzand, that were also addressed in
this study and also detected Nitrosospira cluster 2, exclu-
sively, based on 16S rRNA gene based analysis. More-
over, Laverman et al. [6] confirmed the dominance by
members of Nitrosospira cluster 2 by using a set of prim-
ers that target the ammonia monooxygenase (amoA)
gene. They found that all AOB populations detected in
Wekerom and Roggebotzand soils were closest related
to a cultured representative of Nitrosospira cluster 2,
strain Nitrosospira sp. AHB1.
Nevertheless, we have used only one non-quantitativeanalysis for the detection of AOB sequences. Since no
single technique can be expected to provide a compre-
hensive view of microbial populations in their environ-
ment [2], we might have overlooked other AOB
populations possibly present. Therefore, we cannot rule
out that additional AOB populations will be found if a
combination of different techniques and molecular
markers would be applied on all samples.

480 R.A. Nugroho et al. / FEMS Microbiology Ecology 53 (2005) 473–481
Soils with high nitrification rates are characterised by
high initial NO�3 –N concentrations, low C/N ratios (or
high total N) and high atmospheric N deposition.
According to the atmospheric N deposition map of
The Netherlands [24], sites with high nitrification rates
can be classified as sites with intermediate to high atmo-spheric N deposition. Thus, our observations are in
agreement with earlier findings [25–29]. As the soils with
high nitrification rates were all characterised by a pre-
dominance of Nitrosospira cluster 2-like sequences, the
C/N values and the high atmospheric N deposition of
these sites are probably favourable for the presence of
Nitrosospira. In acid coniferous forest soil profiles with
low N deposition (14.8 kg N ha�1 yr�1) at a site inSouth Western Sweden, AOB-like sequences could not
be detected either [30].
Net nitrification rates and the presence of Nitroso-
spira cluster 2 were not correlated to soil pH. This
may be due to the relatively small range of soil pH val-
ues and small number of study sites, although it has
been observed in acid forest soil that Nitrosospira cluster
2 is present regardless of soil pH [22].Since we did not detect any other cluster types, this
study suggests the dominance of a single 16S rDNA
sequence type within natural AOB communities in
geographically distant acid Scots pine forest soils. So
far, similar little variation of AOB community compo-
sition, with the exclusive detection of a single Nitroso-
spira 16S rDNA sequence cluster, was found in a
nitrogen-saturated coniferous forest soil [6]. These re-sults are in contrast with other molecular studies of
AOB in soil habitats where larger 16S rDNA sequence
diversity has been detected [e.g., 3,5,7,12,22]. Environ-
mental factors in our study sites probably affect the
activity and presence, but not the cluster type of
AOB.
The AOB found in this study at Wekerom is similar
to the AOB previously detected at this site by Lavermanet al. [6]. They also found little variation between differ-
ent organic layers and throughout the year in this site.
We suggest that this high degree of spatio-temporal sta-
bility of AOB in acid Scots pine forest soils is a general
phenomenon.
In general, it appears that members of Nitrosospira
cluster 2 dominate in acidic soils with high nitrification
rates [this study, 3,5,6]. However, Nitrosomonas euro-
paea-like populations dominating in acidic Belgian for-
est soils [11] show that this is not always the case.
Which and how environmental factors select for certain
sequence cluster(s) of AOB remains an enigma. The cor-
relation of N transformation rates to C/N ratio (or total
N), atmospheric N deposition and the presence of AOB
suggests that N transformation rates are not simply the
result of the effects of individual ecosystem properties,but are driven by the interactions between these
properties.
Acknowledgements
The authors thank Paul L.E. Bodelier and Manuela
Coci for providing reference clones of the AOB. Heikki
M. Setala is acknowledged for providing soil from Nast-
ola, Finland and George A. Kowalchuk for his usefulcomments on a previous draft.
References
[1] de Boer, W. and Kowalchuk, G.A. (2001) Nitrification in acid
soils: micro-organisms and mechanisms. Soil Biol. Biochem. 33,
853–866.
[2] Kowalchuk, G.A. and Stephen, J.R. (2001) Ammonia-oxidizing
bacteria: a model for molecular microbial ecological research.
Annu. Rev. Microbiol. 55, 485–529.
[3] Stephen, J.R., McCaig, A.E., Smith, Z., Prosser, J.I. and Embley,
T.M. (1996) Molecular diversity of soil and marine 16S rRNA
gene sequences related to beta-subgroup ammonia-oxidizing
bacteria. Appl. Environ. Microbiol. 62, 4147–4154.
[4] Koops, H.-P., Purkhold, U., Pommerening-Roser, A., Timmer-
mann, G. and Wagner, M. (2003) The lithoautotrophic ammonia-
oxidizing bacteria In: The Prokaryotes: An Evolving Electronic
Resource for the Microbiological Community (Dworkin, M.,
et al., Eds.), third ed. Springer–Verlag, New York.
[5] Kowalchuk, G.A., Stienstra, A.W., Heilig, G.H., Stephen, J.R.
and Woldendorp, J.W. (2000) Molecular analysis of ammonia-
oxidising bacteria in soil of successional grasslands of the
Drentsche A (The Netherlands). FEMS Microbiol. Ecol. 31,
207–215.
[6] Laverman, A.M., Speksnijder, A.G.C.L., Braster, M., Kowal-
chuk, G.A., Verhoef, H.A. and van Verseveld, H.W. (2001)
Spatiotemporal stability on an ammonia-oxidizing community in
a nitrogen-saturated forest soil. Microbial. Ecol. 42, 35–45.
[7] Bruns, M.A., Stephen, J.R., Kowalchuk, G.A., Prosser, J.I. and
Paul, E.A. (1999) Comparative diversity of ammonia oxidizer 16S
rRNA gene sequences in native, tilled, and successional soils.
Appl. Environ. Microbiol. 65, 2994–3000.
[8] Phillips, C.J., Harris, D., Dollhopf, S.L., Gross, K.L., Prosser, J.I.
and Paul, E.A. (2000) Effects of agronomic treatments on
structure and function of ammonia-oxidizing communities. Appl.
Environ. Microbiol. 66, 5410–5418.
[9] Webster, G., Embley, T.M. and Prosser, J.I. (2002) Grassland
management regimens reduce small-scale heterogeneity and spe-
cies diversity of beta-proteobacterial ammonia oxidizer popula-
tions. Appl. Environ. Microbiol. 60, 20–30.
[10] Kowalchuk, G.A., Stienstra, A.W., Heilig, G.H., Stephen, J.R.
and Woldendorp, J.W. (2000) Changes in the community struc-
ture of ammonia-oxidizing bacteria during secondary succession
of calcareous grasslands. Environ. Microbiol. 2, 99–110.
[11] Carnol, M., Kowalchuk, G.A. and de Boer, W. (2002) Nitroso-
monas europaea-like bacteria detected as the dominant b-subclassProteobacteria ammonia oxidisers in reference and limed acid
forest soils. Soil Biol. Biochem. 34, 1047–1050.
[12] Kowalchuk, G.A., Stephen, J.R., de Boer, W., Prosser, J.I.,
Embley, T.M. and Woldendorp, J.W. (1997) Analysis of
ammonia-oxidizing bacteria of the beta subdivision of the
class Proteobacteria in coastal sand dunes by denaturing
gradient gel electrophoresis and sequencing of PCR-amplified
16S ribosomal DNA fragments. Appl. Environ. Microbiol. 63,
1489–1497.
[13] Kristensen, H.L., Debosz, K. and McCarty, G.W. (2003) Short-
term effects of tillage on mineralization of nitrogen and carbon in
soil. Soil Biol. Biochem. 35, 979–986.

R.A. Nugroho et al. / FEMS Microbiology Ecology 53 (2005) 473–481 481
[14] Laverman, A.M., Zoomer, H.R., van Verseveld, H.W. and
Verhoef, H.A. (2000) Temporal and spatial variation of nitrogen
transformations in a coniferous forest soil. Soil Biol. Biochem. 32,
1661–1670.
[15] Hyman, M.R. and Arp, D.J. (1987) Quantification and removal
of some contaminating gases from acetylene used to study gas-
utilizing enzymes and microorganisms. Appl. Environ. Microbiol.
53, 298–303.
[16] Edwards, U., Rogall, T., Blocker, H., Emde, M. and Bottger, E.C.
(1989) Isolation and direct complete nucleotide determination of
entire genes. Characterisation of a gene coding for 16S ribosomal
RNA. Nucleic Acids Res. 17, 7843–7853.
[17] Altschul, S.F., Madden, T.L., Schaffer, A.A., Zhang, J., Zhang,
Z., Miller, W. and Lipman, D.J. (1997) Gapped BLAST and PSI-
BLAST: a new generation of protein database search programs.
Nucleic Acids Res. 25, 3389–3402.
[18] van de Peer, Y. and de Wachter, R. (1994) TREECON for
Windows: a software package for the construction and drawing of
evolutionary trees for the Microsoft Windows environment.
Comput. Appl. Biosci. 10, 569–570.
[19] von Wintzingerode, F., Gobel, U.B. and Stackebrandt, E. (1997)
Determination of microbial diversity in environmental samples:
pitfalls of PCR-based rRNA analysis. FEMS Microbiol. Rev. 21,
213–229.
[20] Purkhold, U., Pommerening-Roser, A., Juretschko, S., Schmid,
M.C., Koops, H.-P. and Wagner, M. (2000) Phylogeny of all
recognized species of ammonia oxidizers based on comparative
16S rRNA and amoA sequence analysis: implications for molec-
ular diversity surveys. Appl. Environ. Microbiol. 66, 5368–5382.
[21] Mintie, A.T., Heichen, R.S., Cromack Jr., K., Myrold, D.D. and
Bottomley, P.J. (2003) Ammonia-oxidizing bacteria along mea-
dow-to-forest transects in the Oregon Cascade Mountains. Appl.
Environ. Microbiol. 69, 3129–3136.
[22] Backman, J.S.K., Klemedtsson, A.K., Klemedtsson, L. and
Lindgren, P.-E. (2004) Clear-cutting affects the ammonia-oxidis-
ing community differently in limed and non-limed coniferous
forest soils. Biol. Fert. Soils. 40, 260–267.
[23] Briones, A.M., Okabe, S., Umemiya, Y., Ramsing, N.-B.,
Reichardt, W. and Okuyama, H. (2002) Influence of Different
Cultivars on Populations of Ammonia-Oxidizing Bacteria in the
Root Environment of Rice. Appl. Environ. Microbiol. 68, 3067–
3075.
[24] RIVM, (2001) Jaaroverzicht luchtkwaliteit 2001. RIVM rapport
725301009. Rijksinstituut voor Volksgezondheid en Milieu, Bil-
thoven, The Netherlands.
[25] Laverman, A.M., Borgers, P. and Verhoef, H.A. (2002) Spatial
variation in net nitrate production in a N-saturated coniferous
forest soil. Forest Ecol. Manag. 161, 123–132.
[26] Bengtsson, G., Bengtson, P. and Mansson, K.F. (2003) Gross
nitrogen mineralization-, immobilization-, and nitrification rates
as a function of soil C/N ratio and microbial activity. Soil Biol.
Biochem. 35, 143–154.
[27] Gundersen, P., Callesen, I. and de-Vreis, W. (1998) Nitrate
leaching in forest ecosystems is related to forest floor C/N ratios.
Environ. Pollut. 102, 403–407.
[28] Persson, T., Rudebeck, J.H., Jussy, J.H., Colin-Belgrand, M.,
Prieme, A., Dambrine, E., Karlsson, P.S. and Sjoberg, R.M.
(2000) Soil nitrogen turnover–mineralisation, nitrification and
denitrification in European forest soils In: Ecological Studies
– Carbon and Nitrogen Cycling in European Forest
Ecosystems (Schulze, E.-D., Ed.), pp. 295–331. Springer,
Berlin.
[29] Gundersen, P., Emmert, B.A., Kjonaas, O.J., Koopmans, C.J.
and Tietema, A. (1998) Impact of nitrogen deposition on nitrogen
cycling in forests: a synthesis of NITREX data. Forest Ecol.
Manag. 101, 37–55.
[30] Backman, J.S.K., Hermansson, A., Tebbe, C.C. and Lindgren, P.-
E. (2003) Liming induced growth of a diverse flora of ammonia-
oxidising bacteria in acid spruce forest soil as determined by SSCP
and DGGE. Soil Biol. Biochem. 35, 1337–1347.
Copyright © 2022 FDOKUMEN