A retrospective, dual-isotope approach reveals individual predispositions to winter-drought induced...
18
A retrospective, dual-isotope approach reveals individual predispositions to winter-drought induced tree dieback in the southernmost distribution limit of Scots pine JORDI VOLTAS 1 , JESÚS JULIO CAMARERO 2 , DAVID CARULLA 1 , MÒNICA AGUILERA 1 , ARACELI ORTIZ 3 & JUAN PEDRO FERRIO 1 1 Department of Crop and Forest Sciences – AGROTECNIO Center, University of Lleida, Av. Rovira Roure 191, 25198 Lleida, Spain, 2 ARAID, Instituto Pirenaico de Ecología, IPE (CSIC), Avda. Montañana 1005, 50192 Zaragoza, Spain and 3 Servicio Provincial de Medio Ambiente de Teruel, Depto. Medio Ambiente, Laboratorio de Sanidad Forestal, Gob.Aragón, C/ Agustín Planas Sancho 10, 44400 Mora de Rubielos, Teruel, Spain ABSTRACT Winter-drought induced forest diebacks in the low-latitude margins of species’ distribution ranges can provide new insights into the mechanisms (carbon starvation, hydraulic failure) underlying contrasting tree reactions. We analysed a winter-drought induced dieback at the Scots pine’s southern edge through a dual-isotope approach (D 13 C and d 18 O in tree- ring cellulose). We hypothesized that a differential long-term performance, mediated by the interaction between CO2 and climate, determined the fates of individuals during dieback. Declining trees showed a stronger coupling between climate, growth and intrinsic water-use efficiency (WUEi) than non- declining individuals that was noticeable for 25 years prior to dieback. The rising stomatal control of water losses with time in declining trees, indicated by negative D 13 C-d 18 O relation- ships, was likely associated with their native aptitude to grow more and take up more water (suggested by larger tracheid lumen widths) than non-declining trees and, therefore, to exhibit a greater cavitation risk. Freeze-thaw episodes occur- ring in winter 2001 unveiled such physiological differences by triggering dieback in those trees more vulnerable to hydrau- lic failure. Thus, WUEi tightly modulated growth responses to long-term warming in declining trees, indicating that co-occurring individuals were differentially predisposed to winter-drought mortality.These different performances were unconnected to the depletion of stored carbohydrates. Key-words: Pinus sylvestris; stable isotopes; water-use effi- ciency; hydraulic failure; carbon reserves; tree rings. INTRODUCTION Efforts to reveal the mechanisms underlying forest dieback and associated tree mortality are commonly framed as the so-called slow-decline hypothesis (Manion 1991; see McDowell et al. 2008 for an updated and physiologically ori- ented review). This theory postulates that trees usually undergo a three-stage cascade to achieve mortality, by which a long-term stressor (or predisposing factor) is followed by a more severe, short-term stressor (or inciting factor) triggering tree death, with a secondary driver (or contribut- ing factor) promoting mortality. Usually, predisposing and inciting factors have a climatic background, whereas contrib- uting factors are linked to the incidence of opportunistic biotic agents (Allen et al. 2010; McDowell et al. 2011). Inter- actions among these drivers are complex and different com- binations of stressors may trigger mortality depending on the tolerances of tree species and individuals, thus challenging the mechanistic disentangling of tree death (Allen et al. 2010; Sala, Piper & Hoch 2010). The most regarded driver of tree dieback is the increase in timing, duration and severity of drought stress associated with climate warming (Allen et al. 2010). Drought-related mortality mechanisms are considered as an interdependent set of processes concerning carbon metabolism and plant hydraulics (McDowell et al. 2011). The case of the Scots pine (Pinus sylvestris L.), the conifer with the widest distribution area worldwide, which occupies dry locations in its southern distribution limit in the Iberian Peninsula, is illustrative of the complex mechanisms associated with drought-related mortality (Galiano, Martínez-Vilalta & Lloret 2010). As a consequence of drought, P. sylvestris in this region has started to reverse the temporal trend to increasing growth observed prior to the last quarter of the past century, particularly in xeric sites (Martínez-Vilalta et al. 2008). In parallel, extensive drought-induced mortality episodes have been reported, which have been attributed primarily to either hydraulic failure (Martínez-Vilalta & Piñol 2002; Peguero-Pina et al. 2011) or carbon starvation (Galiano, Martínez-Vilalta & Lloret 2011). Frequently, declining and non-declining trees are coetane- ous, present similar size, grow side by side and share similar microhabitats (e.g. Bigler et al. 2006; Heres ¸, Martínez-Vilalta & Claramunt-López 2012). However, they seem differen- tially predisposed to withstand short-term stressors such as extreme drought events (Camarero et al. 2011). The exact causes underlying such differential predisposition are diffi- cult to determine, but in some cases declining trees may experience decreasing growth rates traceable back in time from several years to decades prior to death as compared with non-declining individuals (Mundo et al. 2010; Heres ¸ et al. 2012). This fact does not concur with the expected Correspondence: J.Voltas. e-mail: [email protected] Plant, Cell and Environment (2013) doi: 10.1111/pce.12072 © 2013 Blackwell Publishing Ltd 1
Transcript of A retrospective, dual-isotope approach reveals individual predispositions to winter-drought induced...

A retrospective, dual-isotope approach reveals individualpredispositions to winter-drought induced tree dieback inthe southernmost distribution limit of Scots pine
JORDI VOLTAS1, JESÚS JULIO CAMARERO2, DAVID CARULLA1, MÒNICA AGUILERA1, ARACELI ORTIZ3 &JUAN PEDRO FERRIO1
1Department of Crop and Forest Sciences – AGROTECNIO Center, University of Lleida, Av. Rovira Roure 191, 25198 Lleida,Spain, 2ARAID, Instituto Pirenaico de Ecología, IPE (CSIC), Avda. Montañana 1005, 50192 Zaragoza, Spain and 3ServicioProvincial de Medio Ambiente de Teruel, Depto. Medio Ambiente, Laboratorio de Sanidad Forestal, Gob. Aragón, C/ AgustínPlanas Sancho 10, 44400 Mora de Rubielos, Teruel, Spain
ABSTRACT
Winter-drought induced forest diebacks in the low-latitudemargins of species’ distribution ranges can provide newinsights into the mechanisms (carbon starvation, hydraulicfailure) underlying contrasting tree reactions. We analysed awinter-drought induced dieback at the Scots pine’s southernedge through a dual-isotope approach (D13C and d18O in tree-ring cellulose). We hypothesized that a differential long-termperformance, mediated by the interaction between CO2 andclimate, determined the fates of individuals during dieback.Declining trees showed a stronger coupling between climate,growth and intrinsic water-use efficiency (WUEi) than non-declining individuals that was noticeable for 25 years prior todieback. The rising stomatal control of water losses with timein declining trees, indicated by negative D13C-d18O relation-ships, was likely associated with their native aptitude to growmore and take up more water (suggested by larger tracheidlumen widths) than non-declining trees and, therefore, toexhibit a greater cavitation risk. Freeze-thaw episodes occur-ring in winter 2001 unveiled such physiological differences bytriggering dieback in those trees more vulnerable to hydrau-lic failure. Thus, WUEi tightly modulated growth responsesto long-term warming in declining trees, indicating thatco-occurring individuals were differentially predisposed towinter-drought mortality. These different performances wereunconnected to the depletion of stored carbohydrates.
Key-words: Pinus sylvestris; stable isotopes; water-use effi-ciency; hydraulic failure; carbon reserves; tree rings.
INTRODUCTION
Efforts to reveal the mechanisms underlying forest diebackand associated tree mortality are commonly framed as theso-called slow-decline hypothesis (Manion 1991; seeMcDowell et al. 2008 for an updated and physiologically ori-ented review). This theory postulates that trees usuallyundergo a three-stage cascade to achieve mortality, by whicha long-term stressor (or predisposing factor) is followed bya more severe, short-term stressor (or inciting factor)
triggering tree death, with a secondary driver (or contribut-ing factor) promoting mortality. Usually, predisposing andinciting factors have a climatic background, whereas contrib-uting factors are linked to the incidence of opportunisticbiotic agents (Allen et al. 2010; McDowell et al. 2011). Inter-actions among these drivers are complex and different com-binations of stressors may trigger mortality depending on thetolerances of tree species and individuals, thus challengingthe mechanistic disentangling of tree death (Allen et al. 2010;Sala, Piper & Hoch 2010).
The most regarded driver of tree dieback is the increase intiming, duration and severity of drought stress associatedwith climate warming (Allen et al. 2010). Drought-relatedmortality mechanisms are considered as an interdependentset of processes concerning carbon metabolism and planthydraulics (McDowell et al. 2011). The case of the Scots pine(Pinus sylvestris L.), the conifer with the widest distributionarea worldwide, which occupies dry locations in its southerndistribution limit in the Iberian Peninsula, is illustrative ofthe complex mechanisms associated with drought-relatedmortality (Galiano, Martínez-Vilalta & Lloret 2010). As aconsequence of drought, P. sylvestris in this region has startedto reverse the temporal trend to increasing growth observedprior to the last quarter of the past century, particularly inxeric sites (Martínez-Vilalta et al. 2008). In parallel, extensivedrought-induced mortality episodes have been reported,which have been attributed primarily to either hydraulicfailure (Martínez-Vilalta & Piñol 2002; Peguero-Pina et al.2011) or carbon starvation (Galiano, Martínez-Vilalta &Lloret 2011).
Frequently, declining and non-declining trees are coetane-ous, present similar size, grow side by side and share similarmicrohabitats (e.g. Bigler et al. 2006; Heres, Martínez-Vilalta& Claramunt-López 2012). However, they seem differen-tially predisposed to withstand short-term stressors such asextreme drought events (Camarero et al. 2011). The exactcauses underlying such differential predisposition are diffi-cult to determine, but in some cases declining trees mayexperience decreasing growth rates traceable back in timefrom several years to decades prior to death as comparedwith non-declining individuals (Mundo et al. 2010; Hereset al. 2012). This fact does not concur with the expectedCorrespondence: J. Voltas. e-mail: [email protected]
Plant, Cell and Environment (2013) doi: 10.1111/pce.12072
bs_bs_banner
© 2013 Blackwell Publishing Ltd 1

stimulation of carbon uptake and growth owing to the rise inatmospheric CO2 concentration, which implies that plants areable to increase their intrinsic water-use efficiency (WUEi;the ratio of net assimilation to stomatal conductance)(Ceulemans, Janssens & Jach 1999). However, such growthdecline is consistent with an increased drought-induced limi-tation on growth and a decreasing rate of WUEi improve-ment in water-limited environments (Peñuelas et al. 2008;Linares et al. 2009; Linares & Camarero 2012).
The dendrochronological archive of WUEi obtained from13C/12C isotope ratios simultaneously tracks changes inassimilation rates and adjustments in stomatal conductanceunder increasing atmospheric CO2 (Francey & Farquhar1982). The number of long-term, tree-ring based studiesassessing the impact of rising atmospheric CO2 on WUEi hasincreased considerably in the last years, as WUEi varies sub-stantially among species, sites and growing conditions (e.g.Saurer, Siegwolf & Schweingruber 2004; Waterhouse et al.2004; Peñuelas et al. 2008; Linares et al. 2009). In most cases,however, the temporal variation in 13C/12C ratios supports theprevalence of an active plant mechanism that maintains aconstant ratio between intercellular and ambient CO2 con-centrations (Leonardi et al. 2012). Less abundant in the lit-erature, the combined analysis of carbon (d13C) and oxygen(d18O) isotope compositions, the so-called dual-isotopeapproach, applied to either tree rings (Saurer, Borella &Leuenberger 1997; Barbour, Walcroft & Farquhar 2002;Ferrio & Voltas 2005) or bulk leaves (e.g. Guerrieri et al.2009; Moreno-Gutiérrez et al. 2011), may help elucidate ifWUEi trends are more related to stomatal control of waterlosses or to varying assimilation rates (Saurer et al. 1997; butsee Roden & Farquhar 2012). Such an approach may beeffective for understanding the extent to which changes inWUEi modulate growth in response to climatic stressorsleading to forest dieback.
Most studies have reported drought-induced diebackcausing growth decline and defoliation in water-limitedforests from the Mediterranean basin (e.g. Martínez-Vilalta& Piñol 2002; Linares & Camarero 2012) or elsewhere(Bigler et al. 2006). They mostly focused on the effects ofdrought stress on tree performance during the growingseason, usually in spring and summer. However, a diebackepisode characterized by severe defoliation affected around14 000 ha of forests in the Spanish Sistema Ibérico range, andthese effects were observed during late winter 2001 andspring 2002. Such dieback was attributed to a combination oflow temperatures and drought in winter by Peguero-Pinaet al. (2011), since they found xylem embolism in affectedtrees and hypothesized that winter conditions caused freeze-thaw cavitation. This suggests that winter conditions, that isthose previous to the start of the growing season, could be ascritical for Scots pine performance as summer drought, evenat the southernmost limit (rear edge) of the species’ distri-bution area. Similar stand-level diebacks have been observedin boreal Scots pine tree lines, that is near the northernmostdistribution limit of the species (leading edge), being attrib-uted to frost and drought during abnormally cold winterswith thin snow cover (Kullman 1991).
The aforementioned dieback episode bears a potentiallygreat ecological significance as: (1) it departs from thegeneral trend of drought and heat-related inciting factors ofdieback acting during the growing season, and (2) it repre-sents a biogeographically unusual climatic event causingwinter-drought induced dieback at the species’ southernedge. However, the predisposition of some trees to declineremains unexplained. Here, we hypothesize that a differentialhistory in terms of growth and water use, mediated by thelong-term interaction between CO2 levels and climatedrivers, determined the fate of individuals during the diebackevent. To test this, we compared (1) the previous tree-ringrecord of coexisting non-declining and declining Scots pinetrees of similar age and (2) the post-dieback tree-ring recordof surviving trees showing different levels of dieback inci-dence and defoliation. Following a multi-proxy and dual-isotope approach, we analysed d13C and d18O at several timescales in (1) tree slices at breast height with annual resolution(1975–2004), (2) tree slices from the apex separating earlywood and late wood (1990–2004) and (3) tree cores fromsurviving trees in which each tree-ring was divided into foursections (2000–2006). These measurements were comple-mented with (1) post-dieback intra- (dendrometer records)and inter-annual (tree-ring widths) radial growth data, and(2) an assessment of carbon reserves in stems and tracheidlumen diameters, in order to better interpret the potentialmechanisms, that is carbon starvation versus hydraulicfactors, underlying this singular case of forest dieback.
MATERIALS AND METHODS
Study site
The study was conducted in a Scots pine stand located inthe Sierra de Gúdar, Sistema Ibérico range, eastern Spain(Villarroya de los Pinares, Teruel, 40°30′ 49″N, 0°37′ 05″W,1690 m a.s.l.) (Fig. 1). The Scots pine populations in theregion, which are found on either northern or southernslopes and at altitudes varying from 1600 m to 2000 m a.s.l.,can be considered as the southernmost example of continu-ous forests across the current distribution area of the species(Richardson 1998). These forests experienced strong land-use pressures (logging, grazing) until the early 20th century,but this tendency reversed with the extensive abandonmentof cultivated land following the sudden rural populationmigration to cities in the 1950s. The studied Scots pine standhas an even age and size structure (diameter at breast heightmeasured at 1.3 m, dbh, mean � SD = 23.7 � 4.3 cm; treeheight = 10.9 � 2.0 m), with the oldest individuals aged about120 years according to dendrochronological analyses of basalwood samples. It is situated in an approximately flat drainagedivide that extends for about 2 km2. The understory is com-posed mainly of woody, perennial shrubs (Juniperus sabina,Juniperus communis) alternating with deciduous species(Prunus spinosa, Berberis vulgaris). Although mistletoeinfections on Scots pine are common in the Gúdar area(Sangüesa-Barreda, Linares & Camarero 2012), the studiedstand remains completely disease-free to date. The climate
2 J. Voltas et al.
© 2013 Blackwell Publishing Ltd, Plant, Cell and Environment

of the region is Mediterranean continental (Peña-Monné,Cuadrat-Prats & Sánchez-Fabre 2002), and characterized byan annual mean temperature of 8.7 °C and an annual meanrainfall of 565 mm (data for the period 1951–1999 obtainedfrom the Digital Climatic Atlas of the Iberian Peninsula;Ninyerola, Pons & Roure 2005) (Fig. 1, inset). Soils are basicand rocky of the Cambisol type and developed on calcareousCretaceous substrates.
Climatic datasets
Monthly total precipitation and mean temperature, pro-vided by the Spanish National Meteorological Agency, wereused to assess relationships with radial growth and stableisotopes. Only record series spanning 30 years (1975–2004)were selected for climate analyses. Climatic data originatedfrom two meteorological stations positioned 18 km (Alcaláde la Selva, 40°21′ N, 0°42′ W, 1404 m a.s.l.) and 45 km(Teruel, 40°21′ N, 1°07′ W, 900 m a.s.l.) from the sampling
site. The closest climatic dataset (Alcalá de la Selva) coveredthe most recent 30-year period for precipitation, whereasrecords from Teruel station were used for temperature. Bothclimatic series matched well with the overall trends in tem-perature and precipitation for the area according to thegridded CRU TS3.0 dataset built with a 0.5° spatial resolu-tion (Mitchell & Jones 2005) (see the Supporting Informa-tion Fig. S1).
Field conditions
The first visual symptoms of Scots pine dieback were alreadyevident in early spring 2002, the moment at which an impor-tant number of Scots pine trees started to display needleyellowing, followed by a massive loss of dead buds andneedles (see Supporting Information Fig. S2). Damaged treesappeared in an area covering around 14 000 ha of forests andwoodlands, but the impact was stronger on populationslocated on south-southeast slopes than on north-northwestslopes and growing under shallow soils with abundant lime-stone rocks (Camarero & Sancho-Benages 2006). An exten-sive survey conducted in summer 2005 for the area providedmortality rates ranging from 4 to 43% at the stand level(Forest Pathology Laboratory of Mora de Rubielos, AragónForest Service, unpublished results). In winter 2009, theaverage standing tree mortality at the studied stand was stillabout 10%, whereas 47% of trees showed crown defoliationrates higher than 40% (Supporting Information Fig. S2).Remarkably, the distribution of declining and non-decliningtrees at the studied stand did not follow any clear spatial orage pattern, meaning that both tree types occurred andmay share similar microhabitats (Supporting InformationFig. S2). No significant difference was found between treetypes either for dbh (declining trees, 23.9 � 4.3 cm; non-declining trees, 23.5 � 4.5 cm; F = 0.06, P = 0.81) or height(declining trees, 11.0 � 2.4 m; non-declining trees, 10.8 �
1.5 cm; F = 0.07, P = 0.79). In a nearby, similarly affectedstand, a previous study on this dieback episode reportedmean values of 10.4 m2 ha-1 and 348 stems ha-1 for basal areaand density, respectively (Camarero & Sancho-Benages2006). These dendrometric features correspond to relativelyopen stands where the intensity of competition is expected tobe low.
Field sampling and dendrochronologicalmethods
In winter 2004, 20 declining and 23 non-declining dominanttrees from the same stand, separated from each other by atleast 10 m, were randomly selected and logged following a1200 m long transect. Tree slices at 1.30 m (breast height)and 4.50 m (apex) were obtained for every tree and thenorth direction was marked on each wood disk. Defoliationwas visually estimated by taking as a reference a nearby treewith the maximum amount of foliage, since this variablechanges among observers and places. The declining treesexhibited crown defoliation values higher than 60%. Thetree slices were air-dried at room temperature (20–25 °C)
Figure 1. (a) Location of the study area (redrawn from the Scotspine distribution map available at http://www.euforgen.org/) and(b) climatic conditions (monthly precipitation, mean monthlymaximum and minimum temperatures) in 2001 as compared withmean values (period 1975–2004). The December minimumtemperature (encircled value) was significantly lower (P < 0.01)than the mean value.
Scots pine disposition to winter-drought dieback 3
© 2013 Blackwell Publishing Ltd, Plant, Cell and Environment

and sanded with sandpapers of progressively finer grainuntil tree rings were clearly visible. Tree rings were visuallycross-dated and their widths were measured to a precisionof 0.01 mm using a Lintab measuring device (Rinntech,Heidelberg, Germany). The COFECHA cross-dating pro-gramme (Holmes 1983) was applied to evaluate the previ-ous visual cross dating. For each tree type, a subset of fiveindividuals of similar age was subsequently selected forisotope analyses. Tree age at breast height averaged 87 yearsand did not differ significantly between declining and non-declining individuals (Student t-test, P = 0.22) (Table 1).Tree-ring number in the apex did not significantly differbetween tree types (P = 0.26). Similarly, both dbh and apexdiameter did not differ when comparing both tree classes(Table 1). For each tree slice, two non-sanded, oppositeradial wood slats approximately 25 mm high and 5 mm widewere taken following the north-south direction. A fragmentof each wood slat was selected spanning the period 1975–2004 (30 years; stem discs sampled at 1.30 m) or the period1990–2004 (15 years; stem discs sampled at 4.50 m). An addi-tional wood slat of each tree slice comprising only sapwoodwas also taken from the south side for the determination ofcarbohydrates.
In May 2007, 10 declining and 10 non-declining surviving,dominant trees were additionally selected and their second-ary growth monitored using manual band dendrometers(Agricultural Electronics Co., Tucson, AZ, USA) placed at1.30 m around the main stem after slightly brushing the deadbark. Band dendrometers were read to the nearest 0.01 mmfrom January 2008 to December 2008. The mean samplingfrequency was 29 days. In the winter of 2009, twin wood cores(5 mm in diameter) were sampled at 1.30 m from the southside of a subset of three declining and three non-decliningtrees. The chosen trees showed a highly synchronous varia-tion in radial incremental growth at the within-class level forthe period 2007–2008. Samples were oven-dried at 65 °C for48 h. Tree-ring width measurements were also performedwith a Lintab measuring device as explained before. The treeclasses differed neither in dbh nor in age but exhibited dif-ferent crown defoliation rates (Table 1), with declining treeshaving less than 50% of surviving needles based on visualestimations. For one particular core per tree, we selected afragment corresponding to the period 2000–2006 (7 years),which was used for isotope analysis. The remaining availablecore was used for total non-structural carbohydrates (NSC)analysis.
Stable isotopes analyses
A multi-scalar analysis was used to unravel physiologicaleffects acting at distinct temporal scales on differential treesusceptibilities to the stress factors causing forest dieback.Specifically, we determined D13C and d18O in (1) individualtree rings from tree slices taken at breast height with annualresolution (1975–2004), (2) individual tree rings from apextree slices but separating early wood and late wood (1990–2004) and (3) individual tree rings from tree cores of standingtrees in which each tree-ring was divided into four thin sec-tions (three sections of equivalent width corresponding to theearly wood and the remaining one belonging to the latewood)(post-2001 decline analysis, period 2000–2006). Each tree-ring(for the period 1975–2004) or tree-ring fraction (for the period1990–2004) was separated using a scalpel, and tree-ring sec-tions were obtained using a sliding microtome (Leica RM2265; Leica Biosystems GmbH, Nussloch, Germany). Annualtree rings or intra-annual tree-ring fractions were pooled intoa single sample, whereas tree-ring sections were individuallyhandled to assess between-trees variability. The resultingsamples were purified to a-cellulose with a modification of themethod of Leavitt & Danzer (1993) for the removal of extrac-tives and lignin, as detailed in Ferrio & Voltas (2005). Sodiumhydroxide was then used to obtain a-cellulose (Loader et al.1997), which was homogenized to a fine powder with a ballmixer mill (Retsch MM301, Haan, Germany).
For carbon isotope analysis, 0.30–0.40 mg of dry a-cellulose was weighed into tin foil capsules and combustedusing a Flash EA-1112 elemental analyser interfaced with aFinnigan MAT Delta C isotope ratio mass spectrometer. Foroxygen isotope analysis, 0.30–0.40 mg of dry a-cellulose wasweighed into silver foil capsules and combusted using a CarloErba 1108 elemental analyser interfaced with a FinniganDeltaplus XP isotope ratio mass spectrometer. Isotope ratiosare expressed as per mil deviations using the d notationrelative to VPDB (for carbon) and VSMOW (for oxygen)standards. The accuracy of the analyses (standard deviationof working standards) was 0.06‰ (d13C) and 0.25‰ (d18O).
Growth and wood anatomical measurements
In the first instance, basal area increment (BAI) was used forgrowth analyses as provided by the whole set of tree slices(n = 20) obtained at breast height. BAI was calculated fromtree-ring growth according to:
Table 1. Age and size (diameter) of wood samples of declining (D) and non-declining (ND) Scots pine trees. Disks were sampled at 1.3 m(breast height) or at the tree’s apex; cores were taken at 1.3 m. The last column shows the mean defoliation (� SE) of the two types of trees
Stem disks (1.30 m) Stem disks (apex) Stem cores (1.30 m)
nAge(years)
Diameter(cm)
Age(years)
Diameter(cm) n
Age(years)
Diameter(cm)
Defoliation(%)
Declining 5 79.8 (7.51) 21.0 (0.79) 33.0 (2.76) 7.3 (1.32) 3 69.2 (18.45) 15.8 (1.92) 65.0 (4.41)Non-declining 5 93.8 (7.52) 20.5 (1.88) 27.0 (4.18) 7.7 (1.54) 3 53.3 (16.40) 14.4 (0.41) 11.7 (8.66)
Values are means and SE between parentheses.
4 J. Voltas et al.
© 2013 Blackwell Publishing Ltd, Plant, Cell and Environment
BAI R R= − −π( )t t2
12 (1)
where R is the radius of the tree and t is the year of tree-ringformation. Additionally, we also used the original tree-ringwidth chronologies (RW) in order to allow comparison ofgrowth trends at different temporal scales (7, 15 and 30 years)and based on different wood sections. For comparison withclimatic variables, the longest raw chronologies used forisotope analyses (1975–2004), which exhibited negativegrowth trends over time, were detrended by fitting a straightline to each individual tree-ring width series and keeping theresiduals of these linear fits. The residuals were subjectedto autoregressive modelling to remove the first-orderautocorrelation.
To check for possible differences in the hydraulic functionof the wood between declining and non-declining trees, wemeasured the transverse lumen width in the 10 widest earlywood tracheids, considered a reliable proxy of theoreticalhydraulic conductance (Sperry, Hacke & Pittermann 2006),in 10 individuals for each tree class. For this purpose, weselected a sample of three dry and three wet years (corre-sponding, respectively, to narrow - 1974, 1987 and 1998 - andwide - 1976, 1984, 1992 - rings) prior to dieback.
Temporal trends for d13C and WUEi
To account for changes in d13C of atmospheric CO2 (d13Cair),we calculated carbon isotope discrimination in cellulose(D13C) from d13Cair and cellulose d13C, as described byFarquhar, O’Leary & Berry (1982):
Δ1313 13
131C
C CC
= −+
δ δδ
air (2)
d13Cair was inferred by interpolating values from two Antarc-tic stations (Halley Bay and Palmer Station) of theCU-INSTAAR/NOAA-CMDL network for atmosphericCO2 measurements, as described in Ferrio et al. (2005). Stableisotope estimates of whole tree rings in apical samples wereobtained by weighting early wood and late wood recordsof either D13C or d18O by their corresponding annual BAIvalues, and considering late wood density twice the value ofearly wood (Kilpeläinen et al. 2003).
Long-term changes in WUEi (the ratio of the assimilationrate to stomatal conductance of water vapour) were esti-mated for the period 1975–2004 from the linear models relat-ing (1) D13C to changes in the ratio of intercellular toatmospheric CO2 mole fractions (Dlin) and (2) WUEi to D13Cchanges (WUEilin) (Farquhar et al. 1982), as described inLinares et al. (2009). Briefly, we calculated, as a starting point,initial values of intercellular CO2 concentration (Ci) usingthe average D13C value of declining and non-declining treesfor the oldest five tree rings analysed. This decision stemmedfrom the absence of significant differences in D13C recordsbetween tree classes for the period 1975–1979, so single tem-poral trends of Dlin and WUEi changes could be calculatedregardless of tree decline condition. These trends wereobtained under two scenarios (Saurer et al. 2004) considering
Ci and Ca (atmospheric CO2 concentration) for the theoreti-cal regulation of plant gas exchange at increased atmosphericCO2 concentration: (1) constant Ci (i.e. active regulation),and (2) constant Ci/Ca (i.e. passive regulation). The theoreti-cal scenarios were compared with WUEi values obtainedfrom actual d13C records for declining and non-decliningtrees.
Total NSC concentrations in wood
The tree slices taken in winter 2004 were also analysed forsoluble sugars (SS) and starch concentrations. For thispurpose the sapwood fraction of each slice was separatedfrom a radial wood slat about 2 cm in width following thenorth-south direction, ground to fine powder and analysedtwice. SS were extracted from 50 mg samples with 80% v/vethanol. The extraction was done in a shaking water bath at60 °C. After centrifugation, the concentration of SS wasdetermined colourimetrically at 490 nm using the phenol–sulphuric method of Dubois et al. (1956) as modified byBuysse & Merckx (1993). For starch concentration, theremaining sample in the undissolved pellet after ethanolextraction was digested with an enzyme mixture containingamyloglucosidase to reduce glucose as described in Palacio,Maestro & Montserrat-Martí (2007). Starch concentrationwas determined colourimetrically using the same method asfor SS. Total non-structural carbohydrate (NSC, % drymatter) concentrations were calculated as the sum of SS andstarch concentrations.
Statistical analyses
Data on d13C and tree-ring width obtained from wood coreswere subjected to a repeated measures analysis of variance(anova) over years (split-plot in time analysis; Bowley1999), where the measurements among subjects corre-sponded to the factorial combination of tree category(declining or non-declining), ring portion (early wood orlate wood) and slice nested to early wood ring portion (ford13C; for tree-ring width only the factorial combination oftree category and ring portion was available), and the obser-vations within subjects corresponded to the year effect(tree-ring). Applying a sphericity test (Miliken & Johnson1992), repeated data over time were found to satisfy theHuynh-Feldt condition. F-protected least significant differ-ence (LSD) tests (P = 0.05) were employed for least squaresmeans (anova) comparisons.
Product-moment Pearson correlations between climateand tree-ring records (RW, D13C and d18O) for the period1975–2001 were calculated to ascertain the response of treerings to climate before the first visual symptoms of forestdecay. Relationships among climate and tree-ring recordswere also established by response function analyses (Fritts1976). Computations were done using the Dendroclim 2002software package (Biondi & Waikul 2004). Tree-ringrecords were expressed as functions of a set of predictors(meteorological data) weighted by the corresponding set ofpartial regression coefficients (b-values) obtained after
Scots pine disposition to winter-drought dieback 5
© 2013 Blackwell Publishing Ltd, Plant, Cell and Environment

orthogonalization of predictors, that is after reducing theircollinearity (Cropper 1984) by principal component analysis(PCA). The use of bootstrapping in this process (Guiot1991) allowed the estimation of 95% probability confidenceintervals for the response function coefficients.
RESULTS
Climatic trends
The regional climatic series showed an increase in meanannual temperature of about +2 °C for the last century (Sup-porting Information Fig. S1), with a steeper increment of c.+1 °C detected for the period 1975–2000. Annual precipita-tion did not show clear changes over time, but there was atrend towards decreasing rainfall for the last quarter of the20th century (Supporting Information Fig. S1). This trendwas particularly noticeable for summer rainfall, with adecrease of about 40% immediately prior to the diebackepisode (period 1990–2001, not shown). Overall, the 1970s,which were cold and wet, appear as an inflection point froma climatic point of view; afterwards, warmer and drier condi-tions prevailed in the study area.
Climatic conditions in autumn and winter 2001
In October 2001, the weather in the study area waswarmer (mean temperature = 11.6 °C) and slightly drier(precipitation = 47 mm) than the average (October tempera-ture and precipitation averaged 9.6 °C and 54 mm, respec-tively, for the 1975–2004 period), and was followed by anabrupt temperature decrease in November and a relativelydry (14 mm, mean = 35 mm) and very cold December (meantemperature = -1.3 °C; the average for the period 1975–2004was 1.8 °C; see Fig. 1). In fact, the difference between theaverage maximum October temperature and the averageminimum December temperature in 2001 was 28 °C, whichexceeded by more than 8 °C the average difference for thehistorical records (133 years) of the Teruel meteorologicalstation. This is by far the largest difference observed for theperiod 1877–2009 (the second largest difference, about 26 °C,occurred in 1968).
Growth trends and wood anatomy before andafter the 2001–2002 dieback episode
During the second half of the 20th century the declining treesshowed higher BAI values than the non-declining ones(Fig. 2a). On average, the BAI of declining trees was almosttwofold that of non-declining trees for the period 1975–2001(average 8.06 versus 4.44 cm2, respectively; Student t-test,P < 0.001). Both tree groups exhibited a clear but briefincrease in productivity (period 1970–1975), which was fol-lowed by a decrease in BAI until 2001. After 2001, decliningtrees experienced an acute BAI reduction that was notobserved in non-declining individuals (BAI of 2.41 versus4.23 cm2, respectively; P < 0.05), and four out of 20 decliningtrees did not form rings 2 years after the onset of the dieback
episode in 2001 (Fig. 2a). Dendrometer records taken in 2008suggested that this growth decline was mainly due to a majordecrease in early wood formation in late spring and earlysummer (Supporting Information Fig. S3), and indicated apositive response of the radial increment to spring-summerprecipitation along with an interruption of growth inresponse to summer drought.
A significantly higher RW was also observed in decliningthan in non-declining trees for 1975–2001 (Fig. 2b) (1.30 versus0.78 mm, respectively; P < 0.001), but the rate of decrease inRW over time was significantly higher in declining thanin non-declining trees (-0.05 versus -0.02 mm year-1, respec-tively; P < 0.01). Conversely, RW measured in the apex for1990–2001 was lower in declining than in non-declining treesfor either early wood (0.88 versus 1.18 mm, respectively,P < 0.001) or late wood (0.24 versus 0.27 mm, respectively;P < 0.01) (Fig. 2c).A significantly decreasing RW over time wasalso observed in the apex, but only in the early wood of declin-ing trees (-0.06 mm yr-1). Regarding wood anatomy, we founda significantly (Student t-test, P = 0.0005) larger lumen widthin declining (mean � SE = 32.6 � 0.3 mm, mode = 31 mm, n =523) than in non-declining trees (31.3 � 0.3 mm,mode = 28 mm,n = 410) (Supporting Information Fig. S4).
Changes in D13C and d18O and associations withthe dieback episode
The time course of changes in stable isotopes before thedieback episode followed a similar pattern among tree
(a)
(b) (c)
Figure 2. Long-term growth, (a) basal area increment and (b)tree-ring width (RW) trends, for declining (D, filled symbols,dashed lines) and non-declining (ND, empty symbols, continuouslines) trees based on wood samples taken at breast height; (c)early wood (large symbols) and late wood (small symbols) widthsmeasured in apical wood samples. The grey boxes highlight thepost-2001 period. In the upper graph, the right y-axis shows theannual sample size (number of measured radii).
6 J. Voltas et al.
© 2013 Blackwell Publishing Ltd, Plant, Cell and Environment

classes (Fig. 3). Non-declining trees showed a significantlyhigher D13C than declining trees at breast height for theperiod 1975–2001 (14.9 versus 14.7‰, respectively; Studentt-test, P < 0.05) (Fig. 3a). However, there were no significantdifferences between tree classes for D13C in either apical earlywood or late wood sampled for the period 1990–2001(Fig. 3b, c). Declining trees had higher d18O in wood samplestaken at breast height than non-declining trees (32.8 versus32.1‰, respectively; P < 0.01) (Fig. 3d), but this tendencyreverted for apical samples (Fig. 3e, f), since non-decliningtrees exhibited higher d18O than declining individuals in bothearly wood (32.0 versus 30.8‰, respectively; P < 0.001) and
late wood samples (31.8 versus 30.8‰, respectively; P < 0.01).Significant and negative associations were detected betweenD13C and d18O for both stem heights but only in the case ofdeclining trees (Table 2). For apical samples, this relationshipwas attributable mainly to the variation common in the earlywood samples (r = -0.80, P < 0.01) rather than in the latewood ones (r = -0.50, ns). A significant positive correlationwas also observed between the D13C and RW of decliningtrees, but only at breast height (Table 2).
Tree-ring records estimated at breast height and in theapex were compared for each tree class. Growth patternsdiffered depending on tree condition (Table 3): the BAI and
(a) (b) (c)
(d) (e) (f)
Figure 3. Carbon (D13C; figures a, b, c) and oxygen (d18O; figures d, e, f) isotope data measured in wood samples taken at breast height (a,d) and near the apex (b, e, early wood; c, f, late wood) for declining (filled symbols, dashed lines) and non-declining (empty symbols,continuous lines) trees. The grey boxes highlight the post-2001 period.
Table 2. Correlations (Pearson coefficients)calculated between growth and isotope data fordeclining (D) and non-declining (ND) trees atbreast height (period 1975–2001; abovediagonal) or near the apex (period 1990–2001;below diagonal)
D-RW ND-RW D-D13C ND-D13C D-d18O ND-d18O
D-RW - 0.872** 0.427* 0.168 -0.027 -0.152ND-RW 0.896** - 0.466* 0.294 -0.014 0.021D-D13C 0.417 0.480 - 0.800** -0.476* -0.340ND-D13C 0.275 0.502 0.560 - -0.345 -0.170D-d18O -0.124 -0.097 -0.784** -0.415 - 0.436*ND-d18O -0.359 -0.283 -0.701* -0.316 0.853** -
Variables are abbreviated as follows: RW, tree-ring width; D13C, carbon isotope discrimina-tion in cellulose; d18O, oxygen isotope composition in cellulose. Significance levels:*0.01 < P � 0.05; **P � 0.01.
Scots pine disposition to winter-drought dieback 7
© 2013 Blackwell Publishing Ltd, Plant, Cell and Environment
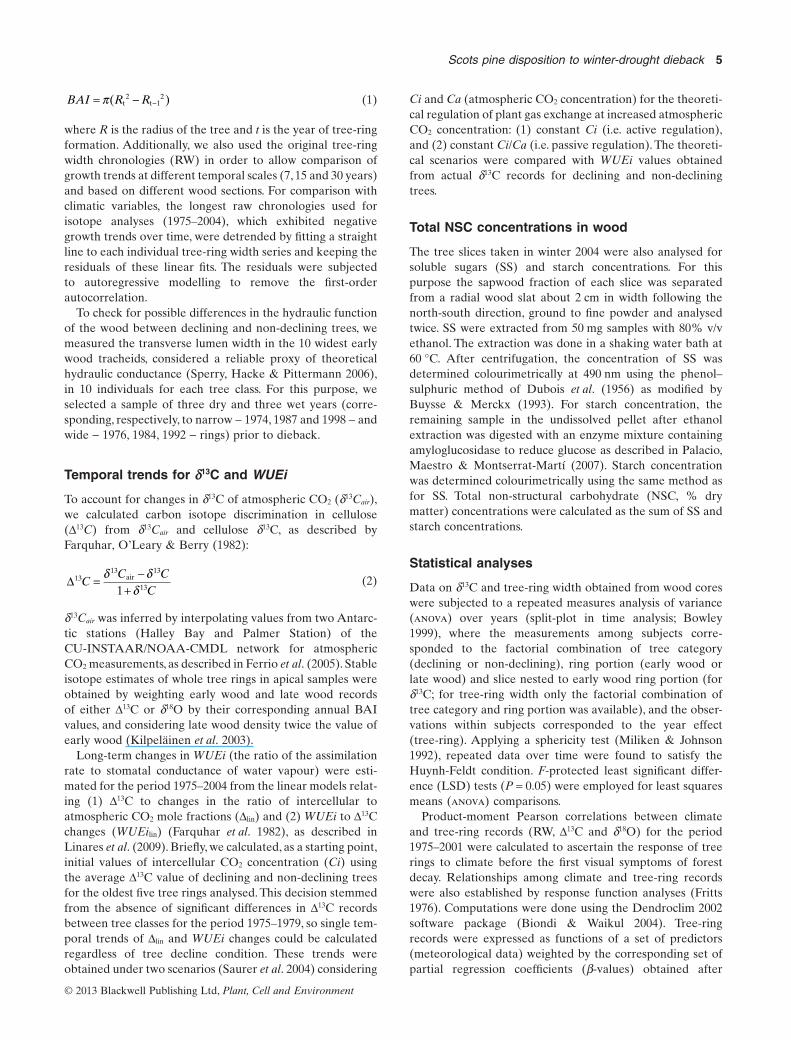
RW of non-declining trees were comparatively much higherin the apex than at breast height, these differences beingabsent in declining trees. Furthermore, D13C was higher in theapex than at breast height, regardless of tree condition, whiled18O was higher at breast height than in the apex, but only inthe case of declining trees (Table 3).
WUEi trends before the dieback occurred
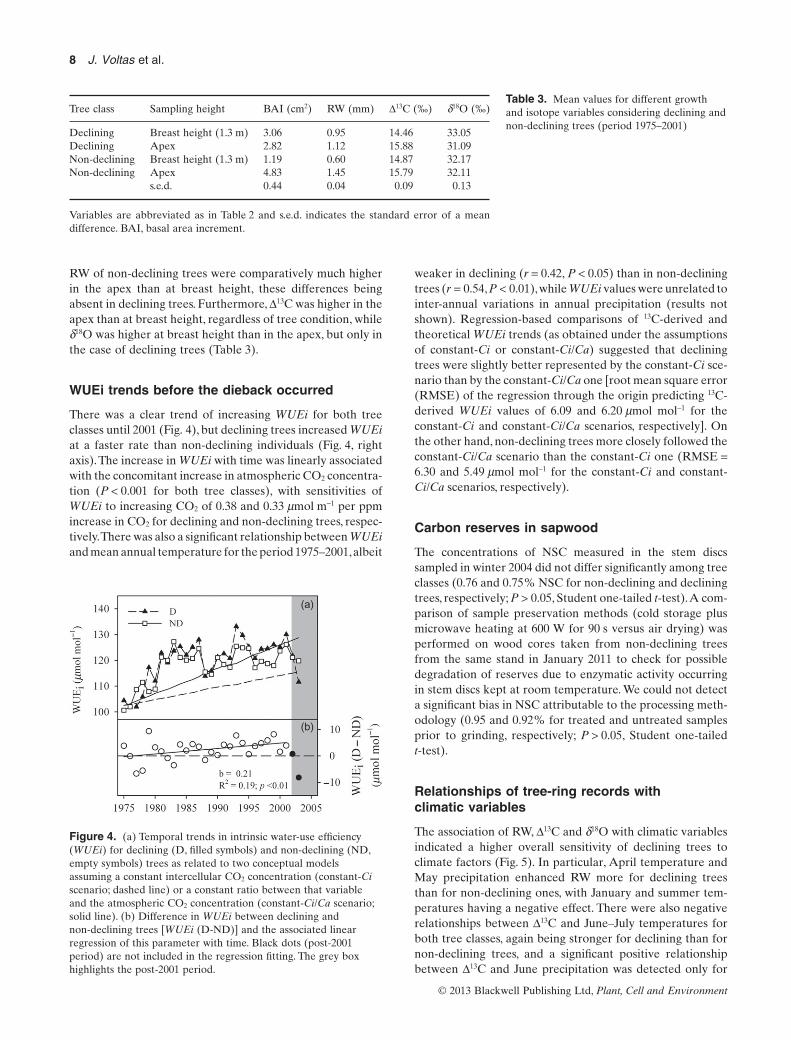
There was a clear trend of increasing WUEi for both treeclasses until 2001 (Fig. 4), but declining trees increased WUEiat a faster rate than non-declining individuals (Fig. 4, rightaxis).The increase in WUEi with time was linearly associatedwith the concomitant increase in atmospheric CO2 concentra-tion (P < 0.001 for both tree classes), with sensitivities ofWUEi to increasing CO2 of 0.38 and 0.33 mmol m-1 per ppmincrease in CO2 for declining and non-declining trees, respec-tively.There was also a significant relationship between WUEiand mean annual temperature for the period 1975–2001,albeit
weaker in declining (r = 0.42, P < 0.05) than in non-decliningtrees (r = 0.54,P < 0.01),while WUEi values were unrelated tointer-annual variations in annual precipitation (results notshown). Regression-based comparisons of 13C-derived andtheoretical WUEi trends (as obtained under the assumptionsof constant-Ci or constant-Ci/Ca) suggested that decliningtrees were slightly better represented by the constant-Ci sce-nario than by the constant-Ci/Ca one [root mean square error(RMSE) of the regression through the origin predicting 13C-derived WUEi values of 6.09 and 6.20 mmol mol-1 for theconstant-Ci and constant-Ci/Ca scenarios, respectively]. Onthe other hand, non-declining trees more closely followed theconstant-Ci/Ca scenario than the constant-Ci one (RMSE =6.30 and 5.49 mmol mol-1 for the constant-Ci and constant-Ci/Ca scenarios, respectively).
Carbon reserves in sapwood
The concentrations of NSC measured in the stem discssampled in winter 2004 did not differ significantly among treeclasses (0.76 and 0.75% NSC for non-declining and decliningtrees, respectively; P > 0.05, Student one-tailed t-test).A com-parison of sample preservation methods (cold storage plusmicrowave heating at 600 W for 90 s versus air drying) wasperformed on wood cores taken from non-declining treesfrom the same stand in January 2011 to check for possibledegradation of reserves due to enzymatic activity occurringin stem discs kept at room temperature. We could not detecta significant bias in NSC attributable to the processing meth-odology (0.95 and 0.92% for treated and untreated samplesprior to grinding, respectively; P > 0.05, Student one-tailedt-test).
Relationships of tree-ring records withclimatic variables
The association of RW, D13C and d18O with climatic variablesindicated a higher overall sensitivity of declining trees toclimate factors (Fig. 5). In particular, April temperature andMay precipitation enhanced RW more for declining treesthan for non-declining ones, with January and summer tem-peratures having a negative effect. There were also negativerelationships between D13C and June–July temperatures forboth tree classes, again being stronger for declining than fornon-declining trees, and a significant positive relationshipbetween D13C and June precipitation was detected only for
Table 3. Mean values for different growthand isotope variables considering declining andnon-declining trees (period 1975–2001)
Tree class Sampling height BAI (cm2) RW (mm) D13C (‰) d18O (‰)
Declining Breast height (1.3 m) 3.06 0.95 14.46 33.05Declining Apex 2.82 1.12 15.88 31.09Non-declining Breast height (1.3 m) 1.19 0.60 14.87 32.17Non-declining Apex 4.83 1.45 15.79 32.11
s.e.d. 0.44 0.04 0.09 0.13
Variables are abbreviated as in Table 2 and s.e.d. indicates the standard error of a meandifference. BAI, basal area increment.
(a)
(b)
Figure 4. (a) Temporal trends in intrinsic water-use efficiency(WUEi) for declining (D, filled symbols) and non-declining (ND,empty symbols) trees as related to two conceptual modelsassuming a constant intercellular CO2 concentration (constant-Ciscenario; dashed line) or a constant ratio between that variableand the atmospheric CO2 concentration (constant-Ci/Ca scenario;solid line). (b) Difference in WUEi between declining andnon-declining trees [WUEi (D-ND)] and the associated linearregression of this parameter with time. Black dots (post-2001period) are not included in the regression fitting. The grey boxhighlights the post-2001 period.
8 J. Voltas et al.
© 2013 Blackwell Publishing Ltd, Plant, Cell and Environment
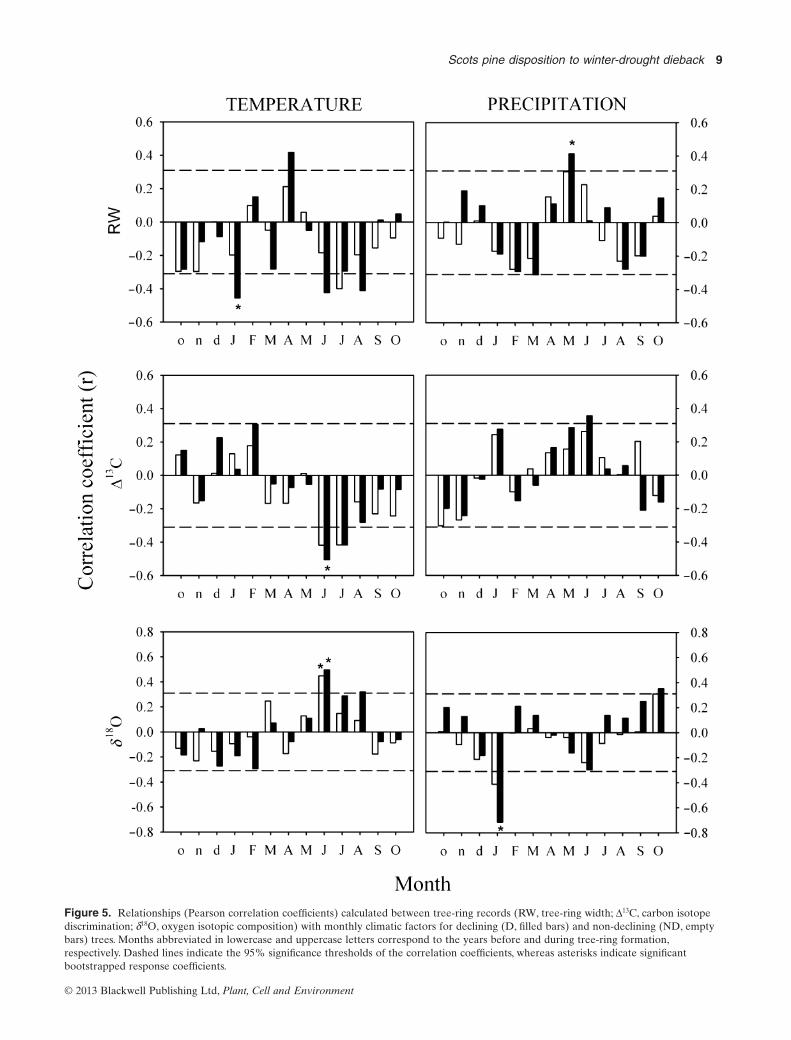
Figure 5. Relationships (Pearson correlation coefficients) calculated between tree-ring records (RW, tree-ring width; D13C, carbon isotopediscrimination; d18O, oxygen isotopic composition) with monthly climatic factors for declining (D, filled bars) and non-declining (ND, emptybars) trees. Months abbreviated in lowercase and uppercase letters correspond to the years before and during tree-ring formation,respectively. Dashed lines indicate the 95% significance thresholds of the correlation coefficients, whereas asterisks indicate significantbootstrapped response coefficients.
Scots pine disposition to winter-drought dieback 9
© 2013 Blackwell Publishing Ltd, Plant, Cell and Environment

declining trees. Both tree classes showed positive relation-ships between d18O and June temperature, and negative rela-tionships with January precipitation, with the latter beingespecially marked in declining trees.
Post-decline analyses of stable isotopesand growth
The post-2001 decline ANOVA revealed a significantyear ¥ tree class interaction for D13C, regardless of tree-ringsection (results not presented). This interaction stemmedfrom the ranking change in D13C among tree classes after theonset of the dieback episode in late 2001, with D13C values ofdeclining trees consistently exceeding those of non-decliningindividuals (Fig. 6). This interaction was not observed in theRW series, although declining trees grew significantly lessthan non-declining ones after the onset of the diebackepisode (2002 and 2003). However, there were no significantdifferences in RW among tree classes when considering thewhole period 2000–2006 (Fig. 6). At the intra-ring level,higher D13C values were usually found for early wood thanfor late wood slices in non-declining trees, with a tendency forD13C records to decrease over the course of any particularyear. More erratic fluctuations in D13C were, however,observed in declining trees.
DISCUSSION
Irrespective of tree status, we have observed a clear trend ofincreasing WUEi and decreasing radial growth in Scots pinetrees over a 25-year period of cumulative warming-induceddrought stress. This realization agrees with previous studiesreporting on the effect of temperature warming counteract-ing or even reversing the stimulating effect of rising atmos-pheric CO2 concentrations on growth since the 1970s inMediterranean conifers (Linares et al. 2009; Maseyk et al.
2011; Linares & Camarero 2012). If secondary growth isregarded as a surrogate of net carbon gain, then the trend fordecreasing growth but increasing WUEi points to a reductionin water losses rather than an increase in assimilation andproductivity over time. At first glance, our results seemconsistent with previous studies suggesting that P. sylvestrisgrowing under dry conditions are carbon-source limited(Eilmann et al. 2010; Galiano et al. 2011; but see Sala & Hoch2009; Gruber et al. 2012). However, we did not observe clearevidence of depleted carbon reserves in stems compared withhealthy Scots pine stands in southern Europe (Hoch, Richter& Körner 2003). More importantly, we did not detect anyrelevant association between carbon reserve depletion andtree decline status, as previously reported in Galiano et al.(2011) for this species in north-eastern Spain. Therefore,rather than carbon starvation, other mechanisms could haveplayed a major role in this dieback episode.
Long-term divergences between declining andnon-declining trees before dieback
A remarkable outcome of this study is that declining treesshowed a stronger coupling between climate, tree growth andWUEi estimates than non-declining individuals. The positivesignificant association between radial growth and D13C andthe stronger relationships between climate factors and eitherD13C or radial growth for declining trees support their greatergrowth dependence on WUEi. Thus, WUEi modulated thegrowth responses to long-term climate warming more tightlyin declining than in non-declining trees (Linares & Camarero2012). Comparing D13C and d18O, the two isotopes were nega-tively correlated only in declining trees, indicating theirstronger stomatal regulation of gas exchange (Scheideggeret al. 2000). This particular functional performance of declin-ing trees points to a greater climate sensitivity, as indicated bytheir highest growth responsiveness to wet spring and coolsummer conditions, and probably determined the fate ofthese individuals during the dieback episode triggered inwinter 2001. Therefore, previous climatic trends may havepredisposed trees in the same stand to winter-drought mor-tality in different fashions. An increase in climate sensitivityhas been already observed for P. sylvestris and other pinespecies during the last decades in the Iberian Peninsula inresponse to increasing climatic variability (Andreu et al.2007; Planells et al. 2009).
The divergence in radial growth and WUEi between treeclasses as the dieback episode approached suggests differ-ences in acclimation to climate warming. The observationthat declining trees showed larger radial growth rates thannon-declining individuals prior to dieback has also beendocumented for Austrocedrus chilensis subjected to recur-rent drought (Mundo et al. 2010), but disagrees with recentresults for P. sylvestris growing in north-eastern Spain(Heres et al. 2012) and the European Alps (Bigler et al.2006), in which the opposite pattern was observed. Consist-ent with our results, however, a reduction in growth ofdeclining trees compared with that of non-declining indi-viduals was reported following periods of severe drought in
Figure 6. Evolution of intra-ring D13C values (left y-axis) andtree-ring width (RW; right y-axis) for declining (D, filled symbols)and non-declining trees (ND, empty symbols) during the period2000–2006 (the grey area emphasizes the post-2001 period). Theintra-annual sections correspond to three similarly wide fractionsof early wood (E1, E2 and E3) and latewood (L).
10 J. Voltas et al.
© 2013 Blackwell Publishing Ltd, Plant, Cell and Environment

the aforementioned studies. In our case, the rising stomatalcontrol of water losses with time in declining trees, as alsosuggested by the divergent WUEi estimates over time (cf.Fig. 4), may be related to the fact that these trees were morevigorous in terms of growth (see the evolution of BAIduring the second half of the 20th century; Fig. 2) and wateruse (hydraulic conductivity), and may have presented alarger leaf-to-sapwood area ratio, and so were more com-pelled to avoid dehydration than their non-declining coun-terparts. In this regard, declining trees showed consistentlylarger tracheid lumen diameters than non-declining trees,suggesting enhanced conducting efficiency (Sperry et al.2006) but also reduced drought resistance and higher risk ofcavitation. Narrower conduits contribute to the survival oftrees confronted with a period of marked water deficit byconferring greater protection against drought- and freezing-induced cavitation (Rozenberg et al. 2012). Indeed, a tightcontrol of water loss protects the xylem against drought-induced embolism (Bréda et al. 2006).
The greater historical reduction in radial growth in theapex also points to a progressive hydraulic limitation indeclining trees, which often increases along the height ofthe tree (e.g. Waring & Silvester 1994; Martínez-Vilalta,Vanderklein & Mencuccini 2007; Woodruff et al. 2007). Fur-thermore, we observed a basipetal increase in d13C and d18Othat was particularly strong in declining trees. Remarkably,this trend goes in the opposite direction to the expectedphysiological response of pine needles along a canopy gradi-ent of decreasing hydraulic limitation, light and evaporativedemand (Scheidegger et al. 2000; Roden & Farquhar 2012).However, a similar trend of increasing d13C and d18O fromtwig to trunk phloem has been reported for P. sylvestris in SWGermany (Kodama et al. 2008; Gessler et al. 2009). Thus, theobserved uncoupling from the apex to the base would beattributable to a longer phloem transport, which in turnwould increase the chances for metabolic interconversionand subsequent isotope fractionation (Gessler et al. 2009). Inthis context, drought-induced limitation of phloem transport(see, e.g. Ruehr et al. 2009) could explain the stronger basip-etal changes observed in declining trees. Altogether, thesepoint to a process of decline starting at the top of the canopyand extending downwards, as has been reported in nearbyareas in response to summer drought (Camarero et al. 2011)or mistletoe infection (Sangüesa-Barreda et al. 2012).
The greater sensitivity of WUEi to Ca in declining indi-viduals suggests a shift in gas exchange performance fromregulation aimed at optimizing Ci/Ca in non-declining trees(constant-Ci/Ca scenario) towards increasing WUEi indeclining trees (constant-Ci scenario, depicting the strongestresponse to Ca). A similar behaviour has been described atopposing ends of a hydrological gradient by Maseyk et al.(2011), when analysing the interactions of WUEi with envi-ronmental conditions in P. halepensis. In our case, however,individuals of either type, showing different gas exchangeregimes, were found co-occurring and sharing similar micro-habitats. Specifically, declining trees showed an active physi-ological response to temperature warming, with a greatercontrol of water losses under drought stress that was most
likely conditioned by an enhanced hydraulic conductivityand radial growth. The exact causes of these different per-formances remain unknown, but meaningful environmentalcorrelates of forest dieback, if they exist, would be extremelydifficult to detect at the single-stand level since no obviouscompetition, age or spatial pattern could be observed under-lying growth decline, tree defoliation and mortality.
Alternatively, a predisposing agent of genetic nature couldplay a key role in this matter. Indeed, intraspecific variationin WUEi has been reported for P. sylvestris (Cregg & Zhang2001), and intra-population variation for d13C in needles canbe sizeable, translating into up to a 20% difference in WUEifor P. pinaster (Aranda et al. 2010; Corcuera, Gil-Pelegrín &Notivol 2010). This may be an important mechanism avail-able to local populations facing future climatic change, sug-gesting the existence of adaptive genetic variation uponwhich natural selection processes could act. We might bewitnessing this phenomenon already taking place in thesesouthernmost populations of P. sylvestris, although artificialselection experiments would be needed to further validatethis hypothesis.
Reanalysing the dieback episode based onretrospective evidence
Peguero-Pina et al. (2011) attributed the 2001–2002 diebackepisode to the combination of (1) low soil temperatureslimiting water uptake, (2) a higher vulnerability to drought-induced embolism in declining individuals (c. 27%) owing tothe presence of repeated freeze-thaw cycles (Mayr, Wieser &Bauer 2006), and (3) high winter radiation levels increasingwater losses due to transpiration. This set of inciting factorswas proposed based on physiological data taken in 2007, butthe pre-dieback history of the trees was not examined. Ourstudy demonstrates that trees were differentially predisposedto experience dieback owing to divergences among treeclasses in the interplay between mechanisms involved in thecarbon-water economy: WUEi response to Ca and climate,hydraulic architecture and secondary growth dynamics overtime.
Differences in hydraulic architecture between tree classesmay have favoured the performance of declining individualsunder relatively mild climatic conditions (i.e. before c. 1970,when Ca and temperature increased faster). However, thissituation reversed from 1975 onwards, as declining treesstarted to prioritize water saving more than non-decliningindividuals did. The abrupt change in temperature inautumn-winter 2001 probably unveiled such differences inphysiological behaviour, hence triggering dieback. Indeed,conduits wider than 30 mm are more vulnerable to cavitationinduced by freeze–thaw cycles (Sperry et al. 2006). Strikingsimilarities in tree performance can be found between thepresent study and the mortality episode reported by Levanic,Cater & McDowell (2011) in a Quercus robur forest after asoil drainage event. Although the factors inciting declinediffer between studies, these authors proposed (based onradial growth, D13C and wood anatomical measurements)that dying trees were also hydraulically underbuilt for dry
Scots pine disposition to winter-drought dieback 11
© 2013 Blackwell Publishing Ltd, Plant, Cell and Environment

conditions, predisposing them to severe hydraulic constraintsand subsequent mortality. In this regard, calcium plays amajor role in cavitation resistance in trees (including P. syl-vestris), emphasizing the fundamental effect of wall pectins inthis mechanism (Herbette & Cochard 2010). Interestingly,Alquézar-Alquézar et al. (2008) reported a calcium defi-ciency in needles of declining trees in Scots pine standslocated in the same area of this study. This phenomenon wasattributed to chronic drought stress impairing mineraluptake, which is fully consistent with our observations andhighlights the complexity of processes underlying climate-driven forest dieback (McDowell et al. 2011).
The absence of differences in non-structural carbohydrateconcentrations between declining and non-declining trees,and evidence for a hydraulic control of stomatal conductanceon declining trees as suggested by (1) the WUEi responses toCa and climate and (2) the differences in tracheid lumenwidth, indicate limited interactions between plant hydraulicsand carbon storage in this study. On the contrary, winter-drought induced dieback seemed unrelated to hydraulicconstraints on carbon acquisition over a 25-year periodof cumulative warming-induced drought stress. However,impairment of long-distance phloem transport caused bydrought (Ruehr et al. 2009; Sala et al. 2010) could have playeda role as an additional mechanism underpinning the pro-posed carbon-water interdependency of climate-driven mor-tality (McDowell et al. 2011). This possibility is indirectlysupported by the greater basipetal isotope fractionation indeclining trees, which could have resulted from a longerphloem transport (Gessler et al. 2009).Analysing the year-to-year evolution in sugar contents of different tissues up to thepoint of tree death would be crucial to clarifying this point(McDowell & Sevanto 2010). In any case, this diebackepisode adds to a growing body of literature reporting onforest mortality and decline under climate change (Allenet al. 2010), but in a different fashion as drought and lowtemperatures in winter are here identified as short-termstressors (or inciting factors) triggering tree death after along-term climate-induced physiological stress driven bywarm temperatures. Therefore, extreme climate events mayact as key triggers of dieback events in a future warmerworld.
Performance of declining and non-decliningtrees after dieback
The pre-dieback and immediate post-dieback D13C values ofsurviving trees (either declining or non-declining) agreedwith those reported from felled trees in 2004: declining treespresented higher D13C values than non-declining ones before2002, but lower D13C values in 2002–2003. This realizationsuggests that the logged trees used for retrospective analysisperformed similarly to the trees sampled in 2009 (i.e. noobvious bias was introduced when coring additional trees), sothe latter likely provided reliable information on the physi-ological reaction of severely defoliated trees after 2002.
Post-dieback responses of declining trees reversedpre-dieback trends in terms of WUEi. Consequently,
non-declining individuals showed enhanced WUEi for theperiod 2002–2006 as compared with declining trees. This per-formance could not be attributed categorically to either anincrease in D13C in declining trees or a decrease in D13C innon-declining trees. Rather, both effects seemed to deter-mine the pace of responses over time (cf. Fig. 6). On the onehand, the trend of increasing WUEi in non-declining treesfollows the response to temperature warming and Ca riseobserved during the last quarter of the 20th century. On theother hand, the decrease in WUEi observed in declining treescould be due either to an uncoupling of regulatory mecha-nisms of water-carbon economy in senescing needles or to afaster recovery at the leaf level of highly defoliated, decliningtrees owing to their lower water demand. The former expla-nation is supported by the lower leaf water potential and lossof conductivity in branches of defoliated trees reported byPeguero-Pina et al. (2011). However, radial growth was notsignificantly affected by the reduction in photosynthetictissue and carbon reserves were not depleted in decliningtrees, hence sustaining the possibility of a rapid recovery ofcanopy functions following needle shedding (Galiano et al.2011). Further ecophysiological work is needed to interpretthe post-dieback performance of damaged trees in relation toopportunities for an eventual recovery through acclimationprocesses as opposed to an exacerbation of mortality rates inalready debilitated populations.
ACKNOWLEDGMENTS
This work was partially supported by the DGI projectsCGL2009-13079-C02-01 and CGL2011-26654 and grant FP7-PEOPLE-2009-RG-246725 (SMARTREES). We acknowl-edge R. Hernández, M. Maestro, V. Pérez-Fortea and P.Sopeña for field and technical assistance. J.P.F. is supportedby a postdoctoral contract from the ‘Ramon y Cajal’ pro-gramme (MCINN). We also thank two anonymous reviewersand the editor for their useful comments.
REFERENCES
Allen C.D., Macalady A.K., Chenchouni H., et al. (2010) A global overview ofdrought and heat-induced tree mortality reveals emerging climate changerisks for forests. Forest Ecology and Management 259, 660–684.
Alquézar-Alquézar J.M., Peguero-Pina J.J., García Saganta M., Gil-Pelegrín E.,Ibarra Ibáñez N. & Martín-Bernal E. (2008) El calcio en las acículas comoindicador de predisposición al decaimiento en masas de Pinus sylvestris L. enla provincia de Teruel. Cuadernos de la Sociedad Española de CienciasForestales 26, 109–112.
Andreu L., Gutiérrez E., Macias M., Ribas M., Bosch O. & Camarero J.J.(2007) Climate increases regional tree-growth variability in Iberian pineforests. Global Change Biology 13, 804–815.
Aranda I., Alía R., Ortega U., Dantas A.K. & Majada J. (2010) Intra-specificvariability in biomass partitioning and carbon isotopic discrimination undermoderate drought stress in seedlings from four Pinus pinaster populations.Tree Genetics & Genomes 6, 169–178.
Barbour M.M., Walcroft A.S. & Farquhar G.D. (2002) Seasonal variation ind13C and d18O of cellulose from growth rings of Pinus radiata. Plant, Cell &Environment 25, 1483–1499.
Bigler C., Braker O.U., Bugmann H., Dobbertin M. & Rigling A. (2006)Drought as an inciting mortality factor in Scots pine stands of the Valais,Switzerland. Ecosystems 9, 330–343.
Biondi F. & Waikul K. (2004) DENDROCLIM 2002: a C++ program forstatistical calibration of climate signals in tree-ring chronologies. Computers& Geosciences 30, 303–311.
12 J. Voltas et al.
© 2013 Blackwell Publishing Ltd, Plant, Cell and Environment

Bowley S.R. (1999) A Hitchhiker’s Guide to Statistics in Plant Biology. AnyOld Subject Books, Guelph, ON, Canada.
Bréda N., Huc R., Granier A. & Dreyer E. (2006) Temperate forest trees andstands under severe drought: a review of ecophysiological responses, adap-tation processes and long-term consequences. Annals of Forest Science 63,625–544.
Buysse J. & Merckx R. (1993) An improved colorimetric method to quantifysugar content of plant tissue. Journal of Experimental Botany 44, 1627–1629.
Camarero J.J. & Sancho-Benages S. (2006) Dendroecología, decaimiento delbosque y patrones no lineares entre clima y crecimiento radial. V Congresode la Asociación Española de Climatología, Zaragoza, Spain. Available athttp://www.aeclim.org/images/stories/articulos_pdf/Vcongreso/clima_sistemas_naturales/camarero.pdf
Camarero J.J., Bigler C.J., Linares J.C. & Gil-Pelegrín E. (2011) Synergisticeffects of past historical logging and drought on the decline of Pyreneansilver fir forests. Forest Ecology and Management 262, 759–769.
Ceulemans R., Janssens I.A. & Jach M.E. (1999) Effects of CO2 enrichment ontrees and forests: lessons to be learned in view of future ecosystem studies.Annals of Botany 84, 577–590.
Corcuera L., Gil-Pelegrín E. & Notivol E. (2010) Phenotypic plasticity in Pinuspinaster d13C: environment modulates genetic variation. Annals of ForestScience 67, 812–820.
Cregg B.M. & Zhang J.W. (2001) Physiology and morphology of Pinus sylves-tris seedlings from diverse sources under cyclic drought stress. ForestEcology and Management 154, 131–139.
Cropper J.P. (1984) Multicollinearity within selected western North Americantemperature and precipitation data sets. Tree-Ring Bulletin 44, 29–37.
Dubois M., Gilles K.A., Hamilton J.K., Rebers P.A. & Smith F. (1956) Colori-metric method for determination of sugars and related substances. Analyti-cal Chemistry 28, 350–356.
Eilmann B., Buchmann N., Siegwolf R., Saurer M., Cherubini P. & Rigling A.(2010) Fast response of Scots pine to improved water availability reflected intree-ring width and d13C. Plant, Cell & Environment 33, 1351–1360.
Farquhar G.D., O’Leary M.H. & Berry J.A. (1982) On the relationshipbetween carbon isotope discrimination and the intercellular carbon dioxideconcentration in leaves. Australian Journal of Plant Physiology 9, 121–137.
Ferrio J.P. & Voltas J. (2005) Carbon and oxygen isotope ratios in woodconstituents of Pinus halepensis as indicators of precipitation, temperatureand vapour pressure deficit. Tellus B 57, 164–173.
Ferrio J.P., Araus J.L., Buxó R., Voltas J. & Bort J. (2005) Water managementpractices and climate in ancient agriculture: inference from the stableisotope composition of archaeobotanical remains. Vegetation History andArchaeobotany 14, 510–517.
Francey R.J. & Farquhar G.D. (1982) An explanation of 13C/12C variations intree rings. Nature 297, 28–31.
Fritts H.C. (1976) Tree Rings and Climate. Academic Press, London, UK.Galiano L., Martínez-Vilalta J. & Lloret F. (2010) Drought-induced multifactor
decline of Scots pine in the Pyrenees and potential vegetation change by theexpansion of co-occurring oak species. Ecosystems 13, 978–991.
Galiano L., Martínez-Vilalta J. & Lloret F. (2011) Carbon reserves and canopydefoliation determine the recovery of Scots pine 4 years after a droughtepisode. New Phytologist 190, 750–759.
Gessler A., Brandes E., Buchmann N., Helle G., Rennenberg H. & BarnardR.L. (2009) Tracing carbon and oxygen isotope signals from newly assimi-lated sugars in the leaves to the tree-ring archive. Plant, Cell & Environment32, 780–795.
Gruber A., Pirkebner D., Florian C. & Oberhuber W. (2012) No evidence fordepletion of carbohydrate pools in Scots pine (Pinus sylvestris L.) underdrought stress. Plant Biology 14, 142–148.
Guerrieri M.R., Siegwolf R.T.W., Saurer M., Jäggi M., Cherubini P., RipulloneF. & Borghetti M. (2009) Impact of different nitrogen emission sources ontree physiology as assessed by a triple stable isotope approach. AtmosphericEnvironment 43, 410–418.
Guiot J. (1991) The bootstrapped response function. Tree-Ring Bulletin 51,39–41.
Herbette S. & Cochard H. (2010) Calcium is a major determinant of xylemvulnerability to cavitation. Plant Physiology 153, 1932–1939.
Heres A.M., Martínez-Vilalta J. & Claramunt-López B. (2012) Growth pat-terns in relation to drought-induced mortality at two Scots pine (Pinussylvestris L.) sites in NE Iberian Peninsula. Trees 23, 621–630.
Hoch G., Richter A. & Körner C. (2003) Non-structural carbon compounds intemperate forest trees. Plant, Cell & Environment 26, 1067–1081.
Holmes R.L. (1983) Computer-assisted quality control in tree-ring dating andmeasurement. Tree-Ring Bulletin 43, 68–78.
Kilpeläinen A., Peltola H., Ryyppö A., Sauvala K., Laitinen K. & Kellomäki S.(2003) Wood properties of Scots pines (Pinus sylvestris) grown at elevatedtemperature and carbon dioxide concentration. Tree Physiology 23, 889–897.
Kodama N., Barnard R., Salmon Y., et al. (2008) Temporal dynamics of thecarbon isotope composition in a Pinus sylvestris stand: from newly assimi-lated organic carbon to respired CO2. Oecologia 156, 737–750.
Kullman L. (1991) Cataclysmic response to recent cooling of a natural borealpine (Pinus sylvestris L.) forest in Northern Sweden. New Phytologist 117,351–360.
Leavitt S.W. & Danzer S.R. (1993) Method for batch processing small woodsamples to holocellulose for stable-carbon isotope analysis. Annals of Chem-istry 65, 87–89.
Leonardi S., Gentilesca T., Guerrieri R., Ripullone F., Magnani F., MencucciniM., Noije T.V. & Borghetti M. (2012) Assessing the effects of nitrogendeposition and climate on carbon isotope discrimination and intrinsic water-use efficiency of angiosperm and conifer trees under rising CO2 conditions.Global Change Biology 18, 2925–2944.
Levanic T., Cater M. & McDowell N.G. (2011) Associations between growth,wood anatomy, carbon isotope discrimination and mortality in a Quercusrobur forest. Tree Physiology 31, 298–308.
Linares J.C. & Camarero J.J. (2012) From pattern to process: linking water-useefficiency to drought-induced forest decline. Global Change Biology 18,1000–1015.
Linares J.C., Delgado-Huertas A., Camarero J.J., Merino J. & Carreira J.A.(2009) Competition and drought limit the response of water-use efficiency torising atmospheric carbon dioxide in the Mediterranean fir Abies pinsapo.Oecologia 161, 611–624.
Loader N.J., Robertson I., Barker A.C., Switsur V.R. & Waterhouse J.S. (1997)An improved technique for the batch processing of small whole woodsamples to alpha-cellulose. Chemical Geology 136, 313–317.
McDowell N.G. & Sevanto S. (2010) The mechanisms of carbon starvation:How, when, or does it even occur at all? New Phytologist 186, 264–266.
McDowell N.G., Pockman W.T., Allen C.D., et al. (2008) Mechanisms of plantsurvival and mortality during drought: why do some plants survive whileothers succumb to drought? New Phytologist 178, 719–739.
McDowell N.G., Beerling D.J., Breshears D.D., Fisher R.A., Raffa K.F. & StittM. (2011) The interdependence of mechanisms underlying climate-drivenvegetation mortality. Trends in Ecology and Evolution 26, 523–532.
Manion P.D. (1991) Tree Disease Concepts. Prentice Hall, Upper Saddle River,NJ, USA.
Martínez-Vilalta J. & Piñol J. (2002) Drought-induced mortality and hydraulicarchitecture in pine populations of the NE Iberian Peninsula. Forest Ecologyand Management 161, 247–256.
Martínez-Vilalta J., Vanderklein D. & Mencuccini M. (2007) Tree height andage-related decline in growth in Scots pine (Pinus sylvestris L.). Oecologia150, 529–544.
Martínez-Vilalta J., López B.C., Adell N., Badiella L. & Ninyerola M. (2008)Twentieth century increase of Scots pine radial growth in NE Spain showsstrong climate interactions. Global Change Biology 14, 2868–2881.
Maseyk K., Hemming D., Angert A., Leavitt S.W. & Yakir D. (2011) Increasein water-use efficiency and underlying processes in pine forests across aprecipitation gradient in the dry Mediterranean region over the past 30years. Oecologia 167, 573–585.
Mayr S., Wieser G. & Bauer H. (2006) Xylem temperatures during winter inconifers at the alpine timberline. Agricultural and Forest Meteorology 137,81–88.
Miliken G.A. & Johnson D.E. (1992) Analysis of Messy Data. Vol. 1. DesignedExperiments. Chapman and Hall, London, UK.
Mitchell T.D. & Jones P.D. (2005) An improved method of constructing adatabase of monthly climate observations and associated high-resolutiongrids. International Journal of Climatology 25, 693–712.
Moreno-Gutiérrez C., Barberà G., Nicolás E., de Luis M., Castillo V.M.,Martínez-Fernández F. & Querejeta J.I. (2011) Leaf d18O of remaining treesis affected by thinning intensity in a semiarid pine forest. Plant, Cell &Environment 34, 1009–1019.
Mundo I.A., El Mutjar V.A., Perdomo M.H., Gallo L.A., Villalba R. & BarreraM.D. (2010) Austrocedrus chilensis growth decline in relation to droughtevents in northern Patagonia, Argentina. Trees 24, 561–570.
Ninyerola M., Pons X. & Roure J.M. (2005) Atlas Climático Digital de laPenínsula Ibérica. Metodología y aplicaciones en bioclimatología y geo-botánica. Universidad Autónoma de Barcelona, Barcelona, Spain.
Scots pine disposition to winter-drought dieback 13
© 2013 Blackwell Publishing Ltd, Plant, Cell and Environment

Palacio S., Maestro M. & Montserrat-Martí G. (2007) Seasonal dynamics ofnon-structural carbohydrates in two species of Mediterranean sub-shrubswith different leaf phenology. Environmental and ExperimentalBotany 59, 34–42.
Peguero-Pina J.J., Alquézar-Alquézar J.M., Mayr S., Cochard H. & Gil-Pelegrín E. (2011) Embolism induced by winter drought may be critical forthe survival of Pinus sylvestris L. near its southern distribution limit. Annalsof Forest Science 68, 565–574.
Peña-Monné J.L., Cuadrat-Prats J.M. & Sánchez-Fabre M. (2002) El clima dela provincia de Teruel. Instituto de Estudios Turolenses, Teruel, Spain.
Peñuelas J., Hunt J.M., Ogaya R. & Jump A.S. (2008) Twentieth centurychanges of tree-ring d13C at the southern range-edge of Fagus sylvatica:increasing water-use efficiency does not avoid the growth decline induced bywarming at low altitudes. Global Change Biology 14, 1076–1088.
Planells O., Gutiérrez E., Helle G. & Schleser G.H. (2009) A forced responseto twentieth century climate conditions of two Spanish forests inferredfrom widths and stable isotopes of tree rings. Climatic Change 97, 229–252.
Richardson D.M. (1998) Ecology and Biogeography of Pinus. Cambridge Uni-versity Press, Cambridge, UK.
Roden J.S. & Farquhar G.D. (2012) A controlled test of the dual-isotopeapproach for the interpretation of stable carbon and oxygen isotope ratiovariation in tree rings. Tree Physiology 32, 490–503.
Rozenberg P., Sergent A.S., Dalla-Salda G., Martínez-Meier A., Marín S.,Ruiz-Díaz M., Bastien J.C., Sánchez L. & Bréda N. (2012) Retrospectiveanalysis of the adaptation of the Douglas-fir to drought. Swiss ForestryJournal 163, 88–95.
Ruehr N.K., Offermann C.A., Gessler A., Winkler J.B., Ferrio J.P., BuchmannN. & Barnard R.L. (2009) Drought effects on allocation of recent carbon:from beech leaves to soil CO2 efflux. New Phytologist 184, 950–961.
Sala A. & Hoch G. (2009) Height-related growth declines in ponderosapine are not due to carbon limitation. Plant, Cell & Environment 32, 22–30.
Sala A., Piper F. & Hoch G. (2010) Physiological mechanisms of drought-induced tree mortality are far from being resolved. New Phytologist 186,274–281.
Sangüesa-Barreda G., Linares J.C. & Camarero J.J. (2012) Mistletoe effects onScots pine decline following drought events: insights from within-tree spatialpatterns, growth and carbohydrates. Tree Physiology 32, 585–598.
Saurer M., Borella S. & Leuenberger M. (1997) d18O of tree rings of beech(Fagus sylvatica) as a record of d18O of the growing season precipitation.Tellus B 49, 80–92.
Saurer M., Siegwolf R. & Schweingruber F. (2004) Carbon isotope discrimina-tion indicates improving water-use efficiency of trees in northern Eurasiaover the last 100 years. Global Change Biology 10, 2109–2120.
Scheidegger Y., Saurer M., Bahn M. & Siegwolf R. (2000) Linking stableoxygen and carbon isotopes with stomatal conductance and photosyntheticcapacity: a conceptual model. Oecologia 125, 350–357.
Sperry J.S., Hacke U.G. & Pittermann J. (2006) Size and function in conifertracheids and angiosperm vessels. American Journal of Botany 93, 1490–1500.
Waring R.H. & Silvester W.B. (1994) Variation in foliar d13C values within thecrowns of Pinus radiata trees. Tree Physiology 14, 1203–1213.
Waterhouse J.S., Switsur V.R., Barker A.C., Carter A.H.C., Hemming D.L.,Loader N.J. & Robertson I. (2004) Northern European trees show a pro-gressive diminishing response to increasing atmospheric carbon dioxide con-centrations. Quaternary Science Reviews 23, 803–810.
Woodruff D.R., McCulloh K.A., Warren J.M., Meinzer F.C. & Lachenbruch B.(2007) Impacts of tree height on leaf hydraulic architecture and stomatalcontrol in Douglas-fir. Plant, Cell & Environment 30, 559–569.
Received 24 September 2012; received in revised form 13 January2013; accepted for publication 16 January 2013
SUPPORTING INFORMATION
Additional Supporting Information may be found in theonline version of this article at the publisher’s web-site:
Figure S1. Long-term climatic trends recorded in the studyarea. Above: mean annual temperatures (T): thin line, CRUdataset; bold line, data from Teruel meteorological stationcorrected for the altitude of Alcalá de la Selva (-0.65 °Cevery 100 m gained in elevation). Below: total annual precipi-tation (P): thin line, CRU dataset; bold line, data fromAlcalá de la Selva meteorological station. CRU trends weresmoothed by LOESS fitting (span = 0.5). Temperature trendsfrom Teruel were fitted to a linear regression (slope =0.025 °C yr-1). The grey bars highlight climatic conditionsafter the 2001–2002 dieback episode.Figure S2. Trees affected by winter-drought induced diebackin the study area showing brown needles (the photographwas taken in February 2002).Figure S3. Estimated rates of radial increment for declining(D) and non-declining (ND) trees based on manual banddendrometers recorded in 2008 (means � SE) and relatedclimatic conditions (T, mean monthly temperature; P, totalmonthly precipitation).Figure S4. Frequencies of earlywood (EW) tracheids as afunction of their transversal lumen diameter for declining (D,filled bars) and non-declining (ND, hatched bars) Scots pines.The frequencies between both types of trees were computedconsidering years of high (wide rings: 1976, 1984 and 1992)and low radial growth (small rings: 1974, 1987, 1998). Fre-quencies were compared among decline classes to test thenull hypothesis that the lumen distributions of the two groupsof trees did not differ using an adjusted G test (Gadj).
14 J. Voltas et al.
© 2013 Blackwell Publishing Ltd, Plant, Cell and Environment
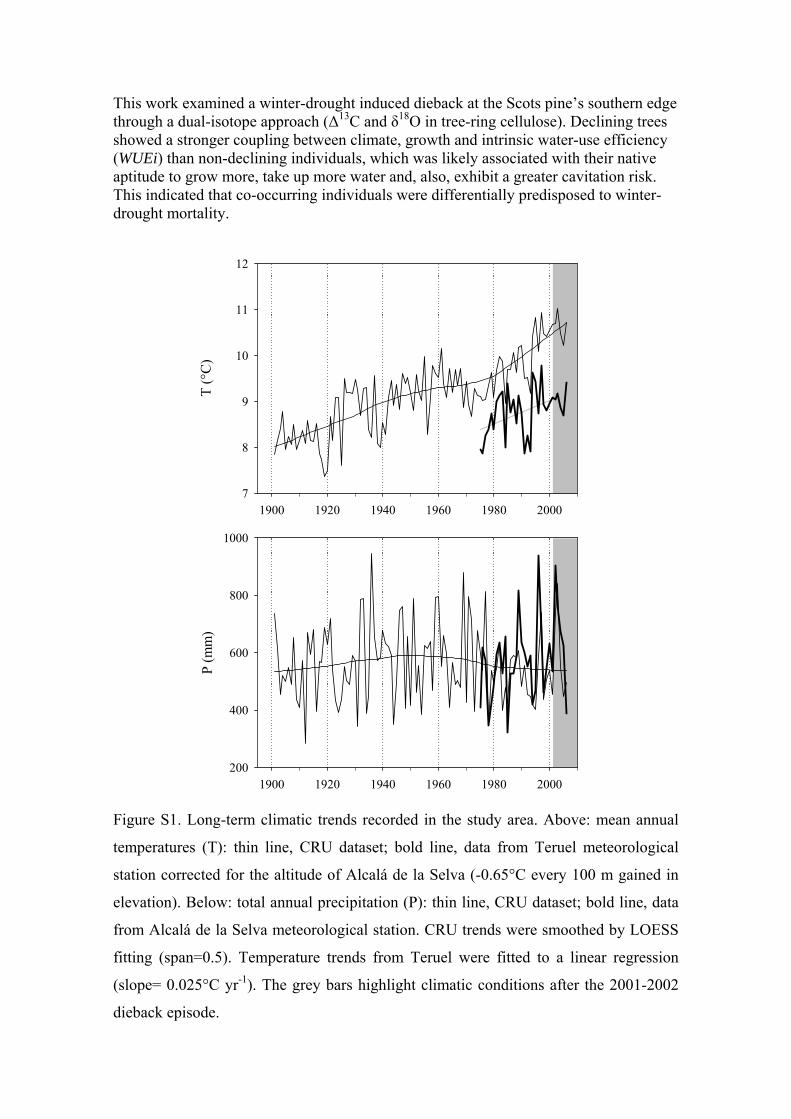
This work examined a winter-drought induced dieback at the Scots pine’s southern edge through a dual-isotope approach (Δ13C and δ18O in tree-ring cellulose). Declining trees showed a stronger coupling between climate, growth and intrinsic water-use efficiency (WUEi) than non-declining individuals, which was likely associated with their native aptitude to grow more, take up more water and, also, exhibit a greater cavitation risk. This indicated that co-occurring individuals were differentially predisposed to winter-drought mortality.
1900 1920 1940 1960 1980 2000
T (°
C)
7
8
9
10
11
12
1900 1920 1940 1960 1980 2000
P (m
m)
200
400
600
800
1000
Figure S1. Long-term climatic trends recorded in the study area. Above: mean annual
temperatures (T): thin line, CRU dataset; bold line, data from Teruel meteorological
station corrected for the altitude of Alcalá de la Selva (-0.65°C every 100 m gained in
elevation). Below: total annual precipitation (P): thin line, CRU dataset; bold line, data
from Alcalá de la Selva meteorological station. CRU trends were smoothed by LOESS
fitting (span=0.5). Temperature trends from Teruel were fitted to a linear regression
(slope= 0.025°C yr-1). The grey bars highlight climatic conditions after the 2001-2002
dieback episode.

Figure S2. Trees affected by winter-drought induced dieback in the study area showing
brown needles (the photograph was taken in February 2002).

25 50 75 100 125 150 175 200 225 250 275 300 325 350Rad
ial i
ncre
men
t rat
e (m
m d
ay-1
)
0.000
0.005
0.010
0.015 DND
J F M A M J J A S O N D
T (ºC
)
010203040506070
P (m
m)
020406080100120140
Figure S3. Estimated rates of radial increment for declining (D) and nondeclining (ND)
trees based on manual band dendrometers recorded in 2008 (means ± SE) and related
climatic conditions (T, mean monthly temperature; P, total monthly precipitation).
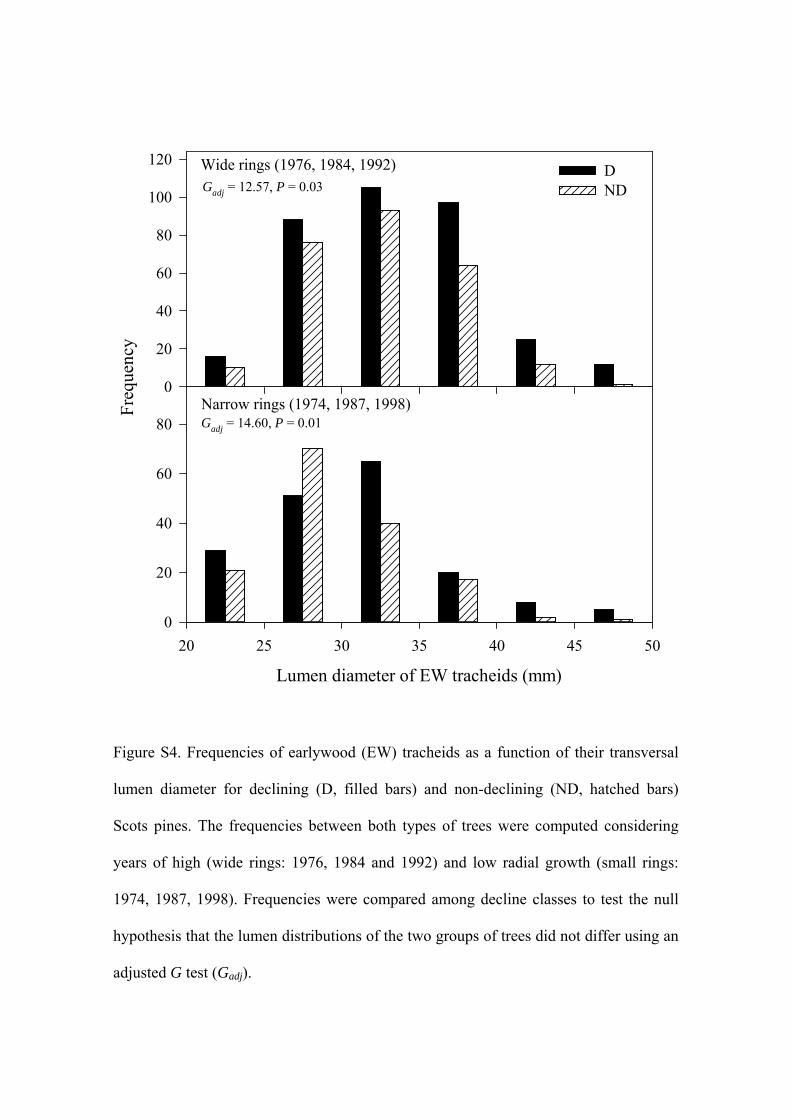
Wide rings (1976, 1984, 1992)
Freq
uenc
y
0
20
40
60
80
100
120DND
Narrow rings (1974, 1987, 1998)
Lumen diameter of EW tracheids (mm)
20 25 30 35 40 45 500
20
40
60
80
Gadj = 12.57, P = 0.03
Gadj = 14.60, P = 0.01
Figure S4. Frequencies of earlywood (EW) tracheids as a function of their transversal
lumen diameter for declining (D, filled bars) and non-declining (ND, hatched bars)
Scots pines. The frequencies between both types of trees were computed considering
years of high (wide rings: 1976, 1984 and 1992) and low radial growth (small rings:
1974, 1987, 1998). Frequencies were compared among decline classes to test the null
hypothesis that the lumen distributions of the two groups of trees did not differ using an
adjusted G test (Gadj).