
Developing a school-based universal screening tool to identify ...
486
Developing a school-based universal screening tool to identify deficits in fundamental movement skills in children aged 5-11 years Lucy Hannah Eddy Submitted in accordance with the requirements for the degree of Doctor of Philosophy The University of Leeds School of Psychology September 2021
-
Upload
khangminh22 -
Category
Documents
-
view
3 -
download
0
Transcript of Developing a school-based universal screening tool to identify ...

Developing a school-based universal screening tool to identify
deficits in fundamental movement skills in children aged 5-11
years
Lucy Hannah Eddy
Submitted in accordance with the requirements for the degree of
Doctor of Philosophy
The University of Leeds
School of Psychology
September 2021


I
The candidate confirms that the work submitted is her own, except where work
which has formed part of jointly-authored publications has been included. The
contribution of the candidate and the other authors to this work has been
explicitly indicated below. The candidate confirms that appropriate credit has
been given within the thesis where reference has been made to the work of
others.
The data presented in Chapter 2 has been accepted for publication:
Eddy, L. H., Bingham, D. D., Crossley, K. L., Shahid, N. F., Ellingham-Khan,
M., Otteslev, A., ... & Hill, L. J. B. (2020). The validity and reliability of
observational assessment tools available to measure fundamental movement
skills in school-age children: A systematic review. PloS one, 15(8), e0237919.
The data presented in Chapter 3 has been accepted for publication:
Eddy, L. H., Hill, L. J. B., Mon-Williams, M., Preston, N., Daly-Smith, A., Medd,
G., & Bingham, D. D. (2021). Fundamental movement skills and their
assessment in primary schools from the perspective of teachers. Measurement
in Physical Education and Exercise Science, 25(3), 236-249.
The data presented in Chapter 4 has been accepted for publication:
Eddy, L. H., Preston, N., Mon-Williams, M., Bingham, D. D., Atkinson, J. M.,
Ellingham-Khan, M., Otteslev, A., & Hill, L. J. B. (2021). Developing and
validating a school-based screening tool of Fundamental Movement Skills
(FUNMOVES) using Rasch analysis. PloS one, 16(4), e0250002.
Only material produced by Lucy Hannah Eddy has been included in this thesis.
This copy has been supplied on the understanding that it is copyright material
and that no quotation from the thesis may be published without proper
acknowledgement.
The right of Lucy Hannah Eddy to be identified as Author of this work has been
asserted by her in accordance with the Copyright, Designs and Patents Act
1988.
© 2021 The University of Leeds and Lucy Hannah Eddy

II
Acknowledgements
Firstly, I would like to express my sincere gratitude to my supervisors, Dr Liam
Hill, Dr Daniel Bingham and Professor Mark Mon-Williams for their unwavering
support, guidance and expertise throughout my PhD. My thanks go to Liam for
nurturing my interest in motor development and for imparting his wealth of
knowledge on research methods and statistical analysis. He was also brilliant at
being ‘the voice of reason’ when our ideas got a bit out of hand! Daniel has
provided a different outlook on this project throughout which has been very
useful. His expertise in physical activity and movement behaviours has allowed
me to explore new literature and enabled me to utilise behaviour change
models to provide a more comprehensive understanding of barriers and
facilitators to research in schools. Thank you to Mark, whose third year
undergraduate module on motor learning inspired me to do a PhD in the first
place! He has been supportive throughout and has provided me with
opportunities to engage and work with a range of key stakeholders outside of
academia, such as the Department for Education, which has been invaluable
not only for this project, but also my professional development.
I would also like to give a special mention to Dr Nick Preston and Jo Atkinson,
whose healthcare expertise were instrumental to the success of this project.
Their insight on the measurement of motor skills in a clinical setting was central
to guiding the development of FUNMOVES. In particular, Nick has been a great
mentor to me and I really appreciate all the words of wisdom he has given me
throughout my PhD! Perhaps my biggest thank you goes to the schools in
Bradford and the children and teachers that participated in this research,
without whom this project would not have been possible. Thanks are also due to
the BiB staff and CAER interns (Nishaat Shahid, Kirsty Crossley, Marsha
Ellingham-Khan and Ava Otteslev) who have helped me throughout with data
collection and screening for the systematic review in Chapter 2. On a similar
note I am grateful to have been a part of the Born in Bradford and Centre for
Applied Education Research ‘families’, which I have learnt so much from.
I have been lucky enough to make lifelong friends during my PhD, whose
support has helped me through the tough times! There aren’t enough words to
express how thankful I am to Alice, she has been an incredible friend and
colleague over the last four years and I am so grateful to have met her. Having
started her PhD two years before me, Amy had always been able to provide
excellent advice - a lot of the time over cake which is always a bonus! To
Megan, I am grateful to have had someone to go on this PhD journey with,
experiencing the highs and lows together. I am also thankful to Anna, who has

III
always been free to chat about PhD work and next steps! Finally, I have only
had the pleasure of knowing Shania for a year but her bubbly personality never
fails to cheer me up; she has been a wonderful source of support.
Last but certainly not least, I would like to thank my family. To my parents who
have been incredibly supportive throughout; thank you for reading my drafts in
first year when I was too nervous to send them straight to my supervisors!
Thank you to my mum for being my constant source of inspiration and to my
dad for never failing to know how to make me smile (the red wine always
helped)! To my brother Jack, who despite not really understanding my research
has always supported my endeavours. Finally, I will forever be grateful to Andy
for his patience, love and encouragement, and to our dog Otis for the
unconditional affection and endless cuddles which got me through the difficult
times. Our adventures as a family have kept me sane - I’d be lost without you
both!
I would like to dedicate this thesis to my Grandma Barbara, who sadly died in
the summer before I handed my thesis in. I hope you are proud, and looking
down on me smiling now that I have ‘finally’ finished with my university studies.

IV
Abstract
A large proportion of children are unable to perform age-appropriate
fundamental movement skills (FMS), despite their importance for wide-reaching
childhood development outcomes including physical activity, health (physical
and mental) and academic achievement. Thus, it is important to assess FMS so
that children needing support can be identified in a timely fashion. There is
great potential for universal screening of FMS in schools, but it is yet to be
implemented within British Primary schools. Chapter 2 utilised a systematic
review to understand what assessments are available to measure FMS
proficiency in school children and their psychometric properties. Results
showed that the most valid and reliable tools were the Movement Assessment
Battery for Children (MABC), the Test of Gross Motor Development (TGMD)
and the Bruininks-Oseretsky Test of Motor Proficiency (BOT). Chapter 3 sought
to understand the barriers and facilitators to school-based FMS assessments,
and develop teacher-directed feasibility guidelines. Results showed that the
MABC, the TGMD and the BOT do not meet these guidelines and thus a new
tool needed to be developed. Chapter 4 outlined the development of
FUNMOVES. Across three studies over 1000 children were tested and Rasch
analysis and implementation fidelity results were used to modify FUNMOVES
after each study. The finalised version of FUNMOVES had good structural
validity and made it possible for teachers to screen the FMS ability of a class in
under an hour. Chapter 5 outlined a protocol for further validation and
acceptability studies which were not implemented due to the Covid-19
pandemic. In summary, there is great potential for benefit from using universal
screening to measure FMS ability in schools, including increased teacher
awareness and expedited time to assessment and intervention. FUNMOVES
has shown promise for use in this context, and whilst further research is
required, it shows promise as a tool for identifying developmental delay.

V
Table of Contents
Acknowledgements ..................................................................................... II
Abstract ...................................................................................................... IV
Table of Contents ........................................................................................ V
List of Figures ............................................................................................ XI
List of Tables ............................................................................................ XIII
Abbreviations ............................................................................................ XV
Chapter 1 Introduction ................................................................................ 1
1.1 FMS and Childhood Development .................................................... 1
1.1.1 Physical Activity ...................................................................... 1
1.1.1.1 Stodden Model ................................................................ 3
1.1.2 Fitness .................................................................................... 4
1.1.3 Weight Status .......................................................................... 5
1.1.4 Perceived Motor Competence ................................................. 6
1.1.5 Socioemotional Wellbeing ....................................................... 6
1.1.6 Academic Achievement ........................................................... 7
1.1.7 Cognition ................................................................................. 7
1.2 Current FMS Ability Levels ............................................................... 8
1.3 Theories of FMS development ......................................................... 9
1.3.1 Mountain of Motor Development ............................................. 9
1.3.2 Hulteen Model for Lifelong PA............................................... 11
1.3.3 Theory of Constraints ............................................................ 12
1.4 External Factors Influence on FMS Development .......................... 13
1.4.1 Gender .................................................................................. 13
1.4.2 Socioeconomic Status ........................................................... 15
1.4.3 Ethnicity ................................................................................ 16
1.5 Assessment of FMS ....................................................................... 17
1.5.1 Problems with Current Assessment Procedures ................... 17
1.5.1.1 Parental Awareness ...................................................... 17
1.5.1.2 Healthcare Issues .......................................................... 18
1.5.2 Universal Screening of FMS.................................................. 20
1.5.2.1 Potential Role of Schools .............................................. 21
1.5.2.2 Assessment Tools Available .......................................... 23
1.6 Thesis Aims .................................................................................... 25
1.7 Thesis structure .............................................................................. 26

VI
1.8 My Role .......................................................................................... 27
Chapter 2 Systematic Review of Observational Assessment Tools Available to Measure the Fundamental Movement Skills of School-Aged Children .................................................................................... 30
2.1 Background .................................................................................... 30
2.2 Methods ......................................................................................... 31
2.2.1 Inclusion Criteria and Preliminary Systematic Search ........... 31
2.2.2 Electronic Search Strategy and Information Sources ............ 32
2.2.3 Study Selection ..................................................................... 32
2.2.4 Data Extraction Process & Quality Assessment .................... 33
2.2.5 Interpretation of Validity and Reliability ................................. 33
2.3 Results ........................................................................................... 36
2.3.1 Assessment Tools ................................................................. 36
2.3.2 Included Studies ................................................................... 36
2.3.3 Participants ........................................................................... 38
2.3.4 COSMIN Quality Assessment ............................................... 39
2.3.5 Assessment Tool Categorisation .......................................... 40
2.3.6 Product-Oriented Assessments ............................................ 40
2.3.6.1 Movement Assessment Battery for Children (MABC) .... 41
2.3.6.2 Bruininks-Oseretsky Test of Motor Proficiency (BOT) ... 59
2.3.6.3 Other Product-Oriented Assessment Tools ................... 61
2.3.7 Process-Oriented Assessment Tools .................................... 62
2.3.7.1 Test of Gross Motor Development (TGMD) ................... 62
2.3.7.2 Other Process-Oriented Assessment Tools .................. 66
2.3.8 Combined Assessments ....................................................... 66
2.3.9 Concurrent Validity ................................................................ 67
2.3.9.1 Between product-oriented ............................................. 67
2.3.9.2 Between process-oriented ............................................. 69
2.3.9.3 Between product and process-oriented ......................... 69
2.4 Discussion ...................................................................................... 70
2.5 Conclusion ..................................................................................... 74
Chapter 3 Fundamental Movement Skills and their Assessment in Primary Schools from the Perspective of Teachers ....................... 76
3.1 Background .................................................................................... 76
3.2 Methods ......................................................................................... 82
3.2.1 Participants and Procedure ................................................... 82
3.2.2 Measure – Online Questionnaire .......................................... 82

VII
3.2.3 Data Analysis ........................................................................ 83
3.3 Results ........................................................................................... 90
3.3.1 Participants ........................................................................... 90
3.3.2 Capability .............................................................................. 92
3.3.2.1 Perceived Knowledge .................................................... 95
3.3.2.2 Actual Knowledge .......................................................... 96
3.3.2.3 Knowledge of relationship between fundamental movement skills and outcomes ...................................... 96
3.3.2.4 Confidence Demonstrating ............................................ 98
3.3.2.5 Confidence Assessing ................................................... 98
3.3.3 Opportunity............................................................................ 98
3.3.3.1 Current Fundamental Movement Skills Assessment Provision in Schools .................................................... 101
3.3.3.2 Support from Senior Leadership .................................. 101
3.3.3.3 Access to Additional Support Staff Resource .............. 102
3.3.3.4 Access to Equipment ................................................... 102
3.3.3.5 Acceptable Assessment Time ..................................... 102
3.3.3.6 Feasibility of Two Hour Start of Year Assessment ....... 102
3.3.3.7 Time in the School Day Most Suitable to Assess FMS 103
3.3.4 Motivation ............................................................................ 103
3.3.4.1 Perception of ability to identify children that need support through FMS assessment in schools ........................... 104
3.3.4.2 Perceived benefit of knowledge of pupils’ FMS ability for teaching ....................................................................... 105
3.3.4.3 Workload Stress .......................................................... 105
3.3.4.4 Peer Influence ............................................................. 105
3.3.4.5 Likelihood of Assessing FMS....................................... 106
3.4 Discussion .................................................................................... 106
3.4.1 Limitations ........................................................................... 115
3.4.2 Conclusion .......................................................................... 119
Chapter 4 Development of FUNMOVES ................................................. 121
4.1 Introduction ..................................................................................... 121
4.2 Study 1 ............................................................................................ 125
4.2.1 Initial Development of FUNMOVES ........................................ 125
4.2.1.1 Establishing a Working Group ........................................ 125
4.2.1.2 Reviewing constructs to be included ............................... 126
4.2.1.3 The Grid .......................................................................... 129

VIII
4.2.1.4 Running .......................................................................... 130
4.2.1.5 Jumping .......................................................................... 131
4.2.1.6 Hopping .......................................................................... 132
4.2.1.7 Throwing ......................................................................... 132
4.2.1.8 Kicking ............................................................................ 134
4.2.1.9 Balance ........................................................................... 134
4.2.1.10 Walking along the line ................................................... 134
4.2.2 Methods .................................................................................. 135
4.2.2.1 Participants ..................................................................... 135
4.2.2.2 Design ............................................................................ 136
4.2.2.3 Materials ......................................................................... 136
4.2.2.4 Procedure ....................................................................... 136
4.2.2.5 Analysis .......................................................................... 137
4.2.3 Results .................................................................................... 140
4.2.3.1 Implementation Fidelity ................................................... 140
4.2.3.2 Initial Rasch Analysis ...................................................... 143
4.2.3.3 Items removed ................................................................ 144
4.2.3.4 Rescoring the Running Activity ....................................... 147
4.3 Study 2............................................................................................ 149
4.3.1 Methods .................................................................................. 149
4.3.1.1 Participants ..................................................................... 149
4.3.1.2 Design, Materials, Procedure and Analysis .................... 150
4.3.2 Results .................................................................................... 151
4.3.2.1 Implementation Fidelity ................................................... 151
4.3.2.2 Initial Rasch Analysis ...................................................... 152
4.3.2.3 Rescore Jump and Hop .................................................. 155
4.4 Study 3............................................................................................ 156
4.4.1 Methods .................................................................................. 156
4.4.1.1 Participants ..................................................................... 156
4.4.1.2 Design, Materials, Procedure and Analysis .................... 156
4.4.2 Results .................................................................................... 157
4.4.2.1 Implementation Fidelity ................................................... 157
4.4.2.2 Both Schools - Initial Rasch Analysis .............................. 158
4.4.2.3 Both Schools - Rescore Items ........................................ 161
4.4.2.4 One School – Initial Rasch Analysis ............................... 162
4.4.2.5 One School – Rescore Items .......................................... 163

IX
4.5 Discussion ...................................................................................... 166
4.5.1 Psychometric Properties ......................................................... 166
4.5.1.1 Limitations in Evaluating Psychometric Properties ......... 168
4.5.2 Feasibility ................................................................................ 170
4.5.2.1 Limitations in Evaluating Feasibility ................................ 173
4.6 Conclusion ...................................................................................... 174
Chapter 5 Protocol for the Validity, Reliability, Feasibility and Acceptability of FUNMOVES........................................................... 176
5.1 Background / Rationale ................................................................ 176
5.2 Project Aims and Objectives ......................................................... 176
5.3 Work Package 1 – Assessing Psychometric Properties (Validity and
Reliability) ..................................................................................... 177
5.3.1 Participants ......................................................................... 177
5.3.1.1 Sample size and power ............................................... 177
5.3.1.2 Recruitment ................................................................. 177
5.3.1.3 Eligibility Criteria .......................................................... 178
5.3.2 Design ................................................................................. 178
5.3.3 Measures ............................................................................ 179
5.3.3.1 Demographics ............................................................. 179
5.3.3.2 FUNMOVES ................................................................ 180
5.3.3.3 Movement Assessment Battery for Children (MABC) .. 181
5.3.4 Procedures .......................................................................... 182
5.3.5 Analysis Plan ....................................................................... 183
5.4 Work Package 2 – Feasibility and Acceptability ........................... 185
5.4.1 Design ................................................................................. 185
5.4.2 Participants ......................................................................... 186
5.4.3 Measures ............................................................................ 186
5.4.4 Procedures .......................................................................... 189
5.4.5 Analysis Plan ....................................................................... 190
5.5 Research Support ........................................................................ 190
5.6 Discussion .................................................................................... 190
5.6.1 Strengths and Limitations .................................................... 192
Chapter 6 Discussion .............................................................................. 194
6.1 General Summary ........................................................................ 194
6.2 Key Findings & Implications ......................................................... 194
6.2.1 Chapter 2 ............................................................................ 194
6.2.2 Chapter 3 ............................................................................ 196

X
6.2.3 Chapter 4 ............................................................................ 198
6.3 Future Research ........................................................................... 202
6.4 Conclusion ................................................................................... 206
References ............................................................................................... 207
Appendix A PROSPERO form for the Systematic Review in Chapter 2 .......................................................................................................... 244
Appendix B Search Strategy for the Systematic Review in Chapter 2255
Appendix C Study Table for the Systematic Review in Chapter 2 ...... 262
Appendix D Online Questionnaire used in Chapter 3 .......................... 416
Appendix F Teacher Response Sheet for Chapter 4............................. 447
Appendix G Fidelity Checklist used in Study 1 in Chapter 4 ............... 449
Appendix H Implementation Fidelity Checklist for Studies 2 & 3 in Chapter 4 .......................................................................................... 456
Appendix I Recruitment flyer for Chapter 5, work package 1 ............. 466

XI
List of Figures
Figure 1 – Stodden Model on the developmental relationship between FMS and Physical Activity .................................................................. 4
Figure 2 – Diagrammatic representation of the mountain of motor development framework (Clarke & Metcalfe, 2002) ........................ 10
Figure 3 – Development of FMS for participation in lifelong PA model proposed by Hulteen et al. (2018) ..................................................... 12
Figure 4 – Diagrammatic representation of the theory of constraints (Newell, 1986) ..................................................................................... 13
Figure 5 – Methods of assessment available to measure FMS in school-aged children ..................................................................................... 24
Figure 6 – Diagrammatic representation of the thesis structure ........... 27
Figure 7 – PRISMA flow diagram illustrating the review process ......... 37
Figure 8 - Graphical representation of the number of assessment tools which evaluate each of the three aspects of FMS. ......................... 38
Figure 9 - Summary of the generalisability subscale of the COSMIN checklist ............................................................................................. 40
Figure 10 – Diagrammatic Representation of the Capability, Opportunity and Motivation Behaviour (COM-B) model of Behaviour Change . 79
Figure 11 - Diagrammatic representation of how the Theoretical Domains Framework (TDF) components fit within the Capability, Opportunity and Motivation Behaviour (COM-B) model categories. ............................................................................................................. 81
Figure 12 - The barriers and facilitators to school-based assessments, and the paired behaviour change techniques to improve the uptake of universal screening in schools. ................................................. 118
Figure 13 – Diagrammatic representation of the logit scale ................ 124
Figure 14 - Diagrammatic depiction of the grid used for FUNMOVES activities, including dimensions ..................................................... 130
Figure 15 - Diagrammatic depiction of the running activity in FUNMOVES version 1 ...................................................................... 131
Figure 16 - Diagrammatic depiction of the jumping activity in FUNMOVES version 1 ...................................................................... 132
Figure 17 - Diagrammatic depiction of the throwing activity in FUNMOVES version 1 ...................................................................... 133
Figure 18 - a diagram explaining the rules of scoring for throwing task. The top right beanbag is counted as it is touching but not crossing the line. The two beanbags on the left are crossing the outside edge so would not be counted. ...................................................... 133
Figure 19 - a demonstration of passing a beanbag around the body in balance position three ..................................................................... 134

XII
Figure 20 - Diagrammatic depiction of the walking along the line activity in FUNMOVES version 1 ................................................................. 135
Figure 21 - an excerpt from the response sheet detailing the demographic information to be completed for each child prior to testing ............................................................................................... 137
Figure 22 - a category probability curve showing an example of ordered thresholds for scoring. The dotted lines indicate the threshold between scoring categories ........................................................... 139
Figure 23 - category probability curves from study 1 initial Rasch analysis. ........................................................................................... 144
Figure 24 – category probability curves for study 1, items removed analysis ............................................................................................ 147
Figure 25 - category probability curves for study 1, rescore running
analysis ............................................................................................ 149
Figure 26 – photographic representation of the new balance included in Study 2 .............................................................................................. 150
Figure 27 - category probability curves from study 2 initial analysis. 153
Figure 28 – Illustration of the target zones on each line of the grid which were used to score jumping and hopping in study 3 ................... 157
Figure 29 - category probability curves from study 3, both schools initial analysis .................................................................................. 159
Figure 30 – Person-Item Map for the finalised Version of FUNMOVES163
Figure 31 - category probability curves from round three of testing, one school ............................................................................................... 164
Figure 32 – Recruitment strategy for work package one ..................... 178
Figure 33 – Pictorial depiction of the activities within FUNMOVES .... 181
Figure 34 - diagrammatic representation of the scaffolding approach for Work Package 2 ............................................................................... 185

XIII
List of Tables
Table 1 – Definitions of Validity and Reliability defined by the COnsensus-based Standards for the selection of health status Measurement Instruments ................................................................ 34
Table 2 - Traffic light system for analysing results of included studies35
Table 3 - The psychometric properties measured for each assessment tool found to measure FMS proficiency ........................................... 42
Table 4- Reliability and Validity of the MABC .......................................... 58
Table 5 - Validity and reliability of the BOT ............................................. 61
Table 6 – Validity and reliability of the TGMD .......................................... 63
Table 7 – Concurrent validity of assessment tools ................................. 68
Table 8 - Questionnaire items in relation to the Capability, Opportunity, Motivation and Behaviour (COM-B) model of behaviour change and the Theoretical Domains Framework (TDF) ..................................... 84
Table 9 - demographic characteristics of the school workers that completed the online questionnaire ................................................ 90
Table 10 - Responses to questions designed to measure the capability of teachers to assess fundamental movement skills in a school setting ................................................................................................. 92
Table 11 - Likelihood Ratio Tests for teachers’ perceived knowledge of fundamental movement skills ........................................................... 96
Table 12 - Likelihood Ratio Tests for the perceived impact of fundamental movement skills on academic attainment ................. 97
Table 13 - Likelihood Ratio Tests for the perceived impact of fundamental movement skills on social relationships ................... 97
Table 14 - Responses to questions designed to understand the opportunity for teachers to assess fundamental movement skills in a school setting ................................................................................. 98
Table 15 - Likelihood Ratio Tests for Whether Schools Currently Assess Fundamental Movement Skills ....................................................... 101
Table 16 - Likelihood Ratio Tests for whether teaching staff would be able to spend 2 hours at the start of the school year assessing the fundamental movement skills of their pupils ................................ 103
Table 17 - responses to questions designed to measure the motivation of teachers to assess fundamental movement skills in a school setting ............................................................................................... 103
Table 18 - Likelihood Ratio Tests for perceived benefit of knowledge of pupils’ fundamental movement skills for teaching ....................... 105
Table 19 – Teacher Implementation Fidelity for Study 1 ...................... 141

XIV
Table 20 - Emerging themes from the qualitative comments section of the implementation fidelity checklist: for static balance and walking along the line ..................................................................... 142
Table 21 – Summary Statistics for Study 1 ............................................ 146
Table 22 – Descriptive statistics for logit location on FUNMOVES by year group for study 1 ..................................................................... 148
Table 23 – Descriptive statistics for logit location on FUNMOVES by motor ability for study 1 .................................................................. 148
Table 24 – Descriptive statistics for logit location on FUNMOVES by gender for study 1 ........................................................................... 148
Table 25 – Implementation Fidelity Issues for Study 2 ......................... 151
Table 26 – Summary Statistics for Study 2 ............................................ 154
Table 27 - Descriptive statistics for logit location on FUNMOVES by year group for study 2 ............................................................................. 155
Table 28 - Descriptive statistics for logit location on FUNMOVES by motor ability for study 2 .................................................................. 156
Table 29 - Descriptive statistics for logit location on FUNMOVES by gender for study 2 ........................................................................... 156
Table 30 - Implementation Fidelity Issues for Study 3 (one school) ... 158
Table 31 – Summary Statistics for Study 3 ............................................ 160
Table 32 - Descriptive statistics for logit location on FUNMOVES by year group for study 3, both schools ..................................................... 161
Table 33 - Descriptive statistics for logit location on FUNMOVES by motor ability for study 3, both schools .......................................... 162
Table 34 - Descriptive statistics for logit location on FUNMOVES by gender for study 3, both schools ................................................... 162
Table 35- Descriptive statistics for logit location on FUNMOVES by year group for study 3, one school ........................................................ 165
Table 36- Descriptive statistics for logit location on FUNMOVES by motor ability for study 3, one school ............................................. 165
Table 37- Descriptive statistics for logit location on FUNMOVES by gender for study 3, one school....................................................... 165
Table 38 - Focus Group Discussion Guide ............................................ 187

XV
Abbreviations
A&C Aiming and Catching Subtest of the Movement Assessment
Battery for Children
ADL Activities of Daily Living
ANOVA Analysis of Variance
APPG All Party Parliamentary Group
ASD Autistic Spectrum Disorder
AST Athletics Skills Track
BiB Born in Bradford
BMI Body Mass Index
BOA Bradford Opportunity Area
BOT Bruininks-Oseretsky Test of Motor Proficiency
CAER Centre for Applied Education Research
CAMSA Canadian Agility and Movement Skill Assessment
CFA Confirmatory Factor Analysis
CMSP Children's Motor Skills Protocol
COM-B Capability, Opportunity and Motivation Model of Behaviour
COSMIN Consensus-based Standards for the Selection of health
Measurement INstruments
CPD Continued Professional Development
CTT Classical Test Theory
D Dominant
DCD Developmental Coordination Disorder
DIF Differential Item Functioning
DV Dependent Variable
EYFSP Early Years Foundation Stage Profile
FASD Foetal Alcohol Spectrum Disorder
FG-COMPASS Furtado-Gallagher Computerized Observational Movement
Pattern Assessment System
FMS Fundamental Movement Skills

XVI
GP General Practitioner
GSGA Get Skilled Get Active
ICC Intraclass Correlation
IMD Index of Multiple Deprivation
IRT Item Response Theory
IV Independent Variable
KS1 Key Stage One
KTK Körperkoordinationstest für Kinder
MABC Movement Assessment Battery for Children
MD Manual Dexterity Subtest of the Movement Assessment
Battery for Children
MOT 4-6 Motoriktest für vier- bis sechsjärige Kinder
MVPA Moderate to Vigorous Physical Activity
ND Non-Dominant
NHS National Health Service
OFSTED Office for Standards in Education, Children's Services and
Skills
OR Odds Ratio
OSU-SIGMA Ohio State University Scale for intra-Gross Motor
Assessment
OT Occupational Therapist
P.E. Physical Education
PA Physical Activity
PDMS Peabody Developmental Motor Scale
PGMQ Preschooler Gross Motor Quality Scale
PMC Perceived Motor Competence
PROSPERO Prospective Register of Systematic Reviews
PSI Person Separation Index
SATS Standard Assessment Tests
SES Socioeconomic Status

XVII
SF Short Form
SLT Senior Leadership Team
SPSS Statistical Package for the Social Sciences
TDF Theoretical Domains Framework
TGMD Test of Gross Motor Development
The Alps Towards Healthy Education and Learning of Playground
Skills
UK United Kingdom
USA United States of America


1
Chapter 1
Introduction
Motor skills are involved in a large proportion of daily activities. We need our
brain to send signals to the muscles in our body to enable us to complete
everyday tasks such as getting dressed and talking to friends. Motor skills are
developmental, and allow children to learn about the world around them. One
group of motor skills that is thought to be particularly important for children is
Fundamental Movement Skills (FMS). FMS are foundational motor skills that,
when mastered, give children the best possible opportunity to participate in
lifelong physical activity (PA) and sport (Barnett, Stodden, et al., 2016).
Historically, FMS comprised two groups of motor skills; Locomotor and Object
Control. Locomotor refers to skills which require you to coordinate body parts to
move through space, such as running, jumping and hopping. Object control
skills are those which involve the manipulation of an object using a body part,
for example through throwing and kicking. More recently, a third group of skills,
termed Stability, have been recognised as FMS (Rudd et al., 2015). Stability
refers to the ability to sense the movement of body parts and make rapid
adjustments to compensate for these movements in order to maintain balance.
Stability skills can be further sub-categorised as involving either static (e.g.
standing on one leg) or dynamic (e.g. walking along a beam) balance (Gallahue
et al., 2012).
1.1 FMS and Childhood Development
1.1.1 Physical Activity
One of the most commonly researched associations in relation to FMS is its
connections with physical activity. The World Health Organisation defines
physical activity as ‘any bodily movement produced by skeletal muscles that
requires energy expenditure’ (World Health Organisation, 2020). The current
guidelines within the UK suggest that children aged between 5 and 18 years old
should be doing at least 60 minutes of moderate-to-vigorous physical activity
(MVPA) each day (Department of Health and Social Care, 2019). Recent survey
data found that 55.1% of children did not achieve these guidelines between
2019 and 2020 (Sport England, 2021). It is believed that children who establish
strong foundations for FMS in early childhood are more likely to have lifelong
participation in PA (Sacko, 2020). With research showing that there are fewer
children than ever reaching guidelines for PA worldwide (Guthold et al., 2020), it

2
is arguably more important than ever to consider the role FMS may play for
participation in physical activity. A number of systematic reviews have evaluated
the relationship between FMS and PA, with three out of four reviews finding that
most studies report at least one significant positive relationship between FMS
and PA in pre-school children (Jones et al., 2020; Logan, Robinson, Getchell, et
al., 2014; Xin et al., 2020), as well as primary and secondary school children
(Logan, Robinson, Getchell, et al., 2014; Lubans et al., 2010). These reviews
postulate that the strength of the relationship between FMS and PA ranges from
low to moderate (Logan, Robinson, Getchell, et al., 2014; Lubans et al., 2010;
Xin et al., 2020), dependent on the measures used and the analysis
undertaken. A meta-analysis on the results of 19 studies showed a small
positive associations between FMS and MVPA (r = .2) and for FMS and total PA
(r = .2) (Jones et al., 2020). Gender differences in these relationships have also
been noted in two systematic reviews, in which correlations were found to be
larger for males than females (Logan, Robinson, Getchell, et al., 2014; Xin et
al., 2020). Additionally, object control skills were more closely related to PA for
boys. The opposite was true for girls with FMS being more strongly associated
with locomotor skills (Logan, Robinson, Getchell, et al., 2014). It is, however,
noted that there is a lack of research exploring the relationship between stability
skills and PA (Xin et al., 2020). Additionally, a recent systematic review with a
focus on longitudinal data found that there was no evidence for PA influencing
FMS ability, and that there is only limited indeterminate evidence for the inverse
(Barnett et al., 2021).
Since the literature search for the most recent systematic review was completed
(November 2019), further research has been carried out to explore the
relationship between FMS and PA, including two longitudinal studies (Burns et
al., 2020; Nilsen et al., 2020), which found conflicting results. Nilsen et al.
(2020) measured FMS and PA 6 weeks apart (before and after the school
summer break) and found that PA (as measured by accelerometers) at time
point one predicted all FMS at follow up but that FMS did not predict later PA, at
time point two. Burns et al. (2020) had a longer follow up (2 years) and found
the opposite, in which baseline FMS predicted PA (number of steps) at time
point two but baseline PA was not predictive of later FMS ability. Cross-
sectional studies have also found conflicting results with regards to the types of
FMS that are associated with PA, with some studies finding relationships with
object control skills (Capio & Eguia, 2020) and others showing associations with
locomotor skills (Aadland et al., 2020).

3
Recent studies may help to explain these differences though. For example, one
study (Martins, Clark, et al., 2020) employed a network analysis and found
evidence to suggest that these relationships may change with age. Specifically,
the study found that at the age of three, both locomotor and object control skills
were positively associated with adherence to physical activity guidelines. Later,
at four years old, this relationship was weakened but still significant, and then at
five years old the relationship became negative with object control skills. A
second study found that the strength of the relationship between PA and FMS
might depend on the what different physical activities are measured (Wood et
al., 2020). Thirdly, research has shown that adherence to all three aspects of 24
hour movement guidelines (sleep, sedentary behaviour and physical activity)
may be more important to FMS development than any one aspect alone, such
as PA (Kracht et al., 2020; Martins et al., 2021). Meanwhile a final study
observed that decisions relating to how data was analysed could prove
influential, because within their accelerometry data the strength of the
association between FMS and PA was dependent upon whether the data was
analysed in raw, normalised or compositional formats (Aadland et al., 2020). In
addition to these explanations, it is likely that the wide range of assessment
methods used to measure both FMS and PA in these studies may result in
slightly different, not directly comparable constructs having been studied.
1.1.1.1 Stodden Model
The Stodden Model (see Figure 1) provides a conceptual framework to
understand the relationship between FMS and PA (Stodden et al., 2008). The
model suggests that there is a reciprocal and dynamic relationship between
FMS and PA, which is mediated by both perceived motor competence (PMC)
and health related fitness. Physical activity is then thought to feed into obesity
risk, in which children with higher levels of FMS, PA, PMC and health related
fitness are more likely to be a healthy weight, which in turn encourages a
positive spiral of engagement. On the other hand, children with low levels of
FMS, PA, PMC and health related fitness are more likely to be overweight or
obese, feeding into a negative spiral of engagement in PA.
It is proposed that the strength of these relationships change throughout child
development (Stodden et al., 2008). It is purported that in early childhood,
participation in physical activity may drive the development of FMS due to PA
promoting neuromotor development (Fisher et al., 2005; Okely et al., 2001).
Differences in the home environment such as parental influence and resources
available are suggested to be the reason that children’s early motor skills are so
variable, and thus why there is only expected to be a weak relationship with PA

4
within the Stodden model during this timeframe (Goodway & Smith, 2005). As
children get older, it is claimed that this relationship will strengthen, as an
increase in motor ability widens opportunities to participate in PA. Thus, the
Stodden model suggests that in middle and late childhood, the direction of the
relationship switches, with FMS increasingly influencing participation in PA
(Stodden et al., 2008).
Figure 1 – Stodden Model on the developmental relationship between FMS and Physical Activity
NB: Image taken from Stodden et al (2008). EC = Early Childhood, MC = Middle
Childhood and LC = Late Childhood.
1.1.2 Fitness
As mentioned in the previous section, the Stodden model (Stodden et al., 2008)
also postulates that there is a relationship between FMS and (health related)
fitness. Fitness has been defined as a set of physical attributes which people
have or achieve, and include both health-related components (e.g.
cardiorespiratory endurance, muscular strength and flexibility) and skill related
components (Caspersen et al., 1985). There have been a number of systematic
reviews conducted that evaluate this relationship (Barnett et al., 2021; Cattuzzo
et al., 2016; Lubans et al., 2010; Utesch et al., 2019), the first of which found
that all four studies showed a positive association between FMS ability and
fitness level (Lubans et al., 2010). In 2016 the second systematic review

5
included a noticeably increased number of studies (44 compared to four),
demonstrating growing interest in the relationship between FMS and fitness
(Cattuzzo et al., 2016). When only evaluating studies which had a low risk of
bias, there was strong evidence for a positive relationship between FMS and
cardiorespiratory and muscle fitness (Cattuzzo et al., 2016). Finally, when
utilising meta-analysis to quantify the impact of FMS, the latest review showed
moderate effect sizes for FMS’ relationship to both physical (r = .41) and
cardiovascular fitness (r = .42). The most recent systematic review found
insufficient evidence to support fitness impacting upon FMS, but did find strong
positive evidence to suggest that locomotor and stability skills have a positive
impact upon fitness in childhood (Barnett et al., 2021). In this review, it is also
noted that there is strong evidence to suggest that fitness acts as a mediator in
the relationship between FMS and PA (which is in line with the Stodden Model).
Since the last literature search was completed, studies have continued to find
moderate correlations between FMS and both cardiorespiratory (Barnett,
Telford, et al., 2019) and cardiovascular fitness (Behan et al., 2020), with one
study reporting that 16.5% of the variance in cardiovascular fitness is
associated with FMS (Behan et al., 2020).
1.1.3 Weight Status
In addition to fitness, the Stodden model also purports that FMS has an indirect
relationship with weight status/risk of obesity, via participation in physical
activity. Three systematic reviews have detailed studies on this relationship, all
of which found that most studies show an inverse relationship between FMS
proficiency and weight status (Barnett et al., 2021; Cattuzzo et al., 2016;
Lubans et al., 2010). When focusing on studies with low risk of bias, Cattuzzo et
al. (2016) found the number of studies reporting this relationship was higher
(eight out of nine studies). More recently, Barnett et al. (2021) found strong
evidence of a bi-directional, negative relationship between FMS and weight
status. Since this review a number of studies have found that FMS have a
significant negative association with BMI and body fat percentage (Behan et al.,
2020). Thus, higher FMS ability shows signs of being a protective factor for
weight status, even when controlling for potentially confounding demographic
factors such as gender and SES (Behan et al., 2020). Research has also shown
that Year 1 children’s ability to perform some FMS (jump and slide) can predict
their BMI one year later, accounting for 12% of the variance (Duncan et al.,
2021). Additionally, research has found that ‘normal’ weight children perform
significantly better on tests of FMS children than their overweight and obese
peers (Kelly et al., 2019). Some studies have suggested that the relationship
between FMS and BMI may depend on the types of FMS measured (e.g.

6
locomotor skills vs object control skills) but the evidence is mixed with regards
to which aspects are comparatively more strongly associated (Draper et al.,
2019; Henrique et al., 2020). Lastly, there has been limited research looking at
the longitudinal relationship between these skills. However, one study which
sampled 2517 primary school children found that higher FMS at baseline
negatively predicted BMI at follow up, and that children with higher baseline BMI
had lower FMS at follow up (D'Hondt et al., 2014). This is in line with the
mechanisms outlined in the Stodden model (Stodden et al., 2008)
1.1.4 Perceived Motor Competence
The final mediator mentioned within the Stodden model (Stodden et al., 2008) is
perceived motor competence (PMC). Perceived motor competence can be
defined as children’s physical self-concept (De Meester et al., 2020). A recent
systematic review and meta-analysis evaluated the findings of 69 studies on the
relationship between actual motor competence and PMC (De Meester et al.,
2020). It was evident from the meta-analysis, that although a large proportion of
the included studies found a relationship between these variables, the effect
sizes of these relationships were only small (De Meester et al., 2020). The
authors also noted a lack of research conducted to date on the relationship
between stability skills and PMC. More recently, Barnett et al. (2021) stated that
there is insufficient evidence to support the impact of FMS on PMC, and no
evidence on the reverse pathway. They noted 9 studied have explored PMC as
a mediator between FMS and PA with results varying dependent on the
direction of the pathway. The review showed that there was indeterminate
evidence of PMC being a mediator between the relationship between PA and
FMS, and no evidence for the reverse. The authors also noted that more work
needs to be conducted in this area, as currently there is only inconsistent
results from small-scale studies.
1.1.5 Socioemotional Wellbeing
In addition to the factors mentioned within the Stodden model (Stodden et al.,
2008), research has also linked FMS to socioemotional wellbeing. Longitudinal
research has shown that FMS do not solely impact upon perception of sporting
abilities, but also perceptions of physical appearance particularly for girls
(Brown & Cairney, 2020). Additionally research has shown that having poor
motor skills can be linked to high levels of stress, psychological distress (Li et
al., 2019), anxiety and depressive symptoms (Rodriguez et al., 2019) and
emotional reactivity (Niemistö et al., 2020; Rodriguez et al., 2019). Low levels of
motor proficiency have also been linked to low self-esteem, poor self-concept,

7
and children believing they have less social support (Li et al., 2019) as well as
low levels of enjoyment in P.E. lessons (St John et al., 2020). It is, however,
important to note that there is a lack of research in this area that uses specific
assessments of FMS, instead much of the research uses more general
assessments of motor competence (which include fine motor skills) or
diagnostic tools for clinically assessing motor difficulties such as Developmental
Coordination Disorder (DCD). It is therefore difficult to decipher the specific
impact of FMS on socioemotional development beyond PMC.
1.1.6 Academic Achievement
Academic achievement, and the underlying abilities that aid a child’s
performance in school, have also been linked to FMS within the literature. A
recent systematic review looked at the relationships between FMS and scores
achieved on measures of reading and maths. It found significant weak to
moderate associations with both academic outcomes but with these
associations varying depending on the type of FMS measured (Macdonald et
al., 2018). In addition, a more recent study by the same author has found
significant positive correlations with maths, of a moderate effect size, when
using both composite and total motor subscales from the BOT-2 to measure
FMS. However, there were no correlations with reading ability (Macdonald et
al., 2020). Both longitudinal (De Waal & Pienaar, 2020) and cross sectional (de
Waal, 2019) research from South Africa has also found small to moderate
correlations between FMS and both reading and maths abilities in primary
school children. When looking more broadly at academic achievement,
research that evaluated the impact of FMS on a child’s average score across all
subjects reported that jumping had a significant positive effect for boys; one leg
balance had a significant positive effect for girls; and both hopping on one leg
and total score had a significant positive effect for both genders (Van Niekerk et
al., 2015).
1.1.7 Cognition
There has also been research conducted evaluating the impact of FMS
development on a child’s cognitive abilities. A systematic review from 2015
revealed evidence for a weak correlation between FMS and crystalised
intelligence (van der Fels et al., 2015). There were also correlations found
between FMS sub-groups and cognition, in which object control skills were
strongly associated with visuospatial working memory, and weakly associated
with other aspects of working memory and fluid intelligence (van der Fels et al.,
2015). This study also noted weak evidence for there being no relationship

8
between FMS and executive function, attention and general knowledge (van der
Fels et al., 2015). It is, however, evident from this review that there was a lack
of high quality research in this area.
Studies since the systematic review have found positive associations between
FMS and cognitive development in toddlers when controlling for potential
confounding demographic factors (Veldman et al., 2019). When looking at pre-
school children, research has shown significant positive correlations between
both total FMS ability, locomotor ability and all three aspects of executive
functions measured (inhibition, attention shifting, and working memory), whilst
object control was not associated with attention shifting (Cook et al., 2019).
Network analysis has shown weak associations between FMS and executive
function (Martins, Bandeira, et al., 2020). Finally, a recent study found that
executive function mediates the relationship between FMS and academic
attainment, specifically for reading proficiency (Chang & Gu, 2018). It is perhaps
unsurprising that these associations are being found considering that the
development of both motor and cognitive abilities follow similar timelines
(Gabbard, 2011; Gale et al., 2004). Additionally, research has postulated that
there is common activation of brain areas, specifically the cerebellum and the
prefrontal cortex when completing motor and cognitive tasks (cerebellum &
prefrontal cortex) (Diamond, 2000, 2007).
1.2 Current FMS Ability Levels
Due to the importance of FMS for childhood development discussed so far, it is
alarming that research suggests a downtrend in the FMS abilities of school-
aged children (Brian et al., 2019). Despite a focus on FMS within education in
the UK (Department For Education, 2013, 2014), studies consistently find that
children are not reaching expected levels. One study which aligned directly with
four of the five FMS identified in the Key Stage One (children aged 5-7 years)
curriculum (run, jump, hop and catch) (Department For Education, 2013) found
that 18.5% of children did not master any of the four skills, and 32.2% only
mastered one (Duncan, Roscoe, et al., 2020). None of the children in Year Two
(aged 6-7 years old) had reached ‘mastery’ of all four of these skills (Duncan,
Roscoe, et al., 2020), despite this expectation being explicitly stated within the
national curriculum (Department For Education, 2013).
Additional studies have shown low levels of competence for children in pre-
school (Foulkes et al., 2015), Primary School (Farmer et al., 2017; Lawson et
al., 2021; Morley et al., 2015; Stratton et al., 2017) and Secondary School
(O’Brien et al., 2016) in the UK and Ireland. Reporting of FMS ability varied
amongst these samples but the results were consistent in that a large

9
proportion (60%) of children had poor FMS (Stratton et al., 2017) and a small
proportion (0% and 11% respectively) of children mastered all of the different
types of FMS measured (Lawson et al., 2021; O’Brien et al., 2016). Similar
trends are apparent in research worldwide (Ali Brian et al., 2018; Brian et al.,
2019; García-Marín et al., 2020; Goodway et al., 2010; Roth et al., 2010;
Veldman et al., 2020), with reports ranging between 8.8% (Veldman et al.,
2020) and 73% (Brian et al., 2019) of children having low levels of FMS
proficiency. This high degree of variation in reported proficiency levels may, in
part, be due to differences in the assessment tools used within these studies.
Additionally, research has suggested that the force and level of coordination
needed to complete each FMS within an assessment may impact upon mastery
levels (Lawson et al., 2021).
When focusing on each aspect of FMS development separately, the results are
mixed. Three studies conducted in both the USA and the UK revealed that pre-
school children performed better on locomotor skills than object control skills
(Ali Brian et al., 2018; Brian et al., 2019; Foulkes et al., 2015), however these
studies do not report whether these differences were statistically significant. On
the other hand, one study found that children performed significantly worse on
locomotor skills than object control skills (O’Brien et al., 2016). The sample in
this study, was however, older (secondary school) than in the other studies, so
it is possible that these differences may be age related. It is also important to
note that of all of the studies worldwide on this subject, only three used an
assessment tool which included a measure of stability (Roth et al., 2010;
Stratton et al., 2017; Veldman et al., 2020). Therefore, it is difficult to ascertain a
clear picture of children’s balance ability, which has been recognised as an
important aspect of FMS (Rudd et al., 2015).
There are a number of factors that have been proposed to have an influence on
FMS levels, which are commonly situated within theories of FMS development.
Thus, in interpreting and trying to understand the reasons underpinning the
current (low) ability levels reported in the extant literature, it is, important to
acknowledge both how FMS are developed, and the role that other factors may
play in its development.
1.3 Theories of FMS development
FMS are developmental in nature (Gabbard & Rodrigues, 2008), and so
improve with age. Numerous theories have been proposed that describe how
children develop FMS. These are detailed below.

10
1.3.1 Mountain of Motor Development
The Mountain of Motor Development (Clark & Metcalfe, 2002) provides a
theoretical framework to understand the changes that occur to motor skills from
birth, through to the development of FMS (referred to as fundamental motor
patterns) all the way to skilful movement (see Figure 2). The first stage of motor
development in this framework is the reflexive period, in which two types of
movements occur: reflexive and spontaneous. Spontaneous movements occur
without the presence of an external stimulus or specific environmental context,
for example when an infant’s arm flails. These movements are the opposite of
reflexive sensorimotor movements, which are elicited in response to stimuli in
the environment, for example sucking or postural changes. The reflexive stage
of motor development enables a child to be able to survive and interact with the
world (Clark & Metcalfe, 2002). Throughout this period, it is thought that infants
learn to assign meaning to movements in relation to their sensory environment
(Gibson, 1987).
Infants transition from the reflexive period to the preadapted period where they
start to make voluntary movements (Clark & Metcalfe, 2002). In this stage,
infants begin to use the sensorimotor patterns learnt during the reflexive period
to increase their understanding of how their bodies moves in relation to gravity
(Clark, 1994). This includes being able to hold up their own head, support their
body and move around (e.g. crawling and eventually independent walking).
Additionally, infants begin to gain manipulative skills such as reach to grasp
movements (Bushnell, 1985), the refinement of which are aided by
improvements in posture (Clark, 1994). Learning how to move through the world
and interact with objects ultimately enables an infant to become independent as
they can seek out food, and subsequently feed themselves (Clark & Metcalfe,
2002).
Figure 2 – Diagrammatic representation of the mountain of motor development framework (Clarke & Metcalfe, 2002)
NB: Image taken from Clarke & Metcalfe, 2002.

11
The third stage of motor development in this framework is the fundamental
motor patterns period. During this timeframe, children begin to develop the
basic locomotor and object control skills that they gained during the preadapted
period to form the “building blocks” for learning more complex, context-specific
skills (Clark & Metcalfe, 2002). The mountain of motor development purports
that this period lasts until a child is around seven years of age, at which time
most children should be able to competently execute such FMS, if given the
appropriate environment and opportunities to learn them in early years
(Gallahue et al., 2012). Although information is still emerging in this area, with a
recent Irish study revealing that FMS improved up until the age of ten (Behan et
al., 2019).
After FMS development, children then go on to learn to adapt movements to a
variety of specific tasks and environments through the Context Specific and
Skilful periods (Clark & Metcalfe, 2002). It is believed that ‘climbing the
mountain’ of motor development is a non-linear and self-guided process in
which development is sequential and cumulative, resulting in autonomous and
adaptive interactions with the environment (Clark & Metcalfe, 2002). The
authors note the importance of the interaction between both nature and nurture
to influence the development of motor skills at all stages (Clark & Metcalfe,
2002).
1.3.2 Hulteen Model for Lifelong PA
Similarly to the Mountain of Motor Development (Clark & Metcalfe, 2002),
Hulteen’s theory (see Figure 3) recognises that children transition from making
reflexive to more intentional movements, which are more conducive to
becoming self-sufficient (Hulteen, Morgan, et al., 2018). For example,
developing crawling and reach to grasp movements, which in combination could
be used to gather and eat food. The main difference between these two models
is the inclusion of the socio-cultural and geographical filter between
Rudimentary Movements and FMS in the Hulteen model (Hulteen, Morgan, et
al., 2018). This filter was included because research has acknowledged that
motor skills that may be considered ‘fundamental’ in some contexts may not be
in others. For example, in the UK, football is a popular sport. Thus kicking may
be considered fundamental in this context. However, in countries where playing
football is less prevalent, this skill may not be considered ‘fundamental’ to
participating in PA. This filter therefore influences the FMS that children are
exposed to in different cultures and countries. This model also acknowledges
that physical (e.g. weight and fitness) and psychological factors (e.g. self-

12
confidence and perceived motor competence) influence the development of
motor skills at each stage (Hulteen, Morgan, et al., 2018).
Figure 3 – Development of FMS for participation in lifelong PA model proposed by Hulteen et al. (2018)
NB: Figure taken from Hulteen et al. (2018)
1.3.3 Theory of Constraints
Similarly, the theory of constraints (Newell, 1986) acknowledges the role of
external factors in the development of FMS. Newell (1986) proposed a set of
three factors that interact to either limit or encourage the development of FMS
(see Figure 4).
Individual constraints refer to restrictions brought about by the child that
comprise both structural and functional factors. Structural factors relate to the
biological makeup of a child that include: height, weight, limb length, and
strength. Functional factors refer to psychological constraints, including fear,
perceived competence and self-esteem, as well as processes central to
successful movement, including vision and other forms of perception (Newell,
1986).
Environmental constraints refer to factors in the setting in which FMS are being
performed that may have an impact on proficiency. For example, the surface,
the weather, sociocultural influences, lighting, and noise. Task constraints are
specific to the activity being undertaken and include the goal of the activity, any
rules that define whether a movement is deemed successful, and the equipment
being used (Newell, 1986). It is believed that an interaction between these three
constraints can have an impact upon how able a child is to coordinate

13
movement. Research has supported this notion, as it has been found that
children need to be given the opportunity to learn FMS in formative years in a
variety of environments (Gallahue et al., 2012).
Figure 4 – Diagrammatic representation of the theory of constraints (Newell, 1986)
NB: Figure was recreated from the original figure (Newell, 1986)
1.4 External Factors Influence on FMS Development
As alluded to in the developmental models of FMS discussed in the previous
section, there are many factors that are thought to have an influence on FMS
proficiency, those most commonly studied are discussed below.
1.4.1 Gender
There is an increasing amount of research exploring the influence of gender on
FMS development. When looking at overall FMS ability, the research is
inconsistent. Research on pre-school children (aged 4-5 years old) found no
difference in total FMS ability between boys and girls (Kokštejn et al., 2017).
However this study measured total motor ability (including fine motor skills),
rather than specifically FMS, which may have influenced the results.
Additionally, it may be the case that differences in total FMS ability may occur
as a product of age. Research with primary school children (aged 5-11 years
old) has consistently found gender differences, albeit with disparities in findings
about whether boys (Adeyemi-Walker et al., 2018; Eyre et al., 2018; Kelly et al.,
2019; Morley et al., 2015) or girls (Matarma et al., 2020; Niemistö et al., 2020)
are more proficient.
When evaluating the three component groups of FMS (locomotor, object control
and stability) separately, the results are more consistent. The most commonly

14
found effect is with regards to object control skills. Most studies examining this
domain find that boys perform better than girls when combining scores of
throwing, kicking and catching (Adeyemi-Walker et al., 2018; Barnett, Telford, et
al., 2019; Ali Brian et al., 2018; Brian et al., 2019; Capio & Eguia, 2020; Cohen
et al., 2014; Eyre et al., 2018; Foulkes et al., 2015; Goodway et al., 2010; Kelly
et al., 2019; Lawson et al., 2021; Tomaz et al., 2019). One study found that
these object control differences may emerge with age. They found no
differences for 3-5 year old children, but that that by the age of six, boys were
more proficient (Kokštejn et al., 2017). However, a small number of studies
have found that there are no gender differences in object control ability for
either pre-school (García-Marín et al., 2020) or primary school aged children
(Matarma et al., 2020). With regards to locomotor skills, there is a split in the
research with some studies finding that girls outperform boys on locomotor
tasks (Behan et al., 2019; Cohen et al., 2014; Lawson et al., 2021; Matarma et
al., 2020) but most finding that there is no significant difference between
genders for these skills (Ali Brian et al., 2018; Brian et al., 2019; Foulkes et al.,
2015; García-Marín et al., 2020; Goodway et al., 2010; Kelly et al., 2019;
Tomaz et al., 2019). Lastly, there has been minimal research to date into
difference between boys’ and girls’ performances on balance tasks. Most
studies find that boys are less proficient (Behan et al., 2019; Matarma et al.,
2020; Mickle et al., 2011), but there is some evidence that these differences
may be non-significant in some populations (Kokštejn et al., 2017).
It is important to recognise that all of this research is correlational and therefore
causation cannot be inferred. It is perhaps surprising that these differences are
being found in pre-school and primary school children because biologically,
there isn’t much difference between boys and girls that could explain these
differences (e.g. strength, and limb length) before puberty (Malina et al., 2004).
Considering the Theory of Constraints (Newell, 1986), it could be suggested
that individual psychological constraints might account for these differences,
such as PMC and self-esteem factors may influence these gender differences.
The Participation in Lifelong PA Model (Hulteen, Morgan, et al., 2018) would
suggest that these differences are also likely due, in part, to the socio-cultural
and geographical filter. Previous studies would support this, as it has been
postulated that variances by gender are likely found due to differences in the
home environment whilst growing up, such as what children have been exposed
to by their family, peers and teachers (Garcia, 1994). There has however been
limited research on this area.

15
1.4.2 Socioeconomic Status
Socioeconomic status (SES) is a measure of a person’s combined social and
economic position within society (Baker, 2014), which is usually measured by
their income, education, neighbourhood levels of deprivation and occupation.
Two systematic reviews have been undertaken which looked at correlates of
FMS that evaluated the impact of SES (Barnett, Lai, et al., 2016; Venetsanou &
Kambas, 2010). The first of these reviews found a consistent relationship
between FMS and SES, in which children living in lower SES areas, with less
educated parents were more likely to have poorer FMS proficiency (Venetsanou
& Kambas, 2010). The second review found more inconsistent evidence in
favour of SES having an influence on FMS proficiency. However the overall
consensus was that higher SES children, on average, have better locomotor
skills and score higher on FMS composite scores (Barnett, Lai, et al., 2016).
Since the completion of the second systematic review, studies in the UK,
Australia and Brazil have found SES effects, in which high and middle SES
children outperform children from a low SES background (da Rocha Queiroz et
al., 2020; Morley et al., 2015; Stratton et al., 2017; Veldman et al., 2020).
Studies from the USA and South Africa, however, did not find this (Brian et al.,
2019; De Waal & Pienaar, 2020; Tomaz et al., 2019). One study found no
influence of SES on either locomotor or object control skills (Brian et al., 2019)
and a second found the opposite effect, in which low SES children, from rural
locations, had significantly higher FMS composite scores and locomotor
subscale scores when compared to high SES children from urban locations
(Tomaz et al., 2019).
It is likely that differences in the way that SES are categorised in studies may
impact upon results because individual measures (e.g. maternal education)
often tap into different aspects of home life and do not encapsulate the
complexity of SES as a construct (Kininmonth et al., 2020). It is also important
to recognise that all of these studies are cross-sectional. Only one longitudinal
study has been done in this area, which found that although SES had a
significant impact upon FMS ability at baseline (five years old), SES did not
have an impact on FMS ability over time (De Waal & Pienaar, 2020). It has
been proposed that SES differences may, in part, occur due to differences in
space and resources available in the home environment to practice FMS
(Venetsanou & Kambas, 2010). It is also possible that access to provision
outside of the home and school environment (e.g. sports clubs) plays a role.

16
1.4.3 Ethnicity
Studies examining the relationship between ethnicity and FMS have also
reported somewhat conflicting results. A systematic review (Barnett, Lai, et al.,
2016) found two papers that looked at the correlation between ethnicity and
FMS proficiency in childhood, both of which found no association with total
motor score (Erwin & Castelli, 2008; McKenzie et al., 2002). These findings
have been recently replicated in the USA (Brian et al., 2019). There is, however,
a body of evidence which would suggest that ethnicity has the potential to
impact upon FMS ability. Studies based in the UK have found that children of
South Asian heritage performed significantly worse on locomotor skills and total
FMS scores when compared to peers with a White or Black ethnic background
(Adeyemi-Walker et al., 2018; Eyre et al., 2018). Similarly, a sample of children
in Wales showed that fewer children of Asian descent met expected standards
of FMS proficiency than White British children (Stratton et al., 2017). Although
UK studies have not found an association between object control skills and
ethnicity (Adeyemi-Walker et al., 2018; Eyre et al., 2018), this effect has been
found in an Australian sample(Barnett, Telford, et al., 2019). In this study,
children who spoke European languages at home scored, on average, two
points higher on object control subscales than children who had English as an
additional language.
It is likely that the way in which ethnicity is categorised within these studies
influences whether or not studies find ethnic differences in FMS ability (which
parallels with the issues highlighted with SES in the previous section). Two
studies have found different results dependent on the measure of ethnicity, with
language spoken at home (Eyre et al., 2018) and the area in which the child
resides (Goodway et al., 2010) not demonstrating this relationship but parentally
reported ethnicity of the child playing a role in FMS proficiency. It is possible
that this is, in part due to the generalisation of ethnicity based on external
factors, rather than focusing on the individual child. For example, area lived in
may associate with ethnicity due to relationships with ethnic density but area
may also be reflective of socioeconomic status. Additionally, it is possible, that
for the studies which solely use language spoken at home as the measure of
ethnicity (Barnett, Telford, et al., 2019), that the results may reflect the
difficulties children with English as an additional language may face in
understanding the explanation of activities, and the feedback they are given
(Logan et al., 2012). It has also been proposed that differences in FMS ability
due to ethnicity may occur due to sociocultural factors such as the importance
parents place on physical activity and educational activities (Barnett, Hnatiuk, et
al., 2019; Cools et al., 2011) as well as biological factors, such as ethnic

17
differences in BMI and muscle mass (Eyre et al., 2018). Finally, research has
found inequalities in the healthcare system for ethnic minorities (Kelly et al.,
2016; Nazroo, 2003) which may impact upon the development of FMS for
children from South Asian communities.
1.5 Assessment of FMS
As FMS proficiency levels are low worldwide (see Section 1.2), it is crucial that
children struggling with their development are able to easily access assessment
and intervention services. Currently in the UK, it is necessary for a child to
complete a three stage process to receive an assessment for motor difficulties.
This process involves: (i) parental/carer identification of an issue, (ii) an
appointment with the family’s medical doctor/general practitioner (GP) and (iii)
referral to an occupational therapist (OT) or physiotherapist, where an
assessment can then be undertaken (NHS, 2019). At this appointment, a child
is screened for both FMS difficulties, and fine motor difficulties, using the
Movement Assessment Battery for Children (Hendersen et al., 2007;
Henderson et al., 1992), which requires the child to perform motor skills for the
OT that are then evaluated in relation to pre-defined guidance. Only a child who
scores below the fifteenth percentile (i.e. they perform worse than 85% of
children of the same age, as per the normative dataset for the measure) may be
considered eligible for a diagnosis of Developmental Coordination Disorder
(DCD), which then enables them to be referred for additional help and support.
Whilst it is important to note that a diagnosis of DCD does not rest solely on
how a child scores on the MABC (Barnett et al., 2015; Blank et al., 2019), there
are, however, often problems at each stage of the process outline above. These
problems can result in children with FMS difficulties being missed, and the most
disadvantaged children being underserved. The following sections outline the
nature of the problems alluded to above.
1.5.1 Problems with Current Assessment Procedures
1.5.1.1 Parental Awareness
Firstly, in order for a child to access an assessment, it requires a parent or
guardian to identify that an issue may be present, yet parental estimates of
ability may not be accurate. It has been found that a parent’s level of knowledge
about childhood development can influence their perceptions of their child’s
ability (Cowen, 2001). Generally amongst parents though, there can be a lack of
knowledge about the ages at which children should achieve motor milestones,
which leads to parents overestimating their child’s ability (Rikhy et al., 2010).
This overestimation could lead to children with problems not receiving

18
assessments, and thus not being able to access services to support FMS
development. More recently, research has been conducted that compares
parental perceptions of motor skills to a child’s actual motor competence, as
measured by assessment tools. Overall, there seems to be a weak to moderate
relationship between parental perceptions of their child’s motor ability and the
child’s actual FMS ability (Brown & Lane, 2014; Estevan et al., 2018; Kennedy
et al., 2012; Liong et al., 2015; Maher et al., 2018; Zysset et al., 2018). It is,
however, important to note that when more robust statistical tests are utilised,
for example, regression, the percentage of the variance that parental
perceptions of their child’s motor ability accounts for is low (e.g. 6.9% in the
Brown & Lane, 2014 study). One study reported that correct identification of
ability may also depend on the type of skill assessed, as parents were more
accurate for object control skills than locomotor ones (Maher et al., 2018).
In addition, it is possible that gender may have an influence on parental
perception of FMS ability, with parents overestimating boys’ ability in one study
(Estevan et al., 2018). Meanwhile, in a second study perceptions of girls’
locomotor ability and boys object control ability being accurate, but not vice
versa (Liong et al., 2015). It is also important to note that for three of the six
samples detailed above, the parents sampled were from a high SES area, with
good levels of education (Kennedy et al., 2012; Liong et al., 2015; Maher et al.,
2018), factors that are known to improve the accuracy of parent’s perceptions of
their child’s abilities (Cowen, 2001). Therefore, it is likely that the correlations
from these studies may overestimate the strength of relationships in more
diverse populations. Due to all of these factors, it is extremely problematic to
rely solely on parents or caregivers as a first line of defence in identifying
children with difficulties, as it is likely that there will be a large number of
children missed.
1.5.1.2 Healthcare Issues
Firstly, the criteria for diagnosing DCD are very stringent. To enable a diagnosis
of DCD worldwide a child must meet four criteria outlined by the Diagnostic and
Statistical Manual of Mental Disorders (American Psychiatric Association,
2013):
(i) Have motor performance (which is determined by a combined score of
both fine and gross motor) below expected levels for their age group
(ii) The motor difficulties in criteria (i) must significantly and persistently
interfere with activities of daily living (ADL) or education
(iii) Difficulties must first present themselves in ‘early development’

19
(iv) Children must not have intellectual disabilities, visual impairments or
neurological conditions which affect movement
Criteria (ii) is restrictive as ADLs are inherently different to FMS. ADLs refer to
the skills a person needs in order to functionally manage basic needs (Mlinac &
Feng, 2016), such as going to the toilet, eating, brushing teeth and getting
dressed, whereas FMS relate to skills enabling participation in physical activity.
Additionally, it is unclear whether FMS difficulties can be classified as interfering
with education given that these skills are not measured within the curriculum as
a form of academic achievement. Criteria (iii) could potentially exclude children
from receiving help if their difficulties with FMS emerged later on in childhood,
due to unforeseen circumstances such as the COVID-19 pandemic. This is a
plausible scenario given recent research has postulated that lockdown had a
negative effect on FMS abilities in Portuguese children (Pombo et al., 2021).
Finally, these guidelines preclude children with intellectual disabilities, visual
impairments and neurological conditions from accessing support that
specifically seeks to improve their motor skills. It is therefore unsurprising that
the estimate for the number of children struggling with DCD is a lot lower than
the number of children with FMS difficulties. It is estimated that between 2-6%
of school-aged children have DCD (American Psychiatric Association, 2013),
compared to the studies finding much higher prevalence of FMS difficulties (see
Section 1.2).
In addition to this, in recent years there has been severe financial pressure on
the National Healthcare Service (NHS) (National Audit Office, 2016), which has
only increased due to the COVID-19 pandemic, with reports suggesting a
funding gap of around one billion pounds (Mortimer, 2020). With such monetary
concerns, it is perhaps unsurprising that there are a number of issues with
assessing FMS difficulties through healthcare services. One such issue is
higher waiting times. In 2019, a survey of GPs found that, on average, people
were having to wait over two weeks (14.8 days) for any appointments which
were considered ‘non-urgent’, which includes referrals for motor difficulties. This
may, in part, be due to the large number of GP jobs that are unfilled. In 2018 it
was reported that 15.3% of GP posts in the UK were unfilled, meaning the NHS
had around 6,000 fewer full time doctors than required (Matthews-King, 2018).
The same recruitment issues are also apparent within physiotherapy and
occupational therapy (OT) services, where there are over 106,000 vacancies
being advertised (UNISON, 2019) and upwards of 15% of OT jobs left unfilled
(Health Education England, 2017). This subsequently means that fewer
practitioners are available to assess children for FMS difficulties. It is therefore,
unsurprising, that these teams are unable to meet waiting time targets in the UK

20
(i.e. seeing 90% of patients within four weeks of being referred) (Dunford et al.,
2010; Dunford & Richards, 2003). This is evidenced by a survey in Scotland
which found that fewer than 50% of patients were being seen in this timeframe
within OT and physiotherapy services (Information Services Division Scotland,
2018). This long lead time to assessment (6+ weeks) may be off-putting for
parents, particularly if they are unaware of the impact FMS difficulties can have
on other aspects of childhood development and wellbeing (Barnett, Stodden, et
al., 2016).
Finally, it is also important to note that health inequalities also play a role in
whether parents access such services for their child. A longitudinal birth cohort
based in Bradford (Raynor & Group, 2008) surveyed over 12,000 mothers and
found that low SES mothers were less likely to access primary care services
than mothers from high SES when it was not related to their own ill health (Kelly
et al., 2016). This may mean that more deprived mothers are less likely to visit
their GP for concerns about their child’s FMS (Kelly et al., 2016). It has
previously been suggested that women living in areas of socioeconomic
deprivation find it difficult to access primary care services rapidly when
necessary (Smaje & Le Grand, 1997). Kelly et al. (2016) replicated these
results, and found the fact that low SES areas have more patients per GP than
more affluent areas may contribute to explaining this relationship.
Regardless of the reasons for not accessing primary care services, it is
important to acknowledge that these factors have an impact on accessing
preventative care. As a result, problems tend to be brought to the attention of
healthcare workers in their more ‘advanced’ stages, particularly in low SES
areas (Cookson et al., 2016). This is particularly important in the case of FMS
development, as there is thought to be a ‘window of development’ for these
skills (Gabbard & Rodrigues, 2008; Gallahue et al., 2012). In addition to SES,
there are also health inequalities in relation to ethnicity, in which ethnic minority
groups are less likely to access NHS services than their white British
counterparts (Kelly et al., 2016). Research has postulated that this may be due
to cultural and language barriers (Szczepura, 2005). This may mean that
children from certain ethnic groups could be missed using the current referral
system for assessments of FMS issues.
1.5.2 Universal Screening of FMS
Considering the issues with the current system of assessment used within UK,
there is a need to explore more resourceful solutions. These could enable
improvements in the systematic and efficient assessment of more children’s
FMS, ensuring that timelier, targeted support can be provided, with greater

21
regularity, and less referral bias. One way this could be achieved is through
‘universal screening’ of children.
1.5.2.1 Potential Role of Schools
In the UK, Primary Schools (children aged 4-11) have previously been identified
as an ideal location for such initiatives by the Chief Medical Officer (Finch,
2015). They are a logical place to host universal screening as children spend a
large proportion of their time in schools, and early identification of motor skill
difficulties is known to be beneficial (Missiuna et al., 2003). Additionally, FMS
development is incorporated within the primary school curriculum in the UK. The
curriculum for the Early Years (i.e. children aged 4-5 years old) has a focus on
the development of FMS (Department For Education, 2014). At the end of this
school year teachers are required to rate whether each child is ‘exceeding, ‘at’
or ‘below’ expected levels of ‘moving and handling’ skills, as part of a wider
assessment of childhood development called the Early Years Foundation Stage
Profile (EYFSP). In 2019, 89.2% of children in England were found to be ‘at’ or
‘exceeding’ expected levels for moving and handling (Department for Education,
2019a). However the guidelines for assessment are rather vague and
somewhat subjective, with teachers being asked whether children (i) show good
control and co-ordination in large and small movements, (ii) move confidently in
a range of ways, safely negotiating space and (iii) handle equipment and tools
effectively, including pencils for writing (Department for Education, 2020).
Greater focus on motor skills is evident in Key Stage One (KS1; i.e. children
aged 5-7) where the development of FMS are a key outcome within Physical
Education (Department For Education, 2013). The curriculum for this age group
states that in KS1, children should be able to master basic skills including
running, jumping, throwing, catching and balance (Department For Education,
2013). Despite this focus in the curriculum though, these expectations are never
formally assessed in KS1. Introducing assessments of FMS into Physical
Education (P.E.), where these skills are already being practiced, should
therefore not be considered an additional burden on schools, rather this would
be essential for properly assessing stated learning outcomes within the current
curriculum.
Assessing FMS in schools could also help with other initiatives. In particular,
there has been increasing pressure on schools to contribute to helping to
increase the levels of childhood physical activity (Department for Digital Culture
Media & Sport, 2015). It is recommended that children should get a minimum of
30 minutes of moderate-to- vigorous physical activity (MVPA) in school each
weekday (Department for Education et al., 2019), which is half of the guideline

22
recommendations (1 hour per day). In order to help schools achieve this goal,
the Government has given an additional 32 million pounds worth of funding (the
PE and Sport Premium) to improve P.E. and physical activity provision in
schools (Department For Education, 2019b). As research has shown that FMS
play a crucial role in facilitating participation in physical activity, ensuring
children have adequate FMS proficiency will be essential.
Such initiatives may play an even more important role in response to delays in
childhood development attributed to the COVID-19 pandemic. Surveys of
parents have found that a large proportion of children (72%) did less physical
activity during lockdown (Pombo et al., 2020) and used play facilities less (Guan
et al., 2020). A large longitudinal cohort study found that over a third of children
failed to leave the house during lockdown, and that only 29% of children were
meeting physical activity guidelines, with a disproportionately low amount of
children from a South Asian heritage being included within this statistic
(Bingham et al., 2021). Additionally, initial reports from the Office for Standards
in Education, Children's Services and Skills suggests that on their return to
school, the physical skills of pupils had regressed (Ofsted, 2020).
The concept of assessing FMS within school time is not a new one, in both
Canada and Australia this is trialled and implemented in different ways. In
Canada, Partnering for Change incorporated OTs into school settings to help
support children with additional needs (Missiuna et al., 2017). Results from this
study were promising, as children were highlighted as struggling with motor
skills much earlier than using the traditional model of assessment; children
identified by the school OT were identified on average one year earlier than
those on the waiting list (Missiuna et al., 2017). Additionally, there was also less
gender bias, whereby there was an increase in the number of girls being
identified. There were only 11 girls on the waiting list for assessment, but
through classroom observation the OTs identified 27 additional girls who were
then referred for assessment (Missiuna et al., 2017). Although not all children
were screened for movement difficulties using this collaborative approach
between healthcare and education services, OTs did observe lessons and
assess children that were not participating as much, as well as children who
were on the waiting list for assessments. In Australia the approach was slightly
different. Schools within the state of Victoria, and Western Victoria were given a
manual on FMS that also instructed teachers on how to assess them within P.E.
lessons (Department of Education Victoria, 2009; Department of Education
Western Australia, 2013).

23
1.5.2.2 Assessment Tools Available
There are a wide range of assessment tools that could be used to measure
FMS in schools (see Figure 5). These involve both subjective and objective
methodologies (Bardid, Vannozzi, et al., 2019). Within subjective methods there
are self-report (child) and proxy report (teachers) which utilise questionnaires to
establish perceived abilities. These methodologies are relatively low cost, and
quick to implement, meaning that a large number of children can be assessed
(Bardid, Vannozzi, et al., 2019). The speed at which these questionnaires could
be implemented in schools would be beneficial to enable universal screening.
There are, however, severe limitations to such approaches. A recent meta-
analysis found that although research generally shows a relationship between a
child’s actual and perceived motor competence, the effect size of this
relationship is small (De Meester et al., 2020). Some research even suggests
there are no correlations between these variables (Estevan et al., 2018; Liong
et al., 2015). With evidence suggesting that children are poor at estimating their
own FMS ability, particularly in younger age groups (Ali Brian et al., 2018; Liong
et al., 2015; True et al., 2017), it is difficult to justify the use of self-report in
universal screening programmes in schools. There has been limited research
on how accurate teachers’ proxy reports are with regards to childhood FMS
ability. The research that has been done in this area has found mixed results
with some studies suggesting that teacher reports are more accurate than child
self-report (Estevan et al., 2017) and other suggesting the contrary (Lalor et al.,
2016). One particular issue with teacher proxy reports is that they do not require
the teachers to watch pupils performing the skills, and it is therefore possible
that memory and judgement may bias the accuracy of these assessments
(Bardid, Vannozzi, et al., 2019). Due to the subjectivity of proxy reports, it is
again questionable whether it would be a valid methodology for use in
screening, particularly as there is a lack of P.E. specialists within the UK
(Ofsted, 2013) that would have a working knowledge of FMS.
In contrast to self-report and proxy report, there are objective assessments
available for assessing FMS in children. One subset within this class of
methodologies is motion devices, which analyse movement using specialist
equipment (e.g. cameras, force plates and motion sensors) to quantify
movement. There is a wide range of technologies used to measure FMS in this
context, including inertial measurements units (e.g. accelerometers), motion
sensors, and force platforms (Clark et al., 2021). These methods are relatively
new in comparison to other measures, and are advancing alongside
technological improvements to offer a completely objective overview of
children’s motor ability. In recent years, these motion devices have become

24
wearable outside of a lab setting (e.g. gyroscopes and accelerometers), and
thus research is being done on the best placement for these devices and how to
classify FMS using this technology (Duncan, Dobell, et al., 2020; Duncan et al.,
2019). Research has shown that these devices can differentiate between
different FMS ability levels in children (Grimpampi et al., 2016), but that certain
skill criteria can be misclassified (Lander et al., 2020). A recent systematic
review has highlighted the need for more large scale studies evaluating the
validity, reliability and usability of these methods (Clark et al., 2021). Although
sensor technology has promise, and will likely improve in the coming years,
they have a number of limitations that undermine their utility in a school setting
currently. Firstly, motion devices are costly (Bardid, Vannozzi, et al., 2019) and,
with the pressure on school budgets predicted to worsen (Perera, 2020), it is
unlikely that schools would be able to invest such technology. Additionally, they
require specialist knowledge of how to process the data and extract meaningful
results (Bardid, Vannozzi, et al., 2019), which most schools are unlikely to have.
Thus, without extensive training, the data collected would be meaningless for
schools.
Figure 5 – Methods of assessment available to measure FMS in school-aged children
NB: Figure modified from Bardid et al. (2019).
The assessment tools that have been utilised in the school-testing initiatives in
Canada and Australia, outlined in section 1.4.2.1, were observational.
Observational assessment tools require an assessor to watch a child physically
performing a skill and score them based on a set of pre-determined criteria. In
the Canadian model, OTs used the Movement Assessment Battery for Children

25
(Hendersen et al., 2007), a well-known diagnostic tool used within clinical
settings to evaluate motor proficiency. In Australia, a purpose-made
assessment was designed for teachers to implement (Department of Education
Victoria, 2009; Department of Education Western Australia, 2013).
Observational assessment tools offer a middle ground to schools, in that they
are less expensive than motion devices, but also less subjective than self- or
proxy-reports. They also can be designed to require minimal data entry. It could
therefore be argued, that out of the four possible methodological approaches
available to assess childhood FMS proficiency, observational assessments are
the most feasible for use in schools, particularly because these measures have
been implemented successfully in school-based initiatives previously overseas
(Department of Education Victoria, 2009; Department of Education Western
Australia, 2013; Missiuna et al., 2017). However, even when focusing on
observational assessment tools alone, there are a large number of different
assessment tools which could be used to measure the FMS of school-aged
children (Klingberg et al., 2018), with new tools being developed all the time. In
addition to this, the psychometric properties of these assessment tools are also
not always readily available, which makes evaluating their utility for school-
based screening difficult.
1.6 Thesis Aims
This thesis therefore aims to:
(i) Understand what observational assessment tools are currently
available to measure FMS in school-aged children, which could be
used for universal screening, and evaluate the validity and reliability
of these assessment tools
(ii) Examine what factors would make FMS assessments feasible for use
in a school setting
(iii) Develop a teacher-led assessment tool that has strong theoretical
and psychometric underpinnings, that is also suitable for use in a
universal screening programme of FMS ability in Primary schools
(iv) Evaluate the validity, reliability, feasibility and acceptability of the new
assessment tool

26
1.7 Thesis structure
The studies undertaken for this thesis addressed these aims as follows.
Chapter Two - This chapter includes a comprehensive systematic review that
synthesises peer-reviewed literature on the psychometric properties of the
assessment tools that currently exist for the evaluation of the FMS of school-
aged children.
Chapter Three – This chapter reports the findings from of an online
questionnaire, which was designed using behaviour change theories
(Capability, Opportunity, Motivation, Behaviour model (Michie et al., 2011) and
the Theoretical Domains Framework (Cane et al., 2012) to understand, from the
viewpoint of teaching staff, what barriers and facilitators there are to
implementing school-based assessments of FMS. By utilising behaviour change
frameworks, guidelines were able to be formulated which detailed both (i) what
school-based FMS assessments should entail, and (ii) accompanying behaviour
change techniques that should be implemented to increase the likelihood of
school-based assessments of FMS becoming a reality.
Chapter Four – This chapter details three studies that were used to help guide
the development of a new teacher-led assessment of FMS (FUNMOVES),
based on the guidelines set out in chapter 3. These three studies iteratively
evaluate the structural validity of FUNMOVES using Rasch analysis, and detail
modifications made based on Rasch and implementation fidelity results from
each study.
Chapter Five - comprises a protocol with two work packages. The first work
package proposes exploring additional aspects of validity and reliability, as per
the COSMIN checklist. The second work package proposes using focus groups
with teachers that have implemented FUNMOVES to evaluate feasibility and
acceptability. Unfortunately, due to COVID-19, this protocol was not able to be
actioned within the timeframe of this PhD.
Chapter Six – This final chapter includes an overview of the findings and
implications from the previous five chapters, and outlines directions for future
research.
For an overview of how the chapters link see Figure 6.

27
Figure 6 – Diagrammatic representation of the thesis structure
1.8 My Role
For the duration of the PhD, I was based in the School of Psychology at the
University of Leeds and the Bradford Institute for Health Research (BIHR),
which hosts the Born in Bradford (BiB) birth cohort study. BIHR and BiB acted
as an industrial partner in my funding. BiB is a longitudinal cohort study which
begun in 2007 that is tracking the health and wellbeing of over 13,500 children
and their families. Beyond this, BiB also uses their contacts and expertise to
facilitate and conduct research (such as that included within this thesis) within
Bradford schools. This research often contains a mix of BiB children and
children not involved in the cohort. I have also been involved with Centre for
Applied Education Research (CAER) since it opened in 2019. CAER aims to
empower schools to ensure that children have the best possible start in life, and
education. It was created by the Bradford Opportunity Area (BOA), this was one
of twelve Opportunity Areas that the Department for Education funded to work

28
in areas identified as ‘social mobility cold spots’. Consequently, the BOA has
since received prioritisation of resources to improve outcomes for children in the
area.
For the studies in Chapters 2-5 (protocol included) I wrote the ethics application.
For the systematic review in Chapter two I (alongside my supervision team)
planned the scope of the review, and I subsequently wrote the protocol for the
methods so that they could be pre-registered on PROSPERO. I reviewed all
articles during both title and abstract screening. I also trained and supervised a
team of BiB interns to help with screening, data extraction and risk of bias
assessment. I wrote up the review for both publication and for inclusion in this
thesis.
For Chapter Three I, alongside my supervision team, designed the online
questionnaire for teachers. I advertised the questionnaire on social media
(Twitter, and teacher groups on Facebook) and on Bradford Schools Online. I
held discussions with my supervision team about the alignment of this research
to the COM-B and TDF models of behaviour change. I processed and cleaned
the data, and completed all data analysis for this chapter. I also wrote up the
results of the questionnaire for both publication and for inclusion in this thesis.
I led the initial development of FUNMOVES and all three studies in Chapter
Four. I presented the ‘regularly included’ activities for pre-existing FMS
assessments (based on the results from Chapter 2) to the working group, and
we discussed which to include, and how each activity should work based on
feasibility criteria outlined in Chapter 3. I was responsible for creating all of the
resources for testing (e.g. consent forms, teacher manuals, score sheets,
implementation fidelity checklists), and training the teachers prior to testing. I
was also present for testing in all schools, to evaluate implementation fidelity
and assist with any queries the teachers had. After testing I inputted, and
cleaned the data from all schools, and then conducted the Rasch analysis for all
studies (in conjunction with Nick Preston for Study 1). After each round of
testing I also hosted meetings with the working group to discuss the iterative
changes to FUNMOVES. I also wrote up these three studies for both publication
and for inclusion in this thesis.
For Chapter Five I designed the protocol, with support from my supervision
team. I edited the ethics application at the start of the COVID-19 pandemic to
reflect more ‘COVID safe practices’ in the hope that testing may be able to take
place before the end of my PhD. I coordinated with interested schools about
testing, and the protocol was almost enacted on a number of occasions but due
to circumstances within schools, and indeed university policies on data

29
collection during the pandemic, unfortunately this research was never
conducted. I am, however, in discussions with schools presently and I am
preparing to undertake this work in the near future.

30
Chapter 2
Systematic Review of Observational Assessment Tools
Available to Measure the Fundamental Movement Skills of
School-Aged Children
2.1 Background
Chapter 1 established the need for universal screening of children’s FMS and
outlined the important role observational assessment tools could play in such a
task. It was noted that there were a large number of observational assessment
tools that could be suitable for this purpose. However, it is unclear which of
these options represent the best choice for schools. For example, which are the
most valid and reliable assessments currently available? Thus, there is a need
for a systematic review in this area.
The measurement of FMS will play a particularly crucial role in schools, due to
the unique nature of these settings. Measurement is particularly difficult as it
requires there to be a relationship between theoretical constructs (e.g. FMS)
and observable behaviours, such as how fast a child can run (Carmines &
Zeller, 1979). When this relationship is strong, it enables useful inferences to be
made about the underlying theoretical constructs (Carmines & Zeller, 1979)
however, errors in measurement can have a detrimental effect on the
conclusions that can be made in research. There are two different types of error
that can occur in measurement; systematic and random. Systematic errors
occur when the assessment tool that you are using is wrong by consistently the
same amount every time that you use it (Drost, 2011). One example of this
would be if you were trying to measure how far a child can throw but the tape
measure does not have accurate measurements on it, with the distance
between each centimetre marking actually 1.5 centimetres in distance. This
would mean that the score given to every child would be reflective of two thirds
of the actual distance they had thrown. Random errors are caused by factors
which vary between measurements (Drost, 2011). One example of this would
be if children were being tested in the playground on how well they can hop,
and the surface was uneven in some places, this may have an impact upon a
child’s balance and thus, score. These differences are not, however, consistent,
as where the child hops will depend on where in the playground they were
assessed. As there are many things that can cause variability in outcome, it is

31
important to evaluate, not only the errors in measurement (reliability) but also
those in the assessment tool used (validity) (Drost, 2011).
It is particularly important for any assessment tool that is selected for use in
universal screening programmes in schools to be valid and reliable, for a
number of reasons. Firstly, it is imperative that the tool for measuring FMS,
does so in a manner consistent with how FMS is defined in the Primary school
P.E. curriculum, in order for it to have relevance for educators. The syllabus
includes the practice of locomotor, object control and stability skills (Department
For Education, 2013). Without all these skills being measured, it is likely that it
will limit the clinical inferences that can be made (Haynes et al., 1995), and as
such, it would be difficult to identify children struggling with the development of
the skills that the Department for Education classify as important to a child’s
development in schools. As teachers already feel under severe time pressure to
deliver the ‘core’ curriculum (i.e. English, Mathematics and Science) (Routen et
al., 2018), it is also crucial that any additional assessment introduced within the
school day can efficiently distinguish between ability levels and provide useful
information about pupils’ development. In addition to this, with screening likely
to take place infrequently, such as annually, it is important that the scores
children receive are representative of their actual ability, and are not caused by
measurement factors such as who implemented the assessment, or because
the scoring of activities are not stable over time. Where such sources of error
present, children may be misidentified as having problems with FMS, and the
limited resources schools have may be unintentionally misplaced for the year.
In this chapter, a systematic review was undertaken to:
(i) establish a comprehensive summary of the observational tools currently used
to measure FMS that have been subjected to scientific peer-review.
(ii) examine and report the validity and reliability of such assessments, to
provide an overview of assessment tools which may be suitable for universally
screening FMS in schools.
2.2 Methods
Methods for this systematic review were registered on PROSPERO
(CRD42019121029), a copy of which can be found in Appendix A.
2.2.1 Inclusion Criteria and Preliminary Systematic Search
A preliminary search was conducted to identify assessment tools that were
identified in peer-review published research as measures of FMS in school-
aged children. This pre-search was conducted in seven electronic databases

32
(PubMed, Medline, Embase, CINAHL, SportDiscus, PsycInfo and Web of
Science) in December 2018, and was subsequently updated in May 2020. It
used the search terms ‘fundamental movement skills’ OR ‘fundamental motor
skills’. Assessment tools identified in this pre-search were included in the
subsequent review if they were confirmed to: (i) assess fundamental movement
skills, including locomotor, object control and/or stability skills (Gallahue et al.,
2012) (ii) observationally measure actual FMS competence (i.e. physical,
observable abilities); (iii) assess children on a standard battery of tasks which
were completed in the presence of an assessor. Proxy reports and
assessments that measured perceived motor competence were therefore
excluded from the review. No restrictions were placed on the health or
development of included participants, as befits investigations within a school
context because any assessment tool that is going to be used in an educational
setting would need to be appropriate for use with children of a variety of ages,
both with and without developmental difficulties.
The titles and abstracts of the results of this pre-search were screened by the
lead reviewer (Lucy H. Eddy [LHE]) to identify assessment tools mentioned
within them that were being used to assess FMS. Any studies stating they were
assessing FMS but omitting mention of the specific assessment tool in the title
or abstract underwent a further full text review.
2.2.2 Electronic Search Strategy and Information Sources
The search strategy developed (see Appendix B) was applied in seven
electronic databases (PubMed, Medline, Embase, CINAHL, SportDiscus,
PsycInfo and Web of Science) in January 2019, and was then updated in May
2020. Conference abstracts that were identified were followed up by searching
for the full articles or contacting authors to clarify whether the work had been
published.
2.2.3 Study Selection
For the initial search (Dec 2018), titles and abstracts were screened in their
entirety by one lead-reviewer (LHE), and two co-reviewers (Nishaat F. Shahid &
Kirsty L. Crossley [researchers]) independently assessed half each. The same
process was followed for full text screening to identify eligible studies.
Reviewers were not blind to author or journal information and disagreement
between reviewers was resolved through consultation with a fourth reviewer
(Daniel D. Bingham [supervisor]). For the update (May 2020), the same process
was repeated but with two different co-reviewers (Marsha Ellingham-Khan &
Natalie S. Figuero).

33
2.2.4 Data Extraction Process & Quality Assessment
Three reviewers each extracted information from a third of the studies in the
review in both the initial search (LHE, KLC & NFS) and the update (ME-K, NSF
& Ava Otteslev). Data extraction and an assessment of the methodological
quality of each study were completed using the Consensus-based Standards for
the Selection of health Measurement INstruments (COSMIN) checklist (Mokkink
et al., 2010b), which outlines guidance for the reporting of the psychometric
properties of health-related assessment tools. Information was extracted on: (i)
author details and publication date; (ii) sample size and demographic
information related to the sample; (iii) the assessment tool(s) used; (iv) the
type(s) of psychometric properties measured by each study; (v) the statistical
analyses used to quantify validity or reliability, including whether they were
measured using classical test theory (CTT) or item-response theory (IRT); and
(vi) the statistical findings. Methodological quality ratings for each study were
recorded as the percentage of the standards that it had met for its included
psychometric properties and generalisability. When an IRT method was used, a
second quality percentage was calculated, based on the COSMIN guidelines for
IRT models (Mokkink et al., 2010b). The lead reviewer (LHE) and a second
reviewer (AO) each evaluated half of the studies for methodological quality, with
a 10% cross-over to ensure agreement. Agreement was 100%, so no arbitration
was necessary.
2.2.5 Interpretation of Validity and Reliability
Many studies used different terminologies to describe the same type of validity
or reliability, so it was necessary to set a definition for each psychometric
property and categorise study outcomes in accordance to the COnsensus-
based Standards for the selection of health status Measurement Instruments
(COSMIN) checklist (Mokkink et al., 2010b) (see Table 1). Interpretability and
face validity (sub-categories of content validity) were not included as these
could not be quantified using statistical techniques. Responsiveness was not
included because this is recognised as being separate to validity or reliability
within the COSMIN guidance.

34
Table 1 – Definitions of Validity and Reliability defined by the COnsensus-based Standards for the selection of health status Measurement Instruments
COSMIN
category
Psychometric
Property (if
different from
COSMIN category)
Definition
Reliability Inter-Rater Reliability The level of agreement between
different assessors’ scores of children
on an assessment tool.
Intra-Rater Reliability How consistent an assessor is at
scoring children using an assessment
tool.
Test-retest Reliability The stability of the children’s scores
on an assessment tool over a
minimum of two time points.
Internal consistency The level of agreement between items
within an assessment tool.
Content
Validity
The extent to which an assessment is
representative of the
components/facets it was designed to
measure.
Construct
Validity
Structural Validity The degree to which an assessment
tool measures what it was designed to
measure.
Cross-Cultural
Validity
The degree to which an assessment
tool and its’ normative data can be
used to assess FMS in countries
other than the one it was designed in.
Hypotheses Testing The degree to which scores on
assessments are consistent with
hypotheses made by authors (e.g.
internal relationships between
subscales, relationships to scores of
other assessment tools or differences
between relevant groups.

35
COSMIN
category
Psychometric
Property (if
different from
COSMIN category)
Definition
Criterion
Validity
Concurrent Validity The level of agreement between two
assessment tools.
Predictive Validity The degree to which performance on
an assessment tool can be used to
predict performance on another
measure, tested at a later date.
Due to a large variation in the statistical tests used to assess validity and
reliability, a meta-analysis was not feasible. To enable easier interpretation of
the findings studies that utilised different statistical analyses, a traffic light
system was instead used (poor, moderate, good and excellent; see Table 2).
Table 2 - Traffic light system for analysing results of included studies
Level of Evidence
Statistical Method Poor Moderate Good Excellent
Intraclass Correlation (ICC)
(Koo & Li, 2016)
<.5 .5 - .75 .75 - .9 >.9
Pearson Correlation (Chan,
2003)
<.3 .3 - .6 .6 - .8 >.8
Spearman Correlation
(Chan, 2003)
<.3 .3 - .6 .6 - .8 >.8
Kappa (McHugh, 2012) <.6 .6 - .79 .8 - .9 >.9
Cronbach’s alpha (Streiner,
2003)
<.6 .6 - .7 .7 - .9 >.9
NB: For Kappa statistics, the first three thresholds described by the authors
(“none”, “minimal” and “weak” were combined to form “poor” in the table above
(McHugh, 2012). For Cronbach’s alpha, “unacceptable” and “poor” were
combined to be classified as “poor” for the purpose of this review (Streiner,
2003).
This allowed certain results to be grouped into different bands, according to
thresholds for these statistical values suggested in previous research. The

36
results of all analyses which utilised other forms of statistical analysis (i.e. tests
not listed in Table 2) are described in the text. For the studies that included
multiple metrics for each psychometric property, the traffic light colour used to
represent these multiple measures reflects the mean value of the specific FMS
related task scores, or subtest scores, as appropriate. A full breakdown of
results for each study can be found in Appendix C.
2.3 Results
2.3.1 Assessment Tools
The pre-search identified 33 possible FMS assessment tools of which three
were removed for not meeting criteria 1 (measuring fundamental movement
skills). These were Functional Movement Screen (Cook et al., 2006a, 2006b),
Lifelong Physical Activity Skills Battery (Hulteen, Barnett, et al., 2018), New
South Wales Schools Physical Activity and Nutrition Survey (Booth et al., 2006).
Two were removed for failing criteria 3 (assessing children on a standard
battery of tasks, completed in the presence of an assessor). These were
Fundamental Motor Skill Stage Characteristics/ Component Developmental
Sequences (Haubenstricker & Seefeldt, 1986) and the Early Years Movement
Skills Checklist (Chambers & Sugden, 2002). Additionally three tools were
identified as being the same assessment tool, with the name translated
differently- the FMS assessment tool, the Instrument for the Evaluation of
Fundamental Movement Patterns and the Test for Fundamental Movement
Skills in Adults (Jiménez-Díaz et al., 2013). The APM-Inventory (Numminen,
1995) and the Passport for Life (Physical Health Education Canada, 2014) were
also excluded as no information could be found explaining these assessment
tools, and authors either did not respond to queries or no contact information
could be found for the author. This left 24 assessment tools for inclusion in the
systematic review, which reviewed studies if they: (i) used assessment tool(s)
identified in the pre-search; (ii) measured validity or reliability quantitatively; (iii)
sampled children old enough to be in compulsory education within their country.
Studies were not excluded based on sample health or motor competence.
Concurrent validity was only examined between the 24 assessment tools
identified in the pre-search.
2.3.2 Included Studies
Electronic searches initially identified 3749 articles for review. Figure 7
demonstrates the review process which resulted in 90 studies being selected
(for study table see Appendix C).

37
Figure 7 – PRISMA flow diagram illustrating the review process
Included articles explored the validity and/or reliability of sixteen of the
assessment tools identified in the pre-search. The search did not identify any
articles for the remaining eight assessment tools (see Table 3), so the reliability
and validity of these measures could not be evaluated in this review.
Only nine of the assessment tools identified in the pre-search assess all three
components of FMS: locomotion, object control and balance (Gallahue et al.,
2012). These are: the Bruininks-Oseretsky Test of Motor Proficiency (BOT)
(Bruininks, 1978; Bruininks & Bruininks, 2005), FMS Polygon (Žuvela et al.,
2011), Get Skilled Get Active (GSGA) (NSW Department of Education and
Training, 2000), Peabody Developmental Motor Scale (PDMS) (Folio & Fewell,
1983, 2000), PLAYfun (Stearns et al., 2019), PLAYbasic (Canadian Sport for
Life, 2013), Preschooler Gross Motor Quality Scale (PGMQ) (Sun et al., 2010),
Stay in Step Screening Test (Department of Education Western Australia,
2013), and the Teen Risk Screen (Africa & Kidd, 2013). Of these assessments,

38
three were product and five were process-oriented. Figure 8 shows a
breakdown of the number of assessment tools which measure each aspect of
FMS. All assessment tools measured some form of locomotor ability, however
there was a large number of different skills assessed within this subscale
(n=13). The most commonly measured locomotor skills were jumping (n=24),
hopping (n=23) and running (n=20). Object control skills were measured by
twenty three assessment tools, with the most popular outcomes being catching
(n=21), throwing (n=19) and kicking (n=15). Stability skills were only assessed
by ten assessment tools, of which eight measured some form of static balance,
five measured walking heel to toe and two measured a child’s ability to walk
along a beam. Other aspects of motor development were also measured by
some of the included assessment tools (e.g. the Movement Assessment Battery
for Children [MABC] includes a subscale measuring manual dexterity subscale).
However this review specifically focused on reporting on measures of FMS
within these broader assessment batteries.
Figure 8 - Graphical representation of the number of assessment tools which evaluate each of the three aspects of FMS.
2.3.3 Participants
The included studies recruited a total of 51,408 participants aged between three
and seventeen years of age, with sample sizes that ranged from 9 to 5210
(mean= 556 [SD = 1000] median = 153 [IQR =652]). Twenty-four studies
included additional sample demographics, with seven studies recruiting children
with movement difficulties (Smits-Engelsman et al., 2008; Tan et al., 2001),
Cerebral Palsy (Iatridou & Dionyssiotis, 2013; Liao et al., 2001) or

39
Developmental Coordination Disorder (Valentini et al., 2015; Wilson et al., 2000;
Wuang et al., 2012). Two studies included participants with Autistic Spectrum
Disorder (Allen et al., 2017; Borremans et al., 2009), and another study
recruited children from special educational needs (SEN) schools (Van
Waelvelde et al., 2004). Eight studies defined themselves as sampling children
with learning and/or attentional problems (Capio et al., 2016; Crawford et al.,
2001; Kim et al., 2012; Mancini et al., 2020; Simons et al., 2008; Wilson et al.,
2000; Wuang et al., 2009; Wuang & Su, 2009). Three studies recruited children
with visual impairments (Bakke et al., 2017; A Brian et al., 2018; Houwen et al.,
2010) and the sample of one study included children with a disability or chronic
health condition (Field et al., 2020). Information regarding socioeconomic status
(SES) was included in one article which stated they sampled from a low SES
population (Ré et al., 2018). Meanwhile, two studies recruited samples from
indigenous populations, in Australia and Canada, respectively (Lucas et al.,
2013; Stearns et al., 2019), the former of which focused on the recruitment of
children whose mothers drank alcohol during pregnancy (Lucas et al., 2013).
Studies evaluating the validity and reliability of FMS assessment tools were
conducted in 29 countries, with Australia hosting the most studies (13), followed
by Brazil (12 studies) and the USA (nine studies). Eight studies were carried out
in Belgium and seven in Canada. The remaining 23 countries spanned Europe
(23 studies from 15 countries), Asia (10 studies from 7 countries), South
America (one study from Chile) and Africa (one study conducted in South
Africa). Two studies did not provide any information regarding where the sample
was recruited from (Capio et al., 2011; Darsaklis et al., 2013).
2.3.4 COSMIN Quality Assessment
Figure 9 shows the results of the generalisability subscale of the quality
assessment for the included studies. The COSMIN checklist (Mokkink et al.,
2010b) revealed multiple issues with reporting in the included studies, with 85%
of studies not providing enough information to make a judgement about missing
responses, and 76% of studies failing to report the language with which the
assessment tool was conducted. Additionally, over a third of the studies
included in this review did not adequately describe the method used to recruit
participants, the age of participants, or the setting in which testing was
conducted.

40
Figure 9 - Summary of the generalisability subscale of the COSMIN checklist
2.3.5 Assessment Tool Categorisation
The observational assessment methods reviewed were defined categorically as
either assessing FMS using a “process” or “product-oriented” methodology
(Logan et al., 2017). Product-oriented assessments measure the outcome of a
movement, for example, how far a child can run in ten seconds. Process-
oriented assessments on the other hand evaluate how a movement is
completed. For example, whether a child’s knees achieve a ninety degree angle
to the floor when they are running. Given these two different approaches to
measuring FMS, which can be used for different purposes in the literature, they
were distinguished between in this review. Of the 24 assessment tools identified
(summarised in Table 3) Eight were product-oriented, fourteen were process-
oriented, and two assessment tools included both process and product
elements within their methodologies.
2.3.6 Product-Oriented Assessments
Despite the pre-search identifying eight product-oriented assessments in the
FMS literature, the systematic review only identified research on the validity and
reliability of six of these measures (described below). No evaluations of the
psychometric properties of any of the following assessments were found: the
FMS Test Package (Adam et al., 1988; Kalaja et al., 2012) and the Stay in Step
Screening Test (Department of Education Western Australia, 2013).

41
2.3.6.1 Movement Assessment Battery for Children (MABC)
Twenty-three studies evaluated the validity and/or reliability of the MABC or
MABC-2. All of the ten COSMIN categories this review focused on (see Table
1) were evaluated for the MABC. Overall there was strong evidence for inter-
rater reliability for these assessments (see Table 4). However, there were more
mixed results for other aspects of validity and reliability, with the weakest
evidence being found in support of its internal consistency. Intra-rater reliability
was only looked at in two studies (Holm et al., 2013; Valentini et al., 2014), with
poor intra-rater reliability (ICC =.49) for both the balance and aiming and
catching subtest) demonstrated in the study exploring this construct in
Norwegian children (Holm et al., 2013). There was good evidence for test-retest
reliability, with just one out of five studies, involving a sample of teenagers
(Chow et al., 2002), finding only moderate correlations (mean ICC for FMS skills
= .74). An adapted version of the MABC-2 was also tested (e.g. increasing the
colour contrast on the ball), with results showing that the modified version was a
reliable assessment tool for use with children with low vision (inter-rater
reliability – ICC = .97; test-retest reliability– ICC = .96; internal consistency-
Cronbach’s alpha ranged from 0.790 to 0.868) (Bakke et al., 2017).
Strong evidence for content validity was found for both the Brazilian (Valentini et
al., 2014) and the Chinese (Hua et al., 2013) versions of the assessment tool,
with concordance rates amongst experts ranging from 71.8%-99.2%.
Additionally, one study found that children with Asperger syndrome perform
worse on all three subtests of the MABC than typically developing children, as
hypothesised (Borremans et al., 2009).

42
Table 3 - The psychometric properties measured for each assessment tool found to measure FMS proficiency
Assessment
Tool
FMS Measured (subscales) Outcome(s) Number of
Validity
/Reliability
Studies
Types of Validity
and Reliability
Assessed
Athletics Skills
Track (AST) a
(Hoeboer et al.,
2016)
AST-1: Crawl, hop, jump, throw,
catch, kick, running backwards
AST-2: crawl, walk, jump, roll,
hopping
Time taken to
complete the course
2 Test-Retest
Reliability
Internal
consistency
Bruininks-
Oseretsky Test of
Motor Proficiency
(BOT) a
(Bruininks, 1978;
Bruininks &
Bruininks, 2005)
Balance: static balances (e.g.
standing on one leg) and dynamic
balance (e.g. walking along a line)
Running speed and agility: running,
hopping, jumping
Time taken to
complete tasks,
number of tasks
completed in a set
time limit
22 Inter-Rater
Reliability
Test-Retest
Reliability
Internal
Consistency
Structural Validity

43
Assessment
Tool
FMS Measured (subscales) Outcome(s) Number of
Validity
/Reliability
Studies
Types of Validity
and Reliability
Assessed
Upper limb coordination: catching,
dribbling, throwing
Concurrent Validity
Cross-Cultural
Validity
Hypothesis testing
validity
Canadian Agility
and Movement
Skill Assessment
(CAMSA) a,b
(Longmuir et al.,
2017)
Jump, slide, catch, skip, hop, kick
and run
Time taken to
complete the course
(converted to points
range) and a
performance
assessment for
each skill
3 Inter-Rater
Reliability
Intra-Rater
Reliability
Test-Retest
Reliability
Concurrent Validity
Children's Motor
Skills Protocol
(CMSP) b
Locomotor: run, broad jump, slide,
gallop, leap, hop
Number of
movement
characteristics
0 N/A

44
Assessment
Tool
FMS Measured (subscales) Outcome(s) Number of
Validity
/Reliability
Studies
Types of Validity
and Reliability
Assessed
(Williams et al.,
2009)
Object control: overarm throw,
underhand roll, kick, catch,
stationary strike, stationary dribble
observed for each
skill
Fundamental
Motor Skills Test
Package
(EUROFIT, FMS
Test Package) a
(Adam et al.,
1988; Kalaja et
al., 2012)
Balance, jump and run Time taken to
complete 20m
shuttle run, time can
stand on one leg,
and distance
jumped
0 N/A
Fundamental
Movement Skill
Polygon (FMS
Polygon) a
Space Covering: Crawling, rolling,
running, beam walking,
Time taken to
complete tasks
1 Intra-Rater
Reliability
Structural Validity

45
Assessment
Tool
FMS Measured (subscales) Outcome(s) Number of
Validity
/Reliability
Studies
Types of Validity
and Reliability
Assessed
(Žuvela et al.,
2011)
Surmounting Obstacles: skipping,
hopping, jumping
Object Control:
Dribble, throw, catch
Concurrent Validity
Furtado-
Gallagher
Computerized
Observational
Movement
Pattern
Assessment
System (FG-
COMPASS)b
(Furtado, 2009)
Locomotor:
Hopping, jumping, leaping, skipping,
sliding
Manipulative:
Hitting, catching, kicking, dribbling,
throwing
Patterns of
movement
characteristics for
each skill
1 Inter-Rater
Reliability

46
Assessment
Tool
FMS Measured (subscales) Outcome(s) Number of
Validity
/Reliability
Studies
Types of Validity
and Reliability
Assessed
Get Skilled Get
Active (GSGA)b
(NSW
Department of
Education and
Training, 2000)
Static balance, jump, run, catch,
hop, leap, gallop, kick, skip, hit,
throw, dodge
Ability to
consistently
complete patterns of
movements for each
skill in a variety of
environments/
contexts
1 Concurrent Validity
Instrument for the
Evaluation of
Fundamental
Movement
Patterns b
(Jiménez-Díaz et
al., 2013)
Locomotor: run, jump, gallop, slide,
hop
Object Control: bounce, catch, kick,
strike, throw
Number of points
(one per criterion
met per skill)
0 N/A

47
Assessment
Tool
FMS Measured (subscales) Outcome(s) Number of
Validity
/Reliability
Studies
Types of Validity
and Reliability
Assessed
Körperkoordinatio
nstest für Kinder
(KTK) a
(Kiphard &
Schilling, 2007;
Kiphard &
Shilling, 1974;
Schilling &
Kiphard, 2000)
Walking backwards along beams of
varying widths
Hopping for height
Jumping sideways over a slat
Moving sideways on boards
Number of steps
walked along the
beam, number of
successful hops/
jumps/ movements
10 Inter-Rater
Reliability
Structural Validity
Concurrent Validity
Internal
Consistency
Hypothesis testing
validity
Motoriktest für
vier- bis
sechsjärige
Kinder (MOT 4-6) a
Gross Motor: jumping, walking,
catching, throwing, hopping
Number of jumps
completed, time
taken to complete
tasks etc. Raw
scores are
converted into a 3
level ranking scale:
4 Structural Validity
Concurrent Validity
Hypothesis testing
validity

48
Assessment
Tool
FMS Measured (subscales) Outcome(s) Number of
Validity
/Reliability
Studies
Types of Validity
and Reliability
Assessed
(Zimmer &
Volkamer, 1987)
0 (not mastered) – 2
(mastered)
Movement
Assessment
Battery for
Children a
(Hendersen et
al., 2007;
Henderson et al.,
1992)
Aiming and catching
Throwing, catching
Balance: static balance (e.g. on one
leg), dynamic balance (e.g. walking
along the line, jumping, hopping )
Number of
successful attempts,
length of time
balances can be
held for
37 Inter-Rater
Reliability
Intra-Rater
Reliability
Test-Retest
Reliability
Internal
Consistency
Predictive Validity
Content Validity
Structural Validity

49
Assessment
Tool
FMS Measured (subscales) Outcome(s) Number of
Validity
/Reliability
Studies
Types of Validity
and Reliability
Assessed
Cross-Cultural
Validity
Concurrent Validity
Hypothesis testing
validity
Objectives-Based
Motor-Skill
Assessment
Instrument b
(Ulrich, 1983)
run, gallop, hop, skip, jump, leap,
slide, strike, bounce, catch, kick,
throw
The number of
qualitative motor
behaviours
exhibited across the
FMS measured
(/45)
0 N/A
Ohio State
University Scale
for intra-Gross
Motor
Locomotor: walking, running,
jumping, hopping, skipping, climbing
Levels of
development for
each skill 1 (least
mature) – 4 (mature
0 N/A

50
Assessment
Tool
FMS Measured (subscales) Outcome(s) Number of
Validity
/Reliability
Studies
Types of Validity
and Reliability
Assessed
Assessment
(OSU-SIGMA) b
(Loovis & Ersing,
1979)
Object control: throwing, catching,
striking, kicking
functional pattern)
based on qualitative
assessment of
movement patterns
Peabody
Developmental
Motor Scale
(PDMS)b
(Folio & Fewell,
1983, 2000)
Stationary
Locomotion: crawling, walking,
running, hopping, jumping
Object manipulation: throwing,
catching
Score of 0-2 as to
the level of skill
shown for each
FMS (not
demonstrated,
emerging, proficient
1 Concurrent Validity
PE Metrics a,b
(National
Association for
Sport and
Physical
Throwing, catching, dribbling,
kicking, striking
Score of 0-4 for
form (how well the
movement is
executed) and
success (the
1 Structural Validity

51
Assessment
Tool
FMS Measured (subscales) Outcome(s) Number of
Validity
/Reliability
Studies
Types of Validity
and Reliability
Assessed
Education, 2010,
2011)
Hopping, jumping, galloping, sliding,
running, skipping
outcome of the
movement)
PLAYbasic b
(Canadian Sport
for Life, 2013)
Locomotor: run, hop
Throw
Kick
Balance (dynamic- heel to toe
backwards)
Levels of
development for
each FMS –
developing (initial or
emerging) or
acquired (competent
or proficient)
1 Inter-Rater
Reliability
Internal
Consistency
Concurrent Validity
PLAYfunb
(Stearns et al.,
2019)
Running: run a square, run there
and back, run, jump and land on two
feet
Levels of
development for
each FMS –
2 Inter-rater
reliability
Structural validity

52
Assessment
Tool
FMS Measured (subscales) Outcome(s) Number of
Validity
/Reliability
Studies
Types of Validity
and Reliability
Assessed
Locomotion: skip, gallop, hop, jump
Upper body object control: overhand
throw, strike, one handed catch,
stationary dribble
Lower body object control: kick a
ball, foot dribble
Balance: walk heel-to-toe forwards,
walk heel-to-toe backwards,
developing (initial or
emerging) or
acquired (competent
or proficient)
Internal
Consistency
Concurrent Validity
Hypothesis Testing
Validity
Preschooler
gross motor
Locomotion: Run, jump, hop, slide,
gallop, leap
Number of
qualitative qualities
0 N/A

53
Assessment
Tool
FMS Measured (subscales) Outcome(s) Number of
Validity
/Reliability
Studies
Types of Validity
and Reliability
Assessed
quality scale
(PGMQ)b
(Sun et al., 2010)
Object manipulation: throw, catch,
kick, bounce, strike
Static balance: one leg balance,
tandem one leg balance, walking
along the line forwards, walking
along the line backwards
for each FMS each
child demonstrates
Smart Start b
(Wessel & Zittel,
1995)
Locomotor: run, gallop, hop, leap,
jump, slide
Object control: strike, bounce, catch,
kick, throw
Whether elements
of each skill were
completed (1= yes,
0 =no)
0 N/A
Teen Risk
Screen b
Posture & Stability (Axial
Movement): sitting, standing,
Extent to which
each skill can be
performed
1 Internal
Consistency
Structural Validity

54
Assessment
Tool
FMS Measured (subscales) Outcome(s) Number of
Validity
/Reliability
Studies
Types of Validity
and Reliability
Assessed
(Africa & Kidd,
2013)
bending, stretching, twisting,
turning, swinging
Posture & Stability (Dynamic
Movement): body rolling, starting
and stopping, dodging and balance
Locomotor Skills (Single Skills):
walking, running, leaping, jumping
and hopping
Locomotor Skills (Combinations):
galloping, sliding and skipping
Manipulative Skills (Sending Away):
carrying, dribbling
according to
guidelines
(0= cannot perform
the skill according to
guidelines, 1= can
perform the skill but
not according to the
guidelines, 2= can
perform the skill)
Test-Retest
Reliability

55
Assessment
Tool
FMS Measured (subscales) Outcome(s) Number of
Validity
/Reliability
Studies
Types of Validity
and Reliability
Assessed
Manipulative Skills (Maintaining
Possession): catching
Test of Gross
Motor
Development
(TGMD)b
(Ulrich, 1985,
2000, 2016)
Locomotor: run, gallop, jump, hop,
skip, leap, slide
Object Control: strike, dribble, catch,
kick, throw
The number of
qualitative motor
behaviours
exhibited for each of
the FMS measured
34 Inter-Rater
Reliability
Intra-Rater
Reliability
Test-Retest
Reliability
Internal
Consistency
Content Validity
Structural Validity

56
Assessment
Tool
FMS Measured (subscales) Outcome(s) Number of
Validity
/Reliability
Studies
Types of Validity
and Reliability
Assessed
Cross-Cultural
Validity
Concurrent Validity
Hypothesis Testing
Validity
Victorian
Fundamental
Movement Skills
Assessment
Instrument b
(Department of
Education
Victoria, 2009)
Catch, kick, run, jump, throw,
bounce, leap, dodge, strike
The number of
components of each
FMS a child has
mastered
1 Concurrent Validity

57
Assessment
Tool
FMS Measured (subscales) Outcome(s) Number of
Validity
/Reliability
Studies
Types of Validity
and Reliability
Assessed
Stay in Step
Screening Test a
(Department of
Education
Western
Australia, 2013)
Static balance (one leg), bounce,
catch, hop, run
Duration balance is
held for, number of
completed
throws/catches in a
specified timeframe,
distance hopped,
time taken to
complete task (e.g.
50m run)
0 N/A
NB: a= product-oriented, b= process-oriented

58
Table 4- Reliability and Validity of the MABC
Reliability Validity
Study IeR IaR TR IC Pr
(Chow et al., 2002) MABC
(Croce et al., 2001)
(Ellinoudis et al., 2008)
(Smits-Engelsman et
al., 2008)
(Bakke et al., 2017) MABC-
2
(Borremans et al.,
2009)
(Darsaklis et al., 2013)
(Holm et al., 2013)
(Hua et al., 2013)
(Jaikaew &
Satiansukpong, 2019)
(Kita et al., 2016)
(Valentini et al., 2014)
(Wuang et al., 2012)
NB: IeR = interrater IaR = intra rater, TR = test-retest, IC = internal consistency,
St=Structural, Ct = content, Pr = predictive. ◼= poor (ICC <.5, r <.3, κ<.6, α
<.6), ◼= moderate (ICC = .5 -.75, r = .3 - .6, κ = .6 - .79, α = .6 - .7), ◼= good,
(ICC = .75 -.9, r = .6 - .8, κ = .8 - .9 , α = .7 - .9) ◼= excellent validity/reliability
(ICC >.9, r > 8, κ >.9 , α > .9) .
Cross-cultural validity was studied in four papers, looking at Swedish, Spanish,
Italian, Dutch and Japanese samples in comparison to US or UK norms
(Niemeijer et al., 2015; Rösblad & Gard, 1998; Ruiz et al., 2003; Zoia et al.,
2019). Results showed that UK norms were not suitable for use when
evaluating the performance of Italian children, as significant differences were
found for eleven of the twenty seven items on the MABC-2 (Zoia et al., 2019).
Small differences were also reported between the performance of UK children
and Dutch children, however these were not statistically significant (Niemeijer et

59
al., 2015). The US standardised sample was found to be valid for use with a
Swedish (Rösblad & Gard, 1998) but not Spanish sample, in the latter case US
norms estimated a large proportion of the sample below the 15th percentile
(Ruiz et al., 2003).
Structural validity was assessed by ten studies, with six finding evidence for a
three factor (manual dexterity, aiming & catching and balance) model (dos
Santos et al., 2017; Hua et al., 2013; Kita et al., 2016; Psotta & Abdollahipour,
2017; Wagner et al., 2011; Zoia et al., 2019). One study found a four factor
solution, with a general factor for age band 1, four factors with balance split into
static and dynamic for age band 2, and a 3 factor correlated model for age band
3 (Schulz et al., 2011). Similarly, another study found evidence for a bi-factor
model with one general factor, and three sub-factors for age band one (Okuda
et al., 2019). Evidence was also found for a five factor solution, with balance
and manual dexterity each split into two factors (Ellinoudis et al., 2008). An
adolescent study found a two factor model (manual dexterity and aiming and
catching) was more appropriate as ceiling effects were evident on balance tasks
(Valtr & Psotta, 2019).
The results of the COSMIN quality assessment of MABC studies show that two
studies which found excellent rated results (see Table 4), had the lowest quality
ratings, in which they met 13% and 29% of generalisability and inter-rater
reliability criteria respectively (Darsaklis et al., 2013; Jaikaew & Satiansukpong,
2019). Additionally, the singular study which found MABC normative data to be
valid in another country only had a quality rating of 39% (Rösblad & Gard,
1998). The MABC study with the best quality rating (81% of criteria met), only
found moderate results for internal consistency (Kita et al., 2016), and the single
study which found that MABC norms data were cross-culturally valid, only had a
quality rating of 39%. When considering COSMIN quality ratings alongside the
results of these studies, it would suggest that caution should be taken when
interpreting their results regarding the psychometric properties of the MABC.
2.3.6.2 Bruininks-Oseretsky Test of Motor Proficiency (BOT)
Twelve studies stated that they explored the validity and reliability of the BOT,
BOT-2 or BOT-2 Short Form (SF), of which six reported results that could be
quantified into poor, moderate, good and excellent evidence of the various
psychometric properties detailed in Table 5. Three studies looked at the inter-
rater reliability of the BOT, all of which found at least good evidence in support
of this aspect of reliability (Darsaklis et al., 2013; Lucas et al., 2013; Wilson et
al., 2000). However, one of these studies provided no information about the
sample, including size and demographic information (Darsaklis et al., 2013).

60
The results for test-retest reliability were more mixed than for the MABC, with
two studies finding low correlations on scores between tests sampling from
children with Cerebral Palsy (ICC= .4) (Liao et al., 2001) and children living in
aboriginal communities in Australia (mean ICC for FMS= .097) (Lucas et al.,
2013). One study did show evidence of the BOT being a reliable measure of
FMS in children with intellectual deficits (Wuang & Su, 2009). One study
explored the cross-cultural validity of the BOT-2 norm scores with a large
Brazilian sample (n=931) and found mixed results (Ferreira et al., 2020).
Results showed that Brazilian children outperformed the BOT normative data on
bilateral coordination, balance, upper-limb coordination, and running speed and
agility subtests, but similar percentile curves were found for both populations on
upper limb coordination and balance subtests (Ferreira et al., 2020).
Five studies explored the structural validity of the BOT. The BOT-2 SF was also
found to have good structural validity once mis-fitting items were removed for
children aged 6-8 years, but ceiling effects were found for older children, aged
9-11 years (Bardid, Utesch, et al., 2019). Two studies exploring structural
validity utilised Rasch analysis and found good evidence for it. These results
were indicative of unidimensionality, with the overarching factor accounting for
99.8% (Wuang et al., 2009) and 82.9% (Brown, 2019b) of the variance in test
scores for children with intellectual deficits (BOT), and typically developing
children (BOT-BF), respectively. Similarly to the results of the Rasch studies,
one additional study found that the four subscales were correlated, with a bi-
factor model that had an overarching motor skill factor, and four correlated sub-
factors providing the best fit (Okuda et al., 2019). When the subscales and
composite scales were evaluated separately using Rasch analysis, one study
found multiple issues with the fine motor integration, bilateral coordination,
balance and body coordination scales/scores, limiting the justification of their
usage as multi-dimensional scales/score. Issues included: Item response
working differently for males and females, disordered item difficulty ratings,
and/or problems with the ability of the subscale/ composite score to differentiate
between abilities (Brown, 2019a).
The quality of the studies evaluating the validity and reliability of the BOT may
have influenced the results though, as the study with the greatest quality rating
(83%) found only “good” results for inter-rater reliability (Lucas et al., 2013),
whilst two studies with lower ratings (13% (Darsaklis et al., 2013) and 53%
(Wilson et al., 2000) reported “excellent” results for this psychometric property,
suggesting that reliability scores may have been inflated by poorer quality
studies. Additionally, the reviewed BOT studies only evaluated seven of the ten
COSMIN categories (see Table 1).

61
Table 5 - Validity and reliability of the BOT
Reliability Validity
Study IeR IaR TR IC Pr
(Iatridou & Dionyssiotis,
2013)
BOT
(Liao et al., 2001)
(Wilson et al., 2000)
(Darsaklis et al., 2013) BOT-2
(Wuang & Su, 2009)
(Lucas et al., 2013) BOT-2
SF
NB: IeR = interrater IaR = intra rater, TR = test-retest, IC = internal consistency,
St=Structural, Ct = content, Pr = predictive. ◼= poor (ICC <.5, r <.3, κ<.6, α
<.6), ◼= moderate (ICC = .5 -.75, r = .3 - .6, κ = .6 - .79, α = .6 - .7), ◼= good,
(ICC = .75 -.9, r = .6 - .8, κ = .8 - .9 , α = .7 - .9) ◼= excellent validity/reliability
(ICC >.9, r > 8, κ >.9 , α > .9) .
2.3.6.3 Other Product-Oriented Assessment Tools
Three studies evaluated the validity and reliability of the Körperkoordinationstest
für Kinder (KTK) (Laukkanen et al., 2020; Moreira et al., 2019; Rudd et al.,
2016). Two studies looked at the structural validity of the KTK, and found
adequate evidence to support a one factor structure, interpreted as representing
“body coordination” (Moreira et al., 2019; Rudd et al., 2016). The internal
consistency of the KTK was consistently found to be good across samples in
Finland, Portugal and Belgium (α ranged from .78 - .83), however, as
hypothesised, there were significant differences between groups, in which
children from Portugal and Belgium performed worse than Finnish participants
(Laukkanen et al., 2020). Additionally, there was evidence of high inter-rater
reliability (94% agreement) (Rudd et al., 2016).
Two studies evaluated the validity and reliability of the Athletic Skills Track
(AST) (Hoeboer et al., 2016; Hoeboer et al., 2018). The results of both studies
suggest that the AST has good test-retest reliability with intraclass correlations
ranging from .8 (Hoeboer et al., 2018) to .88 (Hoeboer et al., 2016). Cronbach’s
alpha was used in one of these studies to examine internal consistency, with

62
results ranging from .7-.76 for the three versions of the AST (Hoeboer et al.,
2018). It is, however, important to note that only two psychometric properties
from the COSMIN checklist (Mokkink et al., 2010b) were evaluated, and the
quality ratings for these studies were lower than 60%.
The psychometric properties of the FMS Polygon were tested in one study
(Žuvela et al., 2011), finding strong evidence for intra-rater reliability (ICC = .98).
Factor analysis also explored the structure of the assessment tool, revealing
four factors: object control (tossing and catching a volleyball), surmounting
obstacles (running across obstacles), resistance overcoming obstacles
(carrying a medicine ball) and space covering skills (straight running). These
psychometric properties of the FMS Polygon, should however, be interpreted
with caution, as the above study only had a quality rating of 43% (Žuvela et al.,
2011).
The structural validity of the MOT 4-6 was evaluated by one study that had a
high quality rating (79%), using Rasch analysis. It established four of the items
had disordered thresholds and needed to be removed from the assessment
(grasping a tissue with a toe, catching a tennis ring, rolling sideways over the
floor and twist jump in/out of a hoop). Results also showed that with one
additional item removed (jumping on one leg into a hoop), there was an
acceptable global model fit for the MOT 4-6 (Utesch et al., 2016).
2.3.7 Process-Oriented Assessment Tools
Fourteen process-oriented assessment tools were identified by the pre-search
as measuring FMS. Of these, eight had been evaluated for validity and reliability
(described below). No research was found evaluating the psychometric
properties of the: Children's Motor Skills Protocol (CMSP) (Williams et al.,
2009), Instrument for the Evaluation of Fundamental Movement Patterns
(Jiménez-Díaz et al., 2013), Objectives-Based Motor-Skill Assessment
Instrument (Ulrich, 1983), Ohio State University Scale for intra-Gross Motor
Assessment (OSU-SIGMA) (Loovis & Ersing, 1979), Preschooler Gross Motor
Quality Scale (PGMQ) (Sun et al., 2010) and Smart Start (Wessel & Zittel,
1995).
2.3.7.1 Test of Gross Motor Development (TGMD)
The results of twenty-one studies which evaluated the psychometric properties
of various versions of TGMD can be found in Table 6. Nine out of ten COSMIN
psychometric properties were evaluated by TGMD studies. Consistently good
evidence for inter-rater and intra-rater reliability was observed, with only one
study finding less than ‘good’ correlations when testing sessions were video

63
recorded (Rintala et al., 2017). One study evaluated these aspects of reliability
using a Content Validity Index (CVI) and found good evidence for both inter and
intra-rater reliability when testing Chilean children, with CVIs ranging from .86 to
.91 (Cano-Cappellacci et al., 2016). An additional study evaluated the inter and
intra-rater reliability of the TGMD (second and third editions) using percentage
agreement (Field et al., 2020). Results showed agreement for inter-rater
reliability was 88% and 87% for the TGMD-2 and TGMD-3 respectively, and for
intra-rater reliability the percentage agreement was 98% for the TGMD-2 and
95% for the TGMD-3 (Field et al., 2020). Fewer studies examined the test-retest
reliability of the TGMD, but those that did demonstrated that for the TGMD-2
(Houwen et al., 2010; Issartel et al., 2017; Kim et al., 2014; Simons et al., 2008;
Valentini, 2012), a short version of the TGMD-2 modified for Brazilian children
(Valentini et al., 2018) and the TGMD-3 (Allen et al., 2017; Valentini et al., 2017;
Wagner et al., 2017; Webster & Ulrich, 2017) participants scored similarly when
they were tested on multiple occasions. Strong test-retest reliability was
evidenced with a CVI of .88 (Cano-Cappellacci et al., 2016) and Bland-Altman
plots found 95% confidence intervals were within one standard deviation (Rudd
et al., 2016), with a .96 agreement ratio (Lopes et al., 2018). Evidence for
internal consistency was more mixed, but there was strong evidence that all
items in the TGMD-3, once modified for children with ASD and visual
impairments could still measure FMS as an overarching construct (Allen et al.,
2017; A Brian et al., 2018). Evidence for good internal consistency of the TGMD
was also found when testing children with intellectual deficits (Capio et al.,
2016).
Table 6 – Validity and reliability of the TGMD
Reliability Validity
Study IeR IaR TR IC Pr
(Allen et al., 2017) TGMD-2
(Barnett et al.,
2014)
(Capio et al., 2016)
(Garn & Webster,
2018)
(Houwen et al.,
2010)

64
NB: IeR = interrater IaR = intra rater, TR = test-retest, IC = internal consistency,
Study IeR IaR TR IC Pr
(Issartel et al.,
2017)
(Kim et al., 2014)
(Lopes et al.,
2018)
(Simons et al.,
2008)
(Valentini, 2012)
(Ward et al., 2020)
(Valentini et al.,
2018)
TGMD-2
SF
(Allen et al., 2017) TGMD-3
(A Brian et al.,
2018)
(Estevan et al.,
2017)
(Maeng et al.,
2017)
(Magistro et al.,
2020)
(Rintala et al.,
2017)
(Valentini et al.,
2017)
(Wagner et al.,
2017)
(Webster & Ulrich,
2017)

65
St=Structural, Ct = content, Pr = predictive. ◼= poor (ICC <.5, r <.3, κ<.6, α
<.6), ◼= moderate (ICC = .5 -.75, r = .3 - .6, κ = .6 - .79, α = .6 - .7), ◼= good,
(ICC = .75 -.9, r = .6 - .8, κ = .8 - .9 , α = .7 - .9) ◼= excellent validity/reliability
(ICC >.9, r > 8, κ >.9 , α > .9) .
Sixteen studies evaluated the structure of the items within various editions of
the TGMD, consistently finding a two factor model (locomotion and object
control) for the TGMD (Evaggelinou et al., 2002), TGMD-2 (Capio et al., 2016;
Garn & Webster, 2018; Houwen et al., 2010; Issartel et al., 2017; Kim et al.,
2014; Lopes et al., 2018; Rudd et al., 2016; Simons et al., 2008; Valentini,
2012) TGMD-2 SF (Valentini et al., 2018) and TGMD-3 (Estevan et al., 2017;
Magistro et al., 2020; Valentini et al., 2017; Wagner et al., 2017; Webster &
Ulrich, 2017), as predicted by multiple studies (Capio et al., 2016; Estevan et
al., 2017; Evaggelinou et al., 2002; Lopes et al., 2018). It is, however, important
to note that some of these models enabled cross-loading of items (e.g. Garn &
Webster, 2018), some models were hierarchical in nature (Rudd et al., 2016)
and in one case a two factor model, whilst being the best fit, explained only 50%
of the total variance (Issartel et al., 2017). Evidence was however found to
suggest that the structural validity of the TGMD is stable across countries, with
the data from populations in Greece, Brazil, Germany, the USA, South Korea
and Portugal all evidencing a two factor model (A Brian et al., 2018;
Evaggelinou et al., 2002; Kim et al., 2014; Lopes et al., 2018; Valentini, 2012;
Wagner et al., 2017).
The content validity of the Brazilian translation of the TGMD-2 and TGMD-3 was
evaluated by two studies, with stronger evidence for the validity of the TGMD-2
(CVI = .93 for clarity and .91 for pertinence) than the TGMD-3, for which the CVI
for the clarity of the instructions only reached .78 (Valentini, 2012; Valentini et
al., 2017). The Spanish translation of the TGMD-2 was also tested for clarity
and pertinence, with results finding a CVI of .83 (Cano-Cappellacci et al., 2016).
Cross cultural validity was investigated in one study that compared Flemish
children with intellectual deficits to US normative data (Simons et al., 2008). It
found significant differences, with large effect sizes (1.22-1.57), indicating US
standardised data was inappropriate for use as a comparison within this
population. Additionally, a large study based in Belgium hypothesised that
Belgian children would perform similarly to US norms on locomotor scores, but
that Belgian children would score lower on object control tasks. However,
Belgian children had significantly worse Gross Motor Quotient (GMQ),
locomotor and object control scores, thus showing that US normative data was
not appropriate for this sample (Bardid et al., 2016). The COSMIN quality rating
of TGMD studies did not appear to effect results, as the relative quality ratings

66
of all studies that found excellent results only varied by 16% (54-70%) (Allen et
al., 2017; Barnett et al., 2014; Capio et al., 2016; Houwen et al., 2010; Kim et
al., 2012; Simons et al., 2008; Valentini, 2012; Valentini et al., 2018; Valentini et
al., 2017; Wagner et al., 2017). However, predictive validity was not explored by
any of the included TGMD studies.
2.3.7.2 Other Process-Oriented Assessment Tools
The psychometric properties of the FG-Compass (Furtado, 2009) were
evaluated in one study, in which expert scores were compared to
undergraduate student scores (Furtado Jr & Gallagher, 2012). Results showed
kappa values ranging from .51-.89, with moderate levels of agreement on
average (m=.71). PLAYbasic was found to have good inter-rater reliability
(mean ICC= .86), and moderate internal consistency (mean α =.605) in one
study (Canadian Sport for Life, 2013). Two studies evaluated PLAYfun, finding
good to excellent inter-rater reliability (ICC ranged from .78 - .98) and good
internal consistency (average α =.78) (Cairney et al., 2018; Stearns et al.,
2019). Additionally, hypotheses testing validity and structural validity were
assessed, with performance increasing with age as hypothesised, and an
acceptable model fit for the proposed five factor structure (Cairney et al., 2018).
Despite the quality ratings of these studies varying, (43% and 76%), the higher
quality study found the more promising results (Cairney et al., 2018). One study
evaluated the psychometric properties of the Teen Risk Screen (Africa & Kidd,
2013), with results demonstrating good evidence for the internal consistency
(mean α = .75) and test-retest reliability (mean r = .64) of subscales.
Confirmatory factor analysis (CFA) was used to evaluate the structural validity
of the Teen Risk Screen, however, the analysis was not completed on the
model they proposed (6 subscales). Authors claimed that due to small sample
sizes, only three of the six subscales were evaluated separately, and the final
three were grouped together. As this analysis did not measure the intended
model, results are not detailed in this review, as it was not truly confirmatory.
Get Skilled Get Active (GSGA), the Peabody Developmental Motor Scales
(PDMS-2) and the Victorian FMS assessment were all used in concurrent
validity studies, however, no articles were found evaluating any other aspects of
validity and reliability of these measures.
2.3.8 Combined Assessments
Two assessment tools from the pre-search measure both product- and process-
orientated aspects of movement: Canadian Agility and Movement Skill
Assessment (CAMSA) (Longmuir et al., 2017) and PE Metrics (National
Association for Sport and Physical Education, 2010, 2011). There is limited

67
evidence for the reliability of the CAMSA with one study finding moderate effect
sizes for inter-rater, intra-rater and test-retest reliability, as well as internal
consistency (Longmuir et al., 2017). One other study found strong evidence for
the test-retest reliability of the CAMSA (Lander et al., 2017), however that study
had a lower quality rating (49% compared to 77%). One study evaluated the
structural validity of PE Metrics using Rasch analysis and found good evidence
that all of the items were measuring the same overarching set of motor skills
(Zhu et al., 2011). It is, however, necessary to interpret this result with caution,
as the COSMIN quality rating for this study was only 43%.
2.3.9 Concurrent Validity
Limited evidence was found for concurrent validity across the 23 assessment
tools included in the review (see Table 7). A large proportion of the studies
exploring this aspect of validity did so against either the MABC (15 studies) or
the TGMD (10 studies).
2.3.9.1 Between product-oriented
The findings of studies exploring the concurrent validity of product-oriented
assessment tools (top left quadrant of Table 7) mostly yielded good results, with
eight out of thirteen studies finding good or better evidence for correlations
between measures. Of those that didn’t, one found a poor correlation (kappa =
.43) between the MABC and the BOT (Crawford et al., 2001), and one study
found moderate correlations between the MABC and the short form of the BOT
(Spironello et al., 2010), as well the AST and the KTK, as hypothesised
(Hoeboer et al., 2018). Two studies evaluated the concurrent validity of the
BOT-2 complete form, and the BOT-2 short form (Jírovec et al., 2019; Mancini
et al., 2020). One found poor correlations between subtests (r ranged from .08 -
.45) (Jírovec et al., 2019), and the other reported moderate correlations
between tasks in a sample of children with ADHD (r ranged from .12 - .98)
(Mancini et al., 2020). A modified version of the KTK (with hopping for height
removed) was also compared to the standard KTK, which was found to have
high levels of validity (Novak et al., 2017). One study used Pearson correlations
to evaluate the concurrent validity between the MOT 4-6 and the KTK, with
results showing moderate correlations for children aged 5-6 (mean r= .63), as
was hypothesised prior to testing (r >.6).

68
Table 7 – Concurrent validity of assessment tools
Product-Oriented Process-Oriented
AST BOT KTK MOT
4-6
MABC FMS
Polygon
GSGA PDMS TGMD
Pro
du
ct-
Ori
en
ted
AST
BOT 1 1
KTK 1 1 1 1
MOT 4-6 1
MABC 1 1 3 1
FMS Polygon
Pro
ce
ss
-
Ori
en
ted
GSGA
PDMS 1
TGMD 1 2 2 1 1 1 2
NB: IeR = interrater IaR = intra rater, TR = test-retest, IC = internal consistency, St=Structural, Ct = content, Pr = predictive. ◼= poor (ICC
<.5, r <.3, κ<.6, α <.6), ◼= moderate (ICC = .5 -.75, r = .3 - .6, κ = .6 - .79, α = .6 - .7), ◼= good, (ICC = .75 -.9, r = .6 - .8, κ = .8 - .9 , α =
.7 - .9) ◼= excellent validity/reliability (ICC >.9, r > 8, κ >.9 , α > .9) .

69
In addition to the results detailed in Table 7 one study looked at the concurrent
validity of assessing children using the MABC in person and via tele-
rehabilitation software, with results showing no significant difference between
scores, as hypothesised (Nicola et al., 2018). As well as this, the MABC and the
BOT-SF had a positive predictive value of .88, with twenty one out of twenty
four children testing positively for motor coordination problems also scoring
below the fifteenth percentile on the MABC (Cairney et al., 2009).
2.3.9.2 Between process-oriented
These findings are summarised in the bottom right quadrant of Table 7. One
study utilised the TGMD to explore the concurrent validity of the GSGA
assessment tool (Logan et al., 2017). Significant differences were found
between the number of children who were classified as mastering FMS versus
those who had not, in which GSGA was more sensitive and classified a greater
number of children as exhibiting non-mastery (Logan et al., 2017) Three studies
also explored the relationship between multiple versions of the TGMD. Results
revealed that children with ASD perform better on the TGMD-3 with visual aids
compared to the standard assessments (Allen et al., 2017). Similarly, modified
versions of the TGMD-2 and TGMD-3 were both found to be valid for use in
children with visual deficits (A Brian et al., 2018). Additionally, one study
showed significant differences between subtest scores on the second and third
editions of the TGMD across year groups and gender, in which participants
performed better on the TGMD-2 (Field et al., 2020).
2.3.9.3 Between product and process-oriented
The results comparing process and product-oriented assessment tools against
each other (bottom left quadrant of Table 7) were also mixed, particularly with
regards to the concurrent validity between the MABC and the TGMD, for which
correlations ranged from .27-.65 (Houwen et al., 2010; Logan, Robinson,
Rudisill, et al., 2014; Valentini, 2012; Valentini et al., 2014; Valentini et al.,
2015). Study quality did not appear to have an effect on the size of the
correlation between the MABC and the TGMD. Two studies also reported
significant differences in level of agreement on percentile ranks (Logan,
Robinson, Rudisill, et al., 2014; Valentini et al., 2015). The KTK and the TGMD-
2 also differed significantly in terms of their classifications of children into
percentile ranks (Ré et al., 2018). In addition to the studies shown in Table 7,
the concurrent validity of the CAMSA and both the PLAYbasic and PLAYfun
assessment tools were assessed by one study, which found moderate
correlations between CAMSA and both PLAY assessment tools, smaller than
was hypothesised (Stearns et al., 2019). Lastly, good cross-product/process

70
concurrent validity was reported between the MABC and the PDMS (Hua et al.,
2013), as well as the CAMSA and the Victorian FMS Assessment Tool (Lander
et al., 2017) and the TGMD and the FMS Polygon, as hypothesised (Žuvela et
al., 2011).
2.4 Discussion
The first aim of this chapter was to document the observational assessment
tools that have been used previously within the literature to assess FMS in
school-aged children. The pre-search identified twenty four assessment tools, of
which nine were product-oriented, thirteen were process-oriented and two
measured both product and process outcomes. The relatively small number of
assessment tools available to measure all three FMS domains (i.e. locomotor,
object control and stability skills) in combination (n=9) was surprising,
particularly given the increased emphasis on the importance of stability skills in
recent years (Rudd et al., 2015). Given that all three sub-components of FMS
feature within the UK - P.E. curriculum (Department For Education, 2013) it will
be important for any school-based screening tool to measure locomotion, object
control and stability. The scarcity of comprehensive assessment tools means
mean schools have limited options. However, it is possible that certain existing,
and otherwise well validated and reliable assessment tools may be able to be
modified to include stability skills (e.g. the TGMD).
The second aim of this chapter was to evaluate the evidence regarding the
psychometric properties of the assessment tools identified in the pre-search.
Surprisingly, there were no studies evaluating either the validity or reliability of
eight (33%) of the identified measures. These were the: Children’s Motor Skill
Protocol (Williams et al., 2009), FMS Test Package (Adam et al., 1988; Kalaja
et al., 2012), Instrument for the Evaluation of Fundamental Movement Patterns
(Jiménez-Díaz et al., 2013), Objectives-Based Motor-Skill Assessment
Instrument (Ulrich, 1983), Ohio State University Scale for intra-Gross Motor
Assessment (Loovis & Ersing, 1979), Preschooler Gross Motor Quality Scale
(Sun et al., 2010), Smart Start (Wessel & Zittel, 1995) and the Stay in Step
Screening Test (Department of Education Western Australia, 2013). Without
any evaluation of these assessments’ psychometric properties, their use in
schools cannot be justified, as it is impossible to ascertain whether they are
able to accurately identify children who need additional support. Without proper
psychometric evaluation, these assessments run the risk of being redundant
and burdensome as schools may expend their already have stretched for
resources on assessments that are not fit for purpose (Perera, 2020). What is
particularly alarming is that the Stay in Step Screening Test, one of the

71
assessments with no psychometric properties assessed, is already being used
within schools in Australia.
Of the remaining sixteen assessment tools which did have research evaluating
their validity and reliability, nine (38%) assessment tools only had a single study
examining their psychometric properties. For five of these nine assessment
tools, the single study only measured one aspect of validity or reliability for
school-aged children. This was true for the: FG Compass (Furtado Jr &
Gallagher, 2012), GSGA (NSW Department of Education and Training, 2000),
PDMS (Folio & Fewell, 1983, 2000), PE Metrics (National Association for Sport
and Physical Education, 2010, 2011) and the Victorian FMS Assessment
Instrument (Department of Education Victoria, 2009). This level of evidence is
insufficient to justify their use in schools, as research has shown that validity
and reliability are separate constructs, and that the presence of one does not
equate to the other being established (Drost, 2011). Nor is one aspect of validity
or reliability equivocal to another.
Similarly, the four other assessment tools with only one study evaluating
psychometric properties only evaluated two (Hoeboer et al., 2016) or three
(Africa & Kidd, 2013; National Association for Sport and Physical Education,
2010, 2011; Žuvela et al., 2011) aspects of validity and reliability, and all of
these studies had poor methodology quality ratings, of between 36%-55%.
Inadequate reporting of methods reduces the utility of these findings as it
becomes difficult to discern whether these results were brought about by
extraneous variables which may have introduced bias into these studies.
Additionally, it is important to note that any aspects of validity and reliability
reported on in these studies will only have been established on one sample. It is
therefore unclear how generalizable these results would be to the wider
population (i.e. all school children), particularly due to small sample sizes, and
the very narrow age ranges tested.
Multiple studies evaluating various aspects of validity and reliability were only
found for the: MABC (n=37 studies), TGMD (n=35 studies), BOT (n=22 studies),
KTK (n=10 studies), CAMSA (n=3 studies), the MOT 4-6 (n=4 studies),
PLAYfun (n=2 studies) and the Athletics Skills Track (n=2 studies). The MABC
was the most extensively examined assessment tool, however, the evidence for
its psychometric properties was very mixed. What is perhaps more concerning,
is that the studies that found strong evidence of validity and reliability (Bakke et
al., 2017; Darsaklis et al., 2013; Jaikaew & Satiansukpong, 2019; Smits-
Engelsman et al., 2008) had disappointingly low quality ratings which ranged
between 13%-50%. Additionally, the MABC comprises three subscales, Manual
Dexterity (MD), Aiming & Catching (A&C) and Balance, and the tasks within MD

72
are not FMS, rather they are fine motor skills. With this in mind, it makes it
difficult to evaluate studies that only use MABC’s total score, which includes MD
subscale scores in this composite score. In the context of universal screening of
FMS ability, whereby fine motor skills would not be assessed, interpretation of
ability based on the MABC total score does not correspond solely to assessing
FMS tasks (Cairney et al., 2018; Crawford et al., 2001; Croce et al., 2001;
Darsaklis et al., 2013; Ruiz et al., 2003; Smits-Engelsman et al., 2008; Tan et
al., 2001). Additionally, all studies evaluating structural validity included the MD
items, so it is impossible to ascertain whether the MABC would be valid to use
with just the A&C and Balance subscales (i.e. as a purely FMS assessment).
When evaluating the results of A&C and Balance subscales separately, studies
show similar patterns of inconsistent results, but often with lower statistical
significance, which indicates that the MD subscale may play a key role within
establishing the MABC was a more wide ranging assessment tool that is valid
and reliable for use when identifying children with motor difficulties in general,
not FMS difficulties specifically. Similarly, despite showing promising signs of
strong psychometric properties, the BOT (Bruininks, 1978; Bruininks &
Bruininks, 2005) also includes a fine motor subscale, and is yet to be validated
without the presence of this aspect. This may limit the utility of both the MABC
and the BOT in universal screening programmes of FMS.
Similar issues are present with the TGMD, despite it being the assessment tool
with the strongest evidence for its psychometric properties. Notably, the TGMD
also does not measure stability skills. Research has established that balance is
a core aspect of FMS (Rudd et al., 2015), so it is important to recognise the
limitations of using tools which do not measure such skills. It seems reasonable
to suggest that exploration of the FMS proficiency of children in schools should
involve an assessment tool which encompasses locomotor skill, object control
and balance. This would enable insights into the skills which underpin a child’s
ability to participate in a wide range of physical activities (Barnett, Stodden, et
al., 2016), particularly as all three groups of skills are incorporated within the
P.E. curriculum (Department For Education, 2013). Stability measures could be
added to the TGMD, but this would also require all psychometric properties to
be re-evaluated with the new items included, to enable justification of using the
TGMD in school-based screening programmes.
The lack of stability skills was also evident in the AST (Hoeboer et al., 2016),
CAMSA (Longmuir et al., 2017) and MOT 4-6 (Zimmer & Volkamer, 1987).
Additionally the KTK (Kiphard & Schilling, 2007; Kiphard & Shilling, 1974) does
not include assessment of object control skills. Thus, despite promising results
for these assessment tools, albeit with the need for more extensive exploration

73
of validity and reliability, it is difficult to recommend them for use in a school-
setting in their current formats.
In particular, PLAYfun measured all three aspects of FMS, and found promising
results for internal consistency, inter-rater reliability as well as structural validity.
It is, however, important to note that the structural validity was not tested
against the three well-established sub-components of FMS, rather a five factor
structure: (i) running, (ii) locomotor, (iii) object control upper body, (iv) object
control lower body, and (v) balance, stability & body control. There was a lack of
information within the manuscript to justify splitting out running from other
locomotor activities, and similarly why upper and lower body object control were
separated. These activities are normally combined in widely accepted
definitions of FMS acknowledged in the introduction to this thesis. In order to
justify PLAYfun’s use in schools, research would need to be done to establish
whether these activities are in fact measuring different constructs. Additionally,
further evidence would need to be provided to show that a more comprehensive
range of psychometric properties are established.
Finally, the majority of studies included in this review utilise researchers in
assessing and scoring children’s FMS. It is therefore difficult to ascertain
whether similar standards of reliability and validity would be retained when
novices (i.e. teachers) instead used these tools to assess FMS proficiency. This
is particularly important, as it would be infeasible for researchers to routinely
implement universal screening programmes in schools.
The tendency for authors to be selective about the aspects of validity and
reliability measured was one of the main limitations of the studies included
within this review. Of the COSMIN guidelines evaluated in this review, all
aspects were evaluated by a minimum of one study, but no single aspect of
validity or reliability was measured by more than half of the included studies.
The most commonly measured aspects of validity and reliability were inter-rater
reliability (45% of studies) and structural validity (42% of studies). There was a
paucity of research evaluating predictive validity (1% of studies) and cross-
cultural validity using normative data sets (7% of studies). These
inconsistencies in measuring different types of validity and reliability increase
further the difficulty associated with making any inferences about the suitability
of these tools for use in universal screening programmes within schools. Such
issues are further compounded by studies recruiting specially selected samples
(e.g. children with ASD or visual impairments) where there are fewer studies
undertaken, and the number of participants are often limited.

74
Although there were no systematic reviews evaluating the validity and reliability
of FMS assessment tools prior to this systematic review being undertaken,
whilst under consideration at a journal, a similar systematic review was
published (Hulteen et al., 2020). However, there are distinct differences
between the two reviews, which mean they both offer unique contributions to
the literature. This review solely explored observational assessment tools that
have been used to measure FMS specifically in school-aged children. The
search for the Hulteen et al. (2020) review was broader, and included pre-
school children, as well as tests of ‘motor fitness’ and ‘athletic skill’, rather than
pre-defined FMS assessments. Additionally, Hulteen et al. (2020) excluded
children with physical and/or cognitive impairment, whereas we chose to include
studies that included children with these conditions in their samples, as children
with such difficulties are often seen within the mainstream school environment.
Whilst the two reviews differed, the findings were largely similar. Both found the
TGMD and the MABC had the most comprehensive evidence base, and that the
TGMD had the strongest evidence to support validity and reliability. Additionally,
both reviews shared the opinion that further work was needed to establish the
psychometric properties of many existing assessment tools.
2.5 Conclusion
It is difficult to recommend any of the assessment tools identified in this review
for use in schools as a method for universally screening FMS ability, in their
current form. The measures with the most evidence to support their
psychometric properties, which may potentially require less adaptations and/or
further research to enable their use in such a capacity, were the TGMD, the
BOT and the MABC.
It is, however, important to consider the feasibility of using these assessment
tools in a school setting to measure the FMS of children en-masse. Indeed,
issues of feasibility distinct from those relating to reliability and validity. To date
there is limited understanding about teachers’ knowledge of FMS, how open
they would be to such a screening initiative, and what factors may impact their
engagement with school-based screening programmes. Further research is
required to consult and query teachers, before recommendations can be made
as to which assessment may be most suitable for this purpose. For example,
certain assessments that are judged to be more valid and reliable may be
viewed as less feasible than others from the perspective of the teacher tasked
with implementing. In turn, this may lead to poorer motivation on the teacher’s
part, and thus less fidelity in implementing such measures, which in turn might

75
lower their validity and reliability in practice. These additional issues of feasibility
will be the focus in the following chapter.

76
Chapter 3
Fundamental Movement Skills and their Assessment in Primary
Schools from the Perspective of Teachers
3.1 Background
Chapter 2 established that the Movement Assessment Battery for Children
(MABC) (Hendersen et al., 2007; Henderson et al., 1992), the Test of Gross
Motor Development (TGMD) (Ulrich, 2000, 2016) and the Bruininks-Oseretsky
Test of Motor Proficiency (BOT) (Bruininks, 1978; Bruininks & Bruininks, 2005)
were the most valid and reliable assessment tools currently available. However,
there is limited understanding about how feasible these assessment tools would
be for use in universal screening programmes in schools. Whilst it is true that
school-based assessments would likely mitigate issues with current assessment
routes, and help to reduce healthcare inequalities, it is unclear whether such
initiatives would be effective or feasible.
It is known that there are a wide variety of factors may play a role in
successfully embedding new initiatives into school settings. Research has
shown that in order for initiatives to be successful in primary schools, it is
important to not only consider the initiative being implemented (i.e. in this case
school-wide FMS assessments), but also higher-level factors (Daly-Smith et al.,
2020). After consultation with school leaders and local stakeholders, the authors
of this paper highlighted the importance of not only addressing the global
system (i.e. implementing FMS assessments across all schools) but also
considering the local system (i.e. challenges with implementation in individual
schools such as generating a supportive social environment), as well as the
mechanical parts of the provision (i.e. is the actual assessment tool feasible)
(Daly-Smith et al., 2020).
Previously, guidelines have been proposed for judging the feasibility
(mechanical parts) of school-based assessments of FMS (Klingberg et al.,
2018). The authors outlined seven criteria that assessment tools should meet in
order to be classified as having ‘good’ feasibility. They should:
(i) take less than ten minutes in duration per child,
(ii) only uses equipment readily available in schools,
(iii) require less than six metres squared of space for children to participate in
the activities,

77
(iv) be product-oriented,
(v) have less than 6 items,
(vi) be administered by school staff,
(vii) require less than half a day of training.
These guidelines, however, were not co-produced in consultation with school
staff, and some of them are somewhat arbitrary. For example, having a time
limit guideline is logical, to ensure that FMS assessments are not burdensome
for schools. However, there is a lack of evidence to support the claim that
assessments that exceed this ten minutes per child threshold are categorically
unfeasible. Additional guidelines allude to time pressures within schools - the
number of items and time taken for teacher training. However, it would be
unwise to ‘prescribe’ such values without teacher input. Furthermore, the
number of items in the assessment tool does not take into account how long
each activity is, and there has been a lack of consultation with teachers about
how much time they would be able to spend being trained for such
assessments. Similarly, there was no empirical evidence cited to demonstrate
that most schools have the facilities large enough to accommodate assessment
tools which take up 6 metres squared worth of space. It is likely that there may
be a socioeconomic gradient with regards to how much space schools have for
such activities. Finally, the authors state that assessments should be product-
oriented because process-oriented assessments tend to have issues with inter-
rater reliability which can lead to longer training sessions being required
(Klingberg et al., 2018). However, it was evident in Chapter 2, that a process-
oriented measure, the TGMD (Ulrich, 1985, 2000, 2016) had the greatest
evidence to support its inter-rater reliability. Despite their largely arbitrary
nature, these guidelines do provide a good starting point to facilitate discussion
about the feasibility of FMS assessments with schools.
It is also not enough to consider the mechanical parts of the provision in
isolation (i.e. solely the feasibility of assessments in isolation), if school-based
screening of FMS is to become a reality. It will be imperative to understand,
global, local, and mechanical barriers in combination (Daly-Smith et al., 2020),
doing so through consultation with teaching staff, who would be tasked with
implementing such initiatives. To date there is a paucity of research in this area.
There have been studies which look at teacher opinions about a singular
assessment tool (Lander et al., 2017) and one previous qualitative study which
interviewed a small number of teachers to understand, more generally, their
opinions on school-based assessments of FMS (van Rossum et al., 2018). This
study found that teachers understand the importance of assessment in order to

78
guage childrens' development, however noted that such measures need to be
quick and easy to implement, and that the feedback needs to feed into lesson
planning to help improve individual skills.
To date, no research has utilised behavioural science frameworks to
understand teachers’ ability to implement interventions, and schools’ capacity to
benefit from hosting such assessments, despite previous research highlighting
the utility of using behaviour change theories when embedding initiatives into
schools and their complex systems (Daly-Smith et al., 2020). Such a rigorous
approach is imperative though if tools that may be suitable for use in schools
are to be identified, intelligible suggestions for modifications to pre-existing
measures are to be made, and/or development of an evidence-based, purpose-
made FMS assessment tool for use in schools is to be embarked upon.
The Behaviour Change Wheel (Michie et al., 2014) is ideal for this purpose as it
gives researchers a guide to understand barriers to behaviours, and
subsequently match behaviour change techniques to these barriers to
effectively facilitate the behaviour of interest (e.g. universal screening of FMS in
schools), based on both theory and evidence. The Behaviour Change Wheel
(Michie et al., 2014) is underpinned by two behaviour change frameworks, the
Capability, Opportunity and Motivation Behaviour (COM-B) model (Michie et al.,
2011), and the Theoretical Domains Framework (TDF) (Cane et al., 2012). The
COM-B model (Michie et al., 2011) was designed to provide a more
comprehensive model of behaviour change, as previous models were more
selective and did not encompass all aspects of behaviour. This framework
postulates that the likelihood of a behaviour occurring at an individual, or
organisational level is dependent on a person’s capability, opportunity and
motivation to exhibit them (see Figure 10). It is also states that when all three
facilitatory components are combined, then the likelihood of achieving
behaviour change increases. When referring to capability, the model postulates
that this can be either psychological or physical. In the context of FMS
screening in schools, this relates to whether teachers have the knowledge and
skills necessary to implement the assessment accurately. Opportunity refers to
external factors that may make the behaviour possible or prompt it, and the
COM-B model postulates that opportunity can be either physical or social. For
schools, opportunity could relate to whether there is support from senior
leadership for such initiatives and whether the school has the resources
necessary to run the assessment. Finally, motivation can be automatic (e.g.
emotions) or reflective (e.g. intentions or goals) and relates to habitual
processes and analytical decision making. This could relate to how beneficial
teachers believe FMS assessments to be, and the extent to which they believe

79
that such assessments are their responsibility. It is thought that both capability
and opportunity can have an influence on motivation, and that all three can
influence the likelihood of enacting a behaviour. Additionally, it is stated that
enacting a behaviour may subsequently impact upon an individuals’ capability,
opportunity and motivation to repeat said behaviour. Thus, to truly understand
how to encourage the use of universal screening programmes within schools, it
is essential to first establish the current capability, opportunity and motivation of
teachers to host such assessments.
Figure 10 – Diagrammatic Representation of the Capability, Opportunity and Motivation Behaviour (COM-B) model of Behaviour Change
The TDF (Cane et al., 2012) also feeds into the Behaviour Change Wheel
(Michie et al., 2014) and aligns with the COM-B categories (See Figure 11).
Similarly to the COM-B, the TDF was developed by an international panel of 32
experts to be a more comprehensive framework. The authors reviewed all
available behaviour change theories (33 different frameworks), and
consolidated 128 constructs evident within these frameworks into 14 key factors
for influencing behaviours (Cane et al., 2012). Due to having been developed by
synthesising multiple frameworks, utilising both the COM-B model and TDF in
combination is beneficial because it allows understanding of a wide-range of
multifaceted factors influencing behaviour(s) without being selective about
theories. In summary, the COM-B model and the TDF in combination with the
Behaviour Change Wheel, therefore, provide a sound theoretical foundation that
can be applied to understand barriers and facilitators to school-based screening
of FMS proficiency.
Consequently, the aims of this chapter were to:
(i) Evaluate teacher perceptions of implementing FMS assessments in
schools in line with the Klingberg et al. (2018) recommendations,
understanding what additional factors might impact upon the
implementation of school-based screening programmes using the
COM-B model and the TDF

80
(ii) Utilise the Behaviour Change Wheel to make recommendations for
the feasibility of school based assessments to increase the likelihood
of schools implementing such initiatives.

81
Figure 11 - Diagrammatic representation of how the Theoretical Domains Framework (TDF) components fit within the Capability, Opportunity and Motivation Behaviour (COM-B) model categories.

82
3.2 Methods
3.2.1 Participants and Procedure
Teachers or staff who worked in a Primary school in a role that directly supports
the education of pupils (e.g. head teachers/senior leaders, teachers, teaching
assistants) were invited to take part in an online questionnaire. This population
was selected due to a lack of P.E. specialisation within primary schools in the
(Ofsted, 2013), which means it is likely that if schools were required to
universally screen FMS, the responsibility could be placed upon any member of
teaching staff.
The questionnaire which had 29 items, was hosted by Qualtrics
(www.qualtrics.com/uk/), and was advertised on social media (e.g. through
teacher groups and forums on Facebook and Twitter) as well as through links
with local schools. Participants were entered into a prize draw that gave them a
chance to win one of three £20 “Amazon.co.uk” vouchers as an incentive for
taking part. The questionnaire took participants approximately ten minutes to
complete, and was available online between February and July 2019. Ethical
approval for this study was granted by the University of Leeds School of
Psychology Ethics Committee (reference: PSC-591).
3.2.2 Measure – Online Questionnaire
Demographic information was collected about participants’ gender, age, highest
qualification, age groups taught, job role, years of teaching experience, type of
school, country, and whether they had received training on FMS prior to
completing the questionnaire. The questionnaire can be found in Appendix D.
Questions were based on previous research which explored the feasibility of
FMS assessments for use in schools (Klingberg et al., 2018), were mapped
alongside all six sub-elements within the COM-B model (Michie et al., 2011)
and categorised in relation to the Theoretical Domains Framework (TDF) (Cane
et al., 2012). There was extensive discussion amongst authors on the wording
of the questions to ensure that they were both easily comprehensible and
theoretically driven. Categorisations for the COM-B model and the TDF were
discussed and agreed upon amongst authors. Disagreements amongst authors
were resolved through consultation with a behaviour change researcher who
was not involved with the design of the questionnaire. Multiple choice, scale and
rank questions were used to explore primary school teachers’ opinion of their
capability (e.g. ability to demonstrate FMS to pupils), opportunity (e.g. senior
leadership team support for such initiatives) and motivation (e.g. how beneficial

83
they believe knowledge of their pupils’ FMS levels would be for their teaching)
to assess FMS. For a full breakdown of questions included in the questionnaire,
and the aspects of the COM-B model and TDF framework they align with, see
Table 8.
3.2.3 Data Analysis
Patterns observed in the descriptive statistics were explored and multinomial
logistic regression was used to investigate whether there were any relationships
between demographic factors and responses to each question. Sex, age,
highest qualification, years of teaching experience, job role, school type, and
whether respondents had received training on FMS were all included in these
regression models. For age, categories 4, 5 and 6 (46-55 years, 56-65 years
and 66+ years) were amalgamated for this analysis because only seventeen
participants were over the age of 55 years. The country in which respondents
taught was not included in the regression model as the number of responses
from outside of the UK was too low to test differences of opinion and draw
meaningful conclusions. Age groups taught was not included in the analysis as
respondents often selected more than one age group. A significance level of
p≤.001 was applied to mitigate for the risk of type-1 errors whilst testing multiple
hypotheses. All analyses were carried out using the Statistical Package for the
Social Sciences (SPSS) version 2.

84
Table 8 - Questionnaire items in relation to the Capability, Opportunity, Motivation and Behaviour (COM-B) model of behaviour change and the Theoretical Domains Framework (TDF)
Construct Measured
Variable Questionnaire item Reponses Component
of COM-B
model
Component of
TDF
Perceived knowledge How knowledgeable do you think
you are about motor skills that are
defined as 'Fundamental Movement
Skills'?
1)Not knowledgeable at all, 2) , 3) ,
4) , 5)Extremely knowledgeable
Capability
(psychological)
Knowledge
Actual knowledge Which of the following motor skill do
you think comprise 'Fundamental
Movement Skills'?
Running, Handwriting , Hopping,
Jumping, Using cutlery, Balancing,
Dressing oneself, Throwing, Catching,
Kicking, Brushing teeth, Riding a bike,
Swimming
Capability
(psychological)
Knowledge
Knowledge of
relationship between
FMS and outcomes
On a scale of 1-5, to what extent do
you think the development of
fundamental movement skills has
an impact upon:
• Academic attainment?
• Participation in PA?
• Mental Health?
1)No impact at all,
2)…..3)…..4)….5)Large impact
Capability
(psychological)
Knowledge

85
• Physical Health?
• Social Relationships?
Confidence
Demonstrating
On a scale of 1-5, how confident
are you that you could demonstrate
the following activities:
• Running between two
markers for 15 seconds?
• Throwing beanbags into a
target box two metres away?
• Hopping between two
markers one metre apart?
• Holding a balance (e.g.
standing on one leg) whilst
passing a beanbag around
your body?
1)Not confident at all,
2)…3)…4)…5)Extremely Confident
Capability
(physical)
Physical Skills
Confidence Assessing On a scale of 1-5, how confident
are you that yourself and one other
member of staff could assess five
children simultaneously in the
following activities:
• Running between two
markers for 15 seconds?
1)Not confident at all,
2)…3)…4)…5)Extremely Confident
Capability
(physical)
Physical skills

86
• Throwing beanbags into a
target box two metres away?
• Hopping between two
markers one metre apart?
• Holding a balance (e.g.
standing on one leg) whilst
passing a beanbag around
your body?
Current FMS
assessment provision in
school
Do you/your school currently
assess fundamental movement skill
proficiency?
Yes, No, Unsure Opportunity
(physical)
Environmental
context and
resources
Support from senior
leadership
Do you think the senior leadership
team at your school would be
supportive if you wanted to assess
fundamental movement skill
proficiency in your class?
Definitely yes, Probably yes, Probably
not, Definitely not
Opportunity
(social)
Social influences
Access to additional
support staff resource
Would you be able to access
support from another member of
staff (e.g. teaching assistant) to
help you deliver an assessment of
fundamental movement skills to a
whole class?
Definitely yes, Probably yes, Probably
not, Definitely not
Opportunity
(physical)
Environmental
context and
resources

87
Access to equipment Does your school have the
following equipment:
• 25 beanbags?
• Chalk?
• A sports hall larger than 5m
x 5m?
• Outdoor space larger than
5m x 5m?
• Stop watch?
• Tape measure or metre
ruler?
Yes, No, Unsure Opportunity
(physical)
Environmental
context and
resources
Acceptable assessment
time
Over the course of a single school
week, once per academic year, how
long do you think is acceptable to
spend assessing the fundamental
movement skills of :
• one child
• a whole class?
Per Child: < 10 minutes, 10-30 minutes,
30-60 minutes, 60-90 minutes, Up to 2
hours, 2 - 3 hours, 3 hours +
Per class: < 10 minutes, 10-30 minutes,
30-60 minutes, 60-90 minutes, Up to 2
hours, 2 - 3 hours, 3 hours +
Opportunity
(physical)
Environmental
context and
resources

88
Feasibility of 2 hour
start of school year
assessment
Do you think you have would be
able to make time in the curriculum
to spend two hours at the start of
the school year evaluating your
class' fundamental movement
skills?
Definitely yes, Probably yes, Probably
not, Definitely not
Opportunity
(physical)
Environmental
context and
resources
Time in school day most
suitable to assess FMS
What time of the day would you be
most likely be able to find time to
assess fundamental movement
skills?
Physical Education (P.E.) lessons, Core
lessons (Maths, English and Science),
Other lessons (e.g. Languages and
Art), After school, Before school
Opportunity
(physical)
Environmental
context and
resources
Perceptions of ability to
identify children who
need support through
FMS assessment in
schools
Do you think a school based
assessment of fundamental
movement skills has the ability to
identify children who need
additional support?
Yes, No, Maybe Motivation
(reflective)
Optimism
Perceived benefit of
knowledge of pupils’
FMS for teaching
On a scale of 1-5, how beneficial to
your teaching would it be to have
knowledge about your pupils'
fundamental movement skills?
1)Not beneficial at all,
2)…3)…4)…5)Extremely beneficial
Motivation
(reflective)
Beliefs about
consequences
Workload stress Do you think that assessing
childhood fundamental movement
skills in school would increase your
workload stress?
Definitely yes, Probably yes, Probably
not, Definitely not
Motivation
(automatic)
Emotion

89
Likelihood of assessing
FMS
On a scale of 1-5, if you had
training and support available, how
likely would you be to assess the
fundamental movement skills of the
children in your class?
1)Not likely at all,
2)….3)…4)….5)Extremely likely
Motivation
(reflective)
Intentions &
beliefs about
capabilities
Peer influence How likely would your decision
regarding whether to assess the
fundamental movement skills be
influenced by the opinions of other
teachers in your school?
1)Not likely at all,
2)….3)…4)….5)Extremely likely
Motivation
(reflective)
Professional/social
role and identity
NB: For confidence demonstrating, two locomotor skills were included as both have very different difficulty levels. Hopping is a more
advanced locomotor skill which requires greater strength, and better vestibular and motor control. It is therefore likely to be more difficult
for adults to demonstrate, particularly less fit adults, those that are overweight or those with lower limb injuries or medical conditions such
as osteoarthritis.

90
3.3 Results
The questionnaire was online for 133 days. A total of 1074 people opened and
began filling in the questionnaire; 221 people did not complete the questionnaire
and their responses were therefore excluded.
3.3.1 Participants
A total of 853 primary school staff fully completed the survey and had their data
analysed. Participant demographics are given in Table 9. Participants reported
working across 32 different countries, with the majority working in the UK
(n=746, 87.7%), followed by India (n=10, 1.2%), the USA (n=7, 0.8%) as well as
Australia, Germany, Ireland and Malta which all had five responses (0.6%). The
remaining responses spanned six continents: Africa (7 responses from 5
countries ), Asia (20 responses from 15 countries), Europe (9 responses from 7
countries), North America (3 responses from 2 countries), Oceania (3
responses from 2 countries) and South America (1 response from Mexico). The
mean time spent in a teaching role was 8.57 years (SD = 7.71, range = 2
months – 45 years 3 months). The most common responses when job role was
selected as ‘other’ were: deputy headteacher (n=19, 2.2%), trainee teacher
(n=8, 0.9%), head of year/phase (n=8, 0.9%), higher level teaching assistant
(HLTA; n=7, 0.8%). When ‘other’ was selected for type of school, the most
common responses were: special educational needs schools (n=9) and faith
schools (n=5). Only 128 primary school staff (15.1%) claimed to have received
training on FMS, ranging from lectures within degrees to programmes used
within schools to knowledge disseminated from Physical Education (PE) leads
in their schools.
Table 9 - demographic characteristics of the school workers that completed the online questionnaire
Demographic Variable n %
Gender
Male 54 6.4
Female 788 92.9
Prefer not to say 6 0.7
Age
18-25 170 20
26-35 345 40.6
36-45 203 23.9

91
46-55 113 13.3
56-65 17 2
66+ 1 0.1
Highest Qualification
General Certificate of Secondary
Education 7
0.8
Advanced Subsidiary Level 2 0.2
Advanced Level 26 3.1
Undergraduate degree 280 32.9
Masters Degree 89 10.4
Professional Degree (e.g. PGCE) 441 52.1
Doctoral Degree 2 0.2
Job Role
Teacher 701 82.3
Teacher Assistant 37 4.3
Headteacher 21 2.5
Special Educational Needs
Coordinator 58
6.8
Other 83 9.7
Age Groups of Children Taught
4-5 years 204 23.9
5-6 years 221 25.5
6-7 years 217 25.4
7-8 years 262 30.8
8-9 years 269 31.6
9-10 years 224 26.3
10-11 years 216 25.4
Type of School Taught In
State 543 64.1
Private 66 7.8
Academy 212 25
Other 26 3.1

92
Training on FMS
Yes 128 15.1
No 719 84.4
3.3.2 Capability
Frequencies for responses to capability questions are reported in full in Table
10.
Table 10 - Responses to questions designed to measure the capability of teachers to assess fundamental movement skills in a school setting
Variable n %
Perceived knowledge of FMS
1 (Not knowledgeable at all) 225 26.6
2 322 38
3 254 30
4 43 5.1
5 (Extremely knowledgeable) 3 0.4
Knowledge of FMS
Running 615 72.2
Handwriting 317 37.2
Hopping 553 64.9
Jumping 626 73.5
Using cutlery 351 41.2
Balancing 736 86.4
Dressing oneself 371 43.5
Throwing 554 65
Catching 544 63.8
Kicking 489 57.4
Brushing teeth 290 34
Riding a bike 219 25.7
Swimming 214 25.1
All correct 356 48.1

93
All correct no incorrect 128 15
All answers on the list 111 13
All incorrect 118 13.8
All incorrect no correct 1 0.1
Knowledge of relationship between
FMS and outcomes
Academic Attainment
1 (No impact at all) 3 0.4
2 34 4
3 223 26.3
4 350 41.1
5 (Large impact) 239 28.1
Physical Activity
1 (No impact at all) 2 0.2
2 11 1.3
3 53 6.2
4 203 23.8
5 (Large impact) 579 68.3
Mental Health
1 (No impact at all) 2 0.2
2 31 3.6
3 141 16.5
4 371 43.5
5 (Large impact) 301 35.6
Physical Health
1 (No impact at all) 2 0.2
2 23 2.7
3 79 9.3
4 281 33
5 (Large impact) 462 54.2

94
Social Relationships
1 (No impact at all) 8 0.9
2 57 6.7
3 220 25.8
4 385 45.2
5 (Large impact) 177 20.8
Confidence Demonstrating
Running between two markers
1 (not confident at all) 1 0.1
2 12 1.4
3 62 7.3
4 152 17.8
5 (extremely confident) 621 72.9
Throwing beanbags to a target
1 (not confident at all) 2 0.2
2 12 1.4
3 121 14.2
4 242 28.4
5 (extremely confident) 472 55.4
Hopping between two markers
1 (not confident at all) 5 0.6
2 21 2.5
3 94 11
4 194 22.8
5 (extremely confident) 531 62.3
Holding a balance whilst passing a
beanbag

95
1 (not confident at all) 4 0.5
2 37 4.3
3 132 15.5
4 227 26.6
5 (extremely confident) 446 52.3
Confidence assessing
Running between two markers
1 (not confident at all) 1 0.1
2 28 3.3
3 176 20.7
4 278 32.6
5 (extremely confident) 363 42.6
Throwing beanbags to a target
1 (not confident at all) 1 0.1
2 25 2.9
3 133 15.6
4 300 35.2
5 (extremely confident) 388 45.5
3.3.2.1 Perceived Knowledge
Perceived knowledge about FMS was relatively low, only 5.5% claimed to be
either ‘very’ (n=44, 5.1%) or ‘extremely’ (n= 4, 0.4%) knowledgeable. A large
proportion (68%) did believe they had ‘some’ working knowledge of FMS
though. A multinomial regression showed that the final model was a better fit
with demographic factors included than the intercept only model (χ² (80) =
233.7, p<.001). Only previous teacher training in FMS predicted a positive
response to perceived knowledge (χ²(4) = 145.83, p<.001) at the accepted
significance level (see Table 11). Respondents who had received training on
FMS were increasingly more likely to think that they had greater knowledge of
FMS than those who had not received training. Using the response ‘not
knowledgeable at all’ as the reference category, teaching staff that had received
training were 29 times more likely to select ‘moderately knowledgeable’ (OR =
29.26, CI = 8.99 – 95.28), 117 times more likely to believe they were ‘very
knowledgeable’ (OR = 117.30, CI = 31.08 – 442.70), and 182 times more likely

96
to think they were ‘extremely knowledgeable’ (OR = 182.43, CI = 9.02–
3691.61).
Table 11 - Likelihood Ratio Tests for teachers’ perceived knowledge of fundamental movement skills
Effect χ² df p
Intercept .00 0
Teaching Experience
(years)
.134 4 .99
Type of School 15.41 12 .22
Training 145.83 4 <.001
Sex 18.10 8 .02
Highest Qualification 21.45 24 .61
Age Group 6.45 12 .89
Job Role 13.07 16 .67
NB: Accepted level of significance was p≤.001
3.3.2.2 Actual Knowledge
When asked to select from a list of motor skills only those that are classified as
FMS, 355 (42%) of the respondents selected all the correct answers (running,
jumping, hopping, throwing, kicking, catching and balancing). However, 227 of
this subset (63.9%) also selected at least one incorrect answer. The most
commonly selected incorrect answers were ‘activities of daily living’ including
dressing oneself (43.5%), using cutlery (41.2%) and brushing one’s teeth
(34%). None of the demographic factors were predictors for knowledge of what
skills comprise FMS (χ² (80) = 170.47, p=.04).
3.3.2.3 Knowledge of relationship between fundamental movement skills
and outcomes
There was a fairly good understanding of the relationships between FMS and
childhood development, with 69.2% of respondents (n= 589) agreeing that FMS
had a moderate or large impact on academic attainment, 66% (n=562) on social
relationships and 79.1% (n= 671) on mental health (i.e. relationships that have
been well established in previous research outlined in Chapter 1). Teaching
staff perceptions of the impact of FMS on physical activity and physical health
were greater still at 92% (n=782) and 87% (n= 743) respectively. Multinomial
regressions found that the final model was not a better predictor of responses to
the impact of FMS on physical activity (χ² (80) = 72.33, p= .87), mental health

97
(χ² (80) = 78.55, p= .53) or physical health (χ² (80) = 68.43, p= .82). Analyses
found that the final model was a better predictor of responses to the importance
of FMS for academic attainment (χ² (80) = 131.22, p<.001), and social
relationships (χ² (80) = 164.29, p<.001), however, none of the demographic
variables alone significantly predicted responses for academic attainment (see
Table 12).
Table 12 - Likelihood Ratio Tests for the perceived impact of fundamental movement skills on academic attainment
Effect χ² df p
Intercept .00 0
Teaching Experience
(years)
8.12 4 .09
Type of School 15.90 12 .20
Training 3.44 4 .49
Sex 13.87 8 .09
Highest Qualification 20.44 24 .67
Age Group 17.71 12 .13
Job Role 15.05 16 .52
NB: Accepted level of significance was p≤.001
For social relationships, age group predicted responses (see Table 13), in
which age groups one (18-25 years) were seven times more likely to state that
FMS had a ‘moderate impact’ on social relationships than a ‘very large impact’
when compared to all other age groups (OR = 7.07, CI = 2.67 – 18.75).
Table 13 - Likelihood Ratio Tests for the perceived impact of fundamental movement skills on social relationships
Effect χ² df p
Intercept .00 0
Teaching Experience
(years)
6.52 4 .16
Type of School 24.44 12 .02
Training 2.31 4 .68
Sex 8.31 8 .40
Highest Qualification 27.84 24 .27
Age Group 31.99 12 .001

98
NB: Accepted level of significance was p≤.001
3.3.2.4 Confidence Demonstrating
When asked to rate their ability to demonstrate FMS on a scale between one
and five (with one indicating ‘not confident at all’ and five indicating ‘extremely
confident’), 92.1% (n=786) were confident (selecting responses four or five) that
they could run between two markers for 15 seconds. Confidence was also high
for throwing into a target box (n= 717, 84.1%), hopping between two markers
(n=732, 85.8%), and holding balance (n= 679, 79.6%). Demographic factors did
not play a significant role in responses to confidence demonstrating ‘running’
(χ²(80) = 81.54, p= .43), ‘throwing’ (χ²(80) = 80.02 p= .49), ‘hopping’ (χ²(80) =
79.1, p= .51) or ‘balance’ (χ²(80) = 36.44, p= 1.00).
3.3.2.5 Confidence Assessing
When asked about confidence in assessing small groups (of five) children
simultaneously for the activities described above, confidence rates remained
positive, with 75.8% (n= 647) responding with four or five on the scale for
‘running’, 81.2% (n= 693) for ‘throwing’, 77.5% (n=661) for ‘hopping’ and 75.3%
(n=642) for ‘balancing’. Demographic factors, again, did not play a significant
role in responses to confidence assessing five children at once for ‘running’
(χ²(80) = 49.49, p= .43), ‘throwing’ (χ²(80) = 91.55, p= .18), ‘hopping’ (χ²(80) =
83.58, p= .37) or ‘balance’ (χ²(80) = 114.14, p= .007).
3.3.3 Opportunity
Frequencies for responses to opportunity questions are reported in full in Table
14.
Table 14 - Responses to questions designed to understand the opportunity for teachers to assess fundamental movement skills in a school setting
Job Role 31.33 16 .01
Variable n %
Current FMS assessment provision in
school
Yes 128 15
No 403 47.3
Unsure 317 37.2

99
Support from senior leadership
Definitely yes 212 24.9
Probably yes 524 61.5
Probably not 109 12.8
Definitely not 3 0.4
Access to additional support staff
resource
Definitely yes 276 32.4
Probably yes 387 45.4
Probably not 149 17.5
Definitely not 36 4.2
Access to equipment
25 beanbags
Yes 696 81.7
No 77 9
Unsure 75 08.8
Chalk
Yes 774 90.8
No 35 4.1
Unsure 38 4.5
Sports hall larger than 5x5 metres
Yes 741 87
No 69 8.1
Unsure 37 4.3
Outdoor space larger than 5x5 metres
Yes 832 97.9
No 11 1.3
Unsure 5 0.6

100
Stopwatch
Yes 789 92.3
No 25 2.9
Unsure 37 4.3
Acceptable assessment time
Per child
<10 mins 393 46.1
10-30 mins 327 38.4
30-60 mins 73 8.6
60-90 mins 13 1.5
Up to 2 hours 8 0.9
2-3 hours 3 0.4
3 hours+ 2 0.2
Whole class
<10 mins 5 0.6
10-30 mins 80 9.4
30-60 mins 205 24.1
60-90 mins 166 19.5
Up to 2 hours 132 15.5
2-3 hours 113 13.3
3 hours+ 132 15.5
Feasibility of two hour start of school
year assessment
Definitely yes 194 22.8
Probably yes 478 56.1
Probably not 157 18.4
Definitely not 18 2.1
Time in school day most suitable to
assess FMS
PE lessons 730 85.7
Core lessons 22 2.6
Other lessons 17 2

101
3.3.3.1 Current Fundamental Movement Skills Assessment Provision in
Schools
When teaching staff were asked whether they themselves, or their school,
currently assess their pupils’ FMS, 128 people (15%) in the sample responded
with ‘yes’, 398 (47.6%) stated they did not, and 319 (37.4%) were unsure. A
multinomial logistic regression found that a model with all demographic factors
included was a better predictor of responses than a model without these factors
(χ²(40) = 129.75, p<.001). Previous FMS training was the only factor to predict
responses to this question (χ²(2) = 36.57, p<.001) (see Table 15). Teaching
staff that had previously completed training on FMS were four times more likely
to say that they, or their school, currently assess the FMS of their pupils (OR=
4.19, CI = 2.54 – 6.91).
Table 15 - Likelihood Ratio Tests for Whether Schools Currently Assess Fundamental Movement Skills
Effect χ² df p
Intercept .00 0
Teaching Experience
(years)
3.61 2 .17
Type of School 4.63 6 .59
Training 36.57 2 <.001
Sex 3.83 4 .43
Highest Qualification 21.00 12 .05
Age Group 9.82 6 .13
Job Role 19.52 8 .01
NB: Accepted level of significance was p≤.001
3.3.3.2 Support from Senior Leadership
A large proportion of teaching staff (n= 736, 86.4%) believed that senior
leadership teams (SLT) in their school would ‘definitely’ or ‘probably’ be
supportive if they decided they would like to assess the FMS proficiency of their
pupils. None of the demographic variables were predictors of teacher
perceptions of SLT support (χ²(80) = 97.72, p= .002).
After school 13 1.5
Before school 20 2.3

102
3.3.3.3 Access to Additional Support Staff Resource
The majority of respondents believed they would ‘definitely’ (n = 277, 32.5%), or
‘probably’ (n= 389, 45.6%) be able to enlist another member of staff to help
them to assess FMS proficiency in school. Only 4.2% of the sample (n= 36)
claimed that this would ‘definitely not’ be possible. Analyses revealed that the
intercept only model was not improved by including demographic factors for this
question (χ²(60) = 79.97, p= .04).
3.3.3.4 Access to Equipment
When asked whether schools had access to basic equipment that would enable
the testing of FMS, the majority of staff said their schools had ‘25 beanbags’
(n=696, 81.7%), ‘chalk’ (n=774, 90.8%), a ‘sports hall larger than five metres
squared’ (n=741, 87%), an ‘outdoor space larger than five metres squared’
(n=832, 97.7%), a ‘stopwatch’ (n=786, 92.3%) and a ‘tape measure or metre
ruler’ (n=827, 97.1%). None of the demographics were predictive of teacher
responses to access to equipment in schools: ‘25 beanbags’ (χ²(40) = 54.93, p=
.06), ‘chalk’ (χ²(40) = 53.99, p= .07), a ‘large enough sports hall’ (χ²(40) = 52.67,
p= .09), ‘suitable outdoor space’ (χ²(40) = 57.76, p= .03), a ‘stopwatch’ (χ²(40) =
34.97, p= .70), and a ‘tape measure’ (χ²(40) = 30.96, p= .85).
3.3.3.5 Acceptable Assessment Time
School staff were also asked how long would be acceptable to spend assessing
the FMS of one child and a whole class at the start of the academic year, with
the most common responses being ‘less than ten minutes’ and ‘30-60 minutes’,
respectively. Demographic factors were not predictors for acceptable time to
assess FMS per child (χ²(120) = 59.38, p= 1.00) or for a whole class (χ²(120) =
125.32, p= .35).
3.3.3.6 Feasibility of Two Hour Start of Year Assessment
The majority of teaching staff said that they would be able to devote two hours
at the start of the school year to assessing FMS, selecting either ‘definitely yes’
(n=194, 22.8%) or ‘probably yes’ (n= 47, 56.1%). Only 18 participants (2.1%)
stated that this would ‘definitely not’ be possible. A multinomial logistic
regression found that the final model significantly predicted responses better
(χ²(60) = 102.85, p<.001). Whether or not teaching staff had received training
on FMS previously was the only demographic factor that had a significant
impact upon responses (χ²(3) = 20.01, p<.001) to this question (see Table 16).
Further exploration showed that teaching staff that had received training were

103
62% less likely to say ‘probably yes’ than ‘definitely yes’ (OR = .38, CI = .24 -
.60), meaning they had greater confidence in the feasibility of a start of year
assessment.
Table 16 - Likelihood Ratio Tests for whether teaching staff would be able to spend 2 hours at the start of the school year assessing the fundamental movement skills of their pupils
Effect χ² df p
Intercept .00 0
Teaching Experience
(years)
5.76 3 .12
Type of School 20.22 9 .02
Training 20.01 3 <.001
Sex 8.80 6 .19
Highest Qualification 17.51 18 .49
Age Group 9.79 9 .37
Job Role 8.27 12 .76
NB: Accepted level of significance was p≤.001
3.3.3.7 Time in the School Day Most Suitable to Assess FMS
When asked to rank when they would most likely be able to find time to assess
FMS in schools, the most popular response was ‘during P.E. lessons’ (91%).
The least feasible time to assess these skills was ‘before school’, with 41.5% of
the sample ranking this last. Demographic factors did not play a significant role
in responses to this question (χ²(80) = 76.21, p = .60).
3.3.4 Motivation
Frequencies for responses to motivation questions are reported in full in Table
17.
Table 17 - responses to questions designed to measure the motivation of teachers to assess fundamental movement skills in a school setting
Variable N %
Perceptions of ability to identify
children who need support through
FMS assessment in schools
Yes 618 72.5
No 14 1.6

104
3.3.4.1 Perception of ability to identify children that need support through
FMS assessment in schools
The majority of school staff believed that a school-based assessment would be
able to identify children who need extra support (72.9% yes, 25.5% maybe),
with only 1.4% of the sample claiming they did not think this would be the case.
Demographic factors did not play a significant role in responses to this question
(χ²(40) = 67.92, p= .004).
Maybe 216 25.4
Perceived benefit of knowledge of
pupils’ FMS for teaching
1 (not beneficial at all) 2 0.2
2 42 4.9
3 251 29.5
4 322 37.8
5 (extremely beneficial) 229 26.9
Workload stress
Definitely yes 94 11
Probably yes 394 46.2
Probably not 330 38.7
Definitely not 30 3.5
Likelihood of assessing FMS
1 (not likely at all) 3 0.4
2 45 5.3
3 190 22.3
4 322 37.8
5 (extremely likely) 285 33.5
Peer influence
1 (not likely at all) 44 5.2
2 84 9.9
3 226 26.5
4 380 44.6
5 (extremely likely) 114 13.4

105
3.3.4.2 Perceived benefit of knowledge of pupils’ FMS ability for teaching
When asked to rate on a scale from one (not beneficial at all) to five (extremely
beneficial) how their teaching would benefit if they were aware of their pupils’
FMS ability, only 5.2% of school staff responded with either one or two. The
majority of respondents selected either three (29.7%), four (38.1%) or five
(27.2%). Demographic factors were found to significantly predict responses
(χ²(80) = 143.34, p< .001). Both training (χ²(4) = 23.84, p< .001) and job role
(χ²(16) = 55.97, p< .001) were predictive of the way respondents answered (see
Table 18). Teachers who had previously received training were more likely to
believe that their teaching would be benefitted by knowledge, and similarly,
teachers were more likely to perceive such benefits than other members of
school staff.
Table 18 - Likelihood Ratio Tests for perceived benefit of knowledge of pupils’ fundamental movement skills for teaching
Effect χ² df p
Intercept .00 0
Teaching Experience
(years)
6.54 4 .16
Type of School 21.41 12 .05
Training 23.84 4 <.001
Sex 8.28 8 .41
Highest Qualification 25.87 24 .36
Age Group 16.04 12 .19
Job Role 55.97 16 <.001
NB: Accepted level of significance was p≤.001
3.3.4.3 Workload Stress
When asked whether assessing FMS in schools would increase workload
stress, over half of the respondents selected ‘definitely yes’ (n= 94, 11%) or
‘probably yes’ (n= 394, 46.2 %). Only 30 participants selected ‘definitely not’
(3.5%). Demographic factors did not have a significant effect on the regression
model (χ²(60) = 87.21, p =.01).
3.3.4.4 Peer Influence
When asked whether their decision to assess FMS would be influenced by
other staff in their school, over half of the respondents selected either
‘extremely likely’ (n= 114, 13.4%) or ‘somewhat likely’ (n=380, 44.6%), and only

106
15.1% of participants selected that it would be ‘not likely at all’ (5.2%, n=44) or
‘somewhat unlikely’ (9.9%, n=84) to influence them. Demographic factors did
not play a significant role in how participants responded to this question (χ²(80)
= 109.59, p =.02).
3.3.4.5 Likelihood of Assessing FMS
When asked on a scale of one (not likely at all) to five (extremely likely) how
likely they would be to assess the FMS proficiency of their pupils if they had
appropriate training and support available, the response was largely positive,
with 71.8% of the sample choosing four or five, and thus being likely to
implement such an initiative. Only 5.7% of the sample (n=47) selected one or
two, indicating they would be unlikely to assess. Demographic factors did not
have a significant effect on the regression model (χ²(80) = 97.50, p =.09).
3.4 Discussion
The first aim of this chapter was to establish teacher perceptions of feasibility,
and more specifically, to see if they aligned with the Klingberg et al. (2018)
guidelines. The second aim was to improve understanding of what other factors
may affect the viability of school-based assessments of FMS by framing
questions in line with two prominent behaviour change theories - the COM-B
model (Michie et al., 2011) and the TDF (Cane et al., 2012). Using behaviour
change will help to unpack why, in spite of a large appetite for use of such
assessments in schools, they were not already being implemented on the
whole. Indeed, only 15% of respondents believed pupils’ FMS was currently
being measured in their schools.
When focusing on psychological capability alone, results revealed that over a
quarter (26.6%) of teachers had no perceived knowledge about FMS and a
greater proportion still (38%) believed they had low levels of knowledge about
these skills. This is in line with recent qualitative research which suggests that
early years educators often do not have the knowledge about FMS to help with
the development of FMS (Dobell et al., 2021). It is therefore perhaps
unsurprising that only fifteen percent of the sample managed to correctly
identify all FMS from a list of generic motor skills, without also selecting any
incorrect answers. Interestingly, this is an equivalent proportion to those that
had also received training on FMS previously. The lack of training that school
staff receive to help support their pupils’ development of FMS is worrying,
considering the wide-ranging impacts these skills have on other aspects of
childhood development (Barnett, Stodden, et al., 2016). This has been brought
to the attention of the Government in the UK previously, with the All Party

107
Parliamentary Group (APPG) on Fit and Healthy Childhood recommending that
teaching staff should be receiving comprehensive training to ensure that
children can develop these skills in a safe and effective manner (Clark et al.).
The Klingberg et al. (2018) feasibility criteria also state that teaching staff
should receive training which takes less than half a day in duration, to enable
them to assess the FMS proficiency of their pupils. Whilst the specific
constraints of teacher training were not evaluated by this questionnaire, it is
clear that such development opportunities will be crucial to ensure
understanding of what FMS are, as well as how to implement the assessment
tool. It will also be important to ensure that training includes information on the
role of FMS plays in childhood development, as although a large proportion of
teaching staff were aware of the association with physical health and physical
activity, which is in line with previous research (van Rossum et al., 2018),
teachers were less aware of the wider implications these skills have for
socioemotional development and academic attainment.
Physical capability did not appear to be a specific barrier to hosting FMS
assessments in schools, with over 75% of teaching staff surveyed confident that
they could demonstrate and assess running, throwing, hopping and balancing. It
is, however, important to note that physical capability could not be truly
measured through the use of a questionnaire (rather the results reflect
perceived ability). Additionally, this still leaves one in four teachers as potentially
not feeling confident enough to demonstrate these skills to their pupils. Whilst
this is not the majority, it is still a rather large proportion which could have
logistical implications for schools. It is possible that having teachers that are not
confident demonstrating FMS could lead to issues with implementation fidelity.
It will therefore be important that such capability is ensured, through the use of
active training sessions, before teachers are allowed to implement FMS
assessments.
With regards to physical opportunity, one of the aspects of the Klingberg et al.
(2018) guidelines that was evaluated was the duration of assessments. Their
proposal was that assessments should take less than ten minutes per child, a
suggestion they did not substantiate with evidence. The teaching staff that
completed this questionnaire did though concur with this idea, and when given a
number of choices, the most acceptable timeframe to assess a single child was
indeed less than less than ten minutes, with 46.1% of the sample selecting this
option. This questionnaire also asked about the duration for a whole class,
because to ensure that children are not missed by the socioeconomic gradient
seen within healthcare services, universal screening in schools will entail
assessing every child, and the most likely format of such assessments would

108
therefore be within a class setting. The most acceptable timeframe to assess a
class of thirty children was between 30-60 minutes. Finally, a majority (78.9) of
teaching staff believed that they would likely be able to spend two hours at the
start of the school year to assess a whole class.
The brevity of the assessment time limits deemed feasible by teachers, likely
reflect teachers feeling progressively more worried about having sufficient time
to cover the ‘core’ curriculum (i.e. English, Maths and Science) (Routen et al.,
2018), which has led to P.E. lessons being shortened, or even completely cut in
some cases (Rumsby, 2015) in order to accommodate for extra time to deliver
content which will be assessed by OFSTED (Rudgard, 2018). This has been
highlighted more recently, in schools’ response to the COVID-19 pandemic,
whereby sports halls were being used as extra classrooms to enable social
distancing (McBride, 2020). With many respondents (85.7%) feeling that P.E.
lessons were the ideal time within the school day to assess FMS, the limited
time deemed feasible to allocate to such assessments is therefore logical.
Of the three assessments that showed the most promising psychometric
properties in Chapter 2, all would require a longer duration than teachers are
willing to spend assessing FMS, both for an individual child, as well as a class.
The TGMD (Ulrich, 1985, 2000, 2016) usually takes between 30-40 minutes per
child to assess both locomotor and object control skills, a duration which was
thought to be acceptable for a whole class, rather than a single child.
Additionally, as was noted in Chapter 2, further activities would need to be
added to the TGMD to ensure it includes stability skills so that it encompasses
all aspects of FMS which are covered by the curriculum. Adding further tasks
would only increase the duration of this assessment. Similarly, the MABC
(Hendersen et al., 2007; Henderson et al., 1992) and the BOT both take
between 45-60 minutes to assess a child’s motor ability and are designed to be
delivered one-to-one. Chapter 2 established that both of these assessments
also include fine motor skills, which could be removed for the purpose of
universal screening of FMS ability. This would likely save some time, however it
is unlikely that enough time would be saved from these assessments to reduce
their administration time to less than ten minutes, in order for them to be
classed as feasible.
Questions relating to physical opportunity also included access to equipment,
which was also a guideline set out by Klingberg et al. (2018). They stated that
assessments should only utilise equipment that is readily available in schools,
however they did not provide any examples of such equipment. This
questionnaire looked at the availability of simple, inexpensive equipment that
can typically be found within schools and could be used to assess FMS. Over

109
80% of the teaching staff that responded to this questionnaire were confident
that their school had 25 beanbags (81.7%), chalk (90.8%) and a stopwatch
(92.3%). It is, however, important to note that the questionnaire did not ask
about all the different types of equipment needed for MABC, TGMD & BOT, so
it is difficult to know whether these are truly feasible in terms of the resources
they require. On the other hand, the nature of these assessments requires
specific equipment which make it even more unlikely that schools would find
these assessments feasible, given they would have to invest in purchasing
them. For example, the MABC (Hendersen et al., 2007; Henderson et al., 1992)
requires you to have specialist mats, which have target circles on, for hopping
tasks. Similarly the BOT requires you have a balance beam and to use the
TGMD (Ulrich, 1985, 2000, 2016) you need to have specifically sized
equipment, such as a 4 inch ball for catching. Whilst such equipment enables
the delivery of these assessments, it is important to factor in the cost, as recent
reports have projected that schools will feel increasing pressure on their
budgets (Perera, 2020). With this in mind, it is noteworthy that the MABC-2
costs £1,172, the gross motor subscale of the BOT-2 costs £545 and the
TGMD-3 costs $150, however the price of the TGMD does not include the
specific equipment required, so it is likely that schools would incur additional
costs resourcing these.
Space required was also evaluated under Physical Opportunity, in alignment
with the Klingberg et al. (2018) guidelines, which state that assessments should
be able to be undertaken in the corner of a room, or in less than six metres of
space. Again, this guideline was unsupported by evidence in the original article,
however, teaching staff that responded to this questionnaire on the whole
agreed that they had five metres squared worth of suitable space either indoors
(87%) or outdoors (97.9%). It is notable that two of the most psychometrically
sound assessments require more space than this. For the TGMD, over 18
metres of ‘clear space’ is needed for the running task alone, similarly the BOT
requires a space of 18 metres by 4 metres. The MABC would be able to be
completed within the Klingberg et al. (2018) space parameters, however, some
activities require a suitable wall (i.e. even surface, clear of mountings) to be
able to throw a ball against, which may be problematic for some schools. The
final Physical Opportunity question that was asked related to the availability of
another member of teaching staff to aid with FMS assessments. This was
included, as it is likely that for universal screening of FMS to be feasible with
regards to time, assessments will need to be done on a class level. Research
has shown that nearly a quarter of P.E. lessons can be spent on class
management (Bevans et al., 2010), so having additional support to aid

110
behaviour management and speed up the process of assessment may be
beneficial. Only a small proportion of teachers (4.2% of the sample) thought that
this would definitely not be possible. It is, however, conceivable that this may
also relate to social dynamics within the school.
Only one question was asked in relation to social opportunity, because there
was only one aspect of the TDF that aligned with this COM-B category (social
influences). Teaching staff were asked whether they believed that the Senior
Leadership Team (SLT) at their school would be supportive if they wanted to
assess the FMS proficiency of their pupils. A large proportion believed SLT
would encourage such initiatives (86.4%). The backing of new initiatives by SLT
has been found to be crucial for implementation in previous research (Taylor et
al., 2011), so it is promising that teachers believe this new provision would be
supported.
The Reflective Motivation of teachers was generally high, with respondents’
believing that there is a relatively strong benefit to assessing FMS in schools
(with over 65% of the sample selecting 4 or 5 on the scale, and only 5%
selecting 1 or 2), and with 72.5% believing that such assessments would help to
identify children that need additional support. Additionally, a large proportion
said they would be very or extremely likely to assess the FMS of their pupils if
they were given appropriate support. There were, however a number of barriers
identified within motivation, which will be important to address, including that
teachers’ decisions as to whether to assess FMS would likely be influenced by
the opinion of other members of teaching staff in the school (peer influence).
Social dynamics have been found to play a crucial role in both teaching
practices (Supovitz et al., 2010), and the adoption of initiatives in schools, with a
co-designed model suggesting that it will be crucial to have a ‘whole school
ethos’ to enable successful implementation (Daly-Smith et al., 2020).
Additionally, within Automatic Motivation, when teachers were asked whether
implementing FMS assessments in schools would increase workload stress,
over half of the sample believed that it ‘definitely’ (11%) or ‘probably’ (46.2%)
would. This is perhaps unsurprising given the literature detailed above
regarding time pressures in schools (Rudd et al., 2015; Rudgard, 2018).
The results of this study enabled the refinement and improvement of Klingberg
et al.’s original guidelines for feasibility, leading to the following amendments:
(i) assessments should be quick to implement, be that either less than ten
minutes per child, or between 30-60 minutes per class

111
(ii) assessments should only utilise equipment that is readily available in
schools, such as beanbags and chalk, or should provide schools with such
equipment at no additional cost
(iii) space constraints in schools mean that the FMS of children should be able
to be assessed within a small (≤5 m2) space, either indoors or outdoors.
These recommendations, if adopted, will increase the likelihood of the adoption
of school-based FMS assessments long term. There were however three
aspects of the Klingberg et al. (2018) guidelines which were not directly
assessed using this questionnaire: teacher training time, person implementing
the assessment and the type of assessment tool. Klingberg et al (2018)’s
original guidelines state that teaching staff should be able to run the
assessment, with less than half a day of training. To enable universal screening
in schools on a regular basis (e.g. annually), it will be essential that
assessments can be done ‘in house’ without outside guidance from researchers
or healthcare professionals, and these results also showed that teachers would
likely be able to access additional support for such assessments. Given time
constraints within schools, and the pressure on workload stress that teaching
staff believed that assessing FMS in schools would bring about, this guideline
should be considered sensible. Two of these guidelines can therefore updated
with the following modifications:
(iv) assessments should be implementable by two members of teaching staff
(v) teaching staff should require minimal training to enable them to assess the
FMS of their pupils (maximum of half a day).
It is important to note that none of the three assessment tools found to have the
strongest psychometric properties (TGMD, BOT & MABC) meet these criteria,
as they are all designed to be implemented by researchers or trained healthcare
professionals, who have had substantially more training.
With regards to the type of assessment used, Klingberg et al. (2018) state that
school-based assessments should be product-oriented (e.g. MABC and BOT),
as process-oriented measures (e.g. TGMD) can have poor inter-rater reliability,
citing one study (Barnett et al., 2014). The authors then infer that this may mean
that training will take longer. Chapter 2, however, showed that ten out of fifteen
studies that tested inter-rater reliability for the TGMD found excellent results,
four found ‘good’ reliability and only one found ‘moderate’ evidence. On the
other hand, it is notable that these studies did not evaluate the inter-rater
reliability of novice scorers, which teachers would be. Due to the lack of clarity
around this point, it is therefore important to further consider the advantages

112
and disadvantages of both types of assessment type before declaring which is
the most suitable for use to universally screen FMS ability in schools.
Although both types of assessment measure FMS, they measure it in very
different ways. Product-oriented assessments measure the outcome of FMS, for
example how far a child can run in ten seconds, whereas process-oriented
focus on how FMS are executed, based on a pre-defined set of expert
movement patterns, such as whether a child’s knees are at a ninety degree
angle to the floor when running. Herein lies the main difference, the focus;
function versus form. Klingberg et al. (2018) argue that training for process-
oriented assessment may therefore take longer, due to the teachers needing to
have a comprehensive understanding about each of the specific phases of all
FMS to enable them to make real-time subjective decisions about whether the
child is adhering to pre-set criteria relating to ‘proper form’. This is likely true,
but process-oriented assessments do provide more information about the
specific problems children have with FMS.
Despite this, the level of knowledge it requires teaching staff to have is
potentially too great, given that there is a paucity of specialist P.E. teachers in
the UK (Ofsted, 2013). Furthermore, the general lack of knowledge about what
FMS are, as demonstrated by the results in this chapter, suggests training
teachers to this level of understanding could require substantial additional
investment. It is, important to also consider the purpose of universal screening
in schools, which would be to help identify children that are struggling with FMS,
who would be under-identified through current referral routes, and thus may
struggle to lead a healthy and fulfilling life. For a child to be able to participate in
physical activities, they do not necessarily need to be able to follow expert
movement patterns. For example, to enable a child to play catch with their
friends, they need to be able to throw to a target and move their hands in space
to receive the ball back, both of which can be measured using product-oriented
measures. It does not matter for participation how a child is completing those
movements. Finally, it is noteworthy that product and process oriented
measures do not correlate very well (see Chapter 2), and that they in fact tell us
different things about motor development (True et al., 2017).
As NHS services also tend to use product-oriented measures (namely the
MABC) to assess motor difficulties, it would therefore be sensible for screening
tools to also be product-oriented (i.e. would highlight similar children as having
difficulties). In turn, this would potentially reduce the burden that children sent to
healthcare services to receive more comprehensive evaluations of their
difficulties from already stretched services. For this reason, the final feasibility

113
criteria proposed in this thesis concurs with Klingberg et al.’s original guideline
that:
(vi) school-based assessments of FMS should be product-oriented.
Considering the six feasibility criteria outlined above, it is clear that none of the
three most psychometrically sound FMS assessments (as identified in Chapter
2) are feasible for use within universal screening programmes of FMS ability in
schools. The TGMD meets none of these guidelines, and the BOT and the
MABC only meet one (type of assessment) or two (space requirements and
type of assessment) respectively. There were 4 other product-oriented
assessment tools identified in the systematic review (Chapter 2) that had some
level of evidence to support their psychometric properties: the AST (Hoeboer et
al., 2016), the FMS Polygon (Žuvela et al., 2011), the KTK (Kiphard & Schilling,
2007; Kiphard & Shilling, 1974) and the MOT 4-6 (Zimmer & Volkamer, 1987).
Three of the assessments don’t include one aspect of FMS, either object control
(KTK) or balance (AST and MOT 4-6), which makes it difficult to justify their use
in schools, particularly given the limited evidence to support their psychometric
properties even without the addition of these skills. Additionally, the MOT 4-6 is
most often used in pre-school, so falls outside the remit of screening in Primary
schools. Finally, there was only one study evaluating the FMS Polygon, which
had a low study quality rating (Žuvela et al., 2011). Moreover, the FMS Polygon
only assesses speed of movement, rather how well the movements are
performed, which arguably limits the value of the results obtained by the
assessment. Finally, it is important to emphasise that none of these
assessments meet all six criteria outlined in this chapter. It is therefore
impossible to recommend any pre-existing measures of FMS for use in school-
based screening programmes. Instead, it is evident that a new, purpose-made
assessment will be required to ensure feasibility, and therefore increased
likelihood of uptake, to enable all children have an equal opportunity to receive
support for FMS difficulties.
Moreover, in order to improve the chances of schools universally screening
pupils’ FMS ability, it will be vital for any new assessment tool to address the
barriers that were identified in this chapter. The Behaviour Change Wheel
(Michie et al., 2014) offers a unique opportunity to pair barriers to initiatives with
behaviour change techniques, and thus provides a great platform to understand
how assessments can be designed to match the constraints of the school
environment. The first barrier identified was with regards to Psychological
Capability, in that there was a lack of knowledge amongst teaching staff about
what exactly FMS are and the wide-ranging impacts these skills have on other
aspects of childhood development (Barnett, Stodden, et al., 2016). It was also

114
evident that, generally, FMS are not included within teacher training
curriculums. The benefits of training could be seen throughout responses, as
those with prior training were more likely to already assess FMS in schools and
think that there would be time available to spend two hours at the start of the
school year assessing the FMS of their pupils. When considering shortcomings
in Psychological Capability (COM-B) or knowledge (TDF), the Behaviour
Change Wheel (Michie et al., 2014) recommends education and training
interventions. In addition, behaviour change techniques are also suggested to
be included within education and training interventions to facilitate their
success, including adding objects to the environment to facilitate the
performance of the behaviour (assessing FMS). One example of this would be
developing a manual for teachers to help them retain information from the
training session. Providing additional “take home” resources, such as manuals
has previously been found to be highly effective for teacher-led FMS
interventions when used alongside face-to-face training (Brian et al., 2017).
Additionally, teachers should be given information about the health
consequences of having poor FMS in childhood including higher physical
inactivity in childhood (Jones et al., 2020; Logan, Robinson, Getchell, et al.,
2014; Xin et al., 2020) and throughout the lifespan (Sacko, 2020), as well as low
levels of fitness and higher incidence of overweight and obesity (Cattuzzo et al.,
2016). It is therefore clear that for any school-based FMS assessment to be
successful, it will need to include comprehensive, but concise (less than half a
day) training for teaching staff.
The two remaining barriers to school-based assessments that were identified
fell within motivation – workload stress and peer influence. Workload stress falls
within Automatic Motivation (COM-B) and Emotions (TDF). For such
categorisations, the Behaviour Change Wheel (Michie et al., 2014) suggests
similar interventions; modelling (providing an example of what to aspire to) and
persuasion (inducing positive feelings to stimulate action). The paired behaviour
change technique to improve the likelihood of the success for these intervention
is social support. One way this could be achieved is through the use of face-to-
face group training, to help create an understanding of FMS within the school
environment and how, teaching staff collectively, can play an important role in
identifying children with difficulties. This may play a particularly important role
within schools that do not have specialist P.E. teachers, which is the case in
many schools in the UK (Ofsted, 2013). This group-based approach may help
them lean on each other for support when learning new concepts. Additionally,
research has shown that having senior leadership support new initiatives within
schools is beneficial to teachers’ training and development (Taylor et al., 2011),

115
so having SLT present for training may prove crucial. Finally, to ensure that
social and emotional support is available to teachers implementing FMS
assessments, schools should be encouraged to set up an ongoing support
network, which provides a safe place for teachers to highlight concerns and
discuss strategies. Research has shown the importance of using a whole school
approach to promoting and sustaining new initiatives within schools (Daly-Smith
et al., 2020), so ensuring teachers have ample support, from all levels within the
school, will be crucial.
Therefore, alongside the guidelines for feasibility outlined within this chapter,
school-based assessment tool should also consider utilising the following
behaviour change interventions and techniques to increase the likelihood of
being acceptable, and therefore utilised in schools: (a) training should be done
face-to-face, with SLT present; (b) manuals should be provided to schools to
encourage an understanding of FMS and their importance, as well as act as a
prompt on how to accurately implement and score the activities within the
assessment; (c) teachers should set up a network of support to share
experiences, ease workload stress and encourage a healthy working
environment. For an overview of barriers and facilitators to school-based
assessments, as well as their paired behaviour change techniques, see Figure
12.
3.4.1 Limitations
It is important to recognise that questionnaires are subject to response bias. In
particular, the way in which the survey in this chapter was advertised may have
had an impact upon the type of participant that responded. Specifically, this
questionnaire was advertised through social media. The first issue related to
this is that the demographic span on such sites is generally not conducive to all
ages, and thus tends towards recruiting younger participants. This was evident
in this study, as over 60% of participants were aged between 18 and 35 years
old. Additionally, an individual’s personality traits can influence their use of
social media site, with research demonstrating that Facebook users are often
more extrovert and agreeable than general internet users (Rife et al., 2016).
Moreover, it is known that it is difficult to verify people’s identities on social
media sites (King et al., 2014), so although the adverts were placed on teacher
groups on Facebook, to be accepted into these groups, all you need to do is
write a brief description of your teaching experience, which could easily be
fraudulent.
On the other hand, it is thought that the benefits of recruiting online, including
the likelihood of gathering more data, outweigh these limitations (King et al.,

116
2014). Additionally, research has shown that online research can yield similar
results to face-to-face studies with the same parameters (Casler et al., 2013).
The questionnaire was also advertised locally, through Bradford Schools
Online, a website through which schools in the Bradford District area receive
news. Targeting this group could have potentially led to bias, as Bradford as a
location poses somewhat unique challenges to its schools. For example it has
some of the richest and poorest neighbourhoods in the country, as well as an
eclectic mix of cultures and ethnicities (Dickerson et al., 2016). However,
location data was gathered when participants completed the questionnaire, and
only 12% of responses were from the Bradford area, so it is likely that there was
a wide enough range of responses to mitigate for these biases.
In addition to this, the questionnaire was optional, and it is therefore likely that
those willing to participate had some interest in FMS or motor skills, and their
assessments in schools prior to taking part. This could mean that the responses
gathered may be more positive than the views of teaching staff more generally.
Moreover, this questionnaire was incentivised, teachers were entered into a
prize draw to win one of three Amazon vouchers. Research has shown that
incentives are effective in increasing the response rate (Laguilles et al., 2011),
and that incentives similar to those used in this study do not impact upon study
quality (Toepoel, 2012). However, it is important to note that women are more
likely to respond to online questionnaires with incentives than men (Becker et
al., 2019; Boulianne, 2013), which was evident in this study with 92.9% of the
sample identifying as female. It is, however difficult to ascertain whether this is
disproportionate in relation to the gender split in primary school teaching, as
there is limited published information about this.
There were also a number of limitations to the questionnaire itself. One example
of this is that it was not possible to truly measure the physical capability of
teachers, as their skills were not able to be evaluated. Physical Capability
questions therefore related to teachers’ perceived capability to demonstrate and
assess the skills outlined in the questionnaire. Research has shown that young
adults (a large proportion of the sample in this questionnaire) are no more
accurate than young children when evaluating their own competence (De
Meester et al., 2020), and thus, it is possible that teachers’ over-estimated their
ability levels. It will therefore be imperative that training sessions be
comprehensive, to ensure that teachers have the understanding and ability to
run FMS assessments effectively. Secondly, teachers were not given a detailed
description about what was meant for each of the FMS when they were asked
to rank how able they would be to demonstrate and assess them. One example
of this is hopping, it was not specifically stated whether this meant single leg

117
hopping, and it is possible that this question was misconstrued to mean bunny
hopping.

118
Figure 12 - The barriers and facilitators to school-based assessments, and the paired behaviour change techniques to improve the uptake of universal screening in schools.

119
Thirdly, this questionnaire did not include any questions regarding the extent to
which teachers would be able to interpret the outcomes of FMS assessments.
This was not included for a number of reasons. Firstly, this parameter was not
within the Klingberg et al. (2018) feasibility guidelines and secondly, the
outcomes of different assessment tools vary massively, and thus it would be
difficult to measure this. Despite this, it will be crucial for any school-based
assessment to ensure that teachers are equipped to understand and respond to
the results they may obtain. Finally, the validity and reliability of this
questionnaire was not tested prior to its use in this study. However, the
research team piloted the questionnaire to ensure that everything worked as it
was supposed to, and all questions were discussed at length amongst the team
to ensure that they were theoretically driven, relevant for teachers and aligned
with both FMS and behaviour change literature.
3.4.2 Conclusion
The results from this online questionnaire confirmed a large appetite for FMS
assessments in primary schools. However, currently, such assessments are not
commonplace. It is likely that the lack of action relates to a lack of capacity
within schools to assess FMS using current measures due to time, equipment,
space and monetary constraints along with social and workload pressures. A
new assessment tool is therefore needed, to enable the implementation of
universal screening in primary schools within the UK. Based on the results of
this questionnaire, the recommendations that need to be adhered to in the
development of such a new measure are as follows:
(i) assessments should be quick to implement, be that either less than ten
minutes per child, or between 30-60 minutes per class.
(ii) assessments should only utilise equipment that is readily available in
schools, such as beanbags and chalk, or should provide schools with such
equipment at no additional cost.
(iii) space constraints in schools mean that the FMS of children should be able
to be assessed within a small (≤5 m2) space, either indoors or outdoors.
(iv) assessments should be implementable by two members of teaching staff.
(v) teaching staff should require minimal training to enable them to assess the
FMS of their pupils (maximum of half a day).
(vi) school-based assessments of FMS should be product-oriented.

120
It will also be essential for any new assessment tool to utilise the following
paired behaviour change techniques to help overcome the barriers identified in
this study:
(a) face-to-face training with SLT present
(b) teachers should be provided with informative and easy to use manuals
(c) teachers should be encouraged to set up a network of support.

121
Chapter 4
Development of FUNMOVES
4.1 Introduction
Chapter 3 established that none of the pre-existing FMS assessment tools are
feasible for use by teaching staff in schools, which limits their utility for universal
screening programmes. In addition, those which were more feasible for use in
schools did not have strong psychometric properties to support their use in
these settings (as seen in Chapter 2). It was therefore evident that a new
assessment tool would need to be developed if universal screening in schools is
going to become a reality.
Chapter 2 established the importance of validity and reliability for tools that are
going to be used in such scenarios. One psychometric property that is crucial to
evaluate during the initial development of an assessment tool is structural
validity. Structural validity refers to the extent to which an assessment tool
measures what it was designed to measure. It is crucial that school-based FMS
assessment tools measure all relevant domains of FMS for a number of
reasons. Firstly, as the P.E. curriculum within the UK focuses on FMS ability in
Key Stage One (Department For Education, 2013), the activities need to
actually measure FMS for teachers to be able to make meaningful inferences
about pupils’ abilities in this aspect of the curriculum. Secondly, it is important
that the activities will pick up children with difficulties with FMS, and not other
problems, so that the support given to children afterwards is appropriate and will
help them lead a healthy and fulfilling life. Referring the wrong children to
physiotherapists and occupational therapists will only increase the pressure on
these services which are already under pressure (Finch, 2015).
There are two main ways that structural validity can be measured: (i) Classical
Test Theory (CTT) or (ii) Item Response Theory (IRT). Historically, CTT has
been used more frequently and is thought to be the more simplistic of the two
methods (Progar et al., 2008). In CTT the observable difference between
children’s FMS scores on an assessment tool would be assumed to be caused
solely by individual differences in FMS abilities (Magno, 2009). CTT is often
referred to as ‘true score theory’ for this reason. CTT analyses work under the
premise that any external variables are constant or random in their response
variability. In CTT models, the observed score (TO) is comprised of true scores
(T) and error scores (E), which are independent of each other (TO = T + E).

122
Standard error is assumed to be the same across participants within CTT
analysis, and often it is presumed that this error is random, with a normal
distribution (Magno, 2009). This error value is used to evaluate how accurate
the results of an analysis are (Magno, 2009). As it is assumed that assessment
tools are imprecise, standard error values are used to calculate confidence
intervals around the observed score which are then used to demonstrate the
upper and lower bound of the ‘true’ score (Kaplan & Saccuzzo, 1997). CTT
analyses, such as factor analysis, are often used to establish the structural
validity of FMS assessment tools.
There are, however, a number of issues that present themselves when using
factor analysis to establish a case for structural validity. Firstly, to run a factor
analysis it requires a complete dataset. Any missing data has to be either
inputted by indirect methods (e.g. estimation) or incomplete persons or items
data have to be excluded. Doing so blurs sample and item factors, which may
problematic for model fit (Wright, 1996). Secondly, in Exploratory Factor
Analysis (EFA) there is no truly objective way to decide when to stop extracting
factors, and the methodology for this often varies (Wright, 1996), which makes
comparison of studies evaluating the structural validity of FMS assessment
tools difficult. Finally, when the same set of items (i.e. the activities within an
assessment tool) are re-tested on a different sample, the factor sizes and
loadings are very rarely reproduced (Wright, 1996). This is likely due to CTT
analyses being reliant on observed test scores, and thus the results can only be
interpreted for the tested sample under the tested conditions (Hambleton, 2000;
Hambleton & Van der Linden, 1982). Given the well documented “Replication
Crisis” within psychological research (Maxwell et al., 2015), it is more important
than ever to utilise more advanced analyses that can better account for
differences across samples. More generally, there are also a number issues
with using CTT methods to evaluate structural validity. One problem is that
ability scores as measured CTT techniques are solely test dependent, meaning
scores may not be stable over time (Magno, 2009). Moreover, every activity
within a test is thought to have its own true score, even when it is known that
they measure the same or closely related sub-constructs (Hambleton & Van der
Linden, 1982), such as all items within an assessment battery contributing to
the overarching construct of FMS.
In contrast, Item Response Theory (IRT) models are thought to enable stronger
assumptions than CTT (Magno, 2009). IRT approaches do not presume a ‘true
score’ but rather take into account the probability that a child may or may not be
able to perform a skill, such as throwing to a target. Unlike CTT models,
performance on an assessment tool is not presumed to be a ‘true reflection’ of

123
abilities, rather IRT recognises that performance is related to an individual’s
abilities (Anastasi & Urbina, 1997), and thus total test scores are an estimate of
ability, relative to the difficulty level of the activities (Magno, 2009). IRT is also
stochastic in nature, and thus recognises that random disturbances to scores do
occur when collecting data (e.g. scores varying across repeated measurements
on the same individual), so they utilise probabilities instead of true scores
(Hambleton & Van der Linden, 1982). Additionally, IRT approaches provide test
scores based on a model, rather than the test scores dictating the model based
on the observed data, as is seen in CTT analyses (Hambleton & Van der
Linden, 1982).
In fact, in this approach, modelling is started prior to children being tested,
which makes them ideal for use when developing an assessment tool from the
ground up. IRT models provide individual characteristic curves for each activity
within an assessment which outlines the probability of a child being able to
perform a skill (Kaplan & Saccuzzo, 1997). As the emphasis is on individual
activities, and reliability and error measurements are embedded within these, it
provides a strong rationale for choosing certain items over others when trialling
and constructing a new measurement tool (Magno, 2009). Additionally,
invariance of activity parameters means that the results are not reliant on the
sample, so an assessment can be developed that will be applicable across
groups, in a range of settings (Magno, 2009).
One form of IRT which is growing in popularity for developing assessment tools
is Rasch analysis. Rasch analysis was specifically developed to improve the
level of precision when developing new assessments, as well as the monitoring
of the quality of pre-existing measurement instruments (Boone, 2016). The
Rasch model is often described using the vertical line (see Figure 13), in which
the line represents the construct the assessment is trying to measure (e.g.
FMS). Children’s ability levels are represented to the left hand side of the line.
On the right hand side of the line there are three activities plotted, in positions
relative to their level of difficulty, with the harder activities being higher up the
line (such as activity 3). Rasch analysis works on the premise that the
probability of a child being able to perform an activity is a logistic function of
both the child’s ability level and the difficulty of the activity (Magno, 2009). For
an activity that is higher up on the line than the child’s ability level, there is thus
a lower probability of them being able to complete it. For example, in Figure 13,
Joe’s ability level is equivalent to the difficulty level of item two. This means that
he has a fifty percent chance of being able to complete this activity, a higher
probability of completing activity one and a lower probability of completing
activity three. This shared continuum is known as the logit scale (Duncan et al.,

124
2003). Rasch analysis uses the logit scale to assess the psychometric
characteristics of assessment tools (Wright & Panchapakesan, 1969).
Figure 13 – Diagrammatic representation of the logit scale
Rasch analysis is recommended for use when developing a tool from scratch as
it ensures that the activities fit within model parameters (Tennant & Conaghan,
2007). It also avoids the pitfalls of CTT analyses by utilising both raw scores
and rating scale data to calculate ability levels (Boone, 2016). This enables
abilities to be placed on a linear scale, which accounts for the differences in
difficulty levels of activities. Rasch analysis is both a mathematical model
(Rasch, 1960) and theory, and this theory can be applied to help guide
assessment tool development. One of the advantages of using it is that
researchers are required to think in depth about the concept being measured
prior to developing the tool. In essence, it allows you to create a ruler (i.e. the
vertical line in Figure 13), marked by the activities that will compare the FMS
levels of children. To make ‘marks’ on the ruler, activities have to be developed,
but only a limited number of marks can be made. Thus, assessment
development within this theoretical framework requires forethought from
researchers to ensure that activities reflect both (i) a range of ability levels and
(ii) the construct intended e.g. all three sub-components of FMS. The aim, for
optimal measurement is an equal distribution of activities across the length of
the ruler (Boone, 2016). As Rasch theory utilises ordinal data, researchers
developing assessments need to explicitly predict where on the ruler the levels
of each activity will fall, to ensure they are representative of varying degrees of

125
abilities, and that the ordering of levels is hierarchical. Once the tool is
developed Rasch analysis can then be used to test these assumptions.
More precisely, once the assessment tool has been piloted, Rasch analysis
allows the evaluation the difficulty levels of activities to see whether they appear
in the anticipated order. Additionally it also evaluates test invariance, a term that
refers to whether the difficulty level of an activity remains constant for all
children taking the assessment, as well as whether bias is present within an
activity for certain subgroups (Tennant & Conaghan, 2007). One example of this
could be that boys found an activity easier than girls. These two factors
(anticipated order and test invariance) contribute to whether activities within an
assessment tool fit the Rasch model (Boone et al., 2014). There are many
reasons why items may not fit the Rasch model (Wright, 1991). For example,
there may have been an easy activity which high performing children performed
poorly on, unexpectedly, perhaps due to lack of engagement (Boone, 2016).
Activities that don’t fit the Rasch model are likely measuring more than one
variable, thus suggesting that the concept under investigation (e.g. FMS) is
being poorly measured by the assessment. These activities can be
subsequently removed or modified, after having re-visited the underlying theory
to try and find an explanation and solution for their poor fit (Boone, 2016).
Rasch analysis also determines whether an assessment tool’s psychometric
properties permit the summing of raw scores to provide a total outcome score
(Rasch, 1960), something which is often done without a sound psychometric
basis when using CTT models. All of these considerations combined mean that
Rasch analysis is particularly useful when developing an assessment tool from
the ground up.
This chapter therefore aimed to develop a school-based screening tool that is:
(i) built based on strong theoretical (based on findings from Chapter 2) and
psychometric underpinnings (using Rasch analysis).
(ii) feasible for use in school settings by teaching staff (based on the
feasibility guidelines outlined in Chapter 3).
4.2 Study 1
4.2.1 Initial Development of FUNMOVES
4.2.1.1 Establishing a Working Group
In order to develop a new assessment tool, an academic working group was
established. The working group (including Professor Mark Mon-Williams, Dr
Liam Hill, Dr Daniel Bingham, Dr Nick Preston and Jo Atkinson) was carefully

126
convened for their expertise. The group included two psychologists that
specialise in motor development. Moreover, they have relevant experience in
developing a motor skill assessment tool for children that is used widely for
major international programmes of work (e.g. the evaluation of London’s Ultra
Low Emission Zone) (Culmer et al., 2009). One of the group sits on a number of
government groups (including within the UK’s Department for Education) in
order to provide advice on motor skill development in children.
Similarly, the team includes a physiotherapist and an occupational therapist,
who have extensive experience of physically assessing children’s motor ability
as well as a wide range of research experience. This experience includes
designing new assessment tools for motor function (Preston et al., 2018), and
designing and implementing motor skill interventions in a school setting,
including both handwriting (Shire et al., 2021) and FMS. There is also a
behavioural epidemiologist on the team whose expertise is physical activity, but
also has experience of using behaviour change theories to (i) evaluate
interventions (ii) understand barriers and facilitators to new initiatives. All
academics in the working group also have extensive experience working in
schools, and with educational bodies, such as the Department for Education,
which brings knowledge and understanding of: (i) what schools want; (ii) what
would be feasible for schools; and (iii) how initiatives can be best implemented
in these settings.
The working group reviewed and discussed the findings from Chapters 2 and 3,
and used their expertise to contribute to decisions going forwards.
4.2.1.2 Reviewing constructs to be included
All activities developed for FUNMOVES were based on activities included in
previous FMS assessments (identified by the systematic review in chapter 2) in
conjunction with expert opinion (e.g. to address gaps identified). This ensured
content validity and that they were in accordance with the feasibility guidelines
from Chapter 3. FUNMOVES was therefore designed to measure the outcome
of movements (i.e. product-oriented) using minimal resources that are
commonly found in schools, within a small space (<5 metres squared).
To ensure that a whole class could be tested in under an hour, the working
group decided that multiple children would have to be able to be tested on the
activities simultaneously, by two members of teaching staff who have had a
short training session prior to testing. Finally, it was decided that for all
activities, the first ‘level’ should be achievable by all children, so that the self-
efficacy and motivation of children with poorer motoric abilities was not
challenged from the outset, to promote sustained engagement.

127
Chapter 2 established the three most commonly measured aspects of each
sub-group of FMS within current assessment tools were: running, jumping, and
hopping (locomotion skills); throwing, kicking, and catching (object control
skills); as well as static balance, walking heel-to-toe and walking along a beam
(stability skills). The working group decided this would be the initial pool of
activities to discuss including, as it was large enough to be comprehensive but
not too large that the assessment would take too long due to time constraints in
schools.
There were a number of assessment tools highlighted in the systematic review
that evaluate product-oriented outcomes for running including the BOT
(Bruininks, 1978; Bruininks & Bruininks, 2005), FMS Polygon (Žuvela et al.,
2011), and the Stay in Step Screening Test (Department of Education Western
Australia, 2013), all of which utilised a timed shuttle run. The working group
wanted to ensure that the running activity was not solely reliant on speed and/or
other biological factors. Firstly, it was decided that this activity should be
completed over a short timeframe (15 seconds) so that fitness does not have
too much of an impact upon children’s performance. Secondly, emphasising
agility within this task would also increase the feasibility of the running activity
for school-use as it requires less space than a straight-line sprint. It was
therefore decided that children should be evaluated on their agility (ability to
speed up, slow down and change direction whilst maintaining balance), which is
noted as a key aspect of the primary school P.E. curriculum (Department For
Education, 2013).
For both jumping and hopping, activities were measured in similar ways by pre-
existing product-oriented measures. Some assessments used the time taken to
complete an obstacle course by hopping or jumping, including the AST and the
FMS Polygon (Hoeboer et al., 2016; Žuvela et al., 2011). Others used distance
jumped/ hopped, such as the FMS test Package (Adam et al., 1988; Kalaja et
al., 2012) and the Stay in Step Screening Test (Department of Education
Western Australia, 2013) or counted the number of jumps/hops completed,
either with obstacles e.g. KTK (Kiphard & Schilling, 2007; Kiphard & Shilling,
1974) or without e.g. the MOT 4-6 (Zimmer & Volkamer, 1987). Finally, the
MABC (Hendersen et al., 2007; Henderson et al., 1992) utilised jumping and
hopping to target locations. As the focus on distance and quantity are likely to
be more impacted by muscular strength than hopping to a target location, the
working group decided to utilise a similar methodology to the MABC for these
tasks.
For throwing and kicking, previously used activities exhibited similar themes to
hopping and jumping, in which one focused on the number of throws/kicks in a

128
given timeframe (Department of Education Western Australia, 2013), others
scored children by the time taken to complete specific throwing/kicking tasks
(Hoeboer et al., 2016; Zimmer & Volkamer, 1987; Žuvela et al., 2011) and the
MABC (Hendersen et al., 2007; Henderson et al., 1992) evaluated the
accuracy. For example, the number of beanbags that could be thrown to a
target location. As distance thrown/kicked would require space larger than 5 x 5
metres (as per feasibility guidelines) the working group decided not to use this
method for assessing throwing and kicking. In addition, for a child to participate
in physical activity at a non-elite level, the speed at which they can throw/kick
was not judged to be the most important factor. Moreover, research has
suggested that propelling an object to a target may be more complex than
propelling an object for distance as it requires integration of visual information
(about the target) with a physiological response which matches the height,
angle and speed of the object required upon release (Valle et al., 2018). For
these reasons, the object manipulation tasks developed for FUNMOVES were
designed to focus on accuracy, as it is likely to provide more information
regarding potential problems with the sensorimotor system. Most pre-existing
assessments use over-arm throwing, however, this is conducive to needing
more space. Consequently, the working group decided to focus on under-arm
throwing for FUNMOVES.
The working group had a long discussion about catching, as this skill was
included in all assessment tools found to measure FMS in the systematic review
(see Chapter 2). This was measured in a similar way to throwing and kicking for
most assessment tools. However, the difficulty with catching is being able to
standardise the presentation of the ball/ object the child is asked to catch. In all
assessment tools, the difficulty of catch that children had to make was highly
dependent on either their peers, a researcher, or how well they could throw to a
wall at an appropriate height for the rebound to be catchable. The working
group discussed ways to standardise the difficulty level of catches, including the
possibility of balls or beanbags being dropped from height instead of thrown.
Ultimately though, all solutions that were thought of would require either a lot of
equipment, or would need a larger staff to student ratio than is normally present
within a standard classroom or P.E. lesson, thus making the inclusion of such
an activity unfeasible in respect to the guidelines developed in Chapter 3. For
these reasons, the working group decided to omit catching from FUNMOVES.
Stability skills were grossly under-represented within pre-existing assessments
of FMS. Of the assessments which included these skills, many used time as the
outcome, for example how long a child could hold a balance, or how far a child
could walk along a beam. The KTK (Kiphard & Schilling, 2007; Kiphard &

129
Shilling, 1974) also utilises the number of steps a child can take along a beam.
Firstly, the working group wanted to ensure that any balance tasks didn’t require
additional equipment that schools might not have. For this reason, beam
walking was not included in FUNMOVES. To incorporate a dynamic balance
that posed similar functional challenges to the child, the working group decided
to include walking heel to toe along a line. This activity is used within the MABC
(Hendersen et al., 2007; Henderson et al., 1992), and was included in
FUNMOVES because such lines could be drawn using chalk, a commonly
found resource in schools, as seen in Chapter 3. Alternatively, pre-existing lines
in school halls could be utilised. The working group also wanted to include a
form of static balance, however they did not believe that time was an
appropriate outcome measure to use to assess this skill for a number of
reasons. Firstly, if the outcome was the time a child could hold a balance for, it
was possible that the task could take a long time. Secondly, if time cut-offs were
applied, it was thought that this would be too arbitrary, with limited research on
developmental norms for different balance poses. The definition of static
balance was discussed, and the working group agreed on ‘the ability to maintain
control of the centre of gravity in relation to the base of support’ (Shumway-
Cook & Woollacott, 2007). It was therefore decided that static balance activities
should require participants to shift their centre of gravity whilst maintaining a
balanced position. Consequently, a novel static balance activity was developed
that fitted with the feasibility guidelines outlined in Chapter 3.
4.2.1.3 The Grid
To ensure that a whole class could be tested within an hour, the working group
decided that multiple children should be able to be tested on the activities
simultaneously. A number of assessment formats were therefore trialled by the
research team, before a five metre squared grid marked out into 25 x 1 metre
squares was found to be the most promising option for conducting FUNMOVES
activities (see Figure 14). This grid allows a class of 30 children to be split into
five ‘teams’ (6 children per team, with one team per five metre ‘lane’). Using the
grid, five children (one from each team) can then be tested simultaneously on
each of the activities in turn.
All activities were designed to be implemented within this five metre squared
grid (see Figure 14), to fit within space guidelines for schools (Klingberg et al.,
2018), and enable the testing of five children simultaneously (one per vertical
‘lane’).

130
Figure 14 - Diagrammatic depiction of the grid used for FUNMOVES activities, including dimensions
4.2.1.4 Running
Children had fifteen seconds to run from the first line on the grid, to the last line
on the grid, and back, as quickly as possible, repeatedly within the time limit
(see Figure 15). Both lines must be touched by a foot before turning. When the
teacher shouts ‘STOP’, children were required to sit down facing the way they
were running. The teacher scored this activity by the number of ‘full lengths’
each child has run (from one side of the grid to the other), and the box they are
sat in (written on the floor on the side of the grid). These scores allowed running
to be converted to the number of metres run, which was used for analysis. In
the case that a child was sat on a line between two boxes, they were marked as
being in the box before (based on their direction of travel).

131
Figure 15 - Diagrammatic depiction of the running activity in FUNMOVES version 1
4.2.1.5 Jumping
When the teacher says ‘GO’ children jump with their feet together (as many
times as necessary) from the bottom of the grid to reach the next horizontal line.
Children should try to land with both feet together on the line, stop and balance.
Once all children reach the line, the teacher counted to three out loud, and then
set the group off jumping to the next line, where the process was repeated all
the way to the far side of the grid (see Figure 16). Jumping was scored by the
box where each child could no longer complete the activity as requested, for
example, falling, not keeping their feet together and/or pausing not on the line.
In the case of a child losing balance whilst pausing on the line, the teachers
scored them as completing the activity up to the box prior to the line upon which
they lost balance. Children that completed the activity and managed to balance
on the back line received a score of 6.

132
Figure 16 - Diagrammatic depiction of the jumping activity in FUNMOVES version 1
4.2.1.6 Hopping
Hopping was performed in the same way as the jumping activity. Children
completed this activity twice, hopping once on their left, then once on their right
leg. The criteria for scoring children was similar to the jumping task, except the
“disqualification criteria” of jumping without their feet together was replaced by
children putting their raised foot down whilst hopping or balancing on the line.
4.2.1.7 Throwing
Children threw five beanbags (underarm), one at a time, aiming to get one
beanbag in each box within their lane (see Figure 17). Children completed this
activity twice, once with their left arm and once with their right. Throwing was
scored by the number of boxes in each child’s lane in which they had managed
to land at least one of their beanbags. Beanbags which touched a boundary
line, but did not cross it were counted towards the child’s score (see Figure 18).

133
Figure 17 - Diagrammatic depiction of the throwing activity in FUNMOVES version 1
Figure 18 - a diagram explaining the rules of scoring for throwing task. The top right beanbag is counted as it is touching but not crossing the line. The two beanbags on the left are crossing the outside edge so would not be counted.

134
4.2.1.8 Kicking
The kicking activity was performed and scored in the same way as the throwing
activity, except children kicked the beanbags along the floor on two occasions,
once using their left and the other using their right foot.
4.2.1.9 Balance
Children were asked to pass a beanbag around their body, three times, whilst
holding five different balance positions (see Figure 19). The balance positions
assessed were: standing with feet shoulder width apart, standing with feet
together, standing on one leg (right), standing on one leg (left) and standing on
one leg (of their preference) with eyes closed. Children were assessed as to
whether they held each balance position (yes/no) for three full rotations of the
beanbag without dropping it. They were also “disqualified” on the fifth balance
position if they opened their eyes during this balance.
Figure 19 - a demonstration of passing a beanbag around the body in balance position three
4.2.1.10 Walking along the line
Children walked heel-to-toe along the left hand edge of the grid, which had half
metre markings made along it (see Figure 20). The activity was scored by the
zone (1-10, marked on the floor with the grid) where children could no longer
complete the activity as requested, this included stepping off the line and
walking with a gap between their feet when walking. Children that completed
the activity without any such errors were awarded a score of 11. One child at a
time was assessed for this activity.

135
Figure 20 - Diagrammatic depiction of the walking along the line activity in FUNMOVES version 1
4.2.2 Methods
4.2.2.1 Participants
Sample size estimates were calculated in alignment with guidelines for Rasch
measurement (Linacre, 1994). In order to have 99% confidence that items are
calibrated within 0.5 logits, a minimum of 150 participants needed to be
recruited. Three hundred and thirty one children (181 male, 150 female) from
Reception to Year 6 from one Bradford primary school subsequently
participated (m age =8.33 years, SD= 2 years). One class teacher responsible
for the testing of a Year 1 class lost their data, so this could not be included in
the analysis. Opt-out parental consent was gained prior to testing, and all
children assented on the day. Before testing, teachers were asked to identify
any children that they believed had motor difficulties. Across the seven year
groups, teachers identified twenty-three pupils. This study, and the subsequent
studies in this chapter were granted ethical approval by the University of Leeds
School of Psychology Research Ethics Committee (reference number: PSC-
591).

136
4.2.2.2 Design
This study was observational in nature, whereby data was collected on
participant performance on FUNMOVES. Additionally, researchers collected
data on how accurately teachers implemented each of the activities to assess
implementation fidelity.
4.2.2.3 Materials
Teaching staff were given a manual (see Appendix E for the version used in
Study 3), in which there was a description of how to run and score each activity.
Additionally, the manual also detailed the importance of FMS for childhood
development. Inclusion of this material was suggested as a solution to barriers
to teacher-led FMS assessment that may exist within schools (see Chapter 3).
Teachers were also provided with response sheets to fill in for their class during
testing (see Appendix F for the version used in study 3). The equipment used to
deliver the first iteration of FUNMOVES were: electrical tape, a stop watch, and
75 beanbags (25 per grid, as the school decided to test multiple classes
simultaneously). A fidelity checklist was used to evaluate how well teachers
were implementing FUNMOVES (see Appendix G). The fidelity checklist
required researchers to observe teachers implementing FUNMOVES and make
a judgement on how often each teacher correctly explained, demonstrated and
scored each activity- ‘never’, ‘sometimes’ or ‘always’. Judgements were made
based on the rules stipulated in the Teacher Manual. The checklist also had
space for qualitative observations, in which researchers could note any issues
observed with specific activities, and anything that teachers did particularly well.
4.2.2.4 Procedure
All teachers and teaching assistants that were going to be involved with testing
attended an hour long training workshop before testing commenced. During this
workshop, researchers gave a brief overview on why measuring FMS is
important and the role schools can play in this. Teachers then role-played
framing and scoring each activity in an interactive session. Teachers were told
that children would not be permitted to practice any of the activities.
Researchers encouraged teaching staff to ask questions throughout, and
provided them with contact details so that any queries could be answered prior
to testing. At the end of training, class teachers were given response sheets
and advised to group their class in fives by perceived ability prior to starting the
assessment, as well as filling out the demographic information for these groups
on the response sheet prior to testing (see Figure 21 for an example of the

137
response sheet). Demographic information was requested for use in later
analyses.
Testing was completed over three days, in which three grids were set up across
the two sports halls so that three classes could be tested at once. Each grid
required at least one teaching assistant to be present to help the class teacher
to score the activities and manage the participating pupils. For each class,
children were lined up in groups of five (pre-determined by the class teacher
based on ability), with their lane on the grid corresponding to their relative
position on the class teachers’ score sheet. Prior to children participating in
each activity, teachers verbally explained and physically demonstrated the
activity. All participants completed one activity before the next was explained,
demonstrated, and tested. Researchers observed the testing of all classes, and
an implementation fidelity checklist was filled out for each class. The school
were debriefed after testing, in the form of an individual report for each child
which detailed how they performed compared to the rest of their year group on
each activity, calculated using percentile rank.
Figure 21 - an excerpt from the response sheet detailing the demographic information to be completed for each child prior to testing
4.2.2.5 Analysis
Rasch analysis was used to measure the structural validity of FUNMOVES. The
analyses in this study were run using the unrestricted partial credit model in
RUMM 2030 software, because responses varied between items (Masters,
1982). The analyses generate summary statistics including mean person and
item locations, and a chi squared test indicating fit to the Rasch model. A

138
perfect fit to the Rasch model would mean residual values for items and
persons (z-standardised) of 0, with a standard deviation of 1; positive mean
residuals would indicate that items were under-discriminating between abilities.
Inversely, negative values would indicate the assessment tool may be over-
discriminating (Hammond et al., 2018). A non-significant chi-square value would
indicate no difference between scores expected by the model and those
observed in testing, and would suggest that items were measuring consistently
across different ability levels. For example, a person at 4/6 on the logit scale
should have been able to successfully complete the easiest three ‘levels’ of an
activity, with a 50% chance of being successful on the fourth most difficult level,
and their ability should have been consistent across activities (Andrich, 1985).
Internal consistency values are also calculated using the Person Separation
Index (PSI). An assessment tool which has the ability to differentiate between
two or more groups of ability should have a PSI value of ≥0.7 (Fisher, 1992).
Unidimensionality refers to extent to which all of the items within an assessment
measure one over-arching construct, i.e. FMS. Unidimensionality was assessed
using principle component analysis which identified the two most divergent
subsets of items within the first factor (Tennant & Conaghan, 2007). Person
estimates for each of the two sets of items were calculated, and differences
between these estimates were assessed using t-tests. For a measure to be
classified as unidimensional, no more than 5% of all tests should be significant,
or the lower bound of the binomial confidence interval should be less than 5%
(Andrich, 1985).
Analyses for individual items included fit to the Rasch model (measured using
chi-squared and fit residuals), response category thresholds, item response
bias (Differential Item Functioning- DIF), and response dependency. Item fit
explores the extent to which each of the items fit within the expectations of the
Rasch model. This analysis used ANOVAs to evaluate whether there was a
statistically significant difference between class intervals. Items which do not
deviate from Rasch model expectations should be non-significant (when using
using Bonferroni adjustment), thus achieving the criteria required for an
outcome to measure ability on a linear (interval) scale (Newby et al., 2009). Fit
residuals of ≤ -2.5 would indicate an item is over-discriminating, and may be

139
redundant, and conversely a fit residual of ≥2.5 would suggest an item is under-
discriminating and measuring a different construct.
Response dependency refers to a form of misfitting in the Rasch model
whereby a person’s score on one item has a bearing upon their performance on
another item, which introduces redundancy to the scale. Dependency can have
an impact upon the relationship between all items as well as unidimensionality
(Marais & Andrich, 2008). Correlations between item residuals were used to
assess local dependency. The threshold for dependency between items is the
average item residual +.2 (Chen & Thissen, 1997). Response category
thresholds explored the extent to which each ‘level’ of scoring was represented
by a different level of ability within the sample. Thresholds refer to the point on
the logit scale between two different scores. Participants falling at a threshold
point on the logit scale should be equally likely to obtain either score. Figure 22
shows an example of ordered thresholds, in which participant ability (logit
scores) follow a logically progressive order, whereby the higher a person’s
ability is, the more likely it is that they will obtain a better score on an activity.
Disordered thresholds occur when scoring categories do not progress in a
logical order.
Figure 22 - a category probability curve showing an example of ordered thresholds for scoring. The dotted lines indicate the threshold between scoring categories
In Figure 22, the x axis refers to the logit scale (the shared scale for person
ability and task difficulty). Zero on the logit scale indicates ‘average’ ability.
Children who perform below average on activities within an assessment tool will
be placed lower down the logit scale (i.e. into the minuses). Similarly, the easier
a scoring threshold is to achieve, the further left on the logit scale it will appear.

140
The y axis represents the probability that a child can achieve scoring
categories. On Figure 22, you can see that a child who is between -8 and -3 on
the logit scale, is never more likely to score 1 than 0, and thus it is highly
probable that they will score 0 on the task. Children at -2.5 on the logit scale fall
at a scoring threshold (pictured on Figure 22 as a dotted black line), which
means that a child is equally likely to achieve either score. Children with this
ability level (-2.5 on the logit scale) will therefore have a 50% chance of
achieving 0 or 1 on the activity.
DIF is another factor which can introduce mis-fitting into the model. DIF was
evaluated using an ANOVA to assess whether FUNMOVES measured
consistently between year groups. There are two forms of DIF (1) uniform DIF
and (2) non-uniform DIF. Uniform DIF occurs when one group is consistently
achieves higher scores than another. When inconsistencies in the differences
between groups occur then non-uniform DIF is found.
Rasch analysis is thought to be a more accurate and comprehensive at
measuring construct validity than factor analysis (Wright, 1996) and has been
used previously to validate measures of motor skill (Avery et al., 2003; Bardid,
Utesch, et al., 2019; Chien & Bond, 2009; Utesch et al., 2016; Wuang et al.,
2009). In the case that FUNMOVES was multidimensional or had response
dependency, items were removed. To ameliorate disordered thresholds, two or
more adjacent categories may be combined. To evaluate the external validity of
FUNMOVES, an ANOVA was conducted using mean logit scores to see
whether there were significant differences between school year groups, and
whether or not teachers thought each child had motor difficulties prior to testing.
4.2.3 Results
4.2.3.1 Implementation Fidelity
Table 19 provides an overview of the clarity of teacher instructions,
demonstrations, and their accuracy in scoring. The most problematic items to
score were static balance and walking along the line, for which teachers only
scored the activity correctly 38% and 30% of the time respectively. As indicated
in Table 20, for these items researcher notes suggested comprehension (both
children and teacher) and ability (child only) issues with delivering these items.
Additionally, for the jumping and hopping activities it was apparent that the way
children were doing the activity was not standardised, and that some children

141
were doing multiple small jumps/hops between the lines, whilst others were
doing one big jump/hop from line to line (making the activity more difficult).
Table 19 – Teacher Implementation Fidelity for Study 1
Activity Aspect of
Activity
Teachers
that never
implemented
it correctly
(%)
Teachers
that
sometimes
implemented
correctly (%)
Teacher that
always
implemented
it correctly
Running Instructions 0 15 85
Demonstration 0 15 85
Scoring 0 23 77
Jumping Instructions 0 8 92
Demonstration 0 8 92
Scoring 0 31 69
Hopping Instructions 0 8 92
Demonstration 0 8 92
Scoring 0 23 77
Throwing Instructions 0 15 85
Demonstration 0 0 100
Scoring 0 8 92
Kicking Instructions 0 15 85
Demonstration 0 23 77
Scoring 0 15 85
Balance Instructions 0 8 92
Demonstration 0 23 77
Scoring 0 62 38
Instructions 0 0 100

142
Activity Aspect of
Activity
Teachers
that never
implemented
it correctly
(%)
Teachers
that
sometimes
implemented
correctly (%)
Teacher that
always
implemented
it correctly
Walking
along the
line
Demonstration 0 0 100
Scoring 0 70 30
Table 20 - Emerging themes from the qualitative comments section of the implementation fidelity checklist: for static balance and walking along the line
Theme Activity Researcher Comments
Child Comprehension
Static Balance
Researcher A: ‘teachers had to continually demonstrate the activity whilst each group of children were being tested – children were confused and were therefore getting practice and multiple testing opportunities’
Teacher Comprehension
Static Balance
Researcher C: ‘instructions for left and right need to be clearer i.e. when they say left leg, should they stand on or raise that leg?’
Walking Along the Line
Researcher C: ‘they were setting children off very close together, problems for children following another child could occur if they have to pause to wait. This meant that the teacher wasn’t watching them for the full length of the course’
Researcher A: ‘there was a little confusion over who was watching which child, due to them setting too many children off at once, meaning some scores were not an accurate representation of their ability’
Researcher A: ‘children were not walking heel to toe, and there was confusion over how these children should be scored because they were still technically on the line’.
Child Ability Static Balance
Researcher B: ‘teacher had to improvise with Reception as passing beanbags around the body was too difficult, so the

143
Theme Activity Researcher Comments
class did a clap at the front and a clap at the back’
Researcher C: ‘The activity took a long time because children struggled with left and right’
4.2.3.2 Initial Rasch Analysis
The initial Rasch analysis revealed a number of issues with this initial version of
FUNMOVES, including misfit to the Rasch model (χ2(40)= 108.03, p<.001), and
internal consistency below the accepted level (PSI =.68).
Table 21 shows an overview of the summary statistics for study 1. Items
displaying misfit to the Rasch model (after Bonferroni adjustment (p<.005) were
running (F(4,318)= 6.10, p<.001), non-dominant leg hopping (F(4,307)= 5.36,
p<.001) and static balance (F(4,320)= 7.73, p<.001). Five items displayed
disordered thresholds – jumping, hopping (both dominant and non-dominant
leg), non-dominant leg kicking and walking along the line (see Figure 23).
Figure 23b shows that children were never more likely to score 1 or 2 than 0 nor
were they more likely to score 3 or 4 than 5. Thus, children below 0.2 on the
logit scale were most likely to score 0 and children with higher ability levels than
this were most likely to score 5. Similarly Figure 23e shows ordered thresholds
apart from scoring category 4 (pink line), which never reaches a higher
probability of being obtained than scores of 3 or 5. Thus, children with an FMS
ability level of 2.2 on the logit scale were equally likely to score 3 or 5, making 4
a redundant response category.
There was also evidence of item response bias for running (F(6)= 5.41, p<.001),
jumping (F(6)= 6.78, p<.001), static balance (F(6)= 6.63, p<.001) and walking
along the line (F(6)= 4.33, p<.001) by year group, after accounting for
Bonferroni adjustment (p<.002). Additionally, running showed item-response
bias by gender (F(6)= 12.81, p<.001). No DIF was found between ‘typically
developing’ children, and children identified by teachers prior to testing as
potentially having motor issues. Correlations between item residuals also
identified local dependency for two sets of items (r >.15): (i) hopping dominant
and non-dominant leg (r = .41) and (ii) kicking dominant and non-dominant foot
(r = .19). The assessment tool was also not unidimensional, as 32 of the 323 t-
tests (9.64%) were significant. One participant response was found to be
misfitting (P23, location = -.29, SE= .65).

144
Figure 23 - category probability curves from study 1 initial Rasch analysis.
NB: a) shows an example of ordered thresholds (from the throwing activity) b)
shows disordered thresholds for jumping; c) shows disordered thresholds for
dominant leg hopping, d) shows disordered threshold for non-dominant leg
hopping, e) shows disordered thresholds for non-dominant leg kicking and f)
shows disordered thresholds for walking along the line. Graphs were generated
by RUMM 2030 software.
4.2.3.3 Items removed
Non dominant leg hop, non-dominant foot kick, and walking along the line were
removed and the analysis re-run in an effort to ameliorate local dependency and
implementation fidelity problems noted with these tasks. This second analysis
revealed that these changes resulted in no local dependency between items
(limit r >.19) and no DIF for gender or motor problems. However, there were still
a number of issues with this the subset of activities in FUNMOVES that
remained in this analysis. Namely, mis-fitting to the Rasch model (χ2(28)=

145
47.10, p =.01), lower than acceptable PSI (.6), and the measure being a
multidimensional rather than unidimensional (7.12% of tests). Additionally,
running (F(4,318)= 8.12, p<.001) and balance (F (4,320)= 4.51, p<.001)
activities were misfitting after Bonferroni adjustment (p<.001). Running,
jumping, hopping, and non-dominant throw all had disordered thresholds (see
Figure 24), and there was uniform DIF (for year group when using Bonferroni
adjustment p<.002) for running (F(6)= 3.95, p=.001), jumping (F(6)= 7.95,
p<.001) and balance (F(6)= 7.35, p<.001). Finally, one misfitting person was
found (P32, location = .08, SE= .67).

146
Table 21 – Summary Statistics for Study 1
NB: Extrms refers to individuals with an extreme fit residual.
Item location
Person location
Item fit residual
Person fit residual
Chi-square interaction
Person Separation Index (PSI)
Unidimensionality
Analysis m SD m SD m SD m SD Value df p With Extrms
No Extrms
Number of sig tests
Out of
% Lower 95% CI
Initial 0 .51 .16 .29 .70 1.09 -.11 .96 108.3 40 <.001 .68 .69 32 323 9.64 .07
Items Removed 0 .52 .29 .30 .50 3.41 -.16 .94 47.1 28 .01 .59 .60 23 323 7.12 .05
Rescore Run 0 .54 .3 .52 .45 .90 -.19 .89 31.79 28 .28 .58 .59 9 323 2.79 .004

147
Figure 24 – category probability curves for study 1, items removed analysis
NB: a) shows disordered thresholds for running b) shows disordered thresholds
for jumping; c) shows disordered thresholds for dominant leg hopping, d) shows
disordered threshold for non-dominant hand throwing. Graphs were generated
by RUMM 2030 software.
4.2.3.4 Rescoring the Running Activity
Due to running having disordered thresholds and misfitting the Rasch model in
the second analysis, a further re-analysis was performed where this activity was
re-scored, to see if this improved fit. Children were scored on the number of full
lengths (5 metre runs) instead of the number of metres a child ran. This re-
scoring resulted in FUNMOVES fitting the Rasch model (χ2(28)= 31.79, p =.28),
with no mis-fitting items (after Bonferroni adjustment, p<.007), and achieving
unidimensionality (2.37% of tests), with no local dependency (limit = r >.04) and
no DIF for gender or teacher identified motor problems. Additionally, ANOVAs
revealed significant differences between the scores obtained by different year
groups (F(6,326)=19.05, p<.001, see Table 22), as well as between ‘typically
developing’ children and children that were identified by teachers prior to testing
as potentially having motor difficulties (F(1,296)=25.35, p<.001, see

148
Table 23). Additionally, there was no significant difference between the mean
logit location of males and females (F(1,308)=.90 p=.34, see Table 24).
Table 22 – Descriptive statistics for logit location on FUNMOVES by year group for study 1
Table 23 – Descriptive statistics for logit location on FUNMOVES by motor ability for study 1
Table 24 – Descriptive statistics for logit location on FUNMOVES by gender for study 1
Year Group n m SD
Reception 47 -0.07 0.46
Year 1 28 -0.05 0.42
Year 2 51 0.22 0.42
Year 3 53 0.14 0.44
Year 4 46 0.41 0.46
Year 5 50 0.73 0.56
Year 6 58 0.5 0.41
Motor Skill n m SD
No problems 276 0.36 0.47
Teacher identified problems 22 -0.2 0.5
Gender n m SD
Male 170 0.27 0.51
Female 140 0.32 0.53

149
A number of issues with this iteration of FUNMOVES were, however,
highlighted with this third and final re-analysis. Similar to the second analysis,
the PSI was lower than acceptable (.59), and one participant had an extreme fit
residual (P32, location = .07, SE= .70). Secondly, there was uniform DIF for
year group (when accounting for Bonferroni adjustment p<.002) for running
(F(6)= 7.36, p<.001), jumping (F(6)= 9.19, p<.001) and balance (F(6)= 5.54,
p<.001). Additionally, despite re-scoring the running activity, thresholds were
still disordered (see Figure 25).
Figure 25 - category probability curves for study 1, rescore running analysis
NB: a) shows disordered thresholds for running b) shows disordered thresholds
for jumping; c) shows disordered thresholds for dominant leg hopping, d) shows
disordered threshold for non-dominant hand throwing. Graphs were generated
by RUMM 2030 software.
4.3 Study 2
4.3.1 Methods
4.3.1.1 Participants
Three hundred and fifteen children (165 male, 150 female) in Years 1-6 from
one school in Bradford participated in Study 2 (n=315, m age =8.37 years, SD=
1.83 years). Reception were not tested after Study 1, due to issues arising with

150
attention and comprehension in this age group, which resulted in FUNMOVES
not being feasible to implement at a whole class level in this age group (as
highlighted by the teachers from Study 1). Prior to testing, class teachers
identified 45 pupils that they thought had motor problems.
4.3.1.2 Design, Materials, Procedure and Analysis
The design, procedure for evaluating FUNMOVES and analysis were all the
same as in Study 1. Materials remained the same, except changes were made
to the teacher manual to reflect changes to activities in FUNMOVES based on
the results of implementation fidelity and Rasch analysis. This included
removing walking along the line and non-dominant leg kicking. Balance was
modified to remove balance 1 (legs shoulder width apart) as all children could
perform this balance and balance 2 (feet together), so it was redundant to
include both. Additionally, the need for children to balance on both their left and
right leg was removed due to confusion about which leg should be the standing
leg, and so for study 2, children were allowed to choose which leg to stand on
during one leg balances. This was presumed to be their dominant leg, and will
be referred to hereafter as such. An extra balance was also added, as two
balances had been removed (non-dominant one leg balance, and legs shoulder
width apart – based on the analysis in Study 1). The new balance entailed a
child standing on one leg, dropping a beanbag in front of them at arm’s length
and then attempting to pick the beanbag up off the floor with one hand whilst
maintaining balance (see Figure 26). This activity was included as it is regularly
used in occupational therapy assessments.
Figure 26 – photographic representation of the new balance included in Study 2
Additionally, the implementation fidelity checklist was modified based on advice
from Professor Jackie Goodway at the International Motor Development
Research Consortium conference. Rather than the frequency of correct

151
instructions, demonstrations and scoring, the checklist was changed to reflect
‘essential’ criteria that teachers must meet to accurately implement
FUNMOVES, and ‘desirable’ criteria which helps the assessment run smoothly
(see Appendix H).
4.3.2 Results
4.3.2.1 Implementation Fidelity
There was full compliance with essential criteria in nine out of the twelve
classes tested. There were issues with instruction-giving and scoring recorded
in the remaining three classes (see Table 25). Researchers did not observe any
further issues in their qualitative comments that did not relate to the checklist
criteria.
Table 25 – Implementation Fidelity Issues for Study 2
Class
% Essential
Criteria Met
Activity where
essential criteria
was not met
Criteria not met
1A 100 n/a n/a
1B 94 Jumping Scoring was not deemed
accurate by researchers
Balance Did not say that feet need to be
together for balance one
Did not count out the rotations of
beanbags around the body so
children were completing the
balances at different speeds and
were thus balancing for unequal
amounts of time
2A 94 Running Didn’t tell children to run as
quickly as they can

152
Class
% Essential
Criteria Met
Activity where
essential criteria
was not met
Criteria not met
Didn’t say that they should touch
the line at both sides with their
feet
Didn’t demonstrate the task
properly
3A 100 n/a n/a
3B 100 n/a n/a
4A 100 n/a n/a
4B 96 Running Scoring was not deemed
accurate by researchers
Balance Didn’t demonstrate balance four
5A 100 n/a n/a
5B 100 n/a n/a
6A 100 n/a n/a
6B 100 n/a n/a
4.3.2.2 Initial Rasch Analysis
The Rasch analysis undertaken in Study 2 revealed several substantial
improvements compared to the results of study 1, with the internal consistency
increasing to an acceptable level (PSI = .71), and no DIF was found between
typically developing children and teacher identified children. Additionally, there
was no local dependency between items (limit r = .05) and none of the
participant’s responses were exceeded thresholds for being classified as
‘extreme’ and thus ill-fitting. FUNMOVES was also found to be unidimensional,
with only 4.31% significant t-tests. Table 26 shows an overview of the summary
statistics for study 2.
There were, however, a number of issues with FUNMOVES still highlighted by
this analysis. Item-trait interaction was significant (χ2(28) = 45.17, p= .02),

153
indicating some misfit to the Rasch model. Additionally, there were 3 items with
disordered thresholds – jumping, hopping and balance (see Figure 27), and
jumping also showed some degree of mis-fitting to the Rasch model
(F(4,320)=3.96, p=.004). There was also evidence of item response bias by
year group for both running (F(5)= 6.07 p<.001) and jumping (F(5)= 5.82,
p<.001), as well as by gender for running (F(1)= 17.01, p<.001) and hopping
(F(1)= 13.20, p<.001).
Figure 27 - category probability curves from study 2 initial analysis.
NB: a) shows disordered thresholds for jumping; b) shows disordered
thresholds for hopping and c) shows disordered threshold for balance. Graphs
were generated by RUMM 2030 software.

154
Table 26 – Summary Statistics for Study 2
NB: Extrms refers to individuals with an extreme fit residual.
Item
location
Person
location
Item fit
residual
Person fit
residual
Chi-square
interaction
Person
Separation
Index (PSI)
Unidimensionality
Analysis m SD m SD m SD m SD Value df p With
Extrms
No
Extrms
Number
of sig
tests
Out
of
% Lower
95%
CI
Initial 0 1.24 .98 .73 .15 1.23 -.26 .89 45.17 28 .02 .71 .71 14 325 4.31 .02
Rescore 0 1.56 1.1 .90 .24 1.14 -.22 .98 57.34 28 <.001 .68 .68 19 325 5.85 .04

155
4.3.2.3 Rescore Jump and Hop
Due to jumping, hopping and balance having disordered thresholds in the initial
analysis (see Figure 27), these activities were re-scored for a second analysis.
Scoring changes were made based on the frequency of responses within
original scoring categories. Jumping and hopping were changed to have three
levels, by combining scores 1 and 2, 3 and 4 as well as 5 and 6. Also, because
children were never more likely to score 3 than 4 for balance, these two scoring
categories were combined.
Re-scoring these problematic activities in this way did not improve fit to the
Rasch model (χ2(28)= 57.34, p <.001), nor did it improve gender DIF for running
(F(1)=12.21, p<.001) or hopping (F(1)=15.83, p<.001) when accounting for
Bonferroni adjustment (p<.002). Additionally, non-uniform DIF was also found
by year group for hopping (F(5)=4.18, p=.001) and kicking (F(5)=4.19, p=.001),
in addition to maintaining this uniform DIF for running (F(5)=4.70, p<.001).
Additionally, these changes reduced the internal consistency to below the
accepted level (PSI = .68), and led to the hopping activity not fitting the Rasch
model (F(4,320)=7.21, p<.001) when accounting for Bonferroni adjustment
(p<.001). Re-scoring these activities, did however, result in ordered scoring
thresholds. Additionally, ANOVAs showed that there was a significant difference
between the scores obtained by year groups (see Table 27; F(5,319)=56.74,
p<.001) and between the scores obtained between typically developing children
and teacher identified children (see Table 28; F(1,319)=7.99, p=.005) on these
activities. There was also no significant difference between the mean logit
scores of males and females (see Table 29; F(1,319)=.48, p=.49)
Table 27 - Descriptive statistics for logit location on FUNMOVES by year group for study 2
Year
Group
n m SD
Year 1 55 0.11 0.65
Year 2 49 0.58 0.75
Year 3 47 0.94 0.52
Year 4 59 1.28 0.66
Year 5 60 1.75 0.65
Year 6 55 1.82 0.71

156
Table 28 - Descriptive statistics for logit location on FUNMOVES by motor ability for study 2
Motor
Problems
n m SD
No 275 1.14 0.92
Yes 45 0.74 0.7
Table 29 - Descriptive statistics for logit location on FUNMOVES by gender for study 2
Gender n m SD
Male 169 1.13 0.87
Female 152 1.1 0.94
4.4 Study 3
4.4.1 Methods
4.4.1.1 Participants
Two schools in Bradford were recruited for the final round of testing, in which
year 1-6 participated (n = 421, 196 male, m age = 8.61, SD = 2.1 years).
Teachers identified eight children as having potential motor skill difficulties.
4.4.1.2 Design, Materials, Procedure and Analysis
The design, evaluation procedure and analysis were all the same as in Studies
1 and 2. Materials remained the same as in Study 2, with the exception of the
following changes to the teacher manual, which reflected changes to the
protocol for certain activities within FUNMOVES in response to the results of
implementation fidelity and Rasch analysis in Study 2. As can be seen in Figure
27, the scoring categories for jumping and hopping were not differentiating
between abilities. This demonstrates that the ‘levels’ within these activities did
not get progressively more difficult. These activities were modified so that
children had to jump or hop to a target zone (marked out in a different colour)
on each line. The target zones became progressively smaller, in which the
whole of the first line (1 metre wide) was the target zone, up to the final line

157
where this narrowed to a 10 cm target zone for children to land on (see Figure
28). Additionally, Figure 27 demonstrates that children were never more likely to
be able to complete Balance 3 than Balance 4. This showed that the final two
balances were in the wrong order for their difficulty level, and were therefore
swapped over for study 3 (i.e. Picking up a beanbag became Balance 3 and
was completed prior to Balancing with eyes closed, which was labelled Balance
4).
Figure 28 – Illustration of the target zones on each line of the grid which were used to score jumping and hopping in study 3
4.4.2 Results
4.4.2.1 Implementation Fidelity
The implementation fidelity data from one of these schools was incomplete and
not meaningful, due to a lack of engagement in teacher training, and little time
being allocated for testing. This led to researchers having to take over sessions
or come back to lead and score some of the activities. For the second school
tested in, there was full compliance with essential criteria in four out of the six
year groups participating, and there were only issues with instruction-giving

158
recorded in the remaining two (see Table 30). Researchers deemed the timing
and scoring of activities as reliable for all year groups.
Table 30 - Implementation Fidelity Issues for Study 3 (one school)
Year
Group
Assessed
%
Essential
Criteria
Met
Activity
where
essential
criteria was
not met
Criteria not met
1 85 Running Teacher did not demonstrate
(asked researcher to)
Jumping Not explaining that they need to
pause on the final line too
Hopping
Not explaining that they need to
pause on the final line too
Teacher did not demonstrate
(asked researcher to)
Balance Teacher did not demonstrate
(asked researcher to)
2 100 n/a n/a
3 92 Set up Teacher did not line up students in
teams
Children were not lined up in the
order on their response sheets
Hopping Did not tell students that they
couldn’t change legs during activity
4 100 n/a n/a
5 100 n/a n/a
6 100 n/a n/a
4.4.2.2 Both Schools - Initial Rasch Analysis
The Rasch analysis showed further improvement upon the results reported in
Study 2, in that FUNMOVES fit the Rasch model (χ2(42)= 55.39, p =.08). It was
also unidimensional (5.94% of tests, CI = .04, .08), there was no local
dependency between items (limit r = .05) and no misfitting people or items when
accounting for Bonferroni adjustment (p<.007) . Summary statistics for all

159
analyses from study 3 can be seen in Table 31.There were, however, a number
of issues identified in this analysis. Firstly, the internal consistency of
FUNMOVES was lower than acceptable (PSI = .64). Running, jumping and
hopping had disordered thresholds (see Figure 29). Additionally, uniform DIF
was found for year group for hopping (F(5)=3.82, p=.002) and balance
(F(5)=5.92, p<.001), as well as for gender for running (F(1)=25.47, p<.001),
kicking (F(1)=13.38, p<.001) and balance (F(1)=12.97, p<.001).
Figure 29 - category probability curves from study 3, both schools initial analysis
NB: a) shows disordered thresholds for running; b) shows disordered thresholds
for jumping and c) shows disordered threshold for hopping. Graphs were
generated by RUMM 2030 software.

160
Table 31 – Summary Statistics for Study 3
Item
location
Person
location
Item fit
residual
Person fit
residual
Chi-square
interaction
Person
Separation
Index (PSI)
Unidimensionality
Analysis m SD m SD m SD m SD Value df p With
Extrms
No
Extrms
Number
of sig
tests
Out
of
% Lower
95%
CI
Both - Initial 0 .97 .7 .61 .26 1.15 -.23 .95 55.39 42 .08 .64 .64 25 421 5.94 .04
Both - Rescore 0 1.06 .64 .72 .13 1.05 -.25 1 56.11 42 .07 .62 .62 25 421 5.94 .04
One – Initial 0 .87 .75 .64 .17 .86 -.22 .90 19.56 14 .14 .67 .67 11 168 6.55 .03
One - Rescore 0 .95 .68 .75 .12 .77 -.24 1.02 20.42 14 .12 .64 .64 9 168 5.36 .02

161
4.4.2.3 Both Schools - Rescore Items
As running, jumping and hopping all had disordered scoring thresholds in the
initial analysis, these items were rescored for a second analysis. As can be
seen in Figure 29, participants were never more likely to score 1-4 full lengths
than zero or five full lengths in the running activity. Categories 1-4 were
therefore collapsed into a single category to explore the effect this would have.
Following the same reasoning, after reviewing Figure 16, jumping and hopping
raw scores (i.e. how many boxes they completed) was rescored into the
following simplified response categories, which were selected to better reflect
gradations in response: 1 - cannot do the activity, 2- can do the activity up to the
half way (line 3), 3- can do it past half way but cannot finish it and 4- can
complete the activity.
FUNMOVES, after this re-scoring fit the Rasch model (χ2(42)= 56.11, p = .07)
and was unidimensional (5.94% of tests, 95% CI = .04, .08), with no items
displaying local dependency (limit r = .04). However, these changes in scorings
also caused some issues with the Rasch analysis. The internal consistency
dropped further below acceptability (PSI = .62), hopping became a mis-fitting
item when accounting for Bonferroni adjustment (F(6,410)=4.14, p<.001) and
uniform DIF was found for year groups for the hopping (F(5)=4.97, p<.001) and
balance (F(5)=4.75, p<.001) activities, as well as gender DIF for running
(Running (F(1)=25.15, p<.001), kicking (F(1)=11.22, p<.001) and balance
(F(1)=16.27, p<.001). An ANOVA found significant differences between mean
logit location of year groups (see Table 32; F(5,415)=48.16, p<.001) and
between the scores of typically developing children and teacher identified
children (see F(1,419)=12.91, p<.001). An ANOVA also showed no significant
difference on performance on FUNMOVES between males and females (F(1,
419)=.60, p=.44).
Table 32 - Descriptive statistics for logit location on FUNMOVES by year group for study 3, both schools
Year
group
n m SD
Year 1 75 -0.05 0.58
Year 2 65 0.34 5
Year 3 70 0.44 0.58
Year 4 72 0.9 0.49

162
Year
group
n m SD
Year 5 70 1.1 0.6
Year 6 69 1.43 0.7
Table 33 - Descriptive statistics for logit location on FUNMOVES by motor ability for study 3, both schools
Motor
Problems
n m SD
No 413 0.65 0.71
Yes 8 0.26 0.83
Table 34 - Descriptive statistics for logit location on FUNMOVES by gender for study 3, both schools
Gender n m SD
Male 196 0.67 0.71
Female 225 0.61 0.73
4.4.2.4 One School – Initial Rasch Analysis
With re-scoring modification proving ineffective at improving the Rasch analysis
results in this study, it was decided to explore what effect excluding the data
from the school that had had not complied with the implementation checks,
would have on analysis. The data from this school was deemed unreliable, and
potentially invalid as FUNMOVES was not delivered in the intended manner in
this school (i.e. it was not teacher delivered/ scored in some case). The revised
sample for subsequent analyses therefore comprised of 168 children (70 male,
m age= 8.42 years, SD = 1.92 years) from the one remaining school, in which
teachers identified five children as having potential motor skill difficulties.
Removing the non-compliant school’s data resulted in FUNMOVES being a
unidimensional measure (6.55% significant tests; 95% CI = .03, .1) which had a
good fit to the Rasch model (χ2(14) = 19.56, p = .14) and just below acceptable
internal consistency (PSI = .67). Additionally, there were no misfitting items,
local dependency (limit r = .05) or item response bias. As with the analysis that

163
included both schools, disordered thresholds were still found for running,
jumping and hopping in this new analysis.
4.4.2.5 One School – Rescore Items
The scoring of running, jumping and hopping were therefore rescored and
reanalysed for a final time in this sub-sample to see if this would ameliorate the
disordered thresholds observed. For running, scores 1-5 were combined as no
child was more likely to get 1-5 than 0 or 6 (see Figure 31). For jumping and
hopping scores were changed to: 1 - cannot do the activity, 2- can do the
activity up to the half way (line 3), 3- can do it past half way but cannot finish it
and 4- can complete the activity. These categories were chosen based on the
frequency of responses within original scoring categories.
Jumping and hopping still presented with disordered thresholds, however, when
accounting for 95% confidence intervals, the thresholds were ordered. These
modifications also improved the unidimensionality of FUNMOVES (5.36%
significant tests; 95% CI = .02, .09). Additionally there were no misfitting items,
or local dependency (limit r = .04), and this version of FUNMOVES fit the Rasch
model (χ2(14)= 20.42, p =.12). The internal consistency (PSI) was lower at 0.64
than the minimum usually accepted for comparisons between individuals (0.7).
However, this PSI value is acceptable in a screening tool for differentiating
between children with age-appropriate motor competence and a group of
children with poor motor skills. A person-item map for study three can be found
in Figure 30.
Figure 30 – Person-Item Map for the finalised Version of FUNMOVES
Item response bias was identified for balance, by gender (Balance F(1) = 9.83,
p= .002), however, the differences between boys and girls were minimal and
only evident for children who scored at the top end of the scale on FUNMOVES,

164
thus the activity was not split (i.e. remained the same activity and scoring for
both genders). An ANOVA showed that there was a significant difference
between the scores obtained by year groups (see Table 35 ; F(5,162) = 25.79,
p<.001), in which mean logit score increased with each year group. Additionally,
there was a significant difference in mean logit scores between children
identified prior to testing as potentially having motor problems, and ‘typically
developing’ children (see Table 36; F(1,166) = 5.42, p=.02), in which teacher
identified children performed significantly worse on FUNMOVES. It is, however,
important to note that there were only 5 children identified as potentially having
difficulties with motor skills, so caution needs to be taken when interpreting this
result to avoid over-interpretation. Analysis also revealed that gender did not
impact mean logit scores (see Table 37; F(1,166) = 1.66, p = .20). The final
version of FUNMOVES allowed teachers to measure the FMS of a whole class
of 30 children in 42 to 58 minutes.
Figure 31 - category probability curves from round three of testing, one school

165
NB: a) shows disordered thresholds for running and b) shows those categories
as ordered once scores 1-5 were combined. c) shows disordered thresholds for
jumping and d) shows those categories as ordered (within 95% confidence
intervals) once categories 1 and 2 were combined and 3 and 4 were combined.
e) shows disordered thresholds for hopping and f) shows those categories as
ordered (within 95% confidence intervals) once categories 1 and 2 were
combined and 3 and 4 were combined. Graphs were generated by RUMM 2030
software.
Table 35- Descriptive statistics for logit location on FUNMOVES by year group for study 3, one school
Year
Group
n m SD
Year 1 28 -0.06 0.61
Year 2 27 0.35 0.45
Year 3 26 0.34 0.46
Year 4 29 0.94 0.48
Year 5 27 1.04 0.59
Year 6 31 1.38 0.75
Table 36- Descriptive statistics for logit location on FUNMOVES by motor ability for study 3, one school
Motor
problems
n m SD
No 163 0.71 0.75
Yes 5 -0.08 0.45
Table 37- Descriptive statistics for logit location on FUNMOVES by gender for study 3, one school
Gender n m SD
Male 70 0.77 0.81
Female 98 0.62 0.7

166
4.5 Discussion
This chapter aimed to develop a school-based screening tool of FMS ability for
Primary school children that was both theoretically and psychometrically sound
and feasible for use in schools.
4.5.1 Psychometric Properties
When considering the psychometric properties of the final version of
FUNMOVES trialled in Study 3, scored using revised criteria, this assessment
tool was unidimensional, fit the Rasch model, and had no misfitting items or
local dependency.
Additionally, results consistently revealed that children identified by teachers as
potentially having motor difficulties prior to testing scored significantly worse
than their peers. This was the case across all three iterations of the assessment
which suggests that FUNMOVES can differentiate between abilities. The results
of these ANOVAs should, however, be interpreted with caution, as there were
very few children identified by teachers in the three studies (7% of the sample in
Study 1, 14% in Study 2 and 3% in Study 3). The small sample sizes in the
‘motor difficulties’ group may have inflated the results. It therefore remains
important to test the ability of FUNMOVES to differentiate between typically
developing children, and those objectively identified as having motor problems
using pre-existing, valid and reliable measures of FMS such as the TGMD
(Ulrich, 1985, 2000, 2016) or the MABC (Hendersen et al., 2007; Henderson et
al., 1992).
Moreover, upon taking part in testing, schools were given reports which detailed
how each child performed on the activities within FUNMOVES compared to
children in the same year group. In the course of preparing these reports, it
became apparent to the researcher that there was a substantial number of
children that were being missed or misidentified by their teacher. One example
was a child who had ASD that the teacher anticipated would perform badly on
the tool, who were then surprised that they scored in line with their peers. This
is perhaps unsurprising, given that a recent review highlighted discrepancies
between ratings of children’s motor abilities when teacher rating (via
questionnaire) were compared to ratings derived from physical assessments
(Bardid, Vannozzi, et al., 2019). Chapter 3 would suggest that this may, in part
be due to a lack of knowledge amongst teachers regarding FMS. Thus, it is

167
likely that children exhibiting more obvious difficulties with motor skills may be
identified utilising questionnaire methodology, however the discrepancies
highlight the importance of physical assessment to identify all children with poor
motor skills so they can be provided with additional support.
In all three studies within this chapter, it was revealed that there was no
meaningful differences between the average performance of boys and girls on
FUNMOVES. This is in contrast to research that found evidence for gender
differences in FMS ability (Bolger et al., 2020; Goodway et al., 2010; Kokštejn et
al., 2017). As was alluded to in Chapter 1, the effects found in these earlier
studies were mixed, however, it is most often reported that girls outperform
boys on locomotor tasks and the opposite for object control tasks. There was no
evidence of item-response bias in relation to gender for any of the locomotor
(running, jumping and hopping) or object control (throwing and kicking) in Study
3. This contradicts some findings discussed in Chapter 1, which proposed that
gender differences in object control ability may in part, be explained by
sociocultural differences in upbringing, in which boys spend more time playing
ball sports (Barnett et al., 2010; Thomas & French, 1985). The lack of a
difference within FUNMOVES’ object control tasks is plausible if one considers
the equipment involved though. The use of beanbags instead of balls means it
is possible that both genders will have been afforded similar opportunities to
practice these skills previously. For example, throwing beanbags is a common
activity within P.E. lessons, so both boys and girls should have had equal
opportunity to practice this previously. Whereas kicking practice is often done
with balls, both in P.E. and in sports specific sessions, so it is likely that kicking
beanbags will have been equally novel for both boys and girls. The results of
study 3 show an item-response bias for the balance activity by gender, in which
males performed marginally worse than females, despite having the same
overall ability levels. This pattern has been found by studies previously (Mickle
et al., 2011; Rodríguez-Negro et al., 2019; Singh et al., 2015; Van Waelvelde et
al., 2008), however as was discussed in Chapter 1, stability skills are less
commonly evaluated so there is limited research exploring why this might be the
case. It is, however, important to note that the gender differences found for the
balance activities within FUNMOVES were only present for children achieving
the highest scores on the activity (i.e. those with the greatest levels of FMS
ability). As FUNMOVES was designed to screen children with FMS difficulties,
the measure was therefore not modified, as there was no gender differences
found for children performing poorly in these balance activities.
It is important to note that the scoring thresholds for running were disordered in
the final study, and researchers decided that although modifications were made

168
in the final study, these modifications would not be carried forwards with
finalised version of FUNMOVES. This decision was made by the working group
due to the growing body of evidence that suggests SES has an impact upon
FMS ability (as is described in more detail in Chapter 1). Studies often find that
high SES children are more proficient than their low SES peers (Hardy et al.,
2012; Morley et al., 2015). The school whose results were analysed in isolation
in Study 3 was from a wealthier area (Index of Multiple Deprivation (IMD) Decile
rank 6) compared to the schools in Studies 1 and 2, both of which were in
neighbourhoods with an IMD Decile rank of 1. As the children in the final school
would be expected to, on average, perform better than children in these earlier
studies, the fact that they were not using the first five scoring categories (i.e.
between one and five lengths) is perhaps unsurprising. In a similar vein, it is
also notable that the final school had many physical activity initiatives in place,
including playground monitors who were responsible for leading active games
during break times. With both of these potential sources of sampling bias in
mind, it was believed that removing scoring categories (1-5) that were
suggested to be redundant in the final analysis in Study 3 may be detrimental
for measuring running ability in lower SES schools, as well as those with less
active policies. Therefore, to ensure FUNMOVES remained suitable for use in
all schools, the scoring categories established in Studies 1 and 2 were retained,
where no such threshold issues were. Although there were no issues with
running scoring in the first two studies (after changing from metres run to the
number of lengths completed in Study 1), it will be important for future research
studies to establish whether this scoring is indeed the most appropriate one to
recommend for use across a wider range of schools.
4.5.1.1 Limitations in Evaluating Psychometric Properties
One limitation of FUNMOVES is that the final PSI value for internal consistency
was lower than 0.7, which is widely acknowledged as the limit for having
acceptable internal consistency in the literature (Fisher, 1992). As can be seen
in Figure 30, many of the participants in the sample were above average ability
(with average being 0 on the logit scale). This figure also shows relatively
narrow levels of variability in ability levels in this sample, with a large proportion
of the children tested falling between zero and two on the logit scale. As only
approximately half of the activity levels fell within this range, there was not
enough measurement points to differentiate between the bulk of the activities.
This explains why the PSI was lower than accepted. However, there were
measurement points spanning the full range of abilities tested, as well as
activity levels beyond the scope of the sample tested (i.e. appropriate for
children of much poorer ability, including those with a logit location of -8, and

169
those of better ability, who would fall at 4.5 on the logit scale). As the scoring
thresholds were spread sufficiently along the scale, this suggests that it would
enable children of all abilities to be measured by the activities on FUNMOVES.
Moreover, it demonstrates that the assessment tool would be able to identify
children that should be highlighted for further investigation by a screening
programme (i.e. those with poor FMS). Despite this, it will be crucial for future
research to evaluate whether FUNMOVES can indeed consistently identify
children that have poor FMS ability, as measured by well-established measures
of FMS ability such as the TGMD (Ulrich, 1985, 2000, 2016), the MABC
(Hendersen et al., 2007; Henderson et al., 1992) or the BOT (Bruininks, 1978;
Bruininks & Bruininks, 2005).
Secondly, the scoring format for the finalised version of the jumping and
hopping in activities has not yet been tested within schools. After two studies,
the scoring thresholds for these activities were still disordered. Upon discussion
amongst the team, it was decided that this may reflect the fact that the ‘levels’
within these activities were not increasing in difficulty; rather children were
required to do the same task five times. Although this may have had an impact
upon strength or balance (e.g. how long a child can stay stood on one leg), the
results from these earlier studies suggested these factors were not sufficient to
differentiate between FMS ability levels. The working group therefore decided to
increase the difficulty between these levels further, by incrementally reducing
the size of the target area for children to land within on each line. It was hoped
that this would improve the response category threshold ordering for hopping
and jumping. Although the use of six scoring categories for these activities was
not appropriate, modifying the scoring to have four categories instead of six
allowed fit to the Rasch model. This allows confidence that the new categories
will be appropriate for other samples, as unlike CTT analyses, Rasch analysis is
not dependent on the sample (Hambleton & Van der Linden, 1982). Despite
this, it will be important to evaluate these scoring categories in a subsequent
studies to build a larger corpus of evidence corroborating their appropriateness.
Finally, it is important to recognise that these three studies are only a first step
in validating FUNMOVES. Although the rigorous development and evaluation
via Rasch analysis builds confidence in the content and structural validity of
FUNMOVES, it will be important to ensure that all aspects of the COSMIN
checklist (Mokkink et al., 2010b) are evaluated before its use can be
unreservedly recommended for use in schools. This degree of evaluation is
particularly important, given the fact that Chapter 2 highlighted that previous
studies have been selective in which aspects of validity and reliability have been
measured. This means that for most assessments there are often several

170
psychometric properties that remain unevaluated. In addition, due to the group
nature of the assessment, further research will also be needed to examine
whether external factors, such as attention, or position on the grid that a child is
assessed, have an impact upon FMS ability as measured by FUNMOVES.
4.5.2 Feasibility
When considering feasibility, Chapter 3 sought to review and adapt a set of
somewhat arbitrary guidelines proposed by Klingberg et al. (2018). Using an
online survey of Primary School teachers, opinions were gathered, prompting
revisions to these guidelines based on empirical evidence gathered from those
that universal screening in schools would directly impact. The revised guidelines
set out at the end of Chapter 3 were as follows:
(i) assessments should be quick to implement, be that either less than
ten minutes per child, or between 30-60 minutes per class
(ii) assessments should only utilise equipment that is readily available in
schools, such as beanbags and chalk, or should provide schools with
such equipment at no additional cost
(iii) space constraints in schools mean that the FMS of children should be
able to be assessed within a small (≤5 m2) space, either indoors or
outdoors
(iv) assessments should be implementable by two members of teaching
staff
(v) teaching staff should require minimal training to enable them to
assess the FMS of their pupils (maximum of half a day)
(vi) school-based assessments of FMS should be product-oriented
When considering guideline (i), the finalised version of FUNMOVES fits within
this remit as it was able to measure the FMS of a whole class between 42 and
58 minutes. This will ensure that testing can be done within the timeframe of a
P.E. lesson, thus lessening the burden on time pressures within schools
(Routen et al., 2018).
In relation to guideline (ii), FUNMOVES was designed to only use equipment
that teacher responses in Chapter 3 indicated would be readily available in
schools (i.e. 25 beanbags and a stopwatch). The research team, did however,
decide to use electrical tape instead of chalk, which was also identified as being
commonly found within schools in Chapter 3. This variation in equipment was
decided upon to allow for ease of implementation whilst testing whole schools in
a short amount of time. As classes were often tested back to back, it removed
the need for teachers or researchers to re-draw the grid every time, as the tape
was more long-lasting and meant that researchers only needed to re-touch the

171
grid at the start of each day. The electric tape was provided for schools in this
instance, so that schools were not having to pay to participate, however it would
cost a school less than £5 to buy enough tape to implement FUNMOVES
across all year groups, so this cost should not be considered burdensome, even
in the context of limited school budgets (Perera, 2020). In addition, it is possible
to implement FUNMOVES using a chalk grid. This was trialled for the first
version of FUNMOVES, which was written up for a Masters dissertation.
Therefore, if school budgets were stretched, there remains the option for
schools to use this more readily accessible resource to create the grid.
In relation to guideline (iii), the activities within the assessment are all contained
within a five metre squared grid, which is in alignment with the space guideline,
as 87% of Primary School teaching staff believed their school had this amount
of suitable space indoors, and 98% outdoors. All testing for these three studies
were conducted indoors, in school sports halls. It is therefore important to note
that the finalised version of FUNMOVES has not been tested outdoors on a
playground. Prior to the three studies detailed above, FUNMOVES was piloted
on one school for a Masters dissertation. Due to a lack of indoor space in the
school, FUNMOVES was completed outdoors. Although the activities varied
slightly from those included in the finalised version, they were largely similar
and were implemented successfully in this outdoor setting. One consideration
that will need to be made, is whether the revised/alternative scoring criteria will
need to be developed to validly assess performance the object control tasks
(both throwing and kicking) when used outside. For these tasks, it is likely that
the beanbag will not travel as readily on an uneven outdoor concrete surfaces
(e.g. school playgrounds) when compared to sports hall floors. This may impact
upon the strength needed for a child to kick or throw a beanbag to the further
boxes because those which would land slightly short and slide into the target
zone in a sports hall, likely won’t outdoors. It is, however, important to consider
the purpose of the throwing and kicking activities. These activities were
designed to require children to moderate the power of their throws/kicks to
reach a number of targets, rather than just measuring the distance a child could
kick. This nuance was intentional because research has shown that for a child
to be able to participate in physical activities, they do not solely need to be able
to throw forcefully for distance, but they are also required to throw accurately to
target locations (Hamilton & Tate, 2002). So, although children may need to be
more precise when throwing or kicking outdoors, it is still plausible that these
activities will function as intended without the need to modify how they are
scored, as children will still need to moderate the force exerted on the beanbag
to reach a target location. Finally, to reach the final target, a child only needs to

172
be able to kick a beanbag just over four metres in length. It is imperative for
further research to be done to establish the effect of the surface on scores
though, as it may impact on the ability to use norms data to identify children with
difficulties. It may be the case that different norms data is needed for indoor and
outdoor versions of these activities.
When considering guidelines (iv) and (v), two members of teaching staff were
able to implement FUNMOVES after an hour of training. The results of Study
3’s fidelity checks revealed that teachers on the whole were able to implement
FUNMOVES accurately, with researchers judging that teachers were scoring
correctly. There were, however a number of instructions for activities that
teachers needed to be reminded of. This likely reflects improvements needed in
clarity with which they are communicated during teacher training and within the
manual. It will also be important to test whether teachers can independently
implement FUNMOVES once these changes have been made. Finally,
FUNMOVES is product-oriented (guideline vi), as it measures the outcome of
movements, for example, the number of beanbags thrown to a target box.
FUNMOVES therefore meets all teacher-defined feasibility criteria, which
should improve the likelihood of its uptake by schools.
Recently, an expert panel, consisting of academics in motor development and
physical education, as well as specialist PE teachers and coaches with
experience improving children’s motor ability, took part in a Delphi study to gain
consensus about what should be included in school-based assessments of
FMS (Van Rossum et al., 2021). The included experts were asked to rank the
importance of a range of FMS, make judgements on the number of FMS from
each sub-category (locomotor, object control and stability) should be included,
and how they should be scored. On average, the experts stated that there
should be four activities which measure stability, five that measure locomotor
skills and five which evaluate object control skills. Consequently, the authors
decided to recommend the inclusion of fourteen skills in any FMS battery: four
stability (one leg balance, walking along a beam, front support and sideways
roll) five locomotion (run, hop, horizontal jump, side stepping and skipping) and
five object control (two handed catch, underarm throw, overarm throw, kicking a
ball and bouncing a ball whilst stationary). The authors then confirmed by a
majority vote, to recommend the use of process-oriented measures within
schools. FUNMOVES does not align with the guidelines outlined by this study. It
includes significantly fewer activities (six, rather than fourteen), only four of
these activities are included in the list outlined in the paper (run, hop, underarm
throw and one-legged balance), and it measures ability using product
outcomes, rather than process. FUNMOVES also includes kicking, but this

173
activity utilises beanbags instead of a ball. Similarly, FUNMOVES also in
includes jumping, however the focus is on moving through space and being
able to stop and balance, rather than jumping sideways.
Although consultation with experts allows for strong face validity, there are,
however, a number of issues with utilising this approach to designing an
assessment tool. Firstly, the authors claim that it is important to consider the
level of knowledge of the end users (i.e. UK primary school teachers) when
deciding whether to utilise product or process oriented activities to measure
FMS ability (Van Rossum et al., 2021). However, rather than consulting
teachers on the two types of assessment, they relied on expert panel members’
interpretation of teachers’ presumed abilities, which may not be accurate.
Particularly given that they acknowledge that there is a lack of P.E. specialists
in the UK, and that, most teachers will have only received six hours of training
on how to deliver the P.E. curriculum (Harris et al., 2012). The authors also
acknowledged the lack of confidence teachers have in their ability to deliver
assessments based on their previous research consulting teachers (van
Rossum et al., 2018). The lack of knowledge that teachers have was also
evident in the results of Chapter 3, so it is presumptuous to assume this method
of assessment will be suitable for teachers without consultation. Moreover,
consensus was not achieved for all activities with regards to how activities
should be measured, with some being voted more suitable for product scoring,
and others process. Secondly, although the included activities are hypothesised
to measure the same overarching construct (i.e. FMS) based on the included
experts’ opinions, it is impossible to ascertain whether this is actually the case
without rigorous psychometric testing of the proposed FMS measure. For
example, the experts included walking along a beam in their list of activities.
FUNMOVES in Study 1 included walking along the line, a similar activity,
however this did not fit the Rasch model. In fact, only following its removal was
unidimensionality improved. Herein lies the advantage of using objective
evaluations within the development of tools, to help ensure their psychometric
properties. It allows systematic evaluation of the feasibility and appropriateness
of included tasks, rather than reliance on opinion.
4.5.2.1 Limitations in Evaluating Feasibility
Firstly, despite the fact that FUNMOVES is feasible when compared to pre-
determined criteria, including the guidelines outlined in Chapter 3, and those
specified by Klingberg et al. (2018), feasibility was not formally evaluated in
these studies. It will be crucial to conduct qualitative studies with teachers that
have implemented FUNMOVES in schools, to explore their thoughts and

174
opinions on feasibility and acceptability. It will also be important to evaluate the
ability of school staff to implement FUNMOVES accurately, without the
assistance and presence of the research team. The three studies included in
this chapter all had researchers present to rectify mistakes made by teachers.
This was a conscious decision to ensure that the activities being evaluated and
validated by Rasch analysis were implemented as intended. In a universal
screening context, however, researchers will not be present, even in this
observing role. Given observations of some teachers omitting certain
instructions crucial to the correct implementation of FUNMOVES, it will be
important to update the teacher training session and the physical resources that
teaching staff receive to accompany these sessions (i.e. the manual and score
sheets) to ensure clarity and ease of execution.
Secondly, it is important to note that FUNMOVES, in a whole class format, was
not feasible for children in their first formal year of education (Reception;
children aged between 4 and 5 years old). This age group was not tested
beyond Study 1 as the Reception teachers believed that it would be difficult to
keep the class on task, and thus the children were tested in groups of five
instead, which is not the intended delivery method of FUNMOVES, due to
increased time demands this would generate. Testing in these small groups
was, however, effective, as it allowed children to better comprehend the
activities, and it was easier for staff to manage the group and score the
activities simultaneously. This methodology also meant that extra staff were
required to supervise the children waiting to be assessed who usually remain in
the classroom. This was not problematic for the school tested in Study 1, due to
there being extra support staff available for Reception year groups. However,
this may not be the case for all schools. As early identification of motor skill
difficulties has been found to be beneficial (Missiuna et al., 2003) future
research would benefit from evaluating whether the finalised FUNMOVES
battery of activities implemented in this way is valid, reliable, and feasible to be
implemented in smaller groups for Reception children, and how results relate to
performance at later ages (i.e. when assessment is conducted as a whole
class).
4.6 Conclusion
After three rounds of iterations, FUNMOVES enables two members of teaching
staff (e.g. a teacher and a teaching assistant) to assess the FMS ability of a
whole class (approximately 30 children) in under an hour, in a small space
(5x5m squared), using resources available in schools (or cheap to buy
resources such as electrical tape) after a short staff training session

175
(approximately an hour). FUNMOVES was found to have strong structural
validity, and meets guidelines for feasibility for use within universal screening
programmes in schools, which were proposed in Chapter 3.
A more collaborative approach to FMS assessment, linking healthcare and
education services, has the potential to expedite access to assessment and
intervention, and ultimately improve outcomes for children. Before FUNMOVES
can be recommended for use in this context, it will, however, be vital to further
evaluate its (i) feasibility and acceptability through qualitative data collection
with teaching staff that have implemented the assessment and (ii) additional
psychometric properties, such as differing forms of validity and reliability.

176
Chapter 5
Protocol for the Validity, Reliability, Feasibility and
Acceptability of FUNMOVES
5.1 Background / Rationale
The structural validity of FUNMOVES was established in Chapter 4, through
rigorous development utilising Rasch analysis. This allows confidence that all
activities are measuring the same over-arching construct (FMS). However,
further work is required to establish the other psychometric properties listed on
the COSMIN checklist (Mokkink et al., 2010a). Such further evaluations are
necessary before FUNMOVES can be recommended for use in universal
screening programmes. Similarly, although FUNMOVES was designed to
adhere to feasibility guidelines (developed in line with teacher opinions), and
this is a good first step (see Chapter 3 for details), research needs to be
conducted to gain insight into teacher experiences with implementing
FUNMOVES in a school environment. This is vital to better understand how
acceptable it would be. This chapter outlines a protocol to address the
remaining aims and objectives outlined in Section 1.6 (to evaluate the validity,
reliability, feasibility and acceptability of the new assessment tool).
This protocol was due to be actioned between March and July 2020, within the
timeframe of this PhD, however the COVID-19 pandemic limited and (during
lockdowns) prevented access to schools. Schools were closed between March
and June 2020, and again December 2020 and January 2021 due to a rise in
cases. When schools re-opened, access was limited due to protocols put in
place by schools, such as classroom bubbles and a blanket rule on no external
visitors. The pandemic has, however, highlighted the need for a universal
screening tool of FMS ability. Research has shown that children have been less
active (Bingham et al., 2021), and have become less proficient at FMS (Pombo
et al., 2021). OFSTED have also noted concerns over children’s physical
abilities upon their return to schools (Ofsted, 2020).
5.2 Project Aims and Objectives
The primary aim of this research is to establish whether FUNMOVES is suitable
for use in universal screening programmes in primary schools.
Objective 1: To evaluate the remaining psychometric properties of
FUNMOVES from the COSMIN checklist (inter-rater reliability, internal

177
consistency, test-retest reliability, concurrent validity, predictive validity and
hypotheses testing validity).
Objective 2: To understand teachers’ opinions of FUNMOVES and its usability
within the school environment.
5.3 Work Package 1 – Assessing Psychometric Properties
(Validity and Reliability)
5.3.1 Participants
5.3.1.1 Sample size and power
A sample size estimate calculation was conducted using the ‘pwr’ package in R
Studio. A significance level of .05, and power value of .8 was specified to detect
a medium effect size (.3). The calculation estimated a minimum of 84
participants (primary school students) for each of the quantitative validity and
reliability studies.
5.3.1.2 Recruitment
Primary schools will be recruited by utilising contacts within the Born in Bradford
(BiB) and the local Department for Education Opportunity Area, who have well-
established links to schools within the Bradford district area. Additionally, a
formal application will be submitted to the Centre for Applied Education
Research (CAER) executive committee, who work with and have influence in, a
large number of schools in the area. Schools will be invited to take part in the
study by (i) a poster emailed to the schools detailing the purpose of the study,
what it entails and the benefits for schools (see Appendix I) and (ii) a follow-up
face to face meeting with a trained researcher about the study. This meeting will
be used to discuss consent, logistics for testing (e.g. dates, times and space
requirements), as well as to answer any questions or concerns they may have.
Due to the group-based nature of FUNMOVES (class-based assessment), head
teachers and class teachers will consent to classes within the school
participating and subsequently parents will be given information regarding the
purpose of the study prior to testing and an opt-out consent form they can use
to inform the school to withdraw their child from participation. This methodology
was chosen as Born in Bradford (BiB) regularly use opt-out consent, and like to
be consistent in their approach across nested studies (of which this will be one).
As well as this, schools in Bradford have a high proportion of children from
disadvantaged families, which are less likely to return opt-in forms. This then
further disadvantages children from these families as they don’t get to

178
participate in programmes that are designed to help with various developmental
difficulties, such as fundamental movement skills (as is the case with this
study). Verbal assent will also be sought from the child, on the morning of
testing.
5.3.1.3 Eligibility Criteria
To be included within the study, children must be: (i) aged between five and
eleven years old (school years 1-6). Children will be unable to participate if (i)
their parents return opt-out consent forms or (ii) they do not verbally assent to
take part on the day(s) of testing.
5.3.2 Design
The schools that are recruited will commit to testing all pupils in years 1-6
classes using FUNMOVES. To reduce the burden on schools, they will be
recruited to also complete additional measures from one of two pathways (see
Figure 32). The first pathway would involve a school doing test-retest reliability
within two classes from either (i) year 1 and year 4, (ii) year 2 and year 5, or (ii)
year 3 and year 6. To ensure sufficient power for analysis, and data across all
year groups this would require recruiting three one form entry schools as a
minimum.
Figure 32 – Recruitment strategy for work package one
For the second pathway, three further schools will be required, from which six
children within each year group will be randomly selected (using a random
number generator to select participants based on their study ID number). These

179
children will be assessed using the Movement Assessment Battery for Children
(MABC).
Schools in both pathways will also allow researchers to evaluate inter-rater
reliability at the time of initial testing within one class, from one year group.
Each of the six schools will contribute a different year group for inter-rater
reliability data, to ensure that the six different year groups of interest are
covered by the six schools involved in the study. For an example of how
schools might be distributed across these different sub-studies following
recruitment, see Figure 32.
5.3.3 Measures
5.3.3.1 Demographics
Researchers will ask the school for the following demographic data:
• Child name
• Date of birth
• Gender
• Home Postcode
• Disability and/or Special Educational Need (SEN)
• Class name
• Year Group
• Ethnicity
• Receipt of free school meals
The child’s name will be utilised to make personalised reports for schools
detailing how each child performed compared to children of the same age. Date
of birth and year group will be utilised to ensure percentile ranks (i.e. how the
children are performing on FUNMOVES compared to their peers) are calculated
for the correct ages. Class name will be used to compile reports for each class.
Gender will be used to evaluate differences between boys and girls, due to
research suggesting these differences exist within FMS ability (which discussed
in detail in Chapter 1) (Matarma et al., 2020). Similarly, SES differences are
found within FMS literature (see Chapter 1 for more comprehensive discussion)
(Barnett, Lai, et al., 2016), so home postcode (which will be used to calculate
IMD decile) and receipt of free school meals will be used to evaluate SES
differences in the recruited sample. Finally, Chapter 1 also discussed FMS
differences by ethnicity (Adeyemi-Walker et al., 2018; Eyre et al., 2018).
Ethnicity data will therefore be collected. As the ethnicity within Bradford is
largely made up of two ethnic groups (White British and South Asian) who are

180
often found to have different FMS ability levels, the differences between these
two groups will be evaluated within this sample.
5.3.3.2 FUNMOVES
The finalised version of FUNMOVES, as described at the end of Chapter 4 will
be utilised. All activities within FUNMOVES take place within a five by five metre
grid, which allows a class to be split into five ‘teams’ so that five children (one
from each team) can be tested simultaneously.
Figure 33 shows an overview of the activities included within the final iteration of
FUNMOVES. To recap briefly:
Running - for this activity, children have fifteen seconds to run from the bottom
line on the grid to the far line and back as many times as possible. They are
scored by the number of full lengths they run – for example in Figure 33 the
child would have scored 5.
Jumping – children perform multiple small jumps (outline of feet on Figure 33)
to reach the first pink line and pause on the line (filled in feet on Figure 33) for 3
seconds before jumping to the next line. The pink ‘target zone’ on each line gets
smaller each time. Children need to land and pause on the target zone for each
line, with both feet. Children are scored by the zone (numbered down the left
hand side of the grid) in which they are unable to do the task as instructed (e.g.
cannot stop on the line and maintain balance, cannot jump to land both feet in
the target zone, falls over etc.). The ‘zone’ will not refer to singular boxes, but
rather the scoring categories outlined by the final Rasch Analysis in Chapter 4.
Hopping – the hopping task works in the same way as jumping, except children
are required to hop and balance on one leg (which the child chooses) for the
duration of the activity. The activity is scored in the same way – by the zone on
the grid where they cannot complete the task as instructed. This may involve
not being able to stop still on the line, putting their foot down etc.
Throwing – for this activity children try to throw (underarm) five beanbags, one
into each box in their lane. For example the child in Figure 33 would have
scored five points. This task is completed twice, once with their left arm and
once with their right.
Kicking – This task is completed a similar way to throwing (i.e. children kick five
beanbags along the floor, aiming to get one in each box in their lane. Again they
are scored by the number of boxes in their lane filled by beanbags. This task is
only completed once, and the child can choose which foot they want to kick
with.

181
Balance – for this activity children are required to manipulate a beanbag whilst
maintaining their balance in four different postures (illustrated in Figure 33).
Balance 1 requires children to pass a beanbag around their body three times
whilst standing with their feet together. Balance 2 requires the same
manipulation of the beanbag but whilst standing on one leg (of their choice). For
balance 3, children are required to pick up a beanbag from the floor,
maintaining balance whilst on one leg. Balance 4 is the same as balance 2 (i.e.
passing a beanbag around their body three times whilst standing on one leg),
except this time they have to do so with their eyes closed. Children are scored
by the number of balances they complete. Once a child has ‘failed’ a balance,
they do not get scored for attempts at later, more challenging balances.
Figure 33 – Pictorial depiction of the activities within FUNMOVES
5.3.3.3 Movement Assessment Battery for Children (MABC)
The MABC (Hendersen et al., 2007; Henderson et al., 1992) will be utilised to
measure the concurrent validity of FUNMOVES. This measure was selected to
validate FUNMOVES against for a number of reasons. Firstly, Chapter 2
established that product-oriented and process-oriented assessments do not
correlate very well. Research has recently established that these two types of

182
assessment measure different aspects of FMS (Palmer et al., 2021). The
systematic review in Chapter 2 indicated that the measure with the greatest
evidence supporting its validity and reliability was the Test of Gross Motor
Development (TGMD) (Ulrich, 1985, 2000, 2016) but this is a process-oriented
assessment. Therefore, it was not considered to be a suitable comparison for
FUNMOVES, a product-oriented measure. Of the product-oriented measures
appraised in the systematic review, the MABC was the most comprehensively
evaluated, with the MABC’s performance having been evaluated for all ten
COMSIN (Mokkink et al., 2010a) categories. In contrast, the BOT, the product-
oriented measure with the next most evidence only had five psychometric
properties established.
Additionally, the MABC is recommended as the ‘gold standard’ measure for
diagnosing motor difficulties (Developmental Coordination Disorder) in Europe
(Blank et al., 2012). Thus, the MABC is used within clinical settings in the UK,
and therefore if children were to be referred for a more comprehensive
assessment of their motor abilities, following screening using FUNMOVES, then
this is the assessment that would be used. Thus, it is important that these two
assessments identify similar children as having delayed motor skills, so that
unnecessary pressure is not put on already over-stretched healthcare services.
5.3.4 Procedures
In alignment with the procedures in Chapter 4, teachers will receive an hour of
training before testing to enable them to implement FUNMOVES. Training
sessions will be interactive; they will involve a short introduction outlining what
FMS are and why they are important, and then role play sessions where the
teachers in attendance get a chance to practice (i) how to do the activities and
(ii) how to score them. Following teacher training, two members of teaching staff
will assess the FMS ability of their class using FUNMOVES.
For the classes within the inter-rater reliability ‘condition’, researchers will be
present whilst testing is occurring. Researchers will score the children ‘live’,
simultaneously with the teaching staff. No assistance will be given to teachers
during testing, researchers will only observe and score the activities being
undertaken. This methodology will enable an evaluation of how accurately
teachers assess FMS ability comparative to ‘gold standard’ scoring.
One class from each year group (across three different schools) will be tested
using FUNMOVES twice, two weeks apart, under the same testing conditions,
to evaluate test – retest reliability. Testing will be undertaken in the same
location, at the same time of day, by the same members of teaching staff on

183
both occasions to mitigate for the potential impact of these extraneous
variables.
Five children from each year group at three separate schools will be tested on
both FUNMOVES and the Movement Assessment Battery for Children (MABC)
subdomains: (i) Aiming and Catching and (ii) Balance, to evaluate concurrent
and predictive validity. The Aiming and Catching and Balance subdomains
within the MABC include measures of all three subdomains of FMS: Locomotion
(jumping and hopping), Object control (throwing and catching) and Stability (one
leg balance and walking along the line). The Manual Dexterity subdomain within
the MABC will not be evaluated within this study, as these skills are not included
within the categorisation of FMS. These activities are instead related to fine
motor skills, so for example, require children to thread beads on a piece of
string.
Given the internal consistency of FUNMOVES was lower (.64) than the
accepted level PSI (.7) in Chapter 4, the data from all schools (with a wider
range of demographics due to purposive sampling) will be re-evaluated.
Finally, hypotheses testing validity will utilise the data from all six schools to
evaluate the following:
(i) No significant differences will be found between total FUNMOVES scores
for males and females
(ii) Children from low SES will perform significantly worse on FUNMOVES
than children from middle and high SES
(iii) White British children will have a significantly higher total FUNMOVES
score than South Asian children
5.3.5 Analysis Plan
Agreement between teachers and researchers (inter-rater reliability), the
stability of FUNMOVES as a measure across time (test-retest reliability) and
how well FUMOVES compares to the MABC (concurrent validity) will be
assessed using intra-class correlations (ICC; two-way mixed effects,
consistency, multiple raters/measurements). The MABC Aiming & Catching and
Balance subscales will be used in analyses, instead of Total Score as the
Manual Dexterity subscale does not comprise FMS, rather fine motor skills.
Intra-class correlations were chosen as they were the most commonly used
statistic in the systematic review for these aspects of reliability and validity (see
Chapter 2). ICC evaluates agreement between two quantitative measures for
consistency (Müller & Büttner, 1994). For FUNMOVES to be considered to have
acceptable inter-rater, test-retest reliability, and concurrent validity, ICCs should

184
be ≥.75, to be classified as ‘good’ or ‘excellent’ (Koo & Li, 2016). This is in
alignment with the guidelines used to evaluate studies in the systematic review
in Chapter 2.
Bland-Altman plots (Bland & Altman, 1999) will also be used to evaluate inter-
rater reliability. Bland-Altmann plots allow an evaluation of mean scoring
differences between two individuals (e.g. a teacher and researcher), around
95% agreement limits, to see whether scoring patterns are similar (Bland &
Altman, 1999). Using this in combination with ICC will allow a comprehensive
overview of scoring differences between researchers and teachers.
PSI will be used to evaluate the internal consistency of FUNMOVES (i.e.
through Rasch analysis as was the case in Chapter 4. This will allow the new,
untested scoring system for jumping and hopping to also be evaluated for both
fit to the Rasch model and to ordered scoring thresholds.
To establish whether FUNMOVES and the MABC identify the same children as
struggling with FMS development (predictive validity), logistic regression will be
used. Logistic regression allows you to evaluate the extent to which a
categorical outcome on one assessment tool (e.g. children identified as below
the 15th percentile on FUNMOVES) can predict a child’s categorisation as
having difficulties on a different assessment tool (Menard, 2010), such as the
MABC, and is therefore ideal for this purpose. A sensitivity and specificity
analysis will also be conducted to determine the proportion of true negatives,
true positives, false negatives and false positives.
Linear regressions will be used to test whether gender, ethnicity and SES have
an impact on FMS ability (as measured by FUNMOVES total score; hypotheses
testing validity). Four models will be utilised to evaluate these hypotheses:
Model 1: Independent Variables (IV) – gender, Dependent Variable (DV) –
FUNMOVES total score, variables controlled for – age, ethnicity, IMD decile,
SEND status, and free school meal status.
Model 2: IV – IMD decile, DV – FUNMOVES total score, variables controlled for
– age, gender, ethnicity, SEND status, and free school meal status.
Model 3: IV – free school meal status, DV – FUNMOVES total score, variables
controlled for – age, gender, ethnicity, IMD decile, and SEND status.
Model 4: IV – ethnicity, DV – FUNMOVES total score, variables controlled for –
age, gender, IMD decile, SEND status, and free school meal status.

185
5.4 Work Package 2 – Feasibility and Acceptability
5.4.1 Design
The theoretical underpinning of this study was informed by the scaffolding
approach (Crotty, 1998), and a diagrammatic representation of this can be seen
in Figure 34. Adopting this approach ensures epistemological, philosophical and
theoretical perspectives are considered and used to inform the selection of an
appropriate methodology. Epistemologically, the research in this work package
will be rooted in constructionism which proposes that knowledge is constructed
rather than created (Papert & Harel, 1991). It is thought that construction
happens when a person interacts within their social environment (i.e. the
teachers and their professional environment), which subsequently allows them
to construct their own version of reality that is reflective of their experienced
truths.
Figure 34 - diagrammatic representation of the scaffolding approach for Work Package 2
Adopting a constructivist approach in this study will allow the researcher to
explore the experiences of the teachers as they use FUNMOVES within their

186
workplace. Their interpretation their experiences of using FUNMOVES will
inform teachers’ perceptions of school-based FMS assessment tools and their
evaluation of how useful they are. This will inform the development of their
personal “truth” (Crotty, 1998), which will be socially constructed within their
professional and workplace culture (i.e. each of the six individual schools). It is
accepted that experiences may differ between teachers, however, the
researchers want to capture and embrace these conflicting constructions as the
aim would be to gather a diversity of experiences. A case study research design
will therefore be adopted (at a school level) to help highlight any similarities or
differences between the individual teachers in each of the schools thus
facilitating cross case analysis between the six schools (Baxter & Jack, 2008).
5.4.2 Participants
Teaching staff will be recruited to focus groups at training sessions, prior to
testing commencing in their schools as part of Work Package 1. Researchers
will aim to recruit 6-10 teachers from each school for each focus group to
optimise group size (Liamputtong, 2011). Where possible, focus groups will
consist of at least one teacher or teaching assistant from each year group that
helped with the delivery of FUNMOVES, as it is likely that different year groups
will pose different challenges. To avoid pre-existing social dynamics influencing
the responses of participants, members of the senior leadership team will not be
invited to participate (Krueger & Casey, 2014). Focus groups will be conducted
in each of the six schools involved in Work Package 1, or until there is
saturation in the data, whichever occurs first (Liamputtong, 2011). Saturation
occurs when new themes are no longer emerging from focus groups, thus the
research is not eliciting any new information.
5.4.3 Measures
To establish the feasibility and acceptability of FUNMOVES, focus groups will
be utilised. As was mentioned in Chapter 3, the COM-B model (Michie et al.,
2011) allows an understanding of a wide-range of multifaceted factors
influencing behaviour(s) through using one model of behaviour change, rather
than applying multiple theories or being more selective of theories. Additionally,
the COM-B model has matched behaviour change techniques (Behaviour
Change Wheel) that propose solutions to increase the likelihood of a behaviour.
The questions asked within the focus group will therefore be aligned to the
COM-B model, and the prompts for discussion will be based on the associated
TDF (Cane et al., 2012) aspects (see Table 38).

187
Table 38 - Focus Group Discussion Guide
COM-B Aspect Sub-Component Question Prompts
Capability Psychological How confident
were you that you
would be able to
assess FMS of
your pupils?
• Do you feel like
you understand
what FMS are
and their
importance?
• What were your
thoughts on the
training session
you were given?
• What were your
thoughts on the
teacher manual?
• Were you able
to demonstrate
the activities?
• What were your
thoughts on the
scoring of the
tasks/ the score
sheet?
• Were there any
issues you
encountered
which made
implementing the
assessment tool
more difficult?
Physical How prepared did
you feel to deliver
the assessment
tool?
Opportunity Social How do you think
schools could
support the use
of FUNMOVES?
• What are your
thoughts on
where
FUNMOVES
would fit into the
curriculum? Physical Do you think it
would be feasible

188
COM-B Aspect Sub-Component Question Prompts
to use
FUNMOVES to
screen FMS in a
school setting?
• Would you be
able to access
support from
another member
of staff to
implement
FUNMOVES at
the start of the
school year?
• Does your
school have the
resources
required for you
to be able to
undertake
FUNMOVES?
• Do you think
that SLT would
be supportive of
routinely
assessing the
FMS of pupils at
your school?
Motivation Automatic What are your
thoughts on
FUNMOVES?
• Was there
anything about
FUNMOVES you
particularly liked?
• Was there
anything about
FUNMOVES you
particularly
disliked?
• Were there any
aspects of
Reflective Would you use
FUNMOVES
again, and why?

189
COM-B Aspect Sub-Component Question Prompts
FUNMOVES you
would change?
• What were your
thought on the
feedback given to
the school after
testing?
• Do you think
using
FUNMOVES was
beneficial?
5.4.4 Procedures
Focus groups will be held at each of the schools involved in Work Package 1
and will consist of one teacher from each year group tested. Focus groups will
last no longer than an hour, and will be voice recorded and transcribed verbatim
to aid analysis. During the focus groups participants will be asked to decide on
a pseudonym that they will be referred to throughout in order to ensure
anonymity. Participants will be informed that all comments made during focus
groups will be confidential, and that they are free to contribute at any time, to
encourage active participation (Denzin & Lincoln, 2008). Focus groups will be
held in person, in a quiet, place within the school that the teachers work in, to
ensure that the participants feel comfortable (Liamputtong, 2011).
A facilitator and a moderator will run the focus groups. The facilitator will ask the
questions and encourage discussion around issues as they arise. They will also
ensure all participants get a chance to contribute by mitigating dominant voices
(Berg et al., 2004). The moderator will take notes on body language and any
other non-verbal cues and keep the facilitator to time. Participants in the group
will be encouraged to ask any questions about the study to ensure there is a
researcher and participant reciprocity in the data collection process. Visual
prompts, such as pictures of the activities, and the FUNMOVES manual will be
brought to the focus groups to aid memory. Research has found that the use of
such prompts helps to ensure the richness (Bukhave & Huniche, 2016) and
accuracy (Rose, 2016) of the data collected. This is particularly important, as it
is likely that some time may have passed between some teachers’
implementation of the assessment tool and the focus groups, in which time,
teachers may have forgotten details.

190
Reflective listening will be used by the researcher throughout the focus groups
as it will help the researcher to clarify information ensuring that participants’
meanings are not misinterpreted or misconstrued (Charmaz, 2006). It is useful
as a way to probe teachers for more information and gather a rich and thick
description of their experiences, enabling a complete picture of their opinions to
be presented (Bailey, 1982).
Upon completion of focus groups, teachers will be sent transcriptions of their
contributions during the session, and will be given the opportunity to change/
amend the transcript to reflect their true feelings to increase the trustworthiness
and credibility of the data. This is known as “member checking”. Participants will
be given two weeks to send back any amendments.
5.4.5 Analysis Plan
NVivo (www.qsrinternational.com/nvivo/) will be used to sort and organise the
data using thematic analysis. An experienced qualitative researcher will be used
to peer review and moderate a sample of the focus groups and the analysis,
thus enhancing credibility and trustworthiness of the study. Thematic analysis
allows you to identify and analyse patterns within qualitative data (Joffe, 2011).
Thematic analysis was chosen as it is a rigorous and systematic way to engage
with data which allows researchers to develop a robust analysis, independent of
theoretical frameworks (Willig & Stainton Rogers, 2017). Additionally, thematic
analysis can be used to gain group consensus on issues and allows for
potential solutions to be highlighted, thus the emphasis is put on themes that
are most important to end users (Joffe, 2011). This will be particularly important
for establishing ways to improve the feasibility and acceptability of using
FUNMOVES within a school setting.
5.5 Research Support
In order to implement the protocol, a minimum of two researchers will be
required (i.e. the number needed to score a class using FUNMOVES). It is,
however, likely that more researchers will be required to complete the MABC
assessments in a timely manner (due to the MABC taking one hour per child).
In order to ensure this testing could be completed within the timeframe of the
PhD, a number of the 10 Born in Bradford (BiB) interns will be trained to assist
with data collection.
5.6 Discussion
It is important to evaluate all aspects of validity and reliability, as Chapter 2
established that many studies have been selective about the psychometric

191
properties measured. The protocol outlined in this chapter would ensure that all
psychometric properties outlined by the COSMIN checklist (Mokkink et al.,
2010b) that can be quantified (and thus were included in the review in chapter
2) would be evaluated except two: intra-rater reliability and cross-cultural
validity.
Intra-rater reliability was not included within this protocol due to the time-
pressures that schools face (Routen et al., 2018). This would require teachers
and teaching assistants watching the session back (e.g. via video) and re-
scoring the children. Although test-retest reliability will have a similar time
requirement, unlike test-retest reliability, intra-rater reliability would not be able
to be completed with the class present. It would require sessions being filmed
and either: (i) the school finding cover for the teacher and teaching assistant so
that lessons can continue as usual, or (ii) teaching staff doing this in their own
time, after working hours. This was deemed to be an excessive demand to
place on teachers on top of focus groups, which may hinder recruitment of
schools. Additionally, it is likely that video and in person ‘live’ assessments
would provide dissimilar conditions for scoring. Moreover, with FUNMOVES
being used to screen ability, it is unlikely that teachers, in everyday practice,
would have the time to review footage of assessments. Thus the research team
decided that inter-rater reliability would provide a sufficient indicator for the
accuracy of teacher scoring. For cross-cultural validity, as a normative dataset
has yet to be established, this would not be possible within the timeframe of this
PhD.
For hypotheses testing validity, hypothesis (i) was included as the Rasch
analysis (as seen in Chapter 4) found no evidence to support there being sex
differences for FUNMOVES across all three studies. This is contrary to previous
literature which stipulates gender differences in FMS ability, albeit with
differences in regards to whether boys (Adeyemi-Walker et al., 2018; Eyre et
al., 2018) or girls (Matarma et al., 2020; Niemistö et al., 2020) are more
proficient. It is possible these differences represent sociocultural biases that are
present within current assessment tools. For example, boys have been regularly
found to be more proficient at object control skills, most frequently kicking
(Adeyemi-Walker et al., 2018; Eyre et al., 2018; Kelly et al., 2019). Meanwhile,
assessments such as the TGMD (Ulrich, 1985, 2000, 2016) include tasks that
require children to kick a football - a skill which is most commonly practiced by
boys. As the object control tasks within FUNMOVES will likely be either equally
novel (kicking a beanbag) or familiar (throwing a beanbag) to both boys and
girls, it is therefore hypothesised these previously reported differences will not
occur.

192
Hypotheses (ii) and (iii) were included as these are commonly found
associations within FMS literature (Adeyemi-Walker et al., 2018; Barnett, Lai, et
al., 2016; Eyre et al., 2018). Bradford is the ideal setting to test the nature of
these relationships as it is ethnically diverse, with roughly equal proportions of
White British and South Asian residents (Dickerson et al., 2016) making up ,
and it is also polarised with regards to SES, with some of the poorest and
wealthiest wards in England (Public Health England, 2020a).
Finally, it is critical that research is done with teachers to understand feasibility
and acceptability from an end-user viewpoint, to enable modifications to be
made (within the remit of what has been accepted by Rasch analysis), to allow
universal screening of FMS ability in schools to become a reality.
5.6.1 Strengths and Limitations
Firstly, the research outlined within the protocol in this chapter is proposed to
take place in the Bradford district area, to utilise well-established links with BiB,
CAER and the DfE’s Bradford Opportunity Area to maximise the potential for
recruitment to enable testing to occur within the timeframe of this PhD. Bradford
is the fifth largest metropolitan district in England (Bradford Council, 2018). It is
also one of the most ethnically diverse cities in the UK, including children from
South Asian, as well as Central and Eastern European backgrounds (Dickerson
et al., 2016). In addition, Bradford is one of the youngest districts, with a third of
the population falling under the age of 20 (Bradford Council, 2018). The city
encompasses some of the most deprived areas in the UK, with nearly a quarter
of children that reside in Bradford live in poverty, and also some of the most
wealthy areas (Public Health England, 2020b). Bradford therefore offers a
unique opportunity to explore the impact of SES and ethnicity within a city with
many young children, and thus will be a great place to explore the hypotheses
outlined in Section 5.3.5.
It is, however, important to note that there may potentially be problems for the
generalisability of this research, as it utilises a city with such a unique set of
demographics. The levels of deprivation, and the proportion of ethnic minorities
in Bradford is much greater than the UK average. The latest census data
reported that 86% of the population in the UK classified themselves as ‘White’
and only 7.5% stated they were ‘Asian’. Bradford therefore has approximately
32.5% higher rates of people from Asian ethnicity living within the district than
the national average (Office for National Statistics, 2011). Additionally, more
families in Bradford live in Poverty than the UK average (Public Health England,
2020a). It will therefore be important for future research to establish the validity,
reliability, feasibility and acceptability of using FUNMOVES to screen for FMS

193
difficulties in schools outside of the Bradford area, ensuring that a sample which
is representative of the demographics within the UK are tested.
Furthermore, to evaluate the feasibility and acceptability of FUNMOVES for use
in school-based universal screening programmes of FMS, focus groups were
chosen because they are flexible, quicker than interviews and more naturalistic
in terms of the conversation elicited and thus can make participants feel more
comfortable (Wilkinson, 2004). Additionally, research has shown that interaction
between individuals can elicit a lot of data (Morgan, 1996) and that such
conversations can lead to ideas being built upon or new ideas being formulated
(Morgan, 1996; Wilkinson, 2004). This potential for increased creativity and
problem solving will be particularly useful for understanding ways in which the
assessment tool could be further modified (Krueger & Casey, 2014) to increase
its feasibility and acceptability as a universal screening tool for use within
schools. Moreover, focus groups pass more of the control over to the group,
which allows them to develop themes which are important to them, rather than
priorities set by the researcher. This may help to elicit responses that reveal
previously unknown issues (Wilkinson, 2004).
It is, however, important to note that there are a number of potential limitations
to using focus groups in this context. Firstly, it has been suggested that all
participants in the focus group should be matched on socioeconomic status,
gender and ethnicity (Krueger & Casey, 2014). Secondly, it has been postulated
that participants of focus groups should not know each other, as this has the
potential to bring pre-existing group dynamics into the situation which may
make it more difficult for participants to share their opinion (Crabtree et al.,
1993). This would not be possible for the focus groups in these studies, due to
participants being invited to take part due to their experiences of implementing
FUNMOVES. It therefore cannot be guaranteed that teachers within a school all
have similar demographics. However, all teachers within the focus group will
already know each other and have a working relationship, so there should be a
mutual respect within the group. In order to reduce power dynamics impacting
upon participants sharing their thoughts, it will however, be important to ensure
that separate focus groups are held for members of the Senior Leadership
Team (SLT).

194
Chapter 6
Discussion
6.1 General Summary
This thesis developed an assessment tool that could be utilised for universal
screening of FMS ability in a primary school setting. Research has shown that
there are a large proportion of children who have ‘below average’ FMS ability,
when compared to normative datasets (Bolger et al., 2020). The percentage of
children struggling with these skills will likely only have increased due to the
lack of movement opportunities afforded to children throughout the COVID-19
pandemic (Pombo et al., 2021; Pombo et al., 2020).
Worryingly, however, despite the importance of FMS for other aspects of
development (Brown & Cairney, 2020; De Meester et al., 2020; Jones et al.,
2020; Macdonald et al., 2018; Stodden et al., 2008), children in the UK are not
routinely screened for such difficulties. Thus, children that would benefit from
additional support are being missed. Schools have been identified as the ideal
location to host such initiatives (Finch, 2015) as a the majority of children attend
school, and those that do spend a large proportion of their week there.
Assessing FMS in schools is not a new concept, it is routinely done in Australia
(Department of Education Victoria, 2009; Department of Education Western
Australia, 2013), however prior to the work in this thesis, there was limited work
being done to establish such initiatives in the UK.
This thesis therefore (i) explored what assessment tools were available to
measure FMS in school-aged children that could be used for universal
screening (ii) evaluated the validity and reliability of these assessment tools (iii)
examined what factors would make FMS assessments feasible for use in a
school setting and (iv) developed an assessment tool that has strong theoretical
and psychometric underpinnings, which is also suitable for use in a universal
screening programme of FMS ability within Primary schools.
6.2 Key Findings & Implications
6.2.1 Chapter 2
A systematic review was conducted to understand what observational FMS
assessment tools are available to measure the FMS proficiency of school-aged
children, what those assessments entail as well as how valid and reliable they
were (addressing thesis aims i and ii). The search was conducted in seven

195
online databases, and identified that 24 different assessment tools were being
used within the literature for this purpose. Of these assessment tools, over a
third (33%, n=8) had no studies assessing their validity and/or reliability, and
38% (n=9) only had a single study evaluating a limited number of their
psychometric properties. What is particularly alarming is that some of these
assessment tools (Department of Education Victoria, 2009; Department of
Education Western Australia, 2013) are being used for FMS screening in
schools, despite the lack of empirical evidence to objectively support their
usage in this way. Moreover, research is routinely being conducted that utilises
tools that have not had their psychometric properties fully evaluated. Without
such comprehensive evaluation of these assessments, it is possible that
children struggling with FMS development are being misidentified. Thus, these
tools may not serve their intended purpose. Multiple studies were only found for
8 assessment tools, with the most comprehensively evaluated being the MABC
(n=37 studies), TGMD (n=35 studies) and the BOT (n=22 studies).
Although this was the first systematic review to evaluate the psychometric
properties of assessment tools that have been used to measure specifically
FMS in the literature, similar systematic reviews (Griffiths et al., 2018; Hulteen
et al., 2020; Scheuer et al., 2019), and narrative reviews (Pill & Harvey, 2019)
all identify the MABC, the TGMD and the BOT as being amongst the most
widely used, as well as the most valid and reliable assessments currently
available for use with children. All of these reviews did, however, have
limitations that meant the novel systematic review presented in Chapter 2 was
necessary.
Firstly, Hulteen et al. (2018) excluded studies that sampled children with
physical and/or cognitive impairments. As children with these difficulties can be
found within mainstream schools, it is therefore important that these
assessment tools are valid and reliable for use with these populations. The
review in Chapter 2 highlighted that some of the more well established
assessment tools can be used with these populations, for example the TGMD
and the MABC were both found to be suitable for measuring FMS ability in
children with visual impairments, with modifications (Bakke et al., 2017; A Brian
et al., 2018) as well as children on the Autistic spectrum (Allen et al., 2017;
Borremans et al., 2009). The BOT was also found to be a valid and reliable
measure for children with intellectual deficits (Wuang & Su, 2009). Prior
systematic reviews by Griffiths et al. (2018) and Scheuer et al. (2019) limited
their search to assessment tools for educational or clinical settings respectively.
These reviews, even when considered in combination, therefore preclude
sufficient information to decide on the most appropriate assessment for use in

196
universal screening programmes within schools. Not all observational FMS
assessments are covered by their inclusion criteria, as they exclude those
which are utilised for research purposes. This was evidenced by the systematic
review in this thesis identifying an additional 16 assessment tools not included
within these two aforementioned papers (Africa & Kidd, 2013; Canadian Sport
for Life, 2013; Department of Education Victoria, 2009; Department of
Education Western Australia, 2013; Furtado, 2009; Jiménez-Díaz et al., 2013;
Kalaja et al., 2012; Longmuir et al., 2017; Loovis & Ersing, 1979; National
Association for Sport and Physical Education, 2010; NSW Department of
Education and Training, 2000; Stearns et al., 2019; Sun et al., 2010; Ulrich,
1983; Wessel & Zittel, 1995; Williams et al., 2009). Finally Pill & Harvey (2019)
produced a relatively recent narrative review on this topic. However, the results
of systematic reviews are known to be less biased due to more rigorous
methodologies (Mallett et al., 2012). It is possible that the results of their review
were therefore not entirely reflective of the literature within the field.
Whilst none of the four reviews mentioned above cover the entire span of
school demographics, or assessment tools that could be used in schools, the
results of the systematic review in Chapter 2 confirm similar findings, in that the
MABC, the BOT and the TGMD are again identified as the most valid and
reliable observational FMS assessment tools for school-aged children. These
measures were therefore considered to be the most psychometrically suitable
for school-based screening and thus were taken forward for feasibility
evaluation in Chapter 3.
6.2.2 Chapter 3
In this chapter, an online questionnaire was used to explore teachers’ opinions
on hosting FMS assessments in schools, and to understand what the potential
barriers and facilitators to universal screening in schools might be (addressing
aim iii). The questionnaire was developed utilising two key behaviour change
frameworks – the COM-B model (Michie et al., 2011) and the TDF (Cane et al.,
2012). This facilitated the pairing of appropriate behaviour change techniques to
increase the likelihood of teachers implementing FMS assessments in schools.
Over 800 members of teaching staff from 32 different countries responded to
the questionnaire (although the majority were based in the UK). Teachers
responded, on the whole, very favourably to the proposition of hosting FMS
assessments in schools. Over 60% of teachers believed that knowledge about
their pupils’ FMS ability would improve their teaching, and over 70% would
assess the FMS of their class if there was appropriate training and support
available for them to do so.

197
A number of barriers to school-based assessments of FMS were identified,
spanning all three aspects of the COM-B model (Michie et al., 2011). For
Capability, the main barrier was knowledge about FMS, as 85% of the sample
could not correctly identify FMS from a list of wider motor skills. Without such
knowledge, it cannot be expected that teachers would be willing or able to
assess childhood FMS proficiency. With regards to Opportunity, the main
barrier related to the time available within the school day to implement
assessment tools. Based on teacher responses, it would suggest that 30-60
minutes is the ideal duration to measure the FMS of a whole class. This is a
substantially shorter period of time than the three assessment tools earlier
identified in the systematic review would require. For example the MABC
(Hendersen et al., 2007; Henderson et al., 1992) takes the maximum duration
teachers said was acceptable for class assessment (an hour), to measure the
ability of a single child. Finally, workload stress was identified as a barrier within
the Motivation component of the COM-B model. This is perhaps unsurprising,
given that teaching staff feel under a tremendous amount of time pressure to
cover the ‘core’ curriculum alone (Routen et al., 2018) before formal
assessments (e.g. SATS).
On the other hand, Social opportunity (or social influences from the TDF) was
seen to be a facilitator to school-based FMS assessments. Over 85% of
respondents believed that the senior leadership team (SLT) at their school
would be supportive if they decided to assess the FMS of their class. With
previous research suggesting that SLT support is imperative to the
implementation of new initiatives in schools (Taylor et al., 2011), this finding is
promising.
Based on the data collected from 853 teachers, six guidelines for assessing the
feasibility of school-based FMS assessments were established. This stipulated
that any FMS assessment conducted in schools should: (i) take less than ten
minutes per child or 30-60 minutes per class to administer; (ii) utilise equipment
available in schools or provide necessary equipment; (iii) be implementable in a
maximum of five metres squared of space indoors or outdoors; (iv) be
implementable by no more than two members of teaching staff; (v) after less
than half a day of training; and (vi) be product-oriented in it assesses FMS. Of
the three assessment tools identified by the systematic review as being the
most psychometrically sound, one does not meet any of these criteria (TGMD),
and two only meet one criteria, with the MABC and the BOT both being
product-oriented assessments.
The feasibility of FMS assessments in a school environment had previously
been explored by two papers (Klingberg et al., 2018; van Rossum et al., 2018).

198
Klingberg et al. (2018) outlined seven criteria that assessments should meet to
be considered feasible for use in schools. However, many of these guidelines
were not evidence based, and their formulation does not appear to have been
carried out in co-production with teachers – the end user of school-based
initiatives. So, it is difficult to ascertain just how practical it would be to follow
these guidelines in such settings. Van Rossum et al. (2018) interviewed 39
teachers on their thoughts about assessing FMS in schools. However, all of the
teachers interviewed were P.E. specialists. It has previously been reported that
there is a lack of P.E. specialists within the UK (Ofsted, 2013), and thus if
schools were to be expected to universally screen FMS, it is likely that ‘general’
class teachers will need to implement these assessments. As these teachers
receive less than six hours’ worth of training on P.E. during the entire initial
teacher training course (Harris et al., 2012) it is unlikely that they will have the
same opinions as P.E. specialists on what they would be able to do, due to a
skills gap. Thus it is again questionable how representative the sample within
Van Rossum et al. (2018) are of the population of most interest here.
The study in Chapter 3 therefore added context to the literature and situated it
within a standard school setting to understand feasibility. Considering the
guidelines from both of the above studies and the online questionnaire in this
thesis, it was evident that no pre-existing observational FMS assessment tools
would be feasible for use in school screening programmes. In fact teachers
have recently highlighted the need for more school-based FMS measurement
tools (van Rossum et al., 2018). Evidence therefore supported the development
of a new universal screening tool of FMS, which the remainder of the thesis
focused on.
6.2.3 Chapter 4
Utilising the evidence from both chapters 3 and 4, a new assessment tool
(FUNMOVES) was developed, addressing aim (iv). FUNMOVES was
developed using an iterative process whereby teachers were trained to
implement the assessment, they then trialled the activities on their class before
Rasch analysis and implementation fidelity results were used to suggest
modifications to these activities, before repeating this development cycle. This
process was repeated until the Rasch analysis demonstrated strong evidence of
structural validity (i.e. the requirements for accurate measurement were met)
and major concerns with implementation fidelity were mitigated for.
During this process, over 60 teachers and teaching assistants were trained to
use FUNMOVES to evaluate the FMS proficiency of over 800 children. Study 1
found a multi-dimensional measure that did not fit the Rasch model, with
199
disordered thresholds (jumping, hopping non-dominant (ND) and dominant (D)
legs, ND foot kicking and walking along the line), local dependency (kicking, D
and ND foot; and hopping D and ND legs), and misfitting items (running, ND leg
hopping and static balance). There were also issues with the way some
activities were implemented. For the static balance activity children were getting
multiple opportunities to practice due to the teacher continually demonstrating
the activity. Meanwhile, for walking along the line, teachers were setting
children off too close together, causing ‘congestion’. Staff were also unclear
how much leeway to give children with regards to how close their feet needed to
be.
In an attempt to ameliorate these issues, the second iteration of the
FUNMOVES battery omitted all non-dominant leg activities, as well as the
walking along the line activity. With one of the balance activities removed to
reduce the chance of local dependency (ND one leg balance), and feet apart
being removed because all children were able to complete this and the second
easiest posture, making the inclusion of both redundant, an extra, more
challenging, balance was also added in (pick up a beanbag from the floor on
one leg). Running scoring was also changed to the number of full lengths (5
metres) run, rather than metres to address disordered thresholds. Finally,
teachers were only allowed to demonstrate the activities once, whilst the class
were sat down, to remove the opportunity for children to practice.
Study 2 showed a unidimensional measure, with acceptable internal
consistency and no local dependency, but which did not fit the Rasch model,
had a single mis-fitting item (jumping) and disordered thresholds (jumping,
hopping and balance). There were no major issues with the implementation
fidelity checklist, with nine of the twelve pairs of teachers complying with all
essential criteria. For the remaining classes, the concerns mostly related to
teachers missing instructions. In order to resolve the issues highlighted in this
study, the training and teacher manual was updated to improve clarity.
Additionally, in the third iteration of FUNMOVES, the order of the two most
challenging postures within the Static Balance activity (one leg eyes closed and
one leg pick up beanbag from the floor) was swapped, as the analysis
suggested that one leg eyes closed was more difficult to achieve. The scoring
thresholds for jumping and hopping demonstrated that the levels within these
activities were never sequentially more difficult, thus a target landing zone was
introduced onto each line, which gradually got smaller to increase the precision
needed, to see if this task progressively increased the degree of challenge each
level within this task presented.

200
Study 3 trialled these changes within two schools, although the data from one of
these schools was deemed to be unreliable due to a lack of time being
dedicated to testing sessions, thus this data was removed from the final
analysis. Disordered thresholds were found for running (scoring categories 1-5
were not being utilised), jumping and hopping (the middle scoring categories
were too similar). However, due to the sole remaining school involved in this
study being situated within a high SES area, and children from more
advantaged backgrounds are more likely to have better FMS than their more
deprived peers (Barnett, Lai, et al., 2016), recommendation to further revise the
running scoring was not actioned. Specifically, the working group was
concerned that this could limit the utility of this activity in low and middle SES
schools. For jumping and hopping, the scoring categories were modified in line
with the frequency of achieved scores, and were therefore reduced from six to
four scoring categories, which were then classified as ‘ordered’ when
accounting for 95% confidence intervals. This finalised version of FUNMOVES
was unidimensional and had no other issues with regards to validity except
internal consistency.
The internal consistency was lower than the accepted value within the literature
(0.64 vs 0.7) (Fisher, 1992). This wasn’t, however considered to be a major
concern because Figure 30 demonstrated that the data from this school was
skewed towards higher FMS proficiency, which is perhaps unsurprising given
the demographics of the school. In the two previous studies, the activities within
FUNMOVES were able to measure a wider range of abilities than were present
at this school, whereby there were not enough measurement points to
differentiate between such a narrow pool of proficiency levels. This will likely not
be the case in schools that serve a wider range of SES and ethnicities, and thus
this version of FUNMOVES was accepted as the final version. It will, however,
be important to test its internal consistency, and the proposed new scoring
categories in a range of more diverse schools to verify their utility.
The rigorous process used to develop FUNMOVES allows confidence in its face
and content validity. The use of Rasch analysis (a powerful, modern statistical
technique) to modify activities, in line with standards for accurate measurement,
also allows confidence in its structural validity. Only one other FMS assessment
tool has utilised Rasch analysis during its development – P.E. Metrics (National
Association for Sport and Physical Education, 2010). However, this group of
activities only underwent one round of Rasch analysis, with modifications made
based on that single analysis. FUNMOVES is the first FMS assessment tool to
undertake such rigorous statistical analysis through multiple rounds of
modifications to enhance and ensure structural validity.

201
There has also been research conducted to ascertain expert opinion (i.e.
researchers and trained practitioners) on what school-based assessments of
FMS should include (Van Rossum et al., 2021). The guidelines from this paper
state that fourteen different skills should be measured. FUNMOVES includes
three of these skills as described in their paper (running, hopping forwards, and
one leg balance) and three which have slight differences – in FUNMOVES
jumping is assessed travelling forwards rather than laterally, throwing is
assessed underarm rather than overarm and kicking is completed with a
beanbag rather than a ball. In reality, including more skills within FUNMOVES
would require a longer duration of assessment, and it is known that there needs
to be a trade-off between feasibility and validity/reliability (in this case content
validity) in order for school-based initiatives to be implemented consistently and
effectively (Koutsouris & Norwich, 2018). Increased duration for assessment will
likely make FUNMOVES less acceptable to school teachers, given that the
assessment of a class currently takes up to an hour (the upper limit for
acceptable class level assessment). It would therefore be inappropriate to
increase the number of items.
When considering the items included within FUNMOVES, there are a similar
proportion across the three sub-categories of FMS to those within the expert
guidelines – with similar emphasis on Locomotor and Object Control skills and
less items within Stability. Based on the feasibility guidelines outlined in Chapter
3, which were developed in line with teacher opinion, it suggests FUNMOVES is
also feasible for use in schools. It is important to note that this was not a
consideration within the expert proposed recommendations by Van Rossum et
al. (2021). It will, however, be important to understand the acceptability of
FUNMOVES for teachers that have experienced implementing it. Such
information would be invaluable in making the process of assessing FMS as
easy as possible for non-specialist teachers.
The focus on validity and feasibility throughout the development of FUNMOVES
established sound foundations to allow universal screening of FMS ability to
occur in schools. Universal screening will have a number of benefits, not only
for children, but also for schools involved. Firstly, it gives an opportunity for
teaching staff to be upskilled, and receive CPD training. Chapter 3 established
that teacher knowledge of FMS was very low. By integrating an assessment of
FMS into the schools, teachers will be required to learn about what they are,
why they are important and how to assess them. This will empower them with
knowledge that will enable a more holistic overview of the development of the
children in their class. This will hopefully help teachers to take a more ‘whole-

202
child’ approach when dealing with any issues that arise in a given child’s
development.
Secondly, universal screening has the potential to expedite access to further
assessment and intervention because it is well suited to facilitating increased
communication and collaboration between healthcare services, families and
education, which often exist in very separate silos. The integration and sharing
of knowledge from all three areas will enable a more rapid and targeted
response to developmental delays, which will ultimately ensure children have
the best opportunities to lead a healthy and happy life. Research has previously
shown that combining both education and healthcare services can improve the
number of children being identified with difficulties, with reduced gender bias
(Missiuna et al., 2017). This research, did not, however, screen all children for
difficulties. Instead, OTs were placed within schools to visually observe children
within a classroom setting, to see whether there were any children struggling to
engage with learning, for example with handwriting. If the OTs noticed children
with difficulties, these children were then comprehensively assessed using the
MABC-2 (Hendersen et al., 2007). Although this method increased the
identification of children with motor difficulties, it is problematic that this
methodology would likely not help to identify FMS difficulties, due to these skills
rarely being exhibited within a typically sedentary classroom setting.
Considering the success of even this less comprehensive school identification
programme, there is therefore great potential for universally screening FMS
ability to yield even wider benefits.
6.3 Future Research
First and foremost, it will be crucial for the protocol outlined in Chapter 5 to be
implemented. The studies outlined in this chapter were designed to evaluate the
acceptability, validity and reliability of FUNMOVES (addressing aim five). It
important that FUNMOVES has (i) acceptability in the eyes of teachers (ii)
stable measurement across time and implementers and (iii) scores that are
representative of children’s true FMS ability level, so that children with
difficulties are accurately identified. These are essential pre-conditions before
widespread, routine use of FUNMOVES within schools can be considered
justifiable.
This work was due to be completed during the timeframe of this PhD, but due to
restricted access to schools during the COVID-19 pandemic this was not
possible. The pandemic, has however, had a detrimental impact upon children’s
health and wellbeing. Research has shown that only 27.4% of children in
Bradford were meeting physical activity guidelines for MVPA during lockdown

203
(Bingham et al., 2021) and that FMS proficiency reduced during this time
(Pombo et al., 2021). Given the importance of FMS for health and wellbeing
(Brown & Cairney, 2020; Cattuzzo et al., 2016; De Meester et al., 2020; Sacko,
2020), it could be argued that screening these skills is now more important than
ever, to ensure that children have the best opportunity to catch up with their
development.
Specialist P.E. teachers have previously suggested that technology (e.g.
electronic tablets) should be utilised for school-based assessments of FMS, and
that feedback given to schools needs to be able to feed into lesson plans to
improve outcomes for children that are struggling (van Rossum et al., 2018).
Whilst in its current form, FUNMOVES does not utilise these two suggestions,
there is scope to incorporate both into the measure. There are a number of
ways in which technology could be utilised to support the use of FUNMOVES in
schools. Firstly, having an app or a website that teachers could use to score
children’s ability directly into a normative database would not only ensure that
the normative data used to calculate performance relative to age was
continually updated. Secondly, it would also allow feedback to be given to
schools on children’s abilities more rapidly. In Chapter 4, teachers filled in
scores for children by hand, and then either researchers or administrative staff
at the school input these scores into an excel file. Automating this step would
save time for both schools, and researchers alike. Similarly, feedback is
currently automated through an Excel Macro, transferring such code for use
within an online database would enable teachers to receive feedback on their
pupils’ abilities instantly. It will, however, be imperative that when recruiting for
the normative database, that a range of both socioeconomic status and ethnicity
are included (Adeyemi-Walker et al., 2018; Barnett, Lai, et al., 2016) to ensure
that it is representative of the whole population. Finally, technology could be
utilised to widen the scope of FUNMOVES by hosting training sessions online,
removing the need for a researcher to travel between schools.
Furthermore, there are a number of important additional research questions that
would arise if aspects of FUNMOVES were moved online. Firstly, Chapter 3
established a number of behaviour change techniques that would likely improve
the uptake of school-based assessments of FMS, one of which was hosting
training in person. This was suggested to ameliorate workload stress, by
encouraging a more collaborative environment in schools with regards to FMS.
It will therefore be important to establish whether online training would
negatively impact upon teachers’ perceived abilities to do such assessments
within school time. Additionally, research would be needed to evaluate whether
online training is as effective as in person training at delivering the key

204
information needed to assess children using FUNMOVES (i.e. are there the
same levels of fidelity achieved after online training as after in-person training?).
Finally, it would be imperative to understand what information teachers would
find useful to be included in automated reports (e.g. whether they would want,
individual, class level, and/or school level data, as well as what guidance on
their written interpretation is required). This will be particularly important to
ensure utility for schools, due to reduced researcher contact with online training
and automated reports, as previously, researchers were able to provide
additional information to schools on request.
The research detailed above, including further evaluation of psychometric
properties, feasibility and acceptability, and digitising aspects of FUNMOVES
has been presented to Sport England and the London Marathon Charitable
Trust, and they are providing funding for a post-doc position to enable further
development as well as to broaden FUNMOVES to include wider aspects of
physical literacy.
With regards to providing teachers with feedback, van Rossum et al. (2018)
found that teachers would like FMS assessment tools to feedback on ways to
facilitate improvements in FMS ability within the school. Whilst FUNMOVES
does not currently do this, there is an aligned intervention programme presently
being developed within Bradford, which could be incorporated (Towards Healthy
Education; Accelerated Learning of Playground Skills; The Alps) to facilitate
such feedback. The Alps was developed by researchers at the University of
Leeds in an attempt to mitigate the need for over-stretched NHS services to be
heavily involved in supporting children, families and schools (Finch, 2015) in
efforts to reduce identified FMS difficulties.
The Alps is a teacher-led intervention, in which schools are given a manual that
outlines activities, how to implement them and the frequency that they should
be practiced in order to help advance children’s FMS. The activities within the
manual are based on evidence-based activities found within a systematic
review of high quality randomised controlled trials (Preston et al., 2017) which
were proven to be the most effective at improving FMS in clinical settings. The
manual was co-developed with teachers and teaching assistants to ensure
clarity and school staff have been observed to ensure that what is written
translates to accurate implementation of the activities. There is the opportunity
to align The Alps with FUNMOVES feedback, by integrating a ‘prescription’ of
activities for children that are identified as struggling using FUNMOVES, tailored
to their specific needs. Activities could also be suggested on a class level to
address the, on average, least well performed aspects of FMS within the group.
This will empower schools and teachers further, to not only allow them to

205
identify difficulties but also begin to resolve them. Additionally, it will enable
some of the burden to be reduced on over-stretched NHS services, potentially
enabling quicker appointment times for the children who need more specialist
help with motor difficulties. However, the efficacy of teacher implementation of
these physiotherapy exercises has yet to be tested. It will be crucial to ensure
that these activities have utility in school settings, before The Alps can be
integrated into FUNMOVES feedback.
In addition to the research outlined above, it would be advantageous to explore
whether FMS ability as scored by FUNMOVES is associated with other aspects
of childhood development. By capitalising on the work that is already being
done by the Bradford Institute for Health Research to link healthcare and
education data, and working in collaboration with the Born in Bradford (BiB)
longitudinal cohort study, data collection for FUNMOVES across Bradford would
enable such associations to be evaluated. Firstly there is a lack of research on
the influence of early life factors on FMS development. Within the BiB 1000
cohort (a nested sub cohort, comprising 1700+ mothers) data was collected on
the home environment, from 0 to 3 years of age, which may influence a child’s
opportunity to develop FMS. For example, when the children were two and
three years old questionnaires asked mothers about (i) their own physical
activity behaviours (ii) their child’s physical activity behaviours (iii) access to
active toys, such as trampolines, climbing frames, balls and bikes, (iv) the time
their child spends playing actively, and (v) the time their child spends in indoor
and outdoor play areas. Testing for associations between these early learning
opportunities and later FMS ability (as measured by FUNMOVES) would enable
insights into the role the home environment plays in physical activity
behaviours. One study has previously looked at similar associations in an
Australian sample (Barnett, Hnatiuk, et al., 2019), but there has yet to be such
research within the UK.
Exploring relationships between FMS and other aspects childhood development
that have previously been evaluated within the literature would also be
beneficial (see Chapter 1), using both cross sectional, and longitudinal
analyses. For example evaluating the relationship between FMS (as measured
by FUNMOVES) and academic attainment, socioemotional development,
physical activity, physical literacy and health as well as exploring whether
biological, home environment, social and cultural factors act as moderators and
mediators for these relationships.
Finally, considering that the purpose of FUNMOVES is to identify children
struggling with FMS development, it would be interesting to evaluate the clinical
significance of the tool. As assessments for motor skill difficulties are currently

206
based within the NHS, it would be essential to work collaboratively with
healthcare professionals (e.g. occupational therapists and physiotherapists) to
evaluate the utility of FUNMOVES for use by these professional groups in their
practice. For example, it could be interesting to evaluate how teacher
identification of children with FMS difficulties (using FUNMOVES) compares to
occupational therapists’/ physiotherapists’ opinion of difficulties and whether
FUNMOVES is suitable for assessing the fundamental movement skills of
children who have special educational needs and disabilities.
6.4 Conclusion
To conclude, this thesis developed a universal screening tool of FMS with
sound theoretical and psychometric underpinnings that is feasible for use in
schools. The extensive groundwork done in advance of developing
FUNMOVES, in particular, enables enhanced confidence in its theoretical
underpinnings and its feasibility. A systematic review evaluating pre-existing
FMS assessment tools and their validity and reliability was conducted. The
results of this review showed that three assessment tools had sufficient
evidence to support their use in schools – the MABC, the BOT and the TGMD.
Feasibility in a school setting was then explored, utilising an online
questionnaire to understand teacher opinions of FMS assessments in schools,
as well as barriers and facilitators to such initiatives. Results highlighted that
none of the pre-existing assessment tools that had strong psychometric
properties would be feasible for use in schools. From this questionnaire
guidelines were set for what FMS assessments in schools should entail in order
to be feasible. These were then used to underpin the development of
FUNMOVES. Utilising Rasch analysis, through a rigorous and iterative process
of development, enabled confidence in its structural validity.
As FUNMOVES has sound theoretical and psychometric underpinnings and is
feasible for use in schools, it may provide a solution to the inequalities that are
present within the healthcare system which hosts motor skill assessments
currently within the UK. There is great potential for universal screening of FMS
ability in schools, including increased teacher awareness, expedited time to
assessment and intervention, as well as increased communication and
collaboration between healthcare, education and families. It is, however, clear
that more research needs to be undertaken before FUNMOVES can be used
within this context.

207
References
Aadland, E., Andersen, L. B., Migueles, J. H., Ortega, F. B., & Kvalheim, O. M. (2020). Interpretation of associations between the accelerometry physical activity spectrum and cardiometabolic health and locomotor skills in two cohorts of children using raw, normalized, log-transformed, or compositional data. Journal of Sports Sciences, 38(23), 2708-2719.
Adam, C., Klissouras, V., & Ravasollo, M. (1988). Eurofit: Handbook for the
Eurofit Tests of Physical Fitness. Council of Europe, Committee for the Development of Sport.
Adeyemi-Walker, L. J., Duncan, M., Tallis, J., & Eyre, E. (2018). Fundamental
motor skills of children in deprived areas of england: A focus on age, gender and ethnicity. Children, 5(8), 110.
Africa, E. K., & Kidd, M. (2013). Reliability of the teen risk screen: a movement
skill screening checklist for teachers. South African Journal for Research in Sport, Physical Education and Recreation, 35(1), 1-10.
Allen, K., Bredero, B., Van Damme, T., Ulrich, D., & Simons, J. (2017). Test of
gross motor development-3 (TGMD-3) with the use of visual supports for children with autism spectrum disorder: validity and reliability. Journal of autism and developmental disorders, 47(3), 813-833. https://link.springer.com/article/10.1007/s10803-016-3005-0
American Psychiatric Association. (2013). Diagnostic and statistical manual of
mental disorders (DSM-5®). American Psychiatric Pub.
Anastasi, A., & Urbina, S. (1997). Psychological Testing. Prentice Hall.
Andrich, D. (1985). An elaboration of Guttman scaling with Rasch models for
measurement. Sociological methodology, 15, 33-80.
Avery, L. M., Russell, D. J., Raina, P. S., Walter, S. D., & Rosenbaum, P. L.
(2003). Rasch analysis of the Gross Motor Function Measure: validating the assumptions of the Rasch model to create an interval-level measure. Archives of physical medicine and rehabilitation, 84(5), 697-705. https://www.archives-pmr.org/article/S0003-9993(02)04896-7/pdf
Bailey, K. D. (1982). Methods of Social Research. Macmillan Publishing Co.
Baker, E. H. (2014). Socioeconomic status, definition. The Wiley Blackwell
encyclopedia of health, illness, behavior, & society, 2210-2214.

208
Bakke, H. A., Sarinho, S. W., & Cattuzzo, M. T. (2017). Adaptation of the MABC-2 Test (Age Band 2) for children with low vision. Research in Developmental Disabilities, 71, 120-129. https://www.sciencedirect.com/science/article/abs/pii/S0891422217302482?via%3Dihub
Bardid, F., Huyben, F., Lenoir, M., Seghers, J., De Martelaer, K., Goodway, J.
D., & Deconinck, F. J. (2016). Assessing fundamental motor skills in Belgian children aged 3–8 years highlights differences to US reference sample. Acta Paediatrica, 105(6), e281-e290. https://onlinelibrary.wiley.com/doi/abs/10.1111/apa.13380
Bardid, F., Utesch, T., & Lenoir, M. (2019). Investigating the construct of motor
competence in middle childhood using the BOT‐2 Short Form: An item response theory perspective. Scandinavian journal of medicine & science in sports, 29(12), 1980-1987.
Bardid, F., Vannozzi, G., Logan, S. W., Hardy, L. L., & Barnett, L. M. (2019). A
hitchhiker’s guide to assessing young people’s motor competence: Deciding what method to use. Journal of Science & Medicine in Sport, 22(3), 311-318.
Barnett, A. L., Hill, E. L., Kirby, A., & Sugden, D. A. (2015). Adaptation and
Extension of the European Recommendations (EACD) on Developmental Coordination Disorder (DCD) for the UK context. Physical & occupational therapy in pediatrics, 35(2), 103-115.
Barnett, L. M., Hnatiuk, J. A., Salmon, J., & Hesketh, K. D. (2019). Modifiable
factors which predict children’s gross motor competence: a prospective cohort study. International Journal of Behavioural Nutrition and Physical Activity, 16(1), 129.
Barnett, L. M., Lai, S. K., Veldman, S. L., Hardy, L. L., Cliff, D. P., Morgan, P. J.,
Zask, A., Lubans, D. R., Shultz, S. P., & Ridgers, N. D. (2016). Correlates of gross motor competence in children and adolescents: a systematic review and meta-analysis. Sports Medicine, 46(11), 1663-1688.
Barnett, L. M., Minto, C., Lander, N., & Hardy, L. L. (2014). Interrater reliability
assessment using the Test of Gross Motor Development-2. Journal of science and medicine in sport, 17(6), 667-670. https://www.jsams.org/article/S1440-2440(13)00230-2/fulltext
Barnett, L. M., Stodden, D., Cohen, K. E., Smith, J. J., Lubans, D. R., Lenoir,
M., Iivonen, S., Miller, A. D., Laukkanen, A., & Dudley, D. (2016). Fundamental movement skills: An important focus. Journal of Teaching in Physical Education, 35(3), 219-225.

209
Barnett, L. M., Telford, R. M., Strugnell, C., Rudd, J., Olive, L. S., & Telford, R. D. (2019). Impact of cultural background on fundamental movement skill and its correlates. Journal of Sports Sciences, 37(5), 492-499.
Barnett, L. M., van Beurden, E., Morgan, P. J., Brooks, L. O., & Beard, J. R.
(2010). Gender differences in motor skill proficiency from childhood to adolescence: A longitudinal study. Research quarterly for exercise & sports, 81(2), 162-170.
Barnett, L. M., Webster, E. K., Hulteen, R. M., De Meester, A., Valentini, N. C.,
Lenoir, M., Pesce, C., Getchell, N., Lopes, V. P., Robinson, L. E., Brian, A., & Rodrigues, L. P. (2021, 2021/08/31). Through the Looking Glass: A Systematic Review of Longitudinal Evidence, Providing New Insight for Motor Competence and Health. Sports Medicine. https://doi.org/10.1007/s40279-021-01516-8
Baxter, P., & Jack, S. (2008). Qualitative case study methodology: Study design
and implementation for novice researchers. The qualitative report, 13(4), 544-559.
Becker, R., Möser, S., & Glauser, D. (2019). Cash vs. vouchers vs. gifts in web
surveys of a mature panel study––Main effects in a long-term incentives experiment across three panel waves. Social Science Research, 81, 221-234.
Behan, S., Belton, S., Peers, C., O’Connor, N. E., & Issartel, J. (2019). Moving
Well-Being Well: Investigating the maturation of fundamental movement skill proficiency across sex in Irish children aged five to twelve. Journal of Sports Sciences, 37(22), 2604-2612.
Behan, S., Belton, S., Peers, C., O’Connor, N. E., & Issartel, J. J. E. J. o. S. S.
(2020). Exploring the relationships between fundamental movement skills and health related fitness components in children. 1-23.
Berg, B. L., Lune, H., & Lune, H. (2004). Qualitative research methods for the
social sciences (Vol. 5). Pearson
Bevans, K., Fitzpatrick, L.-A., Sanchez, B., & Forrest, C. B. (2010). Individual
and instructional determinants of student engagement in physical education. Journal of Teaching in Physical Education, 29(4), 399-416.
Bingham, D. D., Daly-Smith, A., Hall, J., Seims, A., Dogra, S. A., Fairclough, S.
J., Ajebon, M., Kelly, B., Hou, B., Shire, K. A., Crossley, K. L., Mon-Williams, M., Wright, J., Pickett, K. E., McEachan, R. R., Dickerson, J., & Barber, S. (2021). Covid-19 lockdown: Ethnic differences in children’s self-reported physical activity and the importance of leaving the home environment. A longitudinal and cross-sectional. International Journal of

210
Behavioural Nutrition & Physical Activity, 18. https://doi.org/https://doi.org/10.1186/s12966-021-01183-y
Bland, J. M., & Altman, D. G. (1999). Measuring agreement in method
comparison studies. Statistical methods in medical research, 8(2), 135-160.
Blank, R., Barnett, A. L., Cairney, J., Green, D., Kirby, A., Polatajko, H.,
Rosenblum, S., Smits‐Engelsman, B., Sugden, D., & Wilson, P. (2019). International clinical practice recommendations on the definition, diagnosis, assessment, intervention, and psychosocial aspects of developmental coordination disorder. Developmental medicine and child neurology, 61(3), 242-285.
Blank, R., Smits‐Engelsman, B., Polatajko, H., & Wilson, P. (2012). European
Academy for Childhood Disability (EACD): Recommendations on the definition, diagnosis and intervention of developmental coordination disorder (long version). Developmental medicine and child neurology, 54(1), 54-93.
Bolger, L. E., Bolger, L. A., O’Neill, C., Coughlan, E., O’Brien, W., Lacey, S.,
Burns, C., & Bardid, F. (2020). Global levels of fundamental motor skills in children: A systematic review. Journal of Sports Sciences, 1-37.
Boone, W. J. (2016). Rasch Analysis for Instrument Development: Why, When,
and How? CBE Life Sciences Education, 15(4), 1-7.
Boone, W. J., Staver, J., & Yale, M. (2014). Rasch Analysis in the Human
Sciences. Springer.
Booth, M., Okely, A., Denney-Wilson, E., Hardy, L., Yang, B., & Dobbins, T.
(2006). NSW schools physical activity and nutrition survey (SPANS) 2004: Summary report.
Borremans, E., Rintala, P., & McCubbin, J. A. (2009). Motor Skills of Young
Adults with Asperger Syndrome: A comparative Study. European Journal of Adapted Physical Activity, 2(1), 21-33.
Boulianne, S. (2013). Examining the gender effects of different incentive
amounts in a web survey. Field Methods, 25(1), 91-104.
Bradford Council. (2018). City of Bradford Metropolitan District Council:
Bradford District population update.
Brian, A., Bardid, F., Barnett, L. M., Deconinck, F. J., Lenoir, M., & Goodway, J.
D. (2018). Actual and perceived motor competence levels of Belgian and

211
United States preschool children. Journal of Motor Learning and Development, 6(S2), S320-S336.
Brian, A., Goodway, J. D., Logan, J. A., & Sutherland, S. (2017). SKIPing with
Head Start teachers: Influence of T-SKIP on object-control skills. Research quarterly for exercise and sport, 88(4), 479-491. https://doi.org/https://doi.org/10.1080/02701367.2017.1375077
Brian, A., Pennell, A., Taunton, S., Starrett, A., Howard-Shaughnessy, C.,
Goodway, J. D., Wadsworth, D., Rudisill, M., & Stodden, D. (2019). Motor competence levels and developmental delay in early childhood: A multicenter cross-sectional study conducted in the USA. Sports Medicine, 49(10), 1609-1618.
Brian, A., Taunton, S., Lieberman, L. J., Haibach-Beach, P., Foley, J., &
Santarossa, S. (2018). Psychometric Properties of the Test of Gross Motor Development-3 for Children With Visual Impairments. Adapted physical activity quarterly, 35(2), 145-158. https://journals.humankinetics.com/view/journals/apaq/35/2/article-p145.xml
Brown, D. M., & Cairney, J. (2020). The synergistic effect of poor motor
coordination, gender and age on self-concept in children: A longitudinal analysis. Research in Developmental Disabilities, 98, 103576.
Brown, T. (2019a). Structural Validity of the Bruininks-Oseretsky Test of Motor
Proficiency–Second Edition (BOT-2) Subscales and Composite Scales. Journal of Occupational Therapy, Schools, & Early Intervention, 12(3), 323-353.
Brown, T. (2019b). Structural validity of the Bruininks-Oseretsky test of motor
proficiency–second edition brief form (BOT-2-BF). Research in Developmental Disabilities, 85, 92-103. https://www.sciencedirect.com/science/article/abs/pii/S0891422218302385?via%3Dihub
Brown, T., & Lane, H. (2014). Comparing a parent-report and a performance-
based measure of children's motor skill abilities: are they associated? Occupational Therapy in Health Care, 28(4), 371-381.
Bruininks, R. (1978). Bruininks-Oseretsky test of motor proficiency. American
Guidance Service
Bruininks, R., & Bruininks, B. (2005). Bruininks-Oseretsky Test of Motor
Proficiency (2nd Edition) Manual. AGS Publishing.

212
Bukhave, E. B., & Huniche, L. (2016). Photo-interviewing to explore everyday occupation: Benefits and issues. Journal of Occupational Science, 23(1), 96-107.
Burns, R. D., Bai, Y., Byun, W., Colotti, T. E., Pfledderer, C. D., Kwon, S., &
Brusseau, T. A. (2020, 2020/07/09/). Bidirectional relationships of physical activity and gross motor skills before and after summer break: Application of a cross-lagged panel model. Journal of sport and health science, 00, 1-9. https://doi.org/https://doi.org/10.1016/j.jshs.2020.07.001
Bushnell, E. W. (1985). The decline of visually guided reaching during infancy.
Infant Behaviour & Development, 8(2), 139-155.
Cairney, J., Hay, J., Veldhuizen, S., Missiuna, C., & Faught, B. (2009).
Comparing probable case identification of developmental coordination disorder using the short form of the Bruininks‐Oseretsky Test of Motor Proficiency and the Movement ABC. Child: care, health and development, 35(3), 402-408. https://onlinelibrary.wiley.com/doi/abs/10.1111/j.1365-2214.2009.00957.x
Cairney, J., Veldhuizen, S., Graham, J. D., Rodriguez, C., Bedard, C., Bremer,
E., & Kriellaars, D. (2018). A Construct Validation Study of PLAYfun. Medicine and science in sports and exercise, 50(4), 855.
Canadian Sport for Life. (2013). Physical Literacy Assessment for Youth Basic.
Canadian Sport Institute - Pacific. http://physicalliteracy.ca/wp-content/uploads/2016/08/PLAYbasic_workbook.pdf
Cane, J., O’Connor, D., & Michie, S. (2012). Validation of the theoretical
domains framework for use in behaviour change and implementation research. Implementation science, 7(1), 37.
Cano-Cappellacci, M., Leyton, F. A., & Carreño, J. D. (2016). Content validity
and reliability of test of gross motor development in Chilean children. Revista de saude publica, 49, 97.
Capio, C. M., & Eguia, K. F. (2020). Movement skills, perception, and physical
activity of young children: a mediation analysis. Pediatrics International, in press.
Capio, C. M., Eguia, K. F., & Simons, J. (2016). Test of gross motor
development-2 for Filipino children with intellectual disability: validity and reliability. Journal of Sports Sciences, 34(1), 10-17.
Capio, C. M., Sit, C. H., & Abernethy, B. (2011). Fundamental movement skills
testing in children with cerebral palsy. Disability and rehabilitation, 33(25-26), 2519-2528.

213
Carmines, E. G., & Zeller, R. A. (1979). Reliability and validity assessment (Vol.
17). Sage publications.
Casler, K., Bickel, L., & Hackett, E. (2013). Separate but equal? A comparison
of participants and data gathered via Amazon’s MTurk, social media, and face-to-face behavioral testing. Computers in human behavior, 29(6), 2156-2160. https://doi.org/https://doi.org/10.1016/j.chb.2013.05.009
Caspersen, C. J., Powell, K. E., & Christenson, G. M. (1985). Physical activity,
exercise, and physical fitness: definitions and distinctions for health-related research. Public Health Reports, 100(2), 126-131.
Cattuzzo, M. T., dos Santos Henrique, R., Ré, A. H. N., de Oliveira, I. S., Melo,
B. M., de Sousa Moura, M., de Araújo, R. C., & Stodden, D. (2016). Motor competence and health related physical fitness in youth: A systematic review. Journal of Science & Medicine in Sport, 19(2), 123-129.
Chambers, M. E., & Sugden, D. A. (2002). The Identification and Assessment of
Young Children with Movement Difficulties. International Journal of Early Years Education, 10(3), 157-176.
Chan, Y. (2003). Biostatistics 104: correlational analysis. Singapore Med J,
44(12), 614-619.
Chang, M., & Gu, X. (2018). The role of executive function in linking
fundamental motor skills and reading proficiency in socioeconomically disadvantaged kindergarteners. Learning & Individual Differences, 61, 250-255.
Charmaz, K. (2006). Constructing grounded theory: A practical guide through
qualitative analysis. sage.
Chen, W.-H., & Thissen, D. (1997). Local dependence indexes for item pairs
using item response theory. Journal of Educational and Behavioral Statistics, 22(3), 265-289.
Chien, C.-W., & Bond, T. G. (2009). Measurement properties of fine motor scale
of Peabody developmental motor scales-: A Rasch analysis. American Journal of Physical Medicine & Rehabilitation, 88(5), 376-386.
Chow, S. M., Chan, L.-L., Chan, C. P., & Lau, C. H. (2002). Reliability of the
experimental version of the Movement ABC. British Journal of Therapy and Rehabilitation, 9(10), 404-407.

214
Clark, C. C. T., Bisi, M. C., Duncan, M. J., & Stagni, R. (2021). Technology-based methods for the assessment of fine and gross motor skill in children: A systematic overview of available solutions and future steps for effective in-field use. Journal of Sports Sciences, 39(11), 1236-1276.
Clark, H., Royal, P., Manners, L., Baston-Pitt, L., Revel, E., Leech, G., Davies,
C., Mackay, E., Wyllie, E., Nash, A., Smith, S., Franks, S., Broadbent, C., Albon, D., Coleman, N., Lee, D., Platt, G., Peckham, K., & Randall, V. (2017). Physical Activity in Early Childhood. APPG.
Clark, J. E. (1994). Motor development (Vol. 3). Academic Press.
Clark, J. E., & Metcalfe, J. S. (2002). The mountain of motor development: A
metaphor. Motor Development: Research & Reviews, 2(163-190), 183-202.
Cohen, K. E., Morgan, P. J., Plotnikoff, R. C., Callister, R., & Lubans, D. R.
(2014). Fundamental movement skills and physical activity among children living in low-income communities: a cross-sectional study. International Journal of Behavioural Nutrition and Physical Activity, 11(1), 49.
Cook, C. J., Howard, S. J., Scerif, G., Twine, R., Kahn, K., Norris, S. A., &
Draper, C. E. (2019). Associations of physical activity and gross motor skills with executive function in preschool children from low‐income South African settings. Developmental Science, 22(5), e12820.
Cook, G., Burton, L., & Hoogenboom, B. (2006a). Pre-participation screening:
the use of fundamental movements as an assessment of function-part 1. North American journal of sports physical therapy: NAJSPT, 1(2), 62-72. https://www.ncbi.nlm.nih.gov/pmc/articles/PMC2953313/pdf/najspt-01-062.pdf
Cook, G., Burton, L., & Hoogenboom, B. (2006b). Pre-participation screening:
the use of fundamental movements as an assessment of function-part 2. North American journal of sports physical therapy: NAJSPT, 1(3), 132-139.
Cookson, R., Propper, C., Asaria, M., & Raine, R. (2016). Socio‐economic
inequalities in health care in England. Fiscal Studies, 37(3-4), 371-403.
Cools, W., De Martelaer, K., Samaey, C., & Andries, C. (2011). Fundamental
movement skill performance of preschool children in relation to family context. Journal of Sports Sciences, 29(7), 649-660.
Cowen, P. S. (2001). Effectiveness of a parent education intervention for at‐risk
families. Journal for Specialists in Pediatric Nursing, 6(2), 73-82.

215
Crabtree, B. F., Yanoshik, M., Miller, W., & O'Connor, P. (1993). Successful
focus groups: advancing the state of the art. Selecting individual or group interviews, 137-152.
Crawford, S. G., Wilson, B. N., & Dewey, D. (2001). Identifying developmental
coordination disorder: consistency between tests. Physical & occupational therapy in pediatrics, 20(2-3), 29-50.
Croce, R. V., Horvat, M., & McCarthy, E. (2001). Reliability and concurrent
validity of the movement assessment battery for children. Perceptual and motor skills, 93(1), 275-280.
Crotty, M. (1998). The foundations of social research: Meaning and perspective
in the research process. Sage.
Culmer, P. R., Levesley, M. C., Mon-Williams, M., & Williams, J. H. (2009). A
new tool for assessing human movement: the kinematic assessment tool. Journal of Neuroscience Methods, 184(1), 184-192.
D'Hondt, E., Deforche, B., Gentier, I., Verstuyf, J., Vaeyens, R., De
Bourdeaudhuij, I., Philippaerts, R., & Lenoir, M. (2014). A longitudinal study of gross motor coordination and weight status in children. Obesity, 22(6), 1505-1511.
da Rocha Queiroz, D., Guimarães, T. G. M., Campos, C. M. C., Feitoza, A. H.
P., dos Santos Henrique, R., dos Santos, M. A. M., & Cattuzzo, M. T. (2020). Effect of school type and family income on motor competence changes in pre-school children: a repeated cross sectional study. Journal of Physical Education, 31(1).
Daly-Smith, A., Quarmby, T., Archbold, V. S., Corrigan, N., Wilson, D.,
Resaland, G. K., Bartholomew, J. B., Singh, A., Tjomsland, H. E., & Sherar, L. B. (2020). Using a multi-stakeholder experience-based design process to co-develop the Creating Active Schools Framework. International Journal of Behavioural Nutrition & Physical Activity, 17(1). https://doi.org/https://doi.org/10.1186/s12966-020-0917-z
Darsaklis, V., Snider, L. M., Majnemer, A., & Mazer, B. (2013). Assessments
used to diagnose developmental coordination disorder: Do their underlying constructs match the diagnostic criteria? Physical & occupational therapy in pediatrics, 33(2), 186-198.
De Meester, A., Barnett, L. M., Brian, A., Bowe, S. J., Jiménez-Díaz, J., Van
Duyse, F., Irwin, J. M., Stodden, D. F., D’Hondt, E., & Lenoir, M. (2020). The Relationship Between Actual and Perceived Motor Competence in Children, Adolescents and Young Adults: A Systematic Review and Meta-analysis. Sports Medicine, 50(11), 1-49.

216
de Waal, E. (2019). Fundamental movement skills and academic performance
of 5-to 6-year-old preschoolers. Early Childhood Education Journal, 47(4), 455-464.
De Waal, E., & Pienaar, A. E. (2020). Influences of early motor proficiency and
socioeconomic status on the academic achievement of primary school learners: the NW-CHILD study. Early Childhood Education Journal, 1-12.
Denzin, N. K., & Lincoln, Y. S. (2008). Collecting and interpreting qualitative
materials (Vol. 3). Sage.
Department for Digital Culture Media & Sport. (2015). Sporting Future: A New
Strategy for an Active Nation. H. Government. https://www.gov.uk/government/publications/sportingfuture-a-new-strategy-for-an-active-nation
Department For Education. (2013). Physical Education Programmes of Study:
Key Stages 1 and 2, The National Curriculum. H. Government.
Department For Education. (2014). Early year’s foundation stage. H.
Government. https://www.gov.uk/government/publications/early-years-foundation-stage-framework--2
Department for Education. (2019a). Early years foundation stage profile results
in England, 2019. H. Government. https://assets.publishing.service.gov.uk/government/uploads/system/uploads/attachment_data/file/839934/EYFSP_2019_Main_Text_Oct.pdf
Department For Education. (2019b). PE and sport premium for primary schools.
HM Government https://www.gov.uk/guidance/pe-and-sport-premium-for-primary-schools
Department for Education. (2020). Early years foundation stage profile 2021
handbook. H. Government. https://assets.publishing.service.gov.uk/government/uploads/system/uploads/attachment_data/file/942421/EYFSP_Handbook_2021.pdf
Department for Education, Department for Digital Culture Media and Sport, &
Department for Health and Social Care. (2019). School Sport and Activity Action Plan. H. Government. https://assets.publishing.service.gov.uk/government/uploads/system/uploads/attachment_data/file/848082/School_sport_and_activity_action_plan.pdf
Department of Education Victoria. (2009). Fundamental Motor Skills: A Manual
For Classroom Teachers. Department of Education Victoria.

217
Department of Education Western Australia. (2013). Fundamental movement
skills: Book 2 – The tools for learning, teaching and assessment. http://det.wa.edu.au/stepsresources/detcms/navigation/fundamental-movement-skills/
Department of Health and Social Care. (2019). UK Chief Medical Officers'
Physical Activity Guidelines G. o. t. U. Kingdom. https://www.gov.uk/government/publications/physical-activity-guidelines-uk-chief-medical-officers-report
Diamond, A. (2000). Close interrelation of motor development and cognitive
development and of the cerebellum and prefrontal cortex. Child Development, 71(1), 44-56.
Diamond, A. (2007). Interrelated and interdependent. Developmental Science,
10(1), 152-158.
Dickerson, J., Bird, P. K., McEachan, R. R., Pickett, K. E., Waiblinger, D.,
Uphoff, E., Mason, D., Bryant, M., Bywater, T., & Bowyer-Crane, C. (2016). Born in Bradford’s Better Start: an experimental birth cohort study to evaluate the impact of early life interventions. BMC public health, 16(1), 711.
Dobell, A., Pringle, A., Faghy, M. A., & Roscoe, C. M. (2021). Educators
Perspectives on the Value of Physical Education, Physical Activity and Fundamental Movement Skills for Early Years Foundation Stage Children in England. Children, 8.
dos Santos, J. O. L., Formiga, N. S., de Melo, G. F., da Silva Ramalho, M. H., &
Cardoso, F. L. (2017). Factorial Structure Validation of the Movement Assessment Battery for Children in School-Age Children Between 8 and 10 Years Old. Paidéia (Ribeirão Preto), 27(68), 348-355.
Draper, C. E., Tomaz, S. A., Jones, R. A., Hinkley, T., Twine, R., Kahn, K., &
Norris, S. A. (2019). Cross-sectional associations of physical activity and gross motor proficiency with adiposity in South African children of pre-school age. Public Health Nutrition, 22(4), 614-623.
Drost, E. A. (2011). Validity and reliability in social science research.
Educational Research & Perspectives, 38(1), 105-124.
Duncan, M., Hall, C., Eyre, E., Barnett, L., & James, R. (2021). Pre-schoolers
fundamental movement skills predict BMI, physical activity and sedentary behaviour: A longitudinal study. Scandinavian journal of medicine & science in sports, 31, 8-14.

218
Duncan, M. J., Dobell, A., Noon, M., Clark, C. C., Roscoe, C. M., Faghy, M. A., Stodden, D., Sacko, R., & Eyre, E. L. (2020). Calibration and cross-validation of accelerometery for estimating movement skills in children aged 8–12 years. Sensors, 20(10), 2776.
Duncan, M. J., Roscoe, C. M., Faghy, M., Tallis, J., & Eyre, E. L. (2019).
Estimating physical activity in children aged 8–11 years using accelerometry: Contributions from fundamental movement skills and different accelerometer placements. Frontiers in Physiology, 10, 242.
Duncan, M. J., Roscoe, C. M., Noon, M., Clark, C. C., O’Brien, W., & Eyre, E. L.
(2020). Run, jump, throw and catch: How proficient are children attending English schools at the fundamental motor skills identified as key within the school curriculum? European Physical Education Review, 26(4), 814-826.
Duncan, P. W., Bode, R. K., Lai, S. M., & Perera, S. (2003). Rasch analysis of a
new stroke-specific outcome scale: the Stroke Impact Scale. Archives of physical medicine and rehabilitation, 84(7), 950-963. https://www.archives-pmr.org/article/S0003-9993(03)00035-2/pdf
Dunford, C., Owen, C., & Kelly, J. (2010). Occupational therapy with children
and young people: A perspective from the United Kingdom. Journal of Occupational Therapy, Schools & Early Intervention, 3(2), 187-196.
Dunford, C., & Richards, S. (2003). 'Doubly disadvantaged': report of a survey
on waiting lists and waiting times for occupational therapy services for children with developmental coordination disorder.
Ellinoudis, T., Kourtessis, T., Kiparissis, M., Kampas, A., & Mavromatis, G.
(2008). Movement Assessment Battery for Children (MABC): Measuring the construct validity for Greece in a sample of elementary school aged children. International Journal of Health Science, 1(2), 56-60.
Erwin, H. E., & Castelli, D. M. (2008). National physical education standards: a
summary of student performance and its correlates. Research Quarterly for Exercise & Sport, 79(4), 495-505.
Estevan, I., Molina-García, J., Bowe, S. J., Álvarez, O., Castillo, I., & Barnett, L.
M. (2018). Who can best report on children's motor competence: Parents, teachers, or the children themselves? Psychology of Sport and Exercise, 34, 1-9.
Estevan, I., Molina-García, J., Queralt, A., Álvarez, O., Castillo, I., & Barnett, L.
(2017). Validity and reliability of the Spanish version of the test of gross motor development–3. Journal of Motor Learning and Development, 5(1), 69-81.

219
Evaggelinou, C., Tsigilis, N., & Papa, A. (2002). Construct validity of the Test of
Gross Motor Development: a cross-validation approach. Adapted physical activity quarterly, 19(4), 483-495. https://journals.humankinetics.com/view/journals/apaq/19/4/article-p483.xml
Eyre, E. L., Walker, L. J., & Duncan, M. J. (2018). Fundamental movement skills
of children living in england: the role of ethnicity and native English language. Perceptual and motor skills, 125(1), 5-20.
Farmer, O., Belton, S., & O’Brien, W. (2017). The relationship between actual
fundamental motor skill proficiency, perceived motor skill confidence and competence, and physical activity in 8–12-year-old irish female youth. Sports, 5(4), 74.
Ferreira, L., Vieira, J. L. L., Rocha, F. F. d., Silva, P. N. d., Cheuczuk, F.,
Caçola, P., & Chaves, R. N. d. (2020). Percentile curves for Brazilian children evaluated with the Bruininks-Oseretsky Test of Motor Proficiency. Revista Brasileira de Cineantropometria Desempenho Humano, 22. https://doi.org/https://doi.org/10.1590/1980-0037.2020v22e65027
Field, S. C., Bosma, C. B. E., & Temple, V. A. (2020). Comparability of the test
of gross motor development–Second edition and the test of gross motor development–Third edition. Journal of Motor Learning and Development, 8, 107-125.
Finch, P. (2015). Evidence to the NHS Pay Review Body.
Fisher, A., Reilly, J. J., Kelly, L. A., Montgomery, C., Williamson, A., Paton, J.
Y., & Grant, S. (2005). Fundamental movement skills and habitual physical activity in young children. Medicine and science in sports and exercise, 37(4), 684-688.
Fisher, W. P. (1992). Reliability Statistics. Rasch Measurement Transactions,
6(3), 238.
Folio, M. R., & Fewell, R. R. (1983). Peabody developmental motor scales and
activity cards. PRO-ED.
Folio, M. R., & Fewell, R. R. (2000). PDMS-2: Peabody Development Motor
Scales. PRO-ED.
Foulkes, J., Knowles, Z., Fairclough, S. J., Stratton, G., O'dwyer, M., Ridgers,
N., & Foweather, L. (2015). Fundamental movement skills of preschool

220
children in Northwest England. Perceptual and motor skills, 121(1), 260-283.
Furtado Jr, O., & Gallagher, J. D. (2012). The reliability of classification
decisions for the Furtado-Gallagher computerized observational movement pattern assessment system—FG-COMPASS. Research quarterly for exercise and sport, 83(3), 383-390.
Furtado, O. J. (2009). Development and initial validation of the Furtado-
Gallagher Computerized Observational Movement Pattern Assessment System-FG-COMPASS University of Pittsburgh]. Unpublished.
Gabbard, C., & Rodrigues, L. (2008). Optimizing early brain and motor
development through movement. Early Childhood News.
Gabbard, C. P. (2011). Lifelong motor development. Pearson Higher Ed.
Gale, C. R., O’Callaghan, F. J., Godfrey, K. M., Law, C. M., & Martyn, C. N.
(2004). Critical periods of brain growth and cognitive function in children. Brain, 127(2), 321-329.
Gallahue, D. L., Ozmun, J. C., & Goodway, J. D. (2012). Understanding motor
development: Infants, children, adolescents, adults (7th ed.). M.-G. Hill.
García-Marín, P., Fernández-López, N., & English, C. E. (2020). Motor Skills
Competence in Preschool Education. Apunts Educación Física y Deportes, 141, 21-32.
Garcia, C. (1994). Gender differences in young children's interactions when
learning fundamental motor skills. Research Quarterly for Exercise & Sport, 65(3), 213-225.
Garn, A. C., & Webster, E. K. (2018). Reexamining the factor structure of the
test of gross motor development–Second edition: Application of exploratory structural equation modeling. Measurement in Physical Education and Exercise Science, 22(3), 200-212.
Gibson, E. J. (1987). Introductory essay: What does infant perception tell us
about theories of perception? Journal of Experimental Psychology: Human Perception & Performance, 13(4), 515.
Goodway, J. D., Robinson, L. E., & Crowe, H. (2010). Gender differences in
fundamental motor skill development in disadvantaged preschoolers from two geographical regions. Research Quarterly for Exercise & Sport, 81(1), 17-24.

221
Goodway, J. D., & Smith, D. W. (2005). Keeping all children healthy: challenges to leading an active lifestyle for preschool children qualifying for at-risk programs. Family & Community Health, 28(2), 142-155.
Griffiths, A., Toovey, R., Morgan, P. E., & Spittle, A. J. (2018). Psychometric
properties of gross motor assessment tools for children: a systematic review. BMJ open, 8(10), e021734.
Grimpampi, E., Masci, I., Pesce, C., & Vannozzi, G. (2016). Quantitative
assessment of developmental levels in overarm throwing using wearable inertial sensing technology. Journal of Sports Sciences, 34(18), 1759-1765.
Guan, H., Okely, A. D., Aguilar-Farias, N., del Pozo Cruz, B., Draper, C. E., El
Hamdouchi, A., Florindo, A. A., Jáuregui, A., Katzmarzyk, P. T., & Kontsevaya, A. (2020). Promoting healthy movement behaviours among children during the COVID-19 pandemic. The Lancet Child & Adolescent Health, 4(6), 416-418.
Guthold, R., Stevens, G. A., Riley, L. M., & Bull, F. C. (2020). Global trends in
insufficient physical activity among adolescents: a pooled analysis of 298 population-based surveys with 1· 6 million participants. The Lancet Child & Adolescent Health, 4(1), 23-35.
Hambleton, R. K. (2000). Emergence of item response modeling in instrument
development and data analysis. Medical care, 38, 60-65.
[Record #348 is using a reference type undefined in this output style.]
Hamilton, M. L., & Tate, A. (2002). Constraints on throwing behavior of children.
In Motor development: Research and Review (Vol. 2, pp. 49-61). NASPE Publications.
Hammond, A., Prior, Y., Horton, M. C., Tennant, A., & Tyson, S. (2018). The
psychometric properties of the Evaluation of Daily Activity Questionnaire in seven musculoskeletal conditions. Disability and rehabilitation, 40(17), 2070-2080. https://www.tandfonline.com/doi/pdf/10.1080/09638288.2017.1323027?needAccess=true
Hardy, L. L., Reinten-Reynolds, T., Espinel, P., Zask, A., & Okely, A. D. (2012).
Prevalence and correlates of low fundamental movement skill competency in children. Pediatrics, 130(2), e390-e398.
Harris, J., Cale, L., & Musson, H. (2012). The predicament of primary physical
education: A consequence of ‘insufficient’ITT and ‘ineffective’CPD? Physical Education and Sport Pedagogy, 17(4), 367-381.

222
Haubenstricker, J., & Seefeldt, V. (1986). Acquisition of motor skills during
childhood. American Alliance for Health, Physical Education, Recreation and Dance.
Haynes, S. N., Richard, D., & Kubany, E. S. (1995). Content validity in
psychological assessment: A functional approach to concepts and methods. Journal of Psychological Assessment, 7(3), 238-247.
Health Education England. (2017). An Investigation into the Occupational
Therapy Workforce in London. https://www.rcot.co.uk/news/new-report
Hendersen, S., Sugden, D., & Barnett, A. (2007). Movement assessment
battery for children–2 examiner’s manual. Harcourt Assessment.
Henderson, S., Sugden, D., & Barnett, A. (1992). Movement Assessment
Battery for Children. The Psychological Corporation.
Henrique, R. S., Stodden, D. F., Fransen, J., Feitoza, A. H., Ré, A. H., Martins,
C. M., dos Prazeres, T. M., & Cattuzzo, M. T. (2020). Is motor competence associated with the risk of central obesity in preschoolers? American Journal of Human Biology, 32(3), e23364.
Hoeboer, J., De Vries, S., Krijger-Hombergen, M., Wormhoudt, R., Drent, A.,
Krabben, K., & Savelsbergh, G. (2016). Validity of an Athletic Skills Track among 6-to 12-year-old children. Journal of Sports Sciences, 34(21), 2095-2105. https://www.tandfonline.com/doi/full/10.1080/02640414.2016.1151920
Hoeboer, J., Krijger-Hombergen, M., Savelsbergh, G., & De Vries, S. (2018).
Reliability and concurrent validity of a motor skill competence test among 4-to 12-year old children. Journal of Sports Sciences, 36(14), 1607-1613. https://www.tandfonline.com/doi/full/10.1080/02640414.2017.1406296
Holm, I., Tveter, A. T., Aulie, V. S., & Stuge, B. (2013). High intra-and inter-rater
chance variation of the movement assessment battery for children 2, ageband 2. Research in Developmental Disabilities, 34(2), 795-800. https://www.sciencedirect.com/science/article/abs/pii/S0891422212002715?via%3Dihub
Houwen, S., Hartman, E., Jonker, L., & Visscher, C. (2010). Reliability and
validity of the TGMD-2 in primary-school-age children with visual impairments. Adapted physical activity quarterly, 27(2), 143-159. https://journals.humankinetics.com/view/journals/apaq/27/2/article-p143.xml

223
Hua, J., Gu, G., Meng, W., & Wu, Z. (2013). Age band 1 of the Movement Assessment Battery for Children-: exploring its usefulness in mainland China. Research in Developmental Disabilities, 34(2), 801-808. https://www.sciencedirect.com/science/article/abs/pii/S0891422212002673?via%3Dihub
Hulteen, R. M., Barnett, L. M., Morgan, P. J., Robinson, L. E., Barton, C. J.,
Wrotniak, B. H., & Lubans, D. R. (2018). Development, content validity and test-retest reliability of the Lifelong Physical Activity Skills Battery in adolescents. Journal of Sports Sciences, 36(20), 2358-2367. https://www.tandfonline.com/doi/full/10.1080/02640414.2018.1458392
Hulteen, R. M., Barnett, L. M., True, L., Lander, N. J., del Pozo Cruz, B., &
Lonsdale, C. (2020). Validity and reliability evidence for motor competence assessments in children and adolescents: A systematic review. Journal of Sports Sciences, 38(15), 1717-1798.
Hulteen, R. M., Morgan, P. J., Barnett, L. M., Stodden, D. F., & Lubans, D. R.
(2018). Development of foundational movement skills: A conceptual model for physical activity across the lifespan. Sports Medicine, 48(7), 1533-1540.
Iatridou, G., & Dionyssiotis, Y. (2013). Reliability of balance evaluation in
children with cerebral palsy. Hippokratia, 17(4), 303-306. https://www.ncbi.nlm.nih.gov/pmc/articles/PMC4097408/pdf/hippokratia-17-303.pdf
Information Services Division Scotland. (2018). Allied Health Professionals –
Musculoskeletal Waiting Times in NHS Scotland. https://www.isdscotland.org/Health-Topics/Waiting-Times/Publications/2018-06-19/2018-06-19-AHPMSK-Summary.pdf
Issartel, J., McGrane, B., Fletcher, R., O’Brien, W., Powell, D., & Belton, S.
(2017). A cross-validation study of the TGMD-2: The case of an adolescent population. Journal of science and medicine in sport, 20(5), 475-479. https://www.jsams.org/article/S1440-2440(16)30213-4/fulltext
Jaikaew, R., & Satiansukpong, N. (2019). Movement Assessment Battery for
Children-(MABC2): Cross-Cultural Validity, Content Validity, and Interrater Reliability in Thai Children. Occupational Therapy International, 2019. https://doi.org/https://doi.org/10.1155/2019/4086594
Jiménez-Díaz, J., Salazar, W., & Morera-Castro, M. (2013). Diseño y validación
de un instrumento para la evaluación de patrones básicos de movimiento. Motricidad [Design and validation of an instrument for the evaluation of basic movement patterns. Motricity]. European Journal of Human Movement, 31(0), 87-97.

224
Jírovec, J., Musálek, M., & Mess, F. (2019). Test of motor proficiency second edition (BOT-2): compatibility of the complete and Short Form and its usefulness for middle-age school children. Frontiers in pediatrics, 7, 1-7.
Joffe, H. (2011). Thematic Analysis. In D. Harper & A. Thompson (Eds.),
Qualitative research methods in mental health and psychotherapy: A guide for students and practitioners. John Wiley & Sons.
Jones, D., Innerd, A., Giles, E. L., & Azevedo, L. B. (2020). Association
between fundamental motor skills and physical activity in the early years: A systematic review and meta-analysis. Journal of sport and health science, 00, 1-11.
Kalaja, S. P., Jaakkola, T. T., Liukkonen, J. O., & Digelidis, N. (2012).
Development of junior high school students' fundamental movement skills and physical activity in a naturalistic physical education setting. Physical Education and Sport Pedagogy, 17(4), 411-428.
[Record #342 is using a reference type undefined in this output style.]
Kelly, B., Mason, D., Petherick, E. S., Wright, J., Mohammed, M. A., & Bates, C.
(2016). Maternal health inequalities and GP provision: investigating variation in consultation rates for women in the Born in Bradford cohort. Journal of Public Health, 39(2), e48-e55.
Kelly, L., O’Connor, S., Harrison, A. J., & Ní Chéilleachair, N. J. (2019). Does
fundamental movement skill proficiency vary by sex, class group or weight status? Evidence from an Irish primary school setting. Journal of Sports Sciences, 37(9), 1055-1063.
Kennedy, J., Brown, T., & Chien, C.-W. (2012). Motor skill assessment of
children: is there an association between performance-based, child-report, and parent-report measures of children's motor skills? Physical & occupational therapy in pediatrics, 32(2), 196-209.
Kim, S., Kim, M. J., Valentini, N. C., & Clark, J. E. (2014). Validity and reliability
of the TGMD-2 for South Korean children. Journal of motor behavior, 46(5), 351-356. https://www.tandfonline.com/doi/full/10.1080/00222895.2014.914886
Kim, Y., Park, I., & Kang, M. (2012). Examining rater effects of the TGMD-2 on
children with intellectual disability. Adapted physical activity quarterly, 29(4), 346-365. https://journals.humankinetics.com/view/journals/apaq/29/4/article-p346.xml

225
King, D. B., O'Rourke, N., & DeLongis, A. (2014). Social media recruitment and online data collection: A beginner’s guide and best practices for accessing low-prevalence and hard-to-reach populations. Canadian Psychology/Psychologie canadienne, 55(4), 240 - 249. https://doi.org/https://doi.org/10.1037/a0038087
Kininmonth, A. R., Smith, A. D., Llewellyn, C. H., & Fildes, A. (2020).
Socioeconomic status and changes in appetite from toddlerhood to early childhood. Apetite, 146, 104517.
Kiphard, E., & Schilling, F. (2007). Körperkoordinationstest für Kinder KTK.
Manual. 2. überarbeitete und ergänzte Auflage. Beltz Test.
Kiphard, E., & Shilling, F. (1974). Körperkoordinationtest für Kinder. Beltz test.
Kita, Y., Suzuki, K., Hirata, S., Sakihara, K., Inagaki, M., & Nakai, A. (2016).
Applicability of the Movement Assessment Battery for Children-to Japanese children: A study of the Age Band 2. Brain and Development, 38(8), 706-713. https://www.brainanddevelopment.com/article/S0387-7604(16)30001-8/fulltext
Klingberg, B., Schranz, N., Barnett, L. M., Booth, V., & Ferrar, K. (2018). The
feasibility of fundamental movement skill assessments for pre-school aged children. Journal of Sports Sciences, 37, 1-9.
Kokštejn, J., Musálek, M., & Tufano, J. J. (2017). Are sex differences in
fundamental motor skills uniform throughout the entire preschool period? PloS one, 12(4), e0176556.
Koo, T. K., & Li, M. Y. (2016). A guideline of selecting and reporting intraclass
correlation coefficients for reliability research. Journal of chiropractic medicine, 15(2), 155-163. https://www.ncbi.nlm.nih.gov/pmc/articles/PMC4913118/pdf/main.pdf
Koutsouris, G., & Norwich, B. (2018). What exactly do RCT findings tell us in
education research? British Educational Research Journal, 44(6), 939-959.
Kracht, C. L., Webster, E. K., & Staiano, A. E. (2020). Relationship between the
24-Hour Movement Guidelines and fundamental motor skills in preschoolers. Journal of Science & Medicine in Sport, 23(12), 1185-1190.
Krueger, R. A., & Casey, M. A. (2014). Focus groups: A practical guide for
applied research. Sage publications.

226
Laguilles, J. S., Williams, E. A., & Saunders, D. B. (2011). Can lottery incentives boost web survey response rates? Findings from four experiments. Research in Higher Education, 52(5), 537-553.
Lalor, A., Brown, T., & Murdolo, Y. (2016). Relationship between children's
performance‐based motor skills and child, parent, and teacher
perceptions of children's motor abilities using self/informant‐report questionnaires. Australian Occupational Therapy Journal, 63(2), 105-116.
Lander, N., Morgan, P. J., Salmon, J., Logan, S. W., & Barnett, L. M. (2017).
The reliability and validity of an authentic motor skill assessment tool for early adolescent girls in an Australian school setting. Journal of science and medicine in sport, 20(6), 590-594. https://www.jsams.org/article/S1440-2440(17)30238-4/pdf
Lander, N., Nahavandi, D., Mohamed, S., Essiet, I., & Barnett, L. M. (2020).
Bringing objectivity to motor skill assessment in children. Journal of Sports Sciences, 1-11.
Laukkanen, A., Bardid, F., Lenoir, M., Lopes, V. P., Vasankari, T., Husu, P., &
Sääkslahti, A. (2020). Comparison of motor competence in children aged 6‐9 years across northern, central, and southern European regions. Scandinavian journal of medicine & science in sports, 30(2), 349-360.
Lawson, C., Eyre, E. L., Tallis, J., & Duncan, M. J. (2021). Fundamental
Movement Skill Proficiency among British Primary School Children: Analysis at a Behavioral Component Level. Perceptual and motor skills, 128(2), 625-648.
Li, Y.-C., Kwan, M. Y., & Cairney, J. (2019). Motor coordination problems and
psychological distress in young adults: A test of the Environmental Stress Hypothesis. Research in developmental disabilities, 84, 112-121.
Liamputtong, P. (2011). Focus group methodology: Principle and practice. Sage
Publications.
Liao, H.-F., Mao, P.-J., & Hwang, A.-W. (2001). Test–retest reliability of balance
tests in children with cerebral palsy. Developmental medicine and child neurology, 43(3), 180-186. https://onlinelibrary.wiley.com/doi/pdfdirect/10.1111/j.1469-8749.2001.tb00184.x?download=true
Linacre, J. (1994). Sample size and item calibration stability. Rasch Mes Trans.,
7, 328.

227
Liong, G. H., Ridgers, N. D., & Barnett, L. M. (2015). Associations between skill perceptions and young children's actual fundamental movement skills. Perceptual and motor skills, 120(2), 591-603.
Logan, S., Robinson, L. E., Wilson, A., & Lucas, W. (2012). Getting the
fundamentals of movement: a meta‐analysis of the effectiveness of motor skill interventions in children. Child: care, health and development, 38(3), 305-315.
Logan, S. W., Barnett, L. M., Goodway, J. D., & Stodden, D. F. (2017).
Comparison of performance on process-and product-oriented assessments of fundamental motor skills across childhood. Journal of Sports Sciences, 35(7), 634-641. https://www.tandfonline.com/doi/full/10.1080/02640414.2016.1183803
Logan, S. W., Robinson, L. E., Getchell, N., Webster, E. K., Liang, L.-Y., &
Golden, D. (2014). Relationship between motor competence and physical activity: A systematic review. Research Quarterly for Exercise & Sport, 85(S1), A14.
Logan, S. W., Robinson, L. E., Rudisill, M. E., Wadsworth, D. D., & Morera, M.
(2014). The comparison of school-age children's performance on two motor assessments: the Test of Gross Motor Development and the Movement Assessment Battery for Children. Physical Education and Sport Pedagogy, 19(1), 48-59.
Longmuir, P. E., Boyer, C., Lloyd, M., Borghese, M. M., Knight, E., Saunders, T.
J., Boiarskaia, E., Zhu, W., & Tremblay, M. S. (2017). Canadian Agility and Movement Skill Assessment (CAMSA): Validity, objectivity, and reliability evidence for children 8–12 years of age. Journal of sport and health science, 6(2), 231-240. https://www.ncbi.nlm.nih.gov/pmc/articles/PMC6189007/pdf/main.pdf
Loovis, E. M., & Ersing, W. F. (1979). Assessing and programming gross motor
development for children. College Town Press.
Lopes, V. P., Saraiva, L., & Rodrigues, L. P. (2018). Reliability and construct
validity of the test of gross motor development-2 in Portuguese children. International Journal of Sport and Exercise Psychology, 16(3), 250-260.
Lubans, D. R., Morgan, P. J., Cliff, D. P., Barnett, L. M., & Okely, A. D. (2010).
Fundamental movement skills in children and adolescents. Sports Medicine, 40(12), 1019-1035.
Lucas, B. R., Latimer, J., Doney, R., Ferreira, M. L., Adams, R., Hawkes, G.,
Fitzpatrick, J. P., Hand, M., Oscar, J., & Carter, M. (2013). The Bruininks-Oseretsky test of motor proficiency-short form is reliable in children living in remote Australian aboriginal communities. BMC pediatrics, 13(1), 135.

228
Macdonald, K., Milne, N., Orr, R., & Pope, R. (2018). Relationships between
motor proficiency and academic performance in mathematics and reading in school-aged children and adolescents: a systematic review. International Journal of Environmental Research and Public Health, 15(8), 1603.
Macdonald, K., Milne, N., Orr, R., & Pope, R. (2020). Associations between
motor proficiency and academic performance in mathematics and reading in year 1 school children: a cross-sectional study. BMC pediatrics, 20(1), 1-11.
Maeng, H., Webster, E. K., Pitchford, E. A., & Ulrich, D. A. (2017). Inter-and
Intrarater Reliabilities of the Test of Gross Motor Development—Third Edition Among Experienced TGMD-2 Raters. Adapted physical activity quarterly, 34(4), 442-455. https://journals.humankinetics.com/view/journals/apaq/34/4/article-p442.xml
Magistro, D., Piumatti, G., Carlevaro, F., Sherar, L. B., Esliger, D. W., Bardaglio,
G., Magno, F., Zecca, M., & Musella, G. (2020). Psychometric proprieties of the Test of Gross Motor Development–Third Edition in a large sample of Italian children. Journal of Science & Medicine in Sport, In Press. https://doi.org/https://doi.org/10.1016/j.jsams.2020.02.014
Magno, C. (2009). Demonstrating the difference between classical test theory
and item response theory using derived test data. The international Journal of Educational & Psychological assessment, 1(1), 1-11.
Maher, S. J., Schott, N., Lander, N. J., Hinkley, T., & Barnett, L. M. (2018). A
comparison of parent report and actual motor competence in young children. Australian Occupational Therapy Journal, 65(5), 387-394.
Malina, R. M., Bouchard, C., & Bar-Or, O. (2004). Growth, maturation, and
physical activity (2nd Edition ed.). Human kinetics.
Mallett, R., Hagen-Zanker, J., Slater, R., & Duvendack, M. (2012). The benefits
and challenges of using systematic reviews in international development research. Journal of development effectiveness, 4(3), 445-455.
Mancini, V., Rudaizky, D., Howlett, S., Elizabeth‐Price, J., & Chen, W. (2020).
Movement difficulties in children with ADHD: Comparing the long‐and short‐form Bruininks–Oseretsky Test of Motor Proficiency—Second
Edition (BOT‐2). Australian Occupational Therapy Journal, 67(2), 153-161.

229
Marais, I., & Andrich, D. (2008). Effects of varying magnitude and patterns of local dependence in the unidimensional Rasch model. Journal of Applied Measurement, 9(2), 1-20.
Martins, C., Bandeira, P. F. R., Souza Filho, A., Bezerra, T., Clark, C., Webster,
E. K., Mota, J., & Duncan, M. (2021). The combination of three movement behaviours is associated with object control skills, but not locomotor skills, in preschoolers. European Journal of Pediatrics, 180(5), 1505-1512.
Martins, C. M. d. L., Bandeira, P. F. R., Lemos, N. B. A. G., Bezerra, T. A.,
Clark, C. C. T., Mota, J., & Duncan, M. J. (2020). A Network Perspective on the Relationship between Screen Time, Executive Function, and Fundamental Motor Skills among Preschoolers. International Journal of Environmental Research & Public Health, 17(23), 8861.
Martins, C. M. d. L., Clark, C. C. T., Ribeiro Bandeira, P. F., Mota, J., & Duncan,
M. J. (2020). Association between compliance with the 24-hour movement guidelines and fundamental movement skills in preschoolers: A network perspective. International Journal of Environmental Research & Public Health, 17(15), 5443.
Masters, G. N. (1982). A Rasch model for partial credit scoring. Psychometrika,
47(2), 149-174.
Matarma, T., Lagström, H., Löyttyniemi, E., & Koski, P. (2020). Motor Skills of 5-
Year-Old Children: Gender Differences and Activity and Family Correlates. Perceptual and motor skills, 127(2), 367-385.
Matthews-King, A. (2018). GP vacancies rise to record levels despite
recruitment pledge, survey suggests. The Independent.
Maxwell, S. E., Lau, M. Y., & Howard, G. S. (2015). Is psychology suffering from
a replication crisis? What does “failure to replicate” really mean? American Psychologist, 70(6), 487-495.
McBride, M. (2020). Do Covid-19 restrictions spell the end of PE, art and music
in school? The Irish Times.
McHugh, M. L. (2012). Interrater reliability: the kappa statistic. Biochemia
medica: Biochemia medica, 22(3), 276-282.
McKenzie, T. L., Sallis, J. F., Broyles, S. L., Zive, M. M., Nader, P. R., Berry, C.
C., & Brennan, J. J. (2002). Childhood movement skills: predictors of physical activity in Anglo American and Mexican American adolescents? Research Quarterly for Exercise & Sport, 73(3), 238-244.

230
Menard, S. (2010). Logistic Regression: From Introductory to Advanced Concepts and Applications. SAGE Publications, Inc. https://doi.org/10.4135/9781483348964
Michie, S., Atkins, L., & West, R. (2014). The behaviour change wheel: a guide
to designing interventions. . Silverback Publishing.
Michie, S., Van Stralen, M. M., & West, R. (2011). The behaviour change wheel:
a new method for characterising and designing behaviour change interventions. Implementation science, 6(1), 42.
Mickle, K. J., Munro, B. J., & Steele, J. R. (2011). Gender and age affect
balance performance in primary school-aged children. Journal of Science & Medicine in Sport, 14(3), 243-248.
Missiuna, C., Pollock, N., Campbell, W., DeCola, C., Hecimovich, C., Sahagian
Whalen, S., Siemon, J., Song, K., Gaines, R., & Bennett, S. (2017). Using an innovative model of service delivery to identify children who are struggling in school. British Journal of Occupational Therapy, 80(3), 145-154.
Missiuna, C., Rivard, L., & Bartlett, D. (2003). Early identification and risk
management of children with developmental coordination disorder. Pediatric Physical Therapy, 15(1), 32-38.
Mlinac, M. E., & Feng, M. C. (2016). Assessment of activities of daily living, self-
care, and independence. Archives of Clinical Neuropsychology, 31(6), 506-516.
Mokkink, L. B., Terwee, C., Patrick, D., Alonso, J., Stratford, P., Knol, D.,
Bouter, L., & De Vet, H. (2010a). International consensus on taxonomy, terminology, and definitions of measurement properties for health-related patient-reported outcomes: results of the COSMIN study. Journal of Clinical Epidemiology, 63(7), 734-745.
Mokkink, L. B., Terwee, C. B., Patrick, D. L., Alonso, J., Stratford, P. W., Knol,
D. L., Bouter, L. M., & De Vet, H. C. (2010b). The COSMIN checklist for assessing the methodological quality of studies on measurement properties of health status measurement instruments: an international Delphi study. Quality of Life Research, 19(4), 539-549. https://www.ncbi.nlm.nih.gov/pmc/articles/PMC2852520/pdf/11136_2010_Article_9606.pdf
Moreira, J. P. A., Lopes, M. C., Miranda-Júnior, M. V., Valentini, N. C., Lage, G.
M., & Albuquerque, M. R. (2019). Körperkoordinationstest Für Kinder (KTK) for Brazilian children and adolescents: Factor score, factor analysis, and invariance. Frontiers in Psychology, 10, 1-11.

231
Morgan, D. L. (1996). Focus groups. Annual review of sociology, 22(1), 129-
152.
Morley, D., Till, K., Ogilvie, P., & Turner, G. (2015). Influences of gender and
socioeconomic status on the motor proficiency of children in the UK. Human movement science, 44, 150-156.
Mortimer, D. (2020). Coronavirus has driven a coach and horses through the
NHS budget. We badly need more funding. The Independent
Müller, R., & Büttner, P. (1994). A critical discussion of intraclass correlation
coefficients. Statistics in Medicine, 13(23‐24), 2465-2476.
National Association for Sport and Physical Education. (2010). PE Metrics:
Assessing national standards 1-6 in elementary school. NASPE.
National Association for Sport and Physical Education. (2011). PE metrics:
Assessing national standards 1-6 in secondary school. NASPE.
National Audit Office. (2016). Financial Sustainability of the NHS.
Nazroo, J. Y. (2003). The structuring of ethnic inequalities in health: economic
position, racial discrimination, and racism. American journal of public health, 93(2), 277-284.
Newby, V. A., Conner, G. R., Grant, C. P., & Bunderson, C. V. (2009). The
Rasch model and additive conjoint measurement. Journal of Applied Measurement, 10, 348-354.
Newell, K. (1986). Constraints on the development of coordination. Martinus
Nijhoff.
NHS. (2019). Developmental co-ordination disorder (dyspraxia) in children.
https://www.nhs.uk/conditions/developmental-coordination-disorder-dyspraxia/diagnosis/
Nicola, K., Waugh, J., Charles, E., & Russell, T. (2018). The feasibility and
concurrent validity of performing the Movement Assessment Battery for Children–2nd Edition via telerehabilitation technology. Research in Developmental Disabilities, 77, 40-48.
Niemeijer, A. S., Van Waelvelde, H., & Smits-Engelsman, B. C. (2015).
Crossing the North Sea seems to make DCD disappear: cross-validation of Movement Assessment Battery for Children-2 norms. Human movement science, 39, 177-188.

232
Niemistö, D., Finni, T., Cantell, M., Korhonen, E., & Sääkslahti, A. (2020).
Individual, Family, and Environmental Correlates of Motor Competence in Young Children: Regression Model Analysis of Data Obtained from Two Motor Tests. International Journal of Environmental Research and Public Health, 17(7), 2548.
Nilsen, A. K. O., Anderssen, S. A., Johannessen, K., Aadland, K. N., Ylvisaaker,
E., Loftesnes, J. M., & Aadland, E. (2020). Bi-directional prospective associations between objectively measured physical activity and fundamental motor skills in children: a two-year follow-up. International Journal of Behavioural Nutrition and Physical Activity, 17(1). https://doi.org/https://doi.org/10.1186/s12966-019-0902-6
Novak, A. R., Bennett, K. J., Beavan, A., Pion, J., Spiteri, T., Fransen, J., &
Lenoir, M. (2017). The applicability of a short form of the Körperkoordinationstest für Kinder for measuring motor competence in children aged 6 to 11 years. Journal of Motor Learning and Development, 5(2), 227-239.
NSW Department of Education and Training. (2000). Get skilled: Get active. A
K-6 resource to support the teaching of fundament skills. . NSW Department of Education and Training.
Numminen, P. (1995). APM inventory: manual and test booklet for assessing
pre-school children's perceptual and basic motor skills. LIKES.
O’Brien, W., Belton, S., & Issartel, J. (2016). Fundamental movement skill
proficiency amongst adolescent youth. Physical Education and Sport Pedagogy, 21(6), 557-571.
Office for National Statistics. (2011). Population of England and Wales. U.
Government. https://www.ethnicity-facts-figures.service.gov.uk/uk-population-by-ethnicity/national-and-regional-populations/population-of-england-and-wales/latest#by-ethnicity
Ofsted. (2013). Beyond 2012 - outstanding physical education for all. H.
Government. https://www.gov.uk/government/publications/beyond-2012-outstanding-physical-education-for-all
Ofsted. (2020). COVID-19 series: briefing on schools, October 2020. H.
Government. https://assets.publishing.service.gov.uk/government/uploads/system/uploads/attachment_data/file/933490/COVID-19_series_briefing_on_schools_October_2020.pdf

233
Okely, A. D., Booth, M. L., & Patterson, J. W. (2001). Relationship of physical activity to fundamental movement skills among adolescents. Medicine and science in sports and exercise, 33(11), 1899-1904.
Okuda, P. M. M., Pangelinan, M., Capellini, S. A., & Cogo-Moreira, H. (2019).
Motor skills assessments: support for a general motor factor for the Movement Assessment Battery for Children-2 and the Bruininks-Oseretsky Test of Motor Proficiency-2. Trends in psychiatry & psychotherapy
41(1), 51-59.
Palmer, K. K., Stodden, D. F., Ulrich, D. A., & Robinson, L. E. (2021). Using
Process- and Product-oriented Measures to Evaluate Changes in Motor Skills across an Intervention. Measurement in Physical Education and Exercise Science, 1-10. https://doi.org/10.1080/1091367X.2021.1876069
Papert, S., & Harel, I. (1991). Situating constructionism. Constructionism, 36(2),
1-11.
Perera, N. (2020). Analysis: school funding | Budget 2020. E. P. Institute.
https://epi.org.uk/publications-and-research/school-funding-budget-2020/2020
Physical Health Education Canada. (2014). Development of passport for life.
Physical & Health Education Journal, 80(2), 18-21.
Pill, S., & Harvey, S. (2019). A narrative review of children’s movement
competence research 1997-2017. Physical Culture & Sport, 81(1), 47-74.
Pombo, A., Luz, C., de Sá, C., Rodrigues, L. P., & Cordovil, R. (2021). Effects
of the COVID-19 Lockdown on Portuguese Children’s Motor Competence. Children, 8(3), 199.
Pombo, A., Luz, C., Rodrigues, L. P., & Cordovil, R. (2020). COVID-19
Confinement In Portugal: Effects On The Household Routines Of Children Under 13. Research Square, 1-16. https://doi.org/https://doi.org/10.21203/rs.3.rs-45764/v1
Preston, N., Horton, M., Levesley, M., Mon‐Williams, M., & O'Connor, R. (2018).
Development of a parent‐reported questionnaire evaluating upper limb activity limitation in children with cerebral palsy. Physiotherapy Research International, 23(1), e1684.
Preston, N., Magallon, S., Hill, L. J., Andrews, E., Ahern, S. M., & Mon-Williams,
M. (2017). A systematic review of high quality randomized controlled trials investigating motor skill programmes for children with

234
developmental coordination disorder. Clinical Rehabilitation, 31(7), 857-870.
Progar, Š., Sočan, G., & Peč, M. (2008). An empirical comparison of item
response theory and classical test theory. Horizons of Psychology, 17(3), 5-24.
Psotta, R., & Abdollahipour, R. (2017). Factorial Validity of the Movement
Assessment Battery for Children—2nd Edition (MABC-2) in 7-16-Year-Olds. Perceptual and motor skills, 124(6), 1051-1068. https://journals.sagepub.com/doi/10.1177/0031512517729951?url_ver=Z39.88-2003&rfr_id=ori%3Arid%3Acrossref.org&rfr_dat=cr_pub%3Dpubmed&
Public Health England. (2020a). Bradford Local Authority Health Profile 2019.
Public Health England. (2020b). Public Health Outcomes Framework.
Rasch, G. (1960). Studies in mathematical psychology: I. Probabilistic models
for some intelligence and attainment tests. Chicago University Press.
Raynor, P., & Group, B. i. B. C. (2008). Born in Bradford, a cohort study of
babies born in Bradford, and their parents: protocol for the recruitment phase. BMC public health, 8(1), 1-13. https://doi.org/10.1186/1471-2458-8-327
Ré, A. H., Logan, S. W., Cattuzzo, M. T., Henrique, R. S., Tudela, M. C., &
Stodden, D. F. (2018). Comparison of motor competence levels on two assessments across childhood. Journal of Sports Sciences, 36(1), 1-6. https://www.tandfonline.com/doi/full/10.1080/02640414.2016.1276294
Rife, S. C., Cate, K. L., Kosinski, M., & Stillwell, D. (2016). Participant
recruitment and data collection through Facebook: The role of personality factors. International Journal of Social Research Methodology, 19(1), 69-83. https://doi.org/https://doi.org/10.1080/13645579.2014.957069
Rikhy, S., Tough, S., Trute, B., Benzies, K., Kehler, H., & Johnston, D. W.
(2010). Gauging knowledge of developmental milestones among Albertan adults: a cross-sectional survey. BMC public health, 10(1), 183.
Rintala, P. O., Sääkslahti, A. K., & Iivonen, S. (2017). Reliability assessment of
scores from video-recorded TGMD-3 performances. Journal of Motor Learning and Development, 5(1), 59-68.
Rodríguez-Negro, J., Huertas-Delgado, F. J., & Yanci, J. (2019). Motor skills
differences by gender in early elementary education students. Early Child Development & Care, 1-11.

235
Rodriguez, M. C., Wade, T. J., Veldhuizen, S., Missiuna, C., Timmons, B., &
Cairney, J. (2019). Emotional and Behavioral Problems in 4-and 5-year old children with and without motor delays. Frontiers in pediatrics, 7, 474.
Rösblad, B., & Gard, L. (1998). The assessment of children with developmental
coordination disorders in Sweden: A preliminary investigation of the suitability of the movement ABC. Human movement science, 17(4-5), 711-719.
Rose, G. (2016). Visual methodologies: An introduction to researching with
visual materials. sage.
Roth, K., Ruf, K., Obinger, M., Mauer, S., Ahnert, J., Schneider, W., Graf, C., &
Hebestreit, H. (2010). Is there a secular decline in motor skills in preschool children? Scandinavian journal of medicine & science in sports, 20(4), 670-678.
Routen, A. C., Johnston, J. P., Glazebrook, C., & Sherar, L. B. (2018). Teacher
perceptions on the delivery and implementation of movement integration strategies: the CLASS PAL (physically active learning) Programme. International Journal of Educational Research, 88, 48-59. https://doi.org/https://doi.org/10.1016/j.ijer.2018.01.003
Rudd, J., Barnett, L., Butson, M., Farrow, D., Berry, J., & Polman, R. (2015).
Fundamental movement skills are more than run, throw and catch: The role of stability skills. J PLoS One, 10(10), 1-15.
Rudd, J., Butson, M., Barnett, L., Farrow, D., Berry, J., Borkoles, E., & Polman,
R. (2016). A holistic measurement model of movement competency in children. Journal of Sports Sciences, 34(5), 477-485. https://www.tandfonline.com/doi/full/10.1080/02640414.2015.1061202
Rudgard, O. (2018). Schools scrap PE time because of exam pressure.
https://www.telegraph.co.uk/news/2018/02/19/school-scrap-pe-time-exam-pressure/
Ruiz, L. M., Graupera, J. L., Gutiérrez, M., & Miyahara, M. (2003). The
Assessment of Motor Coordination in Children with the Movement ABC test: A Comparative Study among Japan, USA and Spain. International Journal of Applied Sports Sciences, 15(1), 22-35.
Rumsby, B. (2015). Alarming fall in school PE lessons casts doubt over
government's commitment to tackling obesity crisis. http://www.telegraph.co.uk/sport/othersports/schoolsports/11343801/Alarming-fall-in-school-PE-lessons-casts-doubt-over-governments-commitment-to-tackling-obesity-crisis.html.

236
Sacko, R. S. (2020). MC= MVPA. Journal of Physical Education, Recreation &
Dance, 91(4), 3-4.
Scheuer, C., Herrmann, C., & Bund, A. (2019). Motor tests for primary school
aged children: A systematic review. Journal of Sports Sciences, 37(10), 1097-1112.
Schilling, F., & Kiphard, E. (2000). Körperkoordinationstest für kinder Manual.
Beltz Test GmbH.
Schulz, J., Henderson, S. E., Sugden, D. A., & Barnett, A. L. (2011). Structural
validity of the Movement ABC-2 test: Factor structure comparisons across three age groups. Research in Developmental Disabilities, 32(4), 1361-1369. https://www.sciencedirect.com/science/article/abs/pii/S0891422211000333?via%3Dihub
Shire, K. A., Atkinson, J., Williams, E. A., Pickavance, J., Magallón, S., Hill, L.
J., Waterman, A. H., Sugden, D. A., & Mon-Williams, M. (2021). Developing and Implementing a School-led Motor Intervention for Children with Handwriting Difficulties. Journal of Occupational Therapy, Schools, and Early Intervention, 1-17.
Shumway-Cook, A., & Woollacott, M. H. (2007). Motor control: translating
research into clinical practice. Lippincott Williams & Wilkins.
Simons, J., Daly, D., Theodorou, F., Caron, C., Simons, J., & Andoniadou, E.
(2008). Validity and reliability of the TGMD-2 in 7–10-year-old Flemish children with intellectual disability. Adapted physical activity quarterly, 25(1), 71-82. https://journals.humankinetics.com/view/journals/apaq/25/1/article-p71.xml
Singh, D. K. A., Rahman, N., Rajikan, R., Zainudin, A., Nordin, N. A. M., Karim,
Z. A., & Yee, Y. H. (2015). Balance and motor skills among preschool children aged 3 to 4 years old. Malaysian Journal of Medicine & Health Sciences, 11(1), 63-68.
Smaje, C., & Le Grand, J. (1997). Ethnicity, equity and the use of health
services in the British NHS. Social science & medicine, 45(3), 485-496.
Smits-Engelsman, B. C., Fiers, M. J., Henderson, S. E., & Henderson, L.
(2008). Interrater reliability of the movement assessment battery for children. Physical therapy, 88(2), 286-294.

237
Spironello, C., Hay, J., Missiuna, C., Faught, B., & Cairney, J. (2010). Concurrent and construct validation of the short form of the Bruininks‐Oseretsky Test of Motor Proficiency and the Movement‐ABC when administered under field conditions: implications for screening. Child: care, health and development, 36(4), 499-507. https://onlinelibrary.wiley.com/doi/abs/10.1111/j.1365-2214.2009.01066.x
Sport England. (2021). Active Lives Children and Young People Survey:
Academic year 2019/20.
St John, L., Dudley, D., & Cairney, J. (2020). A longitudinal examination of
enjoyment of physical education in children with developmental coordination disorder through a physical literacy lens. PROSPECTS, 1-13.
Stearns, J. A., Wohlers, B., McHugh, T.-L. F., Kuzik, N., & Spence, J. C. (2019).
Reliability and Validity of the PLAY fun Tool with Children and Youth in Northern Canada. Measurement in Physical Education and Exercise Science, 23(1), 47-57.
Stodden, D. F., Goodway, J. D., Langendorfer, S. J., Roberton, M. A., Rudisill,
M. E., Garcia, C., & Garcia, L. E. (2008). A developmental perspective on the role of motor skill competence in physical activity: An emergent relationship. Quest, 60(2), 290-306.
Stratton, G., Foweather, L., & Hughes, H. (2017). Dragon Challenge: A National
Indicator for Children's Physical Literacy in Wales. Surveillance Report January 2017. S. Wales.
Streiner, D. L. (2003). Starting at the beginning: an introduction to coefficient
alpha and internal consistency. Journal of personality assessment, 80(1), 99-103.
Sun, S.-H., Zhu, Y.-C., Shih, C.-L., Lin, C.-H., & Wu, S. K. (2010). Development
and initial validation of the preschooler gross motor quality scale. Research in Developmental Disabilities, 31(6), 1187-1196.
Supovitz, J., Sirinides, P., & May, H. (2010). How principals and peers influence
teaching and learning. Educational Administration Quarterly, 46(1), 31-56.
Szczepura, A. (2005). Access to health care for ethnic minority populations.
Postgraduate medical journal, 81(953), 141-147.
Tan, S. K., Parker, H. E., & Larkin, D. (2001). Concurrent validity of motor tests
used to identify children with motor impairment. Adapted physical activity quarterly, 18(2), 168-182.

238
Taylor, M., Yates, A., Meyer, L. H., & Kinsella, P. (2011). Teacher professional
leadership in support of teacher professional development. Teaching and Teacher Education, 27(1), 85-94. https://doi.org/https://doi.org/10.1016/j.tate.2010.07.005
Tennant, A., & Conaghan, P. G. (2007). The Rasch measurement model in
rheumatology: what is it and why use it? When should it be applied, and what should one look for in a Rasch paper? Arthritis Care & Research, 57(8), 1358-1362.
Thomas, J. R., & French, K. E. (1985). Gender differences across age in motor
performance: A meta-analysis. Psychological bulletin
98(2), 260.
Toepoel, V. (2012). Effects of incentives in surveys. In Handbook of survey
methodology for the social sciences (pp. 209-223). Springer.
Tomaz, S., Jones, R. A., Hinkley, T., Bernstein, S., Twine, R., Kahn, K., Norris,
S. A., & Draper, C. E. (2019). Gross motor skills of South African preschool-aged children across different income settings. Journal of Science & Medicine in Sport, 22(6), 689-694.
True, L., Brian, A., Goodway, J., & Stodden, D. (2017). Relationships between
product-and process-oriented measures of motor competence and perceived competence. Journal of Motor Learning and Development, 5(2), 319-335.
Ulrich, D. A. (1983). The standardization of a criterion-referenced test in
fundamental motor and physical fitness skills. Dissertation Abstracts International, 43(146A).
Ulrich, D. A. (1985). Test of gross motor development. Pro-Ed
Ulrich, D. A. (2000). Test of Gross Motor Development 2nd Edition (TGMD-2).
Pro-Ed.
Ulrich, D. A. (2016). Test of gross motor development—3rd edition (TGMD-3).
University of Michigan.
UNISON. (2019). NHS staff shortages increase.
Utesch, T., Bardid, F., Büsch, D., & Strauss, B. (2019). The relationship
between motor competence and physical fitness from early childhood to early adulthood: A meta-analysis. Sports Medicine, 49(4), 541-551.

239
Utesch, T., Bardid, F., Huyben, F., Strauss, B., Tietjens, M., De Martelaer, K., Seghers, J., & Lenoir, M. (2016). Using Rasch modeling to investigate the construct of motor competence in early childhood. Psychology of Sport and Exercise, 24, 179-187.
Valentini, N. (2012). Validity and reliability of the TGMD-2 for Brazilian children.
Journal of motor behavior, 44(4), 275-280.
Valentini, N., Ramalho, M., & Oliveira, M. (2014). Movement Assessment
Battery for Children-2: Translation, reliability, and validity for Brazilian children. Research in Developmental Disabilities, 35(3), 733-740.
Valentini, N. C., Getchell, N., Logan, S. W., Liang, L.-Y., Golden, D., Rudisill, M.
E., & Robinson, L. E. (2015). Exploring associations between motor skill assessments in children with, without, and at-risk for developmental coordination disorder. Journal of Motor Learning and Development, 3(1), 39-52.
Valentini, N. C., Rudisill, M. E., Bandeira, P. F. R., & Hastie, P. A. (2018). The
development of a short form of the Test of Gross Motor Development‐2 in Brazilian children: Validity and reliability. Child: care, health and development, 44(5), 759-765.
Valentini, N. C., Zanella, L. W., & Webster, E. K. (2017). Test of Gross Motor
Development—Third edition: Establishing content and construct validity for Brazilian children. Journal of Motor Learning and Development, 5(1), 15-28.
Valle, M. S., Lombardo, L., Cioni, M., & Casabona, A. (2018). Relationship
between accuracy and complexity when learning underarm precision throwing. European journal of sport science, 18(9), 1217-1225.
Valtr, L., & Psotta, R. (2019). Validity of the Movement Assessment Battery for
Children test–2nd edition in older adolescents. Acta Gymnica, 49(2), 58-66.
van der Fels, I. M., te Wierike, S. C., Hartman, E., Elferink-Gemser, M. T.,
Smith, J., & Visscher, C. (2015). The relationship between motor skills and cognitive skills in 4–16 year old typically developing children: A systematic review. Journal of Science & Medicine in Sport, 18(6), 697-703.
Van Niekerk, L., Du Toit, D., & Pienaar, A. (2015). The relationship between
motor proficiency and academic performance of adolescent learners in Potchefstroom, South Africa: The PAHL study. African Journal for Physical Health Education, Recreation & Dance, 21(4.2), 1321-1336.

240
Van Rossum, T., Foweather, L., Hayes, S., Richardson, D., & Morley, D. (2021). Expert recommendations for the design of a teacher-oriented movement assessment tool for children aged 4-7 years: a Delphi study. Measurement in Physical Education and Exercise Science, 1-11. https://doi.org/https://doi.org/10.1080/1091367X.2021.1876070
van Rossum, T., Foweather, L., Richardson, D., Hayes, S. J., & Morley, D.
(2018, 2019/04/03). Primary Teachers’ Recommendations for the Development of a Teacher-Oriented Movement Assessment Tool for 4–7 Years Children. Measurement in Physical Education and Exercise Science, 23(2), 124-134. https://doi.org/10.1080/1091367X.2018.1552587
Van Waelvelde, H., De Weerdt, W., De Cock, P., & Smits-Engelsman, B.
(2004). Aspects of the validity of the Movement Assessment Battery for Children. Human movement science, 23(1), 49-60.
Van Waelvelde, H., Peersman, W., Lenoir, M., Engelsman, B. C. S., &
Henderson, S. E. (2008). The movement assessment battery for children: Similarities and differences between 4-and 5-year-old children from Flanders and the United States. Pediatric Physical Therapy, 20(1), 30-38.
Veldman, S. L., Jones, R. A., Chandler, P., Robinson, L. E., & Okely, A. D.
(2020). Prevalence and risk factors of gross motor delay in pre‐schoolers. Journal of Paediatrics & Child Health, 56(4), 571-576.
Veldman, S. L., Santos, R., Jones, R. A., Sousa-Sá, E., & Okely, A. D. (2019).
Associations between gross motor skills and cognitive development in toddlers. Early Human Development, 132, 39-44.
Venetsanou, F., & Kambas, A. (2010). Environmental factors affecting
preschoolers’ motor development. Early Childhood Education Journal, 37(4), 319-327.
Wagner, M. O., Kastner, J., Petermann, F., & Bös, K. (2011). Factorial validity
of the Movement Assessment Battery for Children-2 (age band 2). Research in Developmental Disabilities, 32(2), 674-680.
Wagner, M. O., Webster, E. K., & Ulrich, D. A. (2017). Psychometric properties
of the Test of Gross Motor Development, (German translation): Results of a pilot study. Journal of Motor Learning and Development, 5(1), 29-44.
Ward, B., Thornton, A., Lay, B., Chen, N., & Rosenberg, M. (2020). Can
proficiency criteria be accurately identified during real-time fundamental movement skill assessment? Research Quarterly for Exercise & Sport
91(1), 64-72.

241
Webster, E. K., & Ulrich, D. A. (2017). Evaluation of the psychometric properties
of the Test of Gross Motor Development—third edition. Journal of Motor Learning and Development, 5(1), 45-58.
Wessel, J. A., & Zittel, L. L. (1995). Smart Start: Preschool Movement
Curriculum Designed for Children of All Abilities: a Complete Program of Motor and Play Skills for All Children Ages 3 Through 5, Including Those with Special Developmental and Learning Needs. Pro-Ed.
Wilkinson, S. (2004). Focus Group Research. In D. Silverman (Ed.), Qualitative
research: Theory, method & practice (2nd ed., pp. 177-199). Sage Publications.
Williams, H. G., Pfeiffer, K. A., Dowda, M., Jeter, C., Jones, S., & Pate, R. R.
(2009). A field-based testing protocol for assessing gross motor skills in preschool children: The children's activity and movement in preschool study motor skills protocol. Measurement in Physical Education and Exercise Science, 13(3), 151-165.
Willig, C., & Stainton Rogers, W. (2017). Thematic Analysis In N. K. Denzin & Y.
S. Lincoln (Eds.), The Sage handbook of qualitative research. Sage publications.
Wilson, B. N., Kaplan, B. J., Crawford, S. G., & Dewey, D. (2000). Interrater
reliability of the Bruininks-Oseretsky test of motor proficiency–long form. Adapted physical activity quarterly, 17(1), 95-110.
Wood, A. P., Imai, S., McMillan, A. G., Swift, D., & DuBose, K. D. (2020).
Physical activity types and motor skills in 3-5-year old children: National Youth Fitness Survey. Journal of Science & Medicine in Sport, 23(4), 390-395.
World Health Organisation. (2020). Physical Activity.
Wright. (1996). Comparing Rasch measurement and factor analysis. Structural
Equation Modeling: A Multidisciplinary Journal, 3(1), 3-24.
Wright, & Panchapakesan, N. (1969). A procedure for sample-free item
analysis. Educational and Psychological measurement, 29(1), 23-48.
Wright, B. (1991). Diagnosing Misfit Rasch Meas Trans, 5(2), 156.
Wuang, Y.-P., Lin, Y.-H., & Su, C.-Y. (2009). Rasch analysis of the Bruininks–
Oseretsky Test of Motor Proficiency-in intellectual disabilities. Research in Developmental Disabilities, 30(6), 1132-1144.

242
https://www.sciencedirect.com/science/article/abs/pii/S0891422209000559?via%3Dihub
Wuang, Y.-P., & Su, C.-Y. (2009). Reliability and responsiveness of the
Bruininks–Oseretsky Test of Motor Proficiency-in children with intellectual disability. Research in Developmental Disabilities, 30(5), 847-855. https://www.sciencedirect.com/science/article/abs/pii/S0891422208001777?via%3Dihub
Wuang, Y.-P., Su, J., & Su, C. (2012). Reliability and responsiveness of the
Movement Assessment Battery for Children-Test in children with developmental coordination disorder. Developmental medicine and child neurology, 54(2), 160. https://onlinelibrary.wiley.com/doi/pdfdirect/10.1111/j.1469-8749.2011.04177.x?download=true
Xin, F., Chen, S.-T., Clark, C., Hong, J.-T., Liu, Y., & Cai, Y.-J. (2020).
Relationship between Fundamental Movement Skills and Physical Activity in Preschool-aged Children: A Systematic Review. International Journal of Environmental Research & Public Health, 17(10), 3566.
Zhu, W., Fox, C., Park, Y., Fisette, J. L., Dyson, B., Graber, K. C., Avery, M.,
Franck, M., Placek, J. H., & Rink, J. (2011). Development and calibration of an item bank for PE metrics assessments: Standard 1. Measurement in Physical Education and Exercise Science, 15(2), 119-137.
Zimmer, R., & Volkamer, M. (1987). Motoriktest für vier- bis sechsjärige Kinder
(manual). Beltz Test.
Zoia, S., Biancotto, M., Guicciardi, M., Lecis, R., Lucidi, F., Pelamatti, G. M.,
Carrozzi, M., Skabar, A., Sugden, D. A., & Barnett, A. L. (2019). An evaluation of the Movement ABC-2 Test for use in Italy: A comparison of data from Italy and the UK. Research in Developmental Disabilities, 84, 43-56. https://www.sciencedirect.com/science/article/abs/pii/S0891422218300908?via%3Dihub
Žuvela, F., Božanić, A., & Miletić, Đ. (2011). POLYGON–A new fundamental
movement skills test for 8 year old children: construction and validation. Journal of sports science and medicine, 10, 157-163.
Zysset, A. E., Kakebeeke, T. H., Messerli-Bürgy, N., Meyer, A. H., Stülb, K.,
Leeger-Aschmann, C. S., Schmutz, E. A., Arhab, A., Ferrazzini, V., & Kriemler, S. (2018). The validity of parental reports on motor skills performance level in preschool children: a comparison with a standardized motor test. European Journal of Pediatrics, 177(5), 715-722.

243

https://www.crd.york.ac.uk/prospero/#recordDetails 244
/10
244
Appendix A
PROSPERO form for the Systematic Review in Chapter 2
Systematic review
To edit the record click Start an update below. This will create a new version of the record -
the existing version will remain unchanged.
* Review title.
Give the title of the review in English
Evaluating the validity and reliability of assessment tools used to measure
fundamental movement skill proficiency in children: a systematic review
Original language title.
For reviews in languages other than English, give the title in the original language.
This will be displayed with the English language title.
* Anticipated or actual start date.
Give the date the systematic review started or is expected to start. 03/12/2018
* Anticipated completion date.
Give the date by which the review is expected to be completed. 01/11/2019
* Stage of review at time of this submission.
Tick the boxes to show which review tasks have been started and which have been
completed. Update this field each time any amendments are made to a published
record.
Reviews that have started data extraction (at the time of initial submission) are not
eligible for inclusion in PROSPERO.
If there is later evidence that incorrect status and/or completion date has been
supplied, the published PROSPERO record will be marked as retracted.
This field uses answers to initial screening questions. It cannot be edited until after
registration. The review has not yet started: No
Review stageStarted Completed

https://www.crd.york.ac.uk/prospero/#recordDetails 245
/10
245
Preliminary searches Yes Yes
Piloting of the study selection process Yes Yes
Formal screening of search results against eligibility criteria Yes Yes
Data extraction Yes Yes
Risk of bias (quality) assessment Yes Yes
Data analysisYes Yes
Provide any other relevant information about the stage of the review here.
* Named contact.
The named contact is the guarantor for the accuracy of the information in the
register record. This may be any member of the review team.
Lucy Eddy
Email salutation (e.g. "Dr Smith" or "Joanne") for correspondence: Miss Eddy
* Named contact email.
Give the electronic email address of the named contact. [email protected]
Named contact address
PLEASE NOTE this information will be published in the PROSPERO record so please do not enter private information, i.e. personal home address
Give the full institutional/organisational postal address for the named contact.
School of Psychology, University of Leeds, LS2 9JT
Named contact phone number.
Give the telephone number for the named contact, including international dialling
code.
+44(0)7802639723
* Organisational affiliation of the review.

https://www.crd.york.ac.uk/prospero/#recordDetails 246
/10
246
Full title of the organisational affiliations for this review and website address if
available. This field may be completed as 'None' if the review is not affiliated to any
organisation.
University of Leeds (https://www.leeds.ac.uk/)
* Review team members and their organisational affiliations.
Give the personal details and the organisational affiliations of each member of the
review team. Affiliation refers to groups or organisations to which review team
members belong.
NOTE: email and country now MUST be entered for each person, unless you are
amending a published record.
Miss Lucy Eddy. University of Leeds
Miss Nishaat Shahid. Bradford Institute for Health Research
Dr Daniel Bingham. Bradford Institute for Health Research
Dr Liam Hill. University of Leeds
Miss Kirsty Crossley. Bradford Institute for Health Research
Professor Mark Mon-Williams. University of Leeds
Miss Marsha Ellingham-Khan. Centre for Applied Education Research
Miss Ava Otteslev. Centre for Applied Education Research
Natalie Figueredo. Centre for Applied Education Research
* Funding sources/sponsors.
Details of the individuals, organizations, groups, companies or other legal entities
who have funded or sponsored the review.
Lucy Eddy’s PhD is funded by the Economic and Social Research Council (ESRC).
* Conflicts of interest.
List actual or perceived conflicts of interest (financial or academic). None
Collaborators.

https://www.crd.york.ac.uk/prospero/#recordDetails 247
/10
247
Give the name and affiliation of any individuals or organisations who are working on the review but who are not
listed as review team members. NOTE: email and country must be completed for each person, unless you are
amending a published record.
Professor Mark Mon-Williams. University of Leeds
* Review question.
State the review question(s) clearly and precisely. It may be appropriate to break
very broad questions down into a series of related more specific questions.
Questions may be framed or refined using PI(E)COS or similar where relevant.
To what extent have the validity and reliability of current measures of childhood
fundamental movement skill proficiency been established?
* Searches.
State the sources that will be searched (e.g. Medline). Give the search dates, and
any restrictions (e.g. language or publication date). Do NOT enter the full search
strategy (it may be provided as a link or attachment below.)
PubMed, Ovid MEDLINE, Ovid Embase, EBSCO CINAHL, EBSCO SPORTDiscus,
Ovid PsycINFO and Web of Science will be searched. The search strategy will
comprise of terms which relate to or describe the question of interest. Papers not
captured by searching these databases will be identified by reading through the
reference lists of included studies. Before a final synthesis of results, the searches
will be re-run to identify any further studies that need to be included. Publications
will only be included if they are written in English, unless a translated version is
available.
URL to search strategy.
Upload a file with your search strategy, or an example of a search strategy for a
specific database, (including the keywords) in pdf or word format. In doing so you
are consenting to the file being made publicly accessible.
Or provide a URL or link to the strategy. Do NOT provide links to your search
results.
https://www.crd.york.ac.uk/PROSPEROFILES/121029_STRATEGY_20190103.pdf

https://www.crd.york.ac.uk/prospero/#recordDetails 248
/10
248
Yes I give permission for this file to be made publicly available
* Condition or domain being studied.
Give a short description of the disease, condition or healthcare domain being
studied in your systematic review.
Fundamental Movement Skills (FMS) are a group of foundational motor skills,
which provide the basis for the development of more complex movements and
enable participation in a wide range of physical activity (Logan, Ross, Chee,
Stodden, & Robinson, 2018). There is a growing body of research exploring the
effects of FMS competence on other aspects of childhood development, with
evidence suggesting that these skills may have wide-reaching secondary impacts
(Barnett et al., 2016) including cognition (Haapala, 2013) and academic
achievement (Jaakkola, Hillman, Kalaja, Liukkonen, 2015). There are a large
proportion of children who are not competent at performing FMS in the UK
(Foulkes et al., 2015) and worldwide (Mukherjee, Ting & Fong, 2017). However,
there are a large number of assessment tools used to assess fundamental
movement skills in children, and it is unclear how valid and reliable these
assessment tools are. This systematic review will, therefore, explore the validity
and reliability of assessments of childhood fundamental movement skills.
* Participants/population.
Specify the participants or populations being studied in the review. The preferred
format includes details of both inclusion and exclusion criteria.
Studies will be included if they include participants who are of school age (both
primary and secondary) in the country in which they reside. Children who are too
young to attend school will be excluded. There will be no health or motor skill ability
criteria applied, however this information will be extracted during full text review to
explore whether demographic factors may have an influence on the validity and
reliability of assessment tools. Assessment tools of perceived motor competence,
rather than actual motor competence will be excluded from the review.
* Intervention(s), exposure(s).
Give full and clear descriptions or definitions of the interventions or the exposures
to be reviewed. The preferred format includes details of both inclusion and
exclusion criteria.

https://www.crd.york.ac.uk/prospero/#recordDetails 249
/10
249
A pre-review search was completed to identify assessment tools used to measure
childhood fundamental movement skills (FMS) using the search terms
‘fundamental movement skills’ OR ‘fundamental motor skills’ in the databases
identified for the systematic review. Any studies which explicitly stated they were
measuring FMS using an assessment tool were included.
Studies will be included if they use one of 32 assessment tools identified
The review will evaluate the evidence for the validity and reliability of these tools.
Assessments which have not had the validity or reliability explored will be included
for narrative purposes.
* Comparator(s)/control.
Where relevant, give details of the alternatives against which the
intervention/exposure will be compared (e.g. another intervention or a non-exposed
control group). The preferred format includes details of both inclusion and
exclusion criteria.
Not applicable
* Types of study to be included.
Give details of the study designs (e.g. RCT) that are eligible for inclusion in the
review. The preferred format includes both inclusion and exclusion criteria. If there
are no restrictions on the types of study, this should be stated.
Any study which explores the validity and reliability of assessment tools used to
measure fundamental movement skills that can be quantified using statistical tests
will be included.
Context.
Give summary details of the setting or other relevant characteristics, which help
define the inclusion or exclusion criteria. Assessment tools of perceived motor
competence, rather than actual motor competence will be excluded from the
review.
* Main outcome(s).

https://www.crd.york.ac.uk/prospero/#recordDetails 250
/10
250
Give the pre-specified main (most important) outcomes of the review, including
details of how the outcome is defined and measured and when these
measurement are made, if these are part of the review inclusion criteria.
Any form of validity or reliability that can be quantified statistically (e.g. concurrent
validity, predictive validity, test-retest reliability, inter-rater reliability, etc.)
* Additional outcome(s).
List the pre-specified additional outcomes of the review, with a similar level of detail
to that required for main outcomes. Where there are no additional outcomes please
state ‘None’ or ‘Not applicable’ as appropriate to the review
None.
* Data extraction (selection and coding).
Describe how studies will be selected for inclusion. State what data will be
extracted or obtained. State how this will be done and recorded.
Titles and abstracts identified using the search strategy will be screened
independently by three reviewers to identify studies that may qualify for inclusion.
Reviewers will not be blind to information regarding the author or the journal the
article is published in. The full text of potentially eligible studies will be retrieved
and independently assessed for eligibility by three review team members.
Disagreement between reviewers over eligibility will be resolved through
consultation with a fourth reviewer.
Three review authors, not blinded to information regarding the author or the journal
will independently extract information from a third of the studies. Information will be
extracted on the following aspects of each study:
Study eligibility, study design, study context, date of publication, region/country, participant
demographic/socioeconomic characteristics, who implemented the assessment tool, as well as information to
allow assessment of study risk of bias.
The types of validity and reliability measured by each study and the statistics used to measure these constructs

https://www.crd.york.ac.uk/prospero/#recordDetails 251
/10
251
Statistical findings and reported conclusions
Source(s) of research funding and potential conflicts of interest.
* Risk of bias (quality) assessment.
State which characteristics of the studies will be assessed and/or any formal risk of
bias/quality assessment tools that will be used.
Risk of bias will be assessed independently by three reviewers using the RoBANS
tool for non-randomized studies (Kim et al., 2013). Each of the three reviewers will
complete risk of bias assessment for a third of the studies. The lead reviewer will
check all judgements, and if disagreements occur, a fourth reviewer will be
consulted.
* Strategy for data synthesis.
Describe the methods you plan to use to synthesise data. This must not be generic text but should be specific
to your review and describe how the proposed approach will be applied to your data.
If meta-analysis is planned, describe the models to be used, methods to explore
statistical heterogeneity, and software package to be used.
Summary tables of each FMS assessment tool will be created to detail the studies
that have explored the validity and reliability of each tool, demographic information
about the samples, who implemented the assessment tool (e.g. researcher,
teacher etc), the different forms of reliability and validity assessed (e.g. internal
consistency, re-test reliability, criterion and construct validity) statistical values (e.g.
intraclass correlation values, mean differences and Pearson’s r), and the quality of
each paper. Two reviewers will independently assess the quality of each paper
using the RoBANS tool, with any discrepancies being resolved through discussion
with a third reviewer.
If the design of studies are sufficiently homogenous, a meta-analysis comparing
the assessment tools across the different forms of validity and reliability will be
conducted in RevMan using aggregate data (e.g. comparing the test-retest
reliability of the different assessment tools). The statistical values from each
included paper will be extracted independently by two reviewers. Any
discrepancies will be resolved through consultation with a third reviewer. This
analysis will, however, only be possible if validity and reliability are measured in

https://www.crd.york.ac.uk/prospero/#recordDetails 252
/10
252
similar ways across multiple papers for each assessment tool. If a meta- analysis is
not possible, narrative synthesis will be used.
* Analysis of subgroups or subsets.
State any planned investigation of ‘subgroups’. Be clear and specific about which
type of study or participant will be included in each group or covariate investigated.
State the planned analytic approach.
None planned
Wounds, injuries and accidents No
Violence and abuse No
Language.
Select each language individually to add it to the list below, use the bin icon to
remove any added in error.
English
There is not an English language summary
* Country.
Select the country in which the review is being carried out. For multi-national
collaborations select all the countries involved.
England
Other registration details.
Name any other organisation where the systematic review title or protocol is
registered (e.g. Campbell, or The Joanna Briggs Institute) together with any unique
identification number assigned by them.

https://www.crd.york.ac.uk/prospero/#recordDetails 253
/10
253
If extracted data will be stored and made available through a repository such as the
Systematic Review Data Repository (SRDR), details and a link should be included
here. If none, leave blank.
Reference and/or URL for published protocol.
If the protocol for this review is published provide details (authors, title and journal
details, preferably in Vancouver format)
No I do not make this file publicly available until the review is complete
Dissemination plans.
Do you intend to publish the review on completion?
Yes
The review will be submitted to a journal upon completion. The results of the
systematic review will also be documented within a PhD thesis.
Keywords.
Give words or phrases that best describe the review. Separate keywords with a
semicolon or new line. Keywords help PROSPERO users find your review
(keywords do not appear in the public record but are included in searches). Be as
specific and precise as possible. Avoid acronyms and abbreviations unless these
are in wide use.
Fundamental movement skills
Validity
Reliability
Assessment
Details of any existing review of the same topic by the same authors.
If you are registering an update of an existing review give details of the earlier
versions and include a full bibliographic reference, if available.

https://www.crd.york.ac.uk/prospero/#recordDetails 254
/10
254
* Current review status.
Update review status when the review is completed and when it is published.
New registrations must be ongoing so this field is not editable for initial submission.
Review_Completed_published
Any additional information.
Provide any other information relevant to the registration of this review.
There is a similar systematic review looking at the validity and reliability of motor
skill assessments. This review is however, substantially different as it focuses on
one specific group of motor skills (fundamental movement skills). Also, this review
does not limit to typically developing children, and can therefore explore how well
assessment tools can discriminate between typically developing and non-typically
developing children.
Details of final report/publication(s) or preprints if available.
Leave empty until publication details are available OR you have a link to a preprint
(NOTE: this field is not editable for initial submission).
List authors, title and journal details preferably in Vancouver format.
Eddy, L. H., Bingham, D. D., Crossley, K. L., Shahid, N. F., Ellingham-Khan, M.,
Otteslev, A., Figueredo, N. S., Mon-Williams, M., & Hill, L. J. B. (2020). The validity
and reliability of observational assessment tools available to measure fundamental
movement skills in school-age children: A systematic review. PloS One, 15(8),
e0237919. https://doi.org/10.1371/journal.pone.0237919
https://journals.plos.org/plosone/article?id=10.1371/journal.pone.0237919

https://www.crd.york.ac.uk/prospero/#recordDetails 255
/10
255
Appendix B
Search Strategy for the Systematic Review in Chapter 2
Assessment tools terms Reliability/ validity search
terms
Population search terms
Movement Assessment
Battery for Children
Valid* Child*
MABC Reliab* Infant*
MABC 2 Accura* School child*
MABC 2 Feasib* Adolescen*
M-ABC Consisten* Preschool
Movement-ABC Agreement Pre-school
Movement-ABC 2 Precision Boy*
Movement-ABC-2 Psychometric propert* Girl*
Movement ABC Repeatab* Young people
Movement ABC 2 Reproducib* Teenager
Movement ABC-2 Convergent Youth
Assessment of Perceptual
and
Fundamental Motor Skills
Inventory
divergent
APM Inventory
APM-Inventory
Fundamental Motor Skills
Test
Package

https://www.crd.york.ac.uk/prospero/#recordDetails 256
/10
256
FMS Test Package
Fundamental Movement
Skill Polygon
FMS Polygon
FMS-Polygon
Peabody Developmental
Motor Scale
PDMS
PDMS 2
PDMS-2
Get Skilled Get Active
GSGA
NSW Department of
Education and Training
resource on FMS
New South Wales
Department of Education
and Training resource on
FMS
NSW Department of
Education and Training
resource on Fundamental
Movement Skills
New South Wales
Department of Education
and Training resource on
Fundamental Movement
Skills

https://www.crd.york.ac.uk/prospero/#recordDetails 257
/10
257
Körperkoordinationstest für
Kinder
Korperkoordinationstest fur
kinder
KTK
Test of Gross Motor
Development
TGMD
TGMD 2
TGMD-2
TGMD 3
TGMD-3
Bruninks-Oseretsky Test of
Motor Proficiency
BOTMP
BOTMP 2
BOTMP-2
BOT
BOT-2
BOT 2
Furtado-Gallagher
Computerized Observational
Movement Pattern
Assessment System
FG-COMPASS

https://www.crd.york.ac.uk/prospero/#recordDetails 258
/10
258
Motoriktest für vier-bis
sechsjährige Kinder
Motoriktest fur vier-bis
sechsjahrige Kinder
MOT 4-6
Ohio State University Scale
of Intra Gross Motor
Assessment
OSU-SIGMA
SIGMA
Athletic Skills Track
AST
Canadian Agility and
Movement Skill Assessment
CAMSA
Children's Activity and
Movement in Preschool
Motor Skills Protocol
CMSP
CHAMPS
CHAMPS motor skills
protocol
Early years movement skills
checklist
EYMSC
Fundamental Motor Skill
Stage Characteristics

https://www.crd.york.ac.uk/prospero/#recordDetails 259
/10
259
Fundamental Movement
Screen
Fundamental Movement
Screen Test
Fundamental movement
skill assessment tool
Instrument for the
Evaluation of Fundamental
Movement Patterns
Instrumento de Evaluacion
de los Patrones Basicos de
Movimiento
IPBM
Lifelong Physical Activity
Skills Battery
NSW Schools Physical
Activity and Nutrition
Survey
New South Wales Schools
Physical Activity and
Nutrition Survey
NSW SPANS
New South Wales SPANS
Objectives-Based Motor
Skill Assessment Instrument
Passport for Life
PE Metrics

https://www.crd.york.ac.uk/prospero/#recordDetails 260
/10
260
PLAYbasic
PLAYfun
Preschooler gross motor
quality scale
PGMQ
Smart Start
Smart start-2
Smart Start 2
Teen Risk Screen
Test for FMS in Adults
Test for Fundamental
Movement Skills in Adults
TFMSA
Instrumento para la
evaluacion de Patrones
Basicos de Movimiento
IPBM
Victorian FMS Assessment
instrument
Victorian Fundamental
Movement Skills
Assessment Instrument
Victorian FMS Teacher*
Manual Assessment

https://www.crd.york.ac.uk/prospero/#recordDetails 261
/10
261
Victorian Fundamental
Movement Skill Teacher*
Manual Assessment
Victorian Fundamental
Motor Skills manual
Department of Education of
Victoria A Fundamental
Motor Skills: A Manual for
Classroom Teachers
Western Australian Stay in
Step Screening Assessment
Western Australian
Department of Education
Steps Resource: The Stay in
Step Screening Assessment
Stay in step

262
Appendix C
Study Table for the Systematic Review in Chapter 2
Citation Assessme
nt tool(s)
used
Sample Outcome Statistics
used
Results Methodolo
gy quality
rating (%)
Africa &
Kidd
(2013)
Teen risk
screen
Girls = 125
(mean age =
12.12; SD=
1.1)
Teachers = 7
Internal
Consistency
Cronbach’s
alpha
Posture and stability (axial movement) time 1 = .93,
time 2 = .86
Posture and stability (dynamic movement) time 1 =
.89, time 2 = .86
Locomotor (single skills) time 1 = .89, time 2 = .90
Locomotor (combination) time 1= .67, time 2 = .56
Manipulative Skills (sending away) time 1 = .71, time
2 = .45
Manipulative skills (maintaining possession) = .58
36%

263
Test-retest
reliability Pearson
correlation
Posture and stability (axial movement) = .59
Posture and stability (dynamic movement) = .69
Locomotor (single skills) = .88
Locomotor (combination) = .76
Manipulative Skills (sending away) = .43
Manipulative skills (maintaining possession) = .58
Intraclass
correlation
Posture and stability (axial movement) = .51 (.32, .65)
Posture and stability (dynamic movement) = .63 (.46,
.75)
Locomotor (single skills) = .86 (.76, .91)
Locomotor (combination) = .74 (.65, .82)

264
Manipulative Skills (sending away) = .34 (.13, .51)
Manipulative skills (maintaining possession) = .56
(.42, .67)
Structural
validity Confirmator
y Factor
analysis
Postural stability (axial movement) and postural
stability (dynamic movement) test 1 scales - marginal
fit statistics with the RMSEA just outside the
prescribed boundaries (<.05). AGFA indices were
acceptable (>.95).
Test 2 fit statistics were well below acceptable.
Locomotor (single skills) - marginally acceptable
RMSEA (Test 1 and 2) and acceptable AGFI, CR and
VE (Test 1 and 2).
3-scale CFA model gave acceptable results for all
indices at both time points with perhaps the VE of
manipulative skills (sending away) at time Test 2
being slightly lower (VE=0.43).

265
Allen et al.
(2017)
TGMD-3 14 children
with ASD
(age range 4-
10)
21 typically
developing
children, aged
4 - 11.
Internal
consistency
Cronbach’s
alpha
TGMD-3
Typically developing group:
Locomotor skills= 0.70; Ball Skills= 0.6; Overall=
0.74
ASD- traditional protocol:
Locomotor skills= 0.82; Ball Skills= 0.75; Overall=
0.88
ASD- visual protocol:
Locomotor skills= 0.93; Ball skills= 0.81; Overall=
0.93
TGMD-2
Locomotor= 0.85; Ball skills= 0.88; Overall= 0.91
55%
Inter-rater
reliability
Intra-class
correlationa
l coefficient
with 95%
confidence
limits
ASD visual:
Locomotor= 0.98 (0.94, 1.00)
Ball skills= 0.96 (0.86, 0.99)

266
Overall= 0.99 (.95, 1.00)
ASD traditional:
Locomotor= 0.98 (0.92, 0.99)
Ball skills= 0.97 (0.91, 0.99)
Overall= 0.98 (0.94, 1.00)
Typically developing:
Locomotor= 0.91 (0.79, 0.96)
Ball skills= 0.92 (0.81, 0.97)
Overall= 0.94 (0.87, 0.98)
Intra-rater
reliability
ASD visual:
Locomotor= 0.99 (.95, 1.00)
Ball skills= 1.00 (0.98, 1.00)

267
Overall= 0.99 (0.98, 1.00)
ASD traditional:
Locomotor= 0.97 (0.88, 0.99)
Ball skills= 0.99 (0.96, 1.00)
Overall= 0.99 (0.92, 1.00)
Typically developing:
Locomotor= 0.97 (0.93, 0.99)
Ball skills= 0.91 (0.68, 0.97)
Overall= 0.95 (0.84, 0.98)
Test-retest
reliability
ASD visual:
Locomotor= 0.92 (0.65, 0.98)

268
Ball skills= 0.83 (0.39, 0.96)
Overall= 0.92 (0.66, 0.98)
ASD traditional:
Locomotor= 0.92 (0.65, 0.98)
Ball skills= 0.82 (0.31, 0.96)
Overall= 0.91 (0.63, 0.98)
Typically developing:
Locomotor= 0.81 (0.94, 0.53)
Ball skills= 0.84 (0.62, 0.94)
Overall= 0.92 (0.78, 0.97)
Structural
validity
Two-tailed
independent
t-test
Differences between TGMD-3 traditional protocol
(typically developing and ASD):

269
Locomotor - t=3.75, p=.001
Ball Skills - t=3.51, p=.002
Overall - t=3.93, p=.001
typically developing group scored significantly higher
on the TGMD-3 traditional protocol than the ASD
group
Positive correlations between TGMD-3 traditional
protocol and the TGMD-3 visual protocol scores:
Locomotor - r(10)=0.94, p<0.001, 95% CI (0.80,
0.98)
Ball Skills - r(10)=0.93, p<0.001, 95% CI (0.76, 0.98)
Overall - r(10)=0.96, p < 0.001, 95% CI (0.86, 0.99).

270
Bakke et
al (2017)
MABC- 2
Portugues
e version
Children= 30
(17 boys; 13
girls; mean
age = 9.44;
SD= 1.08)
Moderate low
vision= 28
Severe low
vision= 2
Test-retest
reliability
Intraclass
correlationa
l coefficient
with 95%
confidence
limits
A1xA2 (rater 1 in the first application; rater 1 in the
second application)
Aiming and catching= 0.867 (0.676, 0.945)
Balancing = 0.856 (0.651, 0.941)
Total= 0.958 (0.899, 0.983)
B1xB2 (rater 2 in the first application; rater 2 in the
second application)
Aiming and catching= 0.847 (0.628, 0.936)
Balancing= 0.834 (0.596, 0.931)
50%

271
Inter-rater
reliability
Intraclass
correlationa
l coefficient
with 95%
confidence
limits
A1xB2 (rater 1 in the first application; rater 2 in the
first application)
Aiming and catching= 0.957 (0.905, 0.980)
Balance= 0.936 (0.867, 0.970)
Total= 0.971 (0.939, 0.986)
Internal
consistency
Cronbach’s
alpha
Cronbach’s alpha ranged from 0.790 to 0.868.
Bardid et
al (2016)
KTK
MOT 4-6
638 young
children (323
boys; 315
girls)
aged 5-6.
Concurrent
Validity
Hypothesis
Testing
Validity
Spearman's
rank
KTK MQ and MOT 4-6 MQ (rs = .63)
KTK MQ and MOT 4-6 gross motor cluster score (rs
= .62)
KTK MQ and MOT 4-6 locomotor score (rs = .56)
47%

272
KTK MQ and MOT 4-6 stability score (rs = .43)
KTK MQ and MOT 4-6 object-control score (rs =
.37).
KTK MQ and MOT 4-6 ne motor cluster score (rs =
.32).
MQs of both tests (rs = .61–.67)
KTK MQ and MOT 4-6 gross motor score (rs = .62–
.72).
KTK MQ and MOT 4-6 locomotor score (rs = .53–
.68)
KTK MQ and MOT 4-6 stability score (rs = .42–.49)
KTK MQ and MOT 4-6 object-control score (rs =
.31–.44)

273
KTK MQ and MOT 4-6 ne motor cluster score (rs =
.20–.47).
Cohen’s
Kappa
KTK and MOT 4-6 at P2 (.50)
P16 (.52),
P84 (.23),
P98 (.00).
Bardid et
al. 2016b
TGMD-2 1614 children
aged 3-8
years
841 boys, 773
girls
Cross
cultural
validity
Chi-squared Belgian children performed significantly worse than
US norm sample on GMQ (chi-square = 219.548, p <
0.001, Cramer’s V = 0.279).
Belgian children’s performed worse on the locomotor
(chi-square = 147.872, p < 0.001, Cramer’s V =
0.229) and object control subtests (chi-square =
357.94, p < 0.001, Cramer’s V = 0.356)
60%

274
Hypotheses
testing
validity
T-tests No significant differences between Belgian and US
boys on the locomotor subtest in the age groups of
three (t = 0.961, p = 0.338), four (t= 1.735, p = 0.084)
and five (t = 1.300, p = 0.195)
No significant difference between Belgian and US
three year-old girls (t = -0.828, p = 0.410) and four-
year-old girls (t = 1.233, p = 0.220),
Five year-old Belgian girls scored significantly higher
on locomotor skills (t = 4.813, p < 0.001, Cohen’s d =
0.4).
Lower locomotor skill performances for Belgian boys
and girls aged six years (boys t = -5,632, p <
0.001, Cohen’s d = 0.446 and girls t = -2.193, p =
0.030, Cohen’s d = 0.161), seven years (boys
t = -4.036, p < 0.001, Cohen’s d = 0.396 and girls t = -
3.106, p = 0.002, Cohen’s d = 0.306) and
eight years (boys t = -3.577, p = 0.001, Cohen’s d =
0.453 and girls t = -9.717, p < 0.001,
Cohen’s d = 1.095)

275
Belgian children of all age groups performed
significantly worse on object control skills than the
US reference population (all p-values < 0.001,
Cohen’s d = 0.303-1.269).
Bardid,
Utesch, &
Lenoir
(2019)
BOT-2 SF 2538 children
aged 6‐11
years from
urban and
rural areas.
Structural
Validity
Rasch
Analysis –
General
Partial
Credit
Model
No global model fit (not unidimensional)
Copying a square and copying a star were misfitting
After removing misfitting items, BOT-2 SF was
unidimensional (19.92 ≤ χ2≤ 60.71; 0.06 ≤ P ≤ .97
Disordered thresholds for all items except item 5
Good sensitivity and reliability across the continuum
of motor competence for 6‐ to 8‐year‐old children, 9-
11 year olds showed ceiling effects
48%
Barnett et
al. (2014)
TGMD-2 37 children
(65% girls)
aged 4–8
years (M =
6.2, SD = 0.8)
Inter-rater
reliability
Intraclass
Correlation
Stationary dribble:
Contacts ball with one hand at about belt level
k1=0.83 k2=0.71
Pushes ball with fingertips (not a slap) k1= 0.62
k2=0.63
54%

276
Ball contacts surface in front of or to the outside of
preferred foot k1=0.94, k2=0.87
Maintains control of ball for four consecutive bounces
without having to move the feet to retrieve it –
k1=0.75 k2= 0.87
Striking a stationary ball:
Dominant hand grips bat above nondominant hand
k1= 0.92 k2=0.91
Nonpreferred side of body faces the imaginary tosser
with feet parallel – k1=0.38 k2=1.00
Hip and shoulder rotation during swing k1=0.27 k2=
0.32
Pronounced/clear transfer of body weight to front foot
k1=0.68 k2= 0.61

277
Bat contacts ball k1= 0.88 k2=0.69
Overhand throw:
Windup is initiated with downward movement of
hand/arm k1= 0.34 k2= 0.39
Rotates hip and shoulders to a point where the
nonthrowing side faces the wall k1=0.50 k2= 0.53
Weight is transferred by stepping with the foot
opposite the throwing hand k1=0.42 k2= 0.62
Follow-through beyond ball release diagonally across
the body and down towards the non-preferred side
k1=0.65 k2= 0.65
Underhand roll

278
Preferred hand swings down and back, reaching
behind the trunk while chest faces cones k1=0.84
k2=0.87
Strides forward with foot opposite the preferred hand
towards the cones k1= 0.62 k2= 0.72
Bends knees to lower body k1=0.72 k2=0.49
Releases ball close to the floor so ball does not
bounce more than 4 inches high k1=0.59 k2= 0.47
Kick
An elongated stride or leap immediately prior to ball
contact k1= 0.84 k2=0.36
Nonkicking foot placed even with or slightly in back
of the ball k1=0.69 k2= 0.65

279
Kicks ball with instep of preferred foot (shoe-laces) or
toe k1=1.00 k2=1.00
Catch
Preparation phase where hands are in front of the
body and elbows are flexed k1=0.37 k2= 0.54
Arms extend while reaching for the ball as it arrives
k1=0.42 k2= 0.53
Ball is caught by hands only k1= 0.89 k2=0.81
Intraclass
correlation
Object control subset= excellent (0.93)
Dribble = 0.94 (0.89-0.97)
Strike= 0.85 (0.73-0.92)
Throw= 0.84 (0.70-0.91)
Roll= 0.82 (0.67-0.90)

280
Kick= 0.80 (0.64-0.89)
Catch= 0.71 (0.54-0.84)
Borremans
et al
(2009)
MABC- 2 30 young
adults aged
15–21 years
(21 males; 9
females;
mean age =
17.2; SD =
1.2) with
Asperger
syndrome
Control group
=
30 young
adults (mean
age= 16.9; SD
= 0.8yrs)
Internal
consistency
Cronbach’s
Alpha
Manual dexterity= .44 (in both groups)
If bimanual task deleted= .65 for control group; .71
for AS group
Ball skills = .73 (control) .84 (AS group)
Balance = .35 (control group) .57 (AS)
Zigzag hopping items deleted =.73.
63%

281
Hypothesis
testing
validity
MANOVA AS performed statistically lower compared to control
on overall motor competence (Wilk’s Lambda =
.49, F(11, 48) = 4.48 (p < .001), manual dexterity,
λ = .72, F(4, 55) = 5.29 (p < .001), ball skill
items λ = .63, F(3, 56) = 11.06 (p < .001); and
for balance items λ = .65, F(4, 55) = 7.34 (p <
.001).
Brian et al.
(2018)
TGMD-2
and
TGMD-3
66 children
and
adolescents
(boys = 41;
girls = 25)
aged
9–18 years
(mean age =
12.93, SD =
2.40 years)
White = 51;
Black = 9;
Inter-rater
reliability
Intra-class
correlation
TGMD-3:
Gross motor scale= ICC = .91; CI [.85, .94]),
Locomotor= ICC = .92; CI [.87, .95
Ball skills scales = (ICC = .92; CI [.87, .95])
44%
Internal
consistency
McDonald’
s omega
and gauge
reliability
TGMD-3
Gross motor (ω = .95; , CI, [.93, .96])
Ball skills subscale (ω = .91; CI [.87, .94])
Locomotor subscales (ω = .89; CI [.84, .93])

282
Asian = 2;
Hispanic = 4
Mean body
mass
index of
21.78 (SD =
5.85; boys =
22.09, SD =
6.36; girls =
21.32, SD =
5.07).
Structural
Validity
Confirmator
y factor
analysis
Pearson
product
moment
correlations
Correlations ranged from r = .98–.99 (all significant)
Factor loadings ranged from .57 to .92.
Ball skill and locomotor subscales= (.89)
Criterion
Validity
(Concurrent)
Pearson
product
moment
correlations
Object control TGMD-2 & ball skills TGMD-3= .98
Object control TGMD-2 & Locomotor TMGD-2 =
.84
Object control TGMD-2 & Locomotor TMGD-3 =
.87
Object control TGMD-2 & Gross Motor TGMD-2 =
.96
Object control TGMD-2 & Gross Motor TGMD-3 =
.96
Ball skills TGMD-3 & Locomotor TGMD-2 = .86

283
Ball skills TGMD-3 & Locomotor TGMD-3 = .9
Ball skills TGMD-3 & Gross Motor TGMD-2 = .96
Ball skills TGMD-3 & Gross Motor TGMD-3 = .98
Locomotor TGMD-2 & Locomotor TGMD-3 = .98
Locomotor TGMD-2 & Gross Motor TGMD-2 = .96
Locomotor TGMD-2 & Gross Motor TGMD-3 = .94
Locomotor TGMD-3 & Gross Motor TGMD-2 = .96
Locomotor TGMD-3 & Gross Motor TGMD-3 = .97
Gross Motor TGMD-2 & Gross Motor TGMD-3 =
.99
Brown
(2019)
BOT-2-BF 123 children
aged 8-12 (67
males & 56
Structural
Validity
Rasch
Measureme
14 item BOT-BF:
60%

284
females;
mean age=10
years, 2
months;
SD=1 year, 4
months)
nt Model
Analysis
Bilateral Coordination item 3 (BC3), Bilateral
Coordination item 6 (BC6), Balance item 2 (B2), Fine
Motor Integration item 7 (FMI7),
Strength item 2 (S2), Upper-limb Coordination item 1
(UC1), Fine Motor Integration item 2 (FMI2), Manual
Dexterity item 2 (MD2),
and Fine Motor Precision item 3 (FMP3) were
misfitting items
BOT-2 BF was unidimensional
DIF was found for balance item 7 when examining
gender differences
Person-separation reliability was 0.63, and
item-separation reliability was 1.00
The Person Raw Score reliability for the BOT-2-BF
was 0.69

285
Revised 5 item BOT-2 BF (nine misfitting items
removed)
No misfitting items
No items had DIF based on gender
Unidimensionality requirements were met
Person-separation reliability = 0.60, and item
separation
reliability =1.00
Person Raw Score reliability = 0.62.
Brown
(2019b)
BOT-2 117 children
aged between
8 and 12
years of age -
mean age of
Structural
Validity
Rasch
Analysis
Item Fit – logit scores for the eight BOT-2 subscale
items ranged from −9.36 to 7.46. Upper limb
coordination had one misfitting item. Balance had 4
misfitting items. FMCC and BCC both had a large
number of items that didn’t meet Rasch requirements
93%

286
10 years 2
months
65 males
(56.6%) and
52 females
(44.4%)
Unidimensionality - The percentage of unexplained
variance in the eight BOT-2 subscales ranged from
0.00% to 4.70%. Subscales are unidimensional. The
percentage unexplained for composite scales ranged
from .9% - 2%, and are unidimensional
DIF- balance and upper limb coordination had one
item which exhibited DIF by gender. MCC and BCC
had 2 items with gender DIF.
Reliability - Item reliability of the eight BOT-2
subscales ranged from 0.95 to 1.00 while person
reliability coefficients ranged from 0.08 to 0.80. For
the four composite scales, item reliability coefficients
ranged from 0.98 to 1.00 and person reliability
coefficients
ranged from 0.50 to 0.85.
Cairney et
al. (2009)
BOT-SF
MABC
BOT-SF =
2058 children
24 of 128
children aged
10 (n = 10),
11 (n = 10) or
Concurrent
validity
PPV; 5th
and 15th
percentile
cut-points
on the M-
ABC
21 of 24 children identified as probable
DCD on the BOT-SF were below the 15th percentile
on
M-ABC - PPV = 0.88 (95% CI = 0.69 to 0.96).
30%

287
12 (n = 4)
scoring below
the sixth
percentile =
MABC
15 children were below the 5th percentile – PPV=
0.63 (95% CI = 0.43 to 0.79)
Cairney et
al (2018)
PLAYfun 215 children
in total: 112
(52%) males
and 103
(48%)
females.
Age was not
recorded for
one child. For
the remaining
214, the
average age
was 10.3
years
(SD=1.7),
with a
minimum of
6.5 and a
maximum of
14.1.
Reliability /
Measurement
Error
(Inter-rater
reliability)
Intra-class
correlation
(ICC)
For the total score among 7 assessors in the pilot
sample of 10 children:
ICC = 0.87
76%
Structural
Validity
Hypothesis
testing
validity
Confirmator
y factor
analysis
The fit of the initial model was fair (RMSEA = 0.065,
90% CI = 0.052 to 0.077; CFI =0.93; TLI = 0.91).
Modification - a path to allow error terms for tasks 15
and
16. RMSEA = 0.055, 90% CI = .03 - .075, CFI = .95,
TLI = .94.

288
Cano-
Cappellacc
i,Leyton
and
Carreno
(2015)
TGMD-2
Chilean
Version
TGMD-2
92 children
aged 5-10 (56
boys; 36 girls;
mean
age=7.5;
SD=1.6)
Content
Validity
Content
validity
index (CVI)
Language clarity - CVI = 0.88 for TGMD-2-CH
- CVI = 0.83 for the modified
TGMD-2
TGMD-2-CH CVI = 0.90
Modified test CVI = 0.84
41%
Inter-Rater
Reliability
T-Test Total score - p=.006
Locomotor – p=.14
Object Control – p=.01
CVI (95%
CI)
Total score - 0.86 (0.72,0.93)
Locomotor - 0.87 (0.73,0.93)
Object Control - 0.88 (0.77,0.94)
T-Test Total score - p=.91

289
Intra-Rater
Reliability
Locomotor – p=.92
Object Control – p=.86
CVI (95%
CI)
Total score - 0.91 (0.83, 0.95)
Locomotor - 0.92 (0.83, 0.95)
Object Control - 0.86 (0.76, 0.93)
Test-Retest
Reliability
T-Test Total score - p=.88
Locomotor – p=.86
Object Control – p=.80
CVI (95%
CI)
Total score - 0.88 (0.75, 0.94)
Locomotor - 0.86 (0.71, 0.93)
Object Control - 0.80 (0.59, 0.90)

290
Capio,
Eguia and
Simons
(2016)
TGMD-2 81 children
with
intellectual
disability
aged 5-14 (65
boys; 16 girls;
mean age =
9.29; SD=
2.71 years)
Intra-rater
Reliability
Intra-class
correlation
Locomotor= 0.995; (0.978-0.999)
Object control= .998 (0.991-0.999)
Total FMS= 0.997 (0.989-0.999)
56%
Inter-rater
reliability
Intra-class
correlation
Locomotor= 0.996 (0.984- 0.999)
Object control= 0.998 (0.992-1.000)
Total FMS= 0.998 (0.991-0.999)
Internal
consistency
Cronbach’s
alpha
Locomotor components = 0.830; range of 0.757–
0.814 when each item is deleted.
Object control components= 0.792; range of 0.713–
0.757 when each item is deleted.
Item-total correlation coefficients = locomotor
components = 0.712 to 0.913,
Object control components = 0.673 to 0.816.
Content
Validity Pearson
product–
moment
Age and locomotor = (r = 0.222, P = 0.047) and
object control skills (r = 0.356, P = 0.001).

291
correlation
coefficient
Multivariate
analysis of
covariance
(ANCOVA)
Multivariate ANCOVA = (F(2, 78) = 5.865, P =
0.004, η2 = 0.131).
Structural
validity Confirmator
y factor
analysis
(CFA)
Hypothesis
testing
validity
Locomotor and object control of TGMD-2 with fit
indices: χ2 = 33.525, DF = 34, P = 0.491, χ2/DF =
0.986
GFI = 0.931.
RMSEA = 0.000 with 90% CI of 0.000–0.080
Capio, Sit
and
Abernethy
(2011)
TGMD-2 30 children
with CP (17
girls, 13 boys)
aged 6-14
(mean age=
9.83 years,
SD = 2.5
years).
Inter-rater
reliability
Cohen’s
Kappa
coefficient
Kappa ranged from 0.875 – 0.907
47%

292
Chow et
al. (2002)
Age
Band IV
of the
MABC
test
31 teenagers
(mean age =
13.92, SD=
1.26)
Test- retest
reliability
Intraclass
correlation
coefficient
(ICC)
One-hand catch – preferred hand = 0.75
One-hand catch – non-preferred hand = 0.84
Throwing at wall target = 0.76
Two-board balance = 0.73
Cross board balance = 0.91
Jumping and clapping = 0.84
Zig-zag hopping – preferred leg = 0.91
Zig-zag hopping – non-preferred leg = 0.89
Walking backwards =0.06
48%
Inter-rater
reliability
Intraclass
correlation
coefficient
(ICC)
One-hand catch – preferred hand =0.98
One-hand catch – non-preferred hand =0.97

293
Throwing at wall target = 0.92
Two-board balance = 1.00
Cross board balance =0.98
Jumping and clapping = 0.52
Zig-zag hopping – preferred leg =0.96
Zig-zag hopping – non-preferred = 0.96
Walking backwards = 0.95
Crawford,
Willson
and
Dewey
(2001)
BOT &
M-ABC
101 children
with DCD (61
boys; 40 girls;
mean age=
11.62 yrs; SD
= 1.97)
(low
SES=25.8%;
Criterion
Validity
(Concurrent)
Observed
agreement
between
tests (Po)
and
agreement
corrected
for by
BOT (gross motor) = PO= 0.846, Kappa= 0.673
BOT (fine motor) and BOT (battery composite) =
PO= 0.791, Kappa= 0.476
BOT (fine motor) and BOT (gross motor) = PO=
0.667, Kappa= 0.264
50%

294
middle SES=
47.3%; high
SES= 26.9%)
and
101 matched
children in the
non DCD
group (81
boys; 20 girls;
mean age=
11.50; SD=
2.00)
(low SES=
22.1%;
middle SES=
51.6%; high
SES= 26.3%)
chance
(kappa)
M-ABC and BOT battery composite = PO= 0.722,
Kappa= 0.416
M-ABC and BOT Gross Motor= PO= 0.722, Kappa=
.430
M-ABC and BOT Fine Motor= PO= 0.569, Kappa=
0.073
Croce,
Horvat and
McCarthy
(2001)
MABC,
Bruininks-
Oseretsky
test
106 children
aged 5-12 (39
girls; 67 boys)
Criterion
Validity
(Concurrent)
Pearson
correlation
coefficients
MABC test- Bruininks-Oseretsky Long From
All groups= .76
5-6yr olds= .77
7-8yr olds= .76
9-10yr olds= .70
11-12 yr olds= .90
40%

295
MABC - Bruininks-Oseretsky Short Form
All groups= .71,
5-6yr olds= .79
7-8yr olds= .76
9-10yr olds= .60
11-12 yr olds= .90
Test-retest
reliability of
the MABC
Intraclass
correlation
coefficient
(ICC)
All groups= .95
5-6 yr olds= .98
7-8yr olds= .95
9-10yr= .92
11-12yr= .97
Darsaklis
et al.
(2013)
M-ABC-2
and BOT
Not specified Inter-rater
reliability
Cohen’s
kappa
MABC (overall) = κ = 0.93
BOT:
Running speed and agility= k= 1.00
Balance= k=1.00
13%

296
Bilateral coordination= k=1.00
Strength= k=1.00
Upper-limb coordination = k = 1.00
Dos
Santos et
al. (2017)
MABC-2 350 Children
(188 girls and
162 boys) 350
children (162
boys and 188
girls) aged
between 8 and
10.
(Associação
Brasileira de
Empresas de
Pesquisa
[ABEP],
2008), 1.4%
of
the students
belonged to
social class
A2, 8% to
Structural
validity
Confirmator
y factor
analysis
Correlations between items and MABC-2
Catching with two hands = 0.31
Throwing beanbag onto mat = 0.33
One-board balance for right foot = 0.73
One-board balance for left foot =0.72
Walking heel to toe forwards = 0.34
Hopping on mats 2 for right foot = 0.37
Hopping on mats 2 for left foot = 0.38
1 factor model:
cfd/² = 3.99, GFI = .91, AGFI = .86, CFI= .72,
RMSEA =.09
Original 3 factor model:
cfd/² = 2.82, GFI = .96, AGFI = 94, CFI= .97,
RMSEA =.06
47%

297
social class
B1,
27.1% to
social class
B2, 35.7 % to
social class
C1, 17.4% to
social class
C2, 8.6% to
social class C
and 1.4% to
social class
D.
Schulz et al (2011) model:
cfd/² = 1.97, GFI = .98, AGFI = .97, CFI= 1, RMSEA
=.01
Ellinoudis
and
Thomas
(2008)
MABC In total 220
participants -
110 boys and
110 girls
(Mean age in
months =
126.5, SD =
3.49)
Structural
validity
Cronbach’s
alpha
Age band 3: ranged from .30 to .80.
Age band 4: ranged from .41 to .77
54%
Pearson
correlation
coefficients
Correlation between item score and MABC score
Age band 3:

298
Participants
were divided
into two age
groups:
First = boys
(n=55) and
girls (n=55)
aged 9 to 10
years (n=110,
Mean age in
months =
114.74, SD =
3.88)
Second =
boys (n=55)
and girls
(n=55) aged
11 to 12 years
(n=110, Mean
age in months
= 138.3, SD =
3.11)
Two-hand catch -.52
Throw bean bag into box -.43
One-board balance-preferred leg -.35
One-board balance-other leg -.39
Hopping in squares-preferred leg -.23
Hopping in squares-other leg -.26
Ball balance .52
Age band 4:
One-hand catch-preferred hand -.50
One-hand catch-other hand -.37
Throw at wall target -.46
Two-board balance -.46
Jump and clap -.59
Walking backwards -.30
Cohens
effect size
Correlation between item score and MABC score
Age band 3:
Two-hand catch -1.2

299
Throw bean bag into box -1
One-board balance-preferred leg -.75
One-board balance-other leg -.85
Hopping in squares-preferred leg - .5
Hopping in squares-other leg - .55
Ball balance - 1.2
Age band 4:
One-hand catch-preferred hand -1.2
One-hand catch-other hand -.8
Throw at wall target -1
Two-board balance -1
Jump and clap -1.5
Walking backwards- .6
Principal
components
factor
analysis
Age band 3:
Eigen values greater than 1= 5 factors; explaining
77.38% of the variance.
Factor 1= 23.2% of variance, included “hopping in
squares-preferred leg” and “hopping in squares-non
preferred leg”. Labelled as "Dynamic Balance".

300
Factor 2= 17.3% of variance, included “two-hand
catch” and “throw bean bag into box”. Labelled "Ball
Skills".
Factor 3= 16.0% of variance, included “shifting pegs
by rows-preferred hand” and “shifting pegs by rows-
non preferred hand”. Labelled "Manual Dexterity 1".
Factor 4 = 10.5% of variance, included “One-board
balance- preferred leg” and “one-board balance- non-
preferred leg”. Labelled "Static Balance".
Factor 5= 10.19% of variance, included “threading
nuts on bolt” and “ball balance”. Labelled "Manual
Dexterity 2".
Age band 4:
Eigen values greater than 1= 4 factors; explaining
72.1% of variance.
Factor 1= 27.3% of variance, included “one-hand
catch-preferred hand”, “one-hand catch-non preferred

301
hand” and “throw at wall target”. Labelled “ball
skills”.
Factor 2= 19.7% of variance, included “turning pegs-
preferred hand” and “turning pegs-non preferred
hand”. Labelled "Motor Speed on Hand Dexterity".
Factor 3= 12.8% of variance, included “cutting-out
elephant” and “flower trail”. Labelled "Motor
Accuracy on Hand Dexterity".
Factor 4= 12.2% of variance, included “two-board
balance” and “walking backwards”. Labelled
"Balance".
Estevan et
al. (2017)
TGMD-3 178 typically
developed
children with
an age range
between 3 and
11 years
(Mean age
Internal
consistency
ICC
ICC= 0.89 (95% CI, 0.87-0.92) 57%
Inter-rater
reliability
ICC
ICC= 0.90 (95% CI, 0.66-0.98)

302
6.94 years
(SD = 1.89))
Girls = 47.5%
Boys = 52.5%
Intra-rater
reliability
ICC
ICC= 0.98 (95% CI, 0.85-1.00)
Structural
validity
Maximum
likelihood
model
comparing
fit with
two-factor
model
χ2 (64) = 139.200, p < 0.01, RMSEA = 0.073, SRMR
= 0.050, NNFI = 0.964, CFI = 0.970,
Evaggeli
nou,
Tsigilis
& Papa
(2002)
TGMD
644 children
(310 girls;
334 boys)
Age ranged
from 3 to10
years
Participants
were
divided into
two
subsamples:
The
calibration
sample: (n =
324) -
150 males
(M age =
7.47 years,
Structural
validity
Hypothesis
testing
validity
Confirmator
y factor
analysis
Locomotor: mean factor loading = .50
Gallop: .51
Hop: .63
Jump: .59
Leap: .56
Run: .27
Skip: .47
Slide: .48
Object control: mean factor loading = .57
Bounce: .80
Catch: .61
61%

303
SD = 1.59)
and 174
females (M
age = 7.72
years, SD =
1.69)
The
validation
sample: (n =
320) - 160
males (M
age = 7.68
years, SD =
1.60) and
160
females (M
age = 7.68
years, SD =
1.51)
Kick: .45
Strike: .41
Throw: .61
Ferreira et
al (2020)
BOT-2 931 (477 girls
and 454 boys)
603 children
enrolled in
public schools
and 328
children
enrolled in
private
schools
Cross-
Cultural
Validity
Percentile
curves
Brazilian children showed better results in bilateral
coordination, balance, upper-limb coordination, and
running speed and agility subtests (difference range
0.03 - 6.90 points).
Upper limb coordination and balance subtests curves
were similar.
46%

304
All aged
between 6-10
years old
Field et al
(2020)
TGMD-2
and
TGMD-3
Final sample:
n = 270 (54%
female; mean
age in grade 3
= 8 years 6
months)
11 children
were reported
as having a
disability or
chronic health
condition (by
their parents)
Reliability /
Measurement
Error
(Inter-Rater
Reliability)
Percent
Agreement
Inter-rater reliability between the primary investigator
and a second trained research assistant:
TGMD-2 (.88)
TGMD-3 (.87)
30%
Reliability /
Measurement
Error
(Intra-Rater
Reliability)
Percent
Agreement
Intra-rater reliability:
TGMD-2 (.98)
TGMD-3 (.95)
Criterion
Validity
(Concurrent
Validity)
Paired
samples t-
tests
Significant difference (p < .05) between the tests
(TGMD-2 and TGMD-3) in grade 3
Significant difference (p < .05) between tests in grade
4

305
Significant difference (p < .05) between tests in grade
5
Fransen et
al., (2014)
BOT-2
Short
Form;
KTK
2485 children
(1300 boys
and 1185
girls) aged
between 6 and
12 years
Concurrent
Validity
Hypothesis
testing
validity
Pearson
correlations
Total BOT-2 Short Form score & KTK motor
quotient (r = 0.61, p < 0.001)
BOT- 2 Short Form gross motor composite score &
KTK motor quotient (r = 0.44, p < 0.001)
BOT-2 Short Form fine motor composite score and
KTK Motor Quotient (r = 0.25, p < 0.001)
47%

306
Furtado
and
Gallagher
(2012)
FG-
COMPAS
S
131 children
from 6-11
years
Volunteers
from private
schools in
Western
Pennsylvania
Inter-rater
reliability
Overall
agreement
(Ao)
Locomotor:
Hopping: Ao= 87%
Horizontal jumping Ao= 74%
Leaping Ao=66%
Skipping Ao= 82%
Side sliding Ao= 66%
Manipulative:
Batting Ao=82%
Catching Ao: 77%
Kicking Ao= 61%
Overhand throwing Ao=76%
Side-arm striking Ao=84%
Stationary dribbling Ao= 76%
43%
Weighted
kappa (Kw)
Locomotor:
Hopping: KW= .85
Horizontal jumping: KW= .70
Leaping: KW= .61
Skipping: KW= .77
Side sliding: KW= .61
Manipulative:

307
Batting: KW= .79
Catching: KW= .72
Kicking: KW= .51
Overhand throwing: KW= .74
Side-arm striking: KW= .79
Stationary dribbling: KW= .72
Specific
agreement
(Ps)
Locomotor:
Hopping: P (I) = .93, P(E) = .79, P(A) = .88
Horizontal jumping: P(I) = .65, P(E) = .63, P(A)= .97
Leaping: P(I) = .70, P(E)= .43, P(A)=.80
Skipping: P(I)= .93, P(E)= .77, P(A)= .74
Side sliding: P(I)= .77, P(E) = .40, P(A)= .73
Manipulative:
Batting: P(I)= .82, P(E)= .75, P(A)=.90
Catching: P(I)= .71, P(E)= .72, P(A)= .88
Kicking: P(I)= 28, P(E) = .56, P(A)= .91
Overhand throwing: P(I)= .74, P(E)= .50, P(A)= .97
Side-arm striking: P(I)= .86, P(E)= .83, P(A)=.83
Stationary dribbling: P(I)= .78, P(E)= .65, P(A)= .84

308
Garn and
Webster
(2017)
TGMD-2
1,120 children
between the
ages of 3 and
10 years (M
age = 7.04,
SD = 2.23
years)
49.7% =male
50.3%
=female
Racial/ethnic
backgrounds:
60.89%
White/
Caucasian,
17.59%
Black/
African-
American,
14.29%
Hispanic,
3.30% Asian,
Structural
validity
CFA
1 factor model:
χ2 = 416.03 (54), p=.001, CFI=.95, RMSEA=.06
2 factor model:
χ2 = 250.24 (53), p=.001, CFI=.97, RMSEA=.05,
r=.89
79%
Hypothesis
Testing
Validity
Exploratory
SEM
2 Factor:
χ2 = 164.63 (43), p=.001, CFI=.98, RMSEA=.04,
r=.81

309
2.77% Mixed
racial/Other,
and 1.16%
Native
American.
Approximatel
y 7% of the
participants
had a
disability
Hoeber et
al. (2018)
Athletic
Skills
Tract
(AST) and
KTK
717 (344 girls
and 373 boys)
children in
study 1
Mean age
(SD) = 9 (2)
years
213 (104 girls
and 109 boys)
other children
in study 2
Test- retest
reliability for
AST
Intraclass
correlation
coefficient
AST-1: 0.881 (95% CI: 0.780–0.934)
AST-2: 0.802 (95% CI: 0.717–0.858)
AST-3: 0.800 (95% CI: 0.669– 0.871)
55%
Limits of
agreement
(LoA)
AST-1: (mean = 0.79, [LoA] −3.02 and 4.60)
AST-2: (mean = 1.47, [LoA] −6.12 and 9.06)

310
Mean age
(SD) = 9 (2)
years
AST-3: (mean = 1.68, [LoA] −5.14 and 8.50)
Internal
consistency
of AST
Cronbach’s
α
AST-1: α = 0.764
AST-2: α = 0.700
AST-3: α = 0.763
Criterion
Validity
(Concurrent)
with KTK
Pearson’s
correlation
coefficients
quotients of
the KTK)
AST-1: r = −0.747, p = 0.01
AST-2: r = −0.646, p = 0.01
AST-3: r = −0.602, p = 0.01

311
Hoeboer et
al. (2016)
Athletic
Skills
Track 1
and 2
(AST-
1&2)
KTK
463 children
(211 girls,
252 boys)
aged between
6 and 12
years
Mean age = 9
± 2 years
Criterion
Validity
(Concurrent)
Pearson
correlation
AST-1 and KTK
(r = –0.474, P < 0.01)
AST-2 and KTK
(r = –0.502, P < 0.01)
Gender split AST-1 and KTK:
girls: r = –0.501, P < 0.01; boys: r = –0.533, P < 0.01
Gender split AST-2 and KTK
girls: r = –0.448, P < 0.01; boys: r = –0.566, P < 0.01
45%
Test-retest
reliability
Intraclass
correlation
Between the first and second AST-1 trial = 0.875
(95% CI [0.852–0.895])
Between the first and second AST-2 trial = 0.891
(95% CI [0.870–0.908])

312
Paired
sample t
test
AST-1 trials 1 and 2
t = 6.026, P < 0.05
AST-2 trials 1 and 2
t = 8.226, P < 0.05
Holm,
Tveter,
Aulie &
Stuge
(2013)
MABC-2 45 healthy
children s (7–
9 years of
age)
Females = 23
Males = 22
Mean age
(SD) = 8.7
(0.7) yrs
43 (95.5%)
children had
no movement
problems and
2 (4.5%)
Intra-tester
reliability
Intraclass
correlation
(with 95%
Cl and
SEM)
Aiming and catching:
Catching with two hands, no. of catches = 0.48
[0.15,0.72], SEM = 1.5
Throwing bean bag on to mat = 0.59 [0.29,0.79],
SEM = 1.0
Balance:
One-board balance, right leg = 0.56 [0.26,0.77], SEM
= 4.0
One-board balance, left leg = 0.70 [0.45,0.85], SEM =
5.3
43%

313
children were
classified as
having
impaired
motor
problems
30 children
were included
in the inter-
tester part
of the study,
29 children in
the intra-
tester part, 14
took part in
both studies
Walking heel-to-toe forwards = 0.75 [0.53,0.87],
SEM = 0.9
Hopping on mats, right leg = NA
Hopping on mats, left leg = 0.24 [-0.15,0.56], SEM =
0.6
Domains (component score):
Aiming and catching = 0.49 [0.17,0.72], SEM = 2.4
Balance = 0.49 [0.15,0.72], SEM = 2.7
Total score:
Total test score = 0.68 [0.28,0.85], SEM = 4.9
Total standard score = 0.64 [0.23,0.84], SEM = 1.4
Inter-rater
reliability
Intraclass
correlation
Aiming and catching:
Catching with two hands = 0.66 [0.40,0.82], SEM =
1.3

314
(with 95%
Cl and
SEM)
Throwing bean bag on to mat = 0.62 [0.33,0.80],
SEM = 1.1
Balance:
One-board balance, right leg = 0.39 [0.05,0.65], SEM
= 5.8
One-board balance, left leg = 0.50 [0.19,0.73], SEM =
7.3
Walking heel-to-toe forwards = 0.42 [0.06,0.67],
SEM = 1.6
Hopping on mats, right leg = NA
Hopping on mats, left leg = NA
Domains (component score):
Manual dexterity = 0.63 [0.35,0.80], 3.2
Aiming and catching = 0.77 [0.56,0.89], SEM = 2.0
Balance = 0.29 [-0.07,0.58], SEM = 4.5
Total score:
Total test score = 0.62 [0.35,0.80], SEM = 6.8
Total standard score = 0.63 [0.36,0.80], SEM = 1.6

315
Houwen et
al (2010)
TGMD-2
and
MABC
75 children
with VI
(aged
between 6 and
12 years, 29
girls; 46 boys)
Of these 75
children, 8
children
attended
special-needs
schools and
67 children
attended
mainstream
primary
schools.
71 children
were
Caucasian
while 4 were
Internal
consistency
Cronbach’s
Alpha
Locomotor= 0.71
Item deleted= 0.61-0.68
Item-total correlations= 0.36-0.54
Inter-item correlations= 0.11 to 0.45
Object control= 0.72
Item deleted= 0.63-0.71
Item-total correlations= 0.30-0.54
Inter-item correlations= 0.14 to 0.51
64%
Inter-rater
reliability
TGMD
ICCs (95%
CIs)
Locomotor= 0.82 (0.70-0.90)
Object control=0.93 (0.88-0.96)

316
of Asian
descent.
Total test=0.89 (0.81-0.93)
Intra-rater
reliability
TGMD
ICC
Locomotor= 0.85 (0.69-0.93)
Object control = 0.93 (0.84-0.97)
Total test= 0.95 (0.88-0.98)
Test-retest
reliability
TGMD
ICC
Locomotor= 0.86 (0.70-0.94)
Object control= 0.87 (0.72-0.94)
Total test= 0.92 (0.82-0.91)
Structural
validity
Factor
analysis
Fit Indices: Chi-square (Df = 53) = 79.55, p = 0.01,
Df ratio = 1.50, RMSEA = 0.07, GFI = 0.85.
Locomotor factor loadings
Run=.50 (p < .05)
Gallop=.44 (p < .05.)

317
Hop=.49 (p < .05.)
Leap=.61 (p < .05.)
Jump=.51 (p < .05.)
Slide=.76 (p < .05.)
Object control skills factor loadings
Strike= .32 (p < .05.)
Dribble= .73 (p < .05.)
Catch= .57 (p < .05.)
Kick= .62 (p < .05.)
Throw= .68 (p < .05.)
Roll= .61(p < .05.)
Correlation between LOC and OC= 0.81
Criterion
Validity
(Concurrent)
TGMD and
MABC
Spearman
Rho
TGMD-2 object control subtest and the Movement
ABC ball skills subtest
Age band 2= rs = 0.57, p = 0.001
Age band 3= rs = 0.45, p = 0.040
Hua, Gu,
Meng &
Wu (2013)
MABC-2
and
PDMS-2
1823 children
in total
Internal
consistency
MABC
Cronbach's
alpha
Catching beanbag = .428
67%

318
(Females =
908
and Males =
915)
Aged 36–72
months old
(mean =
61.284
months, SD =
10.212
months)
Throwing beanbag onto mat = .427
One leg balance = .445
Walking heels raised = .517
Jumping on mats = .489
Pearson
correlation
coefficients
(Item-total
correlation)
Catching beanbag = .587
Throwing beanbag onto mat = .603
One leg balance = .525
Walking heels raised = .228
Jumping on mats = .405
Inter-rater
reliability
Intraclass
correlation
(with 95%
Cl)
Catching beanbag (number of correct catches out of
10) = .993 (.992, .994)

319
Throwing beanbag onto mat (Number of correct
catches out of 10) = .979 (.977, .981)
One-leg balance with preferred leg (number of
seconds balanced) = .997 (.997, .998)
One-leg balance with non-preferred leg (number of
seconds balanced) = .998 (.997, .998)
Walking heels raised (number of correct steps) = .895
(.886, .904)
Jumping on mats (number of correct jumps/hops out
of 5) = .993 (.993, .994)
Test-retest
reliability
Intraclass
correlation
(with 95%
Cl)
Catching beanbag (number of correct catches out of
10) = .934 (.912, .950)
Throwing beanbag onto mat (Number of correct
catches out of 10) = .905 (.874, .928)

320
One-leg balance with preferred leg (number of
seconds balanced) = .970 (.959, .977)
One-leg balance with non-preferred leg (number of
seconds balanced) = .985 (.979, .988)
Walking heels raised (number of correct steps) = .832
(.781, .871)
Jumping on mats (number of correct jumps/hops out
of 5) = .936 (.916, .952)
Content
validity
Item-level
content
validity
index
Catching beanbag (number of correct catches out of
10) = 1.0
Throwing beanbag onto mat (Number of correct
catches out of 10) = 1.0
One-leg balance (number of seconds balanced) = 1.0
Walking heels raised (number of correct steps) = .96

321
Jumping on mats (number of correct jumps/hops out
of 5) = .96
The average = .985
Structural
validity
Confirmator
y Factor
Analysis
Original 8 item model (Henderson, 2007)
x2 = 80.149, df = 17, x2/df = 4.715, p < 0.001, GFI =
0.976, AGFI = 0.950, IFI = 0.850, CFA = 0.846,
RMSEA = 0.067
7 item model (heels raised removed)
x2 = 35.828, df = 11, x2/df = 3.257, p < 0.001, GFI =
0.988, AGFI = 0.969, IFI = 0.935, CFA = 0.933,
RMSEA = 0.043
6 item model (drawing trail removed)
x2 = 11.749, df = 6, x2/df = 1.958, p = 0.068, GFI =
0.995, AGFI = 0.984, IFI = 0.984, CFA = 0.984,
RMSEA = 0.034).
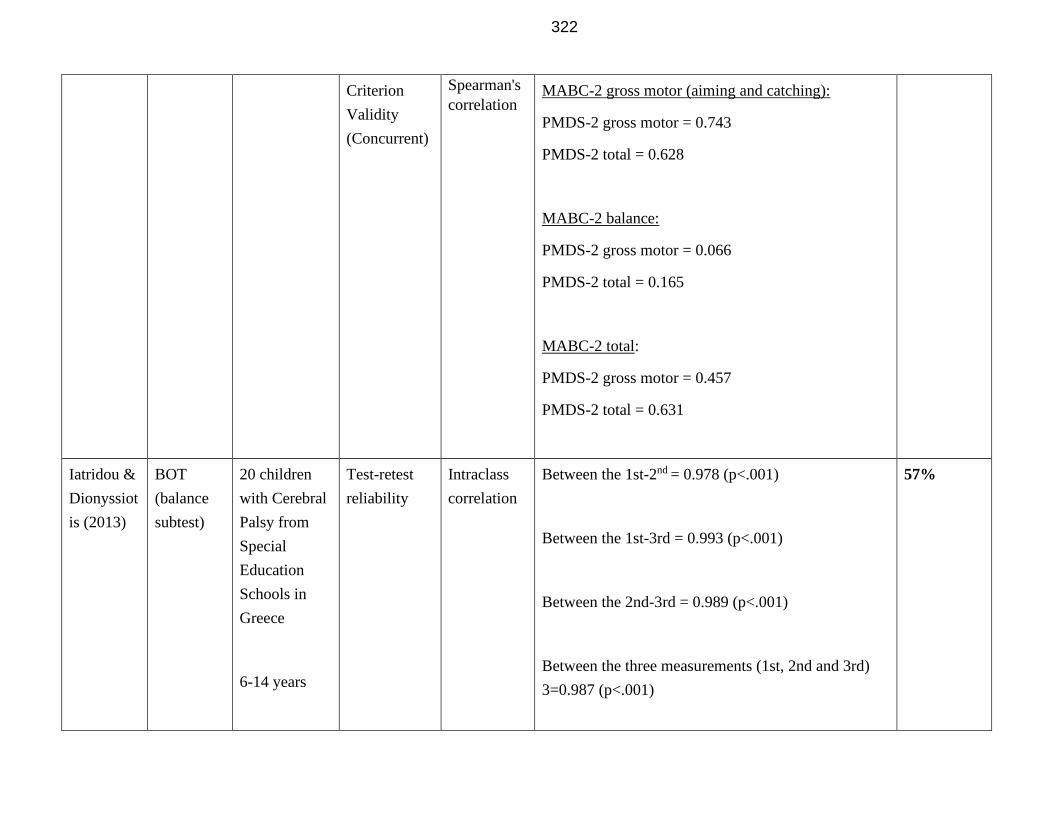
322
Criterion
Validity
(Concurrent)
Spearman's
correlation
MABC-2 gross motor (aiming and catching):
PMDS-2 gross motor = 0.743
PMDS-2 total = 0.628
MABC-2 balance:
PMDS-2 gross motor = 0.066
PMDS-2 total = 0.165
MABC-2 total:
PMDS-2 gross motor = 0.457
PMDS-2 total = 0.631
Iatridou &
Dionyssiot
is (2013)
BOT
(balance
subtest)
20 children
with Cerebral
Palsy from
Special
Education
Schools in
Greece
6-14 years
Test-retest
reliability
Intraclass
correlation
Between the 1st-2nd = 0.978 (p<.001)
Between the 1st-3rd = 0.993 (p<.001)
Between the 2nd-3rd = 0.989 (p<.001)
Between the three measurements (1st, 2nd and 3rd)
3=0.987 (p<.001)
57%

323
Females = 8
Males = 12
Diagnosis of
hemiplegia, or
diplegia with
the capacity
of self-
support
walking
8 children has
diplegia
Issartel,
McGrane,
Fletcher,
O’Brien,
Powell,
Belton et
al. (2017)
TGMD-2 In total 844
participants
(males = 456,
females =
388)
Aged 12.03
Test-retest
reliability
Pearson
product
moment
correlation
Locomotor = 0.78
Object related = 0.76
Gross motor skills = 0.91
47%

324
years ± 0.49
(median =
12.89)
Structural
Validity
Confirmator
y Factor
Analysis
Full model two correlated factors
χ2= 175.26 (53), p<.001, CFI=.59, RMSEA = .05
Full one factor model:
χ2= 187.24 (54), p<.001, CFI=.7, RMSEA = .05
Reduced model one factor
χ2= 111.29 (35), p<.001, CFI=.68, RMSEA = .05
Reduced model two correlated factors
χ2= 87.11 (34), p<.001, CFI=.77, RMSEA = .04

325
Jaikaew &
Satiansukp
ong
(2019)
MABC-2,
Thai
version
30 children
were recruited
for the inter-
rater
reliability
study
5 children
were recruited
for testing
MABC-2
All aged 7
years and 0
months to 10
years and 11
months with
Reliability /
Measurement
Error
(Inter-rater
reliability)
Intraclass
Correlation
Coefficient
(ICC with
95% CI)
Aiming and Catching:
Catching with Two Hands 0.99 (0.98-0.99)
Throwing a Beanbag onto a Mat 0.94 (0.88-0.97)
Balance:
One-Balance Board (other leg) 1.00 (0.99-1.00)
Walking Heel-to-Toe Forwards 0.99 (0.99-0.99)
Hopping on Mats (best leg) NA
Hopping on Mats (other leg) 0.96 (0.92-0.98)
29%

326
no “physical
limitations”
Content
validity
Item
objective
congruence
(IOC) index
Manual Dexterity with:
Language clarity (.73)
Language pertinence (.83)
Aiming and Catching with:
Language clarity (.88)
Language pertinence (.95)
Balance with:
Language clarity (.89)
Language pertinence (.94)
Jirovec,
Musalek &
Mess
(2019)
BOT-2
(CF) and
BOT-2
(SF)
153 children
aged 8 to 11
(M = 9.53 ±
0.85 years),
(boys n = 84,
girls n = 69)
Criterion
Validity
(Concurrent
Validity)
short form
and complete
form
Pearson’s
product
moment
correlations
Manual coordination: 0.24*
Body coordination: 0.42**
Strength and agility: 0.08
54%

327
Receiver
Operating
Characterist
ic (ROC)
analysis of
BOT-2 SF
BOT-2 SF:
High sensitivity (84%)
Poor specificity (42.9%)
Accuracy (76.5%)
Poor value of Empirical Area Under Curve Analysis
(AUC) = 0.484 CI95% (0.31–0.62)
ROC analyses conducted for boys and girls separately
for BOT-2 SF:
High sensitivity (boys = 82.6%, girls = 85.7%)
Low specificity (boys = 53%, girls = 30.7%)
Kim, Kim,
Valentini
& Clark
(2014)
TGMD-2 141 children
aged from 3
to 10 years
old
Mean age
(SD) = 6.8
(1.9) years
Internal
consistency
Cronbach’s
alpha
coefficient
Between the two subtests = .87
Locomotor subset = .82
Object control subset = .73
57%
Inter-rater
reliability
Pearson’s
correlation
Summed score:
Testers A x B = .94**
Testers A x C = .87**

328
Tetsers B x C = .86*
Score from locomotor subtest:
Testers A x B = .89**
Testers A x C = .81**
Testers B x C = .83**
Score from object control subtest:
Testers A x B = .92**
Testers A x C = .87**
Testers B x C = .86**
Testers A x B x C = .92**
Intraclass
correlation
Summed score:
Testers A x B = .97***
Testers A x C = .93***
Testers B x C = .92***
Testers A x B x C = .96***
Score from locomotor subtest:

329
Testers A x B = .94***
Testers A x C = .90***
Testers B x C = .91***
Testers A x B x C = .94***
Score from object control subtest:
Testers A x B = .85**
Testers A x C = .80*
Testers B x C = .77*
Test-retest
reliability
Pearson’s
correlation
Between the raw scores of the locomotor subset = .90,
p < .0001
Between the raw scores of the object control subtest =
.85, p < .0001
Structural
validity
Confirmator
y factor
analysis
2 factor model:
x2(54) = 86.59, p = .003 CFI =0.94, TLI =0.93, NFI
=0.87, GFI = 0.91, and IFI = 0.95

330
Kim, Park
& Kang.
(2012)
TGMD-2 22 children in
total with
intellectual
disabilities
(aged
between 8.6
to 11.2 yrs,
Mean age 9.9
(± 1.3) years)
16 = boys
6 = girls
Inter-rater
reliability
ICC Locomotor skills:
Kicking= 0.85 (0.65, 0.50)
Striking a stationary ball= 0.91 (0.78, 0.75)
Underhand roll= 0.94 (0.83, 0.79)
Overhand throw= 0.93 (.81, 0.78)
Stationary bouncing= 0.89 (0.72, 0.70)
Catch= 0.88 (0.72, 0.53)
Subtotal score= 0.90 (.75, 0.71)
Object control skills:
Hop= 0.93 (0.82, 0.79)
Horizontal jump= 0.92 (0.80, 0.70)
Slide= 0.94 (.84, 0.81)
Run=0.89 (0.73, 0.72)
Gallop= 0.95 (0.86, 0.85)
Leap= 0.91 (0.78, 0.68)
Subtotal score= 0.93 (0.80, 0.78)
Total score= 0.91 (0.78, 0.75)
54%

331
Kita,
Suzuki,
Hirata,
Sakihara,
Inagaki &
Nakai
(2016)
MABC-2 132 children
in total
(Females = 48
and Males =
84)
Aged from
7.0 to 10.8
years (mean =
8.8 and
standard
deviation
(SD) = 1.2)
58, 29, and 45
children were
recruited from
urban,
middle-urban,
and rural
areas
respectively
Internal
consistency
Item-total
correlation
Catching with Two Hands = 0.536
Throwing Beanbag onto Mat = 0.504
One-Board Balance = 0.573
Walking Heel-to-Toe Forwards = 0.534
Hopping on Mats = 0.480
81%
Cronbach’s
alpha
Catching with Two Hands = 0.557
Throwing Beanbag onto Mat = 0.581
One-Board Balance = 0.531
Walking Heel-to-Toe Forwards = 0.546
Hopping on Mats = 0.537

332
Structural
validity
Confirmator
y factor
analysis
χ2 (17) = 12.685, p=.757; v2/df=0.746; GFI=.977;
AGFI = .951; CFI = .999; RMSEA = .000
Lander,
Morgan,
Salmon,
Logan &
Barnett
(2017)
CAMSA
&
Victorian
FMS
34 children in
total (all
female)
Mean age (±
SD) = 12.6
years (± 0.04)
Demographic
s:
Test-retest
reliability
Intraclass
correlation
(with 95%
Cl)
CAMSA: total score = 0.91 (Cl = 0.83,0.95)
CAMSA: time score = 0.80 (Cl = 0.63,0.89)
CAMSA: skill score = 0.85 (Cl =0.73,0.92)
Victorian FMS = 0.79 (Cl = 0.62,0.89)
49%
Bland–
Altman
CAMSA - mean −1.29, [LoA] −5.62 and 3.04

333
17 =
Australian
9 = Asian
8 = European
Victorian FMS Assessment - mean −0.38, [LoA]
−6.82 and 6.06
Bivariate
correlation
CAMSA - r = 0.02, p = 0.89
Victorian FMS Assessment instrument - r = −0.12, p
= 0.49
Criterion
Validity
(Concurrent)
Spearman’s
Rho
Between the finishing position of students in the
CAMSA using their total CAMSA score and
Victorian FMS Assessment in Test 1:
rs = 0.68, p = <0.05
When isolating the skill score of the CAMSA, with
the total skill score of the Victorian FMS Assessment:
rs = 0.60, p = <0.05
Lane &
Brown
(2015)
BOT-2
and
MABC-2
50 typically
developing
children aged
7–16 years.
The sample
was divided
Criterion
validity
(concurrent)
Spearman’s
rho
MABC Age Band 2 – Balance:
BOT bilateral coordination = -.1
BOT Balance = .11
BOT Running speed & agility = .14
BOT strength = .37
77%

334
into two age
bands:
AB2 (7–10
years): 25
children (14
females and
11 males).
Mean age of 8
years 11
months
(SD = 1 year,
1 month)
AB3 (11–16
years): 25
children (11
females and
14 males).
Mean age of
13 years
4 months (SD
= 1 year 8
months).
BOT body coordination =.13
BOT strength and agility = .32
MABC Age Band 2 – Aiming and catching
BOT bilateral coordination = -.08
BOT Balance = .35
BOT Running speed & agility = .14
BOT strength = -.1
BOT body coordination = .17
BOT strength and agility = .17
MABC Age Band 3– Balance:
BOT bilateral coordination = .15
BOT Balance = .31
BOT Running speed & agility = .45
BOT strength = .51
BOT body coordination =.29
BOT strength and agility = .45
MABC Age Band 3 – Aiming and catching

335
.
BOT bilateral coordination = .26
BOT Balance = .01
BOT Running speed & agility = .25
BOT strength = .44
BOT body coordination = .03
BOT strength and agility = .44
Laukkanen
et al
(2020)
KTK Pooled data
from four
independent
studies in:
Finland (1)
Mean age
6.64 ± 0.36
years, range
1.8 years, n =
278
Finland (2):
Internal
consistency
Cronbach's
alphas
Cronbach's alphas of the KTK test items:
Finland (combined) 0.828
Belgium 0.804
Portugal 0.777
51%

336
Mean age
8.60 ± 0.85
years, range
3.3 years, n =
412
Belgium:
Mean age
8.25 ± 1.09,
range 4 years,
n = 1896
Portugal:
Mean age
8.31 ± 1.02,
range 3.9
years, n = 758
Item‐total
correlations
The corrected item‐total correlations for the norm‐
based values of test items: Finland
Walking backwards .571
Hopping for height .710
Jumping sideways .695
Moving sideways .655
The corrected item‐total correlations for the norm‐
based values of test items: Belgium
Walking backwards .549
Hopping for height .656
Jumping sideways .687
Moving sideways .588

337
The corrected item‐total correlations for the norm‐
based values of test items: Portugal
Walking backwards .648
Hopping for height .578
Jumping sideways .680
Moving sideways .616
Liao, Mao
& Hwang
(2001)
BOT
20 TD
children
mean = 10.6
years, SD=
2.3 years
6 males, 14
females
Test-retest
reliability
%
agreement
One-leg standing on floor – 100
On balance beam – 80
on balance beam, eyes closed – 40
Walking forward on walking line – 100
On balance beam - 70
heel-to-toe on walking line - 50
35%

338
heel-to-toe on balance beam – 50
Stepping over stick on balance beam - 50
Logan,
Barnett,
Goodway
& Stodden
(2017)
TGMD-2
and
GSGA
170 children
in total aged
between 4 and
11 years old.
(Females = 86
Males = 84)
Participants
were Hispanic
(n = 94),
Caucasian
(n = 70),
African
American (n
= 5) and
Native
American (n
= 1).
Criterion
Validity
(Concurrent)
Spearman's
rho
(* and **
indicate
significance
at the .05
and .01
levels,
respectively
)
Jump:
TGMD-2:
4-5 years old = .46**
7-8 years old = .26*
10-11 years old = .47**
GSGA:
4-5 years old = .53**
7-8 years old = 0.17
10-11 years old = .41**
Hop:
TGMD-2:
4-5 years old = .65**
7-8 years old = .41**
10-11 years old = 0.25
55%

339
Participants
were split into
the following
age groups:
4–5 year olds:
(n = 55, boys
= 23, girls =
32). Mean age
(SD) = 5
(0.54) years
7–8 year olds:
(n = 61, boys
= 33, girls =
28). Mean age
(SD) = 8.1
(0.62) years
10–11 year
olds: (n = 54,
boys = 28,
girls = 26).
Mean age
GSGA:
4-5 years old = .88*
7-8 years old = .48**
10-11 years old = .47**
Throw:
TGMD-2:
4-5 years old = .30*
7-8 years old = .47**
10-11 years old = .62**
GSGA:
4-5 years old = .29*
7-8 years old = .45**
10-11 years old = .71**
Cochran’s
Q tests
Assessments differed in classifying:
standing long jump Q(2) = 14.1, P < .01

340
(SD) = 10.7
(0.42) years
Hopping Q(2) = 67.2, P < .001
Throwing Q(2) = 100.2, P < .001)
Logan,
Robinson,
Rudisill,
Wadswort
h& Morera
(2014)
TGMD-2
and
GSGA
65 children in
total (Females
= 33 and
Males = 32)
Kindergarten:
(n = 20, 10
boys, 10 girls,
mean age =
5.7 + 0.38
years)
First grade: (n
= 22, 13 boys,
9 girls, mean
age = 6.7 +
0.34 years)
Second grade:
(n = 23, 9
males, 14
females, mean
Criterion
Validity
(Concurrent)
Spearman
correlations
4-5 yrs
Jump = .5
Hop = .68
Throw = .59
7-8 yrs
Jump = .48
Hop = .51
Throw = .66
10-11 yrs
Jump = .17
Hop = .47
Throw = .7
55%

341
age = 7.8 +
0.46 years)
Demographic
s: 72.3% =
African-
American,
20% =
Hispanic,
7.7% =
Caucasian
Longmuir
et al
(2017)
CAMSA 1165 children
Females =
598
males = 567
8-12 years
Test-retest
reliability
ICC Completion time across short (n = 59; ICC = 0.84;
95%CI: 0.74 to 0.91) and long (n = 16; ICC = 0.82;
95%CI: 0.53 to 0.93) test intervals
77%
Inter-rater
reliability
ICC Skill score:
All trials = 0.69 (Cl = 0.61, 0.76)
Trial 1 = 0.70 (Cl = 0.61, 0.79)
Trial 2 = 0.66 (Cl = 0.55, 0.77)

342
Completion time:
All trials = 0.997 (Cl = 0.995, 0.998)
Trial 1 = 0.997 (Cl = 0.994, 0.998)
Trial 2 = 0.993 (Cl = 0.990, 0.995)
Intra-rater
reliability
ICC Skill Score:
All examiners = 0.52 (Cl = 0.43, 0.60)
Examiner 1 = 0.45 (Cl = 0.20, 0.64)
Examiner 2 = 0.55 (Cl = 0.33, 0.72)
Examiner 3 = 0.43 (Cl = 0.19, 0.63)
Examiner 4 = 0.52 (Cl = 0.28, 0.69)

343
Examiner 5 = 0.49 (Cl = 0.26, 0.67)
Examiner 6 = 0.57 (Cl = 0.35, 0.73)
Examiner 7 = 0.53 (Cl = 0.30, 0.70)
Completion time
All examiners = 0.996 (Cl = 0.995, 0.997)
Examiner 1 = 0.999 (Cl = 0.999, 1.000)
Examiner 2 = 0.998 (Cl = 0.998, 0.999)
Examiner 3 = 0.991 (Cl = 0.986, 0.994)
Examiner 4 = 0.996 (Cl = 0.994, 0.997)
Lopes,
Saraiva, &
TGMD-2 330 children
in total
(Females =
Test–retest
Reliability
Bland-
Altman
analysis
95% limits of agreement ranged from 0.80 to 1.13,
agreement ratio = 0.96 (0.09).
62%

344
Rodrigues
(2018)
164 and
Males = 166)
Aged between
5–10 years of
age (Mean
age with SD =
7.9 ± 1.3)
Locomotor - 95% limits of agreement ranged between
0.85 and 1.17, agreement ratio= 1 (0.08).
Object Control- 95% limits of agreement ranged
between 0.63 and 1.16, agreement ratio = 0.80 (0.13).
Inter-rater
reliability
Kappa Ranged .7 - 1
Internal
consistency
Cronbach's
alpha
Whole test = .69
Locomotor = .46
Object control = .64
Structural
validity
CFA 2
factor
model
CFI = .956, NFI = .868, NNFI = .937, SRMR = .048,
RMSEA = .036 (90% CI: .010–.054)
All loading coefficients were significant (p < .05),
with factor loadings ranging from .31 to .76.

345
Hypothesis
testing
validity
High correlation (r = .77; p < .05) between the two
factors
Lucas et
al. (2013)
BOT-2 30
participants
Females = 12
Males = 18
Aboriginal
and Torres
Straight
Island
Background
Mothers in
the sample
drank alcohol
during
pregnancy
Inter-rater
reliability
Intraclass
correlation
Bilateral co-ordination:
Jumping in place (same sides synchronized) = .34
Tapping feet and fingers (same sides synchronized) =
N/A
Balance:
Walking forward on a line = N/A
Standing on one leg on a balance beam (eyes open) =
.54
Running speed and agility:
One legged stationary hop = .49
Upper-limb co-ordination:
Dropping and catching a ball (both hands) = 1.00
Dribbling a ball (alternating hands) = .85
83%

346
BOT-2 score sheet outcomes:
Total point score (Raw) = .92
Standard score (standardized for gender and age) =
.89
Percentile rank (%) = .88
Test-retest
reliability
Intraclass
correlation
Bilateral co-ordination:
Jumping in place (same sides synchronized) = -0.066
Tapping feet and fingers (same sides synchronized) =
-0.032
Balance:
Walking forward on a line = N/A
Standing on one leg on a balance beam (eyes open) =
.17
Running speed and agility:
One legged stationary hop = .25
Upper-limb co-ordination:
Dropping and catching a ball (both hands) = -0.041

347
Dribbling a ball (alternating hands) = .023
BOT-2 score sheet outcomes:
Total point score (Raw) = .62
Standard score (standardized for gender and age) =
.73
Percentile rank (%) = .71
Maeng et
al. (2017)
TGMD-3 10 typically
developing
children (6
boys and 4
girls)
Age ranged
from 3 years,
7 months to
10 years, 9
months old
(Mean age =
6.57, SD =
2.51 years)
Inter-rater
reliability
ICCs (95%
CIs)
Locomotor skills:
Run= 0.66 (0.39 to 0.88)
Gallop= 0.66 (0.39 to 0.88)
Hop= 0.92 (0.82 to 0.98)
Skip= 0.90 (0.78 to 0.97)
Horizontal jump= 0.81 (0.61 to 0.94)
Slide= 0.67 (0.41 to 0.88)
Subscale score= 0.92 (0.82 to 0.98)
Ball skills:
Two-handed strike= 0.81 (0.61 to 0.94)
One-handed strike= 0.86 (0.70 to 0.96)
61%

348
Demographic
s:
70% = White
30% =
African
American
One-handed dribble= 0.92 (0.81 to 0.98)
Two-handed catch= 0.67 (0.41 to 0.88)
Kick= 0.51 (0.22 to 0.80)
Overhand throw= 0.78 (0.57 to 0.93)
Underhand throw= 0.79 (0.59 to 0.93)
Subscale score= 0.93 (0.84 to 0.98)
Total score= 0.96 (0.91 to 0.99)
Intra-rater
reliability
ICC (95%
Cis)
Locomotor skills:
Run= 0.91 (0.84 to 0.95)
Gallop= 0.86 (0.76 to 0.92)
Hop= 0.93 (0.88 to 0.96)
Skip= 0.95 (0.91 to 0.97)
Horizontal jump= 0.90 (0.83 to 0.94)
Slide= 0.84 (0.73 to 0.90)
Subscale score= 0.98 (0.96 to 0.99)
Ball skills:
Two-handed strike= 0.86 (0.77 to 0.92)
One-handed strike= 0.92 (0.87 to 0.96)

349
One-handed dribble= 0.95 (0.92 to 0.97)
Two-handed catch= 0.87 (0.79 to 0.93)
Kick= 0.77 (0.63 to 0.87)
Overhand throw= 0.93 (0.87 to 0.96)
Underhand throw= 0.87 (0.78 to 0.93)
Subscale score= 0.96 (0.94 to 0.98)
Total score= 0.98 (0.96 to 0.99)
Magistro
et al.
(2020)
TGMD-3 5210 children
age range of
3-11; mean
age years =
8.38, SD =
1.97; %
females = 48.
.
Test-retest
reliability
Intraclass
Correlations
6 years old group (n = 50):
Locomotor = (ICC = .993; CI [.987, .996]),
Ball skills scales = (ICC = .992; CI [.986, .995]),
TGMD-3 total= ICC = .991; CI [.983, .995]),
7 years old group (n = 50):
Locomotor = ICC = .983; CI [.971, .990]),
Ball skills scales = (ICC = .989; CI [.981, .984]),
TGMD-3 total= ICC = .979; CI [.964, .988]),
8 years old group (n = 50):
Locomotor = ICC = .985; CI [.974, .992]),
Ball skills scales = (ICC = .993; CI [.987, .996]),
TGMD-3 total= ICC = .981; CI [.967, .989]),
9 years old group (n = 50):
Locomotor = ICC = .991; CI [.985, .995]),
64%

350
Ball skills scales = (ICC = .995; CI [.991, .997]),
TGMD-3 total= ICC = .989; CI [.980, .993]),
10 years old group (n = 50):
Locomotor = ICC = .990; CI [.983, .994]),
Ball skills scales = (ICC = .996; CI [.993, .998]),
TGMD-3 total= ICC = .993; CI [.987, .996]),
11 years old group (n = 50):
Locomotor = ICC = .982; CI [.968, .990]),
Ball skills scales = (ICC = .994; CI [.989, .996]),
TGMD-3 total= ICC = .984; CI [.972, .991])
Inter-rater
reliability
Intraclass
correlation
coefficients
TGMD-3 total scores = 0.973; 95% CI: Lower Bound
= 0.969 and Upper Bound = 0.977).
Structural
validity
Exploratory
and
confirmator
y factor
analysis
CFA with ML estimation method
χ2= 916.284, df = 64, p < 0.001, RMSEA = 0.050
(90% Confidence Intervals: 0.048, 0.053), CFI =
0.955.
Factor loadings were all significant at p < 0.001 and
ranged between 0.583–0.671.
Locomotor Skills
Run: EFAβ= .323 / CFAβ= .671
Gallop: EFAβ= .363 / CFA β= .615
Hop: EFA β= .405 / CFA β= .675

351
Skip: EFA β= .426 / CFA β= .584
Horizontal jump: EFA β= .426 / CFAβ= .622
Slide: EFA β= .454 / CFA β= .585
Ball skills
Forehand strike of self-bounced ball: EFA β= .387 /
CFA β= .565
One-hand stationary dribble: EFA β= .433 / CFA β=
.656
Two-hand catch: EFAβ= .374 / CFA β= .604
Kick a stationary ball: EFA β= .244 / CFA β= .629
Overhand throw: EFA β= .421 / CFA β= .603
Underhand throw: EFA β= .353 / CFA β= .589
Two-hand strike of a stationary ball: EFA β= .376 /
CFA β= .597
Mancini,
Rudaizky,
Howlett,
Elizabeth-
Price &
Chen
(2019)
BOT-2 86 children
with ADHD.
78 males and
6 females
aged 6-14
years (M = 9
years, 11
months; SD =
1 year, 9
months).
Criterion
Validity
(Concurrent)
(Long- and
short-form
BOT-2)
Pearson's
bivariate
correlation
Correlation with domain score
Jumping in place-same sides synchronised = .561*
Tapping feet and fingers-same sides synchronised =
.587*
Walking forward on a line = .173
Standing on one leg on a balance beam - eyes open =
.122
One-legged stationary hop = .676*
Dropping and catching a ball - both hands = .333*
53%

352
Dribbling a ball - alternating hands = .323*
*p<.001.
Moreira,
Lopes,
Miranda-
Junior,
Valentini,
Lage &
Albuquerq
ue (2019)
KTK 565
volunteers
from 5 to 10
years of age
(age mean =
7.93 ±1.51.
49.9% were
boys (n= 282)
and 50.1%
were girls (n=
283), all
whom are
enrolled in
Brazilian
public and
private
schools (from
1stto 5thgrade
of elementary
school).
Structural
Validity
Confirmator
y factorial
analysis
(CFA)
χ2 = 5.086, p = 0.079, CFI = 0.995, TLI = 0.986,
RMSEA = 0.052, SRMR = 0.015).
CFA for male group
(χ2 = 2.733, p = 0.255, CFI = 0.998, TLI = 0.993,
RMSEA =0.036, SRMR = 0.016)
CFA for female group
(χ2 = 3.255, p= 0.196, CFI = 0.997, TLI = 0.990,
RMSEA = 0.047, SRMR = 0.016).
CFA for 5 to 7 years old group
(χ2 = 0.340, p= 0.844, CFI = 1.000, TLI = 1.020,
RMSEA = 0.000, SRMR = 0.006)
CFA for 8 to 10 years old group
(χ2 = 5.881, p= 0.053, CFI = 0.981, TLI = 0.943,
RMSEA = 0.076, SRMR = 0.027).
59%

353
Nicola,
Waugh,
Charles &
Russell
(2018)
MABC-2 Final sample:
n=59, aged 5–
11 years
(Females n =
28 and Males
n = 31)
The ABs were
as follows: 3–
6 years
(n=19), 7–10
years
(n=31); and
11–16 years
(n=9)
Criterion
Validity
(Concurrent)
MABC-2 in
person and
via
telerehabiliat
ion
technology
Hypothesis
testing
validity
Mean
absolute
difference
(SD)
Aiming & Catching = 0.27 (2.07)
Balance = 0.15 (2.59)
Total Test Score = 0.03 (1.63)
40%
Percentage
Agreement % Exact; % within 1 point; % within 2 points; %
within 3 points
Aiming & Catching = 26.67; 51.67; 71.67; 90
Balance = 31.67; 51.67; 71.67; 81.67
Total Test Score = 31.67; 66.67; 81.67; 100
Bland-
Altman Upper & Lower limits
Aiming & Catching = 3.80, −4.33
Balance = 5.23, −4.93
Total Test Score = 3.22, −3.15

354
Paired
samples T-
test
(95% Cl)
Aiming & Catching: TR vs in-person
= 0.27 (SD = 2.09), (Cl = -0.82, 0.27), P = 0.32
Balance: TR vs in-person
= 0.15 (DS = 2.61), (Cl= -0.53, 0.83), P = 0.66
Total test score: TR vs in-person
= 0.03 (SD = 1.64), (Cl= -0.39, 0.46), P = 0.87
Niemeijer,
Van
Waelvelde
& Smits-
Engelsman
(2015)
MABC-2 1172 children
within each
age band:
AB1 = 431
children
AB2 = 333
AB3 = 408
(No further
information)
Cross-
cultural
validity
between
Dutch and
UK children
Independent
t-tests
Aiming and Catching 1:
Age band 1 – t= -0.22, p=.82
Age band 2 – t=4.40, p <.001
Age band 3 – t= 5.20, p<.001
Aiming and Catching 1 (other hand)
Age band 3 – t= 5.30 p<.001
Aiming and Catching 2
Age band 1 – t= -0.85 p=.40
Age band 2 – t= 0.94 p= .35
Age band 3 – t= -0.25, p= .81
61%

355
Balance 1
Age band 1 – t= 1.38 p=.17
Age band 2 – t=3.70, p <.001
Age band 3 – t=6.12, p<.001
Balance 1 (other leg)
Age band 1 – t= 0.74, p= .46
Age band 2 – t= 4.65, p<.001
Balance 2
Age band 1 – t= -3.06, p= .002
Age band 2 – t= -0.07 p=.95
Age band 3 – t=6.33, p<.001
Balance 3
Age band 1 – t=3.26, p=.001
Age band 2 – t=3.05 p=.002
Age band 3 – t= 1.61, p=.11

356
Balance 3 (other leg)
Age band 2 – t= 4.22, p<.001
Age band 3 – t=3.19, p=.002
Aiming and Catching Total
Age band 1 – t= -0.72 p=.47
Age band 2- t=3.49, p <.001
Age band 3 – t= 4.64, p<.001
Balance Total
Age band 1 – t=0.68, p=.50
Age band 2 – t=4.88, p<.001
Age band 3 – t=7.55, p<.001
Total test score
Age band 1 – t= -0.91 p=.36
Age band 2 – t= 5.37, p <.001
Age band 3- t=7.04, p <.001

357
Novak et
al (2016)
KTK 2479 children
aged between
6-11 years
Females =
1179 and
Males = 1300
Criterion
Validity
(Concurrent)
(KTK 3 and
KTK 4)
Pearson
correlation
6 years:
Boys: n = 135, r = 0.96**
Girls: n = 166, r = 0.97**
Total sample: n = 301, r = 0.96**
7 years:
Boys: n = 228, r = 0.97**
Girls: n = 195, r = 0.97**
Total sample: n = 423, r = 0.97**
8 years:
Boys: n = 250, r = 0.98**
Girls: n = 236, r = 0.97**
Total sample: n = 486, r = 0.97**
9 years:
Boys: n = 276, r = 0.97**
Girls: n = 280, r = 0.98**
Total sample: n = 556, r = 0.98**
56%

358
10 years:
Boys: n = 214, r = 0.97**
Girls: n = 148, r = 0.97**
Total sample: n = 362, r = 0.97**
11 years:
Boys: n = 197, r = 0.98**
Girls n = 154, r = 0.98**
Total sample: n = 351, r = 0.98**
Total:
Boys: n = 1300, r = 0.97**
Girls: n = 1179, r = 0.97**
Total sample: n = 2479, r = 0.97**
Chi-
Squared,
Cohens
Kappa
Chi2=6822.53, p<0.001; Kappa = 0.72

359
Okuda,
Pangelinan
, Capellini
& Moreira
(2019)
MABC-2
and BOT-
2
BOT-2: 187
elementary
school
students
(grades 1 to
6) (mean age:
113 +- 20
months; boys:
n = 117,
62.56%).
SLD (n = 20;
10.7%)
MABC-2 :
127
elementary
school
students
(grade 1)
(mean age: 76
=- 2 months;
boys: n= 58,
45.67%).
Structural
validity
Confirmator
y factor
analysis and
bifactor
analysis
(CFA)
BOT-2
CFA with four dimensions were: χ2(14) = 20.937, p =
0.1135; CFI = 0.988; TLI = 0.976; RMSEA = 0.050
(90% confidence interval [90%CI] = 0.000 to 0.093).
Considering the bifactor model for BOT- 2: χ2(17) =
38.545, p = 0.0021; CFI = 0.962; TLI = 0.938;
RMSEA = 0.082 (90%CI = 0.048 to 0.117).
MABC-2
CFA with three dimensions were: χ2(32) = 46.569, p
= 0.0463; CFI = 0.92; TLI = 0.89; RMSEA = 0.06
(90%CI = 0.008 to 0.095)
Considering the bifactorial model for MABC-2:
χ2(26) = 25.560, p = 0.4875; CFI = 1.000; TLI =
1.004; RMSEA = 0.000 (90%CI = 0.000 to 0.069).
65%
Psotta &
Abdollahi
pour
MABC-2 Two samples
of children:
Structural
Validity
Confirmator
y Factor
analysis
Age band 2
χ2(30)=40.612, p= 094,CMIN/df = 1.354, RMSEA
=0.027, GFI = 0.980, AGFI= 0.964,TLI= 0.972
69%

360
(2017) 7- 10-year-
olds
(n = 484, 248
boys and 236
girls)
11-16-year-
olds (n = 674,
328 boys and
346 girls)
Hypothesis
testing
validity
Additional factor loading of Bal 3o MD (-0.27,
p<.0001) and MD 3 on AC (-0.28, p=.009)
Age band 3
χ2= 42.081, p=070, CMIN/df= 1.403, RMSEA=
0.024, GFI= 0.984, AGFI= 0.970, and TLI= 0.958.
Re, Logan,
Cattuzzo,
Henrique,
Tudela, &
Stodden,
(2018)
TGMD-2
and KTK
424 healthy
children (47%
girls and 53%
boys) aged
between 5 and
10 years old
Demographic
s:
White (62%),
Black (13%)
Criterion
Validity
(Concurrent)
Pearson
Correlation
5–6 years old: r = 0.52, r2 = 0.27
7–8 years old: r = 0.50, r2 = 0.25
9–10 years old: r = 0.34, r2 = 0.12
69%
Paired
sample t-
test on
percentile
ranks
5–6 years: t= −3.029(157), p= .003
7–8 years: t= −11.134 (203) p <.001

361
“Mixed”
(25%)
The sample
was grouped
as follows:
5–6 years (n =
158, 76 girls;
M age = 5.78,
SD = 0.46
years),
7–8 (n = 204,
98 girls; M
age = 8.03,
SD = 0.54
years),
9–10 (n = 62,
27 girls; M
age = 9.56,
SD = 0.35
years)
9–10 years: t= −7.243 (61) p<.001
All: t= −11.711 (423), p <.001
Rintala,
Saakslahti
TGMD-3 60 Finnish
children (aged
Intra-rater
reliability
Kappa
statistic
Rater A 54%

362
& Livonen
(2017)
3-9 years old)
divided into
three separate
samples of
20:
Intra-rater
reliability
study:
Rater A:
Boys n = 10,
(ages 6 to 9
years (M =
7.8 ± 1.2)),
and Girls n =
10, (ages 5 to
9 years (M =
7.4
± 1.2))
Rater B:
Boys n = 8,
(ages 4 to 7
Percentage
agreement
calculation
Intraclass
correlation
coefficient
(with upper
and lower
boundary)
Run: κ=0.58
Gallop: κ= 0.8
Hop: κ =0.51
Skip: κ =0.75
Horizontal jump: κ = 0.61
Slide: κ =0.58
Two hand strike on a stationary ball: κ =0.84
One hand force and strike on self-bounced ball: κ
=0.70
One hand stationary dribble: κ =0.67
Two hand catch: κ = 0.90
Kick a ball stationary: κ = 0.62
Overhand throw: κ =0.84
Underhand throw: κ =0.85
Locomotor skills: κ =0.69
Ball skills: κ =0.77
Total skills: κ =0.75
Rater B
Run: κ =0.42

363
years (M =
6.6 ± 1.4)),
and Girls n =
12, (ages 3 to
7 years (M =
6.1 ± 1.6))
Additional
inter-rater
reliability
sample:
Boys n = 10,
(ages 4 to 6
years (M =
5.9 ± 0.7))
and Girls n =
10, (ages 5 to
6 years (M =
6.2 ± 0.5))
Gallop: κ =0.77
Hop: κ =0.62
Skip: κ =0.86
Horizontal jump: κ =0.68
Slide: κ = 0.61
Two hand strike on a stationary ball: κ =0.47
One hand force and strike on self-bounced ball: κ
=0.73
One hand stationary dribble: κ =0.72
Two hand catch: κ =0.81
Kick a ball stationary: κ= 0.76
Overhand throw: κ =0.68
Underhand throw: κ =0.84K
Locomotor skills: κ =0.73
Ball skills: κ =0.73
Total skills: κ =0.73
Inter-rater
reliability
Kappa, ICC Run: κ =0.63 ICC= 0.63
Gallop: κ =0.62, ICC=0.61
Hop: κ =0.19 ICC=0.13
Skip: κ =0.87 ICC=0.87

364
Horizontal jump: κ =0.38 ICC=0.37
Slide: κ =0.45 ICC=0.45
Two hand strike on a stationary ball: κ =0.32K,
ICC=0.32
One hand force and strike on self-bounced ball: κ
=0.64 ICC=0.64
One hand stationary dribble: κ =0.81 ICC=0.81
Two hand catch: κ =0.84 ICC=0.84
Kick a ball stationary: κ =0.52 ICC=0.50
Overhand throw: κ =0.65 ICC=0.65
Underhand throw: κ =0.63 ICC=0.62
Locomotor skills: κ =0.57 ICC=0.56
Ball skills: κ =0.64 ICC=0.64
Total skills: κ =0.62 ICC=0.62

365
Rosblad &
Gard
(1998)
MABC 60 children
(Females = 28
and Males =
32).
Ages ranging
from 73 to 83
months (mean
= 66 months)
None of the
children had
any known
disabilities.
Cross
Cultural
Validity
(Sweden and
America)
T-test
Ball skills:
Catching bean bag (no. out of 10) P = 0.857
Rolling ball into goal (no. out of 10) P = 0.002
Static and dynamic balance:
One-leg balance, preferred leg(s) P = 0.225
One-leg balance, non-preferred leg (s) P = 0.017
One-leg balance, right leg (s) P = 0.102
One-leg balance, left leg (s) P = 0.040
Jumping over cord (no. of trials to pass) P = 0.052
Walking heels raised (no. of steps) P = 0.861
39%
Rudd et al
(2016)
TGMD-2
and KTK
In total 158
children aged
6-12 years
old. (M age =
9.5 SD 2.2)
Structural
validity
KTK
Hypothesis
testing
validity
Confirmator
y Factor
Analysis
Adequate model fit:
χ2 (2df) = 1.49, P = .47, χ2/df = 0.75, CFI = 1.00,
SRMR = .01, RMSEA = .01, P CLOSE = .60
43%

366
Females = 72
Males = 86
Structural
validity for
the TGMD
Hypothesis
testing
validity
Confirmator
y Factor
Analysis
Locomotor:
χ2 (9df) = 9.21; P = .42; χ2/df = 1.02; CFI = .99;
SRMR = .05; RMSEA = .01;
PCLOSE = .69
Object control:
χ2 (9) = 27.54; χ2/df = 1.34; P = .001; CFI = .80;
SRMR = .07; RMSEA = .11; PCLOSE = .02
This original model was inadequate, so it was revised:
χ2 (8) = 10.13, P = .26; χ2/df = 1.26; CFI = .98;
SRMR = .04; RMSEA = .04;
PCLOSE = .52
FMS hierarchical model:
χ2(52) = 71.07; P = .04; χ2/df = 1.36; CFI = .86;
SRMR= .07; RMSEA = .05; PCLOSE = .52
The effect of object control on overall fundamental
movement skill = .67

367
The effect of locomotor on overall fundamental
movement skill = .39
Inter-rater
reliability
Bland-
Altmann
Locomotor - 95% limit -0.7 to 0.7
Object control skills 95% limit -0.6 to 0.6.
95% confidence within one 1SD (1.96) and contains
zero
Ruiz et al
(2003)
MABC Spanish
study:
Total n = 385
(Females =
183
Males = 202)
Japanese
study:
Total n = 102
Females = 49
Cross
Cultural
Validity
MANOVA
Age band 2
F= 25.07(16), p=.000
Age band 3
F= 35.73(16), p=.000
25%

368
Males = 53
American
Study:
Total n = 521
Females =
284
Males = 237
Schulz et
al (2011)
MABC 2
Test
1172 children
, aged 3–16
years.
(Females =
606
Males = 566)
AB1 n = 431
AB2 n = 333
AB3 n = 408
Structural
validity
Confirmator
y factor
analysis
Age band 1:
3 correlated factors was rejected x2 (df = 32) =
410.65, p < 0.001 RMSEA = 0.17, NNFI = 0.76,
AGFI = 0.70, SRMR = 0.19
3 factor plus general factor: x2(df = 24) = 33.44, p <
0.095, RMSEA = 0.03, NNFI = 0.99, AGFI = 0.96,
SRMR = 0.023
Age band 2:
3 correlated factors was rejected x2 (df = 32) = 124.6,
p < 0.001, RMSEA = 0.094, NNFI = 0.83, AGFI =
0.85, SRMR = 0.089
62%

369
Double loadings for balance: x2 (df = 27) = 37.70, p =
0.08; RMSEA = 0.035, NNFI = 0.98, AGFI = 0.95,
SRMR = 0.038
Age band 3
3 correlated factors was rejected x2 (df = 32) = 71.05,
p < 0.001 RMSEA = 0.055, NNFI = 0.93, AGFI =
0.93, and SRMR = 0.056
Double loadings: x2 (df = 28) = 38.41, p = 0.09,
RMSEA = 0.030, NNFI = 0.98, AGFI = 0.96, and
SRMR = 0.036
Simons et
al (2008)
TGMD-2 In total 99
children aged
7-10 years
with cognitive
delay.
Mean age = 8
years, 10
months (SD =
1 year, 9
months)
Structural
validity
Hypothesis
testing
validity
Confirmator
y factor
analysis
chi-square = 83.772, DF = 53, p = 0.004, GFI =.88,
AFGI = .82.
61%
Internal
consistency
Cronbach’s
alpha
Locomotor α = .82
Object control α = .86

370
Females = 32
Mean age = 8
years, 8
months (SD =
10 months)
Males = 67
Mean age = 9
years, 8
months (SD =
1 year, 2
months)
Gross Motor Quotient α = .90
Test-retest Spearman
correlation
Locomotor = .90
Object Control = .92
GMQ = .98
Inter-rater
reliability
Pearson
correlation
Locomotor = 1.00; p < .05
Object Control = 1.00; p < .05
GMQ = 1.00; p < .05
Smits-
Engelsman
, Fiers, &
Henderson
(2008)
MABC
(Dutch
translation
)
In total 9
children with
movement
difficulties
(Females = 3,
Inter-rater
reliability
Kappa
Average = .99
50%

371
Males = 6)
Ages ranged
from 4 to 12
years of age
Spironello,
Hay,
Missiuna,
Faught, &
Cairney
(2010)
BOT
(short
form) and
MABC
2278 children
aged from 9
to 10 years
old
From the total
sample, the
study sample
assessed on
BOT-SF and
M-ABC:
n = 340
Criterion
Validity
(Concurrent)
Pearson
correlation
r = .50, P < 0.01
93%
KAPPA
(relative
Improveme
nt Over
Chance)
5th percentile:
κ = .19
RIOC = 29.41%
15th percentile:
κ = .29
RIOC = 46.8%
Stearns,
Wohlers,
McHugh,
Kuzik, &
Spence
(2019)
PLAYbasi
c and
CAMSA
In total 102
children
October 2014:
N = 54
Inter rater
reliability
(for
PLAYbasic
and
PLAYfun)
Intraclass
correlation
PLAYbasic
October 2014:
Average measures =.84**, 95%CI = .73, 9.1
Single Measures = .72**, 95%CI= .57, .83
43%

372
Mean age
(SD) = 11.10
(1.36)
Age Range =
8.98 to 13.85
Female = 28
(52%)
Male = 26
(48%)
March 2015:
N = 48
Mean age
(SD) = 11.48
(1.31)
Age Range =
9.27 to 14.12
Female = 21
(44%)
Male = 27
(56%)
March 2015:
Average measures =.88**, 95%CI = .79, 9.4
Single Measures = .79**, 95%CI= .65, .88
PLAYfun
October 2014
Average measures = .88***, 95%CI = .79,93
Single measures = .78***, 95%CI = .65,86
March 2015
Average measures = .90***, 95%CI = .82, .94
Single measures = .82***, 95%CI = .70, .89
Internal
consistency
(for
PLAYbasic
and
PLAYfun)
Cronbach's
alpha
PLAYbasic
October 2014:
Mean between raters = .61
Rater 1 = alpha .62
Rater 2 = alpha .65
March 2015:
Mean between raters = .6

373
Rater 1 = .61
Rater 2 = .56
PLAYfun
October 2014:
Mean between raters = .87
Rater 1 = alpha .87
Rater 2 = alpha .86
March 2015:
Mean between raters = .87
Rater 1 = alpha .87
Rater 2 = alpha .83
Criterion
Validity
(Concurrent)
Hypothesis
testing
validity
Pearson
correlation
Between PLAYbasic and CAMSA
October 2014:
Mean = .48**
Rater 1 = .47**
Rater 2 = .41**

374
March 2015:
Mean = .51**
Rater 1 = .40**
Rater 2 = .61**
Between PLAYfun and CAMSA
October 2014:
Mean = .51**
Rater 1 = .47**
Rater 2 = .50**
March 2015:
Mean = .58**
Rater 1 = .51**
Rater 2 = .60**
Tan,
Parker &
BOT-SF
and
MABC
In total 69
children
Criterion
Validity
(Concurrent)
Spearman
rank
r = .79 57%

375
Larkin
(2001)
(Females =
25,
Males = 44)
between the
ages 4 years,
8 months to
10 years, 8
months (M =
81.8 months,
SD = 19.4
months)
Utesch et
al (2016)
MOT 4-6 1467 children
(aged
between 3-6
years)
Girls = 672
(45.8%)
Boys = 795
(54.2%)
Structural
validity
Rasch
partial
credit
model
First-step analysis (all items of MOT 4-6) =
CR =.032, pCR = .43; P- χ² = -.356, pP- χ² = .55
Follow-up model (global model fit with ordered
threshold
Parameters) = (CR = .1.964, pCR = .06; P- χ² = -.227,
pP- χ² = .24, RA = .79) – five items removed
79%
Mixed
Rasch
model
CR = 23, pCR = .28; P- χ² = -.53, pP- χ² = .7,
RA_class 1 = .63; RA_class 2 = .45

376
Valentini
(2012)
TGMD-2
In total 2,674
children
(Females =
1322, Males
= 1352 boys)
Ages ranged
from 3 to 10
years old
(M age = 7.56
years, SD =
1.91 years)
Content
validity
Content
validity
index
Clarity CVI = .93
Pertinence CVI = .91
61%
Exploratory
factor
analysis
RMSEA = .06, 90% CL [.06, .07]
CFI (.88), NFI (.09), TLI (.83), GFI (.98), and AGFI
(.95)
Test-retest
reliability
Pearson
correlation Overall test: r = .9, p = .001
Locomotor subtest: r = .83, p = .0001
Object control subtest: r = .91, p = .0001
Run: r = .8, p = .001
Gallop: r = .51, p = .001
Hop: r = .57, p = .001
Leap: r = .54, p = .001
Horizontal jump: r = .76, p = .001
Slide: r = .71, p = .001
Striking stationary ball: r = .66, p = .001
Stationary dribble: r = .9, p = .001
Catch: r = .64, p = .001
Kick: r = .9, p = .001

377
Overhand throw: r = .72, p = .001
Underhand throw: r = .92, p = .001
T-test
Overall test: t=.9, p=.37
Locomotor subtest: t=.23, p=.82
Object control subtest: t=1.61, p=.11
Run: t=1.68, p=.09
Gallop: t=.73 p=.46
Hop: t=.98, p=.33
Leap: t=.33, p=.74
Horizontal jump: t=1.49, p=.14
Slide: t=1.65, p=1
Striking stationary ball: t=.5, p=.61
Stationary dribble: t=1.78, p=.08
Catch: t=.42, p=.68
Kick: t=2, p=.06
Overhand throw: t=.28, p=.78
Underhand throw: t=1.55, p=.12

378
Criterion
Validity
(Concurrent)
Pearson
correlation
Percentiles for the total sample:
r = .27, p < .001
The correlation explained 7.29% of the variance
Percentiles for each age group:
Age 4: r = .42, p = .05
Age 5: r = .56, p = .002
The associations explained 17.6% and 31.4% of the
variance, respectively.
Ages 6 to 10: r = .14–.30, p > .05
Children scored significantly higher on the MABC
(M percentile=23.57; SD=24.57) compared
with the TGMD-2 (M percentile = 7.50; SD = 10.23).
T-test
Total sample: t(161) = −8.52, p < .001
All age groups (p< .007)
Intra rater
reliability
Cronbach’s
alpha
alpha = .92–.99

379
Inter rater
reliability
Intraclass
correlation
Locomotor subtest = .88
Object control subtest = .89
Locomotor skills = .86–.94
Object control skills = .87–.92
Valentini,
Ramalho,
& Oliveira
(2014)
MABC-2
(Portugues
e
translation
)
In total 844
children
(Females =
404
Males = 440)
Aged between
3 and 13
years of age
(M = 8.31,
SD = 2.91)
Demographic
s: 59.6% =
White 40.4%
= Non-white
Content
Validity
Content
validity
index (%)
Clarity:
Experts 1,2&3 = 71.8
Experts 1&2 = 93.9
Experts 1&3 = 78.9
Experts 2&3 = 74.3
Pertinence:
Experts 1,2&3 = 99.2
Experts 1&2 = 99
Experts 1&3 = 99.3
Experts 2&3 = 98.5
50%
Kappa Clarity:
Experts 1&2 (IC 95%) = .88 (.76-.99), p<.001

380
Experts 1&3 (IC 95%) = .80 (.65-.95), p=.001
Experts 2&3 (IC 95%) = .76 (.59-.93), p=.001
Pertinence:
Experts 1&2 (IC 95%) = .92 (.83-.90), p<.001
Experts 1&3 (IC 95%) = .83 (.69-.98), p=.001
Experts 2&3 (IC 95%) = .87 (.59-.93), p<.001
Inter-rater
reliability
Intraclass
correlation
Manual dexterity:
Raters A&B = .99
Raters A&C = .99
Raters B&C = .99
Raters A,B&C = .99
Ball skills:
Raters A&B = .92
Raters A&C = .86
Raters B&C = .87
Raters A,B&C = .91

381
Balance:
Raters A&B = .99
Raters A&C = .93
Raters B&C = .88
Raters A,B&C = .95
MABC-2 score:
Raters A&B = .99
Raters A&C = .96
Raters B&C = .97
Raters A,B&C = .98
Intra-rater
Reliability
Intraclass
correlation
Manual dexterity: Rater Ax2 = .81
Ball skills: Rater Ax2 = .71
Balance: Rater Ax2 = .72

382
MABC-2 score: Rater Ax2 = .88
Structural
Validity
Cronbach’s
alpha
Overall of the 3 subscales = .78
Manual Dexterity = .77
Ball skills = .52
Balance = .77
Criterion
validity
(predictive)
ANOVA Significant differences among children identified with
DCD, at risk for DCD and TD children (F (2,841) =
722.07, p < .0001, h2 = .63).
Scores of TD children were significantly higher (p-
values < .0001)
Scores of children classified as at risk were
significantly higher compared to the children with
DCD (p-values < .0001).

383
ICC ICC = .88; p < .007
Criterion
Validity
(Concurrent)
Pearson’s
correlation
TGMD-2 and MABC-2 standards scores =.30, p < .02
In each classification group:
DCD = .54, p = .08
At risk for DCD = .26, p = .20
TD =.05, p = .40
Dependent
t-tests
Children in general group: t (42) = 1.36, p < .18
Children within each classification group (p values
range from .16 to .31)
Valentini,
Zanella, &
Webster
(2017)
TGMD-3
(Brazilian
translation
)
In total 597
children aged
3 to 10
Females =
302
Content
validity
Content
validity
index (%)
Clarity:
Experts 1,2&3 =78
Experts 1&2 = 97
Experts 1&3 = 77
Experts 2&3 = 75
60%

384
(age: M =
6.58, SD =
2.06)
Males = 295
(age: M =
6.76, SD =
2.11)
Pertinence:
Experts 1,2&3 = 99
Experts 1&2 = 100
Experts 1&3 = 99
Experts 2&3 = 98
KAPPA
concordanc
e coefficient
Clarity:
Experts 1&2 (IC 95%) = .91 (.88-1), p<.001
Experts 1&3 (IC 95%) = .79 (.62-.96), p=.001
Experts 2&3 (IC 95%) = .77 (.60-.94), p=.001
Pertinence:
Experts 1&2 (IC 95%) = .97 (.88-1), p<.001
Experts 1&3 (IC 95%) = .86 (.72-.99), p=.001
Experts 2&3 (IC 95%) = .86 (.72-.99), p<.001
Inter-rater
reliability
Intraclass
correlation
TGMD-3 Total = .98
Locomotion = .95
Run = .85

385
Gallop = .91
Hop = .86
Skip = .99
Jump = .89
Slide = .93
Ball Skills = .97
Strike 1 hand = .96
Strike 2 hands = .94
Dribble = .97
Catch = .96
Kick = .86
Overhand throw = .96
Underhand throw = .97
Intra rater
reliability
Intraclass
correlation
TGMD-3 Total = .90
Locomotion = .90
Run = .61
Gallop = .71

386
Hop = .86
Skip = .81
Jump = .73
Slide = .78
Ball Skills = .85
Strike 1 hand = .73
Strike 2 hands = .68
Dribble = .90
Catch = .90
Kick = .69
Overhand throw = .60
Underhand throw = .72
Test-retest
reliability
Pearson
correlation
TGMD-3 Total = .90
Locomotion = .93
Run = .60
Gallop = .71

387
Hop = .82
Skip = .74
Jump = .67
Slide = .74
Ball Skills = .81
Strike 1 hand = .73
Strike 2 hands = .72
Dribble = .73
Catch = .86
Kick = .73
Overhand throw = .71
Underhand throw = .77
Internal
consistency
Cronbach’s
alpha
TGMD-3-BR (α) = .74
Locomotion skills (α) = .63
Ball skills (α) = .76
Skill-to-test and -subtests by sex:

388
Boys (α) = .76, α values .72 to .76
Girls (α) = .74, α values .71 to .74
Subtests independently:
Boys:
Locomotion skills = .62, α values .59 to .62
Ball skills = .76, α values .72 to .76
Girls:
Locomotion skills = .64, α values .61 to .64
Ball skills = .71, α values .68 to .71
Performance-criteria-to-test and –subtest:
TGMD-3 = .93
Locomotion skills = .90
Ball skills = .88
Performance-criteria-to-test and -subtests by sex:
TGMD-3-BR for boys = .93, α values .90 to .92
TGMD-3-BR for girls = .92, α values .92 to .92

389
Subtest independently
Boys:
Locomotion skills = .89, α values .87 to .89
Ball skills = .87, α values .85 to .87
Girls:
Locomotion skills = .91, α values .89 to .91
Ball skills = .85, α values .83 to .85
Structural
validity
Confirmator
y factor
analysis
Factor loading:
Locomotion:
Run = .46
Gallop = .41
Hop = .56
Skip = .44
Leap = no value
Horizontal jump = .5
Slide = .6
Ball Skills:
Strike 1 hand = .42
Strike 2 hands = .63

390
Dribble = .72
Catch = .58
Kick = .58
Overhand throw = .51
Underhand throw = .55
Run- SE=.03, skills-subtest correlation =.5**
Gallop SE=.069, skills-subtest correlation =.62**
Hop- SE=.053, skills-subtest correlation =.66**
Skip- SE=.056, skills-subtest correlation =.62**
Leap – no values
Horizontal jump - SE=.045, skills-subtest correlation
=.55**
Slide – SE- NO VALUE, skills-subtest correlation
=.73*
Strike 1 hand - SE=.128, skills-subtest correlation
=.6**
Strike 2 hand- SE=.129, skills-subtest correlation
=.7**
Dribble - SE=.198, skills-subtest correlation =.76**

391
Catch- SE=.103, skills-subtest correlation =.62**
Kick- SE=.108, skills-subtest correlation =.64**
Overhead throw - SE=NO VALUE, skills-subtest
correlation =.63**
Underhand throw - SE=.105, skills-subtest correlation
=.6**
Valentini,
Rudisill,
Bandeira,
& Hastie
(2018)
TGMD-2 In total 2,463
children aged
between 3 and
10 year olds
(M = 8.10,
SD = 1.32)
Females=
1344
Males= 1119
Structural
validity
CFA Run h(communalities=.52), LOC=.54
Gallop h(communalities=.72), LOC=.83
Hop h(communalities=.57), LOC=.69
Strike h(communalities=.57), OC=.75
Kick h(communalities=.58), OC=.76
Throw h(communalities=.57), OC=.73
Two factors explained 59.33% of the variance
(locomotor factor: 19.56%; object control factor:
39.76%).
RMSEA (0.06, 90% confidence interval [0.06, 0.07];
CFI: 0.94; NFI: 0.94; TLI: 0.83; GFI: 0.98; and
AGFI: 0.95
61%

392
Internal
consistency
Cronbach’s
alpha Locomotion = .60
Run =.46
Gallop = .54
Hop =.37
Object control = .66
Strike = .54
Kick = .59
Throw = .55
General test = 0.70
Bivariate
correlation
(between
activity and
subtest)
Run = .64, p=<.001
Gallop = .59, p<.001
Hop = .7, p=<.001
Strike = .68, p<.001
Kick = .68, p<.001
Throw = .74, p<.001

393
Intraclass
correlation
Locomotion = .67
Object control = .68
SF of TGMD = .71
Inter-rater
reliability
Intraclass
correlation
Locomotion:
A&B = .94, A&C = .91, B&C = .92, A&B&C = .94
Run:
A&B = .87, A&C = .81, B&C = .82, A&B&C = .87
Gallop:
A&B = .94, A&C = .89, B&C = .83, A&B&C = .90
Hop:
A&B = .92, A&C = .93, B&C = .92, A&B&C = .93
Object Control:
A&B = .96, A&C = .93, B&C = .94, A&B&C = .96

394
Strike:
A&B = .89, A&C = .83, B&C = .84, A&B&C = .89
Kick:
A&B = .96, A&C = .90, B&C = .85, A&B&C = .92
Throw:
A&B = .96, A&C = .95, B&C = .94, A&B&C = .95
Intra rater
reliability
Intraclass
correlation
Locomotion:
A = .95, B = .96, C = .94
Run:
A = .94, B = .97, C = .95
Gallop:
A = .96, B = .97, C = .93
Hop:
A = .96, B = .95, C = .95

395
Object Control:
A = .97, B = .98, C = .96
Strike:
A = .97, B = .99, C = .95
Kick:
A = .96, B = .97, C = .96
Throw:
A = .95, B = .96, C = .94
Test-retest
reliability
Correlation
analysis
(not
specified)
Locomotor r = .87
Run r = .84
Gallop r = .55
Hop r = .61
Object control r = .95
Strike r = .7

396
Kick r = .94
Throw r = .76
Valentini
et al.
(2015)
TGMD-2
MABC
424 children
(220 boys and
204 girls, age
range: 4–10
years)
DCD = 58
At risk of
DCD = 133
TD = 233
Criterion
Validity
(Concurrent)
Pearson
correlation
TGMD-2 Locomotor and MABC Ball Skills =.202
TGMD-2 Locomotor and MABC Balance =.187
TGMD-2 Locomotor and MABC Total =.169
TGMD-2 Object control and MABC Ball Skills =.289
TGMD-2 Object control and MABC balance =.207
TGMD-2 Object control and MABC Total =.316
TGMD-2 Total and MABC Ball Skills =.244
TGMD-2 Total and MABC Balance =.181
TGMD-2 Total and MABC Total =.226
33%

397
Inter-rater
Reliability
(TGMD-2)
Pearson
correlation
TGMD-2 locomotor r ranged from .88–.96; object
control .89–.94
MABC manual dexterity: r = .96; ball skills: r = .94;
balance: r = .97
Valtr &
Psotta
(2019)
MABC-2 120 Czech
participants of
three age
groups (17:0
– 17:11 years:
months, 18:0-
18:11 years:
months, 19:0-
19:11 years:
months), n=
40 (20 boys,
20 girls) in
each age
group.
Structural
Validity
Confirmator
y factor
analysis
(CFA)
Age band 3
χ2(9) = 14.035, p= .121, CMIN/df= 1.559, RMSEA =
.069, GFI = 0.966, AGFI = 0.920, and TLI = 0.954.
All factor loadings on the MD or AC latent factor
were statistically significant (p < .05).
54%
Van
Waelvelde
, De
Weerdt,
De Cock,
MABC
(Dutch
version)
and tests
of ball
Sample n =
90 children
(50 = boys
and 40 =
girls)
Criterion
Validity
(Concurrent)
Spearman
correlation
7-8 years: Total impairment score = -.72, p<.01
Speed of one hand = -.51, p<.01
Bimanual coordination = -.45, p<.01
Pen control= -40, p<.01
66%

398
& Smits-
Engelsman
, (2004)
catching
and
balance
Control n =
43 children
(29 = boys
and 14 =
girls)
The age
groups are as
follows:
7–8 years:
N = 107, (71
from the
sample group
and 36 from
the control
group). Mean
age = 8 years
6 months.
9–10 years:
(MABC &
Ball
catching)
Ball skills sub score = -.72, p<.01
Catching = -.74, p<.01
Throwing = -.58, p<.01
Balance sub score = -.46, p<.01
Standing on one leg = -.48, p<.01
Jumping = -.19
Balance in walking = -.21
9 years: Total impairment score = -.68, p<.01
Speed of one hand = -.30
Bimanual coordination = -.35
Pen control = -.60, p<.01
Ball skills sub score = -.53, p<.01
Catching = -.54, p<.01
Throwing = -.27
Balance sub score = -.48, p<.01
Standing on one leg = -.45, p<.01
Jumping = -.18
Balance in walking = -.51, p<.01

399
N = 26, (19
from the
sample group
and 7 from
the control
group).
Mean age = 9
years 3
months.
Criterion
Validity
(Concurrent)
(MABC &
KTK jump)
Spearman
correlation
7-8 years: Total impairment score = -.76, p<.01
Speed of one hand = -.54, p<.01
Bimanual coordination = .47, p<.01
Pen control= -.52, p<.01
Ball skills sub score = -.5, p<.015
Catching = -.57, p<.01
Throwing = -.44, p<.01
Balance sub score = -.70, p<.01
Standing on one leg = -.65, p<.01
Jumping = -.41, p<.01
Balance in walking = -.37, p<.01
9 years: Total impairment score = -.69, p<.01
Speed of one hand = -.43, p<.05
Bimanual coordination = -.39, p<.05
Pen control = -.47, p<.05
Ball skills sub score = -.58, p<.01
Catching = -.44, p<.01
Throwing = -.49, p<.01
Balance sub score = -.65, p<.01

400
Standing on one leg = -.48, p<.05
Jumping = -.33
Balance in walking = -.58, p<.01
Criterion
Validity
(Concurrent)
(MABC &
KTK beam)
Spearman
correlation
7-8 years: Total impairment score = -.72, p<.01
Speed of one hand = -.57, p<.01
Bimanual coordination = .43, p<.01
Pen control= -.46, p<.01
Ball skills sub score = -.52, p<.01
Catching = -.53, p<.01
Throwing = -.38, p<.01
Balance sub score = -.68, p<.01
Standing on one leg = -.63, p<.01
Jumping = -.30, p<.01
Balance in walking = -.46, p<.01
9 years: Total impairment score = -.58, p<.01
Speed of one hand = -.37
Bimanual coordination = -.19
Pen control= -.20

401
Ball skills sub score = -.34
Catching = -.34
Throwing = -.26
Balance sub score =-.69, p<.01
Standing on one leg = -.66, p<.01
Jumping = -.50, p<.01
Balance in walking = -.38
Wagner,
Webster &
Ulrich
(2017)
TGMD-3
(German
translation
)
In total 189
typically
developing
children
(Females =
90,
Males = 99)
Mean age =
7.15 years
(SD = ± 2.02
years Age
Range =
3.17-10.67
years
Test-retest
reliability
Hypothesis
testing
validity
Intraclass
correlation
Locomotor skills = .94, 95% CI [.91, .96], p < .001
Balls skills = .98, 95% CI [.97, .99], p < .001
70%
Inter-rater
reliability
Hypothesis
testing
validity
Intraclass
correlation
Locomotor skills = .88, 95% CI [.76, .95], p < .001
Ball skills = .97, 95% CI [.94, .99], p < .001
Intra-rater
reliability
Intraclass
correlation
Locomotor skills = .97, 95% CI [.94, .99], p < .001

402
56 =
kindergarten
children
133 =
elementary
school
children
Hypothesis
testing
validity
Ball skills = .99, 95% CI [.98, 1.00], p < .001
Internal
consistency
Hypothesis
testing
validity
Cronbach’s
alpha
Locomotor skills = .76
Ball skills = .89
Structural
validity
Hypothesis
testing
validity
Confirmator
y factor
analysis
Locomotion:
Run: IR = .32
Gallop: IR = .17
One legged hop: IR = .47
Skip: IR =.42
Horizontal jump: IR = .37
Slide: IR = .47
Ball skills:
One hand forehand strike: IR = .69
One hand stationary dribble: IR = .63

403
Two hand catch: IR = .44
Kick a stationary ball: IR = .63
Overhand throw: IR = .63
Underhand throw: IR = .52
Divergent measures:
Locomotor: FR=.77, AVE=.38, FLR = 1.77
Ball skills: FR= .90, AVE =.62, FLR = 1.09
Criterion
Validity
(Concurrent)
Hypothesis
testing
validity
Spearman
correlation
Ball skills:
At time of testing = rs(89) = .36, p < .001
12 months after = rs(66) = .39, p < .001
Locomotor:
At the time of testing - rs(89) = .15, p = .086, 1-ß =
.42
12 months after= rs(66) = .08, p = .253, 1-ß = .16
Ward,
Thornton,
Lay, Chen
TGMD-2 16 primary
school
students (age
Inter-rater
reliability
ICCs and
Spearman All assessments Overall ICC (Video):
Rater 1 (Pediatric professionals) = .88**(95% CI =
0.80-0.93) Rs = 0.75**
43%

404
&
Rosenberg
(2020)
8.2 ± 2.2
years)and 17
raters were
recruited to
the current
study; 7
pediatric
movement
professionals
(age 28.7 ±
6.55 years)
and 10
primary
school
teachers (age
34.5 ± 13.5
years).
Hypothesis
testing
validity
correlations
(Rs)
Rater 2 (Primary teachers) = .84** (95% CI =0.75–
0.90) Rs = .73**
All assessments Overall ICC (Point light):
Rater 1 = .87**(95% CI 0.79–0.93)
Rs = 0.79**
Rater 2 = .85** (95% CI 0.77–0.91)
Rs = .67**
Individual Skills (Video):
Kick ICC
Rater 1 = .92** (95% CI = .80- .98)
Rater 2 = .87** (95% CI = .71- .96)
Throw ICC
Rater 1 = .92** (95% CI = .80- .98)
Rater 2 = .89** (95% CI = .74 -.97)
Hop ICC
Rater 1 = .86** (95% CI = .67 - .96)
Rater 2 = .80** (95% CI = .53 - .91)
Jump ICC
Rater 1 = .75** (95% CI = .42 - .93)
Rater 2 = .59** (95% CI = .05 - .88)
Individual Skills (Point light):
Kick ICC

405
Rater 1 = .92** (95% CI = .80- .98)
Rater 2 = .86** (95% CI = .69- .96)
Throw ICC
Rater 1 = .94** (95% CI = .86- .98)
Rater 2 = .90** (95% CI = .78 -.97)
Hop ICC
Rater 1 = .74** (95% CI = .39 - .93)
Rater 2 = .72** (95% CI = .35 - .92)
Jump ICC
Rater 1 = .86** (95% CI = .68 - .96)
Rater 2 = .71** (95% CI = .34 - .92)
Wagner,
Kastner,
Petermann
, & Bos
(2011)
MABC-2 In total 323
children
(Female =
154,
Male = 169)
Mean age of
8.96 years
(min: 7.02,
max: 10.98).
Structural
validity
Confirmator
y factor
analysis
Aiming and catching: Factor reliability = .43 and
average assessed variance = .28
Throw tennis: Indicator reliability = .15
Throw beanbag: Indicator reliability = .44, t(factor
loading) = 2.89
Balance: Factor reliability = .53 and average assessed
variance = .45
One foot: Indicator reliability = .46
WAL: Indicator reliability = .29, t(factor loading) =
6.04
62%

406
Hop: Indicator reliability = .08, t(factor loading) = 4
Divergent measures:
Average assessed variance:
Manual dexterity = .44
Aiming and catching = .28
Balance = .45
Maximum squared intercorrelation:
MD & BL = .55
BL & AC = .28
Fornell-Larcker Ratio:
MD = 1.25
AC = 1.01
BL = 1.22
Wilson,
Kaplan,
Crawford,
& Dewey
(2000)
BOT-LF In total 50
children aged
between 7
years, 1
month and 14
Inter-rater
reliability
Intraclass
correlation
Entire sample:
Battery composite ICC = .945
Gross motor composite ICC = .897
53%

407
years, 5
months (M =
10.34 years,
SD = 1.83).
Male = 33
Female = 17
26 children
had known
learning or
attentional
problems
(LD) or both.
24 children
did not have
any known
learning
problems.
LD:
Battery composite ICC = .939
Gross motor composite ICC = .898
Non LD:
Battery composite ICC = .892
Gross motor composite ICC = .853
DCD:
Battery composite ICC = .939
Gross motor composite ICC = .816
Non DCD:
Battery composite ICC = .934
Gross motor composite ICC = .902
Running speed and agility = .902
Balance = .817
Bilateral motor coordination = .93
Strength = .84

408
Upper Limb coordination = .825
KAPPA
Battery composite = .64
Gross motor composite = .7
Wuang &
Su (2009)
BOT-2 Final sample
(n = 100).
Female = 41
and Male =
59
Average age
= 82.9 months
S.D. = 24.9,
Age Range =
48–124
months.
64 children =
mild ID
36 children =
moderate
Internal
consistency
Cronbach’s
alpha
Upper limb coordination = .87
Bilateral coordination = .87
Balance = .85
Running speed and agility = .87
Strength = .85
Manual coordination = .88
Body coordination = .87
Strength and agility = .88
TOTAL = .920
57%
Test-retest
reliability
Intraclass
correlation
(with a 2-
way random
effects
model)
Upper limb coordination (95%CI) = .88 (.83 - .92)
Bilateral coordination (95%CI) = .96 (.95 - .98)
Balance (95%CI) = .99 (.98 - .99)
Running speed and agility (95%CI) = .97 (.95 - .97)
Strength (95%CI) = .96 (.95 - .97)

409
to severe ID Manual coordination (95%CI) = .98 (.97 - .99)
Body coordination (95%CI) = .99 (.98 - .99)
Strength and agility (95%CI) = .99 (.97 - .99)
TOTAL (95%CI) = .99 (.99 - 1)
Standard
error of
measureme
nt
Upper limb coordination = .73
Bilateral coordination = .65
Balance = .49
Running speed and agility = .49
Strength = .63
Manual coordination = .66
Body coordination = .8
Strength and agility = .8
TOTAL = 1.79
Wuang, Su
& Su
(2012)
MABC-2 The final
sample
(n=144)
Females = 57
Males = 87
Internal
consistency
Cronbach’s
alpha
Aiming and Catching = .84
Balance subscales = .88
MABC-2 Test total score: a = .90
51%

410
Mean age = 7
years 7
months (SD
2y 1mo,
range 6y–12y
9mo)
Test-retest
reliability
Intraclass
correlation
(with a two-
way random
effects
model)
AC1 = .88, 95%CI = .83 - .92, SEM = .74
AC2 = .96, 95%CI = .95 - .98, SEM = .61
AC OVERALL = .91, 95%CI = .82 - .95, SEM = .92
BL1 = .99, 95%CI = .98 - .99, SEM = .35
BL2 = .97, 95%CI = .95 - .98, SEM = .44
BL 3 = .96, 95%CI = .95 - .97, SEM = .62
BL TOTAL = .97, 95%CI = .95 - .98, SEM = .52
TOTAL SCORE = .97, 95%CI = .96 - .98, SEM = .52
Wuang,
Lin & Su
(2009)
BOT-2 446 children
with
intellectual
deficits aged
4-18 years
Female =
40.4%
Male = 59.6%
Structural
validity
Rasch
analysis
(partial
credit
model)
(IRT)
Original BOT
18/53 misfitting items
Manual coordination PSI = 4.14 (0.95)
Body Coordination PSI = 2.02 (0.80)
Strength and Agility PSI = 4.24 (0.95)
BLC4 and BAL 5 had disordered thresholds
69%

411
Mean age was
9.4 years
(S.D. = 4.02)
71.7% of
children =
classified as
having mild
ID
28.3% of
children =
classified as
having
moderate to
severe ID
14 items had disordered step difficulty, so items were
re-scored
Revised BOT
No misfitting items
99.8% of the variance accounted for
No DIF for age or gender
Unidimensional underlying construct
Zhu et al
(2011)
PE
Metrics
5021 students
Male = 2568
(51.1%)
Female =
2453 (48.9%)
Structural
validity
Many-
faceted
rasch model
(IRT)
Grade 2
analysed
first - K and
All Infit and Outfit statistics of G2, K and G5 within
acceptable “–2 to 2” range
Acceptable age progression
43%

412
The sample
was split into:
K = 1465,
G2 = 1991
G5 = 1565
G5
anchored
onto G2
scale
Zoia et al
(2018)
MABC-2
(Italian
translation
)
IT sample:
AB1:
338 children
between the
ages of 3 and
6 years
162 females
and 176 males
AB2:
380 children
between the
ages of 7 and
10 years
199 females
and 181 males
Structural
Validity
Confirmator
y Factor
analysis
AGE BAND 1:
Satorra-Bentler X2 (df = 23) = 57.42, p < .01,
RMSEA = .067 (p = .096), NNFI = .96, AGFI = .93,
SRMR = .054
All model parameters significant (t-value > 1.96)
AGE BAND 2:
Satorra-Bentler X2 (df = 30) = 78.46, p < .01,
RMSEA = .065 (p = .073), NNFI= .95, AGFI = .92,
SRMR = .067
All model parameters significant (t-value > 1.96)
46%
Cross
cultural
validity (Italy
and UK)
ANOVA
Country effect 11/27 raw scores (p < .01), ES low to
moderate (ηp2: .014 - .09)
Age Band 1

413
UK sample:
AB1:
431 children,
aged 3 to 6
years
AB2:
333 children
aged 7 to 10
years
(Bonferroni
and LSD
adjustment)
AC1 in 3-4 years (F(1,414) = 9.536; p = .002),
interaction effect (F(1,414) = 4.103; p = .043): at 3
years of age, IT children made fewer catches
(F(1,414) = 10.985, p = .001; Cohen’s d: .48)
Dynamic BAL1 (F(1,762) = 42.76; p < .001) IT
children made less correct steps
Age band 2
AC1 (F(1,319) = 31,659; p < .001): IT children
achieved a higher number of correct catches
Static BAL both legs (best leg: F(1,705) = 13,581; p <
.001; other leg: F(1,705) = 21,675; p < .001),
IT children maintained balance longer
Dynamic BAL1 (F(1,705) = 32,423; p < .001), Age X
Country (F(3,705) = 4.270; p = .005): better result for
UK children
Dynamic BAL2 ‘other leg’ (F(1,705) =

414
12,768; p < .001), IT children made a higher number
of correct hops
Zuvela,
Bozanic,
& Miletic
(2011)
FMS
POLYGO
N
TGMD-2
95 children
(48 boys and
47 girls) aged
8 years old
(8.1 ± 0.3)
Intra-rater
reliability
Intraclass
correlation
Tossing and catching a volleyball against the wall
consecutively = .92
Running across obstacles = .96
Carrying the medicine balls = .90
Straight running = .95
Overall test = .98
42%
Structural
validity
Factor
analysis
Tossing and catching a volleyball against the wall
consecutively: mean = 5.57, SD = 1.24, F = .84
Running across obstacles: mean = 4.91, SD = .59, F =
.87

415
Carrying the medicine balls: mean = 5.33, SD = .59, F
= .86
Straight running: mean = 4.53, SD = .31, F = .83
Criterion
Validity
(Concurrent)
Hypothesis
testing
validity
Pearson's r
correlation
r= -.82, p < .05

https://www.crd.york.ac.uk/prospero/#recordDetails 416
/10
416
Appendix D
Online Questionnaire used in Chapter 3
Primary School Teachers’ Knowledge and Perceptions of Childhood Fundamental Movement Skills
Start of Block: Default Question Block
Q1 Information for potential participants
The purpose of this study is to: (1) investigate primary school teachers’
knowledge and understanding of fundamental movement skills (2) explore the
primary school teachers' perceptions of assessing pupils' motor skills in
schools. As a primary school teacher you are invited to participate in the
study, which will entail you completing a short questionnaire which will take
approximately 10 minutes. All questions are optional, and you can refuse to
answer a question by leaving the response field blank. Upon completion of the
questionnaire you will have the option to enter a prize draw to win one of three
£20 Amazon vouchers by leaving your email address. This email address will
only be used to contact the winners of the prize draw.
Please be aware that if you leave the questionnaire part way through, your
responses will not be saved, unless you click 'continue later'. This will save your
responses up to that point and allow you to complete the rest of the
questionnaire at a later date. You can withdraw your data from the study up to
one month after completing the questionnaire by contacting one of the
researchers (contact details listed below). All personal information will be kept
confidential and all data will be anonymised to ensure that individuals are not
identifiable. At the start of the questionnaire, you will be allocated a unique 4
digit ID number. This will be used to identify your responses in place of your
personal information. Please keep a record of this number as the researchers
will need this if you decide that you would like to withdraw from the study after
completing the questionnaire.
If you have any questions, or would like any further information please contact:
Lucy Eddy ([email protected]), Dr Liam Hill ([email protected] / 0113 343

https://www.crd.york.ac.uk/prospero/#recordDetails 417
/10
417
5726) or Dr Daniel Bingham ([email protected] / 01274 383935).
This research has been approved by the School of Psychology Ethics
Committee at the University of Leeds (insert ref number and approval date
when approved).
o Yes (23)
o No (24)
Page Break
Display This Question:
If Information for potential participants The purpose of this study is to: (1) investigate primary s... = Yes
Q2 Information for potential participants (part 2)
Do you understand that you can withdraw your data up to one month after
completing the questionnaire by contacting one of the researchers involved in
this project?
Lucy Eddy ([email protected])
Dr Liam Hill ([email protected])
Dr Daniel Bingham ([email protected])
o Yes (1)
o No (2)
Page Break
Display This Question:
If Information for potential participants The purpose of this study is to: (1) investigate primary s... = No
And Information for potential participants (part 2)Do you understand that you can withdraw your data... = No

https://www.crd.york.ac.uk/prospero/#recordDetails 418
/10
418
Q3 Sorry, you are unable to take part in this questionnaire.
Skip To: End of Survey If Sorry, you are unable to take part in this questionnaire.() Is Displayed
Page Break
Q4 Your unique ID number is listed below:
rand://int/1000:9999
Please keep a record of this.
Q5 What is your age?
o 18-25 years old (1)
o 26-35 years old (2)
o 36-45 years old (3)
o 46-55 years old (4)
o 56-65 years old (5)
o 66+ years old (6)

https://www.crd.york.ac.uk/prospero/#recordDetails 419
/10
419
Q6 What is your sex?
o Male (1)
o Female (2)
o Prefer not to say (3)
o Other (please specify) (4)
________________________________________________
Q7 What is your job description?
(Please tick those which apply)
▢ Teacher (1)
▢ Teaching Assistant (2)
▢ Headteacher (3)
▢ Special Educational Needs Coordinator (SENCO) (4)
▢ Other (please specify) (5)
________________________________________________
Skip To: Q9 If What is your job description? (Please tick those which apply) = Headteacher

https://www.crd.york.ac.uk/prospero/#recordDetails 420
/10
420
Q8 What age are the pupils that you teach?
(Please tick all the ages that apply)
▢ 4-5 years old (1)
▢ 5-6 years old (2)
▢ 6-7 years old (3)
▢ 7-8 years old (4)
▢ 8-9 years old (5)
▢ 9-10 years old (6)
▢ 10-11 years old (7)
Q9 How long have you held a teaching job for?
o Years (1) ________________________________________________
o Months (2) ________________________________________________
Q10 What country do you currently teach in?
▼ Afghanistan (1) ... Zimbabwe (1357)

https://www.crd.york.ac.uk/prospero/#recordDetails 421
/10
421
Q11 What type of school do you currently teach in?
o State (1)
o Private (2)
o Academy (3)
o Grammar (4)
o Other (please specify) (5)
________________________________________________
Q12 What is the highest level of qualification you have achieved?
o GCSE (or equivalent) (1)
o AS Level (or equivalent) (2)
o A Level (or equivalent) (3)
o Undergraduate degree (4)
o Master's degree (5)
o Professional degree (e.g. PGCE) (6)
o Doctoral degree (7)
Q13 What is the general subject area of your highest qualification?
(e.g. Psychology, Education, Sport etc)
________________________________________________________________
Page Break

https://www.crd.york.ac.uk/prospero/#recordDetails 422
/10
422
Q14 Have you had any training on 'Fundamental Movement Skills'?
o Yes (1)
o No (2)
Skip To: Q17 If Have you had any training on 'Fundamental Movement Skills'? = No
Skip To: Q15 If Have you had any training on 'Fundamental Movement Skills'? = Yes
Q15 What training did you receive?
________________________________________________________________
Q16 When did you complete this training?
________________________________________________________________
Q17 How knowledgeable do you think you are about motor skills that are
defined as 'Fundamental Movement Skills'?
o Not knowledgeable at all (1)
o Slightly knowledgeable (2)
o Moderately knowledgeable (3)
o Very knowledgeable (4)
o Extremely knowledgeable (5)

https://www.crd.york.ac.uk/prospero/#recordDetails 423
/10
423
Q18 Which of the following motor skill do you think comprise 'Fundamental
Movement Skills'?
(please tick all that apply)
▢ Running (1)
▢ Handwriting (2)
▢ Hopping (3)
▢ Jumping (4)
▢ Using cutlery (5)
▢ Balancing (6)
▢ Dressing oneself (7)
▢ Throwing (8)
▢ Catching (9)
▢ Walking (10)
▢ Crawling (11)
▢ Kicking (12)
▢ Brushing teeth (13)
▢ Riding a bike (14)
▢ Swimming (15)

https://www.crd.york.ac.uk/prospero/#recordDetails 424
/10
424
Q19 On a scale of 1-5, to what extent do you think the development of
fundamental movement skills has an impact upon:
No Impact High Impact
1 2 3 4 5
Academic achievement? ()
Participation in physical activity? ()
Mental health? ()
Physical health? ()
Social relationships? ()
Q20 On a scale of 1-5, how confident are you that you could demonstrate the
following activities:
Not confident at all Extremely confident
1 2 3 4 5

https://www.crd.york.ac.uk/prospero/#recordDetails 425
/10
425
Running between two markers for
15 seconds ()
Throwing beanbags into a target
box two metres away ()
Hopping between two markers one
metre apart ()
Holding a balance (e.g. standing on
one leg) whilst passing a beanbag
around your body ()
Q21 On a scale of 1-5, how confident are you that yourself and one other
member of staff could assess five children simultaneously in the following
activities:
Not confident at all Extremely confident
1 2 3 4 5
Running between two markers for
15 seconds ()
Throwing beanbags into a target
box ()
Hopping between two markers ()
Balancing whilst passing a
beanbag around their body ()
Page Break

https://www.crd.york.ac.uk/prospero/#recordDetails 426
/10
426
Q22 Do you/your school currently assess fundamental movement skill
proficiency?
o Yes (1)
o No (2)
o Unsure (3)
Q23 Do you think the senior leadership team at your school would be
supportive if you wanted to assess fundamental movement skill proficiency in
your class?
o Definitely yes (1)
o Probably yes (2)
o Probably not (3)
o Definitely not (4)
Q24 Would you be able to access support from another member of staff (e.g.
teaching assistant) to help you deliver an assessment of fundamental
movement skills to a whole class?
o Definitely yes (1)
o Probably yes (2)
o Probably not (3)
o Definitely not (4)

https://www.crd.york.ac.uk/prospero/#recordDetails 427
/10
427
Q25 Does your school have the following equipment:
Yes (1) No (2) Unsure (3)
25 beanbags? (1) o o o
Chalk? (2) o o o
A sports hall
larger than 5m x
5m? (3) o o o
Outdoor space
larger than 5m x
5m? (4) o o o
Stopwatch? (5) o o o
Tape measure or
metre ruler? (6) o o o
Q26 Over the course of a single school week, once per academic year, how
long do you think is acceptable to spend assessing the fundamental movement
skills of one class?
(please drag one response into each of the boxes below)
Per child For a whole class
______ < 10 minutes (1) ______ < 10 minutes (1)
______ 10-30 minutes (2) ______ 10-30 minutes (2)

https://www.crd.york.ac.uk/prospero/#recordDetails 428
/10
428
______ 30-60 minutes (3) ______ 30-60 minutes (3)
______ 60-90 minutes (4) ______ 60-90 minutes (4)
______ Up to 2 hours (5) ______ Up to 2 hours (5)
______ 2 - 3 hours (6) ______ 2 - 3 hours (6)
______ 3 hours + (7) ______ 3 hours + (7)
Q27 Do you think you have would be able to make time in the curriculum to
spend two hours at the start of the school year evaluating your class'
fundamental movement skills?
o Definitely yes (32)
o Probably yes (33)
o Probably not (34)
o Definitely not (35)
Q28 What time of the day would you be most likely be able to find time to
assess fundamental movement skills?
(Please rank from the most likely to the least likely by dragging the responses)
______ Physical Education (P.E.) lessons (1)
______ Core lessons (Maths, English and Science) (2)
______ Other lessons (e.g. Languages and Art) (3)
______ After school (4)
______ Before school (5)
Page Break

https://www.crd.york.ac.uk/prospero/#recordDetails 429
/10
429
Q29 Do you think a school based assessment of fundamental movement skills
has the ability to identify children who need additional support?
o Yes (1)
o No (2)
o Maybe (3)
Q30 On a scale of 1-5, how beneficial to your teaching would it be to have
knowledge about your pupils' fundamental movement skills?
Not beneficial at all Extremely beneficial
1 2 3 4 5
()
Q31 Do you think that assessing childhood fundamental movement skills in
school would increase your workload stress?
o Definitely yes (38)
o Probably yes (39)
o Probably not (40)
o Definitely not (41)

https://www.crd.york.ac.uk/prospero/#recordDetails 430
/10
430
Q32 On a scale of 1-5, if you had training and support available, how likely
would you be to assess the fundamental movement skills of the children in your
class?
Not at all Extremely likely
1 2 3 4 5
()
Q33 How likely would your decision regarding whether to assess the
fundamental movement skills be influenced by the opinions of other teachers in
your school?
o Extremely likely (1)
o Somewhat likely (2)
o Neither likely nor unlikely (3)
o Somewhat unlikely (4)
o Extremely unlikely (5)
Page Break
Q34 Thank you for completing the questionnaire. If you would like to be entered
into a prize draw to win one of three £20 Amazon vouchers please leave your
email address below*.

https://www.crd.york.ac.uk/prospero/#recordDetails 431
/10
431
* Your email address will not be downloaded from this website, and will only be
used to contact you if you have won.
________________________________________________________________
End of Block: Default Question Block

https://www.crd.york.ac.uk/prospero/#recordDetails 432
/10
432
Lucy Eddy [ps13lhe] UNIVERSITY OF LEEDS |
Appendix E
Teacher Manual used in Study 3 in Chapter 4

https://www.crd.york.ac.uk/prospero/#recordDetails 433
/10
433
About FUNMOVES FUNMOVES is a tool designed to assess fundamental movement skills in children. It
specifically focuses on a number of motor skills that are central to childhood
development: running, jumping, hopping, throwing, kicking and balancing.
Why are fundamental movement skills important?
Research has shown that children who have poor fundamental movement skills have
an increased risk of adverse outcomes in childhood including physical and mental
health problems, as well as poor academic achievement. Identifying children who
struggle with key motor skills will help schools to target support effectively for those
pupils.
Why should I use FUNMOVES?
FUNMOVES is an evidence-based assessment tool which has been modified based on
the teacher feedback to ensure that it is feasible for use in schools. FUNMOVES is a
fast way to identify children in your school which may need additional support – it can
assess a whole class in two PE lessons. After completing the assessment, you will
receive tailored reports on how each child performed compared to other children in
the same year group.

https://www.crd.york.ac.uk/prospero/#recordDetails 434
/10
434
Preparing for FUNMOVES
Resources Required
• 25 beanbags
• 80m electrical tape / chalk
• 6 response sheets
• 5 team score sheets
• A measuring tape or meter ruler
• A stopwatch or a device able to time activities
• Pens
• The help of a second member of staff to score activities
Splitting your class into teams
1. Separate your class into groups of five, based on their ability
When you are splitting them into groups you should consider how good each child
is at running, jumping, hopping, throwing, kicking and balancing.
2. Complete the demographic information on the response sheet
Dominant hand should be noted as the hand they write with. You should state that
you think a child has a motor problem if they have difficulty with handwriting, are
clumsy when moving around the classroom, or has difficulty physically interacting
with objects.
3. Compile teams
All the children whose names are written under name 1 will be a team, all the
children who are in the name 2 column make up a team etc.
4. Choosing team names
Once the teams are established, you should give each team a team score sheet, on
which they can write their names and decide upon a team name.

https://www.crd.york.ac.uk/prospero/#recordDetails 435
/10
435
Setting up the grid
All activities are based within a 5x5 metre grid, which should be set up using electrical
tape or chalk and a tape measure to the specifications shown below. Please note the
red lines on the diagram should be marked out in a different colour to the rest of the
grid. Make sure there is space at the bottom of the grid for your class to sit in their
teams.
•

https://www.crd.york.ac.uk/prospero/#recordDetails 436
/10
436
Implementing FUNMOVES
Team Competition FUNMOVES can be run as a team competition to make it fun and engaging. A class can
complete the assessment in approximately 1 hour, and can be split up over a number
of PE lessons.
Give each team a score sheet and a pen so they can count up the number of points
they get
Before you begin testing, line up the children in their teams, in the box on your
response sheet which corresponds to the lane on the grid
Go through the activities one at a time, testing all children before moving to the
next activity
Do not allow children to practice the tasks before testing
To avoid children not completing the tasks properly, tell them that they will not
receive any points for their team if they cheat
Try not to make it obvious when a child has been unsuccessful at completing a
task, or if a child is ‘winning’
Mark down unsuccessful attempts on the response sheet, but allow the children to
carry on and complete all activities, regardless of the level they achieved

https://www.crd.york.ac.uk/prospero/#recordDetails 437
/10
437
Running
Rules
Children have 15 seconds to run as many times from the start line to the far line
and back as possible
When you say STOP, they have to sit down as quickly as possible facing the way
they were running
Foot must touch both the start line and the far line of the grid for them to get any
points
Demonstrate the activity and explain the rules
Scoring
Children are scored by the number of ‘full lengths’ they have run
A full length comprises a 5 metre run (from one side of the grid to the other)

https://www.crd.york.ac.uk/prospero/#recordDetails 438
/10
438
Jumping
Rules
Children jump to the first line, then pause
Children are not allowed to jump line to line, they must use small jumps
When all five children reach the line, count 3 seconds, and then set them off to the
next line
Children must land with both feet in the red zone each time
Demonstrate the task and explain the rules
Scoring
Children are scored by the box in which they lost balance.
Losing balance includes
o Falling
o Pausing not on the line
o One or both of the child’s feet is not in the red zone
If the child loses balance on the line, mark that they lost balance in the box before
e.g. if the child lost balance on the line between boxes 2 and 3, put a cross in box 2
If a child completes the task, give them a score of 6

https://www.crd.york.ac.uk/prospero/#recordDetails 439
/10
439
Hopping
Rules
Children hop on one leg to the first line, then pause (whichever leg they want)
Children are not allowed to hop line to line, they must use small hops
When all five children reach the line, count 3 seconds, and then set them off to the
next line
Children must not put their foot down at any point during the activity
Children cannot change the leg on which they hop during the activity
Children must land in the red zone on each line
Demonstrate the task and explain the rules
Scoring
Children are scored by the box in which they lost balance.
Losing balance includes
o Falling
o Putting their foot down
o Pausing not on the line
o Foot shuffling whilst pausing on the line
o Not landing within the red zone on the line
If the child loses balance on the line, mark that they lost balance in the box before
e.g. if the child lost balance on the line between boxes 2 and 3, put a cross in box 2
If a child completes the task, give them a score of 6

https://www.crd.york.ac.uk/prospero/#recordDetails 440
/10
440
Throwing
Set up
Each child needs 5 beanbags that are all the same colour
Children stood next to one another on the grid should not have the same colour
beanbags
Rules
Children aim to throw (underarm) one beanbag into each box in their lane
Foot needs to be behind the line
Each child can only throw one beanbag at a time
Points are only be awarded for beanbags that land in their lane
Only one point can be awarded per box in their lane
Get all children to do the task right handed (all 5 beanbags), then reset the task
and allow them to complete it left handed
Demonstrate the task and explain the rules

https://www.crd.york.ac.uk/prospero/#recordDetails 441
/10
441
Scoring
Children are scored by the number of boxes in their lane which are filled by their
beanbags.
Left handed score is noted in the L box, right handed score is noted in the R box for
each child
To get a point, the beanbag needs to be fully in their target box. If it is touching the
boundary line but not crossing the outside edge, you can count this (see below for
some examples)

https://www.crd.york.ac.uk/prospero/#recordDetails 442
/10
442
Kicking
Set up
Each child needs 5 beanbags all that are the same colour
Children stood next to one another on the grid should not have the same colour
beanbags
Rules
Children aim to kick (along the floor) one beanbag into each box in their lane using
whichever foot they want
Children cannot change the foot they use during the activity
Each child can only kick one beanbag at a time
Points will only be awarded for beanbags that land in their lane
Only one point can be awarded per box in their lane
Demonstrate the task and explain the rules

https://www.crd.york.ac.uk/prospero/#recordDetails 443
/10
443
Scoring
Children are scored by the number of boxes in their lane which are filled by their
beanbags.
To get a point, the beanbag needs to be fully in their target box. If it is touching the
boundary line but not crossing the outside edge, you can count this (see below for
some examples)

https://www.crd.york.ac.uk/prospero/#recordDetails 444
/10
444
Static Balance
Set up
• Give each child one beanbag
• Line the children up next to each other, with enough space that children can swing
their arms without hitting each other
Rules
Balances 1, 2 and 4: children pass a beanbag around their body three times whilst
holding a balance
o Balance 1 = feet together
o Balance 2 = on one foot
o Balance 4 = on one foot, with eyes closed
Balance 3 - put each child’s beanbag on the floor in front of them, they should
attempt to pick up the beanbag in front of them whilst balancing on one leg

https://www.crd.york.ac.uk/prospero/#recordDetails 445
/10
445
Demonstrate each balance whilst ALL children are sat down and explain the rules,
then get all groups to do balance 1 before moving onto balance 2. Count the number
of rotations of the beanbags out loud.
Scoring
Children are scored by whether they can successfully complete each balance (yes/no).
Losing balance includes:
o Dropping the beanbag
o Not maintaining the balance position whilst passing the beanbag around
their body
▪ Wobbling is acceptable, but shuffling on their foot is not
o Opening their eyes in an eyes closed balance
o Putting their other hand down when picking up the beanbag in balance 4
Place a Y (yes) or a N (no) on the response sheet to indicate whether each child
successfully completed each balance

https://www.crd.york.ac.uk/prospero/#recordDetails 446
/10
446

https://www.crd.york.ac.uk/prospero/#recordDetails 447
/10
447
Appendix F
Teacher Response Sheet for Chapter 4
Name 1 Name 2 Name 3 Name 4
Demographics
Gender
Date of Birth
Dominant Hand
Do you think this child has motor problems?
Running
Number of Full Lengths
Box where the child is sat
Jumping (1-6)
Box on the grid where the child lost balance
Hopping (1-6)
Box on the grid where the child lost balance
Throwing (0-5)
Number of boxes with beanbags in
L R L R L R L R
Kicking (0-5)
Number of boxes with beanbags in
Static Balance
Legs Together
Y/ N Y/ N Y/ N Y/ N
One Leg
Y/ N Y/ N Y/ N Y/ N
Beanbag on the Floor One Leg
Y/ N Y/ N Y/ N Y/ N

https://www.crd.york.ac.uk/prospero/#recordDetails 448
/10
448
One Leg Eyes Closed
Y/ N Y/ N Y/ N Y/ N Y/ N

https://www.crd.york.ac.uk/prospero/#recordDetails 449
/10
449
Appendix G
Fidelity Checklist used in Study 1 in Chapter 4
Implementation Fidelity
Teacher ID _________________________________________
School _________________________________________
Year Group Tested ______________________________________________
Running
Teacher provides clear instructions to participants for the task
Never ☐ Sometimes ☐ Always ☐
Teacher provides clear instructions to ‘buddies’ for the task
Never ☐ Sometimes ☐ Always ☐
Teacher demonstrates task clearly
Never ☐ Sometimes ☐ Always ☐
Buddies understand how to score the task based on demonstration
Never ☐ Sometimes ☐ Always ☐
Buddies can accurately keep count of how many full lengths participants ran
Never ☐ Sometimes ☐ Always ☐
Teacher scores task correctly (full lengths and boxes)
Never ☐ Sometimes ☐ Always ☐
Hopping
Teacher provides clear instructions to participants for the task

https://www.crd.york.ac.uk/prospero/#recordDetails 450
/10
450
Never ☐ Sometimes ☐ Always ☐
Teacher provides clear instructions to ‘buddies’ for the task
Never ☐ Sometimes ☐ Always ☐
Teacher demonstrates task clearly
Never ☐ Sometimes ☐ Always ☐
Buddies understand how to score the task based on demonstration
Never ☐ Sometimes ☐ Always ☐
Buddies can accurately keep track of when participants fall/ put their foot down
Never ☐ Sometimes ☐ Always ☐
Teacher scores task correctly (last box)
Never ☐ Sometimes ☐ Always ☐
Comments:

https://www.crd.york.ac.uk/prospero/#recordDetails 451
/10
451
Jumping
Teacher provides clear instructions to participants for the task
Never ☐ Sometimes ☐ Always ☐
Teacher provides clear instructions to ‘buddies’ for the task
Never ☐ Sometimes ☐ Always ☐
Teacher demonstrates task clearly
Never ☐ Sometimes ☐ Always ☐
Buddies understand how to score the task based on demonstration
Never ☐ Sometimes ☐ Always ☐
Buddies can accurately keep track of when participants lose balance/ step out
Never ☐ Sometimes ☐ Always ☐
Teacher scores task correctly (last box)
Never ☐ Sometimes ☐ Always ☐
Comments:

https://www.crd.york.ac.uk/prospero/#recordDetails 452
/10
452
Walking along the line
Teacher provides clear instructions to participants for the task
Never ☐ Sometimes ☐ Always ☐
Teacher demonstrates task clearly
Never ☐ Sometimes ☐ Always ☐
Teacher scores task correctly (last marker)
Never ☐ Sometimes ☐ Always ☐
Comments:

https://www.crd.york.ac.uk/prospero/#recordDetails 453
/10
453
Static Balance
Teacher provides clear instructions to participants for the task
Never ☐ Sometimes ☐ Always ☐
Teacher provides clear instructions to ‘buddies’ for the task
Never ☐ Sometimes ☐ Always ☐
Teacher demonstrates task clearly
Never ☐ Sometimes ☐ Always ☐
Buddies understand how to score the task based on demonstration
Never ☐ Sometimes ☐ Always ☐
Buddies can accurately keep track of when participants lose balance
Never ☐ Sometimes ☐ Always ☐
Teacher scores task correctly (last box)
Never ☐ Sometimes ☐ Always ☐
Comments:

https://www.crd.york.ac.uk/prospero/#recordDetails 454
/10
454
Kicking
Teacher provides clear instructions to participants for the task
Never ☐ Sometimes ☐ Always ☐
Teacher provides clear instructions to ‘buddies’ for the task
Never ☐ Sometimes ☐ Always ☐
Teacher demonstrates task clearly
Never ☐ Sometimes ☐ Always ☐
Buddies understand how to score the task based on demonstration
Never ☐ Sometimes ☐ Always ☐
Buddies can accurately keep count of how many beanbags in the target area
Never ☐ Sometimes ☐ Always ☐
Teacher scores task correctly (how many full beanbags in target area)
Never ☐ Sometimes ☐ Always ☐
Comments:

https://www.crd.york.ac.uk/prospero/#recordDetails 455
/10
455
Throwing
Teacher provides clear instructions to participants for the task
Never ☐ Sometimes ☐ Always ☐
Teacher provides clear instructions to ‘buddies’ for the task
Never ☐ Sometimes ☐ Always ☐
Teacher demonstrates task clearly
Never ☐ Sometimes ☐ Always ☐
Buddies understand how to score the task based on demonstration
Never ☐ Sometimes ☐ Always ☐
Buddies can accurately keep count of how many beanbags in the target area
Never ☐ Sometimes ☐ Always ☐
Teacher scores task correctly (how many full beanbags in target area)
Never ☐ Sometimes ☐ Always ☐
Comments:

https://www.crd.york.ac.uk/prospero/#recordDetails 456
/10
456
Appendix H
Implementation Fidelity Checklist for Studies 2 & 3 in Chapter 4
Implementation Fidelity Checklist
Teacher ID:
______________________________________________________________
School:
_________________________________________________________________
____
Class Tested:
_________________________________________________________________
____
Preparation
Essential: Preferable:
Grid is set up
Teams are located in the lane on the grid they refer to on the teachers sheet
Teacher has a stop watch/ timer
Physically show each team their lane
Teacher has pens
Explain that the row they are sat in is their team
Teacher lines students up in their teams
Explain that each activity can earn their team points
Within each team, children are in the order they appear on the teacher’s sheet
Explain how to keep note of team scores on the score sheet
Explain that they will receive no points if they do not follow the rules
Comments:

https://www.crd.york.ac.uk/prospero/#recordDetails 457
/10
457
_______________________________________________________________________
_______________________________________________________________________
_______________________________________________________________________
_______________________________________________________________________
____________________________________________

https://www.crd.york.ac.uk/prospero/#recordDetails 458
/10
458
Running
Essential: Preferable:
Explain that they will be running for 15 seconds
The first person to sit down when they say stop wins a bonus point
Explain that they run from the start line to the back line as many times as possible
Clarify with class for understanding of rules
Explain that they should run as quickly as they can
Ensure the children not running from each team are out of the way
Explain that they must touch the line with their foot at both sides
Teacher keeps a tally for each child whilst running
Explain when they say stop, the children must sit down as quickly as possible
Teacher uses a timer which beeps after 15 seconds
Accurate demonstration of the task
Explain that they will get no points if they don’t run all the way to the lines
Teacher shouts stop after 15 seconds of running (time once to check)
Explain that they must stay in their own lane when running
Scores full lengths correctly (best judgement)
Comments:
_______________________________________________________________________
_______________________________________________________________________
_______________________________________________________________________
_______________________________________________________________________
____________________________________________
Jumping
Essential: Preferable:

https://www.crd.york.ac.uk/prospero/#recordDetails 459
/10
459
Explain that they must do small jumps from the first line to the second line and pause until they say go
Ensure all children are sat down when explaining the activity
Explain that they will do the same from the second line to the third line etc.
Explain that they will get no points if they don’t follow the rules
Explain that on each line they must land with both feet in the red/ coloured zone
Explain that it isn’t a race, they are scored on how well they can jump
Explain that they should only start jumping when they say go
Accurate demonstration
Actively times 3 seconds
Pauses children for approximately 3 seconds on each line
Keeps all children sat down until their turn so they don’t get to practice beforehand
Explain that they cannot just jump from line to line
Scores children correctly (best judgement)
Explain that they must pause on the back line too
Comments:
_______________________________________________________________________
_______________________________________________________________________
_______________________________________________________________________
_______________________________________________________________________
____________________________________________

https://www.crd.york.ac.uk/prospero/#recordDetails 460
/10
460
Hopping
Essential: Preferable:
Explain that they must do small hops from the first line to the second line and pause until they say go
Ensure all children are sat down when explaining the activity
Explain that they will do the same from the second line to the third line etc.
Explain that they will get no points if they don’t follow the rules
Explain that they can hop on any leg but must not change legs during activity
Explain that it isn’t a race, they are scored on how well they can hop
Explain that they cannot just hop from line to line
Actively times 3 seconds
Explain that on each line they must land on one foot in the red/ coloured zone
Keeps all children sat down until their turn so they don’t get to practice beforehand
Accurate demonstration
Explain that they must pause on the back line too
Pauses children for 3 seconds on each line
Explain that when they say they should put one leg in the air, and only start hopping when they say go
Scores children correctly (best judgement)
Comments:
_______________________________________________________________________
_______________________________________________________________________
_______________________________________________________________________
_______________________________________________________________________
____________________________________________

https://www.crd.york.ac.uk/prospero/#recordDetails 461
/10
461
Throwing
Essential: Preferable:
Explain that they should aim to throw one beanbag into each box in their lane
Ensure all children are sat down when explaining the activity
Explain that they should throw underarm
Explain that they will get no points if they don’t follow the rules
Explain that their foot should be behind the line when throwing
Explain that they do not get more points for further away boxes
Explain that they get one point for each box they fill in their lane
Before each child starts, asks them to hold one beanbag in their right/left hand in the air to check they understand
Explain that they will do the activity twice, once throwing all five beanbags with their right hand, once with their left
Accurate demonstration
Ensures children are throwing with the correct hand and re-sets if not
Ensures children throw underarm and re-sets if not
Physically checks beanbags which land near a line
Scores children correctly (best judgement)
Comments:
_______________________________________________________________________
_______________________________________________________________________
_______________________________________________________________________

https://www.crd.york.ac.uk/prospero/#recordDetails 462
/10
462
_______________________________________________________________________
____________________________________________

https://www.crd.york.ac.uk/prospero/#recordDetails 463
/10
463
Kicking
Essential: Preferable:
Explain that they should aim to kick one beanbag into each box in their lane
Ensure all children are sat down when explaining the activity
Explain that they should kick the beanbag along the floor, not out of hands
Explain that they will get no points if they don’t follow the rules
Explain that the beanbags should be behind the line before kicking
Explain that they do not get more points for further away boxes
Explain that they can use whichever leg they like to kick, but must not change leg
Explain that they get one point for each box they fill in their lane
Accurate demonstration
Ensures children are kicking along the floor and re-sets if not
Physically checks beanbags which land near a line
Scores children correctly (best judgement)
Comments:
_______________________________________________________________________
_______________________________________________________________________
_______________________________________________________________________
_______________________________________________________________________
____________________________________________

https://www.crd.york.ac.uk/prospero/#recordDetails 464
/10
464
Balance
Essential: Preferable:
Explains there will be a series of balance poses they need to hold
Ensure all children are sat down when explaining the activity
Balance 1: feet need to be kept together at all times
Explain that they will get no points if they don’t follow the rules
Balance 1: standing up straight you must pass the beanbag around your body with my count
Removes beanbags from throwing and kicking tasks and hands each child a beanbag only when it is their turn
Explain with my count: when I say 1, you pass it around your body the first time, 2 the second time etc.
Explain that they can pass the beanbag around their body either way
Explain they should only pick up the beanbag when the teacher says so
Ensures all children are sat down until it is their turn so they get no chance to practice
Explain that they should only start passing the beanbag around their body when the teacher starts counting
Balance 2: explains that they should do the same again but on one leg
Explain that after the 3rd rotation they should drop the beanbag in front of them, but maintain the balance until their beanbag hits the floor
Balance 3: explains that they should place the beanbag in front of them
Balance 4: explains they will get no points if they open their eyes
Balance 3: explains that they should try to retrieve the beanbag, standing on one leg using one hand
Balance 4: explains that they should stand on one leg and close their eyes to pass the beanbag around their body
Accurate Demonstration for each balance

https://www.crd.york.ac.uk/prospero/#recordDetails 465
/10
465
Scores children correctly (best judgement)
Comments:

https://www.crd.york.ac.uk/prospero/#recordDetails 466
/10
466
Appendix I
Recruitment flyer for Chapter 5, work package 1


![To Identify the given inorganic salt[Ba(NO3)2] To Identify the ...](https://static.fdokumen.com/doc/165x107/63169e619076d1dcf80b7c23/to-identify-the-given-inorganic-saltbano32-to-identify-the-.jpg)

