
Developing a Cost-Effective Solar Powered Vaccine ...
82
Developing a Cost-Effective Solar Powered Vaccine Refrigeration Unit for Uttar Pradesh, India Ross Sison * , Daren Fernandez † , Justin Ringle ‡ and Ryan Schofield § Department of Electrical Engineering and Renewable Energy, Oregon Institute of Technology Wilsonville, Oregon, USA Email: * [email protected], † [email protected], ‡ [email protected], § [email protected] TABLE OF CONTENTS I Introduction 4 I-A Summary of the Problem ..............................4 I-B Purpose and Objectives of this Project……... 5 I-C Proposed Solution to the Problem ................5 II Project Technology Description 5 II-A Technology Overview ....................................5 II-B Design Summary ...........................................5 II-C Approach and Methodology ..........................6 II-D Components & Testing Equipment ...............6 II-E Healthcare and Technology-Related Ethical Concerns ............................................7 II-F Project Milestones .........................................7 III Technical Feasibility 7 III-A Technical Limitations ....................................7 III-B Theoretical Performance Evaluation .............8 III-C Empirical Performance Evaluation .............. 10 III-D Constraints ................................................... 14 III-E Possible Risks and Complications............... 14 III-F Technology Maintenance and Lifecycle 15 III-G Benefits to the End-Consumers ................... 15 III-H Transportation Requirements ....................... 15 III-I Site Assessment ........................................... 15 IV Economic Feasibility of the Proposed Technology 16 IV-A Microeconomic Analysis………………… 16 IV-B Macroeconomic Analysis………………... 17 IV-C Effect of Energy Policy and Regulations... 18 IV-D Multi-Objective Economic Decision Process…………………………………… 19 IV-E Project Cost Estimates…………………… 21 IV-F Marketability and Economic Impact Evaluation………………………………... 21 IV-G Cost-Benefit Analysis…………………… 21 IV-H Social Implications………………………. 22 IV-I Project Financing………………………… 22 This paper was submitted to Professor Hope J. Corsair, PhD., Electrical and Renewable Energy (EERE) Department Chair of Oregon Institute of Technology (OIT) and capstone project advisor; and Dawn Lowe- Wincentsen, Portland Metro Campus Library Director for OIT, on 06/11/2020. This work was supported by the OIT EERE Department and the OIT Engineering Class Fee – PDX (FEGP) funding source. V Conclusion 22 V-A Summary and Reflection............................. 22 V-B Areas of Future Research ........................... 22 Appendix 24 References 80 Acknowledgements 80 LIST OF FIGURES 1 Block Diagram of SPVR System Interconnections… 6 2 Fusion 360 thermal simulation (Scenario 3) showing magnitude of the heat flux through ex- terior wall of the cooler assuming approximate temperature conditions for Uttar Pradesh in January...11 3 Second 48-hr test of the SPVR unit. The system was provided with a total simulated solar power input of 335 Wh per day............................................. 13 4 Simplified model of the SPVR charge controller and its electrical connection to the rest of the system. Level of solar irradiation represented by variable current source. .............................................. 24 5 Current through the SLA battery over a range of input values. The highest value represents solar condition during peak sun hour conditions in Uttar Pradesh, India. .................................................. 24 6 3D model of angled frontal view of the PV sys- tem trainer that holds the SPVR DC Solar Array Simulator Power Supply, SLA Battery, DC Ther- mostat Controller, ALLPOWERS Charge Con- troller, Fusebox, and Load connection ports. ............ 38 7 3D model of left side view of the PV system trainer for the SPVR unit........................................... 39 8 3D model showing angled, upper view of PV system trainer for the SPVR unit. ............................. 40 9 3D model showing rear PV system trainer for the SPVR unit. The back panel contains fuses, charge controller, DIN rails, load connection ports. ............. 41 10 Close-up of the back panel of PV system trainer for the SPVR unit. ..................................................... 42 11 3D model of Igloo Thermoelectric Cooler Unit from a front-edge angled view. The surface area of this unit is approx. 0.786 m 2 ................................ 43
-
Upload
khangminh22 -
Category
Documents
-
view
1 -
download
0
Transcript of Developing a Cost-Effective Solar Powered Vaccine ...

Developing a Cost-Effective Solar Powered Vaccine
Refrigeration Unit for Uttar Pradesh, India
Ross Sison*, Daren Fernandez†, Justin Ringle‡ and Ryan Schofield§ Department of Electrical Engineering and Renewable Energy, Oregon Institute of Technology
Wilsonville, Oregon, USA
Email: *[email protected], †[email protected], ‡[email protected], §[email protected]
TABLE OF CONTENTS
I Introduction 4
I-A Summary of the Problem .............................. 4
I-B Purpose and Objectives of this Project……... 5
I-C Proposed Solution to the Problem ................ 5
II Project Technology Description 5
II-A Technology Overview .................................... 5
II-B Design Summary ........................................... 5
II-C Approach and Methodology .......................... 6
II-D Components & Testing Equipment ............... 6
II-E Healthcare and Technology-Related
Ethical Concerns ............................................ 7
II-F Project Milestones ......................................... 7
III Technical Feasibility 7
III-A Technical Limitations .................................... 7
III-B Theoretical Performance Evaluation ............. 8
III-C Empirical Performance Evaluation .............. 10
III-D Constraints ................................................... 14
III-E Possible Risks and Complications............... 14
III-F Technology Maintenance and Lifecycle 15
III-G Benefits to the End-Consumers ................... 15
III-H Transportation Requirements ....................... 15
III-I Site Assessment ........................................... 15
IV Economic Feasibility of the Proposed Technology 16 IV-A Microeconomic Analysis………………… 16
IV-B Macroeconomic Analysis………………... 17
IV-C Effect of Energy Policy and Regulations... 18
IV-D Multi-Objective Economic Decision
Process…………………………………… 19
IV-E Project Cost Estimates…………………… 21
IV-F Marketability and Economic Impact
Evaluation………………………………... 21
IV-G Cost-Benefit Analysis…………………… 21
IV-H Social Implications………………………. 22
IV-I Project Financing………………………… 22
This paper was submitted to Professor Hope J. Corsair, PhD., Electrical and Renewable Energy (EERE) Department Chair of Oregon Institute of Technology (OIT) and capstone project advisor; and Dawn Lowe-Wincentsen, Portland Metro Campus Library Director for OIT, on 06/11/2020. This work was supported by the OIT EERE Department and the OIT Engineering Class Fee – PDX (FEGP) funding source.
V Conclusion 22
V-A Summary and Reflection ............................. 22
V-B Areas of Future Research ........................... 22
Appendix 24
References 80
Acknowledgements 80
LIST OF FIGURES
1 Block Diagram of SPVR System Interconnections… 6
2 Fusion 360 thermal simulation (Scenario 3)
showing magnitude of the heat flux through ex-
terior wall of the cooler assuming approximate
temperature conditions for Uttar Pradesh in January...11
3 Second 48-hr test of the SPVR unit. The system
was provided with a total simulated solar power
input of 335 Wh per day ............................................. 13
4 Simplified model of the SPVR charge controller
and its electrical connection to the rest of the
system. Level of solar irradiation represented by
variable current source. .............................................. 24
5 Current through the SLA battery over a range of
input values. The highest value represents solar
condition during peak sun hour conditions in
Uttar Pradesh, India. .................................................. 24
6 3D model of angled frontal view of the PV sys-
tem trainer that holds the SPVR DC Solar Array
Simulator Power Supply, SLA Battery, DC Ther-
mostat Controller, ALLPOWERS Charge Con-
troller, Fusebox, and Load connection ports. ............ 38
7 3D model of left side view of the PV system
trainer for the SPVR unit. .......................................... 39
8 3D model showing angled, upper view of PV
system trainer for the SPVR unit. ............................. 40
9 3D model showing rear PV system trainer for the
SPVR unit. The back panel contains fuses, charge
controller, DIN rails, load connection ports. ............. 41
10 Close-up of the back panel of PV system trainer
for the SPVR unit. ..................................................... 42
11 3D model of Igloo Thermoelectric Cooler Unit
from a front-edge angled view. The surface area
of this unit is approx. 0.786 m2 ................................ 43

12 3D model of Igloo Thermoelectric Cooler from
a top-down, side-edge angled view ............................ 43
13 3D model of Igloo Thermoelectric Cooler from
a back edge angled view ............................................ 44
14 Physical wiring connection schematic for the
SPVR unit. Please note that the Oregon Tech
power lab’s microgrid building ground connec-
tion was used in place of a grounding rod. ............... 45
15 ACOPower R40A Potable Solar Fridge which has
superior cooling characteristics compared to the
Igloo Iceless Thermoelectric Cooler used for the
SPVR unit. .................................................................. 51
16 Map highlighting the area of Uttar Pradesh.
(Source: Google Maps) .............................................. 51
17 RELion RB35 lithium iron phosphate battery ........... 52
18 Renogy 200 W Foldable Solar Panel. ....................... 52
19 GenaSun GV-10 Lithium Iron Phosphate MPPT
Solar Charge Controller ............................................. 53
20 Igloo Iceless Thermoelectric Cooler with the vac-
cine vials and thermal mass (i.e., water battles) in
place. The position of the water bottles conforms
to the CDC standards for refrigerated vaccines
and the standards for packing vaccines for trans-
port in emergency situations. ..................................... 53
21 Top-down view of plastic basket that holds the
vaccine vials. Beneath this container is a row of
five water bottles that act as the thermal mass (for
the lower portion of the cooler). ................................ 53
22 Complete SPVR unit while the second
48-hour system test was in progress. ......................... 54
23 Planned power input program for the DC SAS
Power Supply for second 48-hour test. Please
note that the position of the time marks on the
x-axis are not to scale. ................................................ 56
24 Fusion 360-generated drawing of the ALLPOW-
ERS charge controller used in all full-SPVR
system tests. ................................................................ 57
25 Fusion 360-generated drawing of ExpertPower,
55 Ah, 12 V battery unit used for battery dis-
charge and all full-SPVR system tests. ..................... 58
26 Fusion 360-generated drawing of the Igloo Ice-
less 28-quart Thermoelectric Cooler. Please note
that the dimensions of the cooler are inaccurate
by approx. 3 in due to the challenges faced in
modeling the curved edges of this unit to match
the actual product specifications. ............................... 59
27 Cross section of the thermoelectric cooler. From
left to right: polypropylene exterior, polyurethane
foam, polypropylene interior ...................................... 69
28 Thermal simulation (Load 1) showing magnitude
of heat flux through exterior wall of cooler as-
suming indoor temperature conditions. ...................... 69
29 Thermal simulation (Load 2) showing magnitude
of heat flux through exterior walls of cooler as-
suming maximum ambient operating temperature
conditions. ................................................................... 70
30 PUSH sensor temperature measurements for inte-
rior ceiling of thermoelectric cooler for load tests
1-3………………………………………………….... 70
31 PUSH sensor temperature measurements for bot-
tom interior of thermoelectric cooler for load tests
1-3…………………………………………………… 71
32 PUSH sensor temperature measurements at inte-
rior ceiling and external heat sink of thermoelec-
tric cooler during load tests 1-3. ............................... 71
33 Fluke 289 Thermocouple Temperature Sensor
measurements at the interior ceiling of thermo-
electric cooler for load tests 2 and 3. ........................ 72
34 Fluke 289 Thermocouple Temperature Sensor
measurements at the bottom of thermoelectric
cooler for load tests 2 and 3. ..................................... 72
35 Fluke 289 Thermocouple Temperature Sensor
measurements for interior ceiling and external
heat sink of the cooler for load test 3. ...................... 73
36 Fluke 289 Thermocouple Temperature Sensor
measurements for vaccine vials and top interior
and bottom interior of thermoelectric cooler for
load test 3. .................................................................. 73
37 Fluke 289 Thermocouple Temperature Sensor
measurements for the voltage of the battery, tem-
perature of the vaccine vials, and current supplied
to the thermoelectric cooler for the 24-hour full
SPVR system test. Please note that the input
DC power from the DC SAS Power Supply was
set at a pre-programmed mode to following the
EN50530 testing standards. ....................................... 74
38 Fluke 289 Thermocouple Temperature Sensor
measurements for the voltage of the battery, tem-
perature of the vaccine vials, and current supplied
to the thermoelectric cooler for the first 48-hour
full-PV system test. .................................................... 74
39 Fluke 289 Thermocouple Temperature Sensor
measurements for the vaccine vial temperatures
for the first and second 48-hour full-PV system
tests. ............................................................................ 75
40 PUSH temperature sensors and Fluke 289 Ther-
mocouple Temperature Sensor measurements for
the bottom of the thermoelectric cooler for
load
test 2. .......................................................................... 75
41 PUSH temperature sensors and Fluke 289 Ther-
mocouple Temperature Sensor measurements for
the top interior portion of the thermoelectric
cooler for load test 2. ................................................. 76
42 PUSH temperature sensors and Fluke 289 Ther-
mocouple Temperature Sensor measurements for
the ambient temperature during load test 2............... 76
43 PUSH temperature sensors and Fluke 289 Ther-
mocouple Temperature Sensor measurements for
the heat sink of the thermoelectric cooler during
load test 2. .................................................................. 77
44 PUSH temperature sensors and Fluke 289 Ther-
mocouple Temperature Sensor measurements for
the bottom interior of thermoelectric cooler dur-
ing load test 2. ............................................................ 77

LIST OF TABLES
I Power requirements of the Igloo Cooler and the
Temperature Sensor. The power demand of the
load is used as the basis for sizing the PV panels
and the battery unit. ................................................... 25
II Battery sizing calculations for the SPVR system.
The results indicate that it would take approx.
one, 55 Ah, 12 V battery unit to have a system
autonomy of one day .................................................. 25
III PV array sizing calculations for the SPVR sys-
tem. The results indicate that approximately 8-9,
100 W panels are needed to power the SPVR
system assuming that each of these panels. .............. 25
IV Charge controller sizing worksheet calculations
for the SPVR system. The results indicate that the
controller must have a max DC amperage rating
of at least 3.33 A. The charge controller used
could handle up to 20 A. ........................................... 26
V PV module to charge controller wire sizing
worksheet which is based on NEC and AWG
wiring standards. The results indicate that the
optimal wire sizing for wires connecting the
PV module to the charge controller would be
18 AWG assuming a component distance of
less than 5 feet based on the AWG reference:
https://bit.ly/2SDGHz7 ............................................... 26
VI Fuse sizing calculations for the SPVR unit. The
results show that there must be a minimum array
to controller fuse rating of 8.98 Amps assuming
a 5.75 Amp module short circuit current. The
fuse selected for this application was oversized
to be 20 Amps. In addition, the controller to
battery/load was sized at 20 Amps. The charge
controller already has a built-in load protection
fuse that address this requirement. ............................. 26
VII Tier 4 RBC proposal bill of materials (i.e., used
when the team was applying for Oregon Tech-
based funding for this project) which includes
the ideal system components for a robust solar-
powered vaccine refrigeration unit. ............................ 46
VIII Tier 3 RBC proposal bill of materials which
includes the next best system components for a
robust solar-powered vaccine refrigeration unit. ....... 47
IX Tier 2 RBC proposal bill of materials. ...................... 47
X Tier 1 of the RBC proposal bill of materials (no
funding option). Please note that ultimately the
team was able to contribute a small amount of
out-of-pocket expenses; acquire limited funding
from Oregon Tech’s Student Project Fees (FEGP)
fund; and use donated materials from OIT and
Richard Ellis which made the build and test phase
of this project possible. .............................................. 48
XI Tier 4 RBC Proposal Bill of Materials list
which complied with UL Safety Standards. .............. 48
XII Summary of variables and parameters that the
team focused on testing for this project. ................... 55
XIII Parameter list for the first load test performed on
the thermoelectric cooler............................................ 63
XIV Parameter list for the second load test performed
on the thermoelectric cooler ...................................... 63
XV Parameter list for the third load test performed
on the thermoelectric cooler ...................................... 64
XVI Parameter list for the battery discharge test. ............. 65
XVII Parameter list for the 24-hour full SPVR system
test. ............................................................................. 65
XVIII Parameter list for the first 48-hour full SPVR
system test. ................................................................. 66
XIX Parameter list for the second 48-hour full SPVR
system test. ................................................................. 67
XX Summary of Results from full SPVR system
tests. ............................................................................ 68

4
W
Abstract—Critically underdeveloped countries often lack the technologies and properly established medical standards to meet the basic needs of their patients. According to numerous studies, high in-patient and infant mortality rates in these countries have been linked to inadequate medical treatment and unsanitary environments. The main barriers to obtaining the proper tools, supplies, and equipment needed to address these issues include the high initial costs, maintenance and upgrade costs, as well as accessibility of materials. This report focuses on a renewable energy solution to properly store vaccines for transport to rural communities in Northern India that lack the health infrastructure and access to medical care.
The aim of this project was to develop a working prototype of a portable vaccine refrigeration unit powered by solar energy and battery storage. Experimental analysis showed that over a 48-hour period a single, one hundred-watt solar photovoltaic module was able to successfully provide adequate current to simultaneously charge a deep-cycle battery and power a com- mercial thermoelectric cooler for approximately twenty hours. This finding supports the limited viability of such a system under the approximate solar conditions of Uttar Pradesh, India during the winter months. Future research and tests using the data obtained from larger sized photovoltaic units and higher capacity energy storage units could possibly serve as the basis for the development of a more stable and robust unit with a higher degree of operability and autonomy.
Index Terms—Solar, Photovoltaic, Refrigeration, Battery, Vac- cine, Autonomy, Cold-Chain, Medical, Thermal, MATLAB, LT- spice, Fusion 360, Renewable, Energy, India
I. INTRODUCTION
ithin the last decade, new records were set for global
life expectancy which were largely due to reductions
in infant mortality and disease prevention through vaccina-
tions. While the global population continues to increase and
the percentage of populations with access to medical care also
sets new records, the number of individuals who still lack
medical care remains at a high level. The analysis of this
report focuses particularly on the state of Uttar Pradesh, India.
India is the second most populated country in the world and
is also one of the world’s leading producers of vaccines. In
recent years great progress has been made in the distribution
of vaccines, including national events where hundreds of
thousands of children are vaccinated in a single day. On the
other hand, access to this nation’s poorest populations remains
elusive, and each year India reports hundreds of thousands
of cases of preventable diseases such as polio, hepatitis B,
and tuberculosis. There are societal and technical challenges
in reaching these populations. One major challenge is the
critically low access to education. Large groups of the popula-
tion either lack the knowledge, do not understand the benefit,
or even fear the idea of being vaccinated. Another major
challenge is the lack of a cold chain infrastructure needed
to effectively deliver vaccines to the poorest communities
that are highly prone to vaccine-preventable diseases. This
is where renewable energy engineering (REE) can make the
greatest difference. The development of new clinics requires
significant time, capital, and input from targeted communities.
By taking advantage of the modular nature of renewable
energy sources such as solar PV modules, medical workers
can take portable vaccine coolers into densely populated and
underserved communities with the greatest need.
This project analyzes the potential of using a battery-
supported, solar-chargeable, portable vaccine refrigerator to fill
in the gaps of the cold-chain infrastructure in Uttar Pradesh.
The goal was to design a system that is cost-effective, portable,
and one that fulfills the requirements of the Center for Disease
Control (CDC) recommendations for secure vaccine storage.
A. Summary of the Problem
Based on the NREL report entitled “Renewable Energy
for Rural Health Clinics (1998)”, the “Cold Chain” is the
infrastructure necessary for the distribution of vaccines. This
system consists of medical workers who physically transport
electric vaccine storage equipment designed to maintain a
2°- 8° C temperature range during transport of vaccines [1].
One challenge facing successful distribution of vaccines and
the transport of other temperature sensitive medical items in
developing areas is the technological shortcomings within an
area’s Cold Chain Infrastructure. The abundance of renewable
energy technology in developed countries like the United
States offers potential solutions for filling those gaps.
Current technologies for solar-powered vaccine refrigeration
involve a Solar Direct Drive, where a refrigeration unit freezes
a “water bank” that will act as a thermal regulator if the power
goes out. These systems do not have batteries and tend to be
more cost effective than fully relying on refrigeration systems
for constant cooling. A vaccine refrigeration system with
battery pack and a solar PV panel which supports additional
electrical loads could be useful for a health clinic. Many rural
clinics still rely on people carrying vaccines into isolated parts
of the country, far away from electronic amenities of any kind.
By foot or by mule, keeping samples chilled to a proper level
is a constant concern for health practitioners.
The northern state of Uttar Pradesh, India was the region
of consideration for this project. The team focused primarily
on the rural districts of the state because of the high incident
rate of child mortality due to vaccine preventable diseases (i.e.,
only 51% of children aged 12-23 months have basic coverage)
[2]. A solar-powered unit would be practical for this location
considering the high range of solar resource available. There
was also adequate research information and resources that
allowed the team to adjust the specifications of this technology
to meet the meteorological and socioeconomic conditions in
that area. Data from the World Health Organization (WHO)
suggests that the need for vaccination is concentrated in the
northern regions of Uttar Pradesh where the risk of disease is
high, especially for vaccine preventable diseases like tubercu-
losis with more than 200,000 cases every year [3][4][5].
In Uttar Pradesh, tuberculosis, hepatitis B, and polio are
common diseases that could be prevented through proper
vaccine refrigeration (i.e., at a temperature between 2° - 8 °C)
[6]. Rotavirus vaccine is also needed by the general population
and could be stored safely at this temperature [5][6].

5
B. Purpose and Objectives of this Project
The main objectives of this project include the assessment
of the technical and economic feasibility of implementing the
proposed solar powered vaccine refrigeration units in areas
within India that still have low vaccination rates, such as Uttar
Pradesh. The team was focused on developing and building a
prototype of the PV-system which includes a portable thermo-
electric vaccine refrigeration unit. We also created an analysis
of the logistical and social implications of implementing such
a technology.
C. Proposed Solution to the Problem
The team set out to design a portable, battery-
supported, solar-powered vaccine refrigerator that met CDC-
recommended standards and was technically and economically
feasible. The portable refrigeration system was intended to
provide medical workers a means to transport vaccines into
the densely populated, poor communities that are at greatest
risk.
Our system sought to address both the rescue and develop-
mental aspects of Uttar Pradesh’s medical situation. A rescue
(or relief) effort allowed the team to design a smaller and
more portable system that would aid rural cold-chain vaccine
transport methods. This system also requires less power than a
full-sized medical grade system. An article from the Brookings
Institution mentions that health clinics in India use a network
of primary health centers (PHC) and community health centers
(CHC). There are also subcenters that serve as a first contact
between PHCs and CHCs for families in rural villages for
general child health, immunity, and communicable disease
treatment [7]. A solar powered vaccine refrigeration unit
designed to be distributable for rescue efforts would effectively
improve the storage technologies available to medical workers,
allowing subcenters to provide higher quality or expanded
vaccine administration services (i.e., this system would have
a more relevant, immediate, and longer lasting impact on the
rural districts in Uttar Pradesh).
Our project could potentially see a higher rate of success if it
supports the local economy. Thus, incorporating a small-sized
cell phone charging station and requiring users to pay a small
fee for each recharge would help raise profits for clinics. It
could also provide an opportunity for small businesses to rent
(or purchase) PV equipment to provide customers with other
services (i.e., charging, computer stations, etc.). Overall, the
short-term impacts of this system would be focused on rescue,
but the long-term impacts would be beneficial for economic
development.
II. PROJECT TECHNOLOGY DESCRIPTION
A. Technology Overview
Students are building a solar powered vaccine refrigeration
(SPVR) unit prototype for small clinics and subcenters that
would be portable, lightweight, cost-effective, and provide the
maximum utility relative to its size. The primary loads of
the system include a charge controller, thermoelectric cooler,
and a DC thermostat. While the charge controller and DC
thermostat draw considerably less current than the cooler,
they are essential to the operation of the unit. The charge
controller protects the system from overvoltage, overcurrent,
overheating, short circuit, reverse polarity, and other electrical
failure scenarios. The DC thermostat allows the user to set
the desired temperature range of the thermoelectric cooler.
Once the desired temperature range has been achieved, the
thermostat deenergizes the cooler. Secondary loads can be
attached to the charge controller which has two USB ports with
a standard 500 mA current output [8]. This feature enables the
charging of small electronic devices and mobile phones.
B. Design Summary
Due to economic restraints, the team had to acquire proto-
type components that could fulfill most of the requirements of
the SPVR system at the lowest available cost. These limitations
led the group to use the PV trainer module on campus,
made accessible by Richard Ellis. The PV trainer module
significantly reduced spending since several of the necessary
components of the SPVR unit were already included (i.e.,
such as the PV module, charge controller, DIN rails, and
fuse components). However, it does not represent the model
that would be employed in the field. An ideal system would
house electrical components within a centralized container
so that most electrical connections would not be exposed to
the elements. This container would house the battery, charge
controller, and DC thermostat.
A sealed lead acid (SLA) battery was chosen because
this energy storage technology is universally used and comes
at a lower cost than lithium ion batteries. SLA technology
also requires less regular maintenance than flooded lead acid
batteries, making it a more robust option [9]. The prototype
refrigeration unit used during testing was the Igloo Iceless
thermoelectric (TE) cooler. This unit was selected because it
was cost-free (i.e., this was a donated item); had a larger car-
rying capacity compared to other mini-coolers in the market;
and used an internal temperature reduction system that was
slightly more powerful than other mini-coolers in the market.
The Igloo Iceless TE cooler did not have any shelving on
which to place the vaccines. To compensate, students placed
the vaccine vials in a modified plastic basket. The bottom
of this basket had small rectangular holes covered with paper
towels to allow a certain degree of cool air flow to the vaccine
vials from the bottom. It also had a wooden grill near the
top of the basket to hold any loads placed on top of the
basket. The layering of the thermal mass conformed to the
CDC recommendations for the refrigeration and transport of
vaccines. Chilled water bottles lined the bottom of the cooler;
a basket was placed on top of those bottles; and another layer
of chilled water bottles placed on top of the wooden grill of
the basket. Photos in Appendix I show the cooler setup and the
layout of the system. The diagram in Appendix E illustrates
the layout of principle components of the SPVR unit, with
electrical connections included in the figure.

6
C. Approach and Methodology
This project consisted of three major development phases
with five working areas of focus. All members of the project
team were tasked to perform research, planning & design,
development, and testing for one or more of these areas of
focus:
• Solar Power System (Energy Generation)
• Battery System (Energy Storage)
• Vaccine Refrigeration (Electric Load)
• Accessory Charging Station (Secondary Load)
• System Modelling and Cost-Benefit Analysis
The first development phase focused on discussion and
agreement on the project focus and direction. Once an agree-
ment was reached, administrative tasks such as teamwork
hours, scheduling, and meetings were planned. The constraints
that could affect project accomplishments for each phase
included delays in the acquisition of materials; lack of funds;
material availability; personal and academic obligations; time
availability for each team member; errors and revisions; fac-
ulty availability; equipment availability; unexpected failures
in building tools and equipment; and project revisions rec-
ommended by faculty members. For a project of this scale,
approximately 80% of the delays were attributed to these
unforeseen events. Dynamic time management methods were
necessary to optimize the use of limited project development
time.
The first phase also focused on research into the five system
components. This involved a thorough review and analysis
of the literature associated with the component technologies
currently available in the market. Team members will also be
responsible for enhancing their knowledge in the areas of ma-
terial science, photovoltaic (PV) systems, medical standards,
and economics to better understand the design of the system.
Prior knowledge and information from the following courses
were needed during the planning phase of this project:
• PV Systems
• Materials for Renewable Energy Applications
• Thermodynamics & Heat Transfer
• Costing Renewable Energy
The team created and revised several drafts of the PV
vaccine refrigeration system design with the intent of keeping
the system simple, maintainable, and cost-effective. Once a
final model had been agreed upon, the team discussed the de-
velopment of a small-scale prototype of the actual SPVR unit.
During this phase, students also documented their observations
and findings and began creating a revisable draft of the first
project progress report.
The second developmental phase was an iterative process
involving multiple revisions on the prototype design or sys-
tem testing methods. Once the final model and method of
testing was agreed upon, the prototype of the SPVR unit
was developed. Team members planned and implemented
various tests to simulate the expected climate in Uttar Pradesh.
Our team ensured that the safety protocols of the power
lab at Oregon Tech and all safety regulations were followed
(Appendix O). Our team began characterizing the limitations
and strengths of the device which provided a basis for the
economic feasibility analysis. After testing various parameters
of the device (Appendix J), the team reported its findings in
the second project progress report.
The third developmental phase was originally planned as a
check on the tests conducted in the second phase of the project.
However, due to the COVID-19 situation, the team decided to
cancel further testing and analyze the existing data obtained
from previous experimental tests. Throughout the process, the
appropriate faculty members were informed of the progress
and intents of the team.
Economics played a major role in the guiding the group’s
choice of materials for this project. The total budget available
to the team was $400 which included $30 from lab fees
per student over three terms ($10/term) and a $70 individual
contribution per team member. To limit spending, the group
decided to use the PV trainer module mentioned previously.
This trainer system was convenient for experimental testing
and data collection, as all electrical connections were readily
visible and accessible. This feature made it easy to verify that
all connections were properly configured.
The factors considered when creating the testing parameters
for this project included climate and solar radiation research
data; electric and thermal performance of the thermoelectric
cooler; as well as charging & discharging characteristics.
Calculations were performed in MATLAB to help determine
characteristics such as the R value of the Igloo cooler as well
as the minimum battery sizing requirement based on the power
requirements of the Igloo cooler.
Fig. 1: Block Diagram of SPVR System Interconnections.
D. Components & Testing Equipment
The main electronic components, equipment, and tools used
in Phase 2 of the project are shown below. The dimensions of
the main components are listed in Appendix L. For the full
list of materials and equipment used for this project, please
refer to Appendix G.
• PV System Components
– Renogy 100D 100 W PV panel (2017 version)
– ExpertPower 12 V, 55 Ah Sealed Lead Acid Battery

7
– Igloo 28-Quart Iceless Thermoelectric Cooler
– LM YN DC 12 V Thermostat Module
– ALLPOWERS Solar Charge Controller (20 Amp)
– Faylapa CS-579B4 12-Way Fuse Block
– 18 AWG Conductor Wire
• Testing Equipment
– BK Precision PVS60085MR Programmable DC Power
Supply (DC Solar Array Simulator (SAS) Power Sup-
ply)
– BK Precision 8512 DC Electronic Load
– Fluke 289 DMM/FVF FlukeView Forms Combo Kit
– WILLHI 110 V Temperature Controller/Digital Ther-
mostat
– SensorPUSH Wireless Temperature and Hygrometer
Sensor (or PUSH Sensor)
– Duracell Ultra 3.8 A, 12 V Battery Charger
– Trip-Lite AC Surge Suppressor Outlet (for Compo-
nent/Equipment Protection)
– 12 V AC Converter Adapter for Igloo cooler
• System Assembly Tools
– Ratchet Wrench Assorted Sizes
– DIN Rail Screwdriver
– Wire Connection Crimper
– Heavy-duty Boxcutter
– DeWalt Portable Drill
– Wire Cutter & Stripper
– Measuring Tape
E. Healthcare and Technology-Related Ethical Concerns
The temperature probe of the DC thermostat of the SPVR
unit would need to be regularly calibrated against a high-
quality thermometer with a low tolerance rating to ensure that
vaccines are consistently being maintained within the
prescribed temperature range. Without this safeguard, there
is less certainty that the vaccinations would be consistently
administered under proper temperature conditions to ensure
maximum potency.
Owners of the SPVR technology would be entitled to
assess a fee for individuals using the mobile phone charging
capability of the charge controller. The fee should be assessed
at a value that is lower than the market cost of electricity,
thereby making it available to people of lesser social status.
However, with the current prototype situation, this feature may
not be available unless solar conditions are optimal (1000
W/m2) and a larger PV panel is used in the SPVR unit.
Further testing could be performed to determine whether the
prototype model is capable of supplying power to additional
loads. The possibility exists for consumers to modify this
product beyond its nominal operating specifications which
raises concerns for the safety of the user and the quality
of the primary load operation for the user. In addition, once
the technology reaches the end of its warranty or lifespan,
consumers may try to salvage materials to use in other
technologies or replace parts with components that do not
conform with internationally recognized medical standards.
External or internal enhancements to the vaccine refrigeration
unit or the solar unit may also change or reduce the capabilities
of this technology.
F. Project Milestones
During phase one of the project, the team prepared for
calculation and simulation work that began in November
2019 and was completed by January 2020. Experimental
testing began on January 30, 2020. The updated computer
simulations and experimental trials had been completed by
March 19, 2020. A summary covering the main analysis of
the experimental trials is presented in the technical feasibility
section of this report. Due to precautionary measures that the
administration of OIT had taken to limit the spread of COVID-
19, the team had decided to conclude further testing as of April
7, 2020. A full analysis and interpretation of the results from
phase two was successfully completed by May 3, 2020.
III. TECHNICAL FEASIBILITY
The components for the ideal design were chosen because
they met the minimum calculated design specifications. The
goal was to develop a prototype system that provides enough
power, vaccine storage space, and portability while meeting
the physical demands of being deployed in Uttar Pradesh,
India. The main consideration for a working fridge system is
the ability of the thermoelectric generator (TEG) to maintain
the required 2° – 8°C to keep the Polio, Hepatitis B, and
Tuberculosis vaccines in proper storage conditions. Several
guidelines from the WHO set standards for vaccine storage
that require the 0.5 mL vials to be 2 cm apart to allow proper
airflow and temperature control [10]. Economic constraints
limited the team from acquiring the principal components for
a more robust design and ideal testing setup (see Technical
Feasibility part D). The modelling work and experimental data
included in this section reflects the system that was built using
the components from the economical design.
A. Technical Limitations
The Igloo cooler does not have internal shelving or barriers
to separate vaccine containers from one another. The team
designed a custom rack to secure the vaccine vials in place
while accommodating thermal mass. According to the CDC
“Vaccine Storage and Handing Toolkit” document, vaccines
stored in refrigerators must have thermal mass (water bottles)
on the top rack, bottom rack, and door racks [11]. Considering
that the Igloo TEC has a more compact space, the team was
only able to accommodate a top and bottom layer of water
bottles. The positioning of the thermal mass also conformed
to the CDC document “Packing Vaccines for Transport During
Emergencies” [12].
Using high quality medical grade vaccines and vaccine
potency testing equipment as part of the thermoelectric cooler
tests was beyond the budget for this project. Even if such
materials could be obtained, this would likely make imple-
mentation of this technology cost-prohibitive for its intended
application. The climate conditions in Uttar Pradesh, coupled

8
≈
with the performance characteristics of the Igloo TEC and
considerations for needed vaccine temperature control, render
the SPVR prototype functional only during the three coolest
months of the year (i.e., December, January, and February).
Even though the solar conditions are not optimal during these
three months, the climate is notably drier than other parts of
the year, which is more ideal for using the SPVR unit. Testing
the unit in Uttar Pradesh was beyond the intended economic
and physical scope of this project.
The room in which the system testing was performed was
consistently at a temperature of approximately 20°C. This
consistency does not align with the temperature fluctuations
experienced over a typical winter day in Uttar Pradesh. To
receive data that is more reflective of true climate conditions
experienced in mobile applications, the SPVR unit must
be tested outdoors. The highly variable weather conditions
and amount of solar radiation in Allahabad, Uttar Pradesh,
India during the winter season required the use of a DC
load simulator and programmable DC variable solar power
supply simulator equipment to provide constancy in all power
measurements. Testing the SPVR prototype unit outside under
direct sun conditions would have been a more optimal direc-
tion for the project tests, but a 24-hour test period under clear
sky conditions was not possible.
The portability of the SPVR unit has several limitations that
originate from the equipment used in the prototype model. For
one, the rigid frame of the 100 W PV panel makes it less easily
carried than the desired solar suitcase PV panel [13]. As the
name of that panel implies, the flexible design allows it to be
folded and carried by a handle. The weight of the SLA battery
is an inherent limitation to true portability. This chemistry is
significantly heavier than that of its lithium ion counterparts.
In general, an SLA battery with the same amp-hour capacity as
a Li-ion battery weighs twice as much [14]. While the cooler
could be detached from power and be temporarily used as a
traditional cooler, the complete SPVR unit would undoubtedly
need to be transported by a pack animal or vehicle.
B. Theoretical Performance Evaluation
The PV System Sizing Excel Spreadsheet calculations
(Appendix B) and the MATLAB calculations (Appendix C)
allowed the team to determine that a 55 Ah battery would
allow for the system to run for a complete 24-hour cycle
without any solar power under ideal conditions. In the scenario
where there was no power generation from the PV panel for
more than one day, the system would not be capable to support
any loads. The team had to consider the trade-offs of system
portability to system autonomy. Considering the economic
constraints imposed on this project, the team chose a 55 Ah
battery which met the minimum requirements of the calculated
PV system sizing. The MATLAB results also provided insight
into the heat flux of the Igloo cooler under ideal conditions
(6.776 W/m2) which was also used as a basis for comparison
for the Fusion 360 thermal simulation analysis described later
in this sub-section.
The charge controller unit and SPVR system was modeled
in LTSpice to verify expected electrical performance. The
team used the LTSpice model of a PWM charge controller to
approximate the ALLPOWERS charge controller used in the
SPVR prototype [15]. As can be seen in Appendix A, the DC
thermostat is not included in the simulated model. However,
the current draw of the ALLPOWERS charge controller com-
bined with the DC thermostat approximates the performance
of the charge controller used in the simulation (i.e., 160 mA,
as stated from the user manuals, versus 185 mA, when run in
the simulation).
The main assumptions for the LTspice simulation were that
the maximum solar conditions corresponded with the short-
circuit current in the simulation.
The LTspice model was based on a generic charge controller
that approximated PWM current & voltage control due to the
lack of a specific circuit diagram for the ALLPOWERS
controller. Maximum solar irradiance was assumed to be 1000
W/m2. As indicated in Appendix A (Fig. 5), the simulated
current is shown entering the battery. Under maximum solar
irradiation conditions, approximately 710 mA of current was
permitted by the charge controller into the battery. A sweep
analysis was performed to determine the point where current
flowing from the charge controller (CC) to the battery changed
from a negative value (i.e., CC supplying power to the load)
to a positive value (i.e., CC charging and supplying power to
the load). The results of this analysis showed that an input
current above 5.055 A would permit current to flow to the
load and the battery. The solar irradiance conditions for the
switch from CC-to-load to CC-to-load & battery was
determined to be 871 W/m2 after equating the input current
(i.e., 5.055 A) to short- circuit current ratio with the ratio of
the input solar irradiance to the maximum irradiance.
The MATLAB calculations roughly yielded similar results
to the LTspice simulations in terms of the solar irradiance
conditions needed for the charge controller to switch the
current flow from CC-to-load to CC-to-load & battery. For
these calculations, the maximum input current to the charge
controller during ideal solar irradiance conditions was assumed
to be equal to the maximum operating current of the panel
(Iop = 5.29 A). The switching current boundary (i.e., CC-to-
load to CC-to-load & battery) was assumed to be equal to
maximum typical load draw of the Igloo cooler (i.e., 4.8 A).
Based on these assumptions, the solar irradiance conditions
for the switch from CC-to-load to CC-to-load & battery was
determined to be approximately 907 W/m2. The current to the
battery under optimal solar conditions was determined to be
490 mA. The main limitation to the MATLAB calculations was
the lack of information regarding the current flow switching al-
gorithm or calculation of the ALLPOWERS charge controller.
It should be noted that this model does not take into
consideration mobile phone charging through the USB ports
on the charge controller. This would be applied as an additional
load on the system, resulting in a higher probability that
the battery would have a decreased recharge period. A more
efficient PV module would theoretically be able offer better

9
power output; however, this would likely come from a larger,
heavier solid-frame PV panel, thereby further affecting the
portability of the SPVR unit.
The thermal simulation of the Igloo cooler focused on
showing how the refrigeration system behaves under different
thermal loads. Three scenarios were tested to simulate different
conditions that the cooler would operate in, specifically in
Uttar Pradesh during the month of January. The cooler has a
surface area of approximately 0.786 m2, which was measured
through Fusion 360 modeling (Appendix D, Fig. 11) and
a power draw of approximately 60 W. While no official
documentation was found that shows the efficiency of the
cooler, an approximation of 12.5% was assumed [16]. This was
a major assumption to make prior to physical testing and does
affect the projected outcomes from the thermal simulation.
One limitation on the use of the thermal simulations in Fusion
360 was that only static conditions could be modeled which
limited the accuracy of the results.
A CAD model was created in Fusion 360 that was based off
the measurements of the Igloo cooler. Several compromises
had to be made to the CAD model to simplify the system.
The cooler is powered by a thermoelectric generator (TEG)
and uses a fan to exhaust excess heat from the system. Due to
limitations of the software, the fan had to be removed from the
thermal simulations. Another alteration was to the lid of the
cooler, which is shown to be solid, though the actual cooler
has a chamber in the lid that allows air to flow from the fan
to the TEG.
The thermal loads were comprised of two sources of heat:
the interior chamber and the exterior shell. The interior
chamber walls had an applied temperature source with the
assumption that the chamber was at a constant temperature.
The exterior walls had a convective thermal source that was
applied to simulate the air moving around the cooler. By using
the simulation function of Fusion 360, a rough estimation of
the heat leaving the cooler can be modeled and estimated
at various points on the surface of the fridge. The main
consideration for these tests were to replicate the physical
materials that makeup the walls of the fridge as well as the
insulation material located in the interior of the fridge. While
general dimensions were found, it was not clear how thick
the individual layers of material are, so an approximation
of 0.344 in per layer was made (Appendix P, Fig. 27). The
interior and outer layers are made up of polypropylene plastic
which serves as a hard, light shell that protects the cooler from
physical impact. A middle layer of polyurethane foam acts as
the insulator for the system, reducing the heat flux that radiates
through the cooler walls. The material properties of the three
layers are accurately reflected in the Fusion 360 design based
on the stored physical material properties that the program
uses to run physical tests on 3D models.
Prior to beginning the simulations, the heat transfer coef-
ficient (hc, W/m2 K) had to be calculated for the system.
This was done using (1), where Q represents the heat flux,
A represents the area of the cooler wall, and ∆T represents
the difference between the exterior and interior temperature
of the TEC. The heat transfer coefficient represents the heat
flux through a surface based on the change in temperature
between the ambient environment and the exterior walls of
the cooler and was found by analyzing the maximum oper-
ating temperature conditions. It was assumed that during the
maximum operating temperatures, the cooler will have to run
continuously to keep the interior at or below 8 °C. Given the
approximate efficiency of the cooler to be 12.5% and a power
draw of 60 W, this leads to 7.5 W of energy leaving the cooler.
Based on these assumptions, hc was found to be 0.4769 W/m2 K and was assumed to be constant throughout all three tests.
By keeping the thermal coefficient constant, the amount of
energy leaving the system could be calculated for each load.
1) Load 1: Indoor Conditions
The first load simulation performed was for the indoor
operating conditions (Tinterior = 5 °C, Tambient = 20 °C) for the
cooler. These conditions assumed the cooler would be in a
temperature-controlled room out of direct sunlight and away
from the wall to allow proper air intake (i.e., rural healthcare
clinic or doctor’s office). This would result in a low power
draw since the cooler would not need to function for long
periods of time to maintain its internal temperature. If we
assume that hc is constant, 5.625 W of heat are expected to
leave the system. This would suggest that the total system
draw, with an efficiency of 12.5%, would need a total 45 W
to power the thermoelectric cooler under this load based on
(2).
The heat flux thermal simulation of Load 1 (Appendix P,
Fig. 28), shows the cooler blue region being more insulated
than yellow warmer region. As was expected, the cooler
shows a symmetric profile in heat flux through the exterior
walls. The heat flux through each wall and bottom of the
cooler was calculated to be approximately 6.0 W/m2 while
the lid had a lower heat flux of approximately 2.2 W/m2 .
In comparison, the MATLAB calculations for the walls of
the cooler yielded a heat flux value of 6.776 W/m2. Whereas
no official documentation was found regarding the number
of pairs of thermoelectric current (N-value), this value was
assumed to be 100,000. This was another major assumption to
make when calculating the TEC heat flux using MATLAB. As
was expected, the seam where the lid rests on the cooler allows
for the greatest heat flux (approximately 18 W/m2) since the
seal is not airtight.
2) Load 2: Maximum Operating Temperature
The second thermal simulation studied how the system
behaved under the maximum operating temperature
(Tinterior = 8 °C, Tambient = 28 °C). Since the cooler is limited
to only being able to lower its internal temperature to -20 °C
below ambient temperature, the maximum operating
conditions for this cooler would be 28 °C. The vaccines that
were being studied must be stored between 2 – 8 °C. By
allowing the

10
temperature to rise or fall out of this range, the potency of
the vaccines may be reduced. It is expected that the cooler
would have highest power draw under these load conditions
since the thermoelectric generator would have to be in constant
operation to maintain the required 8 °C internal temperature.
The thermal results for the maximum operating temperature
are shown in Appendix P, Figure 29. Similar to the first test,
the walls and bottom of the cooler showed a consistent heat
flux of approximately 8.0 W/m2 and a lower value (3.0 W/m2)
for the exterior surface of the lid. The seams showed the
highest heat flux (approximately 21 W/m2). Based on (1), the
heat flux through the system was estimated to be 7.50 W/m2
with a total power draw of 60 W.
3) Load 3: January in Uttar Pradesh
For the final load simulation, the operating conditions of
Uttar Pradesh were approximated to be 16 °C to simulate
the average temperature between night and day conditions.
Similarly, a 5 °C interior temperature was chosen to provide
a buffer for the vaccines in case of temperature changes.
The temperature change in the third load was the lowest in
comparison to the previous load simulations which suggests
that the power demand for this simulation would also be
reduced.
The final thermal simulation is shown in Fig. 2. The exterior
walls of the main body of the cooler show an approximate
heat flux of 4.4 W/m2 through their center while the lid has a
lower heat flux of approximately 1.7 W/m2. As with previous
models, the seams between the lid and the main body showed
the highest heat flux of approximately 11 W/m2. Assuming a
constant hc value of 0.4769 W/m2K, equation 1 was used to
find the total heat leaving of the system under load 3 conditions
to be 4.14 W. By using equation 2 the total power of the system
was calculated to be 33 W.
The three simulations showed that the heat flux through
the Igloo Iceless 28-quart TEC was determined based on
the change in temperature between the environment and the
interior chamber. The third load simulation showed the lowest
power consumption from the cooler due to the reduced tem-
perature differential. The second load simulation showed the
maximum power that the system would require to operate the
load continuously. As can be seen, there is a large variance in
the amount of power that is required to maintain a constant
internal temperature which creates a large drain on the overall
battery system of the SPVR unit since it must be sized to
consider this increased demand.
Further refinement to the thermal simulations could be done
in future research to more accurately model the heat flux of
the cooler. Adding a fan and accurately modeling the TEG
subsystem would provide a more accurate profile of the cooler
and allow for further refinement in other subsystems (i.e.,
batteries and solar panels). While the interior temperature was
modeled to be constant the experimental results show that the
temperature gradient within the interior of the cooler could
be modeled for more accurate results. Similarly, the vaccine
vials that are located within the cooler could be added to the
thermal model to provide a more comprehensive thermal load
analysis that more accurately represents the system.
C. Empirical Performance Evaluation
In order to characterize the physical and electrical capabil-
ities of this system, the team developed three types of tests
which included a load test, battery test, and full-PV system
test. These tests focused on evaluating several parameters
such as temperature, voltage, current, and load performance
stability. These tests are listed below. Appendix M provides
detailed information on the procedures for each of these tests.
• Load Test 1 (TEC Operation Check)
• Load Test 2 (TEC Thermal Mass Observations)
• Load Test 3 (CDC-Based Vaccine Storage Setup)
• Battery Discharging Test
• 24-hr Full PV System and Load Test
• 48-hr Full PV System and Load Test 1
• 48-hr Full PV System and Load Test 2
The development of these tests was based on a detailed list
of test parameters (Appendix N) and testing equipment listed
in Section II (D). The main limitations of this performance
evaluation were the tolerance of the measurement equipment;
the amount of component parameters the team could test;
and the number of tests that could be performed with the
limited financial and time resources. Based on a brief time
and motion study, the team determined that conducting the
essential tests directly relating to the storage of vaccines during
transport would be sufficient to support the analysis & design
for a workable prototype of a system that could potentially be
deployed in Uttar Pradesh.
The team also decided that the main measurement device for
the SPVR tests would be the Fluke 289 multimeter because of
the ease of use, rugged construction, and detailed measurement
data records. The secondary measurement device would be the
wireless PUSH sensor which would mainly be used for the first
load test (i.e., for TEC functionality) and serve as a backup
temperature sensor for load tests 2 and 3. In addition, the BK
Precision PVS60085MR was used to simulate solar input for
all full PV system tests.
The time scales in the resulting graphs from the team’s
system tests (Appendix Q), with the exception of the second
48-hour test, represent the actual, non-scaled experimentation
times. The graph of the second 48-hour test provides the
results for a hypothetical solar day with a 0-hour start time
and follows a non-scaled, 24-hour time basis. Please note that
the range of x-axis (time) values for all of the load tests have
been chosen so that the results of these tests could be compared
within the same time frame.
1) Load Test 1 (TEC Operation Check)
For this load test, temperature measurement data from
the PUSH sensors located at the top of the cooler were
consistently higher than the bottom of the cooler by an average
of 1-2 ºC (Appendix Q, Fig. 30-31). Thus, the temperature
measurements at the top of the cooler were used to determine
the length of time that the cooler was able to maintain
a 2-8 ºC temperature range. Based on these measurements
(Appendix Q, Fig. 30), the internal temperature of the top

11
Fig. 2: Fusion 360 thermal simulation (Scenario 3) showing magnitude of the heat flux through exterior wall of the cooler assuming approximate temperature conditions for Uttar Pradesh in January.
of the cooler decreased from room temperature (20 ºC) to
approximately 7 ºC within a period of about 3 hours. The
internal temperature of the cooler remained at 7 ºC (± 0.9 ºC)
for a period of approximately 6.5 hours. For the purposes of
this test, the cooler functioned without any power interruptions
or temperature inconsistencies.
After this period of temperature stability, the team turned off
the power to the TEC at 6:25 PM. The internal temperature
of the top of the cooler exceeded the 8 ºC vaccine storage
temperature limit after approximately 12 minutes. In contrast,
the bottom of the cooler took approximately 20 minutes to
exceed this limit. The team also found that bottom of the
thermoelectric cooler was only able to reduce its temperature
by approximately 14 ºC below ambient temperature (i.e.,
compared to the rated temperature reduction of 20 ºC). In
addition, the rapid rise in temperature after the power to the
TEC was turned off indicated that there was an external source
of heat that influenced the internal temperature of the cooler.
The team made an initial inference that the small gaps where
cooler lid touched the top of the cooler were allowing the
warmer ambient air into the cooler which may have resulted
in rapid temperature increases after power to the TEC was
removed.
2) Load Test 2 (TEC Thermal Mass Observations)
The main purpose of this test was to determine the tem-
perature behavior of the cooler with thermal mass. Before
including the thermal mass, the rate at which the internal
cooler ceiling temperature decreased was similar to the PUSH
sensor tests from load test 1. Between 10:30 AM and 1:00
PM this rate of decrease was 4 ºC (± 1 ºC) every 22 minutes
(Appendix Q, Fig. 33). A similar trend was observed for the
bottom of the cooler (Appendix Q, Fig. 34).
During the second load test, the team noted a positive
temperature spike at the top of the cooler which started at
2:40 PM. This was caused by the inclusion of thermal mass
which consisted of 31 frozen vaccine vials and 4 frozen bottles
of water (i.e., the thermal mass was determined to be at
approximately -2.7 °C). Within about 22 minutes of including
the thermal mass, the temperature reached 13 ºC (± 0.1 ºC).
In contrast, there was also a negative temperature spike at the
bottom of the cooler where temperatures decreased to -2.7 °C
(± 0.1 ºC).
Three hours after the thermal mass was included, the
temperature at the top of the cooler remained relatively stable
at approximately 14.3 °C. Whereas, the temperature at the bot-
tom of the cooler was at about 4 °C and gradually increasing
at a rate of 0.5 °C (± 0.2 ºC) every 40 minutes. From this
data trend, the team inferred with a high degree of certainty
that the thermal mass had created a region of dense, cold air
at the bottom of the cooler which forced the warmer air to the
top of the cooler. In addition, the small gap in the cooler lid
(i.e., created from the thermocouple wires entering the cooler),
permitted small amounts of ambient air into the cooler which
may have accounted for the slight increase in temperature over
a three-hour period.
3) Load Test 3 (CDC-Based Vaccine Storage Setup)
For this test, the team used water bottles and vaccine vials
that were at a temperature of approximately 2 °C. One hour
and thirty minutes after the thermal mass was included, the
temperature of the top of the cooler stabilized at 5 °C (±
0.2 ºC) and the temperature at the bottom of the cooler had
stabilized at 6 °C (± 0.1 ºC) (Appendix Q, Fig. 33-34). Over
a period of approximately 4.5 hours, the temperature of the
top and bottom of the cooler decreased by 1 ºC (± 0.3 ºC).
When power to the cooler was turned off at 4:50 PM, it took
approximately two hours for the bottom of the cooler to exceed
the 8 ºC vaccine storage temperature limit. Whereas, the top of
the cooler took approximately 45 minutes to reach the vaccine
storage temperature limit.
From these results, the team noted that the bottom of the
cooler was able to maintain a 2-8 ºC temperature range for
a significantly longer period of time compared to load test 1.
The team inferred with a high degree of certainty that these
improvements in temperature stability were attributed to the

12
addition of a flexible foam window seal on the area where the
lid rests on the cooler as well as the inclusion of thermal mass.
The seal greatly reduced the amount of ambient air that could
enter into the cooler resulting in a higher degree of temperature
stability.
The temperature of the vaccine vials (Appendix Q, Fig. 36)
also followed the same trends as the top and bottom portion
of the cooler. Between 11:40 AM and 5:00 PM, the vial
temperatures were consistently 1°C (± 1.2 ºC) below the top
interior temperature of the cooler and 2°C (± 1.2 ºC) below
the bottom interior temperature of the cooler. This supports the
team’s inference that the seal and surrounding thermal mass
(i.e., water bottles) were a significant factor in maintaining
temperature stability. This finding further supports the thermal
simulation (Fig. 2) which indicates the main source of internal-
external air flow was the seam of the cooler.
A comparison graph was developed to determine the cor-
relation between the interior temperature of the TEC and the
influence of the TEG on the internal temperature of the upper
portion of the cooler (Appendix Q, Fig. 32 and 35). The team
noted that a decrease in the internal cooler temperature was
followed by a corresponding increase in the temperature of the
heat sink due to the electrically induced temperature gradient
in the TEG. This finding confirms the relationship between the
temperature towards the top of the cooler and the TEC heat
sink.
4) Battery Discharging Test
The main objective for this test was to determine whether
a 55 Ah, 12 V sealed lead-acid battery would reach its rated
depth of discharge (DOD) within a 24-hour period of time.
For this test, the team set the DC load simulator to simulate
a load that draws 12 V and 4.8 A which represents the
maximum typical power draw of the cooler. Once the rated
depth of discharge (11.6 V) had been reached, the DC load
simulator would automatically shut down. The battery was
initially charged to 12.578 V using the Duracell Ultra charger.
After a 24-hour period, the battery was measured to have a
voltage of 11.695 V.
Based on the calculated autonomy and expected duration
of load operation per day, the result of this test matched the
team’s expectation that the rated DOD (of approximately 11.6
V) would be reached before the 24-hour period was completed.
However, this result represents the ideal scenario where the
battery discharges at a constant rate.
5) 24-Hour Full PV System Test and Load Test
For this test, the main objective was to determine the
functionality of the PV system and the DC power supply. The
graphical results for the 24-hour full system test (Appendix Q,
Fig. 37) show that the battery voltage and current input to the
cooler remained constant (i.e., at approximately 13 V and 4.5
A, from 5:30 PM to 3:00 PM the next day) when the DC SAS
supplied power at a preset power curve which conformed with
the EN50530 European testing standard. The temperature of
the Igloo cooler remained under 8 °C for the duration of the
test. Furthermore, the optimal vaccine temperature of 4-6 °C
was maintained for approximately 10.5 hours (i.e., from 3:16
AM to 1:46 PM).
These results illustrate that the refrigeration unit could
keep the appropriate vaccine temperature with a power input
that conforms to EN50530 testing standards (i.e., involving a
preset, simulated solar irradiation intensity pattern fluctuating
between 30% to 100% of 100 W/m2/s) [17].
6) 48-Hour Full PV System and Load Test 1
The first 48-hr test was run with a DC SAS Power Supply
program that supplied a total of 540 Wh/day to the SPVR unit
(Appendix Q, Fig. 38). This test compared the temperature of
the cooler, the voltage level of the battery, the load current,
and the power supplied by the DC SAS Power Supply over
each 24-hour cycle. A DC thermostat was utilized to maintain
the vaccine vial temperature between 2-8 °C.
The results of this test indicate that the DC thermostat and
cooler setup only began to draw current once it reached the
set temperature limit of 8 °C. The vaccine vial temperature
remained within the acceptable range of 6.2-8° C for a total
of 37.25 hours. When the first simulated night-time condition
started at 4:49 AM, there was approximately a 40-minute gap
where the measured load current was zero. The team inferred
with a high degree of certainty that the cooler turned off in
step with the power supply and did not immediately draw
power from the battery. Once the cooler began to operate
on battery power, the data shows that the battery voltage
was decreasing at a rate of approximately 0.2 V/h which
lasted for approximately 11 hours, followed by a sharp voltage
decline (lasting for 2.8 hours at a rate of about 1.17 V/h)
as the battery approached its maximum depth of discharge.
After this period, the battery was able to return to a charge
level of approximately 11.8 V at 11:34 PM (during the
second simulated solar day). The cooler continued to function
while drawing power from the DC SAS power supply as it
operated for the second and final (24-hour) cycle. After the
DC power supply turned off approximately one hour after 3:19
AM (i.e., to simulate the second night-time conditions), the
battery rapidly discharged and was not able to supply adequate
power to keep the load operating. This is evident by the lack
of measured current through the load and the continuously
increasing vaccine vial temperatures after the battery reached
its deep-discharge level (i.e., 4.5 V approximately 1.5 hours
after night-time conditions started).
From these results, the team determined that the battery
would be able to supply power and keep the cooler operating
sufficiently for approximately 11 hours. This first test provided
promising results for the limited operation of this system in
Uttar Pradesh. However, it should be noted that the solar
curve was developed using the maximum current and voltage
output of the panel and the length of daylight in Allahabad.
It should also be noted that the battery would have to enter
a state of deep discharge to achieve 11 hours of cooler
operation. In practical applications, excessive deep-cycling
could significantly reduce the cycle life of an SLA battery
(e.g., from six months to one month of constant use).

13
Fig. 3: Second 48-hr test of the SPVR unit. The system was provided with a total simulated solar power input of 335 Wh per day.
7) 48-Hour Full PV System and Load Test 2
The second 48-hr test showed that the SPVR system was
able to remain within the proper vaccine storage temperature
range of 2-8 °C for 32 hours (Fig. 3). Unlike the first 48-
hour test, the DC SAS Power Supply program during this test
provided a total of 335 Wh/day to the PV module (i.e., a
reduction of 205 Wh compared to the previous 48-hr test).
This adjustment to the total power input was made based
on the group’s change in understanding of average peak sun
hours during January in Allahabad, Uttar Pradesh (Appendix
K). During this 48-hour test, the thermal mass placed inside
the cooler was at a temperature below the cooler’s 2-8 °C
operating temperature. The first time where the temperature
was above 2 °C was approximately 6.25 hours after beginning
the test (6:15 AM). For the purposes of simulating the cold-
chain conditions, we considered this point in time as the true
starting point of the test where the vaccine temperature data
was valid.
The graph of this test also shows that during the first
simulated solar day, the cooler remained off. At about 11.25
hours into test, the cooler reached the upper temperature limit
for vaccine storage and began to draw power from the battery.
The vaccine vial temperature was maintained between 2-8 °C
for 20 hours (6:00 AM of day 1 to 2:00 PM of day 2). The
team noted that the cooler was only able to operate under
battery power for approximately 7 hours before the battery
reached a depth of discharge too low to supply power to the
load. The cooler remained off after this period, with a steady
rate of temperature increase of about 0.5 °C/h, until the DC
SAS power supply began to supply enough power during its
second cycle, at which point the cooler temperature returned to
the 2-8 °C range for 5 hours (i.e., from 4:15 AM to 9:15 AM
during the second simulated solar day). The cooler ceased to
operate once the power supply turned off because the battery
did not receive enough power to operate the load and recharge
during the second power cycle. As the graph indicates, the
battery voltage was significantly below its operational range,
and the temperature continuously increased at about 0.5 °C/h.
Similar to the previous 48-hour test, it should be noted that
the battery would have to enter a state of deep discharge to
power the cooler for approximately 12 hours.
From the vaccine temperature graph (Appendix Q, Fig.
39), the temperature of the thermal masses used in the two
respective 48-hour full-PV system tests were significantly
different at the start of the tests (i.e., approximately 6 °C
for the first 48-hour test and -6 °C for the second 48-hour
test). For the second 48-hour PV system test, the plateau of
the curve after the first 12 hours of the test suggests that the
thermal mass was stabilizing the temperature of the vaccine
vials. The temperature was maintained for approximately 6
hours. After 12:00 AM the next day, the temperature in the
cooler reached the maximum vaccine vial storage temperature
and began functioning solely under battery power. Even when
the DC power supply began its second ON cycle, the battery
did not have enough current to supply the load nor did it have
the sufficient to time recharge. Thus, the cooler eventually
stopped functioning at approximately 6:00 AM the next day.
During both tests, the cooler ceased to receive adequate power
after the end of the last DC power supply cycle. In both cases,
the rate at which cooler temperature began to increase after
the battery and load units had shut down was consistent. These
findings were also consistent with the LTspice and MATLAB
analysis which suggest that the battery would be unable to
fully recover from deep-discharge in both of the 48-hour full
system tests. The team inferred with a high degree of certainty
that the lack of load current, when the DC SAS power supply
simulated the second daytime condition, was due to the low
PV power input (i.e., using a single 100-watt solar panel) and
low charge controller current allocation for the battery.

14
D. Constraints
There were multiple constraints on the ideal design for the
SPVR system that limited the scope of the project. One of the
most notable constraints on this project was the limited access
to funds. The team applied for the OIT Resource Budget
Commission (RBC) Proposal fund in November 2019 but were
not granted any funds to help with the purchase of materials.
Thus, the project was largely funded out-of-pocket ($44.35)
and from access to the consumable fees associated with OIT
student project fees ($120). For this reason, a limited prototype
SPVR unit was agreed upon. Additional help was provided by
Richard Ellis (OIT Instrument Technologist 1) who donated
and gave the team access to several critical components to
make a functional prototype. He also provided the team with
access to testing equipment to evaluate the performance of this
unit.
The design of the system focused on portability and cost
effectiveness which limited the size of the system. Since this
project focused on transportation and cost effectiveness, a
short time of operation was chosen. Under ideal operating
conditions, the cooler would have to be placed indoors due
to the variable climate in Uttar Pradesh. For these reasons,
four hours of operation was chosen as the ideal time of
operation. This reduction in sizing also limited the project’s
ability to support a secondary load (i.e., cell phone charger)
since refrigeration was the main component with a high-power
draw. In addition, the equidistant spacing between vaccine
vials (i.e., in accordance with the WHO guidelines for vaccine
storage) was not possible due to material availability, time
availability, and economic constraints on this project. Thus, the
team chose to follow the CDC guidelines for vaccine transport
in emergency situations which did not have a specified vaccine
vial spacing requirement [12].
Uttar Pradesh was chosen in part due to the abundance of
information that was present about the climate and weather
in the area. Allahabad is a large city located in the state
with an adequate amount of data in terms of solar irradiance,
weather patterns, and cloud cover. Other constraints included
the difference in climate between Portland and Allahabad
which prevented the team from completely matching the
conditions of the target location; the low and highly variable
amount of solar radiation & weather conditions in Oregon (i.e.,
which required the use of DC variable power supply to provide
constancy in all power measurements); and the limited time
for project testing that forced the team to choose only primary
parameters directly relevant to vaccine refrigeration for mea-
surement. Minor sensitivity analyses were briefly considered
and placed in future areas of study.
E. Possible Risks and Complications
For this project, the team analyzed the hypothetical scenario
where an SPVR unit with similar capabilities was implemented
in rural areas of Uttar Pradesh, India. In this scenario, the
initial parts of the SPVR unit would be sourced from the
most cost-effective retailers in India or China. The unit would
be assembled in the United States by all team members
and transported with the necessary building accessories to
Allahabad. All four team members would be responsible for
contacting the community health center or cold-chain transport
center to coordinate the vaccine transfer (i.e., for a trial run of
this technology). We would also be responsible for setting up
the units, performing a one-day temperature test, and including
as much as 40 (25 ml) vaccine vials for Hepatitis B and Polio
for transport to a single rural destination. We would remain
with the medical transport personnel for approximately 2-3
weeks to provide necessary technical support and guidance
for self-operation of the unit. We would also verify and
record the performance of the system during that time through
physical checks and audio conferencing in accordance with
CDC regulations. After the system had been tested for a set
period, we would return to the United States and develop a
full report of the team’s findings while maintaining contact
with the medical staff using this technology.
In a hypothetical operation of this scale, there will probably
be various underlying political, economic, and environmental
scenarios which will be associated with the implementation
of this project. Each challenge comes with some degree of
inherent risk. These risks may include, but are not limited to:
• Construction Risks - originating from damage or safety
risks stemming from improper electrical or physical setup
errors
• Team and Institution Risks – relating to errors in commu-
nication and the logistics of implementing the technology
in the desired region of Allahabad
• Weather-related Risks – relating to unpredictable natural
disasters that may delay this project or even damage the
equipment setup
• Financial Risks – sudden changes or cancellations in the
funding of this project
• Operational Risks – reduction in manpower, technology,
equipment, and logistics due to unexpected reallocation of
resources (e.g. national emergencies, war, or pandemics)
• Regulatory Risks – relating to changes in governmental
or local policies on the implementation of solar-powered
medical technologies in rural areas
• Damage Liabilities and Risks – criminal activities that
could impact the successful construction and operation
of this project (e.g. theft and sabotage of equipment)
If these risks materialize, they could possibly complicate
the implementation of this project. Some of the complications
include, but are not limited to:
• Finding alternate equipment and material sources that
could provide replacement technology at a fast delivery
rate (i.e., higher cost involved)
• Creating special error correction procedures for improper
unit configuration scenarios
• Finding suitable facilities in underdeveloped regions of
Uttar Pradesh that could support construction and testing
of equipment over long periods of inclement weather

15
• Finding alternate sources of funding or loan agencies with
a low interest rate
• Contacting other community health agencies and tech-
nology companies who have a vested investment in
their industry to serve as alternate sources of help for
implementing this project in Uttar Pradesh during a crisis
• Reviewing policies and legal documents regarding legacy
support for previous foreign-based outreach community
projects for renewable energy (i.e., in the scenario that
regulations become more stringent on solar technologies).
This may involve hiring a special legal assistant or lawyer
to support the team’s case.
• Maintaining connections with law enforcement and com-
munity members to seek those responsible for equipment
damage and to contact local technology companies for
immediate replacement of parts (i.e., which may incur a
higher cost)
A special risk management team or hired firm would be
beneficial to effectively anticipate and prepare for these chal-
lenges and risks, as well as help expedite the implementation
of this project with minimal interruptions.
F. Technology Maintenance and Lifecycle
The PV system will require routine inspection and cleaning.
Solar panels will need to be checked for any dust or debris
every 2-3 weeks to avoid hot spots. Charge controllers will also
need to be checked daily for any overload warning signs. The
charge on the batteries must be monitored daily to evaluate
days of autonomy in case of weather changes.
The PV panels have a life expectancy of 25 years, and most
other essential components have a life expectancy of 20 years.
If the components last up to their nominal life expectancies, the
SPVR system could be anticipated to function with minimal
maintenance for 20 years.
According to a preliminary estimate acquired from
UPS.com, costs for shipping one unit with a weight of 40
kg from Portland, Oregon to Allahabad, Uttar Pradesh would
cost 888 USD. Whereas this price is not economically viable,
there would likely be a reduction in cost per unit for bulk
shipments.
The lifecycle of the PV system is generally dependent on the
performance warranties of the individual components. In the
optimal case, solar panels have 25-year warranties, batteries
have 10 to 15-year warranties, and charge controllers have 5
to 10-year warranties.
With any system using a compressor (Appendix H), there is
the possibility of occasional maintenance that may need to be
performed on the compressor. Compressors are commonplace
systems with which technicians worldwide should be familiar;
therefore, any required service should be attainable at a
reasonable price. The average lifespan of a compressor for
a compact refrigerator design is between 10 and 14 years.
If all components last for their entire lifecycle, the annual
cost of the system, including initial shipment costs, would be
125 USD. This does not include the cost of any incidental
maintenance that may be required of the mechanical or elec-
trical components of the system. However, this is the ideal case
and it is probable that some mechanical or electrical failures
could occur. Equation (3) was used to determine the costs of
system maintenance over a period of 20 years and considers
all materials that would have a lower probability of lasting
through their anticipated lifespans (i.e., due to mishandling,
accidents, or excessive wear and tear) [18][19]. Based on (3),
the estimated cost of replacement parts would be $515.69 over
a period of 20 years (i.e., ($237.99*10/20) + ($539.00*14/20)
+ ($193.99*2/20)).
Estimated Cost of Replacement over a 20-Year Period = Sum of Component Costs * Actual Lifespan / 20 years
(3)
G. Benefits to the End-Consumers
One of the upfront benefits of this technology include
reliable delivery of potent vaccinations, thereby reducing the
incidence of polio and other epidemic viruses that affect Uttar
Pradesh. This creates more healthy, able-bodied members of
society that can contribute to their community, whether at the
regional or international level. With more capable components,
the system could likely power secondary loads such as mobile
phones and other small electronics. Once the system has
reached its destination, the design of this system could allow
for people to charge their mobile phones and small electronic
devices for a small fee, allowing for the generation of capital,
and a return on investment that helps community members.
The secondary benefits include a reduction in reliance on grid-
based systems that utilize fossil fuels and increase carbon
emissions.
H. Transportation Requirements
The movement of vaccines between medical facilities would
require an efficient means of transport of the cooling unit.
The largest component in the SPVR unit is the PV module
which would have to be stored in a separate cargo bag or
container during transport. The battery, cooler, and charge
controller could be placed in a separate container. The main
limitation is the ability of the battery unit to recharge during
long-distance travel. Unless the vehicle has the capacity to
hold the panels (on the roof) and connect to the charge control
system, charging during travel will not be feasible.
I. Site Assessment
The desired location for the SPVR project is Allahabad,
Uttar Pradesh, India. Uttar Pradesh is home to a population of
199.8 million that are underserved in access to medical vac-
cines [20]. Since Uttar Pradesh is located along the southern
foothills of the Himalayan Mountains, one of the difficulties
in distributing vaccines in this region is how mountainous the
terrain can be and the relative distance between large sections
of the population. As reported by the National Family Health
Survey, 68% of the population has received the full dosage
of the Polio vaccine which leaves approximately 60 million

16
people who are not properly vaccinated [20]. This makes Uttar
Pradesh one of the least covered states in India for vaccination
inoculation for the general public. This led the team to choose
this location as the proposed application of the SPVR unit.
Many refrigeration units are only able to lower their inter-
nal temperature to a certain temperature below the ambient
temperature. Uttar Pradesh is a very warm state, which was
a significant limiting factor on the working conditions of the
SPVR unit design. Since the operational period for the SPVR
unit is limited to the winter months (December – February),
optimal sun hours for the area are also limited due to the
natural reduction of solar hours during winter months. This
effect is not as prominent as it is in other northern hemisphere
locations due to Uttar Pradesh’s proximity to the equator, but
it does factor into the system sizing. The solar irradiance
for Allahabad, Uttar Pradesh for the winter months is shown
below [21]:
– December: 3.31 kWh / m2 / day
– January: 3.35 kWh / m2 / day
– February: 4.43 kWh / m2 / day
Depending on the terrain in Uttar Pradesh, it may prove
imprudent to wheel the Igloo cooler. If the ground is very
rocky, wheeling the cooler could result in damage to the
vaccine vials.
IV. ECONOMIC FEASIBILITY OF THE PROPOSED
TECHNOLOGY
The following sections will cover an in-depth economic
analysis of the hypothetical scenario where this technology
is delivered to an underdeveloped country who will bear the
initial and long-term maintenance costs of the system.
A. Microeconomic Analysis
To add to the existing hypothetical scenario, we consider
the economic effect of this technology to the market within a
given underdeveloped country. The main assumption is that all
underdeveloped countries have similar needs in terms of food,
shelter, water, and an adequate living environment. In this
analysis, we assume that all market participants act rationally
in their own self-interest without changing their preferences
[18]. They also maximize the quantifiable utility of their
equipment and have equal access to information. In addition,
governing organizations also act as individual participants.
There are also no barriers to entry in the PV market with
minimal externalities that affect competition [18]. The market
is represented as an aggregate collection of decisions made by
individuals.
There are currently a wide range of solar-powered refrig-
erators available in the Indian market from retailers such as
IndiaMART, Bharat Solar Energy, and Meditech Technologies
India Pvt. Ltd [22][23][24]. There are also international whole-
salers such as Alibaba that provide this technology specifically
for users in India. While some of these technologies may not
necessarily meet the needs of the medical industry applications
such as vaccine refrigeration, this highlights the growing
demand for this technology because of its high reliability,
efficiency, portability, and decreasing costs [25]. This also in-
dicates the efforts of national and local policymakers to reduce
barriers to entry, eliminate monopolies, and externalities that
are symptoms of market failure [18].
With all economic factors held constant, the high prices of
standalone PV vaccine refrigerators match the relatively large
supply of this technology within India which is consistent with
the law of supply [18][25]. If we consider external factors such
as demand location and consumer preferences, the introduction
of a small-sized PV vaccine fridge unit in Uttar Pradesh would
increase demand for this type of technology and serve as an
impetus to develop and support the purchase of larger-scale
PV vaccine refrigerators for health subcenters and community
health centers in Uttar Pradesh.
The Pareto optimality seems to be reflected in medical facil-
ities around India. Hospitals in India are currently cutting costs
by focusing all expensive technologies in high volume areas
and more rudimentary technologies in small villages [18][26].
This suggests a high supply of expensive equipment, but low
demand due to the costs of production. The introduction of
low-cost or donated PV vaccine refrigeration technologies
would increase development and aid vaccine relief efforts.
This technology could be combined with other fundraising or
business initiatives such as co-use of PV vaccine technologies
for basic amenities (e.g. cell phone/small tablet charging) at
a nominal fee to customers. This could serve as the means to
fund medical facility expansions or to acquire more expensive
technologies where it is most needed in areas of Uttar Pradesh.
As the cost of materials to build PV vaccine cooling systems
decreases, the cost of these systems for end-consumers should
also decrease because of reductions in the costs of the factors
of production (i.e., land, labor, and capital) required to develop
these technologies. Ultimately this makes such systems more
affordable for many community health subcenters, thereby
increasing demand and leading to market equilibrium [18].
Some of the factors affecting short-term supply of the team’s
SPVR system include material and production costs; prices of
similar renewable vaccine cooling methods; changes to price
productions; policy restrictions; and the number of suppliers
in the market [18]. Some of the other factors that would affect
demand for this system would be the price of substitutes &
compliments to this technology; changes to the predicted tech-
nology prices; changes in the income or preference of the end-
consumer [18][27]. The social benefit for this system would
be the sum of end-consumer and external benefits [18][28].
Some benefits for the end consumer would include savings on
purchasing commercial grade vaccine cooling systems; low
maintenance costs; and utility of the technology. External
benefits could include decreased pollution from using PV
systems instead of diesel generators to power the refrigerator
and decreased medical costs for vaccine patients. The price
elasticity of demand for PV technologies has been relatively
elastic due to competition between several power sources
(i.e., grid at -0.74, diesel at -1.34, off-grid solar at -3.48,
and microgrid solar technology options at -2.34) according
to the report “Demand for Electricity in a Poor Economy” by

17
Burgess et. Al [29]. The major factors that can affect price
elasticity of demand include substitutes, necessities, time, and
consumer habits. The report states that:
the finding of high elasticity implies that anticipated
innovation in solar technology and small changes
in government policy, which in turn affect the char-
acteristics of different electricity sources, may have
dramatic effects on the electricity market. These are
explored in our counterfactual analysis. We find that
further reductions in solar prices would moderately
increase its market share, mostly arising from adop-
tion by households that would not otherwise be
electrified. However, when solar is the only electricity
source available, its market share is limited to 34%
and almost two thirds of households choose to remain
in darkness. Indeed, willingness to pay for off-grid
solar is considerably lower if the grid is available,
so that it appears to be more of a stop gap – albeit
a potentially important one – for households who do
not have access to grid or for poor households who
cannot afford full-cost grid electricity. In this sense,
solar power is valuable in large part because the grid
is incomplete and dysfunctional [32].
B. Macroeconomic Analysis
Adding to the existing hypothetical scenario, we consider
the economic effect of this technology to the national market-
place of India and the potential effects of this technology on
the entire country. The assumption here is that this product is
manufactured and distributed in India.
Increased human capital improvements, capital investments,
labor force growth (through population increases), and im-
provement in technology have contributed significantly to
India’s expanding production possibility frontier in the PV
related technologies such as vaccine refrigeration [29][30].
The production possibility frontier is a defined set of choices
people face for any combination of goods that can be pro-
ductively efficient. If more of one good is produced, then the
production of another good will be reduced.
Some of the factors that affect aggregate demand for these
technologies include total consumption, investment, govern-
ment spending and net exports of materials. In particular,
per capita income increases have been significant drivers of
consumption changes with the per capita NNP increasing by
1000 crore every 3 decades [31]. This is one indication that PV
cooling systems will eventually become more acquirable for
individuals and owners of small health facilities. Government
policy and support for investment in solar technology has
resulted in the creation of 23,499, in aggregate, capacity
increases as of March 2019 [32]. This data may suggest that
technological changes and production processes have become
efficient to the point where large-scale projects would be cost-
effective and feasible. In this case, if this trend continues,
the mass production of the team’s small-scale solar-powered
vaccine units could become a critical factor in expanding
solar-powered medical applications to rural areas thereby
reducing electricity costs, especially for health subcenters and
community health centers in Uttar Pradesh.
Charles Ebinger of the Brooking’s Institute highlights two
major issues that India faces in terms of energy policies and
production of electric power. He mentions that:
the most serious issue India must address is that the
gap between energy demand and energy supply is
wide and growing. Two reasons for this trend are
demographics and economics: not only is India’s
economy growing, thereby demanding more energy
and electricity, but the population is as well. There
is also massive urbanization, which is putting more
pressure on energy and the environment [33].
He also highlights climate and geographical challenges for
the transmission of power, mentioning that:
India’s power network comprises five regions span-
ning the country. While each is connected to a neigh-
boring region, there are inadequate interregional
connections through high voltage transmission lines,
creating difficulties for moving power from electricity
surplus states to those in deficit. This also creates
difficulties on a seasonal basis, as power is often
in short supply during the dry season and abundant
in some regions during the monsoon but cannot be
moved to help other states. An additional complica-
tion is that India’s investment in power transmission
and distribution has not kept up with generation.
Thus, in some cases, new generation cannot move to
the market because of transmission bottlenecks, such
as with wind power in Tamil Nadu [33].
In terms of energy policy, “the land acquisition bill is under
debate in India. This bill must be comprehensive and fair
to both owners and purchasers. Most importantly, however,
it must be transparent and enforceable. While India’s energy
sector is improving, the biggest problem for investors is that
translucent regulations and processes drive up private sector
costs. A clear and egalitarian bill can accelerate projects in the
national interest while providing fair compensation for those
displaced” [34]. While these issues remain to be addressed,
this technology would provide the necessary services to pro-
vide immediate relief will developing the medical sector to
meet future demand increases for services such as vaccination.
The increase in solar technology availability and the diversi-
fication of applications suggests that aggregate supply for PV
powered vaccine refrigeration will be relatively elastic in the
long run. Significant changes in LRAS (long-run aggregate
supply) can be influenced by a variety of factors such as
income or wage reductions, deregulation of the solar indus-
try, privatization of industries specializing in vaccine cooling
technologies, research & development, physical/informational
infrastructure development as well as improved education of
the labor sector [31].
There is also the difficult question of the ‘value’ of a human
life [31]. How would one quantify the monetary value of one
human life that is taken by improperly stored vaccines or the

18
lack of ability to safely transport vaccines to people in need?
There are several methods that have been put forth and one
of the most relevant method seems to be subtracting the value
of PV technology output across the economy from the value
of intermediate consumption [31].
India’s current inflation rate stands at 3.6% (CPI), which
is relatively low compared to other nations with an equally
sized economy [35][36][37]. This could potentially mean that
the rise in prices of technologies in the long-term will also be
gradual and purchasing power of money will remain stable.
However, one of the driving concerns is the high interest
rates which have the potential to reduce overall investment
activity in industries such as PV and cooling systems. In
terms of the unemployment rate, India is nearly comparable
to developed nations in the G20 with a rate of 8.50 percent as
of October 2019. Their youth unemployment rate is 23% [36].
This statistic does not cover underage workers and mutually
accepted underage workers which are a significant part of the
workforce (33 million), but do not appear on any official
government census in India. Some of the highest figures
come particularly from Uttar Pradesh [38]. Considering that
this type of labor system is integral to India’s economy, the
mass application of this PV technology would employ more
workers in the manual production and installation sectors of
the economy. Higher vaccine transportation rates would also
increase employment in the transportation sector and help
attract more money to working class families in need.
When hiring a labor force with workers of different skill
sets there is also the issue of how to address workers with
knowledge that has been rendered obsolete by the fast-paced
PV industry [34]. In this case, more costs would be incurred
through training, but would be recovered by the increase in
worker productivity (i.e., PV vaccine cooling system pro-
duction) and higher profits. Direct and indirect government
taxation of PV technologies used to provide services, reduce
negative externalities associated with consumption of goods,
and protectionism. Considering that India is a lead exporter
of vaccines and a notable retailer in cooling systems, they
have a relatively low level of protectionism for these types of
products [39].
Equitable distribution of income would also be a beneficial
byproduct of the introduction of this technology. Several gov-
ernment actions that could be taken include graduated taxation,
merit goods subsidizing, and payment transfer services [34].
Subsidizing the production and distribution of this technology
in Uttar Pradesh would serve as a platform for creating new
jobs, reducing expenditures, and benefiting the health of rural
communities. Healthier communities will have more potential
to serve India’s growing technology sector thereby increasing
economic expansion and balancing income distribution.
C. Effect of Energy Policy and Regulations
Energy policy attempts to address four main concerns:
energy security, reductions in toxic emissions, economic de-
velopment, and equity & accessibility for the energy industry
[35]. According to an official SAGE report entitled “India’s
Energy Security: Critical Considerations” by Arora et. al.,
India relies mostly on domestic and foreign coal and oil,
which are vulnerable due to internal and international conflicts
that could compromise the supply of these resources [36].
The increased use of PV technologies in critical sectors such
as the medical industry could increase energy independence
thereby increasing energy security. A change to renewable
energy would also improve economic development through
the creation of additional jobs, as more industrial workers
will be needed to build and install solar panels. However,
these changes come at a heavy cost, especially for industries
that must restructure their systems, as well as special land
acquisitions by the government for solar panels (or solar
recharging areas). Considering that India has shifted to a
market economy, most of the costs would be placed on the
people and partially on businesses [37]. The benefits of this
change would be minimal for well-developed communities and
cities but would be especially evident in more populated areas
of India with limited access to power or a heavily constrained
power network.
India has been one of the world’s largest contributors to
global air pollution for the past several decades [38][39]. Their
government has recently set targets to reducing industrial and
vehicular air pollution as of 2017 through the National Clean
Air Program (NCAP) but has not revealed specific information
on their approach [38][39]. Most of the economic burdens
imposed by excessive emissions come from long-term health
issues related to smog; negative impacts on drinking water;
losses in tourism; fishing & shellfish harvesting industries;
and reductions in the value of real estate [38][39][40]. The
mass manufacture and implementation of this system could
serve as a small but significant step towards the net reduction
of polluting energy sources such as coal, oil, and other fossil
fuels. Both the public and businesses bear the costs & benefits
of emission reductions programs. The net return on investment
would be significant considering the improvement in seafood,
tourism, and energy industries [41][42][43]. Equitable access
to electricity from renewable sources is both an economic
cost and benefit. For people and business to have an equal
share of renewable energy benefits, priorities must be set
regarding the nature of the energy need and the location. Safety
needs (e.g. emergency relief efforts) are the highest priority,
while health needs such as vaccination of children are nearly
equal in importance. Thus, the team’s standalone PV vaccine
refrigeration system comes as an important addition that could
relieve energy demand burden on existing renewable systems
and provide necessary time for development of both the
medical sector (i.e., gaining money to acquire more superior
technologies) and the energy sector (i.e., to develop more high-
output renewable energy generation systems). India appears
to have made renewable energy as one of its policy goals –
supporting the planned development of 175 GW of renewable
capacity by 2022 according to the National Renewable Energy
Laboratory [41]. Several options are open to policy makers to
achieve this goal which include subsidizing energy through tax
credits & feed in tariffs; subsiding energy prices or capacity

19
expansion through corporate investment or loans; or subsi-
dizing the manufacture of renewable energy systems through
direct funds (from taxes) on hardware or the acquisition of
hardware from other countries [42]. The choice of what or how
many areas should be subsidized is dependent on the economic
situation and the public’s willingness to pay for a future
benefit. Ideally, equal subsidies or subsidies that favor more
efficient technologies would be a good initial platform. As
mentioned previously, these subsidies depend on consumer &
business taxes and fees [42]. From the consumer perspective,
a shift to renewable energy does not constitute any tangible
savings, but it does promote long-term energy security and a
reduction in pollution.
When considering the implementation of any renewable
energy system, the concept of negative externalities must
also be considered [42]. There are hidden aspects of costs
which could affect those who do not benefit (e.g. plants
and animals) as well as those who pay the upfront financial
costs of a venture but not the public costs (such as pollution
and noise) [42]. Solar panels do not have any emissions,
but solar production companies may still depend on fossil-
based energy sources, and the toxic fumes emitted during
production collectively contribute to a significant amount of
carbon emissions [43]. However, the net long-term benefit
is pollution reduction assuming that solar PV systems last
their full lifecycle (i.e., approximately 20-25 years). One
solution to help encourage the shift to having renewable energy
sources power critical safety and health-related services could
be emissions taxes. On the other hand, some industries may
engage in efficiency improvements, but not necessarily make
system-wide energy source changes due to the nature of their
business (e.g. transportation and large oil industries).
D. Multi-Objective Economic Decision Process
In an ideal case where the team was successfully able to
implement this solar vaccine technology in Uttar Pradesh,
there will always be a single optimal outcome that results
from acting upon any decision that the team decides to make.
However, to make the situation more realistic, multiple factors
and options must be involved which complexify the problem
[44]. In order to arrive at a possible solution, a trade-off
analysis that considers all criteria of the problem would be
needed to understand the priorities of the different parties
involved in a decision-making process [44].
The decision-making process always involves multiple ob-
jectives which is subject to constraints (i.e., rules or limita-
tions). The extent of these constraints depends on the decision
variables [44]. This report will focus on one multi-objective
decision-making approach to implementing a PV vaccine
cooling system in Uttar Pradesh, India. There are seven major
steps outlined below.
1) Identify all the relevant stakeholders
2) Identify all the relevant objectives and attempt to
quantify them
3) Variables and Constraints must be defined
4) Data must be collected to gain understanding of the
problem
5) Alternative decisions must be developed and evaluated
6) Non-inferior alternatives must be selected from the group
of alternative decisions
7) Select and implement an alternative decision.
This process repeats with the goal of finding more optimal
solutions for complex problems. For this project, we will
briefly consider three categories of stakeholders – primary
stakeholders (i.e., directly affected parties by the implemen-
tation of a decision); secondary stakeholders (i.e., parties that
are indirectly affected by a decision); and key stakeholders
(i.e., individuals or groups that have the potential of positively
or negatively impacting the implementation of system) [44].
In this case, the primary stakeholders would be children and
young adults that are at risk of vaccine preventable diseases
which are widespread in certain parts of Uttar Pradesh. Sec-
ondary stake holders could include family members, friends,
and other people that could be affected by communicable
vaccine-preventable diseases. Key stakeholders could include
policy makers that permit the development and implementation
of national and foreign renewable technologies that benefit the
medical industry. In addition, community organizations such
as health groups, churches, and schools could all serve and
sponsors of this project.
The objectives for this project include developing a PV-
powered vaccine refrigeration system with the ability to charge
secondary loads (if necessary). In this hypothetical scenario,
we also plan to implement this system in Uttar Pradesh, India.
The development and implementation of this system must be
low construction, maintenance, travel, and replacement costs
with long lifespan (for good return on investment).
The variables for this project include fuel prices for the
transport of material, climate conditions, power outages, avail-
ability of labor, conflicts in the target location, and the price
of raw materials. The constraints for this project include the
rules set forth by supporting institutions (i.e., OIT), availability
(or lack) of funds for the project, transportation requirements,
government policy restrictions on equipment used to medical
care in India, as well as time to implement the project.
Data collection for this project will consist of analyzing
the yearly climate conditions of Uttar Pradesh; temperature
and time relationship for compressor-based refrigeration; total
power consumption during different times of year; prices of
transportation fuel and travel fees; and the quantification of
government support (or restriction) on the implementation of
renewable powered medical equipment in rural provinces of
India (i.e., in terms of government funding).
One of the major sources of uncertainty and concern for the
team regarding project design, development, and construction
is project funding. Thus, the team created several tiers of
materials lists based on the amount of funding we would be
able to obtain from the Resource Budget Commission of OIT
(refer to Appendix F). We also evaluated the priorities of this
project and the desired knowledge and skill sets we plan to
acquire from this experience. This was used as the basis to

20
decide what should be done if no funds could be acquired.
Below is a summary of the alternatives:
1) Full Funding: High power PV system (100 Watt) with
oversized battery (i.e., to handle secondary loads) and
self-powered vaccine fridge system. The system comes
with accessories for component and load protection and
tools for system maintenance and adaptability to different
connection systems. In addition, it includes system test
equipment and a cell phone for communication. This
system would cost approximately $2,600 (based on tier
4 of the RBC proposal calculations – Appendix F).
2) Partial Funding: High power PV system (100 Watt) with
oversized battery (i.e., to handle secondary loads) and
self-powered vaccine fridge system. The main accessories
and protection elements for the system to run are in-
cluded. This system would cost approximately $980 -
$1,300 (based on tier 2 and 3 of the RBC proposal
calculations).
3) No Funding (Out-of-pocket Expense): Medium power PV
system (100 W) and small-sized battery (i.e., enough
to meet short-term cooling applications) with a low-
cost, low power mini-fridge. This would involve donated
materials from the PV lab and power labs of Oregon
Institute of Technology. This system would serve as a
testable prototype that could be used as the basis for a
larger, more robust system. This system would cost about
$44.35 (based on the actual selected non-consumable and
consumable project materials for this project).
From the hypothetical sense where we implement this
technology in Uttar Pradesh, there are several alternatives that
the team could consider. Here we will assume that we will
be testing and evaluating the success of a single PV vaccine
cooling system in the cold chain to determine whether more
units could be produced and implemented. Options 1-3 below
apply to options 1 and 2 for the PV systems above.
1) Single Year-Round Mobile Application: This would cover
transportation, on-site maintenance, replacement, and la-
bor costs for having students installing, tracking, and
checking the system to obtain field data every month.
Considering that the average ticket price per person
is $1,645 (round trip with a stay of 1 week in Uttar
Pradesh); cost-effective hotel rates of $70 per night (based
on TripAdvisor); assumed key component replacement
costs of $300; van rental at $54 per day (according to
kayak.com rates); and food costs of approximately $29
a day (based on Budget Your Trip); and four group
members to help with implementation; the total cost could
be approximately $10,030 per month and $120,360 for 1
year (i.e., with monthly visits to this system) [45]-[49].
2) Scheduled Mobile Application: Our system could operate
for 2-months during the cooler winter season, and for 2-
months during peak heat to understand any hardware
improvements that need to be made. This would cover
transportation, maintenance, replacement, and labor costs
for having students installing, tracking, and checking the
system to obtain field data every month. Based on the
rough calculation for implementation costs (above), the
total expenditure could be at $40,120 (assuming a 4-
month checking period) [45]-[49].
3) Remote, Guided Application: A mobile health facility can
be contacted to receive and test this system with specific
instructions on system assembly and maintenance. We
can request the facility to provide specific data on how
this system operates and possible improvements that
could be made to suit their region of operation. Con-
sidering shipping costs of approximately $500 (for 2-5
shipping for a single 100-lb package, based on myus.com)
and administrative costs assumed to be $55 per hour
(based on annual salaries for family medical workers in
India and assuming a 8-hour workday), the total costs
for a 12-month system implementation and evaluation
would be $20,500. This cost assumes that the staff in
Uttar Pradesh are paid to make brief checks on the system
for a total of one hour of work on the system per day for
one year [50][51].
4) Remote, Guided Application for Prototype: Similar to
option 3 above, the total costs for this lighter system
(approx. 30 lbs), would be $20,270 (with a shipping cost
of approximately $194 for 2- to 5-day shipping)
[50][51].
The system and implementation costs have been calculated
and estimated based on item, equipment, and other implemen-
tation costs as of January 4, 2019. When selecting optimal
alternatives from the lists above, all significant factors such
as technology development time and available funds must be
considered. Since this project was not selected for funding
from the Resource Budget Commission in December 2019,
option 4 for the PV system and hypothetical implementation
would be the most suitable choice. Considering that we had
received funding for this project, the following question arises:
how much would we be willing to pay for additional system
features and implementation options? This decision would be
heavily dependent on Oregon Tech engineering department
funds and less on out-of-pocket expenses [44].
All options presented in this section are means to other
means. For instance, developing a prototype of the team’s PV
vaccine cooling system would be a means to improving this
system and customizing it to the cold chain system in Uttar
Pradesh. That would also be a means to finding solutions to
mass manufacture and implement this system over a wider
region with the ultimate goal of being able to provide reli-
able, cost-effective, and low-maintenance vaccine cold-chain
technologies to rural communities in underdeveloped countries
around the world. Each alternative course of action is equally
useful in determining the next step to achieve the team’s goal
(i.e., there are no inferior solutions). One objective such as
cost may have been optimized while all other objectives were
set as constraints [52].
One of the biggest advantages of the SPVR system is the
small land use and negligible environmental impact that would
be incurred during the use of this system. However, one
of the significant concerns that impacts the energy industry

21
is the recyclability and disposal of batteries and other PV
materials which contain toxic chemicals or gases that can
damage the environment when degrading. Further research will
be needed to understand India’s policies on renewable energy
system waste disposal (at the end of the lifecycle of certain
components).
When implementing this system at a large scale, there is
also the question about how the large-scale expansion of this
technology in the medical sector could possibly impact global
poverty and income distribution. Our technology focuses on
maintaining the quality and potency of vaccines which is a
crucial factor that indirectly affects the quality of healthcare
in India. Improvements in this sector allow more children to
be protected from vaccine preventable diseases and contribute
more effectively to the workforce of India once they reach
the legal working age. This system also has the potential to
create new industrial and commercial jobs pertaining to the
manufacture, sale, and implementation of PV vaccine cooling
systems which can help lead to better income distribution and
reduce poverty (i.e., for those who do not have jobs). Further
advancements in PV technology as well as the increased
production of this technology can lower prices across the
market making this system more affordable in the long run
[53].
E. Project Cost Estimates
The following table shown in Appendix G include a tenta-
tive list of materials, equipment and associated prices based on
the most optimal cost-effective options on the market that have
been researched as of February 20th, 2020. The total out-of-
pocket expenses for non-consumable materials was currently at
$44.35. The PV trainer which includes the DC Simulated Solar
vaccine cooling technology, manufacturing activity (costs),
value of inventory, value of distribution, building permits,
and development of new related firms. Some of the lagging
indicators may include effects to the GDP from RET firms,
demand for jobs, and corporate profits. A detailed explanation
on how these indicators would guide implementation and
marketing plans could be discussed in future revisions of this
project [55].
G. Cost-Benefit Analysis
Vaccine refrigeration units that rely on renewable technol-
ogy could be built as a pre-designed unit or a modifiable
unit with a “base” design. A pre-designed unit with fixed
capabilities would be easier to build and manufacture which
would lead to reduced production & end-consumer costs.
Another aspect to consider is manufacturing. A simple, but
robust modular unit design will allow for faster and cheaper
mass production. If this product is to be assembled at several
plants located within these developing countries, then the
ability to satisfy consumer demand relies on availability and
accessibility of raw materials. Thus, any endeavor would
require careful consideration for the direct costs associated
shipping and handling as well as satisfying the needs of a
localized workforce.
In terms of finances, healthcare facilities will also be
concerned about the monetary value (or worth of this system
over time). Our team will evaluate the net present value of
the system we plan to use for the project. The formula for net
present value is shown in (4) [56]. In this formula i represents
the return or discount rate, t represents the number of time
periods.
Array Power Supply, DC Load Simulator, charge controller,
10-way fusebox, and DC circuit breaker has a total combined
(4)
worth of approximately $8,733.53. The total consumable costs
which were funded by the FEGP (Student Capstone Fees)
amounted to $106.
F. Marketability and Economic Impact Evaluation
The potential for a solar powered vaccine refrigeration unit
to be introduced into the market of a critically underdeveloped
nation relies on several major factors which include retail
price, return on consumer investment, long-term product relia-
bility, and availability of source materials. In addition, some of
the most successful PV projects and endeavors have resulted
from the ability of individuals and businesses to engage in the
resale of parts of the system or use the renewable technologies
to generate income. Therefore, future upgrades to the current
PV vaccine cooling system could feature a larger energy
storage unit to service more loads (e.g. paid recharging of
tablets and computers or the ability of low-cost cell phone
communication powered by this PV system) [53][54].
Several significant leading and lagging economic indicators
for a product-specific industry are applicable for PV vaccine
cooling system. Some important leading indicators include the
current stock market value, market-value of solar powered
Assuming that we will be incorporating the RNG-100 solar
panel into this system and excluding the DC SAS Power
Supply from the cost analysis, the total cost of the system with
accessories would be approximately $322.91. If we assume
that the required return is 8% and implementation of this test
equipment will be for 3 months, this equates to a net present
value of ($322.91)/((1+0.08)0.25) = $316.76. For this system
to be economically viable, the net return on this unit must be
greater than the annual worth A. This can be calculated by (5),
where P represents initial cost:
If we assume that the required return is 8% and im-
plementation of the test equipment (excluding maintenance
and labor costs) will be for 3 months every year for
the next 4 years, this equates to an annual worth of
($322.91)*((0.8(1+0.8)1)/((1+0.8)1-1))) = $348.74. From this
result, the team inferred that the CHC or MHC facility owners
must find a service of revenue or fund that would be able to
exceed the net costs of this system provide this amount of
return on investment for each year of use.
(5)

22
H. Social Implications
There is also the need for an in-depth analysis of the
cultures and traditions associated with the target consumers
(i.e., hospitals and the parents of the newborn patients). One
of the factors of successful production and distribution of
a product is a well-planned dissemination of technological
information that would be acceptable to communities and their
workplaces. Any conflicts within the target within or near
the target region must be considered (i.e., the India-Pakistan
territorial conflict). In future revisions of this document, an in-
depth explanation will be provided on several possible “cases”
for implementation as well as successful examples that have
been done by other teams or firms in the past.
I. Project Financing
There were three methods for project financing that were
considered for this project. The first was through grants and
institutional funds. Applications for these funds were mostly
dependent upon the time available for the group to apply
for these funds as well as the availability of funds. As of
January 5, 2020, the group had applied for the Resource
Budget Commission proposal funds and did not receive any
funds.
The second option for the group was to obtain fund-
ing through consumable fees which originated from student
project fees (i.e., in OIT tuition). Considering that there are
four members who worked on this project for three terms, there
was a total of $120 available ($10/member per term). A
purchasing request for the SPVR battery was approved by
OIT. This used $106 out of the $120 in available funds. The
team also used the third option of sharing the out-of-pocket
expenses associated with the purchase of the TEC sealing
material, DC thermostat controller, and DC timer relay.
V. CONCLUSION
A. Summary and Reflection
Implementing a PV vaccine refrigeration system that has the
capability to provide power to secondary loads was a central
goal of this project. Despite the lack of funds, the team was
able to develop non-inferior prototype options that would serve
as a means to achieving the ultimate objective – to provide a
mass manufacturable solar powered vaccine cooling system to
support the cold chain infrastructure in Uttar Pradesh, India.
The current version of the SPVR unit has significant limita-
tions resulting from the use of a readily available one hundred-
watt PV module due to economic restrictions. However, further
development of the design and material choices could create
a more robust system that is applicable to a wider range
of developing areas with similar medical needs and climate
conditions.
In terms of testing the SPVR unit, the primary basis for
the 335 Wh supplied to the PV system during the second 48-
hour PV system test was the NREL data for Allahabad for
January as of 2020. This source did not specify whether it
was the total solar radiation for the day or if this was the
peak solar radiation achieved (over a given number of
peak sun hours). There was no data provided on the hourly
solar radiation for the target location. Furthermore, the team
was unable to find detailed, reliable, and credible information
regarding the number of peak sun hours in Allahabad in
January within the time available for this project. The team
was primarily interested in simulating a realistic PV curve
showing the rise and fall of input power (i.e., diurnal solar
conditions). However, the team was only able to find and use
the total sun hours per day and the total daylight period as the
basis of how the solar curve was manually programmed in the
DC SAS Power Supply. When designing the solar curve for
the second 48-hour test, the team made all attempts to balance
the number of peak sun hours while attempting to simulate a
PV curve that roughly approximated a realistic solar curve.
In retrospect, testing this system with different DC SAS pa-
rameters that assumed larger solar panels and battery modules
would have given a wider range of data for the team to analyze
and determine the optimal PV and storage combination. The
main advantage of using a one hundred-watt PV panel was that
the team found the minimum possible component requirements
for an SPVR unit to potentially store vaccines within the
acceptable range of 2-8 ºC for approximately 32 hours based
on the second 48-hour full PV system and load test. In short,
the tests and simulations illustrated that a one hundred-watt
PV system could possibly work, albeit for limited time
applications, in the cold-chain system.
The economic and technical feasibility analysis provided
the team with a clearer idea of the importance of various
factors such as policies, labor needs, and cost constraints when
developing the design for this project. The most indicative
information came from the experimental results of the second
48-hr test, which illustrated the ability of the one hundred-
watt PV module to generate enough current to simultaneously
power the load and recharge the battery for a very limited
period of time. The team had considered performing additional
analysis to substantiate and possibly improve the SPVR system
based upon these findings. However, that was not possible due
to OIT’s appropriate safety measures during the COVID-19
situation. Ultimately, the experimental results serve as a good
basis for achieving a greater understanding of the limitations
of the SPVR system and what must be done to make this
system more feasible for application Uttar Pradesh, India.
B. Areas of Future Research
Considering the numerous project constraints that the team
faced over the course of this project, there are several pathways
for future research that could enhance the stability and feasibil-
ity of the SPVR system in Uttar Pradesh, India. First, obtaining
an in-depth analysis of India’s solar radiation data, sun hours,
and weather data for specific target areas within Uttar Pradesh
would improve the quality of the test parameters and serve
as a basis for potential system deployment in other areas of
Uttar Pradesh, India. In this context, various governmental
and scientific agencies would have to be directly consulted
regarding this information.

23
Another area of future research could focus on the design
and modeling of the SPVR system. A clear upgrade to this
system would be the use of a higher rated PV module and
a battery unit with a larger storage capacity. Economic con-
straints forced the team to work with a 100 W panel, leading
to a deficiency in current for battery, even when testing under
optimal solar conditions. In addition, the 55 amp-hour battery
chosen for this project was the slightly below the minimum,
calculated battery size requirement for one day of autonomy.
Thus, the battery module was unable to provide enough current
for the simulated night-time duration. Considering the limited
time constraints, the team was able to produce a circuit design
of the charge controller – a critical feature of all PV systems.
However, we found many challenges attempting to customize
the voltage and current output to match the characteristics
of the ALLPOWERS charge controller. Additional research
into the circuit layout and charge controller algorithm(s) of
this device could result in a better prediction of system
performance before undergoing any system tests. In terms of
modeling, a more thorough approach to the physical aspects
of designing this system could possibly aid other mechanical
analysis of this system such as thermal and structural stress
testing. Understanding these factors would allow this system
to work in a variety of settings in Uttar Pradesh, India.
In addition, there could be more in-depth research regarding
the selection of materials that were incorporated into the
design of this project. Due to the lack of external funding
sources, the team focused on obtaining materials from the
REE department and searched for cost-effective retail options
in the market. Seeking more avenues of funding in future
expansions of this project would allow the team to obtain
materials and components that have more optimal thermal,
mechanical, and electrical characteristics. For instance, using
a portable compressor-based fridge that could cool its contents
to a specific temperature range without dependence on ambient
temperature would have the potential to increase the annual
duration that this system could be applied in Uttar Pradesh,
India.
There are currently two methods of vaccine storage in the
cold chain system – sustained cooling (using energy storage)
and direct drive systems that purely rely on solar power.
Considering that the goal is to provide relief and development
for the rural medical sector of India, a system that operates
for 24 hours is desirable. Thus, some form of energy storage
would be needed to provide energy during periods of low
solar insolation or night-time hours. Lithium iron phosphate
batteries have a longer cycle life and could possibly serve as
a future alternative to lead acid batteries in terms of power
capacity and energy performance. However, the availability
and cost of materials in Uttar Pradesh, India was a primary
concern the team had to consider. Thus, further research
into higher rated, marine deep-cycle lead acid batteries could
provide more application-related power stability and extended
longevity over standard SLA batteries. Larger loads may
require multiple renewable inputs and large storage systems
such as compressed air or pumped hydro [53][54][57]. Further
considerations for safety such as adding a separate battery
charger switching circuit; fusing between the battery and the
charge controller; and timed load control would benefit the
end-user over the duration of the product lifecycle. Appendix
H has more information about a possible idealized system that
has the potential to benefit the cold-chain system.
One other area of research could focus on materials testing.
Due to time constraints, the team decided to focus on verifying
system component operation before conducting full 24 or 48-
hour full PV system tests. A more detailed characterization of
the electrical and mechanical performance of each component
would lead to a better understanding of how this system would
need to be maintained during implementation in any future
target locations.
Finally, the successful long-term functionality of this tech-
nology, its distribution, and effectiveness in mobile clinics or
community health centers could possibly provide new avenues
for technological and market expansions. As mentioned in the
project technology description section, some possible improve-
ments on the planned technology could include additional
secondary loads such as lighting. More investments could be
made to research more specific, yet common needs of devel-
oping communities. This may involve a detailed study on cost-
effective components with longer functional lifespans (i.e., PV
modules, charge controllers, battery units). For more detailed
information about possible future project directions that could
be pursued from this project please refer to Appendix S.

24
APPENDIX
Appendix A: LTSpice Model and Simulation Result for the SPVR system
Fig. 4: Simplified model of the SPVR charge controller and its electrical connection to the rest of the system. Level of solar irradiation represented by variable current source.
Fig. 5: Current through the SLA battery over a range of input values. The highest value represents solar condition during peak sun hour conditions in Uttar Pradesh, India.
Appendix B: Calculation Tables for PV System Sizing
The calculation tables below show how the PV system sizing was determined. Please note that the numbers colored in blue
represent the input values and the red colored numbers represent the calculated values. The numbers in black are calculated
numbers originating from a previous table in the spreadsheet.

25
TABLE I: Power requirements of the Igloo Cooler and the Temperature Sensor. The power demand of the load is used as the
basis for sizing the PV panels and the battery unit.
TABLE II: Battery sizing calculations for the SPVR system. The results indicate that it would take approx. one, 55 Ah, 12 V
battery unit to have a system autonomy of one day.
TABLE III: PV array sizing calculations for the SPVR system. The results indicate that approximately 8-9, 100 W panels are
needed to power the SPVR system assuming that each of these panels.

26
TABLE IV: Charge controller sizing worksheet calculations for the SPVR system. The results indicate that the controller must
have a max DC amperage rating of at least 3.33 A. The charge controller used could handle up to 20 A.
TABLE V: PV module to charge controller wire sizing worksheet which is based on NEC and AWG wiring standards. The
results indicate that the optimal wire sizing for wires connecting the PV module to the charge controller would be 18 AWG
assuming a component distance of less than 5 feet based on the AWG reference: https://bit.ly/2SDGHz7
TABLE VI: Fuse sizing calculations for the SPVR unit. The results show that there must be a minimum array to controller fuse
rating of 8.98 Amps assuming a 5.75 Amp module short circuit current. The fuse selected for this application was oversized
to be 20 Amps. In addition, the controller to battery/load was sized at 20 Amps. The charge controller already has a built-in
load protection fuse that address this requirement.

27
Appendix C: MATLAB Calculations for PV System Components & Theoretical Power Calculations
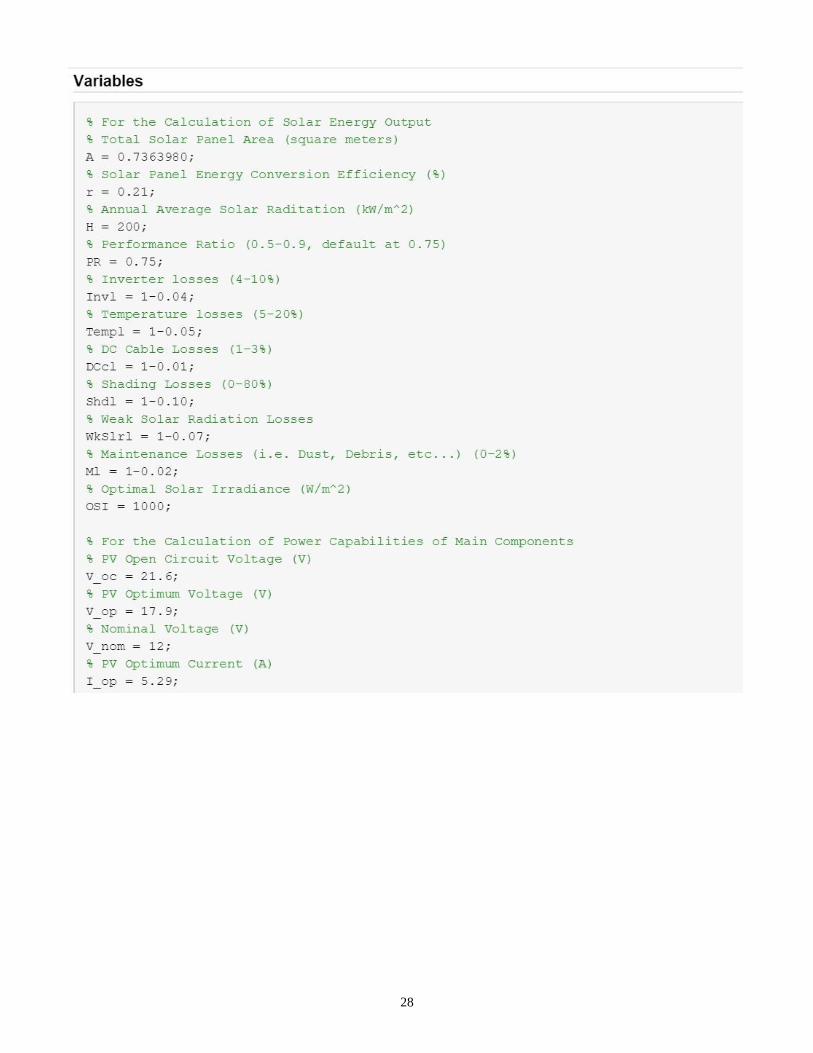
28

29

30

31
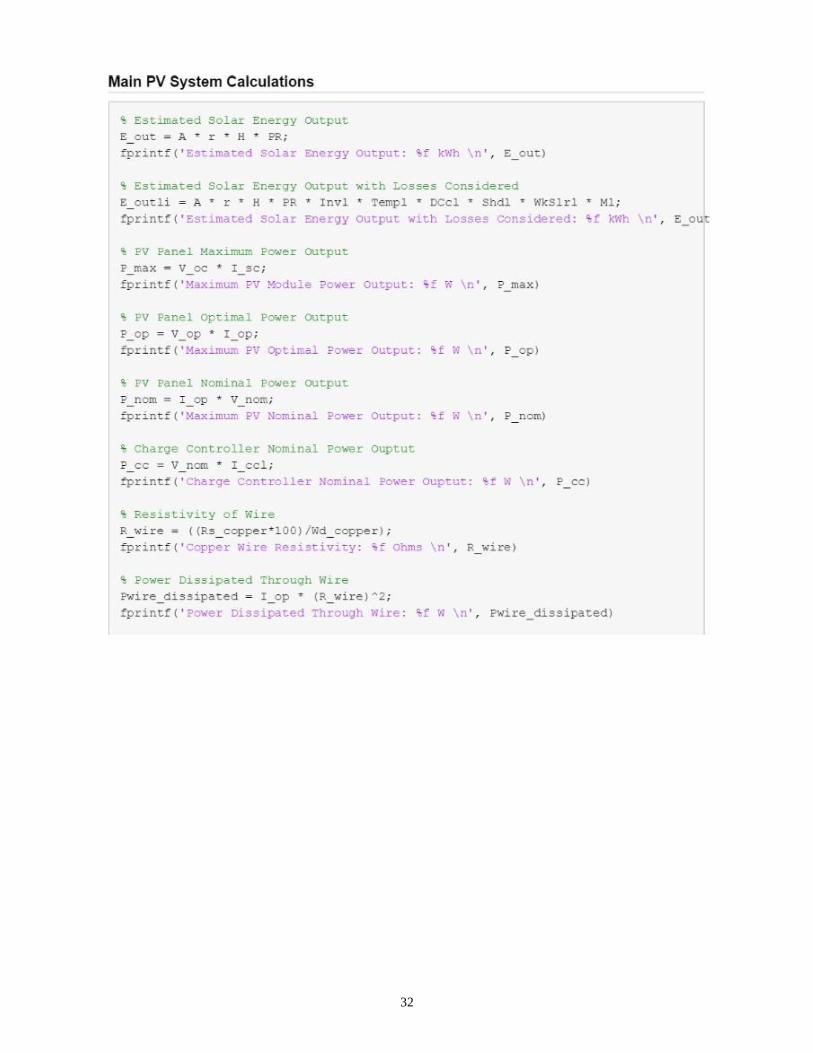
32

33

34

35

36

37

38
Appendix D: Draft Fusion 360 System Modeling
Fig. 6: 3D model of angled frontal view of the PV system trainer that holds the SPVR DC Solar Array Simulator Power Supply, SLA Battery, DC Thermostat Controller, ALLPOWERS Charge Controller, Fusebox, and Load connection ports.

39
Fig. 7: 3D model of left side view of the PV system trainer for the SPVR unit.

40
Fig. 8: 3D model showing angled, upper view of PV system trainer for the SPVR unit.

41
Fig. 9: 3D model showing rear PV system trainer for the SPVR unit. The back panel contains fuses, charge controller, DIN rails, load connection ports.

42
Fig. 10: Close-up of the back panel of PV system trainer for the SPVR unit.

43
Fig. 11: 3D model of Igloo Thermoelectric Cooler Unit from a front-edge angled view. The surface area of this unit is approx. 0.786 m2.
Fig. 12: 3D model of Igloo Thermoelectric Cooler from a top-down, side-edge angled view.

44
Fig. 13: 3D model of Igloo Thermoelectric Cooler from a back edge angled view.

45
Appendix E: SPVR System Physical Wiring Diagram
Fig. 14: Physical wiring connection schematic for the SPVR unit. Please note that the Oregon Tech power lab’s microgrid building ground connection was used in place of a grounding rod.

46
Appendix F: Tiered BOMs Tables for the RBC Proposal
BOM Tables are listed in order of decreasing project cost. Please note that the materials listed in Tier 4 have been basis for
the ideal design and feasibility analysis.
TABLE VII: Tier 4 RBC proposal bill of materials (i.e., used when the team was applying for Oregon Tech-based funding for
this project) which includes the ideal system components for a robust solar-powered vaccine refrigeration unit.
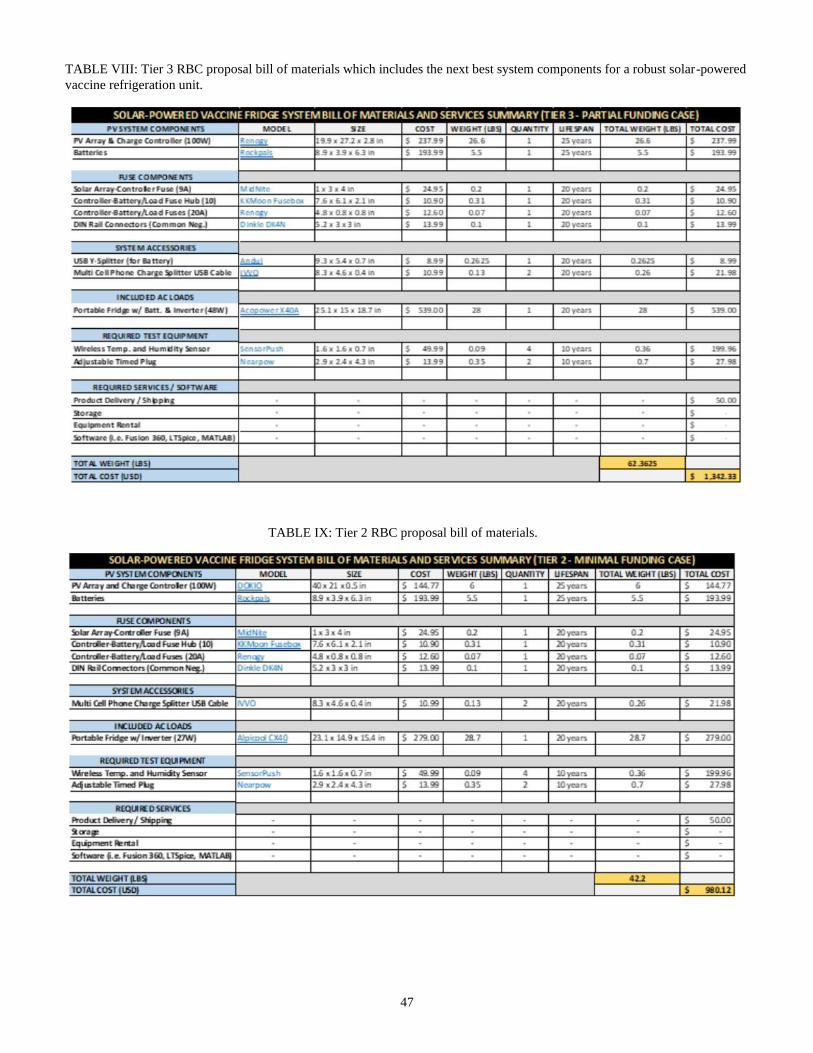
47
TABLE VIII: Tier 3 RBC proposal bill of materials which includes the next best system components for a robust solar-powered
vaccine refrigeration unit.
TABLE IX: Tier 2 RBC proposal bill of materials.

48
TABLE X: Tier 1 of the RBC proposal bill of materials (no funding option). Please note that ultimately the team was able to
contribute a small amount of out-of-pocket expenses; acquire limited funding from Oregon Tech’s Student Project Fees (FEGP)
fund; and use donated materials from OIT and Richard Ellis which made the build and test phase of this project possible.
TABLE XI: Tier 4 RBC Proposal Bill of Materials list which complied with UL Safety Standards.
Appendix G: Project Bill of Materials

49

50
Appendix H: Possible Idealized System
Materials
The design for the project consists of several primary components, namely: solar panel, battery storage, and the charge controller.
The system was designed under the assumption that refrigeration unit would need an average power of 384 Wh/day based on
the ideal refrigeration unit, the ACOPower R40A Portable Solar Fridge.
Refrigeration
Most market freezers are based on using a compressor and a refrigerant liquid to keep the interior of the cooler at temperature.
This technology is commonplace throughout the world and has seen widespread success being deployed and used in the cold
chain which is important when it comes to maintenance and operation. The drawback to a compressor system is the increased
power draw but this is offset but the increased stability of the internal temperature which is crucial for vaccine storage. Given
these tradeoffs, an ACOPower R40A Portable Solar Fridge (Fig. 15) was chosen as the ideal unit to transport polio vaccines
in northern India [58].

51
Fig. 15: ACOPower R40A Potable Solar Fridge which has superior cooling characteristics compared to the Igloo Iceless Thermoelectric Cooler used for the SPVR unit.
This fridge was chosen due to the size, portability, and efficiency in maintaining internal temperature which would all be
beneficial for deployment to Uttar Pradesh (Fig. 16).
Fig. 16: Map highlighting the area of Uttar Pradesh. (Source: Google Maps)
Battery
A battery storage system is required in a PV array when there is a need for continuous power. If the solar array is not producing
electricity (nighttime hours and rainy days) there needs to be suitable energy storage to power the fridge. Due to load size and
limitations on portability, a single day of autonomy was chosen for the system. This reduces the number of batteries that must
be carried and the size of the solar array required. For these reasons, a ReLion RB35 12 V 35 Ah Lithium-Iron Phosphate
battery was chosen (Fig. 17). One of the benefits of this lithium battery is that the phosphate replaces cobalt in a typical
lithium cell, reducing the toxicity of the battery in the case of improper disposal [59]. These health risks have been noted
in NHFS-4 (National Family Health Survey) report conducted by the Indian government [60]. Lithium batteries are known
for higher energy density than typical Lead Acid which allows similar capacity at a reduced weight. The total weight of the
battery is 9.9 lb (4.5 kg), with a nominal voltage of 12.8 V [61].

52
Fig. 17: RELion RB35 lithium iron phosphate battery.
Solar Panel
To power the load and to charge the batteries, the Renogy 200 W Foldable Solar Panel was chosen due to the packability
of the system (Fig. 18) [62]. The foldable design allows for the system to be deployed and stored with ease and allows the
system to stay mobile. Given a daily average of 4.2 peak-sun hours in Uttar Pradesh during the month of January (the lowest
peak sun month) the 200 W module should be able to operate at full capacity and produce 840 Wh/day. These calculations
assume an ideal tilt and zero sky cover.
Fig. 18: Renogy 200 W Foldable Solar Panel.
Charge Controller
The central unit between the load, battery, and array is the charge controller. This device acts to balance the system and to
prevent reverse current flow from the battery to the solar panel. Charge controllers come in two primary types: Pulse Width
Modulation (PWM) and Max Power Point Transfer (MPPT). MPPTs are the modern standard and offer several benefits over
the PWM style devices such as being able to change the voltage output of the panel to maximize the power being produced
by the array and charge the battery more efficiently. The charge controller also acts to balance the system so the load (fridge)
can be powered at the same time the battery is being charge allowing for uninterrupted service. A GenaSun 14.2 V MPPT
Solar Charge Controller was chosen to provide optimum charging to the battery and being designed specifically for lithium
iron phosphate batteries [63]. The charge controller has a high efficiency (98.3%) and a small footprint to keep the system
portable.

53
Fig. 19: GenaSun GV-10 Lithium Iron Phosphate MPPT Solar Charge Controller.
Design Considerations
In future renditions of the SPVR unit, the solar generation and energy storage capacity of this system could possibly be
expanded to account for variations in the solar radiation in Uttar Pradesh. According to the PV system calculations it would
take approximately eight 100 W panels (assuming 5.72 peak amps/module) to charge a 55 Ah battery with one day of autonomy.
A possible future system may include four 200 W PV panels which could recharge four, 12 V, 35 Ah Lithium batteries which
would allow the SPVR unit to have approximately 2 days of autonomy. However, future designs must consider that including
more generation and storage capacity would results in a higher overall system weight, size, and cost.
Appendix I: PV System Photos
Fig. 20: Igloo Iceless Thermoelectric Cooler with the vaccine vials and thermal mass (i.e., water battles) in place. The position of the water bottles conforms to the CDC standards for refrigerated vaccines and the standards for packing vaccines for transport in emergency situations.
Fig. 21: Top-down view of plastic basket that holds the vaccine vials. Beneath this container is a row of five water bottles that act as the thermal mass (for the lower portion of the cooler).

54
Fig. 22: Complete SPVR unit while the second 48-hour system test was in progress.

55
Appendix J: Table of Parameters Tested for the Experiment
TABLE XII: Summary of variables and parameters that the team focused on testing for this project.
Appendix K: Basis for the Second 48-Hour Test DC SAS Parameters
Given: The solar radiation for a particular location is (3350 Wh/m2)/day. A solar panel that is 0.736 square meters and is
rated at 100 Wh (peak output) is used. Assume that the peak solar radiation under ideal conditions to be 1000 Wh/m2.
Find: The energy output per day in (Wh/day) for this solar panel.
Solution Approach
(455 Wh/m2)/day assumes that 13.95% (of the locational solar radiation) is the hypothetical value if the solar panel itself
had 1 square meter (of solar cells). The panel is rated at 100 W, under peak conditions of 100 Wh/m2, the energy output is
100 W or 10%. 10% of 3350 W is 335 W.
In the first calculation below, the team multiplied the solar radiation of Allahabad with 13.95% or ((135.9 Wh/m2)/(1000
Wh/m2)). Then, the team multiplied this value with the area of the solar panel which tailors the calculation specifically to the
size of the solar panel. This also cancels the sq. meters term.
If we want this result to be in terms of W/day, we must include the conversion (1 day/1 hour) assuming that all the solar
radiation of the day was placed in one hour. This cancels the (h) and (day) units to provide W/day.

56
Solution: The solar panel’s energy output would be 335 Wh/day or 335 W/day. Fig. 23 shows the programming approach for
the DC SAS PS.
Fig. 23: Planned power input program for the DC SAS Power Supply for second 48-hour test. Please note that the position of the time marks on the x-axis are not to scale.
Given:
100-Watt Panel
18.9 V (Optimal)
5.29 A (Optimal)
Assumptions:
335 Watts per Day
Graph Information:
- Values in parenthesis are the total Watts in that interval of time
- Values not in parentheses are the wattage outputs of the panel during that time interval
- The total area of the bar graph is equal to the total power output of the panel per day
- The suggested voltages and amperage for each bar could be:
100 W (18.9 V, 5.29 A)
50 W (13.36 V, 3.74 A)
40 W (11.95 V, 3.35 A)
15 W (7.32 V, 2.05 A)
10 W (5.98 V, 1.67 A)
- The voltages and currents were based on the formulae:
where x is a constant and P is the desired power output.

57
Appendix L: Estimated Dimensions of Selected Main PV System Components
Fig. 24: Fusion 360-generated drawing of the ALLPOWERS charge controller used in all full-SPVR system tests.

58
Fig. 25: Fusion 360-generated drawing of ExpertPower, 55 Ah, 12 V battery unit used for battery discharge and all full-SPVR system tests.

59
Fig. 26: Fusion 360-generated drawing of the Igloo Iceless 28-quart Thermoelectric Cooler. Please note that the dimensions of the cooler are inaccurate by approx. 3 in due to the challenges faced in modeling the curved edges of this unit to match the actual product specifications.
The actual dimensional information of the TEC unit (shown in Fig. 37) is provided below for reference:
– Length 19.12 in
– Width 13.25 in
– Height 18.31 in
– Link https://www.walmart.com/ip/Igloo-28-Qt-Iceless-Cooler-in-Silver/34053000
Appendix M: Project Testing Procedures
LOAD TEST I – PRELIMINARY TEMPERATURE AND HUMIDITY MEASUREMENTS
1. Check the physical condition of the fridge and connections.
2. Set up the PUSH temperature sensors on the upper and lower portions of the cooler and connect them to the phone.
3. Place two Fluke 289 meters to record the heat sink temperature and the temperature at the side of the cooler.
4. Place an emergency ambient temperature sensor near the cooler.
5. Close the cooler lid and make sure that it is firmly shut.
6. Review the relevant LOTO and re-energization procedures outlined in the Safety Binder.
7. Plug the Igloo cooler to the AC thermostat controller using the DC adapter provided.
8. Plug the AC Thermostat Controller into the wall outlet.
9. Set the AC thermostat controller between 2°-8 °C.
10. Record the initial temperature and humidity readings of all sensors.
11. Record all temperature and humidity readings every 15 minutes for approximately 8-9 hours.
12. Take photos of the setup.
13. Remove the power cord to the fridge.
14. Remove the AC thermostat controller from the wall output and leave the PUSH sensors in the cooler for Load Test II.
15. Follow the relevant LOTO and de-energization procedures outlined in the Safety Binder

60
16. Complete and file safety checklists.
LOAD TEST II – TEMPERATURE, HUMIDITY, and AC POWER DRAW (WITH THERMAL MASS)
1. Check the physical condition of the fridge and connections.
2. Set up the two FLUKE 289 temperature sensors on the upper and lower portions inside the cooler.
3. Place two PUSH sensors to record the heat sink temperature and the ambient temperature one foot from the side of the
cooler with the heat sink. Ensure connection to a phone.
4. Place an emergency ambient temperature sensor near the cooler.
5. Close the cooler lid and make sure that it is firmly shut.
6. Review the relevant LOTO and re-energization procedures outlined in the Safety Binder.
7. Plug the AC Thermostat Controller into the wall outlet.
8. 8. Note where the temperature remained consistent during Load Test I and use this at the low point (LP) for the AC
thermostat controller setting.
9. Set the AC thermostat controller between (LP Value) - 8 °C.
10. Record the initial temperature and humidity readings of all sensors.
11. Plug the Igloo cooler to the power meter.
12. Plug the power meter to the AC thermostat controller using the DC adapter provided.
13. Record all temperature and humidity sensor readings every 15 minutes for 8-9 hours or until a stable temperature has
been reached by the cooler for approximately 1 hour.
i. When the temperature of the cooler has reached 8 °C, place the thermal mass (30-35 frozen vaccine vials and 4 frozen
water bottles) into the fridge.
14. Take photos of the interior and exterior of the setup.
15. Remove the power cord to the fridge.
16. Remove the AC thermostat controller from the wall output and leave the PUSH sensors in the fridge for Load Test III.
17. Follow the relevant LOTO and de-energization procedures outlined in the Safety Binder
18. Complete and file safety checklists.
LOAD TEST III – TEMPERATURE, HUMIDITY, and AC POWER DRAW (WITH THERMAL MASS): SIMULATED
APPLICATION OF VACCINE COOLING
PART I: VACCINE VIAL PREPARATION
1. Measure and record the weight of one vaccine vial.
2. Fill a 250 ml beaker with tap water.
3. Add 20 g of salt and mix for 30 seconds.
4. Add 20 ml to water to 15 glass vials.
5. Repeat steps 2-4 until 40-45 glass vials have been filled.
6. Label all the glass vials with water with the following information.
i. Abbreviated Name of Capstone Project
ii. Class Name (ENGR 465)
iii. Contents of the Vial
iv. Contact Information
7. Obtain and fill 10 water bottles with 500 ml of water.
8. Label all the water bottles with the following information.
i. Abbreviated Name of Capstone Project
ii. Class Name (ENGR 465)
iii. Contents of the Bottle
9. Fill and 8 liquid-storage containers that are 200 ml or larger.
10. Label all the containers with the following information.
i. Abbreviated Name of Capstone Project
ii. Class Name (ENGR 465)
iii. Contents of the Bottle
11. Take photos of all vials and water containers.
12. Store all vials and water bottles in a refrigerator at least 24 hours before Part II.
13. Take photos of the storage space (of the refrigerator).
14. Obtain the following dimensional measurements for the cooler.
i. Thickness of cooler walls, cover, and cooling unit

61
ii. Length and Width of bottom & top portion of the cooler
15. Take photos of the cooler and label the cooler with the measured dimensions.
16. Build a Vaccine Rack with the following characteristics
i. Must be able to stack on top of water bottles that are horizontally positioned
ii. Must be capable of having water bottles stacked on top of the rack
PART II: MEASUREMENT EQUIPMENT PREPARATION
1. Check the physical condition of the fridge and connections.
2. Place an adhesive foam seal on the bottom rim of the fridge and create small slits to allow for the passage of the wires
in the front.
3. Set up the two FLUKE 289 temperature sensors on the upper internal portion, lower internal portion, and heat sink of
the cooler. Make sure that one of the sensors is dedicated for the vaccine vials.
i. Ensure that all wires coming out of the cooler must exit the front of the cooler (and not near any hinge).
4. Place two PUSH sensors to record the heat sink temperature and the temperature at exactly 12 inches from the side of
the cooler.
i. Ensure Wi-Fi/Bluetooth connection to a phone with the PUSH sensor application.
5. Place an emergency ambient temperature sensor near the cooler.
6. Set up the sensor of the AC Thermostat Controller and ensure that the probe wire comes out of the front portion of the
cooler.
7. Take photos of the interior and exterior setup.
PART III: COOLER PREPARATION
1. Close the cooler lid and make sure that it is firmly shut.
2. Review the relevant LOTO and re-energization procedures outlined in the Safety Binder.
3. Plug the AC Thermostat Controller into the wall outlet.
4. Set the AC thermostat controller to –10 °C to force the cooler to continuously work.
5. Record the initial temperature and humidity readings of all sensors.
6. Plug the Igloo cooler to the power meter. Make sure that the cooler is connected firmly into the AC power adapter.
7. Place 8 of the frozen water containers in the cooler.
8. Record all temperature and humidity sensor readings every 15 minutes for a set period decided by the group. This time
period will be determined by the temperature trends for the cooler.
9. When the temperature of the top and bottom portions of the cooler are at (or below) 8 °C, take photos of the exterior
setup and proceed to Part IV.
PART IV: THERMAL MASS INCLUSION AND MEASUREMENT
1. Prepare and agree on which member of the group will execute the following tasks:
i. Opening and closing the fridge
ii. Preparing the Vaccine Rack
iii. Placing of water bottles
2. The following tasks below should be done within the span of 5 minutes.
3. Obtain the refrigerated vials and water bottles.
4. Place 40-45 vaccine vials in the container and take a photo of the setup.
5. Place 5 of the 500 ml water bottles on the bottom of the fridge and take a photo.
6. Place the vaccine vial rack on top of the water bottles and take a photo
7. Place the other 5 of the 500 ml water bottles on the top of the vial rack and take a photo of the setup.
8. Close the cooler door and ensure that it is shut.
9. Record all temperature and humidity sensor readings every 15 minutes for 24 Hours.
10. Take photos of the setup.
11. Once the temperature and power measurements have been obtained, be sure to remove the power cord to the fridge.
12. Remove the AC thermostat controller from the wall output and extract the PUSH sensors (unless they will be used for
another test).
13. Follow LOTO and de-energization procedures outlined in the Safety Binder.
14. Complete and file safety checklists.

62
BATTERY DISCHARGE TESTING 1 - USING DC SIMULATED POWER SUPPLY ONLY
1. Ensure that there are no connections to the terminals of the battery
2. Ensure that the battery is charged to the nominal battery voltage level (at float charge).
3. Connect the Fluke 289 (set to measure Voltage) in parallel to the terminals of the battery.
4. Connect the terminals of the DC Load Simulator to the proper terminals of the battery.
5. Set the DC Load Simulator to consume V = 12 V and I = 4.8 A (simulating the rated nominal high-power consumption
of an Igloo 28-quart cooler).
6. Follow LOTO and re-energization procedures as outlined in the Safety Binder before activating the DC Load Simulator.
7. Take photos of the setup.
8. Check the voltage level on the Charge Controller 3-5 times in a 24-hour period to see whether the battery has reached
the maximum depth of discharge (or approximately 10.8 Volts).
9. Once the charge controller shuts off or reaches the lowest recommended DOD, turn off the DC Load Simulator.
10. Follow LOTO and de-energization procedures outlined in the Safety Binder.
11. Complete and file safety checklists.
12. Recharge the battery using the Duracell Battery Recharger.
PV SYSTEM and LOAD PERFORMANCE TESTING GUIDE – USING DC SIMULATED SOLAR POWER SUPPLY ONLY
This will be the procedure that will be used for all full PV system tests.
1. Ensure that all PV system connections are correctly placed.
2. Ensure that the PV module is connected correctly to the controller.
3. Ensure that the DC thermostat controller is connected correctly to the load port. Set the operating temperature range to 2°-
8 °C.
4. Ensure that the battery is connected correctly to the charge controller.
5. Verify that the charge controller is functioning and set the charge controller to have a low voltage disconnect of 11.6
Volts.
6. Check the physical condition of the fridge and connections.
7. Set up three Fluke 289 sensors in the following positions:
a. Battery Voltage (i.e., parallel connection with battery)
b. Input Current to Cooler (i.e., in series with the DC power port of the cooler)
c. Vaccine-level of the cooler
8. Set the sensors to record for a 24 or 48-hour period depending on the type of test.
9. Review the LOTO and re-energization procedures outlined in the Safety Binder.
10. Set the DC simulated solar power supply to use the preset PV SIM CURVE or program a PV curve as required by the
project testing parameters.
a. Prepare and agree on which member of the group will execute the following tasks:
i. Opening and closing the fridge
ii. Preparing the Vaccine Rack
iii. Placing of water bottles
b. The following tasks below should be done within the span of 5 minutes.
c. Obtain the refrigerated vials and water bottles.
d. Place 40-45 vaccine vials in the container and take a photo of the setup.
e. Place five of the 500 ml water bottles on the bottom of the fridge and take a photo.
f. Place the vaccine vial rack on top of the water bottles and take a photo.
g. Place the other five 500 ml water bottles on the top of the vial rack and take a photo of the setup.
h. Close the cooler door and ensure that it is shut.
11. Take photos of the setup.
12. Set the DC simulator solar power supply to the ON status.
13. Start the recording for the Fluke 289 sensors and monitor the following items for the set duration of the test (24-hours
or 48-hours)
a. Temperature and Humidity of the Fridge 3-5 times per day (e.g. 8am, 12pm, 4pm) according to the CDC Vaccine
Storage and Handling Toolkit guide (https://bit.ly/2RxOKM9).
b. Voltage and Current Readings (stored electronically through the power logger)
c. Visual checks on system performance – heat, sound, safety checks (i.e., when any available group members have the
chance to check the system). These checks must be carried out at least 3-5 times during the duration of the test.
14. Once all recording objectives have been completed, turn OFF the DC simulated solar power supply and the Fluke 289
devices.

63
15. Follow the relevant LOTO and de-energization procedures outlined in the Safety Binder.
16. Complete and file safety checklists.
Appendix N: Project Testing Parameters
TABLE XIII: Parameter list for the first load test performed on the thermoelectric cooler.
TABLE XIV: Parameter list for the second load test performed on the thermoelectric cooler.

64
TABLE XV: Parameter list for the third load test performed on the thermoelectric cooler.

65
TABLE XVI: Parameter list for the battery discharge test.
TABLE XVII: Parameter list for the 24-hour full SPVR system test.

66
TABLE XVIII: Parameter list for the first 48-hour full SPVR system test.

67
TABLE XIX: Parameter list for the second 48-hour full SPVR system test.
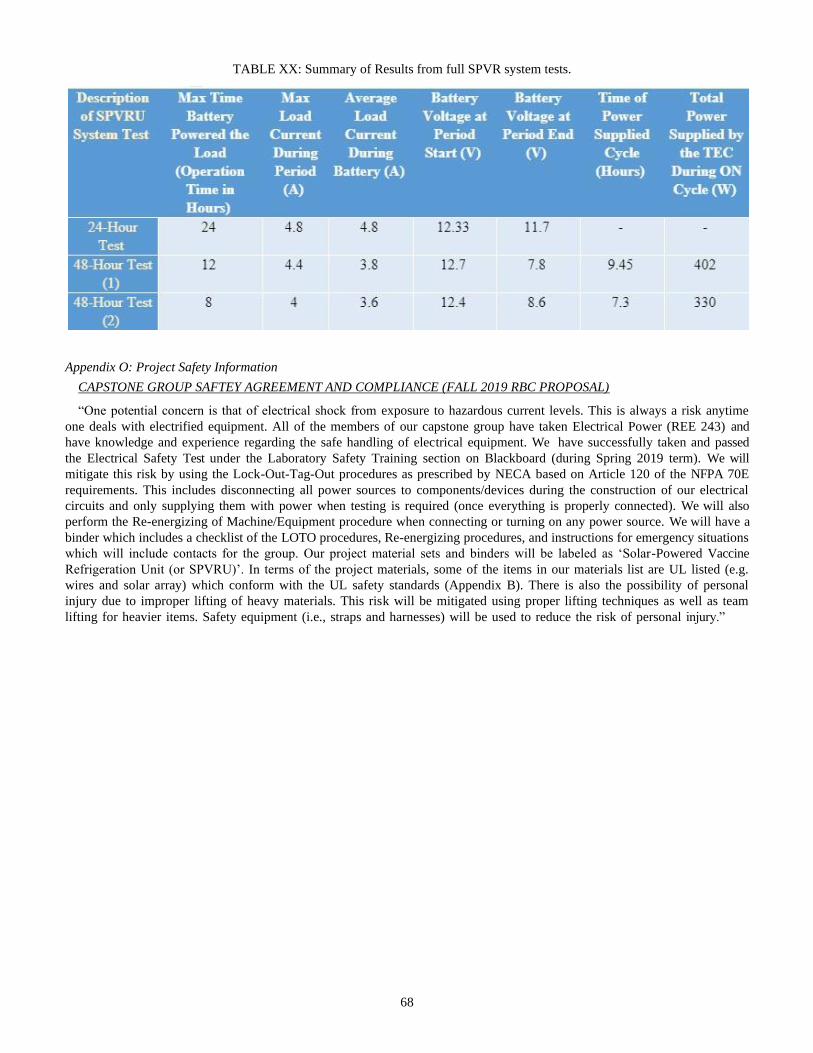
68
TABLE XX: Summary of Results from full SPVR system tests.
Appendix O: Project Safety Information
CAPSTONE GROUP SAFTEY AGREEMENT AND COMPLIANCE (FALL 2019 RBC PROPOSAL)
“One potential concern is that of electrical shock from exposure to hazardous current levels. This is always a risk anytime
one deals with electrified equipment. All of the members of our capstone group have taken Electrical Power (REE 243) and
have knowledge and experience regarding the safe handling of electrical equipment. We have successfully taken and passed
the Electrical Safety Test under the Laboratory Safety Training section on Blackboard (during Spring 2019 term). We will
mitigate this risk by using the Lock-Out-Tag-Out procedures as prescribed by NECA based on Article 120 of the NFPA 70E
requirements. This includes disconnecting all power sources to components/devices during the construction of our electrical
circuits and only supplying them with power when testing is required (once everything is properly connected). We will also
perform the Re-energizing of Machine/Equipment procedure when connecting or turning on any power source. We will have a
binder which includes a checklist of the LOTO procedures, Re-energizing procedures, and instructions for emergency situations
which will include contacts for the group. Our project material sets and binders will be labeled as ‘Solar-Powered Vaccine
Refrigeration Unit (or SPVRU)’. In terms of the project materials, some of the items in our materials list are UL listed (e.g.
wires and solar array) which conform with the UL safety standards (Appendix B). There is also the possibility of personal
injury due to improper lifting of heavy materials. This risk will be mitigated using proper lifting techniques as well as team
lifting for heavier items. Safety equipment (i.e., straps and harnesses) will be used to reduce the risk of personal injury.”

69
Appendix P: Fusion 360 Cooler Modeling and Thermal Simulation Results
Fig. 27: Cross section of the thermoelectric cooler. From left to right: polypropylene exterior, polyurethane foam, polypropylene interior.
Fig. 28: Thermal simulation (Load 1) showing magnitude of heat flux through exterior wall of cooler assuming indoor temperature conditions.

70
Fig. 29: Thermal simulation (Load 2) showing magnitude of heat flux through exterior walls of cooler assuming maximum ambient operating temperature conditions.
Appendix Q: Graphical Results for Load Tests, Battery Tests, and Full SPVR System Tests
Fig. 30: PUSH sensor temperature measurements for interior ceiling of thermoelectric cooler for load tests 1-3.
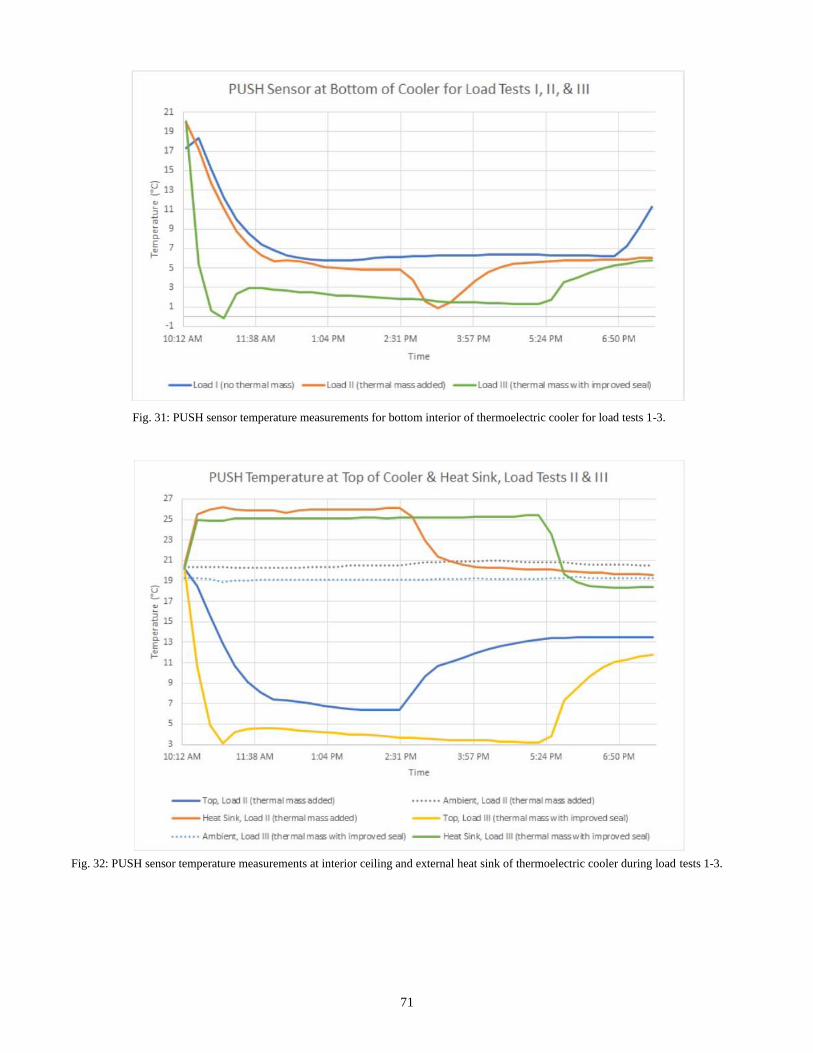
71
Fig. 31: PUSH sensor temperature measurements for bottom interior of thermoelectric cooler for load tests 1-3.
Fig. 32: PUSH sensor temperature measurements at interior ceiling and external heat sink of thermoelectric cooler during load tests 1-3.

72
Fig. 33: Fluke 289 Thermocouple Temperature Sensor measurements at the interior ceiling of thermoelectric cooler for load tests 2 and 3.
Fig. 34: Fluke 289 Thermocouple Temperature Sensor measurements at the bottom of thermoelectric cooler for load tests 2 and 3.

73
Fig. 35: Fluke 289 Thermocouple Temperature Sensor measurements for interior ceiling and external heat sink of the cooler for load test 3.
Fig. 36: Fluke 289 Thermocouple Temperature Sensor measurements for vaccine vials and top interior and bottom interior of thermoelectric cooler for load test 3.

74
Fig. 37: Fluke 289 Thermocouple Temperature Sensor measurements for the voltage of the battery, temperature of the vaccine vials, and current supplied to the thermoelectric cooler for the 24-hour full SPVR system test. Please note that the input DC power from the DC SAS Power Supply was set at a pre-programmed mode to following the EN50530 testing standards.
Fig. 38: Fluke 289 Thermocouple Temperature Sensor measurements for the voltage of the battery, temperature of the vaccine vials, and current supplied to the thermoelectric cooler for the first 48-hour full-PV system test.

75
Fig. 39: Fluke 289 Thermocouple Temperature Sensor measurements for the vaccine vial temperatures for the first and second 48-hour full-PV system tests.
Appendix R: Extra Graphical Results for Load Test II
Fig. 40: PUSH temperature sensors and Fluke 289 Thermocouple Temperature Sensor measurements for the bottom of the thermoelectric cooler for load test 2.

76
Fig. 41: PUSH temperature sensors and Fluke 289 Thermocouple Temperature Sensor measurements for the top interior portion of the thermoelectric cooler for load test 2.
Fig. 42: PUSH temperature sensors and Fluke 289 Thermocouple Temperature Sensor measurements for the ambient temperature during load test 2.

77
Fig. 43: PUSH temperature sensors and Fluke 289 Thermocouple Temperature Sensor measurements for the heat sink of the thermoelectric cooler during load test 2.
Fig. 44: PUSH temperature sensors and Fluke 289 Thermocouple Temperature Sensor measurements for the bottom interior of thermoelectric cooler during load test 2.
Appendix S: Possible Future Project Directions Stemming from this SPVR Project
1. Testing system with High-Quality, Lightweight Monocrystalline or Polycrystalline PV Panels Versus a DC Simulated
Solar Array Power Supply
a. Description of Idea: Sizing the PV Panel for the current system used in this project (based on the solar radiation of
Portland, Oregon) and testing the viability of this system here would be one of the major goals for this type of project.
Considering that Oregon has a significantly lower solar radiation value compared to Uttar Pradesh, India, the success

78
of these tests would increase the possibility that this system would be able to handle the solar conditions of Allahabad,
India.
b. Aspect of Improvement (based on this project): This provides a more realistic idea of how the system will perform
using actual solar conditions instead of replication of a solar curve using a DC SAS Power Supply. However, the DC
SAS would still be needed as a comparison, but not as a basis for the implementation of this technology.
2. Developing an SPVR System Using Ideal Components
a. Description of Idea: In the team’s RBC proposal, we sized and specified a specific set of components, materials, and
accessories that would provide large vaccine storage space; two battery systems to support refrigeration; extra energy
storage to accommodate secondary loads (such as cell phone charging); a communication unit; ease of travel; and more
days of system autonomy.
b. Aspect of Improvement: Using materials and components that are closer to the actual build for Uttar Pradesh would
give future capstone teams a better idea on how to address the issues and challenges involved with implementing a
more robust system.
3. Further Research into the Solar and Climate Data of Uttar Pradesh, India
a. Description of Idea: Having more detailed information regarding the hourly solar radiation, weather patterns, and climate
during the optimal operation months for this technology allows for better simulation parameter settings for the DC SAS
Power Supply and a better selection of solar PV panels.
b. Aspect of Improvement: Further technologies (for future projects) could be researched and developed to use devices to
optimize solar energy capture or integrate other renewable systems. For example, more efficient or customizable charge
controller units could be built specifically for medical application purposes.
4. SPVR System Modeling
a. Description of Idea: More detailed modeling of the SPVR system in terms of mechanical stability; physical build;
thermal stability (with TEC operation included in the analysis); as well temperature impact on energy consumption
would be beneficial for creating a more accurate prediction of how the TEC would operate in Uttar Pradesh. Computer
simulations should account for the actual design and materials used for the build.
b. Aspect of Improvement: Improved system modeling would allow for better comparisons between empirical tests and
computer simulated data
5. Expanded System Testing Parameters
a. Description of Idea: Performing comprehensive tests on various system parameters and components such as solar
panel tilt angle, insulation type, battery type, wire resistance would provide future project teams with a more detailed
characterization of the system.
b. Aspect of Improvement: More comprehensive tests that take all parameters into account would provide a better
understanding of the limitations of implementing this system in the cold-chain infrastructure of Uttar Pradesh, India.
6. Expanded Economic Feasibility for Implementation
a. Description of Idea: The implementation of this project in Uttar Pradesh, India could see a higher rate of success if it
benefits the local economies in that region.
b. Aspect of Improvement: Determining the medical needs and key electronic/electrical-related necessities of Uttar Pradesh,
India would serve as a means to understanding what type of technologies to incorporate with the SPVR unit that would
make it more convincing for local medical facilities to use.
7. Energy Efficiency of Off-Grid RE-based Vaccine Refrigeration
a. Description of Idea: Determining the technologies or improvements to existing technologies that could be developed
to conserve energy for medical vaccine refrigerators could be the means to the development of a more compact and
robust SPVR system. Research could also be made on how to extend the lifespan of RE systems for rugged conditions
(i.e., cold-chain transportation in rural communities).
b. Aspect of Improvement: Analysis and measurements that focus on energy consumption and usage statistics for solar-
powered vaccine cooling systems could serve as the basis for projects that aim to improve the autonomy and durability
of such systems.
8. Modularization, Replacements, and Manufacturability of the SPVR System
a. Description of Idea: Once a more robust SPVR system has been developed, tested, and simulated for application in
Uttar Pradesh, India, finding ways to make the system easy to set up, move, replace, and manufacture would be one
of the future steps to expand the viability of this system in rural areas of India and other developing countries.
b. Aspect of Improvement: Projects that focus on modularizing the build and making this system easily updatable &
customizable for different conditions (I.e., in underdeveloped countries) could possibly support the wide-spread use of

79
this system.
9. Creation of Housing/Case for Electrical Components of SPVR System
a. Description of Idea: This relates to the modularization idea where the prototype system is designed for easy access to
electrical components. Future students could design and build a case to enclose the principal electronic components of
the system.
b. Aspect of improvement: Creating an enclosure would give a better sense of the space needed by the SPVR in cold-chain
transport vehicles and community health centers.
10. Research and Development to Expand the SPVR System to a Multi-Purpose Medical Unit
a. Description of Idea: If there is sufficient support for further development and refinement of the SPVR technology, further
research could be done to expand the use of this system to other medical applications such as immediate response and
relief efforts around the world (e.g. cooling units for food and medical supplies for areas affected by natural disasters
such as Hurricane Katrina).
b. Aspect of improvement: Research, development, and testing that is focused on expanding the operational range and
capability of the ideal SPVR system for global relief applications for both developed and developing countries could
possibly support the widespread use of this system.

80
ACKNOWLEDGEMENTS
Generous thanks are owed to Dr. Hope Corsair (EERE
Department Chair) who provided the team with crucial advice
and support that were instrumental in the successful comple-
tion of this project. We are very grateful to Richard Ellis
(Instrument Technologist I) for providing us with the measur-
ing equipment, PV trainer system, and considerable technical
knowledge. The critical development milestones of this project
would not have been possible without his assistance. We would
also like to thank Thomas Bridges (EE Student) for providing
insight regarding the LTspice simulation for the team’s charge
controller circuit diagram. We are also grateful for the help of
Connor Backlund (Office Specialist 2) and Dr. Lara Pracht
(Director of Academic Affairs) for expediting the ordering
process for the battery unit of this project. We appreciate Dr.
Torres Garibay (EERE Associate Professor) for her thoughts
which contributed to the team’s decision on how to program
the PV Power Curve for the BK Precision power supply during
experimental testing. We are also grateful to Bear Bowen from
Fluke Corporation who was very helpful in providing us with
the necessary Fluke Connect software to upload the data from
the Fluke 289 sensors. Finally, we would also like to thank
Kevin Henderson (EERE graduate) for providing his thoughts,
feedback, and encouragement regarding the initial ideas and
formation of this capstone project.
REFERENCES
[1] Godrej Sure Chill Technology, “Vaccine Storage Is a Key to Effective Prevention against Diseases in Hospitals.” Godrej, Godrej Appliances. Available: http://webcache.googleusercontent.com/search?q=cache:http: //www.godrejappliances.com/medical/HospitalsBlog.aspx.
[2] Tripathi, Bhasker. “India Getting Basic Vaccines to More Children but Trails Other Emerging Nations.” IndiaSpend, 14 Oct. 2019. Avaiable: https://www.indiaspend.com/india-getting-basic-vaccines-to- more-children-but-trails-other-emerging-nations-45209/.
[3] Gurnani, Vandana, et al. “Improving Vaccination Coverage in India: Lessons from Intensified Mission Indradhanush, a Cross-Sectoral Sys- tems Strengthening Strategy.” The BMJ, British Medical Journal Pub- lishing Group, 7 Dec. 2018. Available: https://www.bmj.com/content/ 363/bmj.k4782.
[4] Samant, Yogindra, et al. “Evaluation of the Cold-Chain for Oral Polio Vaccine in a Rural District of India.” Public Health Reports (Wash- ington, D.C. : 1974), Association of Schools of Public Health, 2007, https://www.ncbi.nlm.nih.gov/pmc/articles/PMC1802111/.
[5] World Health Organization. “UIP Fact Sheet - Uttar Pradesh.” WHO: Regional Office for South-East Asia, WHO: Country Office for India. Available: http://www.searo.who.int/india/topics/routine immunization/ Immunization UP Fact Sheet.pdf.
[6] ACIP. “Vaccine Storage Temperature Recommendation (Table).” SlidePlayer, ACIP General Recommendations on Immunization. Available: https://slideplayer.com/slide/4568764/15/images/46/ VaccineStorageTemperatures.jpg.
[7] Panagariya, Arvind. “India: The Crisis in Rural Health Care.” Brook- ings, The Brookings Institution, 28 July 2016. Available: https://www. brookings.edu/opinions/india-the-crisis-in-rural-health-care/.
[8] J. Lendino, “How USB charging works, or How to Avoid Blowing Up your Smartphone,” Extremetech.com. [Online]. Available: https://www.extremetech.com/computing/115251-how-usb-charging- works-or-how-to-avoid-blowing-up-your-smartphone. [Accessed Mar. 14, 2020].
[9] Battery University, “BU201-How Does the Lead Acid Battery Work?”, Battery University. [Online]. Available: https://batteryuniversity.com/ learn/article/lead based batteries. [Accessed Mar. 17, 2020].
[10] WHO. “Poliomyelitis.” World Health Organization, World Health Or- ganization, 9 Feb. 2017. Available: https://www.who.int/immunization/ diseases/poliomyelitis/en/.
[11] CDC. “Vaccine Storage and Handling Toolkit [PDF].” CDC, U.S. De- partment of Health and Human Services, Jan. 2019. Available: www.cdc. gov/vaccines/hcp/admin/storage/toolkit/storage-handling-toolkit.pdf.
[12] CDC. “Packing Vaccines for Transport during Emergencies [PDF].” CDC, U.S. Department of Health and Human Services, Aug. 2015. Available: www.cdc.gov/vaccines/hcp/admin/storage/downloads/ emergency-transport.pdf.
[13] ”Renogy 100W 12V Portable Foldable Monocrystalline Solar Panel, Folding Solar Charger with 10A LCD Waterproof Charge Controller” Renogy.com Available: https://renogy.com/template/files/specifications/ 100-Watt-12-Volt-Monocrystalline-Solar-Panel-Specifications.pdf.
[14] P. Taylor-Parker, “Lead-Acid vs. Lithium Batteries: Which is Bet- ter for Solar,” wholesalesolar.com, [Online]. Available: https://www. wholesalesolar.com/blog/lead-acid-vs-lithium-batteries. [Accessed Mar. 17, 2020].
[15] J. Keith, “12V LDO Solar Charge Controller,” electroschematics.com, [Online]. Available: https://www.electroschematics.com/12v-ldo-solar- charge-control/. [Accessed Feb. 15, 2020].
[16] D. R. Brown, J. A. Dirks, N. Fernandez, and T. B. Stout, The Prospects of Alternatives to Vapor Compression Technology for Space Cooling and Food Refrigeration Applications. Washington, D.C: United States. Dept. of Energy, 2010.
[17] Yu, Byunggyu. “An Improved Dynamic Maximum Power Point Tracking Method for PV Application.” Jstage.jst.go.jp, IEICE Electronics Ex- press, 16 Jan. 2014. Available: https://www.jstage.jst.go.jp/article/elex/ advpub/0/advpub 11.20130941/ pdf/-char/en.
[18] Corsair, Hope. “ree407/557.Lecture 1.Summer 2019.Pdf.” 2019. Oregon Institute of Technology.
[19] “The Real Lifespan of Solar Panels.” Energy Informative, Available: https://energyinformative.org/lifespan-solar-panels/.
[20] “Uttar Pradesh Population 2011-2020 Census,” Uttar Pradesh Popula- tion Sex Ratio in Uttar Pradesh Literacy rate data 2011-2020. [Online]. Available: https://www.census2011.co.in/census/state/uttarpradesh.html. [Accessed: 19-Mar-2020].
[21] “PVWatts,” PVWatts Calculator. [Online]. Available: https://pvwatts.nrel.gov/pvwatts.php. [Accessed: 20-Mar-2020].
[22] “Sunrise Technology Inc., Gandhinagar - Manufacturer of Solar Refrigerator and Solar Lantern.” IndiaMART.com, https://www.indiamart.com/sunrise-technology-incorporation/.
[23] “Solar Refrigerators.” Bharat Solar Energy, http://www.bharatsolarenergy.com/37-solar-refrigerators/1/listings.html.
[24] “Solar Powered Commercial Refrigerators in India - India Off-Grid, Captive Solar Power.” India Renewable Energy Consulting - Solar, Biomass, Wind, Cleantech, Available: http://www.eai.in/ref/ae/sol/cs/ms/ ref/solar powered commercial refrigerators.html.
[25] Chappelow, Jim. “Law of Supply Definition.” Investopedia, Investo- pedia, 18 Nov. 2019. Available: https://www.investopedia.com/terms/l/ lawofsupply.asp.
[26] Ramamurti, Vijay GovindarajanRavi. “India’s Secret to Low-Cost Health Care.” Harvard Business Review, 7 Aug. 2014. Available: https://hbr.org/ 2013/10/indias-secret-to-low-cost-health-care.
[27] Kenton, Will. “How Substitutes Work.” Investopedia, Investopedia, 18 Nov. 2019, https://www.investopedia.com/terms/s/substitute.asp.
[28] Pettinger, Tejvan. “External Benefits.” Economics Help, https://www.economicshelp.org/blog/glossary/external-benefits/.
[29] Demand for Electricity in a Poor Economy. Available: http://www.lse.ac.uk/economics/Assets/Documents/personal- pages/robin-burgess/demand-for-electricity-in-a-poor-economy.pdf.
[30] “India’s Population: Becoming Number One.” India’s Popula- tion: Becoming Number One — YaleGlobal Online, 10 Aug. 2017. Available: https://yaleglobal.yale.edu/content/indias-population- becoming-number-one.
[31] “Trends in National Income of India (With Statistics).” Your Article Library, 12 July 2015, Available: http://www.yourarticlelibrary.com/ economics/national-income/trends-in-national-income-of-india-with- statistics/62835.
[32] Sengupta, Hindol, et al. “Renewable Energy.” Investment Promotion and Facilitation Agency, 31 Oct. 1970,Available: https://www.investindia. gov.in/sector/renewable-energy.

81
\ \ \ \
[33] Ebinger, Charles K. “India’s Energy Policy and Electricity Production.” Brookings, 28 July 2016, Available: https://www.brookings.edu/on-the- record/indias-energy-policy-and-electricity-production/.
[34] Contributors, Et. “Is Low Inflation the Culprit for India’s Economic Woes?” The Economic Times, Economic Times, 19 Sept. 2019. Available: https://economictimes.indiatimes.com/news/ economy/policy/is-low-inflation-the-culprit-for-indias-economic- woes/articleshow/71190710.cms?from=mdr.
[35] “India.” Indian Economy: Population, Facts, GDP, Corruption, Business, Trade, FDI. Available: https://www.heritage.org/index/country/india.
[36] India Unemployment Rate, Available: https://tradingeconomics.com/ india/unemployment-rate.
[37] “World Day Against Child Labour 2017: Key Statistics.” Moneycontrol, MoneyControl. Available: https://www.moneycontrol.com/news/india/ world-day-against-child-labour-2017-key-statistics-2302279.html.
[38] Laxminarayan, Ramanan, et al. “India’s Vaccine Deficit: Why More Than Half of Indian Children Are Not Fully Immunized, And What Can-And Should-Be Done.” Health Affairs, 1 June 2011, https://www.healthaffairs.org/doi/full/10.1377/hlthaff.2011.0405.
[39] Corsair, Hope. “REE407/557.lecture 4.summer 2019.pdf.” 2019. Oregon Institute of Technology.
[40] Chakrabarti, Anindita, and Ravinder Kumar Arora. “India’s Energy Se- curity: Critical Considerations - Anindita Chakrabarti, Ravinder Kumar Arora, 2016.” SAGE Journals. Available: https://journals.sagepub.com/ doi/full/10.1177/0972150916660443.
[41] Amadeo, Kimberly. “Bollywood Is More Popular Than Hollywood: In- dia’s Opportunities.” The Balance, The Balance, 3 July 2019. Available: https://www.thebalance.com/india-s-economy-3306348.
[42] PTI. “What India Can Learn from Other Countries to Beat Air Pollution.” The Economic Times, Economic Times, 17 Nov. 2019. Available: https://economictimes.indiatimes.com/news/politics- and-nation/what-india-can-learn-from-other-countries-to-beat-air- pollution/articleshow/72094039.cms?from=mdr.
[43] Abi-Habib, Maria, and Hari Kumar. “India Finally Has Plan to Fight Air Pollution. Environmentalists Are Wary.” The New York Times, The New York Times, 11 Jan. 2019. Available: https://www.nytimes.com/ 2019/01/11/world/asia/india-air-pollution.html.
[44] Corsair, Hope. “ree407/557.lecture 5.Summer 2019.pdf.” 2019. Oregon Institute of Technology.
[45] “Hotels: Find Cheap Hotel Deals & Discounts.” KAYAK, Available: https://www.kayak.com/hotels/New-Delhi,DL,India-c32821/2020-01- 05/2020-01-12/1adults?lang=en&skipapp=true&contextualSearch= true&sort=rank a.
[46] “Cheap Flights from Portland to Delhi.” JustFly, https://www.justfly. com/flight/search?currency=usd&kayakclickid=1GUkKv1IpahQX BxJTlKcH8VmNXqxn06-lpKdqcqqVfaOpIswqif5hg==&num adults=4&num children=0&seat class=Economy&seg0 date=2020- 01-05&seg0 from=PDX&seg0 to=DEL&seg1 date=2020-01- 12&seg1 from=DEL&seg1 to=PDX&type=roundtrip.
[47] “THE 10 BEST Hotels in Uttar Pradesh for 2020 (with Prices).” Tri- pAdvisor, https://www.tripadvisor.com/Hotels-g297682-Uttar Pradesh- Hotels.html.
[48] Budget Your Trip. “India Travel Cost - Average Price of a Vacation to India: Food & Meal Budget, Daily & Weekly Expenses.” Budget Your Trip, Budget Your Trip, 31 Dec. 2019, https://www.budgetyourtrip.com/ india.
[49] “Car Rentals in India from $35/Day - Search for Cars on KAYAK.” KAYAK. Available: https://www.kayak.com/India-Car-Rentals.112.crc. html.
[50] “HOW IT WORKS.” Shop US Stores and Save on International Shipping with MyUS, Delhivery. Available: https://www.myus.com/in/.
[51] “Indian Health Service.” Find Jobs, https://www.indeed.com/cmp/ Indian-Health-Service/salaries?job category=meddr.
[52] The Effects: Economy.” EPA, Environmental Protection Agency, 4 Feb. 2019, https://www.epa.gov/nutrientpollution/effects-economy.
[53] “Solar Energy Pros and Cons.” Energy Informative, https: //energyinformative.org/solar-energy-pros-and-cons/.
[54] Corsair, Hope, PhD., Causes of Success and Failure of Stand-alone Solar Electric Systems in Rural Guatemala. Doctor of Philosophy Dissertation. Nov. 2013, pp. 79–81.
[55] Smith, Kalen, et al. “List of 16 Major Leading & Lagging Economic Indicators.” Money Crashers, 9 Sept. 2019. Available: https://www. moneycrashers.com/leading-lagging-economic-indicators/.
[56] Jagerson, John A. “What Is the Formula for Calculating Net Present Value (NPV)?” Investopedia, Investopedia, 5 Jan. 2020, https://www.investopedia.com/ask/answers/032615/what-formula- calculating-net-present-value-npv.asp.
[57] “Evaluating Clean Energy Goals in India.” NREL.gov, https://www.nrel.gov/usaid-partnership/energy-goals-india.html.
[58] “ACOPOWER R40A Portable Solar Fridge Freezer, 42 Quarts (2018 Model),” ACOPOWER. [Online]. Available:https://www.acopower.com/ products/hy-r40a?variant=15687333347394cy &utm campaign=gs- 2019-06-15 &utm source=google &utm medium=smart campaign &gclid=CjwKCAjwsMzzBRACEiwAx4lLGyuaifhgCQEyJaR9XGge Q4pPE6TM90WjzfyuZGTTmGkwDsCluJFmBoCAycQAvD BwE. [Accessed: 19-Mar-2020].
[59] “RB35,” RELiON. [Online]. Available: https://relionbattery.com/ products/lithium/rb35. [Accessed: 19-Mar-2020].
[60] National Family Health Survey (NFHS-4) 2015-16. Print. [61] NREL Enhances the Performance of a Lithium-Ion Battery Cathode
(Fact Sheet). Washington, D.C.: United States. Dept. of Energy. Office of Energy Efficiency and Renewable Energy, 2012.
[62] “Renogy 200 W Foldable Solar Panel,” Renogy.com. [Online]. Available:https://www.renogy.com/200-watt-12-volt-monocrystalline- foldable-solar-suitcase-back-order/?gclid=Cj0KCQjwka 1BRCPARIsAMlUmErMVmt4q1CWMhfvNCwRiV1NQqgqMibc3d7sW4XTp36 U9iBmyqI7saAmbDEALw wcB[Accessed: 19-Apr-2020].
[63] “Genasun GV-10-Li-14.2V, MPPT Solar Charge Controller for Lithium Batteries,” Genasun GV-10-Li-14.2V, MPPT Solar Charge Controller for Lithium Battery Charge Controllers. [Online]. Available:https://www.gogreensolar.com/products/genasun-gv-10-li- 14-2v-mppt-solar-charge-controller-for-lithium-batteries. [Accessed: 19-Mar-2020].
Ross Sison (M, ’19),
is currently pursuing a
B.S. in renewable energy
engineering at Oregon
Institute of Technology
(OIT), Wilsonville,
Oregon, U.S.A. He was
involved in the associate
of science transfer degree
program at Portland
Community College from
2013-2015 and involved in
electrical engineering studies at Portland State University in
Portland, Oregon from 2015-2017.
He was the student project manager and coordinator of his
senior capstone group at Oregon Tech from 2019-2020 which
developed a prototype of a solar powered vaccine refrigeration
unit for rural applications in Uttar Pradesh, India. In 2019, he
was also the student project manager of a solar PV business
initiative proposal group project at Oregon Tech that focused
on providing lighting and device charging solutions for small
school classrooms located in Bolivia. In addition, he has
also held two student project analyst positions in renewable
energy engineering course projects at Oregon Tech from 2019-
2020. He worked as a volunteer for the Tigard Public Works
Nature Restoration Project in 2012 which focused on the
revival of Tigard’s native flora and fauna using various
landscaping strategies. He is also the founder and sole author
of the Renewable Energy Future 365 Podcast Show which
focuses on providing news and opinions on various topics
relating to renewable energy. He is currently pursuing his

82
career interests in the field of electrical and renewable energy
systems research, development, power systems analysis, grid-
integration of renewables, and protection & control systems.
Daren Fernandez is cur-
rently pursuing his B.S.
in renewable energy engi-
neering from Oregon In-
stitute of Technology in
Wilsonville, OR. He was
the materials manager for
his senior capstone project
at OIT from 2019-2020
which developed a proto-
type of a solar powered
vaccine refrigeration unit.
He was also a founding
member of Hyperion Inter-
national, a student organi-
zation focused on bringing renewable energy resources to
developing nations. He is currently a volunteer with Twende
Solar, a non-profit solar company that implements renewable
energy systems in energy poor communities across the globe.
Justin Ringle graduated
from Northern Arizona
University with a B.S. in
Geology in 2015. Justin is
currently attending Oregon
Institute of Technology
with the intent of pursuing
a M.S. in renewable energy
engineering (2022).
Justin is the assistant
project manager, research
and funding specialist, and
the spokesperson for his
senior capstone project at
Oregon Tech during the
2019 – 2020 academic
year. They are also the
Lead Renewable Energy
Engineer on the RockSat-C team at Oregon tech as well as the
being the Lead Peer Consultant. Justin is a large proponent of
STEM education and works with MESA to do outreach with
middle school students in Salem, Or. The focus of Justin’s
research at school revolves around satellite operation and the
use of renewable energies in space exploration. Hopefully,
Justin will launch their first payload into space with NASA
June 2020.
Ryan Schofield (M‘18)
received a B.A. degree in
Spanish Literature (2007)
and a Certificate of Spanish
Translation Studies (2008)
from the University of
Nevada, Reno. He is
currently pursuing a
B.S. in renewable energy
engineering at Oregon
Institute of Technology
(OIT), Wilsonville, OR.
He was the project ana-
lyst for his senior capstone project at OIT from 2019-2020
which developed a prototype of a solar powered vaccine
refrigeration unit for rural applications. He is the Lead Event
Coordinator for OIT Wilsonville IEEE student branch. He
was also the treasurer of Hyperion International, a student
organization focused on bringing renewable energy resources
to developing nations. Though interested in all aspects of
promulgating a green energy future, his current studies center
around power systems engineering with an emphasis on pro-
tections & controls and grid integration of renewable energy.