Determining the Distribution and Interaction of Soil Organic ...
13
Article Determining the Distribution and Interaction of Soil Organic Carbon, Nitrogen, pH and Texture in Soil Profiles: A Case Study in the Lancangjiang River Basin, Southwest China Wenxiang Zhou, Guilin Han * , Man Liu , Jie Zeng , Bin Liang , Jinke Liu and Rui Qu Institute of Earth Sciences, China University of Geosciences (Beijing), Beijing 100083, China; [email protected] (W.Z.); [email protected] (M.L.); [email protected] (J.Z.); [email protected] (B.L.); [email protected] (J.L.); [email protected] (R.Q.) * Correspondence: [email protected]; Tel.: +86-10-82323536 Received: 5 April 2020; Accepted: 8 May 2020; Published: 10 May 2020 Abstract: The profile distributions of soil organic carbon (SOC), soil organic nitrogen (SON), soil pH and soil texture were rarely investigated in the Lancangjiang River Basin. This study aims to present the vertical distributions of these soil properties and provide some insights about how they interact with each other in the two typical soil profiles. A total of 56 soil samples were collected from two soil profiles (LCJ S-1, LCJ S-2) in the Lancangjiang River Basin to analyze the profile distributions of SOC and SON and to determine the effects of soil pH and soil texture. Generally, the contents of SOC and SON decreased with increasing soil depth and SOC contents were higher than SON contents (average SOC vs. SON content: 3.87 g kg -1 vs. 1.92 g kg -1 in LCJ S-1 and 5.19 g kg -1 vs. 0.96 g kg -1 in LCJ S-2). Soil pH ranged from 4.50 to 5.74 in the two soil profiles and generally increased with increasing soil depth. According to the percentages of clay, silt, and sand, most soil samples can be categorized as silty loam. Soil pH values were negatively correlated with C/N ratios (r = -0.66, p < 0.01) and SOC contents (r = -0.52, p < 0.01). Clay contents were positively correlated with C/N ratios (r = 0.43, p < 0.05) and SOC contents (r = 0.42, p < 0.01). The results indicate that soil pH and clay are essential factors influencing the SOC spatial distributions in the two soil profiles. Keywords: soil organic carbon; soil organic nitrogen; soil pH; soil texture; Lancangjiang River Basin; Southwest China 1. Introduction Soil that is the largest carbon pool in the terrestrial ecosystem owns a strong ability to store organic carbon, which is critical for mitigating global warming caused by increasing atmospheric CO 2 [1,2]. Soil strongly interacts with atmosphere and plant which makes soil an important role in regulating the global carbon cycle [3]. Against the background of global warming, learning about the distribution characteristics of soil organic carbon (SOC) in soils helps to determine the response of SOC on climate change. Moreover, soil C/N ratio (SOC to SON ratio) is an important indicator for the decomposition of SOM and often adopted to assess the quality of SOM: SOM that owns low C/N ratio is more easily to be decomposed and utilized by microorganisms [4]. It’s accepted that soil C/N ratio can significantly influence rice yield by changing the utilization efficiency of SON, thus it has been more concerned in agricultural management [5]. Therefore, studying the distribution characteristics and influencing factors of SOC and SON is essential in providing a reference for the development of soil management strategies. Forests 2020, 11, 532; doi:10.3390/f11050532 www.mdpi.com/journal/forests
-
Upload
khangminh22 -
Category
Documents
-
view
0 -
download
0
Transcript of Determining the Distribution and Interaction of Soil Organic ...
Article
Determining the Distribution and Interaction of SoilOrganic Carbon, Nitrogen, pH and Texture in SoilProfiles: A Case Study in the Lancangjiang RiverBasin, Southwest China
Wenxiang Zhou, Guilin Han * , Man Liu , Jie Zeng , Bin Liang , Jinke Liu and Rui Qu
Institute of Earth Sciences, China University of Geosciences (Beijing), Beijing 100083, China;[email protected] (W.Z.); [email protected] (M.L.); [email protected] (J.Z.);[email protected] (B.L.); [email protected] (J.L.); [email protected] (R.Q.)* Correspondence: [email protected]; Tel.: +86-10-82323536
Received: 5 April 2020; Accepted: 8 May 2020; Published: 10 May 2020�����������������
Abstract: The profile distributions of soil organic carbon (SOC), soil organic nitrogen (SON), soil pHand soil texture were rarely investigated in the Lancangjiang River Basin. This study aims to presentthe vertical distributions of these soil properties and provide some insights about how they interactwith each other in the two typical soil profiles. A total of 56 soil samples were collected from two soilprofiles (LCJ S-1, LCJ S-2) in the Lancangjiang River Basin to analyze the profile distributions of SOCand SON and to determine the effects of soil pH and soil texture. Generally, the contents of SOC andSON decreased with increasing soil depth and SOC contents were higher than SON contents (averageSOC vs. SON content: 3.87 g kg−1 vs. 1.92 g kg−1 in LCJ S-1 and 5.19 g kg−1 vs. 0.96 g kg−1 in LCJS-2). Soil pH ranged from 4.50 to 5.74 in the two soil profiles and generally increased with increasingsoil depth. According to the percentages of clay, silt, and sand, most soil samples can be categorizedas silty loam. Soil pH values were negatively correlated with C/N ratios (r = −0.66, p < 0.01) andSOC contents (r = −0.52, p < 0.01). Clay contents were positively correlated with C/N ratios (r = 0.43,p < 0.05) and SOC contents (r = 0.42, p < 0.01). The results indicate that soil pH and clay are essentialfactors influencing the SOC spatial distributions in the two soil profiles.
Keywords: soil organic carbon; soil organic nitrogen; soil pH; soil texture; Lancangjiang River Basin;Southwest China
1. Introduction
Soil that is the largest carbon pool in the terrestrial ecosystem owns a strong ability to storeorganic carbon, which is critical for mitigating global warming caused by increasing atmosphericCO2 [1,2]. Soil strongly interacts with atmosphere and plant which makes soil an important role inregulating the global carbon cycle [3]. Against the background of global warming, learning about thedistribution characteristics of soil organic carbon (SOC) in soils helps to determine the response ofSOC on climate change. Moreover, soil C/N ratio (SOC to SON ratio) is an important indicator for thedecomposition of SOM and often adopted to assess the quality of SOM: SOM that owns low C/N ratiois more easily to be decomposed and utilized by microorganisms [4]. It’s accepted that soil C/N ratiocan significantly influence rice yield by changing the utilization efficiency of SON, thus it has beenmore concerned in agricultural management [5]. Therefore, studying the distribution characteristicsand influencing factors of SOC and SON is essential in providing a reference for the development ofsoil management strategies.
Forests 2020, 11, 532; doi:10.3390/f11050532 www.mdpi.com/journal/forests
Forests 2020, 11, 532 2 of 13
The distributions of SOC and SON are influenced by many factors, including soil pH and soiltexture. Although soil pH was generally thought not to influence the mineralization processes of SOM,the decomposition and nitrification processes of SOM are quite sensitive to soil pH [6,7]. Soil pHwas reported to regulate a series of soil processes, such as SOM turnover, nutrient bioavailability andmicrobial activity, through which soil pH greatly affects the decomposition of SOM [8]. Soil texturerefers to the soil particle size distributions (including clay, silt and sand) and is believed to be essentialfor understanding soil physicochemical properties in the terrestrial ecosystems [9,10]. Generally, clayand fine silt particles can protect SOM from being decomposed by a physical or chemical way dueto their high surface activity and large specific surface area [11]. However, the effects of these fineparticles on the accumulation and decomposition of SOM are different in different ecosystems, makingit necessary to explore the specific influence of clay on SOM in different regions [10,11].
Lancangjiang River Basin is an undeveloped region where the intensity of human interference isquite low, making it a great area for exploring the correlations between different soil properties [12].However, previous studies mainly focused on dam construction and soil erosion in the local area withoutidentifying the spatial distribution of soil properties (e.g., soil pH, soil texture) [12,13]. Consideringthat little research on soil properties (including soil pH and soil texture), SOC, and SON is carried out inthe Lancangjiang River Basin, this study aims to: (1) learn about the vertical distribution characteristicsof SOC and SON in soil profiles of Lancangjiang River Basin, (2) learn about the vertical distributioncharacteristics soil pH and soil texture in these soil profiles, and (3) explore the influence of soil pHand soil texture on the distributions of SOC and SON.
2. Materials and Methods
2.1. Study Area
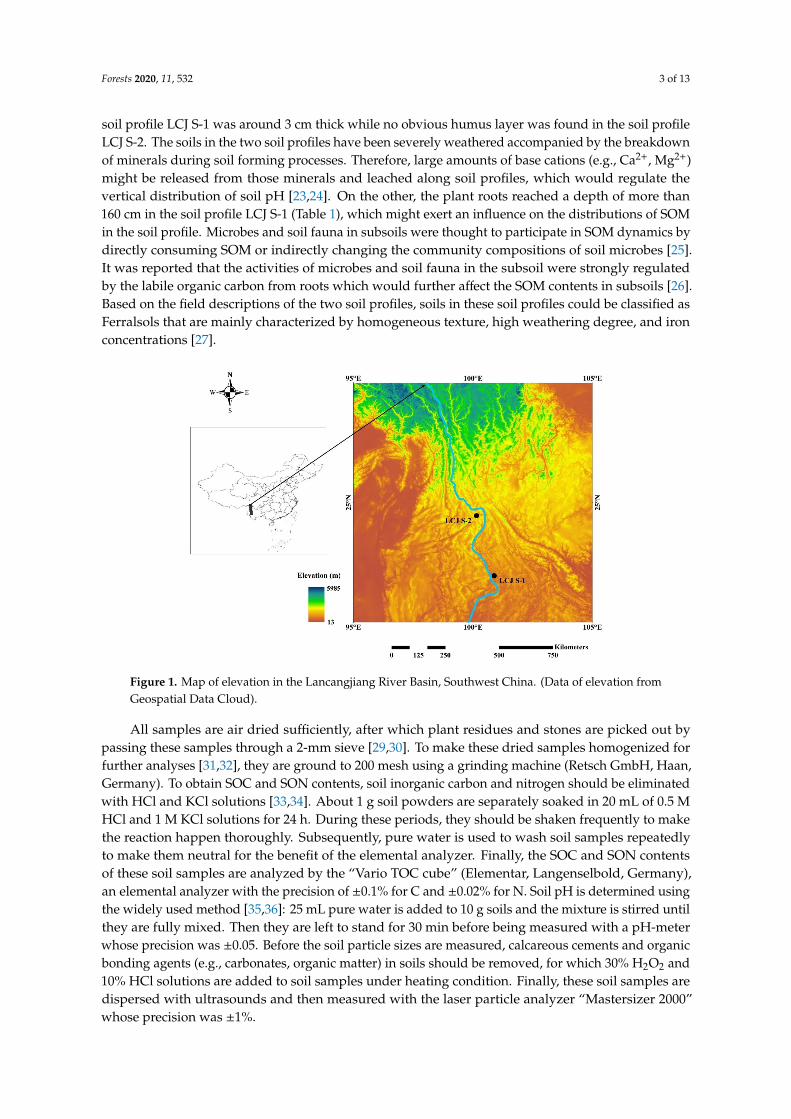
The Lancangjiang River Basin (94◦40′~102◦19′ E, 21◦08′~33◦81′ N) is located in Southwest China,with an area of 167,400 km2 [14,15]. The Lancangjiang River Basin has various kinds of climatetypes, varying from subtropical and temperate to cold climate zones [16]. There are two distinctiveseasons within the basin all year round, a dry season (November to April) and a rainy season (May toOctober) [17,18]. It’s reported that 80% of the annual precipitation is concentrated in the rainy season sothe Lancangjiang River Basin is mostly dominated by dry air in the dry season [19]. With huge changesof elevation (upper reach: >4500 m; middle reach: 2500 to 5000 m; lower reach: 500–3000 m) (Figure 1),the geomorphology of the basin is mainly characterized by deep valleys and high mountains [14,20].The unique climatic and geographical characteristics determine that most areas of this region cannot beused for agricultural production and have kept virgin vegetation coverage over these years, includingconiferous forests, evergreen broad-leaved forests, and miscellaneous grass meadow [12]. Accordingto the remote sensing maps, the main land uses in the Lancangjiang River Basin are forest landsand grasslands that are estimated to account for 47% and 44% of the total area, respectively [12,21].Therefore, the two soil profiles in this study were dug in forestland and grassland.
Surficial lithology is an important descriptor of the earth’s surface although only partial informationcan be obtained due to the occupation of sediments [22]. The main surficial rock types in the studyarea are carbonates, metamorphic rocks of low-grade, volcanic rocks, and Paleozoic clastic rocks [14].
2.2. Soil Sampling and Analysis
A total of 56 soil samples were collected from two soil profiles (LCJ S-1, LCJ S-2) in the LancangjiangRiver Basin. We selected these two soil profiles because they were derived from volcanic rock thatwas one of the main rock types in the study area [14]. The land covers of the soil profiles LCJ S-1(21◦56′9” N, 100◦53′24” E) and LCJ S-2 (24◦27′11” N, 100◦8′49” E) were forest and grass, respectively.Soil profiles above 50 cm were sampled at 5 cm intervals, and below 50 cm were sampled at 10 cmintervals. The topsoil of the two soil profiles was collected from the soil layer of 0–3 cm. The specificdescriptions of different horizons in the two soil profiles were shown in Table 1. The humus layer in the
Forests 2020, 11, 532 3 of 13
soil profile LCJ S-1 was around 3 cm thick while no obvious humus layer was found in the soil profileLCJ S-2. The soils in the two soil profiles have been severely weathered accompanied by the breakdownof minerals during soil forming processes. Therefore, large amounts of base cations (e.g., Ca2+, Mg2+)might be released from those minerals and leached along soil profiles, which would regulate thevertical distribution of soil pH [23,24]. On the other, the plant roots reached a depth of more than160 cm in the soil profile LCJ S-1 (Table 1), which might exert an influence on the distributions of SOMin the soil profile. Microbes and soil fauna in subsoils were thought to participate in SOM dynamics bydirectly consuming SOM or indirectly changing the community compositions of soil microbes [25].It was reported that the activities of microbes and soil fauna in the subsoil were strongly regulatedby the labile organic carbon from roots which would further affect the SOM contents in subsoils [26].Based on the field descriptions of the two soil profiles, soils in these soil profiles could be classified asFerralsols that are mainly characterized by homogeneous texture, high weathering degree, and ironconcentrations [27].Forests 2020, 11, x FOR PEER REVIEW 3 of 13
Figure 1. Map of elevation in the Lancangjiang River Basin, Southwest China. (Data of elevation from Geospatial Data Cloud).
2.2. Soil Sampling and Analysis
A total of 56 soil samples were collected from two soil profiles (LCJ S-1, LCJ S-2) in the Lancangjiang River Basin. We selected these two soil profiles because they were derived from volcanic rock that was one of the main rock types in the study area [14]. The land covers of the soil profiles LCJ S-1 (21°56′9″ N, 100°53′24″ E) and LCJ S-2 (24°27′11″ N, 100°8′49″ E) were forest and grass, respectively. Soil profiles above 50 cm were sampled at 5 cm intervals, and below 50 cm were sampled at 10 cm intervals. The topsoil of the two soil profiles was collected from the soil layer of 0–3 cm. The specific descriptions of different horizons in the two soil profiles were shown in Table 1. The humus layer in the soil profile LCJ S-1 was around 3 cm thick while no obvious humus layer was found in the soil profile LCJ S-2. The soils in the two soil profiles have been severely weathered accompanied by the breakdown of minerals during soil forming processes. Therefore, large amounts of base cations (e.g., Ca2+, Mg2+) might be released from those minerals and leached along soil profiles, which would regulate the vertical distribution of soil pH [23,24]. On the other, the plant roots reached a depth of more than 160 cm in the soil profile LCJ S-1 (Table 1), which might exert an influence on the distributions of SOM in the soil profile. Microbes and soil fauna in subsoils were thought to participate in SOM dynamics by directly consuming SOM or indirectly changing the community compositions of soil microbes [25]. It was reported that the activities of microbes and soil fauna in the subsoil were strongly regulated by the labile organic carbon from roots which would further affect the SOM contents in subsoils [26]. Based on the field descriptions of the two soil profiles, soils in these soil profiles could be classified as Ferralsols that are mainly characterized by homogeneous texture, high weathering degree, and iron concentrations [27].
Figure 1. Map of elevation in the Lancangjiang River Basin, Southwest China. (Data of elevation fromGeospatial Data Cloud).
All samples are air dried sufficiently, after which plant residues and stones are picked out bypassing these samples through a 2-mm sieve [29,30]. To make these dried samples homogenized forfurther analyses [31,32], they are ground to 200 mesh using a grinding machine (Retsch GmbH, Haan,Germany). To obtain SOC and SON contents, soil inorganic carbon and nitrogen should be eliminatedwith HCl and KCl solutions [33,34]. About 1 g soil powders are separately soaked in 20 mL of 0.5 MHCl and 1 M KCl solutions for 24 h. During these periods, they should be shaken frequently to makethe reaction happen thoroughly. Subsequently, pure water is used to wash soil samples repeatedlyto make them neutral for the benefit of the elemental analyzer. Finally, the SOC and SON contentsof these soil samples are analyzed by the “Vario TOC cube” (Elementar, Langenselbold, Germany),an elemental analyzer with the precision of ±0.1% for C and ±0.02% for N. Soil pH is determined usingthe widely used method [35,36]: 25 mL pure water is added to 10 g soils and the mixture is stirred untilthey are fully mixed. Then they are left to stand for 30 min before being measured with a pH-meterwhose precision was ±0.05. Before the soil particle sizes are measured, calcareous cements and organicbonding agents (e.g., carbonates, organic matter) in soils should be removed, for which 30% H2O2 and10% HCl solutions are added to soil samples under heating condition. Finally, these soil samples aredispersed with ultrasounds and then measured with the laser particle analyzer “Mastersizer 2000”whose precision was ±1%.
Forests 2020, 11, 532 4 of 13
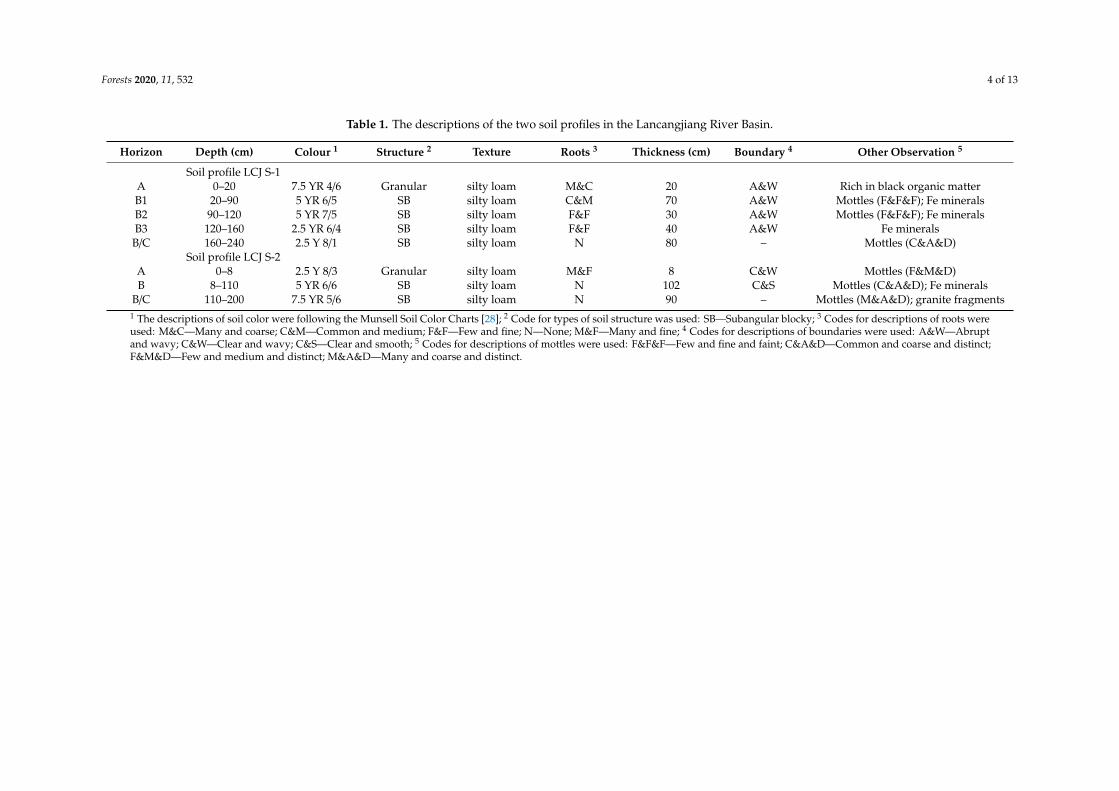
Table 1. The descriptions of the two soil profiles in the Lancangjiang River Basin.
Horizon Depth (cm) Colour 1 Structure 2 Texture Roots 3 Thickness (cm) Boundary 4 Other Observation 5
Soil profile LCJ S-1A 0–20 7.5 YR 4/6 Granular silty loam M&C 20 A&W Rich in black organic matterB1 20–90 5 YR 6/5 SB silty loam C&M 70 A&W Mottles (F&F&F); Fe mineralsB2 90–120 5 YR 7/5 SB silty loam F&F 30 A&W Mottles (F&F&F); Fe mineralsB3 120–160 2.5 YR 6/4 SB silty loam F&F 40 A&W Fe mineralsB/C 160–240 2.5 Y 8/1 SB silty loam N 80 – Mottles (C&A&D)
Soil profile LCJ S-2A 0–8 2.5 Y 8/3 Granular silty loam M&F 8 C&W Mottles (F&M&D)B 8–110 5 YR 6/6 SB silty loam N 102 C&S Mottles (C&A&D); Fe minerals
B/C 110–200 7.5 YR 5/6 SB silty loam N 90 – Mottles (M&A&D); granite fragments1 The descriptions of soil color were following the Munsell Soil Color Charts [28]; 2 Code for types of soil structure was used: SB—Subangular blocky; 3 Codes for descriptions of roots wereused: M&C—Many and coarse; C&M—Common and medium; F&F—Few and fine; N—None; M&F—Many and fine; 4 Codes for descriptions of boundaries were used: A&W—Abruptand wavy; C&W—Clear and wavy; C&S—Clear and smooth; 5 Codes for descriptions of mottles were used: F&F&F—Few and fine and faint; C&A&D—Common and coarse and distinct;F&M&D—Few and medium and distinct; M&A&D—Many and coarse and distinct.
Forests 2020, 11, 532 5 of 13
2.3. Statistical Analysis
The correlation analyses between different soil properties were conducted by SPSS 20 (StatisticalPackage for Social Science, IBM, Armonk, NY, USA). Elevation map of the Lancangjiang River Basinwere produced by ArcMap 10.0 software and other figures (including the vertical distributions of SOC,SON, soil pH, and soil texture, ternary diagram of soil texture and scatter plot between soil texture, pHand soil C/N ratio, SOC contents) were drawn by OriginPro 9.0 software.
3. Results and Discussion
3.1. Distribution Characteristics of SOC, SON, Soil pH and Soil Texture in Soil Profiles
3.1.1. Distribution of SOC, SON Contents
It was reported that the SOC and SON contents primarily depended on the compositions ofparent materials, but the leaching and decomposition processes of SOM would also alter the SOC andSON contents [1,37], making it essential to explore the profile distributions of SOC, SON contents andvarious soil properties. As shown in Table 2, average SOC and SON contents were 3.87 g kg−1 and1.92 g kg−1 in the soil profile LCJ S-1, 5.19 g kg−1 and 0.96 g kg−1 in the soil profile LCJ S-2, respectively.Based on the coefficient of variation, SOC contents were more variable than SON contents in the twosoil profiles and both contents were distinctly variable at different depths (CV > 0.2).
Table 2. Data description for SOC, SON and other soil properties in soil profiles LCJ S-1 and LCJ S-2.
N Min Max Mean (SD) Coefficient of Variation (CV)
SOC g kg−1 30 0.77 10.13 3.87 (2.94) 0.76SON g kg−1 30 0.46 2.67 1.92 (0.42) 0.22
pH 30 4.65 5.56 5.08 (0.28) 0.06LCJ S-1 C/N 30 0.40 14.84 2.36 (2.82) 1.19
Clay % 30 6 24 15 (6.06) 0.41Silt % 30 61 74 68 (4.01) 0.06
Sand % 30 4 33 17 (9.43) 0.55SOC g kg−1 26 1.37 23.78 5.19 (4.27) 0.82SON g kg−1 26 0.29 2.85 0.96 (0.67) 0.70
pH 26 4.50 5.74 4.93 (0.39) 0.08LCJ S-2 C/N 26 3.36 16.78 7.91 (4.37) 0.55
Clay % 26 3 19 12 (4.88) 0.40Silt % 26 29 79 63 (10.40) 0.16
Sand % 26 4 68 25 (14.30) 0.58
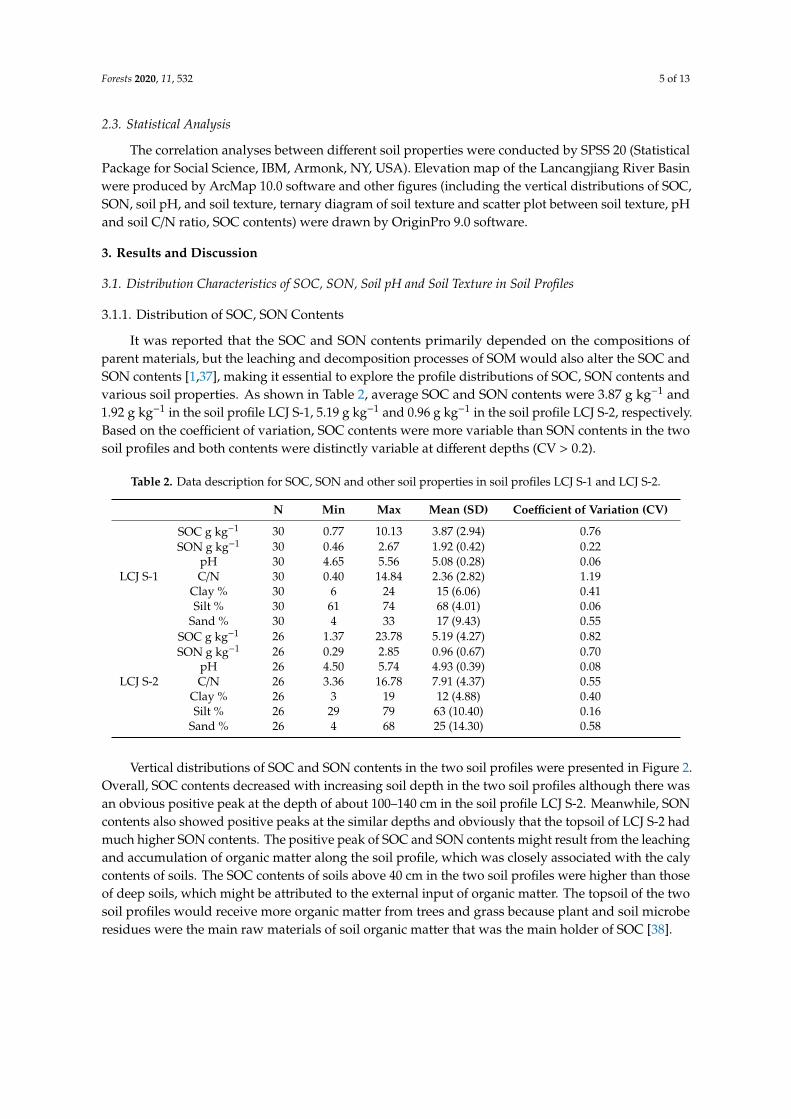
Vertical distributions of SOC and SON contents in the two soil profiles were presented in Figure 2.Overall, SOC contents decreased with increasing soil depth in the two soil profiles although there wasan obvious positive peak at the depth of about 100–140 cm in the soil profile LCJ S-2. Meanwhile, SONcontents also showed positive peaks at the similar depths and obviously that the topsoil of LCJ S-2 hadmuch higher SON contents. The positive peak of SOC and SON contents might result from the leachingand accumulation of organic matter along the soil profile, which was closely associated with the calycontents of soils. The SOC contents of soils above 40 cm in the two soil profiles were higher than thoseof deep soils, which might be attributed to the external input of organic matter. The topsoil of the twosoil profiles would receive more organic matter from trees and grass because plant and soil microberesidues were the main raw materials of soil organic matter that was the main holder of SOC [38].
Forests 2020, 11, 532 6 of 13
Forests 2020, 11, x FOR PEER REVIEW 6 of 13
Vertical distributions of SOC and SON contents in the two soil profiles were presented in Figure 2. Overall, SOC contents decreased with increasing soil depth in the two soil profiles although there was an obvious positive peak at the depth of about 100–140 cm in the soil profile LCJ S-2. Meanwhile, SON contents also showed positive peaks at the similar depths and obviously that the topsoil of LCJ S-2 had much higher SON contents. The positive peak of SOC and SON contents might result from the leaching and accumulation of organic matter along the soil profile, which was closely associated with the caly contents of soils. The SOC contents of soils above 40 cm in the two soil profiles were higher than those of deep soils, which might be attributed to the external input of organic matter. The topsoil of the two soil profiles would receive more organic matter from trees and grass because plant and soil microbe residues were the main raw materials of soil organic matter that was the main holder of SOC [38].
Figure 2. Vertical distribution of SOC (a) and SON (b) in soil profiles. (SON contents of soil samples below 150 cm in soil profile LCJ S-2 were lower than the instrument detection limit).
3.1.2. Distribution of pH and C/N Ratio
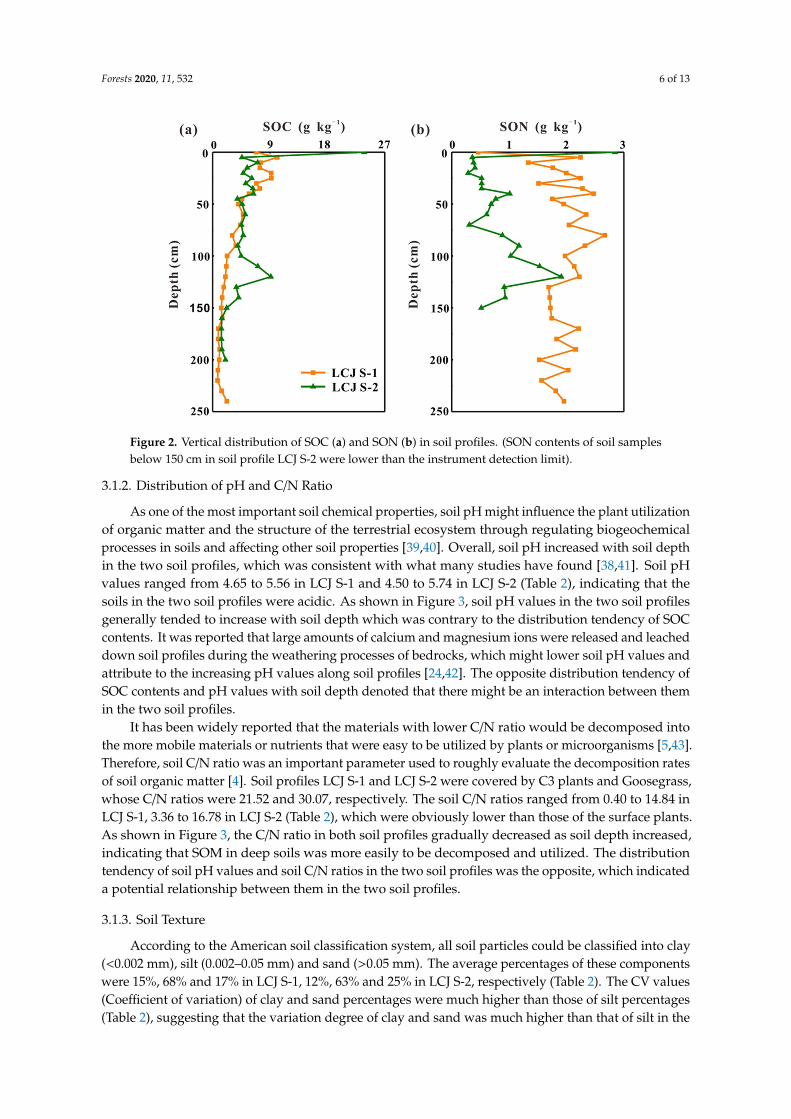
As one of the most important soil chemical properties, soil pH might influence the plant utilization of organic matter and the structure of the terrestrial ecosystem through regulating biogeochemical processes in soils and affecting other soil properties [39,40]. Overall, soil pH increased with soil depth in the two soil profiles, which was consistent with what many studies have found [38,41]. Soil pH values ranged from 4.65 to 5.56 in LCJ S-1 and 4.50 to 5.74 in LCJ S-2 (Table 2), indicating that the soils in the two soil profiles were acidic. As shown in Figure 3, soil pH values in the two soil profiles generally tended to increase with soil depth which was contrary to the distribution tendency of SOC contents. It was reported that large amounts of calcium and magnesium ions were released and leached down soil profiles during the weathering processes of bedrocks, which might lower soil pH values and attribute to the increasing pH values along soil profiles [24,42]. The opposite distribution tendency of SOC contents and pH values with soil depth denoted that there might be an interaction between them in the two soil profiles.
It has been widely reported that the materials with lower C/N ratio would be decomposed into the more mobile materials or nutrients that were easy to be utilized by plants or microorganisms [5,43]. Therefore, soil C/N ratio was an important parameter used to roughly evaluate the decomposition rates of soil organic matter [4]. Soil profiles LCJ S-1 and LCJ S-2 were covered by C3 plants and Goosegrass, whose C/N ratios were 21.52 and 30.07, respectively. The soil C/N ratios ranged from 0.40 to 14.84 in LCJ S-1, 3.36 to 16.78 in LCJ S-2 (Table 2), which were obviously lower than those of the surface plants. As shown in Figure 3, the C/N ratio in both soil profiles gradually
Figure 2. Vertical distribution of SOC (a) and SON (b) in soil profiles. (SON contents of soil samplesbelow 150 cm in soil profile LCJ S-2 were lower than the instrument detection limit).
3.1.2. Distribution of pH and C/N Ratio
As one of the most important soil chemical properties, soil pH might influence the plant utilizationof organic matter and the structure of the terrestrial ecosystem through regulating biogeochemicalprocesses in soils and affecting other soil properties [39,40]. Overall, soil pH increased with soil depthin the two soil profiles, which was consistent with what many studies have found [38,41]. Soil pHvalues ranged from 4.65 to 5.56 in LCJ S-1 and 4.50 to 5.74 in LCJ S-2 (Table 2), indicating that thesoils in the two soil profiles were acidic. As shown in Figure 3, soil pH values in the two soil profilesgenerally tended to increase with soil depth which was contrary to the distribution tendency of SOCcontents. It was reported that large amounts of calcium and magnesium ions were released and leacheddown soil profiles during the weathering processes of bedrocks, which might lower soil pH values andattribute to the increasing pH values along soil profiles [24,42]. The opposite distribution tendency ofSOC contents and pH values with soil depth denoted that there might be an interaction between themin the two soil profiles.
It has been widely reported that the materials with lower C/N ratio would be decomposed intothe more mobile materials or nutrients that were easy to be utilized by plants or microorganisms [5,43].Therefore, soil C/N ratio was an important parameter used to roughly evaluate the decomposition ratesof soil organic matter [4]. Soil profiles LCJ S-1 and LCJ S-2 were covered by C3 plants and Goosegrass,whose C/N ratios were 21.52 and 30.07, respectively. The soil C/N ratios ranged from 0.40 to 14.84 inLCJ S-1, 3.36 to 16.78 in LCJ S-2 (Table 2), which were obviously lower than those of the surface plants.As shown in Figure 3, the C/N ratio in both soil profiles gradually decreased as soil depth increased,indicating that SOM in deep soils was more easily to be decomposed and utilized. The distributiontendency of soil pH values and soil C/N ratios in the two soil profiles was the opposite, which indicateda potential relationship between them in the two soil profiles.
3.1.3. Soil Texture
According to the American soil classification system, all soil particles could be classified into clay(<0.002 mm), silt (0.002–0.05 mm) and sand (>0.05 mm). The average percentages of these componentswere 15%, 68% and 17% in LCJ S-1, 12%, 63% and 25% in LCJ S-2, respectively (Table 2). The CV values(Coefficient of variation) of clay and sand percentages were much higher than those of silt percentages(Table 2), suggesting that the variation degree of clay and sand was much higher than that of silt in the
Forests 2020, 11, 532 7 of 13
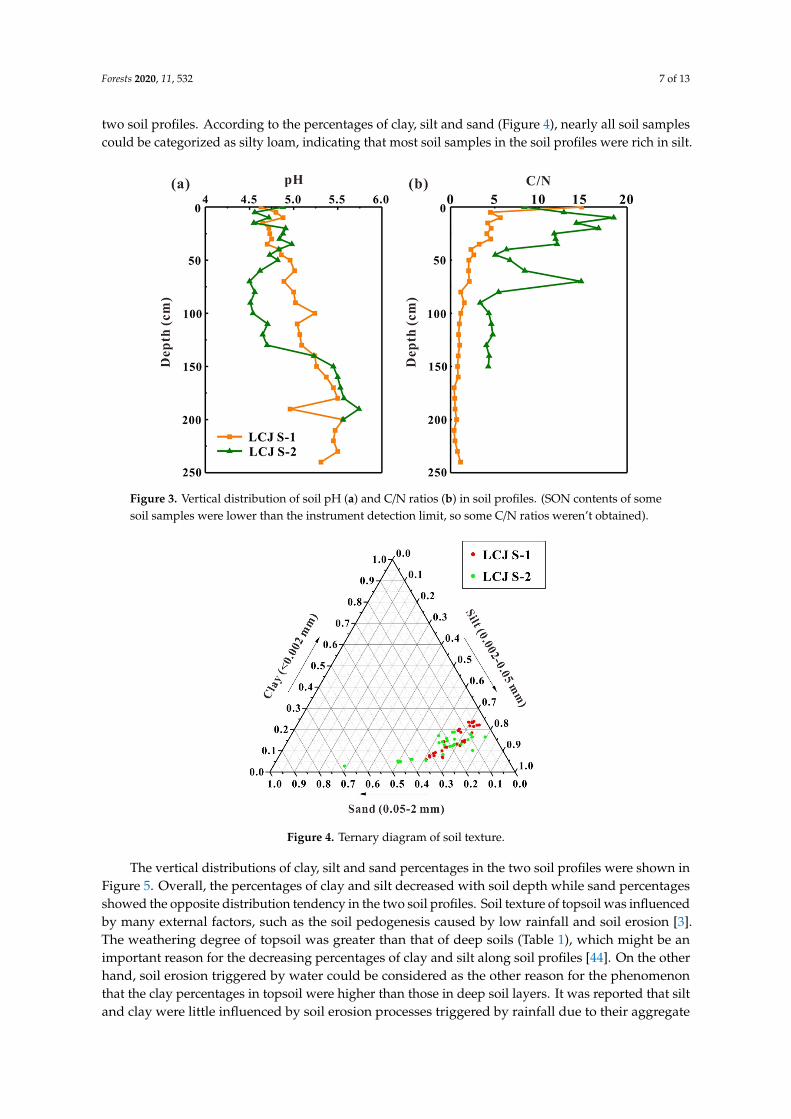
two soil profiles. According to the percentages of clay, silt and sand (Figure 4), nearly all soil samplescould be categorized as silty loam, indicating that most soil samples in the soil profiles were rich in silt.
Forests 2020, 11, x FOR PEER REVIEW 7 of 13
decreased as soil depth increased, indicating that SOM in deep soils was more easily to be decomposed and utilized. The distribution tendency of soil pH values and soil C/N ratios in the two soil profiles was the opposite, which indicated a potential relationship between them in the two soil profiles.
Figure 3. Vertical distribution of soil pH (a) and C/N ratios (b) in soil profiles. (SON contents of some soil samples were lower than the instrument detection limit, so some C/N ratios weren’t obtained).
3.1.3 Soil Texture
According to the American soil classification system, all soil particles could be classified into clay (<0.002 mm), silt (0.002–0.05 mm) and sand (>0.05 mm). The average percentages of these components were 15%, 68% and 17% in LCJ S-1, 12%, 63% and 25% in LCJ S-2, respectively (Table 2). The CV values (Coefficient of variation) of clay and sand percentages were much higher than those of silt percentages (Table 2), suggesting that the variation degree of clay and sand was much higher than that of silt in the two soil profiles. According to the percentages of clay, silt and sand (Figure 4), nearly all soil samples could be categorized as silty loam, indicating that most soil samples in the soil profiles were rich in silt.
Figure 4. Ternary diagram of soil texture.
Figure 3. Vertical distribution of soil pH (a) and C/N ratios (b) in soil profiles. (SON contents of somesoil samples were lower than the instrument detection limit, so some C/N ratios weren’t obtained).
Forests 2020, 11, x FOR PEER REVIEW 7 of 13
decreased as soil depth increased, indicating that SOM in deep soils was more easily to be decomposed and utilized. The distribution tendency of soil pH values and soil C/N ratios in the two soil profiles was the opposite, which indicated a potential relationship between them in the two soil profiles.
Figure 3. Vertical distribution of soil pH (a) and C/N ratios (b) in soil profiles. (SON contents of some soil samples were lower than the instrument detection limit, so some C/N ratios weren’t obtained).
3.1.3 Soil Texture
According to the American soil classification system, all soil particles could be classified into clay (<0.002 mm), silt (0.002–0.05 mm) and sand (>0.05 mm). The average percentages of these components were 15%, 68% and 17% in LCJ S-1, 12%, 63% and 25% in LCJ S-2, respectively (Table 2). The CV values (Coefficient of variation) of clay and sand percentages were much higher than those of silt percentages (Table 2), suggesting that the variation degree of clay and sand was much higher than that of silt in the two soil profiles. According to the percentages of clay, silt and sand (Figure 4), nearly all soil samples could be categorized as silty loam, indicating that most soil samples in the soil profiles were rich in silt.
Figure 4. Ternary diagram of soil texture. Figure 4. Ternary diagram of soil texture.
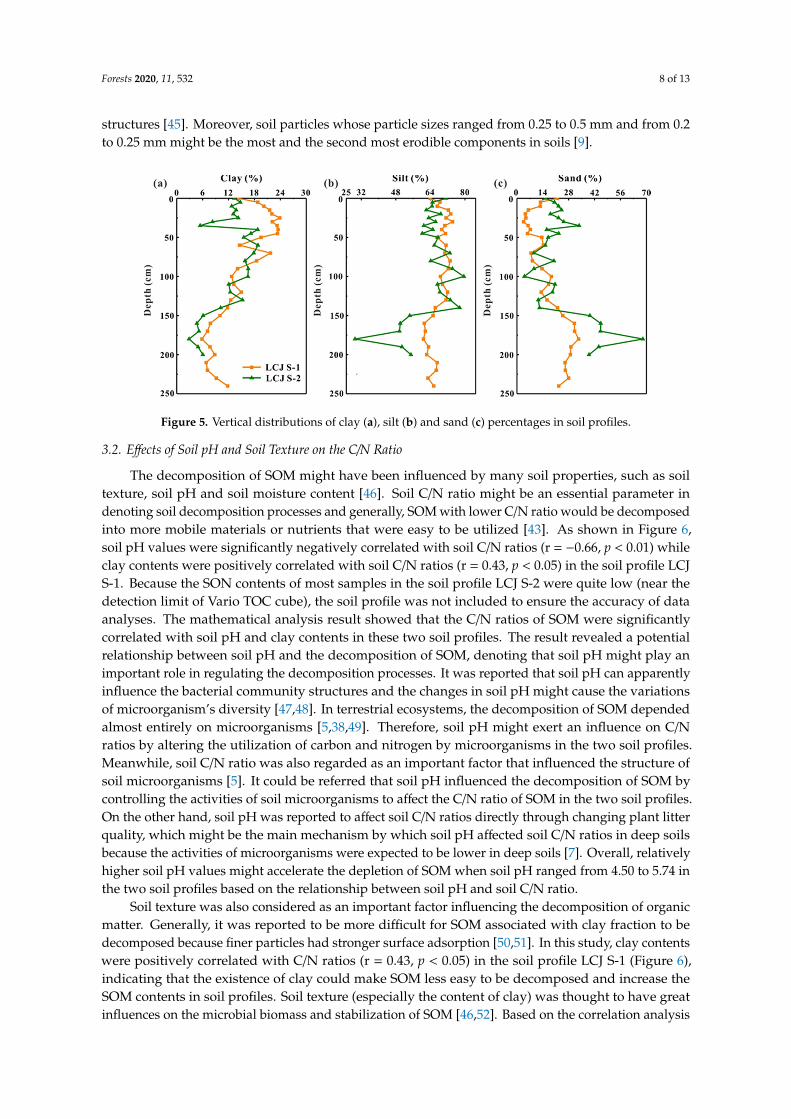
The vertical distributions of clay, silt and sand percentages in the two soil profiles were shown inFigure 5. Overall, the percentages of clay and silt decreased with soil depth while sand percentagesshowed the opposite distribution tendency in the two soil profiles. Soil texture of topsoil was influencedby many external factors, such as the soil pedogenesis caused by low rainfall and soil erosion [3].The weathering degree of topsoil was greater than that of deep soils (Table 1), which might be animportant reason for the decreasing percentages of clay and silt along soil profiles [44]. On the otherhand, soil erosion triggered by water could be considered as the other reason for the phenomenonthat the clay percentages in topsoil were higher than those in deep soil layers. It was reported that siltand clay were little influenced by soil erosion processes triggered by rainfall due to their aggregate
Forests 2020, 11, 532 8 of 13
structures [45]. Moreover, soil particles whose particle sizes ranged from 0.25 to 0.5 mm and from 0.2to 0.25 mm might be the most and the second most erodible components in soils [9].
Forests 2020, 11, x FOR PEER REVIEW 8 of 13
The vertical distributions of clay, silt and sand percentages in the two soil profiles were shown in Figure 5. Overall, the percentages of clay and silt decreased with soil depth while sand percentages showed the opposite distribution tendency in the two soil profiles. Soil texture of topsoil was influenced by many external factors, such as the soil pedogenesis caused by low rainfall and soil erosion [3]. The weathering degree of topsoil was greater than that of deep soils (Table 1), which might be an important reason for the decreasing percentages of clay and silt along soil profiles [44]. On the other hand, soil erosion triggered by water could be considered as the other reason for the phenomenon that the clay percentages in topsoil were higher than those in deep soil layers. It was reported that silt and clay were little influenced by soil erosion processes triggered by rainfall due to their aggregate structures [45]. Moreover, soil particles whose particle sizes ranged from 0.25 to 0.5 mm and from 0.2 to 0.25 mm might be the most and the second most erodible components in soils [9].
Figure 5. Vertical distributions of clay (a), silt (b) and sand (c) percentages in soil profiles.
3.2. Effects of Soil pH and Soil Texture on the C/N Ratio
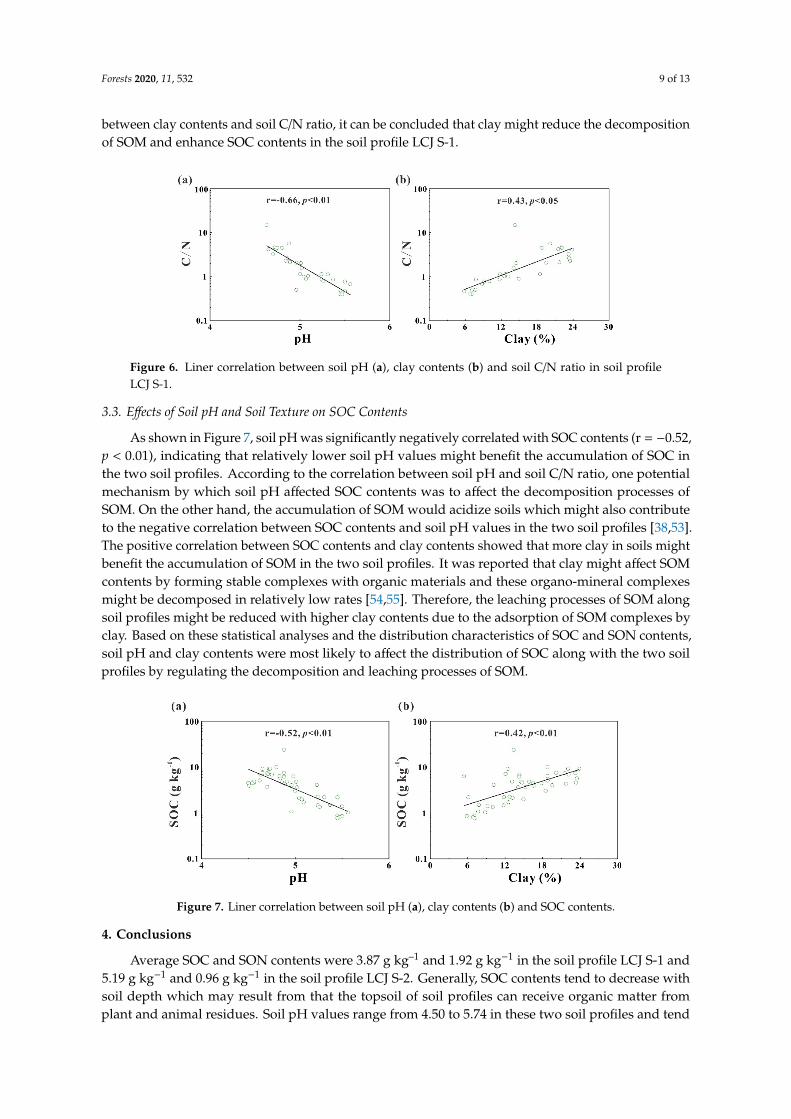
The decomposition of SOM might have been influenced by many soil properties, such as soil texture, soil pH and soil moisture content [46]. Soil C/N ratio might be an essential parameter in denoting soil decomposition processes and generally, SOM with lower C/N ratio would be decomposed into more mobile materials or nutrients that were easy to be utilized [43]. As shown in Figure 6, soil pH values were significantly negatively correlated with soil C/N ratios (r = −0.66, p < 0.01) while clay contents were positively correlated with soil C/N ratios (r = 0.43, p < 0.05) in the soil profile LCJ S-1. Because the SON contents of most samples in the soil profile LCJ S-2 were quite low (near the detection limit of Vario TOC cube), the soil profile was not included to ensure the accuracy of data analyses. The mathematical analysis result showed that the C/N ratios of SOM were significantly correlated with soil pH and clay contents in these two soil profiles. The result revealed a potential relationship between soil pH and the decomposition of SOM, denoting that soil pH might play an important role in regulating the decomposition processes. It was reported that soil pH can apparently influence the bacterial community structures and the changes in soil pH might cause the variations of microorganism’s diversity [47,48]. In terrestrial ecosystems, the decomposition of SOM depended almost entirely on microorganisms [5,38,49]. Therefore, soil pH might exert an influence on C/N ratios by altering the utilization of carbon and nitrogen by microorganisms in the two soil profiles. Meanwhile, soil C/N ratio was also regarded as an important factor that influenced the structure of soil microorganisms [5]. It could be referred that soil pH influenced the decomposition of SOM by controlling the activities of soil microorganisms to affect the C/N ratio of SOM in the two soil profiles. On the other hand, soil pH was reported to affect soil C/N ratios directly through changing plant litter quality, which might be the main mechanism by which soil pH affected soil C/N ratios in deep soils because the activities of microorganisms were expected to be lower in deep soils [7]. Overall, relatively higher soil pH values might accelerate the depletion of SOM when soil pH
Figure 5. Vertical distributions of clay (a), silt (b) and sand (c) percentages in soil profiles.
3.2. Effects of Soil pH and Soil Texture on the C/N Ratio
The decomposition of SOM might have been influenced by many soil properties, such as soiltexture, soil pH and soil moisture content [46]. Soil C/N ratio might be an essential parameter indenoting soil decomposition processes and generally, SOM with lower C/N ratio would be decomposedinto more mobile materials or nutrients that were easy to be utilized [43]. As shown in Figure 6,soil pH values were significantly negatively correlated with soil C/N ratios (r = −0.66, p < 0.01) whileclay contents were positively correlated with soil C/N ratios (r = 0.43, p < 0.05) in the soil profile LCJS-1. Because the SON contents of most samples in the soil profile LCJ S-2 were quite low (near thedetection limit of Vario TOC cube), the soil profile was not included to ensure the accuracy of dataanalyses. The mathematical analysis result showed that the C/N ratios of SOM were significantlycorrelated with soil pH and clay contents in these two soil profiles. The result revealed a potentialrelationship between soil pH and the decomposition of SOM, denoting that soil pH might play animportant role in regulating the decomposition processes. It was reported that soil pH can apparentlyinfluence the bacterial community structures and the changes in soil pH might cause the variationsof microorganism’s diversity [47,48]. In terrestrial ecosystems, the decomposition of SOM dependedalmost entirely on microorganisms [5,38,49]. Therefore, soil pH might exert an influence on C/Nratios by altering the utilization of carbon and nitrogen by microorganisms in the two soil profiles.Meanwhile, soil C/N ratio was also regarded as an important factor that influenced the structure ofsoil microorganisms [5]. It could be referred that soil pH influenced the decomposition of SOM bycontrolling the activities of soil microorganisms to affect the C/N ratio of SOM in the two soil profiles.On the other hand, soil pH was reported to affect soil C/N ratios directly through changing plant litterquality, which might be the main mechanism by which soil pH affected soil C/N ratios in deep soilsbecause the activities of microorganisms were expected to be lower in deep soils [7]. Overall, relativelyhigher soil pH values might accelerate the depletion of SOM when soil pH ranged from 4.50 to 5.74 inthe two soil profiles based on the relationship between soil pH and soil C/N ratio.
Soil texture was also considered as an important factor influencing the decomposition of organicmatter. Generally, it was reported to be more difficult for SOM associated with clay fraction to bedecomposed because finer particles had stronger surface adsorption [50,51]. In this study, clay contentswere positively correlated with C/N ratios (r = 0.43, p < 0.05) in the soil profile LCJ S-1 (Figure 6),indicating that the existence of clay could make SOM less easy to be decomposed and increase theSOM contents in soil profiles. Soil texture (especially the content of clay) was thought to have greatinfluences on the microbial biomass and stabilization of SOM [46,52]. Based on the correlation analysis
Forests 2020, 11, 532 9 of 13
between clay contents and soil C/N ratio, it can be concluded that clay might reduce the decompositionof SOM and enhance SOC contents in the soil profile LCJ S-1.
Forests 2020, 11, x FOR PEER REVIEW 9 of 13
ranged from 4.50 to 5.74 in the two soil profiles based on the relationship between soil pH and soil C/N ratio.
Figure 6. Liner correlation between soil pH (a), clay contents (b) and soil C/N ratio in soil profile LCJ S-1.
Soil texture was also considered as an important factor influencing the decomposition of organic matter. Generally, it was reported to be more difficult for SOM associated with clay fraction to be decomposed because finer particles had stronger surface adsorption [50,51]. In this study, clay contents were positively correlated with C/N ratios (r = 0.43, p < 0.05) in the soil profile LCJ S-1 (Figure 6), indicating that the existence of clay could make SOM less easy to be decomposed and increase the SOM contents in soil profiles. Soil texture (especially the content of clay) was thought to have great influences on the microbial biomass and stabilization of SOM [46,52]. Based on the correlation analysis between clay contents and soil C/N ratio, it can be concluded that clay might reduce the decomposition of SOM and enhance SOC contents in the soil profile LCJ S-1.
3.3. Effects of Soil pH and Soil Texture on SOC Contents
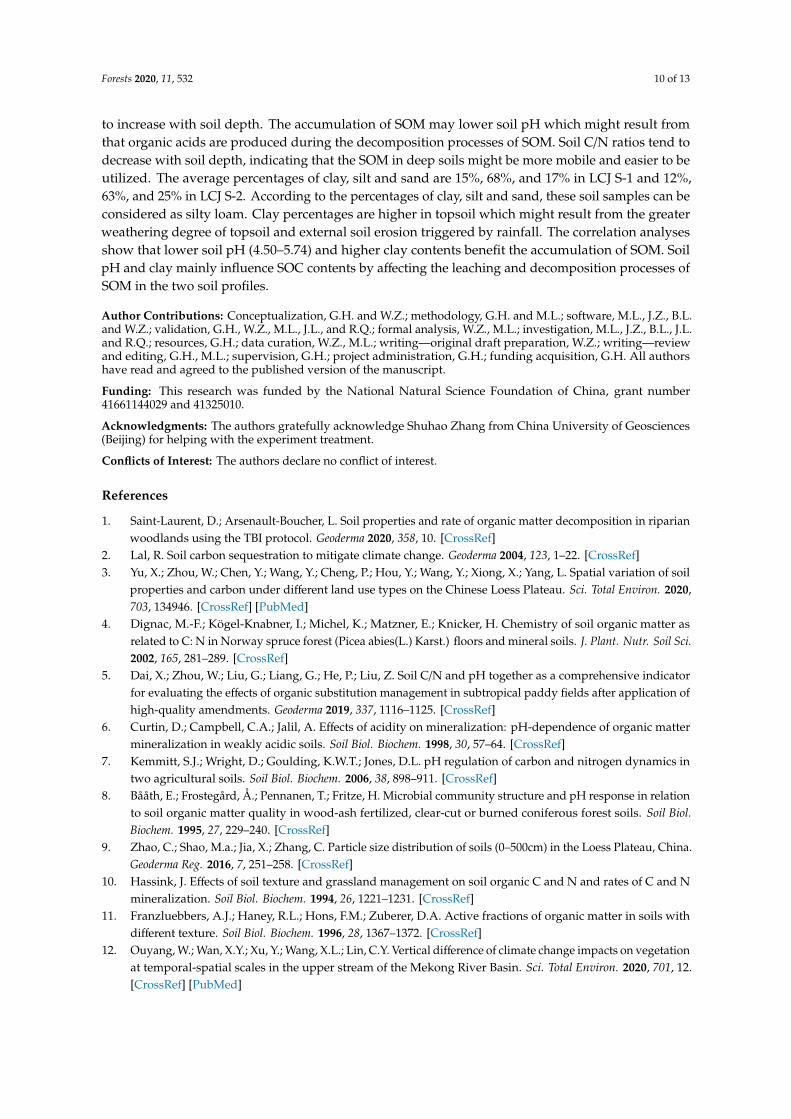
As shown in Figure 7, soil pH was significantly negatively correlated with SOC contents (r = −0.52, p < 0.01), indicating that relatively lower soil pH values might benefit the accumulation of SOC in the two soil profiles. According to the correlation between soil pH and soil C/N ratio, one potential mechanism by which soil pH affected SOC contents was to affect the decomposition processes of SOM. On the other hand, the accumulation of SOM would acidize soils which might also contribute to the negative correlation between SOC contents and soil pH values in the two soil profiles [38,53]. The positive correlation between SOC contents and clay contents showed that more clay in soils might benefit the accumulation of SOM in the two soil profiles. It was reported that clay might affect SOM contents by forming stable complexes with organic materials and these organo-mineral complexes might be decomposed in relatively low rates [54,55]. Therefore, the leaching processes of SOM along soil profiles might be reduced with higher clay contents due to the adsorption of SOM complexes by clay. Based on these statistical analyses and the distribution characteristics of SOC and SON contents, soil pH and clay contents were most likely to affect the distribution of SOC along with the two soil profiles by regulating the decomposition and leaching processes of SOM.
Figure 6. Liner correlation between soil pH (a), clay contents (b) and soil C/N ratio in soil profileLCJ S-1.
3.3. Effects of Soil pH and Soil Texture on SOC Contents
As shown in Figure 7, soil pH was significantly negatively correlated with SOC contents (r = −0.52,p < 0.01), indicating that relatively lower soil pH values might benefit the accumulation of SOC inthe two soil profiles. According to the correlation between soil pH and soil C/N ratio, one potentialmechanism by which soil pH affected SOC contents was to affect the decomposition processes ofSOM. On the other hand, the accumulation of SOM would acidize soils which might also contributeto the negative correlation between SOC contents and soil pH values in the two soil profiles [38,53].The positive correlation between SOC contents and clay contents showed that more clay in soils mightbenefit the accumulation of SOM in the two soil profiles. It was reported that clay might affect SOMcontents by forming stable complexes with organic materials and these organo-mineral complexesmight be decomposed in relatively low rates [54,55]. Therefore, the leaching processes of SOM alongsoil profiles might be reduced with higher clay contents due to the adsorption of SOM complexes byclay. Based on these statistical analyses and the distribution characteristics of SOC and SON contents,soil pH and clay contents were most likely to affect the distribution of SOC along with the two soilprofiles by regulating the decomposition and leaching processes of SOM.
Forests 2020, 11, x FOR PEER REVIEW 9 of 13
ranged from 4.50 to 5.74 in the two soil profiles based on the relationship between soil pH and soil C/N ratio.
Figure 6. Liner correlation between soil pH (a), clay contents (b) and soil C/N ratio in soil profile LCJ S-1.
Soil texture was also considered as an important factor influencing the decomposition of organic matter. Generally, it was reported to be more difficult for SOM associated with clay fraction to be decomposed because finer particles had stronger surface adsorption [50,51]. In this study, clay contents were positively correlated with C/N ratios (r = 0.43, p < 0.05) in the soil profile LCJ S-1 (Figure 6), indicating that the existence of clay could make SOM less easy to be decomposed and increase the SOM contents in soil profiles. Soil texture (especially the content of clay) was thought to have great influences on the microbial biomass and stabilization of SOM [46,52]. Based on the correlation analysis between clay contents and soil C/N ratio, it can be concluded that clay might reduce the decomposition of SOM and enhance SOC contents in the soil profile LCJ S-1.
3.3. Effects of Soil pH and Soil Texture on SOC Contents
As shown in Figure 7, soil pH was significantly negatively correlated with SOC contents (r = −0.52, p < 0.01), indicating that relatively lower soil pH values might benefit the accumulation of SOC in the two soil profiles. According to the correlation between soil pH and soil C/N ratio, one potential mechanism by which soil pH affected SOC contents was to affect the decomposition processes of SOM. On the other hand, the accumulation of SOM would acidize soils which might also contribute to the negative correlation between SOC contents and soil pH values in the two soil profiles [38,53]. The positive correlation between SOC contents and clay contents showed that more clay in soils might benefit the accumulation of SOM in the two soil profiles. It was reported that clay might affect SOM contents by forming stable complexes with organic materials and these organo-mineral complexes might be decomposed in relatively low rates [54,55]. Therefore, the leaching processes of SOM along soil profiles might be reduced with higher clay contents due to the adsorption of SOM complexes by clay. Based on these statistical analyses and the distribution characteristics of SOC and SON contents, soil pH and clay contents were most likely to affect the distribution of SOC along with the two soil profiles by regulating the decomposition and leaching processes of SOM.
Figure 7. Liner correlation between soil pH (a), clay contents (b) and SOC contents.
4. Conclusions
Average SOC and SON contents were 3.87 g kg–1 and 1.92 g kg−1 in the soil profile LCJ S-1 and5.19 g kg−1 and 0.96 g kg−1 in the soil profile LCJ S-2. Generally, SOC contents tend to decrease withsoil depth which may result from that the topsoil of soil profiles can receive organic matter fromplant and animal residues. Soil pH values range from 4.50 to 5.74 in these two soil profiles and tend
Forests 2020, 11, 532 10 of 13
to increase with soil depth. The accumulation of SOM may lower soil pH which might result fromthat organic acids are produced during the decomposition processes of SOM. Soil C/N ratios tend todecrease with soil depth, indicating that the SOM in deep soils might be more mobile and easier to beutilized. The average percentages of clay, silt and sand are 15%, 68%, and 17% in LCJ S-1 and 12%,63%, and 25% in LCJ S-2. According to the percentages of clay, silt and sand, these soil samples can beconsidered as silty loam. Clay percentages are higher in topsoil which might result from the greaterweathering degree of topsoil and external soil erosion triggered by rainfall. The correlation analysesshow that lower soil pH (4.50–5.74) and higher clay contents benefit the accumulation of SOM. SoilpH and clay mainly influence SOC contents by affecting the leaching and decomposition processes ofSOM in the two soil profiles.
Author Contributions: Conceptualization, G.H. and W.Z.; methodology, G.H. and M.L.; software, M.L., J.Z., B.L.and W.Z.; validation, G.H., W.Z., M.L., J.L., and R.Q.; formal analysis, W.Z., M.L.; investigation, M.L., J.Z., B.L., J.L.and R.Q.; resources, G.H.; data curation, W.Z., M.L.; writing—original draft preparation, W.Z.; writing—reviewand editing, G.H., M.L.; supervision, G.H.; project administration, G.H.; funding acquisition, G.H. All authorshave read and agreed to the published version of the manuscript.
Funding: This research was funded by the National Natural Science Foundation of China, grant number41661144029 and 41325010.
Acknowledgments: The authors gratefully acknowledge Shuhao Zhang from China University of Geosciences(Beijing) for helping with the experiment treatment.
Conflicts of Interest: The authors declare no conflict of interest.
References
1. Saint-Laurent, D.; Arsenault-Boucher, L. Soil properties and rate of organic matter decomposition in riparianwoodlands using the TBI protocol. Geoderma 2020, 358, 10. [CrossRef]
2. Lal, R. Soil carbon sequestration to mitigate climate change. Geoderma 2004, 123, 1–22. [CrossRef]3. Yu, X.; Zhou, W.; Chen, Y.; Wang, Y.; Cheng, P.; Hou, Y.; Wang, Y.; Xiong, X.; Yang, L. Spatial variation of soil
properties and carbon under different land use types on the Chinese Loess Plateau. Sci. Total Environ. 2020,703, 134946. [CrossRef] [PubMed]
4. Dignac, M.-F.; Kögel-Knabner, I.; Michel, K.; Matzner, E.; Knicker, H. Chemistry of soil organic matter asrelated to C: N in Norway spruce forest (Picea abies(L.) Karst.) floors and mineral soils. J. Plant. Nutr. Soil Sci.2002, 165, 281–289. [CrossRef]
5. Dai, X.; Zhou, W.; Liu, G.; Liang, G.; He, P.; Liu, Z. Soil C/N and pH together as a comprehensive indicatorfor evaluating the effects of organic substitution management in subtropical paddy fields after application ofhigh-quality amendments. Geoderma 2019, 337, 1116–1125. [CrossRef]
6. Curtin, D.; Campbell, C.A.; Jalil, A. Effects of acidity on mineralization: pH-dependence of organic mattermineralization in weakly acidic soils. Soil Biol. Biochem. 1998, 30, 57–64. [CrossRef]
7. Kemmitt, S.J.; Wright, D.; Goulding, K.W.T.; Jones, D.L. pH regulation of carbon and nitrogen dynamics intwo agricultural soils. Soil Biol. Biochem. 2006, 38, 898–911. [CrossRef]
8. Bååth, E.; Frostegård, Å.; Pennanen, T.; Fritze, H. Microbial community structure and pH response in relationto soil organic matter quality in wood-ash fertilized, clear-cut or burned coniferous forest soils. Soil Biol.Biochem. 1995, 27, 229–240. [CrossRef]
9. Zhao, C.; Shao, M.a.; Jia, X.; Zhang, C. Particle size distribution of soils (0–500cm) in the Loess Plateau, China.Geoderma Reg. 2016, 7, 251–258. [CrossRef]
10. Hassink, J. Effects of soil texture and grassland management on soil organic C and N and rates of C and Nmineralization. Soil Biol. Biochem. 1994, 26, 1221–1231. [CrossRef]
11. Franzluebbers, A.J.; Haney, R.L.; Hons, F.M.; Zuberer, D.A. Active fractions of organic matter in soils withdifferent texture. Soil Biol. Biochem. 1996, 28, 1367–1372. [CrossRef]
12. Ouyang, W.; Wan, X.Y.; Xu, Y.; Wang, X.L.; Lin, C.Y. Vertical difference of climate change impacts on vegetationat temporal-spatial scales in the upper stream of the Mekong River Basin. Sci. Total Environ. 2020, 701, 12.[CrossRef] [PubMed]
Forests 2020, 11, 532 11 of 13
13. Hoke, G.D.; Liu-Zeng, J.; Hren, M.T.; Wissink, G.K.; Garzione, C.N. Stable isotopes reveal high southeastTibetan Plateau margin since the Paleogene. Earth Planet. Sci. Lett. 2014, 394, 270–278. [CrossRef]
14. Zhang, L.L.; Zhao, Z.Q.; Zhang, W.; Tao, Z.H.; Huang, L.; Yang, J.X.; Wu, Q.X.; Liu, C.Q. Characteristicsof water chemistry and its indication of chemical weathering in Jinshajiang, Lancangjiang and Nujiangdrainage basins. Environ. Earth Sci. 2016, 75, 18. [CrossRef]
15. Liu, J.K.; Han, G.L.; Liu, M.; Zeng, J.; Liang, B.; Qu, R. Distribution, Sources and Water Quality Evaluation ofthe Riverine Solutes: A Case Study in the Lancangjiang River Basin, Tibetan Plateau. Int. J. Environ. Res.Public Health 2019, 16, 4670. [CrossRef]
16. Hu, B.; Cui, B.S.; Dong, S.K.; Zhai, H.J.; Liu, Z.Y. Ecological Water Requirement (EWR) Analysis of HighMountain and Steep Gorge (HMSG) River-Application to Upper Lancang-Mekong River. Water Resour.Manag. 2009, 23, 341–366.
17. Fan, X.M.; Luo, X. Precipitation and Flow Variations in the Lancang-Mekong River Basin and the Implicationsof Monsoon Fluctuation and Regional Topography. Water 2019, 11, 2086. [CrossRef]
18. Yang, K.H.; Han, G.L.; Zeng, J.; Liang, B.; Qu, R.; Liu, J.K.; Liu, M. Spatial Variation and Controlling Factorsof H and O Isotopes in Lancang River Water, Southwest China. Int. J. Environ. Res. Public Health 2019, 16,4932. [CrossRef]
19. Costa-Cabral, M.C.; Richey, J.E.; Goteti, G.; Lettenmaier, D.P.; Feldkotter, C.; Snidvongs, A. Landscapestructure and use, climate, and water movement in the Mekong River basin. Hydrol. Process. 2008, 22,1731–1746. [CrossRef]
20. Li, J.P.; Dong, S.K.; Yang, Z.F.; Peng, M.C.; Liu, S.L.; Li, X.Y. Effects of cascade hydropower dams on thestructure and distribution of riparian and upland vegetation along the middle-lower Lancang-Mekong River.Forest Ecol. Manag. 2012, 284, 251–259. [CrossRef]
21. Zhao, Q.; Liu, S.; Deng, L.; Dong, S.; Yang, Z.; Liu, Q. Determining the influencing distance of damconstruction and reservoir impoundment on land use: A case study of Manwan Dam, Lancang River.Ecol. Eng. 2013, 53, 235–242. [CrossRef]
22. Durr, H.H.; Meybeck, M.; Durr, S.H. Lithologic composition of the Earth’s continental surfaces derived froma new digital map emphasizing riverine material transfer. Glob. Biogeochem. Cycles 2005, 19, 23. [CrossRef]
23. Langan, S.J.; Reynolds, B.; Bain, D.C. The calculation of base cation release from mineral weathering in soilsderived from Palaeozoic greywackes and shales in upland UK. Geoderma 1996, 69, 275–285. [CrossRef]
24. Zhao, Z.; Liu, G.; Liu, Q.; Huang, C.; Li, H.; Wu, C. Distribution Characteristics and Seasonal Variation ofSoil Nutrients in the Mun River Basin, Thailand. Int. J. Environ. Res. Public Health 2018, 15, 1818. [CrossRef][PubMed]
25. Hyodo, F.; Tayasu, I.; Konate, S.; Tondoh, J.E.; Lavelle, P.; Wada, E. Gradual enrichment of N-15 withhumification of diets in a below-ground food web: Relationship between N-15 and diet age determinedusing C-14. Funct. Ecol. 2008, 22, 516–522. [CrossRef]
26. Potapov, A.M.; Goncharov, A.A.; Semenina, E.E.; Korotkevich, A.Y.; Tsurikov, S.M.; Rozanova, O.L.;Anichkin, A.E.; Zuev, A.G.; Samoylova, E.S.; Semenyuk, I.I.; et al. Arthropods in the subsoil: Abundanceand vertical distribution as related to soil organic matter, microbial biomass and plant roots. Eur. J. Soil Boil.2017, 82, 88–97. [CrossRef]
27. FAO; ISRIC; ISSS. World Reference Base for Soil Resources; World Soil Resources Reports; FAO: Rome, Italy,1998.
28. Munsell, A. Munsell Soil Color Charts, revised ed; Macbeth Division of Kollmorgen Instruments: Baltimore,MD, USA, 1990.
29. Liu, M.; Han, G.; Zhang, Q. Effects of agricultural abandonment on soil aggregation, soil organiccarbon storage and stabilization: Results from observation in a small karst catchment, Southwest China.Agric. Ecosyst. Environ. 2020, 288, 106719. [CrossRef]
30. Qu, R.; Han, G.L.; Liu, M.; Li, X.Q. The Mercury Behavior and Contamination in Soil Profiles in Mun RiverBasin, Northeast Thailand. Int. J. Environ. Res. Public Health 2019, 16, 4131. [CrossRef]
31. Liu, M.; Han, G.; Zhang, Q.; Song, Z. Variations and Indications of δ13CSOC and δ15NSON in Soil Profiles inKarst Critical Zone Observatory (CZO), Southwest China. Sustainability 2019, 11, 2144. [CrossRef]
32. Zeng, J.; Han, G.; Wu, Q.; Tang, Y. Effects of agricultural alkaline substances on reducing therainwater acidification: Insight from chemical compositions and calcium isotopes in a karst forests area.Agric. Ecosyst. Environ. 2020, 290, 106782. [CrossRef]
Forests 2020, 11, 532 12 of 13
33. Kachurina, O.M.; Zhang, H.; Raun, W.R.; Krenzer, E.G. Simultaneous determination of soil aluminum,ammonium- and nitrate-nitrogen using 1 M potassium chloride extraction. Commun. Soil Sci. Plant. Anal.2000, 31, 893–903. [CrossRef]
34. Midwood, A.J.; Boutton, T.W. Soil carbonate decomposition by acid has little effect on δ13C of organic matter.Soil Biol. and Biochem. 1998, 30, 1301–1307. [CrossRef]
35. Navas, A.; Gaspar, L.; Quijano, L.; López-Vicente, M.; Machín, J. Patterns of soil organic carbon and nitrogenin relation to soil movement under different land uses in mountain fields (South Central Pyrenees). Catena2012, 94, 43–52. [CrossRef]
36. Han, G.L.; Song, Z.L.; Tang, Y.; Wu, Q.X.; Wang, Z.R. Ca and Sr isotope compositions of rainwater fromGuiyang city, Southwest China: Implication for the sources of atmospheric aerosols and their seasonalvariations. Atmos. Environ. 2019, 214, 10. [CrossRef]
37. Vinther, F.P.; Hansen, E.M.; Eriksen, J. Leaching of soil organic carbon and nitrogen in sandy soils aftercultivating grass-clover swards. Biol. Fertil. Soils 2006, 43, 12–19. [CrossRef]
38. Zhou, W.X.; Han, G.L.; Liu, M.; Li, X.Q. Effects of soil pH and texture on soil carbon and nitrogen in soilprofiles under different land uses in Mun River Basin, Northeast Thailand. PeerJ 2019, 7, 15. [CrossRef]
39. Hong, S.; Gan, P.; Chen, A. Environmental controls on soil pH in planted forest and its response to nitrogendeposition. Environ. Res. 2019, 172, 159–165. [CrossRef]
40. Falkengren-Grerup, U.; ten Brink, D.J.; Brunet, J. Land use effects on soil N, P, C and pH persist over 40-80years of forest growth on agricultural soils. Forest Ecol. Manag. 2006, 225, 74–81. [CrossRef]
41. Han, G.; Li, F.; Tang, Y. Variations in soil organic carbon contents and isotopic compositions under differentland uses in a typical karst area in Southwest China. Geochem. J. 2015, 49, 63–71. [CrossRef]
42. Zeng, J.; Yue, F.-J.; Wang, Z.-J.; Wu, Q.; Qin, C.-Q.; Li, S.-L. Quantifying depression trapping effect onrainwater chemical composition during the rainy season in karst agricultural area, southwestern China.Atmos. Environ. 2019, 218, 116998. [CrossRef]
43. Wan, X.H.; Huang, Z.Q.; He, Z.M.; Yu, Z.P.; Wang, M.H.; Davis, M.R.; Yang, Y.S. Soil C:N ratio is the majordeterminant of soil microbial community structure in subtropical coniferous and broadleaf forest plantations.Plant. Soil 2015, 387, 103–116. [CrossRef]
44. Xia, D.; Deng, Y.S.; Wang, S.L.; Ding, S.W.; Cai, C.F. Fractal features of soil particle-size distribution ofdifferent weathering profiles of the collapsing gullies in the hilly granitic region, south China. Nat. Hazards2015, 79, 455–478. [CrossRef]
45. Zhao, P.; Shao, M.A.; Omran, W.; Amer, A.M.M. Effects of erosion and deposition on particle size distributionof deposited farmland soils on the Chinese loess plateau. Rev. Bras. Cienc. Solo 2011, 35, 2135–2144.[CrossRef]
46. Xu, J.M.; Tang, C.; Chen, Z.L. Chemical composition controls residue decomposition in soils differing ininitial pH. Soil Biol. Biochem. 2006, 38, 544–552. [CrossRef]
47. Lauber, C.L.; Hamady, M.; Knight, R.; Fierer, N. Pyrosequencing-Based Assessment of Soil pH as a Predictorof Soil Bacterial Community Structure at the Continental Scale. Appl. Environ. Microbiol. 2009, 75, 5111–5120.[CrossRef] [PubMed]
48. Tripathi, B.M.; Stegen, J.C.; Kim, M.; Dong, K.; Adams, J.M.; Lee, Y.K. Soil pH mediates the balance betweenstochastic and deterministic assembly of bacteria. ISME J. 2018, 12, 1072–1083. [CrossRef] [PubMed]
49. Gregorich, E.G.; Carter, M.R.; Angers, D.A.; Monreal, C.M.; Ellert, B.H. Towards a minimum data set toassess soil organic-matter quality in agricultural soils. Can. J. Soil Sci. 1994, 74, 367–385. [CrossRef]
50. Gelaw, A.M.; Singh, B.R.; Lal, R. Organic Carbon and Nitrogen Associated with Soil Aggregates and ParticleSizes Under Different Land Uses in Tigray, Northern Ethiopia. Land Degrad. Dev. 2015, 26, 690–700.[CrossRef]
51. Wang, W.J.; Dalal, R.C.; Moody, P.W.; Smith, C.J. Relationships of soil respiration to microbial biomass,substrate availability and clay content. Soil Biol. Biochem. 2003, 35, 273–284. [CrossRef]
52. Christensen, B.T. Physical fractionation of soil and structural and functional complexity in organic matterturnover. Eur. J. Soil Sci. 2001, 52, 345–353. [CrossRef]
53. Ritchie, G.; Dolling, P. The role of organic matter in soil acidification. Soil Res. 1985, 23, 569–576. [CrossRef]

Forests 2020, 11, 532 13 of 13
54. Sims, Z.R.; Nielsen, G.A. Organic Carbon in Montana Soils as Related to Clay Content and Climate. Soil Sci.Soc. Am. J. 1986, 50, 1269–1271. [CrossRef]
55. Rutherford, P.M.; Juma, N.G. Influence of soil texture on protozoa-induced mineralization of bacterial carbonand nitrogen. Can. J. Soil Sci. 1992, 72, 183–200. [CrossRef]
© 2020 by the authors. Licensee MDPI, Basel, Switzerland. This article is an open accessarticle distributed under the terms and conditions of the Creative Commons Attribution(CC BY) license (http://creativecommons.org/licenses/by/4.0/).