Determining lineaments and geomorphic features using Landsat 5-TM data on lower Bakırçay plain,...
11
Ege Coğrafya Dergisi, 13 (2004), 47-57, İzmir Aegean Geographical Journal, 13 (2004), 47-57, Izmir—TURKEY DETERMINING LINEAMENTS AND GEOMORPHIC FEATURES USING LANDSAT 5-TM DATA ON THE LOWER BAKIRÇAY PLAIN, WESTERN TURKEY Landsat 5-TM Uydu Görüntüleri Kullanarak Aşağı Bakırçay Ovası’nda Çizgiselliklerin ve Jeomorfolojik Özelliklerin Belirlenmesi M. Kirami ÖLGEN Ege Üniversitesi Edebiyat Fakültesi Coğrafya Bölümü 35100 Bornova-İzmir [email protected] Abstract The lineament analysis was carried out in this study. Earth scientists have been interested in linear features on the earth’s crust since the early period of earth observations. The linear features, which are faults, folds, and fractures, can give a clue for explorations of ore, oil and ground water. They are also important in some engineering applications such as dam, road and power plant construction or determining new settlement sites. Using visual interpretation, determining the lineaments on the satellite image is very difficult and subjective and it requires an experienced interpreter. However, using digital mapping it is possible to obtain structural and lithological information more efficiently and cost effectively for tectonic areas than can be achieved on the ground using automated or semi - automated lineament analysis. In this study, the lineament analyses was undertaken to examine the orientation of lineament, the relationship between lineaments and geologic structures and tectonic features. For this purpose, all lineaments were obtained using the edge enhancement filters and principal component analysis together. Fifty-seven lineaments determined. The earthquake epicentre was linked to the lineament map and nineteen possibly new faults were determined, which had not been previously identified. In addition some geological and geomorphologic features were identified due to tonal and texture variations on the image. Keywords: The Lower Bakırçay Plain, Remote Sensing, Lineaments Öz Yerbilimciler, yerkabuğundaki çizgisel özelliklerle yerin gözlenmeye başladığı antik dönemlerden beri ilgilenmişlerdir. Faylar, kıvrımlar ve kırıklar gibi bu çizgisellikler maden, petrol ve yeraltı suyu araştırmaları için önemli ipuçları sağlamaktadırlar. Aynı zamanda baraj, yol, enerji santralleri inşaatı veya yeni yerleşim alanlarının belirlenmesi için de oldukça önemlidirler. Uydu görüntüleri üzerinde çizgiselliklerin görsel yorumu oldukça zordur ve iyi deneyim gerektirir. Bununla birlikte, otomatik veya yarı-otomatik çizgisellik analizleri kullanarak tektonik çizgiselliklerin belirlenmesi büyük zaman ve para tasarrufu sağlar. Bu çalışmada, çizgiselliklerin yönleri ve çizgiselliklerle tektonik ve jeolojik
Transcript of Determining lineaments and geomorphic features using Landsat 5-TM data on lower Bakırçay plain,...
Ege Coğrafya Dergisi, 13 (2004), 47-57, İzmirAegean Geographical Journal, 13 (2004), 47-57, Izmir—TURKEY
DETERMINING LINEAMENTS AND GEOMORPHIC FEATURES USING LANDSAT 5-TM DATA ON THE LOWER BAKIRÇAY PLAIN,
WESTERN TURKEY
Landsat 5-TM Uydu Görüntüleri Kullanarak Aşağı Bakırçay Ovası’nda Çizgiselliklerin ve Jeomorfolojik Özelliklerin Belirlenmesi
M. Kirami ÖLGEN
Ege Üniversitesi Edebiyat Fakültesi Coğrafya Bölümü 35100 Bornova-İzmir [email protected]
Abstract
The lineament analysis was carried out in this study. Earth scientists have been interested in linear features on the earth’s crust since the early period of earth observations. The linear features, which are faults, folds, and fractures, can give a clue for explorations of ore, oil and ground water. They are also important in some engineering applications such as dam, road and power plant construction or determining new settlement sites. Using visual interpretation, determining the lineaments on the satellite image is very difficult and subjective and it requires an experienced interpreter. However, using digital mapping it is possible to obtain structural and lithological information more efficiently and cost effectively for tectonic areas than can be achieved on the ground using automated or semi - automated lineament analysis. In this study, the lineament analyses was undertaken to examine the orientation of lineament, the relationship between lineaments and geologic structures and tectonic features. For this purpose, all lineaments were obtained using the edge enhancement filters and principal component analysis together. Fifty-seven lineaments determined. The earthquake epicentre was linked to the lineament map and nineteen possibly new faults were determined, which had not been previously identified. In addition some geological and geomorphologic features were identified due to tonal and texture variations on the image.
Keywords: The Lower Bakırçay Plain, Remote Sensing, Lineaments
Öz
Yerbilimciler, yerkabuğundaki çizgisel özelliklerle yerin gözlenmeye başladığı antik dönemlerden beri ilgilenmişlerdir. Faylar, kıvrımlar ve kırıklar gibi bu çizgisellikler maden, petrol ve yeraltı suyu araştırmaları için önemli ipuçları sağlamaktadırlar. Aynı zamanda baraj, yol, enerji santralleri inşaatı veya yeni yerleşim alanlarının belirlenmesi için de oldukça önemlidirler. Uydu görüntüleri üzerinde çizgiselliklerin görsel yorumu oldukça zordur ve iyi deneyim gerektirir. Bununla birlikte, otomatik veya yarı-otomatik çizgisellik analizleri kullanarak tektonik çizgiselliklerin belirlenmesi büyük zaman ve para tasarrufu sağlar. Bu çalışmada, çizgiselliklerin yönleri ve çizgiselliklerle tektonik ve jeolojik
M. Kirami ÖLGEN
EGE COĞRAFYA DERGİSİ
Aegean Geographical Journal, VOL. 13, 47-57, (2004)
48
unsurlar arasındaki ilişkiler araştırılmıştır. Bu amaçla, tüm çizgisellikler, Kenar Zenginleştirme Filtreleri ve Temel Bileşen Analizi uygulanarak belirlenmiş ve bu çizgisellikler deprem odakları ile ilişkilendirilerek, daha önce tanımlanmamış ondokuz muhtemel yeni fay saptanmıştır. Ayrıca görüntü üzerindeki tonal değişiklikler yardımıyla jeolojik ve jeomorfolojik özellikler belirlenmeye çalışılmıştır.
Anahtar Kelimeler: Aşağı Bakırçay Ovası, Uzaktan Algılama, Çizgisellik
Introduction This paper describes lineaments and geomorphic units delineated from digital satellite images of the Lower Bakırçay Valley, Western Turkey. The aim of the study is part of a larger effort to understand the tectonic regime and structural gemorphic responses that have formed the area.
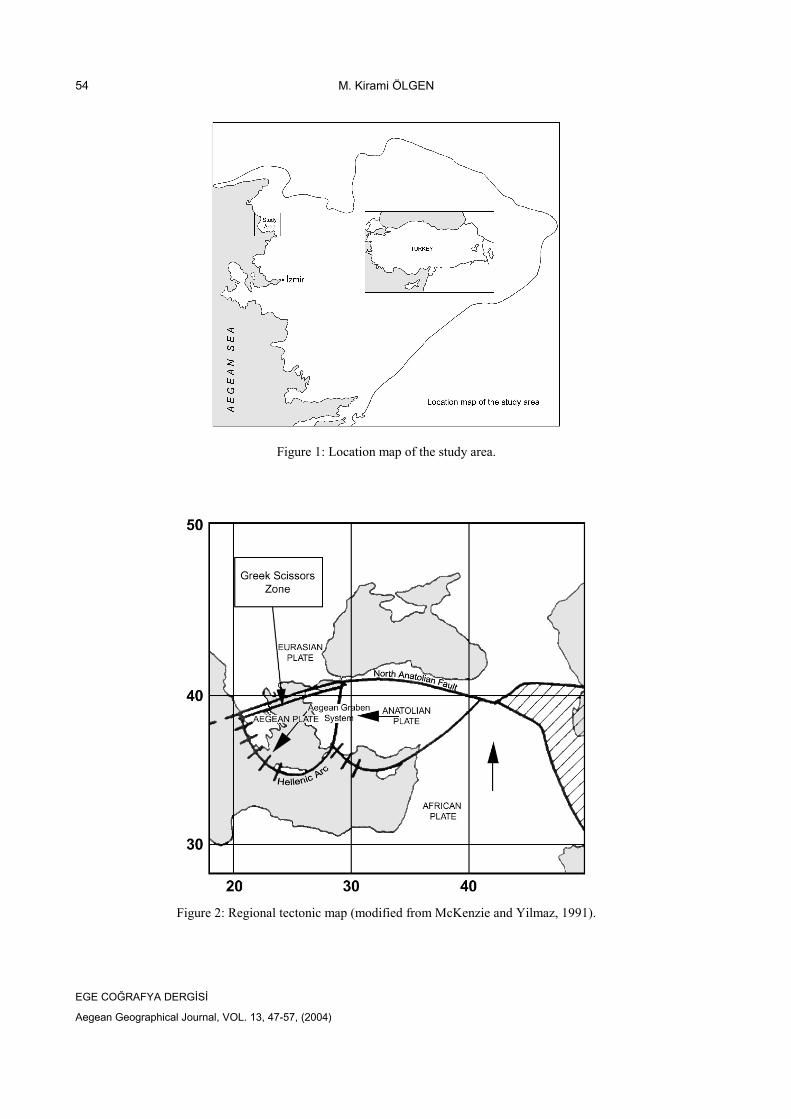
The study area is situated in the northern part of the Aegean region, 100 kms. From İzmir and stretches from Dikili to Çandarlı Bay (Figure 1). Rectangular in shape, it covers 47740 ha. Elevation varies between 0 – 750 m.
The lower Bakırçay plain is the one of the four main Aegean coastal plains, which has similar characteristics in both landscape and land use with others.
The geomorphology of the Aegean region are, the tectonic grabens in an East-West direction, the alluvial plains (flood plains) formed by the rivers in these grabens, and the coastal zone deltaic plains. Although the general view is simply as stated above, some differences attract attention: the properties of the depressions and the factors that effect their formation. For example, in reality the depressions in the East – West direction do not show continuity from inner parts to the coast. Because of the big mountain blocks in front of the rivers, they change their direction near the coastal zones, and the rivers which are located in this area arrive at the sea after passing through gorges.
Geological settings The geology of the lower Bakırçay valley is a part of the complex geology of the Western Anatolia and the Eastern Mediterranean. The rocks and structures of the study area reflect the tectonic outline and basin development sequences of the Aegean region (Figure 2). The closing movement
of the Mediterranean in the north-south direction and the westward movement of Anatolia have contributed to the production, as well as uplift and exposure of metamorphosed rocks. Extrusive igneous materials overlie these, in turn. The rocks have also been subjected to lateral motion that created low angle faults. This regional crustal movements (uplift) and tensions generated a series of horsts and grabens fringed by vertical faults.
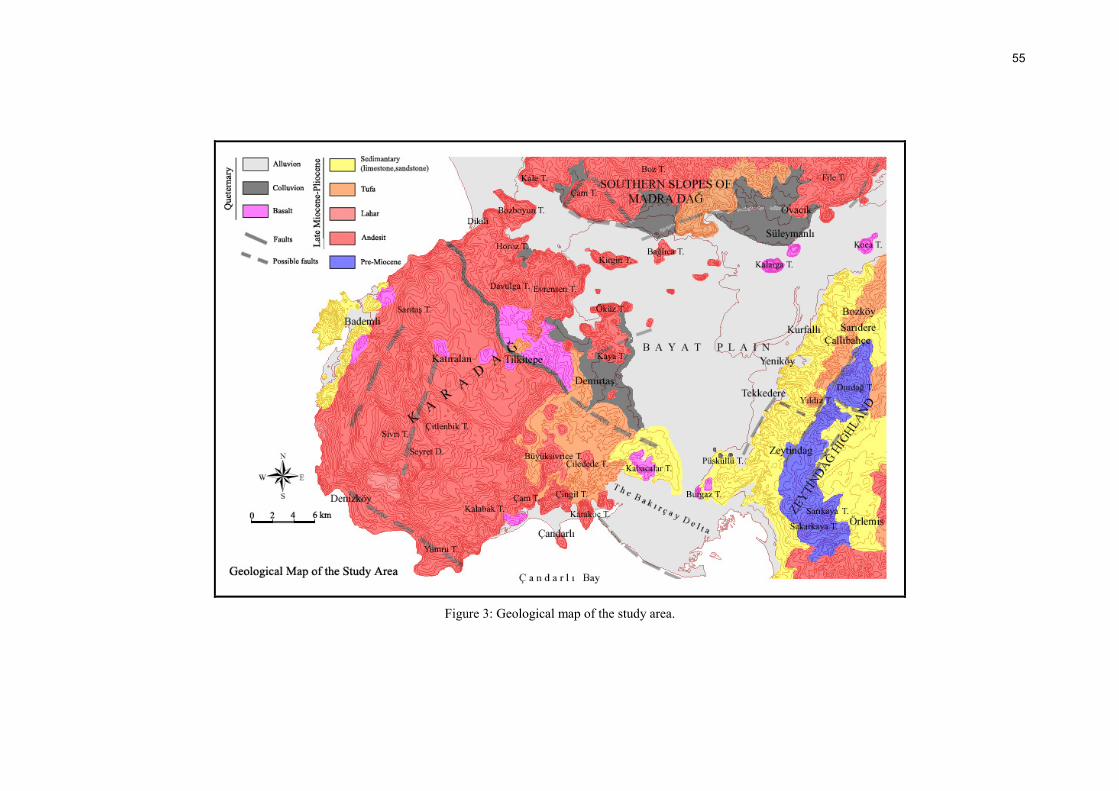
The study area has a complex geological structure and history. Due to tectonic activity, the relationship between the various lithological groups is not as simple as it at first appears. The dominant rock types are the volcanics which are located in the northern, western and eastern part of the study area, which vary in age from Tertiary to Quaternary. The second common rock types are sedimantaries of Tertiary age which are located in the eastern and southern part of the area association at the top (Akyürek and Soysal, 1993). The central part of the area is covered by Quaternary alluvial deposits (Figure 3).
The Lineament Analysis Earth scientists have been interested with linear features on the earth’s crust since the early period of earth observations. The linear features, which are relevant with faults, folds, and fractures, can give a clue for explorations of ore, oil and ground water. They are also important in some engineering applications such as dam, road and power plant construction or determining new settlement.
Some researchers explain the lineament term in the remote sensing context. For example, Isiorho (1985) explain lineaments as “traces on the earth’s surface of planar breaks in the crust of the earth”. Drury and Walker (1987), “Lineaments, which is correctly applied to long, often subtle, linear arrangements of various topographic, tonal,
Determining Lineaments and Geomorphic Features Using Landsat 5-TM Data On The Lower Bakırçay Plain, Western Turkey
EGE COĞRAFYA DERGİSİ
Aegean Geographical Journal, VOL. 13, 47-57, (2004)
49
geological and even geophysical and geochemical features”. According to Cracknell and Heyes (1993), “Lineaments are the terrain surface expression of fractures, jointing and other linear geological phenomena that occur anywhere from the terrain surface down to possibly great depths”.
Not only the lineaments can be tectonic features such as faults, folds, joints and fractures, but they can also be other natural features, such as steep to vertical strata, rivers, vegetation and some cultural features such as roads and boundaries between areas of different agricultural use.
Using visual interpretation, determining the lineaments on the satellite image is very difficult and subjective and it is requesting experienced interpreter, however, it is possible to obtain structural and lithological information efficiently and cost effectively for tectonic areas than can be achieved on the ground using automated or semi-automated lineament analysis. These are application of some image processing techniques such as edge enhancement and principal component analysis.
In remote sensing literature, several studies have been focused on lineament analysis such as; Sesören (1984) studied the geological and geomorphological features of the Netherlands. Sesören determined the lineaments from Landsat MSS image and compared with real faults on the alluvial plains. Isiorho (1985) carried out a lineament map of the 1:250 000 scaled in the Benue trough of Nigeria is presented that is derived from Landsat and radar images. He determined two general trends of the lineaments correspond to the structural trend of the Nigerian basement rocks. Ananaba and Ajakaiye (1987) made a lineament density map of Nigeria using 30 Landsat frames. The lineament density map has been compared with the primary mineral occurrences map and results shows good correlation between the areas of high lineament density and the areas where the occurrences of most primary minerals and also this correlation suggests that primary mineralisation is tectonically controlled. Stefouli and Angelopulos (1990) studied integration of Landsat and aero-magnetic data to structural analysis in Crete and Southeast Peloponessus. They derived the lineaments from
Landsat data and compared them with aero-magnetic data and determined several significant structural features, which previously unrecognised from separate interpretations of aero-magnetic and Landsat data. Ghosh and Viswanatham (1991) examined the tectonically active Mendha river basin, Rajatshan, India. The lineaments were extracted through digital analysis of principal component and directional filtered images. They generated neo-tectonic features map using the analysed images and limited field observations. Kamel and Elsirafe (1994) integrated photo-geological – geophysical study with the delineation and analysis of the structural lineament pattern and potential earthquake activity in the surroundings of the Aswan region, Upper Egypt.
The expression of the lineaments is discussed in detail above. As a result, the lineaments are defined as a line feature or pattern interpreted on a remote sensing image. The lineaments can reflect the geological structure. In this sense, the lineament extraction is very important for the application of remote sensing to geology. It should be discriminated from other line features that are not due to geological structures. Therefore the lineament extraction should be carefully interpreted by geologists. For this purpose, recognition of faults and joints on the image could be very useful for extracting the lineaments related with tectonic features.
Faults are recognised by various criteria. 1) Offsets of layers so that units (and age) that are different become juxtaposed, 2) abrupt topographic discontinuities of landforms, 3) depressions along the fault trace (broken rock is more easily eroded), 4) scarps or cliffs, 5) sudden shifts of drainage courses. The lineaments that fit with these features (explained above) can indicate to the real faults. Furthermore, comparing with real faults determined previously can also be useful.
In this section, the lineament analysis was undertaken to examine the prevalent orientation of lineament, the relationship between the lineaments and geologic structures and tectonic features, and also determining new faults that they had not been recognised before.
M. Kirami ÖLGEN
EGE COĞRAFYA DERGİSİ
Aegean Geographical Journal, VOL. 13, 47-57, (2004)
50
Methodology Remotely sensed data acquisition
and pre-processing The Landsat TM image (path 181, row 33) acquired on 31 December 1989. The digital analysis of the remotely sensed data was conducted with ERDAS IMAGINE version 8.4 software configured in SUN Sparc 10 workstation in the Geography Laboratory, University of Sussex. To reduce computational time, a subset was created from the full scene image. The Landsat TM data were registered geometrically to the Universal Transversal Mercator (UTM) using a second order polynomial and nearest neighbour resampling (root mean square error of ± 2.1 pixels) with selected ground control points on both image and geological map of the area.
To obtain the best images for lineament analysis and identification, the geocorrected data were digitally enhanced using band-ratio techniques, linear and Gausian nonlinear stretching, and principal component analysis (PCA). A series of directional edge enhancement filters were applied to enhance the lineaments contained in the image. The resultant images were visually assessed to determine the best combination for mapping linear features.
Generation of the Edge Enhancement Filtered Image
Campbell (1996) explains the Edge Enhancement as generally the human eye favours sharp and distinctive lines between adjacent regions of a picture. Unfortunately, the presence of noise and coarse resolution tends to blur or weaken the distinctive edges in a picture. In order to restore this visual distinctiveness a technique called Edge Enhancement is used. The technique is based on the strengthening of local contrast. A typical edge enhancement algorithm has a window, which is systematically moved through the image, centred successively on each pixel. A local average of values can be calculated at each position; the central value can be compared to the averages of near pixels. If the value exceeds a specified difference from this average, the value can be
altered to accentuate the difference in brightness between the two regions.
The edge enhancement convolution filter was applied to all TM Bands except Band 6 (thermal infrared). In a Landsat TM data set, all bands have 30 meter resolution except Band 6 which has 120 meters.
Generation of Principal Component (PCA) Image
Principal Component Analysis is often used as a method of data compression. In an n-dimensional histogram, an ellipse (2 dimensions), ellipsoid (3 dimensions) or hyper-ellipsoid (more than 3 dimensions) is formed if the distributions of each input band are normal or near normal (Erdas, 1997). The PCA has the following advantages: (1) most of the variance in a multi-spectral data set is compressed into one or two PC images; (2) noise may be relegated to the less-correlated PC images; and (3) spectral differences between materials may be more apparent in PC images than in individual bands (Sabins, 1987). In addition, the principal component analysis can be used for the following applications.
Effective classification of land use with multi band data,
Colour representation or visual interpretation with multi band data,
Change detection with multi temporal data.
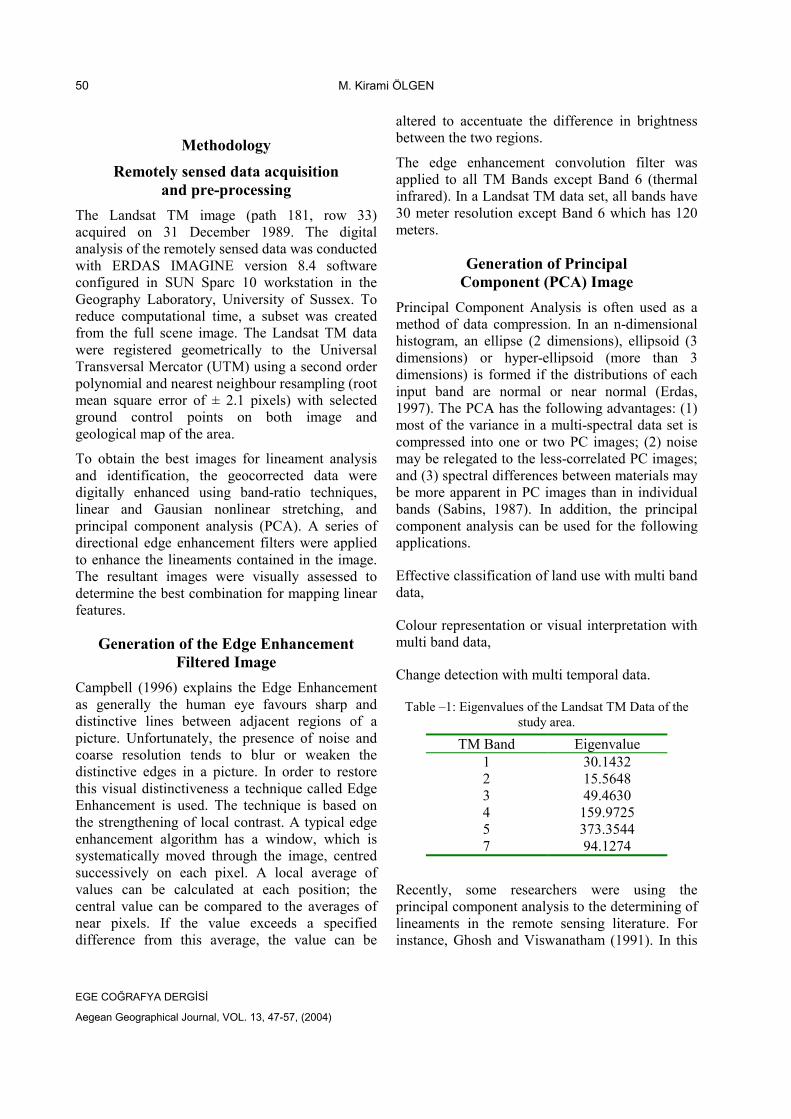
Table –1: Eigenvalues of the Landsat TM Data of the study area.
TM Band Eigenvalue 1 30.1432 2 15.5648 3 49.4630 4 159.9725 5 373.3544 7 94.1274
Recently, some researchers were using the principal component analysis to the determining of lineaments in the remote sensing literature. For instance, Ghosh and Viswanatham (1991). In this
Determining Lineaments and Geomorphic Features Using Landsat 5-TM Data On The Lower Bakırçay Plain, Western Turkey
EGE COĞRAFYA DERGİSİ
Aegean Geographical Journal, VOL. 13, 47-57, (2004)
51
study, The Principal Component Analysis was applied to all six TM Bands and generated six different Principal Component images. First three highest eigenvalues were selected. These are bands 5, 4 and 7. Table - 1 is shown eigenvalue of all six bands. The false colour composite image was generated by layer merging with these selected bands 5, 4 and 7.
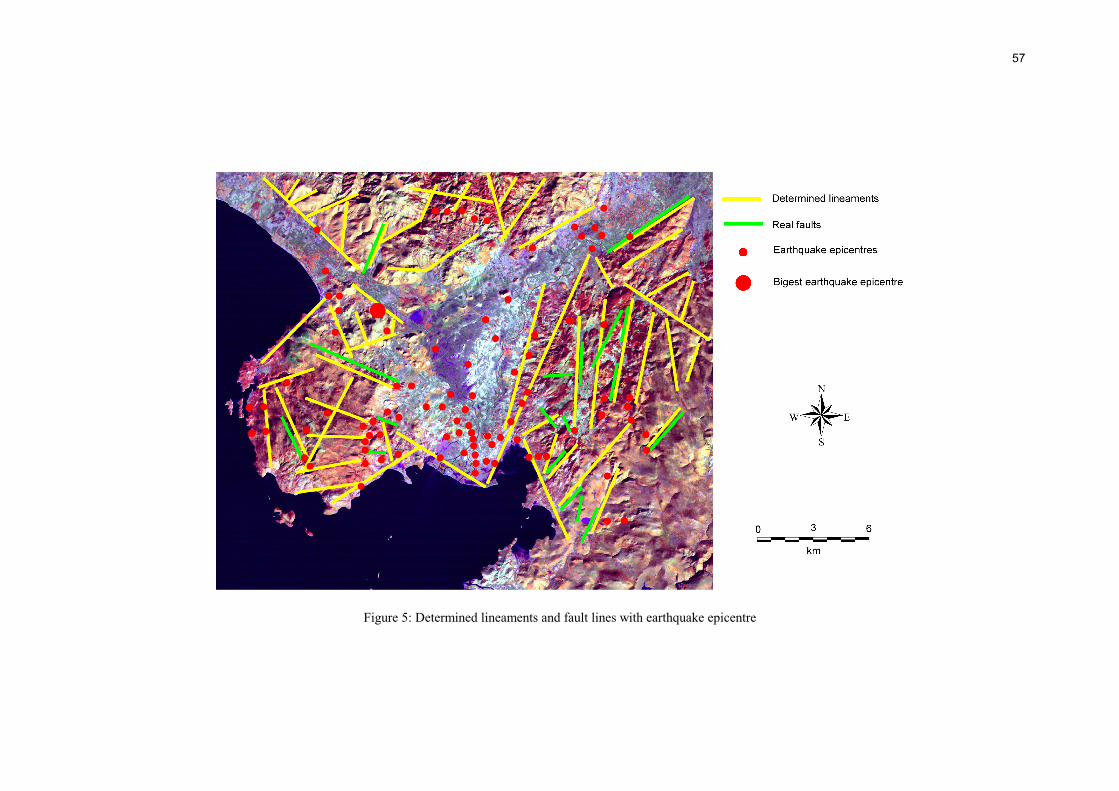
Determining Lineaments The processed false colour composite image was studied using manual photo-interpretation techniques. Fifty seven lineaments were identified and mapped and their prevalent orientations as well as their relation to structural geologic features were drawn on the image. Faults, which were derived from the geological map of the study area, were also mapped on the image (Figure 6). Each lineament orientation was calculated and these orientations were drawn as rose diagrams (Figure 4).
Earthquake Epicentres The earthquake epicentres were obtained from earthquake statistics of Turkey and mapped each earthquake epicentre on the lineament map (Figure 6). This gives the information on relationship between earthquake epicentres and lineaments.
Results Interpretation of Rose Diagrams
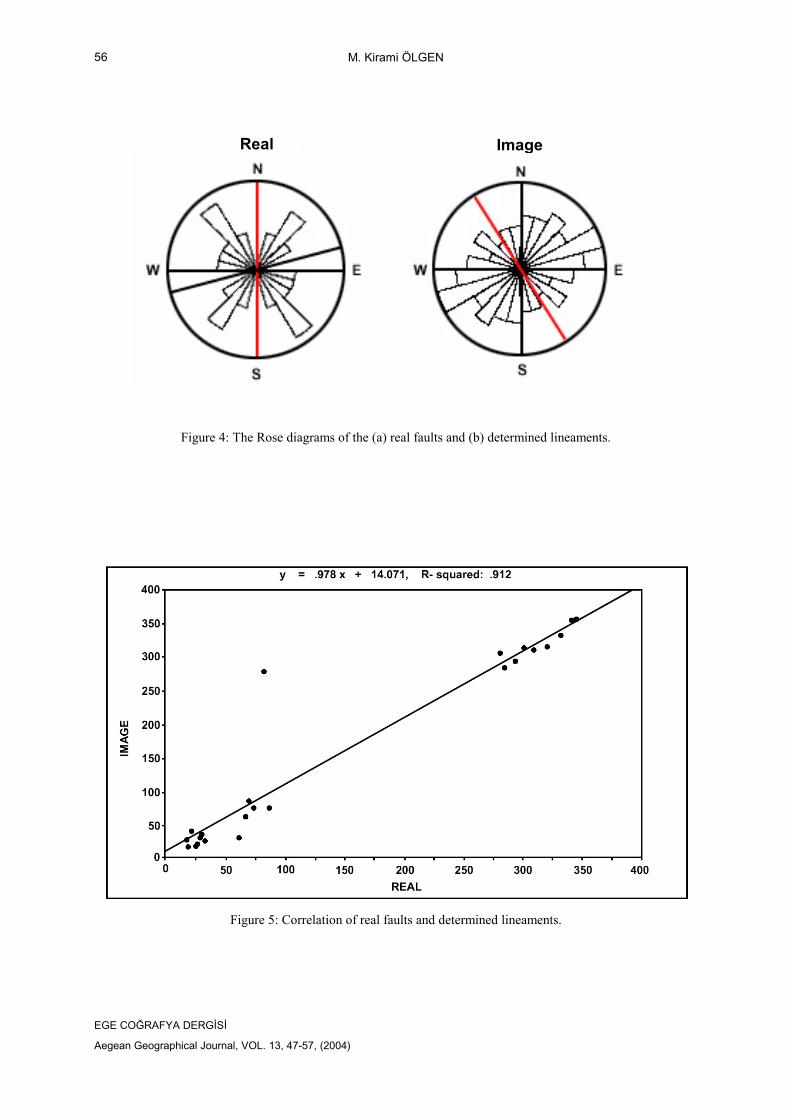
Statistical trend analysis was applied to the interpreted structural lineaments. The results obtained are displayed on the Rose diagrams (Figure 4). The rose diagram of the determined lineaments, which is named image, suggests predominantly NE-SW direction. This pattern of lineaments has been observed particularly in the east part of the study area (Figure 6). Other directions are NW-SE and roughly E-W. The rose diagram of faults (Figure 4) which is named real, suggests predominantly NW-SE, NE-SW and E-W direction (Figure 6).
Comparison of Real and Image Lineaments Sixteen lineaments from real faults have been matched to image lineaments. I performed a
correlation analysis to the matched lineaments and according to the analysis; the correlation coefficient is 0.83, which shows that there is a close correlation between determined lineaments and faults. I determined fifty seven lineaments which have only sixteen lineaments matched with real faults, and most of them have not been recorded in the geological map of the study area. They should be updated and can help to facilitate the planning of new construction.
Interpreting Earthquake Epicentres 113 earthquake epicentres, which had occurred in the study area between 1917 and 1997, were mapped in their real coordinate on Figure – 2. Most of the earthquakes had occurred on the alluvial plain. This analysis can indicate the hidden faults under the alluvial plain. The Bakircay River has also been controlled by tectonic features. Because several earthquake epicentres are following the river especially on the deltaic part. Second most dense distribution of the earthquake epicentres is occurring in the Karadag volcanic mass, which is located western part of the study area. Nineteen new faults were determined, which had not previously been identified.
Geomorphology Analysis of satellite imagery has repeadly shown that its value in deciphering the interrelation between lithology, structures, and landforms (Krishnamurthy and Srinivas, 1996). A basic tenet of geomorphology is that geomorphic units can be expected to reflect underlying bedrock types and the processes that have been at work. Based on field observations, and image tone and texture, we defined six different geomorphic units;
Karadağ volcanic mass Southern slopes of Madra dağ Zeytindağ highland Burgaz threshold and Köprübaşı gorge Bayat plain The Bakırçay delta
The image set used in this study were acquired in winter (31 December 1989). On this date, agricultural areas that are usually on the plain are empty, that is, the soil surface is open and can be easily recognised from the main rock that is
M. Kirami ÖLGEN
EGE COĞRAFYA DERGİSİ
Aegean Geographical Journal, VOL. 13, 47-57, (2004)
52
covered with natural vegetation. For this reason, alluvial boundary is easily determined.
Karadağ volcanic mass and southern slopes of Madra dağ The karadağ volcanic mass have been formed as a result of volcanic activity from late Miocene to Pliocene. The mass is situated in the western part of the study area with its height exceeding 750 meters. It has generally been composed by andesitic lithology. But partially basaltic lithology is seen on the mass, which is represented to last stage of volcanism. These lithologies are appearing in slightly dark tones on the image. Tuffs are located in the eastern part of the mass and they create erosional landform due to their easily denudational structure. They are seen in light tones on the image. Southern slopes of Madra dağ have similar geological structure with the Karadağ volcanic mass. This part has also been formed by andesitic and basaltic volcanism. Tuffs are in the middle part of the mass and they can easily be recognised with their light tones on the image.
Zeytindağ highland The Zeytindağ highland at the east of the study area, which consist of Pre-Neogene metamorphic rocks, Neogene sedimantaries ad volcanic rocks. Due to this structure, the topography of this part is very rough. Erosion is important agent in the forming of the part which has been formed by erosion on soft and weak formations such as Neogene sedimantaries and volcanic tuffs. On the other hand, high elevated landforms, especially hogback type landforms, have been formed on hard and strong formations such as crystallised limestones. The part is seen as a highly deformed and cut on the image.
The Bayat plain The Bayat plain can be divided into two sub sections. The floodplain and the alluvial plain. The floodplain (light grey tones on the image) are composed of unconsolidated and loose sediments such as gravel, sand and silt found along the banks
of the Bakırçay river. Moisture is retained within floodplain deposits ad thus allows vegetative cover. Agriculture is intensive in this section.
The alluvial plain is level plain, gently sloping, or slightly undulating land surfaces comprised of alluvial and colluvial deposits of sand, silt and clay. The plain is seen in dark grey tones on the image.
The Bakırçay delta The Bakırçay delta resembles a roughly triangle is shape with its base constituted by the Çandarlı bay and its top by the Burgaz threshold. The delta can be divided into upper and lower sections. The upper section is seen in light grey tones on the image and lies in between the discharge channels behind lagoonary lower section where fluvial and marine forms are found mixed together, are clearly differentiated from each other.
Summary This paper focused on the remote sensing analyses. The lineament analysis was carried out in this study. The lineament analyses was undertaken to examine the orientation of lineament, the relationship between lineaments and geologic structures and tectonic features. All lineaments were obtained using the edge enhancement filters and principal component analysis together. Fifty seven lineaments were determined. The earthquake epicentre was linked to the lineament map and nineteen possibly new faults were determined, which had not been previously identified. In addition some geological and geomorphologic features were identified due to tonal and texture variations on the image.
Acknowledgements I would like to thank to Dr. Tom Browne from Sussex University Computing Centre for his great help in the early stage of my study, Martin Wingfield from Sussex University Geography Laboratory for his help on the workings of the Sun Sparc workstations and other computer support.
Determining Lineaments and Geomorphic Features Using Landsat 5-TM Data On The Lower Bakırçay Plain, Western Turkey
EGE COĞRAFYA DERGİSİ
Aegean Geographical Journal, VOL. 13, 47-57, (2004)
53
REFERENCES
Akyurek, B., and Soysal, Y., 1993. ‘Biga yarimadasi guneyinin (Savastepe – Kirkagac – Bergama – Ayvalik) temel jeoloji ozelikleri,’ MTA Dergisi, 95/96, 1-2.
Ananaba, S.E., and Ajakaiye, D.E., 1987. ‘Evidence of tectonic control of mineralization in Nigeria from lineament density analysis. A Landsat study’. International Journal of Remote Sensing, 8 (10), 1445-1454.
Campbell, J.B., 1996 Introduction to Remote Sensing. Taylor and Francis Ltd., London.
Cracknell, A.P., and Hayes, L.W.B., 1993. Introduction to Remote Sensing. Taylor and Francis, London.
Drury, S.A., and Walker, A.S.D., 1987. ‘Display and enhancement of gridded aeromagnetic data of the Solway Basin’, International Journal of Remote Sensing, 8 (10), 1433-1444.
Erdas, 1997. Erdas Imagine v8.3 Field Guide. Erdas Inc.
Ghosh, T.K., and Viswanatham, S., 1991. ‘Neotectonic analysis of Mendha river basin, Rajasthan, India’. International Journal of Remote Sensing, 12 (12), 2585-2596.
Isiorho, S.A., 1985. ‘The significance of lineaments mapped from remotely sensed images of the 1:250 000 Lau Sheet in the Benue trough of Nigeria’, International Journal of Remote Sensing, 6 (6), 911-918.
Kamel, A.F., and Elsirafe, A.M., 1994. ‘Delineation and analysis of the surface and subsurface structural lineament patterns in the North Lake Nasser area and its surroundings, Aswan, upper Egypt. International Journal of Remote Sensing, 15 (7), 1471-1494.
Krishnamurthy, J., and Srinivas, G., 1996. Demarcation of the geological and geomorphological features of parts of Dharwar Craton, Karnataka, using IRS LISS-II data. International Journal of Remote Sensing, 17, 3271-3288.
McKenzie, D., and Yılmaz, Y., 1991. Deformation and volcanism in western Turkey and the Aegean, Bulletin of Technical University of Istanbul, 44, 345-373.
Sabins, F., 1987. Remote Sensing: Principles and interpretation. 2nd edn. Freeman, New York.
Sesoren, A., 1984. Uzaktan Algilama Yontemi ile Hollandanin Jeolojik ve Jeomorfolojik Ozellikleri. Istanbul Universitesi, yayinlanmamis Doktora tezi, Istanbul.
Stefouli, M., and Angelopoulos, A., 1990. ‘Integration of Landsat and aeromagnetic data as aid to the structural analysis of Crete and S.E. Peloponessus’. International Journal of Remote Sensing, 11 (9), 1625-1644.
M. Kirami ÖLGEN
EGE COĞRAFYA DERGİSİ
Aegean Geographical Journal, VOL. 13, 47-57, (2004)
54
Figure 1: Location map of the study area.
Figure 2: Regional tectonic map (modified from McKenzie and Yilmaz, 1991).
55
Figure 3: Geological map of the study area.
M. Kirami ÖLGEN
EGE COĞRAFYA DERGİSİ
Aegean Geographical Journal, VOL. 13, 47-57, (2004)
56
Figure 4: The Rose diagrams of the (a) real faults and (b) determined lineaments.
Figure 5: Correlation of real faults and determined lineaments.
Real Image
57
Figure 5: Determined lineaments and fault lines with earthquake epicentre