VALIDATION OF THE LANDSAT 7 LONG-TERM ACQUISITION PLAN
13
VALIDATION OF THE LANDSAT 7 LONG-TERM ACQUISITION PLAN Pecora 15/Land Satellite Information IV/ISPRS Commission I/FIEOS 2002 Conference Proceedings VALIDATION OF THE LANDSAT 7 LONG-TERM ACQUISITION PLAN Terry Arvidson, Senior Systems Engineer, Lockheed Martin Richard Irish, Senior Systems Engineer, SSAI Brian Markham, Landsat Calibration Scientist, NASA/GSFC Dr. Darrel Williams, Landsat Project Scientist, NASA/GSFC Goddard Space Flight Center Code 923 Bldg 33 Greenbelt, Maryland 20771 [email protected] [email protected] [email protected] [email protected] Jay Feuquay, Landsat 7 Program Data Acquisition Manager, USGS EROS Data Center Sioux Falls, South Dakota 57198 [email protected] John Gasch, Landsat 7 Mission Analyst, Emalico LLC Goddard Space Flight Center Code 428.1 Bldg 32 Greenbelt, Maryland 20771 [email protected] Dr. Samuel N. Goward, Professor Department of Geography 2181 LeFrak Hall University of Maryland College Park, Maryland 20742-8225 [email protected] ABSTRACT The launch of Landsat 7 on April 15, 1999 ushered in a new era of managing global survey missions. For the first time (for Landsat or any similar mission) an automated Long-Term Acquisition Plan (LTAP) was employed to populate the US Archive at the USGS EROS Data Center. The automated LTAP system was designed to globally collect sunlit, essentially cloud-free, and seasonally refreshed Landsat acquisitions for all land areas of the Earth. The LTAP has successfully populated the archive such that most users requiring data find it already in the archive, from the right time of year, substantially cloud-free, and under the right radiometric conditions, rather than having to order new acquisitions. Requests for data acquisitions outside of the LTAP have been lower than for any other Landsat mission. After three years of operations, we have undertaken an exhaustive analysis of the performance of the LTAP in terms of seasonality, cloud contamination, gain setting strategy, and satisfaction of science community requirements. This paper addresses the evolution of the LTAP during Landsat-7 operations, the validation strategies that were designed, and the results of the validation process. In addition, lessons learned from the validation exercise and future updates to the LTAP strategy are discussed. INTRODUCTION AND BACKGROUND A new automated approach to Landsat mission operations was introduced with the deployment of Landsat 7. A long-term acquisition plan (LTAP) was developed prior to launch to systematically populate the US archive, held at the USGS EROS Data Center, with seasonally refreshed, essentially cloud-free observations of all land areas of the planet (Arvidson, et al, 2001). The LTAP system addresses terrestrial seasonality, cloud climatology versus daily NOAA-predicted cloud cover, the two possible gain states on the Enhanced Thematic Mapper plus (ETM+) sensor on Landsat 7, and various technical and/or operational constraints such as sensor duty cycle and battery reserve
-
Upload
independent -
Category
Documents
-
view
2 -
download
0
Transcript of VALIDATION OF THE LANDSAT 7 LONG-TERM ACQUISITION PLAN

VALIDATION OF THE LANDSAT 7 LONG-TERM ACQUISITION PLAN
Pecora 15/Land Satellite Information IV/ISPRS Commission I/FIEOS 2002 Conference Proceedings
VALIDATION OF THE LANDSAT 7 LONG-TERM ACQUISITION PLAN
Terry Arvidson, Senior Systems Engineer, Lockheed Martin Richard Irish, Senior Systems Engineer, SSAI
Brian Markham, Landsat Calibration Scientist, NASA/GSFC Dr. Darrel Williams, Landsat Project Scientist, NASA/GSFC
Goddard Space Flight Center Code 923 Bldg 33 Greenbelt, Maryland 20771
[email protected] [email protected]
[email protected] [email protected]
Jay Feuquay, Landsat 7 Program Data Acquisition Manager, USGS EROS Data Center
Sioux Falls, South Dakota 57198 [email protected]
John Gasch, Landsat 7 Mission Analyst, Emalico LLC Goddard Space Flight Center Code 428.1 Bldg 32
Greenbelt, Maryland 20771 [email protected]
Dr. Samuel N. Goward, Professor Department of Geography
2181 LeFrak Hall University of Maryland
College Park, Maryland 20742-8225 [email protected]
ABSTRACT
The launch of Landsat 7 on April 15, 1999 ushered in a new era of managing global survey missions. For the first time (for Landsat or any similar mission) an automated Long-Term Acquisition Plan (LTAP) was employed to populate the US Archive at the USGS EROS Data Center. The automated LTAP system was designed to globally collect sunlit, essentially cloud-free, and seasonally refreshed Landsat acquisitions for all land areas of the Earth. The LTAP has successfully populated the archive such that most users requiring data find it already in the archive, from the right time of year, substantially cloud-free, and under the right radiometric conditions, rather than having to order new acquisitions. Requests for data acquisitions outside of the LTAP have been lower than for any other Landsat mission. After three years of operations, we have undertaken an exhaustive analysis of the performance of the LTAP in terms of seasonality, cloud contamination, gain setting strategy, and satisfaction of science community requirements. This paper addresses the evolution of the LTAP during Landsat-7 operations, the validation strategies that were designed, and the results of the validation process. In addition, lessons learned from the validation exercise and future updates to the LTAP strategy are discussed.
INTRODUCTION AND BACKGROUND A new automated approach to Landsat mission operations was introduced with the deployment of Landsat 7. A
long-term acquisition plan (LTAP) was developed prior to launch to systematically populate the US archive, held at the USGS EROS Data Center, with seasonally refreshed, essentially cloud-free observations of all land areas of the planet (Arvidson, et al, 2001). The LTAP system addresses terrestrial seasonality, cloud climatology versus daily NOAA-predicted cloud cover, the two possible gain states on the Enhanced Thematic Mapper plus (ETM+) sensor on Landsat 7, and various technical and/or operational constraints such as sensor duty cycle and battery reserve

VALIDATION OF THE LANDSAT 7 LONG-TERM ACQUISITION PLAN
Pecora 15/Land Satellite Information IV/ISPRS Commission I/FIEOS 2002 Conference Proceedings
power. All of these factors are merged in an Oracle-based information system that resides in the Landsat mission operations center (MOC). Information on predicted cloud cover and mission technical status are fed to the MOC daily. The MOC then prepares a mission operations plan, determining which Landsat WRS paths and rows will be acquired for the next 37 hours. An updated operations plan is uploaded to the satellite every 24 hours to command the payload data acquisition subsystems.
Prior to launch, a team of researchers at NASA Goddard and the University of Maryland developed the specific characteristics of the LTAP system. As much as possible, the LTAP team depended upon then-existing information about land seasonality from NOAA Advanced Very High Resolution Radiometer (AVHRR) global observations, and on cloud cover climatology, developed from AVHRR and GOES observations by the International Satellite Cloud Climatology Project (ISCCP) (Arvidson et al., 2001; Goward et al., 1996; Goward et al., 1999). A similar approach was taken with ETM+ gain state considerations. This automated approach was reviewed by the Landsat Science Team in 1998, prior to launch (Goward & Arvidson, 1998).
The LTAP system has now predominately operated Landsat 7 for the last 3 years (July 1999-July 2002)*. The LTAP development team is currently pursuing a validation of the LTAP, to insure that it is accomplishing the goals of the LTAP, initiated in 1995. The specific goals include:
• All Land Areas: Observations will be collected for all Landsat Worldwide Reference System (WRS) areas that contain any land (including islands and coral reefs where possible).
• Seasonally Refreshed: All land locations will be revisited with sufficient temporal frequency to capture major seasonal changes (e.g. spring, summer, fall, winter, dry versus wet season, low versus high sun).
• Essentially Cloud Free: To meet the previous requirements, at least one observation per season should be as cloud free as possible -- this is an elusive goal in cloud-prone regions of the globe.
• Radiometry: The LTAP considers the radiometric dynamic range across the optically reflective spectrum. The ETM+ sensor acquires measurements in either “low” or “high” gain for each spectral band. This is a trade-off between observation saturation and radiometric precision. The desire was to minimize saturation while maximizing scene radiometric contrast in the acquired observations. The low light factor and the two gain states available with the ETM+ sensor required a radiometric aspect to the LTAP method.
As the LTAP system was developed, members of the Landsat Science Team, as well as other members of the Landsat user community, pointed out that seasonality as defined by an AVHRR normalized difference vegetation index (NDVI) would not necessarily meet all their needs. Several such “niche” communities were identified, and special provisions within the LTAP were incorporated to meet their needs:
• Glaciers & Ice Sheets • Volcanoes • Fire study sites • Ocean Islands • Calibration sites • Sea ice • Coral Reefs • Boreal forests • Rainforests • Agricultural areas of interest to the USDA Foreign Agricultural Service A validation plan to evaluate the basics of the Landsat-7 LTAP approach was developed by the LTAP Working
Group at Goddard and the University of Maryland. The team proposed and developed independent validation approaches for each of the unique aspects of the LTAP:
• Seasonality: In this case, the acquired coverage, at monthly time steps, resident in the EROS Data Center archive was compiled to evaluate how well the seasonality was achieving desired goals. WRS-based maps of monthly coverage, as well as the lowest acquired cloud cover, were examined.
• Cloud Cover: There are multiple aspects to this methodology, including the within-scene automated cloud cover assessment (ACCA), the ISCCP cloud climatology, and the comparative performance of the NOAA National Centers for Environmental Prediction (NCEP) cloud forecast versus the ACCA results and the ISCCP climatology. In effect: Are we better off using cloud forecasts versus climatology versus nothing?
• Radiometry: Quite early in the Landsat-7 mission, the Landsat Science Team members reported observing measurement saturation in the near-infrared band for full canopy agricultural fields observed during the summer in the mid-latitudes. So began the saga of changing gain strategies as a function of user complaints. Thus the validation approach in this case has been predominately based on reaction to user input. Beyond these on-going changes, we also carried out a seasonal assessment of measurement
* There are times, such as during calibration maneuvers and orbital realignments, when mission operations are taken over by ground control to accomplish tasks other than the primary observation missions. Also during national emergencies the system is targeted to meet other national needs.

VALIDATION OF THE LANDSAT 7 LONG-TERM ACQUISITION PLAN
Pecora 15/Land Satellite Information IV/ISPRS Commission I/FIEOS 2002 Conference Proceedings
saturation, as a function of spectral band and geolocation to insure that we are minimizing this problem as much as possible. We have also revisited the pre- launch decision to set the maximum solar zenith angle threshold at 85 degrees.
• Niche Communities: Our validation approach for niche communities has been to ask community representatives to comment on the quality and value of observations acquired for their purposes.
This LTAP validation exercise is significant for the following reasons: 1. Refine LTAP-based mission operations for the remainder of the Landsat-7 mission (through 2006 at the
earliest). 2. Identify potential acquisition reduction strategies for the purposes of extending mission life 3. Provide a refined assessment of the LTAP approach for the benefit of the Landsat Data Continuity Mission
(LDCM) and all future Landsat missions. Each of the validation analyses was complex and led to extensive in-depth consideration of the questions raised.
In this paper we will only present a high-level summary of the conclusions we have reached without presenting many of the details that underpin our conclusions. We hope that in the near future we will be able to compile for publication more detailed manuscripts on the various aspects of the Landsat-7 LTAP validation.
LAND DEFINITION The Landsat-7 land database contains over 53,000 geographic tags (Fig. 1) identifying for each WRS land scene
the geopolitical extents, land-cover type, and other useful information. The geographic tags were not included in the initial system design but were added just before launch. They have proven extremely useful for answering queries, selectively applying scheduling rules, and conducting analyses. These include:
• Identification of nearly 17,000 Worldwide Reference System (WRS) scenes which consist of land and shallow coastal waters. Each of these scenes are acquisition candidates for the US archive (Arvidson et al., 2000).
• Land scenes also set limits for scheduling International Ground Station (IGS) acquisitions, as IGS requests over water are not allowed.
• Geographic tags serve as keys to the scheduling software, triggering special logic paths used during scheduling (e.g., high latitude overlap, night or ascending scene duty cycle constraints);
• Geographic tags allow collection of statistics by interest group, such as the various science niches (e.g., reefs, volcanoes) (Arvidson et al., 2000).
103 28 Russia-Kuril Islands103 28 volcano-(Russia-Kuril Islands) Medvezhia 45.38N 148.83E (197/216)103 29 Russia-Kuril Islands103 53 Reef niche103 53 USA-Palau (Trust Territory of the Pacific Islands)
Figure 1. Example of geographic tags appended to each WRS path/row in the land database Validation Strategies
The geographic tags were used to sort and display the data, evaluate the tag versus the WRS, and identify errors.
Land scenes that are surrounded on two or more sides by water were classified as "fringe coastal" scenes. Browse images of these scenes were visually inspected in the context of their neighboring scenes to determine whether the land portion of each fringe scene was included within the surrounding scenes. If so, then the scene could be removed from the land database with no loss of coverage.
Finally, efforts are underway to compare the LTAP land database with the land database generated by the Earth Satellite Corporation (EarthSat) in their compilation of the Global Landsat 2000 Scientific Data Purchase.
Validation Outcome
As expected with such a large database, we found 64 errors in the geographic tags and in the WRS assigned to some of the tags, and we found 32 WRS scenes in the land database with no entries in the seasonality file. These

VALIDATION OF THE LANDSAT 7 LONG-TERM ACQUISITION PLAN
Pecora 15/Land Satellite Information IV/ISPRS Commission I/FIEOS 2002 Conference Proceedings
were corrected in August 2002. The analysis of the list of fringe coastal scenes identified 352 scenes that could be deleted from the land and seasonality databases. These were deleted in August 2002.
Future analysis of the large land database to refine the geographic tags and correct any reported errors in location is planned. As an example, future work will include adding a detailed reef definition to the land database, using inputs from the reef community to correct the location of reefs based on the imagery, and adding the names of the reefs to the database instead of using the generic "reef niche" tag. We have discovered islands in the EarthSat database that had not been included in the LTAP database, and reefs in the LTAP database that are not included in the EarthSat database. The comparison is ongoing and results will be exchanged with EarthSat.
SEASONALITY The basic goal of the seasonality portion of the LTAP is to insure that Landsat 7 acquires new observations for
each new variation in land surface conditions. In general this is with respect to the condition of local vegetation cover, although there are other reasonable definitions as noted by the various niche communities discussed later in this paper. For vegetative cover, the typical mid-latitude perspective is “spring, summer, fall, winter”, approximate quarterly (3-month) sectors of the annual 12-month Earth orbital cycle. However, seasonality varies by region of the planet. For example, wet and dry cycles in lower latitude locations where temperature is not the primary determinant of seasonality, or high latitude locations where there is a very short summer and a very long winter. Our effort to characterize these regional variations in “seasonality” led us to employ the AVHRR observation record of land in the visible and near-infrared, converted to a measure of green vegetation presence with the normalized difference vegetation index (NDVI) (Arvidson et al., 2001; Justice et al., 1985). Our analysis produced monthly WRS location assessments to acquire-once or acquire-every opportunity (i.e. ~ twice) during that month (Fig. 2).
January July
Figure 2. LTAP seasonality WRS maps for January and July. White is acquire-every opportunity, gray is acquire-once. Note that most of the land areas are acquire-every opportunity in both months.
Operational acquisition performance has been closely monitored throughout operations and has been fine-tuned
through database, parameter, and software updates to conform to this definition of seasonality.
Validation Strategies Our primary interest was to evaluate whether the LTAP was acquiring the basic spatio-temporal coverage we
would have expected. Landsat 7's sensor, limited by a 16% maximum duty cycle, should optimally be able to acquire nearly the entire Earth’s land areas every two 16-day orbital cycles. We therefore began with examination of WRS maps consisting of observations collected over a 32-day (2-cycle) period (Fig. 3). Following our initial analysis of these 2-cycle maps, we determined that analysis of seasonal quarterly maps would also be important, where the seasons were defined to approximately coincide with the Earth’s orbital solstices and equinoxes (i.e. Dec-Feb, Mar-May, Jun-Aug., Sept.-Nov.) In support of this analysis, we also employed the newly implemented Landsat global visualization (GLOVIS) data exploration tool, available at the EROS Data Center Web Site (http://glovis.usgs.gov/). This system provides interactive access to the Landsat-7 metadata, including the browse images. This facilitated rapid and qualitative evaluation of specific examples of the results shown in the global WRS maps noted previously.

VALIDATION OF THE LANDSAT 7 LONG-TERM ACQUISITION PLAN
Pecora 15/Land Satellite Information IV/ISPRS Commission I/FIEOS 2002 Conference Proceedings
Figure 3. Example WRS actual coverage maps for 2-cycle coverage (left) for cycles 11-12 (~June) and seasonal
coverage (right) for June, July and August. Lighter tone indicates more scenes acquired during time period.
Validation Outcome Based upon the 2-cycle and quarterly WRS maps, we concluded that the LTAP is operating the Landsat-7
mission to acquire better than 90% global coverage for each quarter of the year. Thus for most locations, we are accomplishing the desired seasonal coverage originally specified as a goal of the LTAP.
However, we do note that the geographic distribution of the observations is not entirely in line with our expectations. Our conclusions concerning regional geographic coverage include:
• Too many “desert” scenes are being acquired currently. Our estimate is that on average 8.1 scenes are acquired annually of each WRS desert scene. Of these 5 are cloud-free and 3.1 have cloud cover that averages over 43%! Our seasonality analysis was clearly too conservative (or too generous, depending on how you look at it) in addressing desert coverage. We do have to worry about desert-based irrigated agriculture, for example in central Saudi Arabia and Sudan. This activity appears to be rapidly expanding. Further analysis of the phenomenon is warranted.
• The mission is consuming substantial acquisition resources in tropical, cloud-prone regions (as noted in Fig. 3). A quick examination of the browse imagery suggests a) there are only selected seasons of the year when low cloud cover images are acquired, and b) the only probable way of producing “cloud-free” coverage in these locations is to employ image composition methods, such as those used with AVHRR and MODIS measurements today. These observations indicate that a more in-depth analysis of tropical coverage is warranted. This problem may in part be addressed with a new 80% cloud cover threshold cut-off rule that has recently been implemented in the LTAP. That is, if the NCEP cloud cover forecast is for 80% cloud cover or worse, acquisition will not be scheduled.
• There appears to be excessive coverage of the high mid-latitudes (>45 degrees) in the winter. Apparently our conservative (generous) seasonality file prescribes acquisition every opportunity during the winter and the low cloud cover makes such scenes good candidates for acquisitions. However, having seen the frozen, snow-covered boreal and tundra regions once, there seems little value to acquiring them again.
• The reverse is true in these mid- to high-latitude regions during the summer. As with the tropical forest regions, these boreal and tundra zones are cloud-prone during the summer. However, only one scene is acquired during the summer (June-August) timeframe. There may be a need to set a high summer priority on acquisitions for these locations during the summer, particularly for Russian Siberia and Northern China, where there is no international ground station coverage to augment the LTAP.
We now believe that the binary NDVI interpretation (acquire-once, acquire-every opportunity) we deployed in this version of the LTAP does not take full advantage of the LTAP system functions. In fact, use of a continuous variable extract of the NDVI record may well be far more successful in addressing a number of the shortcomings we have already discovered, specifically with respect to desert acquisitions. Implementation of such a new seasonality definition would require an additional commitment to development, testing and validation but we believe that such an approach would produce a substantial improvement in LTAP operations.

VALIDATION OF THE LANDSAT 7 LONG-TERM ACQUISITION PLAN
Pecora 15/Land Satellite Information IV/ISPRS Commission I/FIEOS 2002 Conference Proceedings
CLOUDS To achieve the least cloud contamination in acquired imagery, the LTAP considers cloud conditions in the past,
the present, and nominal: • Cloud forecasts -- The National Centers for Environmental Prediction furnish daily global weather forecasts.
These forecasts are used as a scheduling aid to avoid acquiring scenes likely to be cloud contaminated. • Cloud climatology -- Acquisition scheduling decisions employ the forecasted cloud conditions normalized
against the historical average cloud cover. Priority of a candidate acquisition appreciates if the forecasted cloud cover is better than the historical average or depreciates if the forecast is worse than average. (Gasch & Campana, 2000)
• Cloud cover assessment -- Image processing assesses the amount of cloud contamination in each acquired image. This automated cloud cover assessment (ACCA) score (Irish, 2000) is conveyed back to the scheduling system as an indicator of past success. Future acquisition decisions consider the results of prior acquisitions as defined by the ACCA.
Cloud avoidance is a major goal of the LTAP and is accomplished by using all three types of data. In some areas of the world, cloud avoidance is not attempted. These are the 50 United States, where data is required every opportunity regardless of cloud cover, and Antarctica where the reliability of the cloud predictions has been questionable due to persistent ground fog.
Validation Strategies
Inter-comparisons were made among the different types of cloud data used to understand the relationships, compare results, and identify any biases: climatological versus predicted, climatological versus assessed, assessed versus predicted.
To evaluate ACCA performance, a blind study was conducted on 192 images selected randomly across 8 latitudinal zones, 21 locations in each zone. 160 of the 192 images (for 20 of the 21 locations) were selected from the time interval when the Normalized Difference Vegetation Index (NDVI) was within 10% of its peak value. For the other location, four seasonal images were chosen for each latitudinal zone. Various Adobe Photoshop tools were used to generate binary cloud masks from each of the browse images; histograms of the cloud masks yielded cloud mask percentages for comparison with the calculated cloud cover scores.
To determine the regional success of cloud avoidance, maps showing the best cloud cover score for each WRS scene and the influence of cloud cover on acquis ition frequency were generated and analyzed (Fig. 4).
Validation Outcome
Our analysis has demonstrated that the ACCA algorithm is performing quite well (Fig. 5). As expected, the ACCA algorithm did under-report very thin high cirrus clouds (Irish 2000), especially where water dominates a scene. Also, commanded changes to the sensor gain during image acquisition presents a problem for the algorithm, which can over-estimate clouds in the image area following the gain change.
Considering the 7 scenes that differed by more than 15%: • two scenes under-reported (17% and 39%) due to thin cirrus not visible to the ACCA algorithm • one scene under-reported (22%) due to weaker cirrocumulus cloud signature over water • one scene over-reported (17%) due to gain change • three scenes with apparent over-reporting (26%, 38%, 30%) proved not true because the remaining clouds
are not visible in the spectral bands shown in the browse images. If the mask scores are adjusted for the three over-reporting cases where ACCA appeared to work, then ACCA is
within 10% of truth for 95% of all scenes examined. Considering the 160 scenes at peak NDVI, ACCA is within 10% of truth 97% of the time. ACCA under-performed for peak NDVI scenes in the mid-latitudinal zone (30-45 degrees North), with results within 10% of truth only 85% of the time, however several of the over-reporting cases fell into this zone. A seasonal bias is suggested in the Boreal South zone (45-60 degrees South), but 2 of the 4 seasonal scenes were contaminated by gain changes and were thus over-estimated. We concluded that ACCA is performing as designed in most cases and is providing reliable feedback to the scheduling system.

VALIDATION OF THE LANDSAT 7 LONG-TERM ACQUISITION PLAN
Pecora 15/Land Satellite Information IV/ISPRS Commission I/FIEOS 2002 Conference Proceedings
Comparisons among the cloud file types revealed a slight bias (approximately 3%) in the cloud predictions to the high side; this value is considered to be in the noise. The predictions are also more accurate at the extremes (0% and 100%) as shown in Figure 6. Based on this, we recently decided to implement a cloud cover cut-off of 80%;
Figure 4. Example WRS maps for 2-cycle coverage (left) for cycles 11-12 (~June) and seasonal coverage (right) for June, July and August. Top maps: cloud cover for the lowest cloud cover scene acquired during the time period, where black is clearest and white is cloudiest. Bottom maps: how many times an acquisition failed to meet cloud cover requirements and therefore was targeted for another acquisition. Lighter tones indicate more repeat attempts.
139
40
6 2 1 1 1 2
0
20
40
60
80
100
120
140
0-5 % 5-10% 10 - 15% 15 - 20% 20 - 25% 25 - 30% 30 - 35% 35-40%
ACCA Versus Truth Differences for all 192 scenes (Absolute %)
Figure 5. Results of the ACCA score versus Truth analysis for the 192 images selected.
Predicted cloud cover
ACCA
0
100
0 100
Figure 6. Scatterplot showingconvergence of predicted and assessed
cloud cover values at the extremes.
if the forecasted cloud cover for a scene is worse than 80%, the scene is not considered a candidate for scheduling. This rule is applied only to scenes outside the 50 US states. Being a recent change, analysis of the consequences of this rule change is pending. Modeling runs predict that a tiny percentage of clear scenes will be missed and a significant amount of duty cycle will be reallocated to acquiring less cloudy scenes.
There was no apparent degradation due to the staleness of cloud forecasts out to 36 hours. Degradation of cloud forecasts at higher latitudes was evident during the campaigns over Antarctica. This combined with the ACCA algorithm's difficulty in discriminating clouds from snow and ice (Irish 2000) led us to not consider cloud

VALIDATION OF THE LANDSAT 7 LONG-TERM ACQUISITION PLAN
Pecora 15/Land Satellite Information IV/ISPRS Commission I/FIEOS 2002 Conference Proceedings
avoidance over Antarctica and to rely on the feedback of manual cloud cover assessments to guide the scheduler for future scene acquisitions over the continent.
Two interesting phenomena were observed in our analysis of browse scenes and the associated cloud assessments:
1. Island effect -- for isolated oceanic islands and reefs, an assessment of low cloud cover is misleading because the few reported clouds are almost always over the island or reef, rendering the scene useless; conversely, for islands and reefs that are close to continental coasts, an assessment of high cloud cover is also misleading because the clouds are almost always over the continental landmass and the offshore islands and reefs are in the clear.
2. Western continental coastal cloud/fog banks -- we found poor correlation between usefulness of the image and the ACCA score for these scenes, where the morning cloud/fog banks are hanging off the coast over the water, and the land is clear. These scenes are reported at 50 or 70% cloud cover but the land area is clear. This was primarily seen in North and South America.
Both of these phenomena highlight the importance for users to check the browse images and ascertain that their areas of interest are not under the clouds. Also, in their queries, it is important to keep the cloud cover threshold wide open in order to not exclude some of the scenes as described above that have high cloud cover assessments but generally clear land areas.
Future plans include investigating the feasibility of employing a land mask in the cloud assessment process, resulting in a scene utility score as well as a cloud cover score. We will consider manual cloud assessment in other areas of the world where automated cloud assessment is unreliable, and explore the compositing of images to construct cloud-free images in areas that are persistently cloud-covered. We will also investigate a cloud-confidence factor based on our assessment of latitudinal and regional reliability of the cloud forecasts.
RADIOMETRY With the exception of the thermal infrared band (Band 6), which is always acquired in both gain states, each
band of the ETM+ can be acquired in one of two gain states: high or low. The high gain mode improves noise performance but is susceptible to saturation over highly reflective land. Low gain mode results in a larger radiometric dynamic range, thus raising the threshold of saturation to a higher radiance. At launch the gains for each scene were set to maximize the entropy based on analysis of AVHRR data (Arvidson & Markham, 2001). Analysis of the efficacy of the gain setting strategy has been ongoing since launch. There have been four iterations to date on the methodology for setting the gains. Table 1 describes the latest gain setting rules. All strategies had the following in common (except for special acquisitions): the bands were grouped as 1-3, 4, and 5&7. Within each group all band gain changes are coincident. Band 8 was always acquired in low gain.
COVER TYPE BANDS 1-3 BAND 4 BANDS 5 AND 7 BAND 8 (PAN)
Land (non-desert, non-ice)
HIGH gain HIGH until sun elevation > 45 deg.
HIGH gain LOW gain
Desert HIGH until sun elevation > 28 deg.
HIGH until sun elevation > 45 deg.
HIGH until sun elevation > 38 deg.
LOW gain
Ice / Snow and Sea ice
HIGH until sun elevation > 19 deg.
HIGH until sun elevation > 31 deg.
HIGH gain LOW gain
Water / Coral Reefs HIGH gain HIGH gain HIGH gain LOW gain Volcanoes / Night HIGH gain HIGH gain LOW gain LOW gain
Table 1. Gain setting rules, based on sun angle and cover type At launch, scene acquisitions were limited to a maximum solar zenith angle of 85 degrees (Goward et al., 1999)
because the ETM+ would not return generally useful data at zenith angles greater than this due to low radiance and excessive shadowing. To conserve ETM+ duty cycle during the first Antarctic campaign season, 1999-2000, especially during the extension of the campaign into March, Northern Hemisphere acquisitions were limited to WRS Row 24, corresponding to an approximate 75-degree solar zenith angle. This strategy resulted in immediate relief seen

VALIDATION OF THE LANDSAT 7 LONG-TERM ACQUISITION PLAN
Pecora 15/Land Satellite Information IV/ISPRS Commission I/FIEOS 2002 Conference Proceedings
by the IGSs and in the early spring green-up acquisitions for the Northern Hemisphere. This experience led us to reconsider the 85-degree constraint. Validation Strategies
Analysis of gain setting performance has been ongoing during operations, influenced heavily by user feedback. For validation of the LTAP, the Image Assessment system (IAS) database was used to analyze occurrences of
saturation. The IAS database stores information on the extent of saturation of each scene processed by IAS as well as the Landsat Product Generation System (LPGS). As of October 2000 the IAS database also stores the cloud cover assessments (ACCA) produced by the Landsat Processing System (LPS). The IAS database was queried for clear scenes, those with cloud cover less than 10%), along with the related saturation statistics for these scenes. The browse images of the scenes with significant saturation were manually assessed to ascertain the source of the saturation. Sample scenes were selected for analysis when more than 5% of the image pixels were saturated for the 0% cloud cover scenes and 10% of the pixels were saturated in scenes assessed with 1-10% cloud cover.
The relationship between the sun angle constraint and the types and extents of targets being acquired was examined in both the northern and southern latitudes.
Exoatmospheric Noise Equivalent Delta Reflectances (NE∆ρ) were determined for each gain state as a function of solar zenith angle using data acquired while viewing the on-board solar diffuser panel. NE∆ρ is the change in reflectance that produces a signal change equal to the noise level (standard deviation) of the instrument. These data in plot form were used as a tool to evaluate appropriate maximum sun angles for acquisitions.
Validation Outcome
The study of all scenes in the IAS database with 0% cloud cover, high gain, and no gain change in the image showed that most band saturation occurred in the spring (March through May). Bands 1 through 4 were most affected by reflection from ice and snow cover, while bands 5 and 7 were most affected by reflection from sand (Table 2). For scenes with 1-10% cloud cover, similar results were obtained (Table 3). The overall percentage of high gain scenes analyzed that did not have significant saturation (i.e., saturation % greater than cloud cover %) was ~95% for bands 1 through 3, ~97% for band 4, and ~99% for bands 5 and 7. This study examined only the extent of saturation where a high gain setting was used when low gain perhaps would have been a better choice.
BAND # AND GAIN
SETTING
TOTAL #
OF SCENES ANALYZED
NUMBER OF SCENES WITH
>5% SATURATION
OBSERVED
SATURATION SOURCE
# AND % OF SCENES FOR SATURATION
SOURCE
COMMENTS Band 1 High 1667 41 Snow / Ice 40 (97.60%) A few clouds may be involved.
Clouds 1 (2.40%) Band 2 High 1674 33 Snow / Ice 32 (97.00%) A few clouds may be involved.
Clouds 1 (3.00%) Band 3 High 1673 39 Snow / Ice 38 (97.40%) A few clouds may be involved.
Clouds 1 (2.60%) Band 4 High 765 6 Snow / Ice 6 (100.00%) Band 5 High 1755 5 Desert sand 5 (100.00%) Band 7 High 1754 0 No scenes exceed 5% saturated.
Table 2. Sources of saturation for 0% cloud cover scenes with greater than 5% saturation. In conclusion, our gain setting strategy has been fairly successful in minimizing saturation in all bands.
However, the fact that we have to deal with gain settings is a complicating factor for the scheduling system, for the scientific community trying to use the data, and for the IGS stations trying to handle gain changes in their processing systems. We are currently studying the potential benefits of acquiring all data in the low gain setting, by default, and reverting to high gain only on request. This would simplify scheduling and processing, and would eliminate most of the remaining saturation observed in the data to the extent possible. Until that decision is taken, we will investigate updating the reflectance values used to set the sun angle values in the gain strategy (Table 1) by analyzing more current vegetation index data. We will also explore the possible use of snow masks from NCEP to avoid high gain over snow.

VALIDATION OF THE LANDSAT 7 LONG-TERM ACQUISITION PLAN
Pecora 15/Land Satellite Information IV/ISPRS Commission I/FIEOS 2002 Conference Proceedings
During the summer of 2001, analyses and models supported our decision to revise the Northern Hemisphere solar zenith constraint to 75 degrees, while retaining the 85-degree constraint for the Southern Hemisphere. As shown in Figure 7, the southern extent of 75 degrees would cut off approximately one-third of southern Argentina and most of the South Island of New Zealand, areas not snow-covered during the local winter. In the North, the areas cut off by the 75-degree constraint are snow-covered, thus yielding little information of general interest. This new constraint was implemented in the summer of 2002.
BAND # AND GAIN
SETTING
TOTAL #
OF SCENES ANALYZED
NUMBER OF SCENES WITH
>10% SATURATION
OBSERVED
SATURATION SOURCE
# AND % OF SCENES FOR SATURATION
SOURCE
COMMENTS Band 1 High 1168 26 Snow / Ice 25 (96.10%) Includes clouds with snow/ice.
Coastal sand 1 (3.80%) Includes clouds with sand. Band 2 High 1187 25 Snow / Ice 24 (96.00%) Includes clouds with snow/ice.
Coastal sand 1 (4.00%) Includes clouds with sand. Band 3 High 1188 25 Snow / Ice 24 (96.00%) Includes clouds with snow/ice.
Coastal sand 1 (4.00%) Includes clouds with sand. Band 4 High 401 11 Snow / Ice 11 (100.00%) Includes clouds with snow/ice. Band 5 High 1238 1 Desert sand 1 (100.00%) Includes clouds with bare. Band 7 High 1238 0 No scenes exceed 10%
saturation. Table 3. Sources of saturation for 1-10% cloud cover scenes with greater than 10% saturation.
Figure 7. Extent of the 75-degree solar zenith angle constraint in the Northern and Southern Hemispheres
The NE? ρ plots indicate that the sensor instrument noise levels at a 75-degree solar zenith angle correspond to
approximately 0.5% absolute reflectance in bands 1-5, which is useful for many types of analyses. This conforms to the original performance requirement for the Landsat Thematic Mapper sensor. A sample NE? ρ plot is shown in Figure 8. For example, at a signal level corresponding to the light reflected by a 5% diffuse target, in band 3 at a 85-degree solar zenith angle, the sensor noise level is equivalent to a target reflectance change of 1.7%. As the noise level of the instrument is the same as this level of target reflectance change, i.e., the signal-to-noise ratio (SNR) equals 1, it would be impossible to distinguish differences in target brightness less than 1.7% (without averaging pixels). This noise could be considered marginal at best for vegetation analyses where the range of vegetation reflectance may only be 5-10%. If you consider the range of reflectances divided by the noise level as your SNR, this means a SNR of 3-6.
VALIDATION OF THE LANDSAT 7 LONG-TERM ACQUISITION PLAN
Pecora 15/Land Satellite Information IV/ISPRS Commission I/FIEOS 2002 Conference Proceedings
0.000
0.500
1.000
1.500
2.000
2.500
3.000
3.500
4.000
20 25 30 35 40 45 50 55 60 65 70 75 80 85 90
Solar Zenith Angle
Band 1Band 2band 3band 4band 5band 7pan
Figure 8. ETM+ Exoatmospheric Noise Equivalent Change in Reflectance(NE² ρ) for high gain, exoatmospheric reflectance of 0.05 and Level 0R data.
It is difficult to rationalize an acquisition solar angle cut-off when may be some utility of scenes acquired at
higher solar zenith angles, such as using shadowing over snowfields to derive terrain features. However, based on our analyses, 75 degrees may be considered a reasonable cut-off for normal acquisitions. There are few justifications for acquiring scenes when the solar angle exceeds 85 degrees.
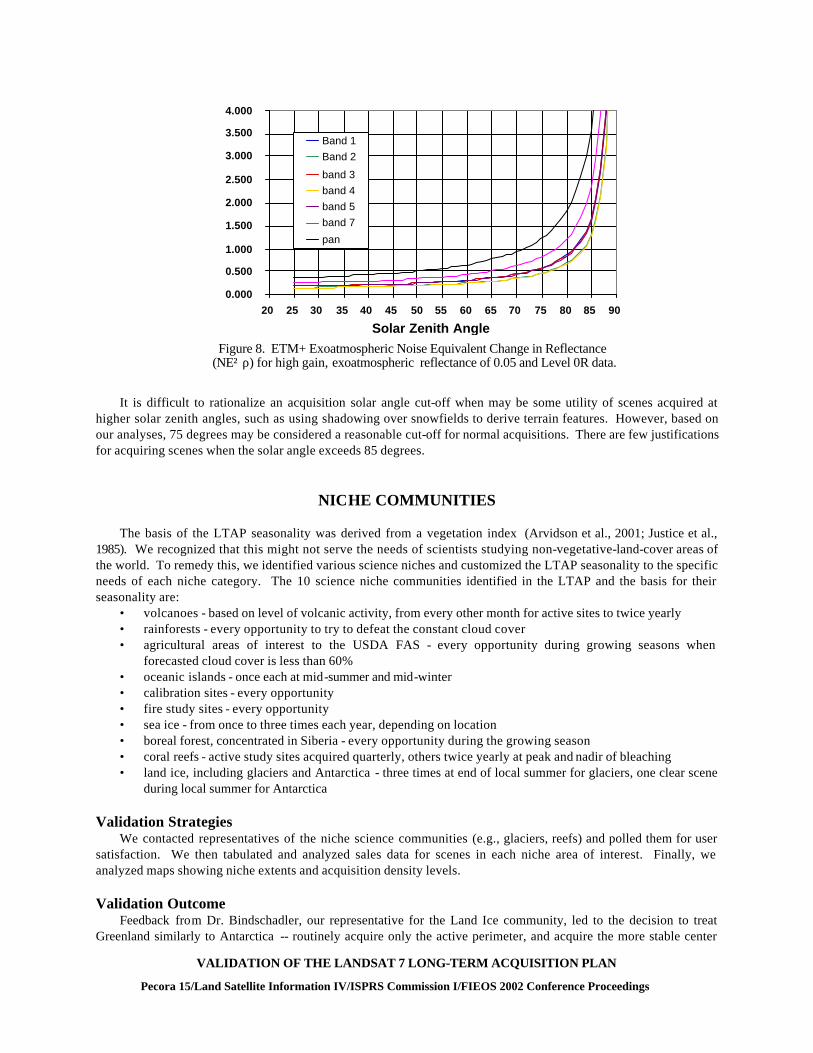
NICHE COMMUNITIES The basis of the LTAP seasonality was derived from a vegetation index (Arvidson et al., 2001; Justice et al.,
1985). We recognized that this might not serve the needs of scientists studying non-vegetative-land-cover areas of the world. To remedy this, we identified various science niches and customized the LTAP seasonality to the specific needs of each niche category. The 10 science niche communities identified in the LTAP and the basis for their seasonality are:
• volcanoes - based on level of volcanic activity, from every other month for active sites to twice yearly • rainforests - every opportunity to try to defeat the constant cloud cover • agricultural areas of interest to the USDA FAS - every opportunity during growing seasons when
forecasted cloud cover is less than 60% • oceanic islands - once each at mid-summer and mid-winter • calibration sites - every opportunity • fire study sites - every opportunity • sea ice - from once to three times each year, depending on location • boreal forest, concentrated in Siberia - every opportunity during the growing season • coral reefs - active study sites acquired quarterly, others twice yearly at peak and nadir of bleaching • land ice, including glaciers and Antarctica - three times at end of local summer for glaciers, one clear scene
during local summer for Antarctica
Validation Strategies We contacted representatives of the niche science communities (e.g., glaciers, reefs) and polled them for user
satisfaction. We then tabulated and analyzed sales data for scenes in each niche area of interest. Finally, we analyzed maps showing niche extents and acquisition density levels.
Validation Outcome
Feedback from Dr. Bindschadler, our representative for the Land Ice community, led to the decision to treat Greenland similarly to Antarctica -- routinely acquire only the active perimeter, and acquire the more stable center

VALIDATION OF THE LANDSAT 7 LONG-TERM ACQUISITION PLAN
Pecora 15/Land Satellite Information IV/ISPRS Commission I/FIEOS 2002 Conference Proceedings
region on request only (probably biannually). Analysis of sales data from EDC revealed that night volcano scenes were not being bought. As acquisition of night scenes involves high overhead, and we have received no indication from the volcano community of the utility of routine night acquisitions, the decision was made to acquire them on request only. Sales data also showed that the images over sea ice were not being bought. We discovered the sea ice community was planning to use Landsat data to validate sea ice concentrations derived from Advanced Microwave Scanning Radiometer - EOS Version (AMSR-E) data from the Aqua satellite (just launched in April 2002) and Special Sensor Microwave Imager Sounder (SSMIS) data from a Defense Meteorological Satellite Program (DMSP) satellite not yet launched. Therefore, routine acquisition of sea ice scenes has been suspended based on this information. When the sea ice community is prepared to commence their validation process, we will coordinate with them to conduct a coincident image acquisition campaign by all three instruments (ETM+, AMSR-E, SSMIS).
Having a responsible representative for the land ice and reef communities provided us valuable input during the validation process and during the course of routine operations. Therefore, representatives are being assigned for every niche community, to communicate the community's needs to the LTAP committee, and to provide frequent feedback on the usefulness, coverage, and interest of the imagery acquired on behalf of the community. Work is planned to correct the location of reefs, as needed, using imagery acquired to date and, with coral reef niche representatives, to review the priorities assigned to the reefs in light of coverage to date and the current status of ongoing studies. We believe that some reef locations have been over-imaged and the level of future acquisitions could be scaled down, so the resource savings may be applied toward regions with inadequate coverage. We plan to scale back acquisitions in the northern latitudes, with coordination from the land ice and boreal niche community. We will review the results of the LTAP and EarthSat land database comparison with the ocean island niche representative before deciding on whether to add the missing islands. Coverage history of islands already in the database will also be reviewed to see if acquisition priorities should be shifted to islands not adequately represented in the archive with cloud-free scenes.
SUMMARY AND CONCLUSIONS The long-term acquisition plan implemented for Landsat-7 is a major success. This is particularly evident when
the Landsat-7 archive that has been acquired in just three years of operation is compared to the total mission archives for Landsat-4 and -5. The automated LTAP system was designed to populate the US Archive at the USGS EROS Data Center with sunlit, essentially cloud-free, seasonally refreshed Landsat acquisitions for all land areas of the Earth. Our recent validation efforts have shown that goal has been met. Most users requiring data find it already in the archive, at the right time of year, substantially cloud-free, and under the right radiometric conditions, rather than having to order new acquisitions. In fact, requests for special data acquisitions outside of the LTAP have been less than for any other Landsat mission. However, as a result of our on-going analyses of the performance of the LTAP in terms of seasonality, cloud contamination, gain setting strategy, and satisfaction of science community requirements, we have concluded that some adjustments in our decision-making algorithms could further enhance the utility of future data collections. This continued evolution of the LTAP during Landsat-7 operations is particularly important, as the LTAP approach is a significant metric that has been captured as a requirement for the operation of the Landsat Data Continuity Mission, the successor to Landsat 7 in the Landsat series.
REFERENCES Arvidson, T., Gasch, J., and Goward, S.N. (2000), Building a global, consistent, and meaningful Landsat 7 data
archive. In: Algorithms for Multispectral, Hyperspectral, and Ultraspectral Imagery IV, Sylvia S. Shen, Michael R. Descour, Editors, Proceedings of SPIE Vol. 4049, pp. 356-367.
Arvidson, T., Gasch, J., & Goward, S.N. (2001). Landsat 7's Long Term Acquisition Plan - An Innovative Approach to Building a Global Archive, Special Issue on Landsat 7. Remote Sensing of Environment, 78, 13-26.
Arvidson, T., Markham, B. (2001) Landsat-7 Collection Techniques Move Into The 21st Century, In: Proceedings of ASPRS 2001 Conference: Gateway to the New Millennium , St. Louis MO, April 2001.

VALIDATION OF THE LANDSAT 7 LONG-TERM ACQUISITION PLAN
Pecora 15/Land Satellite Information IV/ISPRS Commission I/FIEOS 2002 Conference Proceedings
Gasch, J. and Campana, K. A. (2000), Cloud cover avoidance in space-based remote sensing acquisition. In: Algorithms for Multispectral, Hyperspectral, and Ultraspectral Imagery IV, Sylvia S. Shen, Michael R. Descour, Editors, Proceedings of SPIE Vol. 4049, pp. 336-347.
Goward, S.N., Arvidson, T. (1998). Science Review of Landsat-7 Long Term Acquisition Plan. NASA Goddard Space Flight Center, Greenbelt, Maryland. September 22, 1998.
Goward, S.N., Dubayah, R., Haskett, J. (1996). Landsat-7 Long Term Acquisition Plan: A Seasonal Acquisition Strategy. In: Proceedings of Pecora 13 Conference - Land Satellite Information II, ASPRS, Sioux Falls, South Dakota. August 1996.
Goward, S.N., Haskett, J., Williams, D.L., Arvidson, T.J., Gasch, J., Lonigro, R., Reeley, M., Irons, J., Dubayah, R., Turner, S., Campana, K., Bindschadler, R. (1999) Enhanced Landsat capturing all the Earth's land areas. EOS Transactions, 80, 289-293.
Irish, R. (2000), Landsat 7 Automated Cloud Cover Assessment. In: Algorithms for Multispectral, Hyperspectral, and Ultraspectral Imagery IV, Sylvia S. Shen, Michael R. Descour, Editors, Proceedings of SPIE Vol. 4049, pp. 348-355.
Justice, C.O., Townshend, J.R.G., Holben, G.N., Tucker, C.J. (1985). Analysis of the Phenology of Global Vegetation Using Meteorological Satellite Data. International Journal of Remote Sensing, 6 (8), 1271-1381.