Diagnostic Peptide Discovery: Prioritization of Pathogen Diagnostic Markers Using Multiple Features
Upload
khangminh22Category
view
2download
0
Determination of prioritization for maintenance of the upper structure of truss bridge
Heni Fitriani1*, M. Ade Surya Pratama1, Yakni Idris1, and Gunawan Tanzil1
1Department of Civil Engineering, Universitas Sriwijaya, Palembang, Indonesia
Abstract. Bridge maintenance is one of the major issues of infrastructure problems. Deterioration of a bridge’s structure will continuously increase without proper maintenance. This condition will adversely affect the service life of a bridge. Moreover, the damage will also have a direct impact on structural and functional failure of the bridge. This paper aims at identifying the damages of truss bridges and determining the most significant criteria and sub-criteria used in prioritizing bridge maintenance. Analytical Hierarchy Process (AHP) was used to assess the most important criteria that give significant weight to bridge maintenance analysis. The objects of research were nine truss bridges with a wide range of types and levels of damage. It was found that there were approximately 900 m' of components damaged at the railing of Baruga Bridge and 227 m' truss damages due to poor quality of the galvanized paint. Furthermore, based on the analysis, the most significant criteria were the level of damage (27.6%), the technical aspects (25.7%), the finance (21%), the vehicle load (13.6%) and the resources (12%). The results of this research showed important findings in determining the priority scales for bridge repair and maintenance systems.
1 Introduction The role of the bridge in the transportation system is very strategic and crucial to link any roadway network as well as control the movement of its traffic. Due to the function and safety of the road, the existence of the bridge should have special attention for its structural and functional condition for reliability and serviceability. The maintenance of bridges plays an essential role in reassuring the service and dependability of the bridge network. Thus, it is necessary to define a reliable strategy for maintaining and rehabilitating the bridge.
Studies on bridge maintenance have been emerging for many decades [1, 5-9]. According to Hasan et al. [5], the inspection and condition rating of the bridge has significantly affected the decisions for further action of bridge maintenance. This study also addressed the deterioration forecast of bridge components using visual inspection data and proposed the deterioration trends for its structural elements. Gattuli & Chiaramonte [4] studied the condition assessment using visual inspection and developed modules for bridge inventory, computer visual inspection, and priority ranking procedure. Wang & Elhaq [10]
*Corresponding author: [email protected]
, 0 (2019) https://doi.org/10.1051/matecconf /201927601036MATEC Web of Conferences 276
ICAnCEE 2018
1036
© The Authors, published by EDP Sciences. This is an open access article distributed under the terms of the Creative
Commons Attribution License 4.0 (http://creativecommons.org/licenses/by/4.0/).
combined the Analytical Hierarchy Process (AHP) and Data Envelopment Analysis (DEA) to assess risks of bridge elements for decision making. Meanwhile, Walia et al. [11] presented the damage evaluation of truss bridge using the deflection test.
To maintain the condition of the bridges, there is a need to develop condition assessment to prioritize the bridge components as well as to propose the bridge maintenance procedures. Continuous damage over time will increase the maintenance cost. It is known that there are limited funds available for maintenance. Thus, the bridge required a priority to prepare the maintenance program of the bridge. The purpose of this research is to identify damages along with their volume for each bridge and to determine the most significant criteria and sub-criteria for a bridge maintenance program. AHP was used to measure the most dominant criteria in fulfilling the maintenance selection program on truss frame bridge and determine the priority scale of bridge handling.
2 Methodology This paper adopted the Bridge Management System [2, 3] to establish the criteria for bridge assessment. The bridge condition was determined by a series of assessment criteria based on the hierarchy process of the bridge structure. The bridge assessors evaluated the terms based on their experience, values, and knowledge. This assessment was done during the bridge inspection. The condition ratings are in between 1-9 which reflect the bridge condition values and the elements at a given time. Each element of the bridges consists of these following aspects as seen in Table 1. Five criteria were used to assess the condition of bridges comprising of structure condition, damage level, damage volume, element functions, and element effects to the damages.
Table 1. Scale of condition ratings for AHP.
Intensity interest Description
1 Equal importance
3 Weak importance of one over another
5 Essential or strong importance
7 Demonstrated importance
9 Absolute importance
2, 4, 6, 8 Intermediate values between the two adjacent judgments
The primary objective of this paper is to identify the damages of the upper structure of
bridges and to determine the most significant criteria in prioritizing bridge maintenance. Analytical Hierarchy Process (AHP) was used to assess the most important criteria that give the significant weights to the bridge maintenance analysis. AHP used multiple criteria analysis by taking account of more than one criterion. Field surveys were conducted to record the damage characteristics of each bridge structure accurately. The data were used to plan a bridge-handling program. The investigation was carried out by directly monitoring 9 (nine) truss frame bridges located in South Sumatra Province. The survey team consisted of an inspector and two assistant inspectors. The inspector was in charge of verifying the damages to the upper building in accordance with the truss frame bridge hierarchy and putting the notes to the form when the
, 0 (2019) https://doi.org/10.1051/matecconf /201927601036MATEC Web of Conferences 276
ICAnCEE 2018
1036
2
survey took place. The questionnaires were then distributed to selected respondents based on the expertise, knowledge, and experience in the field of bridges. The respondents consisted of 12 respondents from the National Road Implementation Agency V (BBPJN V), three respondents from the Public Works of South Sumatra Province, and two respondents from the consultant and academia. Therefore, the number of respondents in total were 17 people.
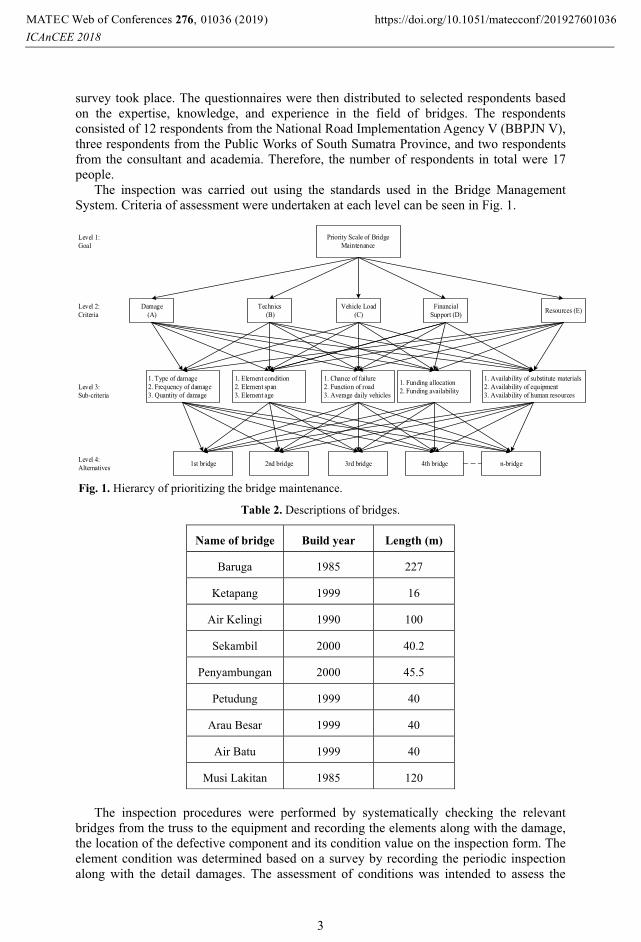
The inspection was carried out using the standards used in the Bridge Management System. Criteria of assessment were undertaken at each level can be seen in Fig. 1.
1. Type of damage2. Frequency of damage3. Quantity of damage
1. Element condition2. Element span3. Element age
1. Chance of failure2. Function of road3. Average daily vehicles
1. Funding allocation2. Funding availability
1. Availability of substitute materials2. Availability of equipment3. Availability of human resources
1st bridge 2nd bridge 3rd bridge n-bridge4th bridge
Damage (A)
Technics (B)
Vehicle Load (C)
Financial Support (D) Resources (E)
Priority Scale of Bridge Maintenance
Level 1:Goal
Level 2:Criteria
Level 3:Sub-criteria
Level 4:Alternatives
Fig. 1. Hierarcy of prioritizing the bridge maintenance.
Table 2. Descriptions of bridges.
Name of bridge Build year Length (m)
Baruga 1985 227
Ketapang 1999 16
Air Kelingi 1990 100
Sekambil 2000 40.2
Penyambungan 2000 45.5
Petudung 1999 40
Arau Besar 1999 40
Air Batu 1999 40
Musi Lakitan 1985 120
The inspection procedures were performed by systematically checking the relevant
bridges from the truss to the equipment and recording the elements along with the damage, the location of the defective component and its condition value on the inspection form. The element condition was determined based on a survey by recording the periodic inspection along with the detail damages. The assessment of conditions was intended to assess the
, 0 (2019) https://doi.org/10.1051/matecconf /201927601036MATEC Web of Conferences 276
ICAnCEE 2018
1036
3
extent of damage conditions that occur in the structure to sub-elements of the bridge at a certain time. The assessment of the state of truss frame bridge elements was put into a detailed checking form.
The objects of research were nine truss-frame bridges with a wide range of types and levels of damage conditions element as shown in Table 2. The detailed criteria and sub-criteria were given in the table. Baruga and Musi Lakitan bridges were built in 1985, Sekambil and Penyambungan in 2000, and the remaining were constructed between 1985 and 2000. It is known that Baruga Bridge has the longest among those nine bridges.
3 Results and discussion One of the complex issues facing the entire bridge is the damage to the buildings of the bridge due to several factors that influence it. Elements/sub-elements of mild or severe damage were reported in the form of a list of damage which might help the decision makers prepare the plans and bridge management program. The results of field surveys provide information on the type, the extent and the amount of damage that occur in each element or sub-element of a steel truss bridge. The lists of damage are used to determine the type of treatment and to calculate the necessary budget plan in the handling of the bridge.
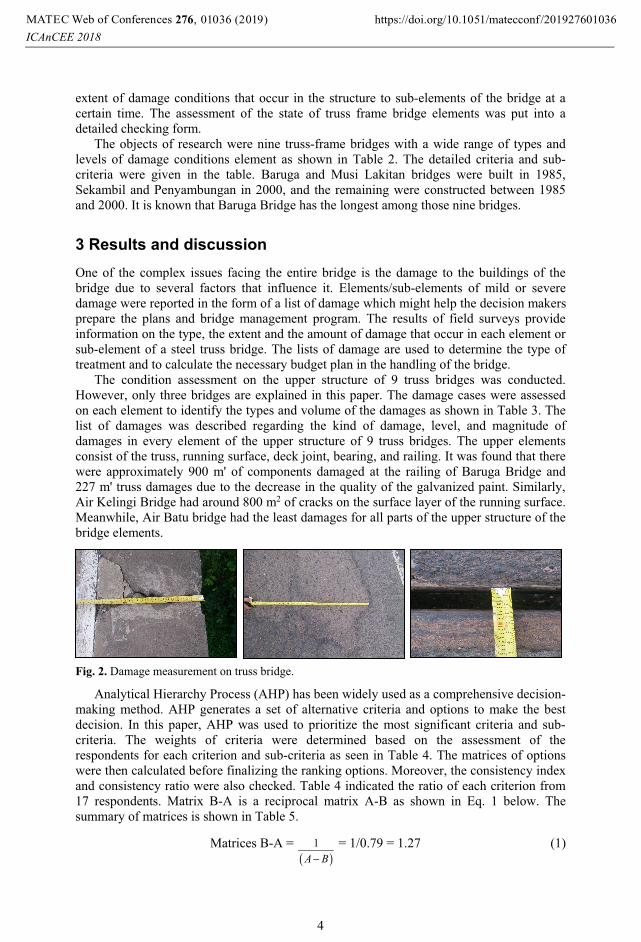
The condition assessment on the upper structure of 9 truss bridges was conducted. However, only three bridges are explained in this paper. The damage cases were assessed on each element to identify the types and volume of the damages as shown in Table 3. The list of damages was described regarding the kind of damage, level, and magnitude of damages in every element of the upper structure of 9 truss bridges. The upper elements consist of the truss, running surface, deck joint, bearing, and railing. It was found that there were approximately 900 m' of components damaged at the railing of Baruga Bridge and 227 m' truss damages due to the decrease in the quality of the galvanized paint. Similarly, Air Kelingi Bridge had around 800 m2 of cracks on the surface layer of the running surface. Meanwhile, Air Batu bridge had the least damages for all parts of the upper structure of the bridge elements.
Fig. 2. Damage measurement on truss bridge.
Analytical Hierarchy Process (AHP) has been widely used as a comprehensive decision-making method. AHP generates a set of alternative criteria and options to make the best decision. In this paper, AHP was used to prioritize the most significant criteria and sub-criteria. The weights of criteria were determined based on the assessment of the respondents for each criterion and sub-criteria as seen in Table 4. The matrices of options were then calculated before finalizing the ranking options. Moreover, the consistency index and consistency ratio were also checked. Table 4 indicated the ratio of each criterion from 17 respondents. Matrix B-A is a reciprocal matrix A-B as shown in Eq. 1 below. The summary of matrices is shown in Table 5.
Matrices B-A = ( )
1A B−
= 1/0.79 = 1.27 (1)
, 0 (2019) https://doi.org/10.1051/matecconf /201927601036MATEC Web of Conferences 276
ICAnCEE 2018
1036
4
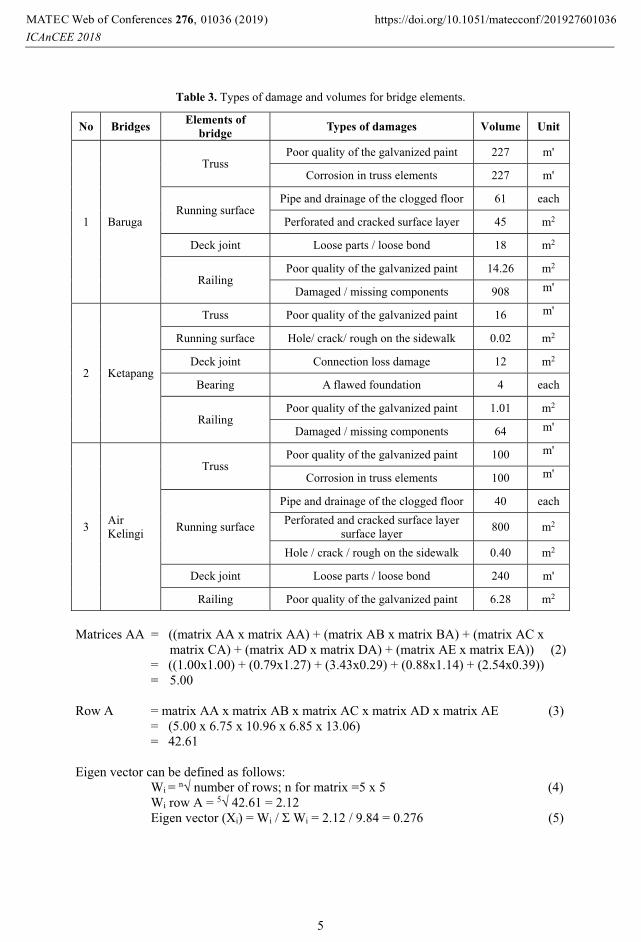
Table 3. Types of damage and volumes for bridge elements.
No Bridges Elements of bridge Types of damages Volume Unit
1 Baruga
Truss Poor quality of the galvanized paint 227 m'
Corrosion in truss elements 227 m'
Running surface Pipe and drainage of the clogged floor 61 each
Perforated and cracked surface layer 45 m2
Deck joint Loose parts / loose bond 18 m2
Railing Poor quality of the galvanized paint 14.26 m2
Damaged / missing components 908 m'
2 Ketapang
Truss Poor quality of the galvanized paint 16 m'
Running surface Hole/ crack/ rough on the sidewalk 0.02 m2
Deck joint Connection loss damage 12 m2
Bearing A flawed foundation 4 each
Railing Poor quality of the galvanized paint 1.01 m2
Damaged / missing components 64 m'
3 Air Kelingi
Truss Poor quality of the galvanized paint 100 m'
Corrosion in truss elements 100 m'
Running surface
Pipe and drainage of the clogged floor 40 each Perforated and cracked surface layer
surface layer 800 m2
Hole / crack / rough on the sidewalk 0.40 m2
Deck joint Loose parts / loose bond 240 m'
Railing Poor quality of the galvanized paint 6.28 m2
Matrices AA = ((matrix AA x matrix AA) + (matrix AB x matrix BA) + (matrix AC x
matrix CA) + (matrix AD x matrix DA) + (matrix AE x matrix EA)) (2) = ((1.00x1.00) + (0.79x1.27) + (3.43x0.29) + (0.88x1.14) + (2.54x0.39)) = 5.00 Row A = matrix AA x matrix AB x matrix AC x matrix AD x matrix AE (3)
= (5.00 x 6.75 x 10.96 x 6.85 x 13.06) = 42.61
Eigen vector can be defined as follows:
Wi = n� number of rows; n for matrix =5 x 5 (4) Wi row A = 5� 42.61 = 2.12 Eigen vector (Xi) = Wi / � Wi = 2.12 / 9.84 = 0.276 (5)
, 0 (2019) https://doi.org/10.1051/matecconf /201927601036MATEC Web of Conferences 276
ICAnCEE 2018
1036
5

Table 4. Ratio for each criterion.
Table 5. Matrices for each criterion.
Criteria A B C D E
A 1.00 0.79 3.43 0.88 2.54
B 1.27 1.00 1.31 2.02 1.20
C 0.29 0.77 1.00 0.60 1.60
D 1.14 0.49 1.68 1.00 1.75
E 0.39 0.83 0.63 0.57 1.00
� 4.09 3.88 8.04 5.07 8.10
Respondents code
Respondents’ perceptions
A:B A:C A:D A:E B:C B:D B:E C:D C:E D:E
R1 0.33 3.00 0.50 0.33 0.50 3.00 0.50 0.14 2.00 7.00
R2 2.00 4.00 0.25 5.00 5.00 2.00 3.00 0.20 3.00 0.50
R3 2.00 7.00 0.33 0.20 0.50 0.20 7.00 0.14 0.50 0.50
R4 3.00 7.00 0.33 5.00 0.50 3.00 0.33 0.14 0.50 0.50
R5 0.33 0.33 1.00 1.00 1.00 5.00 3.00 2.00 3.00 1.00
R6 0.50 3.00 0.33 3.00 0.50 3.00 0.50 0.33 0.33 1.00
R7 0.20 0.20 5.00 5.00 0.20 0.20 0.20 2.00 0.20 5.00
R8 0.20 5.00 0.20 3.00 0.50 0.33 0.33 0.20 2.00 5.00
R9 0.20 0.20 0.14 1.00 3.00 1.00 1.00 1.00 0.14 1.00
R10 0.33 5.00 3.00 5,00 0.33 0.33 0.50 0.20 1.00 3.00
R11 0.33 4.00 0.33 6,00 3.00 3.00 0.25 0.14 7.00 1.00
R12 0.16 7.00 0.20 0.50 0.50 5.00 0.20 0.33 3.00 0.50
R13 0.20 0.20 1.00 1.00 0.33 1.00 1.00 1.00 0.14 1.00
R14 0.20 5.00 1.00 5.00 2.00 1.00 0.33 0.14 0.20 1.00
R15 0.20 0.20 0.14 1.00 3.00 1.00 1.00 1.00 0.14 1.00
R16 3.00 7.00 0.20 1.00 1.00 5.00 1.00 0.14 3.00 0.50
R17 0.20 0.14 1.00 0.20 0.33 0.33 0.33 1.00 1.00 0.33
�R 13.4 58.27 14.97 43.23 22.20 34.40 20.48 10.12 27.16 29.83
R/17 0.79 3.43 0.88 2.54 1.31 2.02 1.20 0.60 1.60 1.75
, 0 (2019) https://doi.org/10.1051/matecconf /201927601036MATEC Web of Conferences 276
ICAnCEE 2018
1036
6
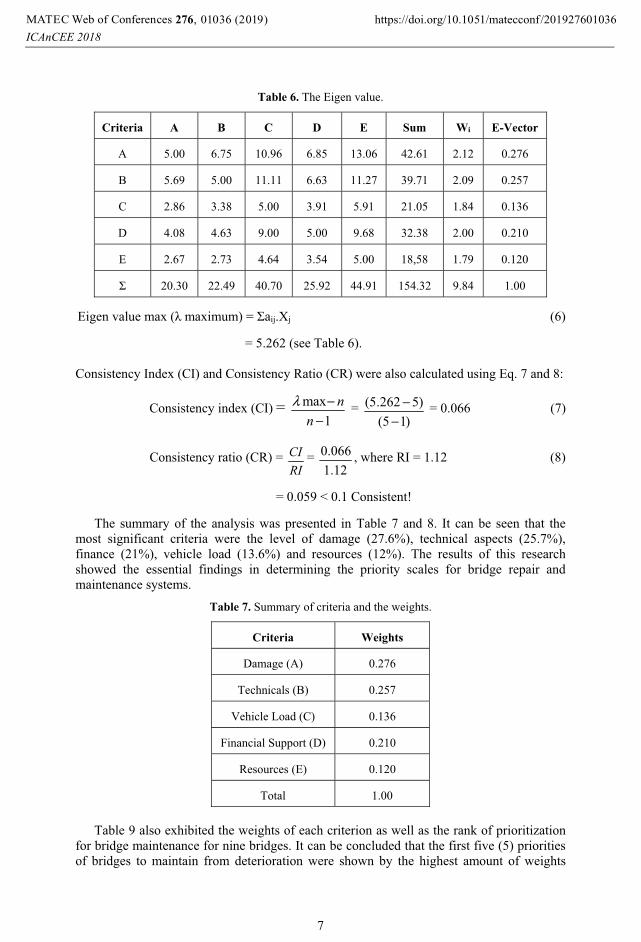
Table 6. The Eigen value.
Criteria A B C D E Sum Wi E-Vector
A 5.00 6.75 10.96 6.85 13.06 42.61 2.12 0.276
B 5.69 5.00 11.11 6.63 11.27 39.71 2.09 0.257
C 2.86 3.38 5.00 3.91 5.91 21.05 1.84 0.136
D 4.08 4.63 9.00 5.00 9.68 32.38 2.00 0.210
E 2.67 2.73 4.64 3.54 5.00 18,58 1.79 0.120
� 20.30 22.49 40.70 25.92 44.91 154.32 9.84 1.00
Eigen value max (� maximum) = �aij.Xj (6)
= 5.262 (see Table 6).
Consistency Index (CI) and Consistency Ratio (CR) were also calculated using Eq. 7 and 8:
Consistency index (CI) = max1
nn
λ −−
= (5.262 5)(5 1)
−−
= 0.066 (7)
Consistency ratio (CR) = CIRI
= 0.0661.12
, where RI = 1.12 (8)
= 0.059 < 0.1 Consistent!
The summary of the analysis was presented in Table 7 and 8. It can be seen that the most significant criteria were the level of damage (27.6%), technical aspects (25.7%), finance (21%), vehicle load (13.6%) and resources (12%). The results of this research showed the essential findings in determining the priority scales for bridge repair and maintenance systems.
Table 7. Summary of criteria and the weights.
Criteria Weights
Damage (A) 0.276
Technicals (B) 0.257
Vehicle Load (C) 0.136
Financial Support (D) 0.210
Resources (E) 0.120
Total 1.00
Table 9 also exhibited the weights of each criterion as well as the rank of prioritization
for bridge maintenance for nine bridges. It can be concluded that the first five (5) priorities of bridges to maintain from deterioration were shown by the highest amount of weights
, 0 (2019) https://doi.org/10.1051/matecconf /201927601036MATEC Web of Conferences 276
ICAnCEE 2018
1036
7
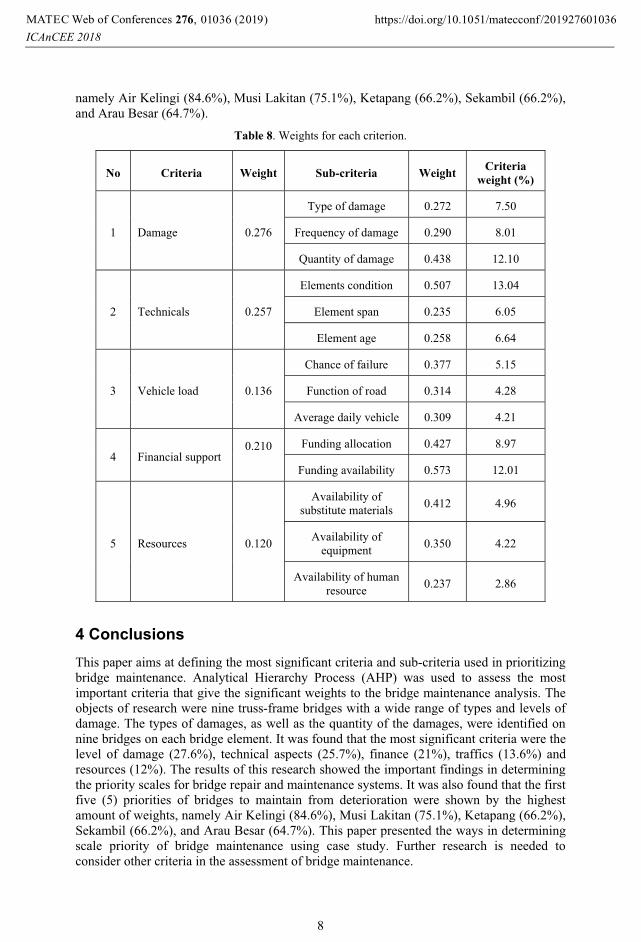
namely Air Kelingi (84.6%), Musi Lakitan (75.1%), Ketapang (66.2%), Sekambil (66.2%), and Arau Besar (64.7%).
Table 8. Weights for each criterion.
No Criteria Weight Sub-criteria Weight Criteria weight (%)
1 Damage
0.276
Type of damage 0.272 7.50
Frequency of damage 0.290 8.01
Quantity of damage 0.438 12.10
2 Technicals
0.257
Elements condition 0.507 13.04
Element span 0.235 6.05
Element age 0.258 6.64
3 Vehicle load
0.136
Chance of failure 0.377 5.15
Function of road 0.314 4.28
Average daily vehicle 0.309 4.21
4 Financial support 0.210
Funding allocation 0.427 8.97
Funding availability 0.573 12.01
5 Resources 0.120
Availability of substitute materials 0.412 4.96
Availability of equipment 0.350 4.22
Availability of human resource 0.237 2.86
4 Conclusions This paper aims at defining the most significant criteria and sub-criteria used in prioritizing bridge maintenance. Analytical Hierarchy Process (AHP) was used to assess the most important criteria that give the significant weights to the bridge maintenance analysis. The objects of research were nine truss-frame bridges with a wide range of types and levels of damage. The types of damages, as well as the quantity of the damages, were identified on nine bridges on each bridge element. It was found that the most significant criteria were the level of damage (27.6%), technical aspects (25.7%), finance (21%), traffics (13.6%) and resources (12%). The results of this research showed the important findings in determining the priority scales for bridge repair and maintenance systems. It was also found that the first five (5) priorities of bridges to maintain from deterioration were shown by the highest amount of weights, namely Air Kelingi (84.6%), Musi Lakitan (75.1%), Ketapang (66.2%), Sekambil (66.2%), and Arau Besar (64.7%). This paper presented the ways in determining scale priority of bridge maintenance using case study. Further research is needed to consider other criteria in the assessment of bridge maintenance.
, 0 (2019) https://doi.org/10.1051/matecconf /201927601036MATEC Web of Conferences 276
ICAnCEE 2018
1036
8
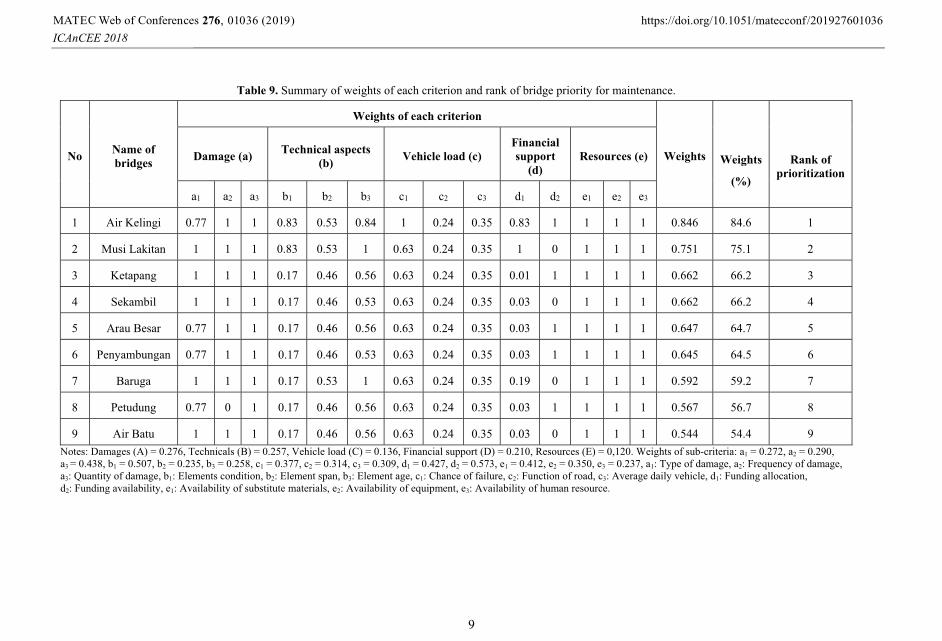
Table 9. Summary of weights of each criterion and rank of bridge priority for maintenance.
Notes: Damages (A) = 0.276, Technicals (B) = 0.257, Vehicle load (C) = 0.136, Financial support (D) = 0.210, Resources (E) = 0,120. Weights of sub-criteria: a1 = 0.272, a2 = 0.290, a3 = 0.438, b1 = 0.507, b2 = 0.235, b3 = 0.258, c1 = 0.377, c2 = 0.314, c3 = 0.309, d1 = 0.427, d2 = 0.573, e1 = 0.412, e2 = 0.350, e3 = 0.237, a1: Type of damage, a2: Frequency of damage, a3: Quantity of damage, b1: Elements condition, b2: Element span, b3: Element age, c1: Chance of failure, c2: Function of road, c3: Average daily vehicle, d1: Funding allocation, d2: Funding availability, e1: Availability of substitute materials, e2: Availability of equipment, e3: Availability of human resource.
No Name of bridges
Weights of each criterion
Weights
Weights
(%)
Rank of prioritization
Damage (a) Technical aspects (b) Vehicle load (c)
Financial support
(d) Resources (e)
a1 a2 a3 b1 b2 b3 c1 c2 c3 d1 d2 e1 e2 e3
1 Air Kelingi 0.77 1 1 0.83 0.53 0.84 1 0.24 0.35 0.83 1 1 1 1 0.846 84.6 1
2 Musi Lakitan 1 1 1 0.83 0.53 1 0.63 0.24 0.35 1 0 1 1 1 0.751 75.1 2
3 Ketapang 1 1 1 0.17 0.46 0.56 0.63 0.24 0.35 0.01 1 1 1 1 0.662 66.2 3
4 Sekambil 1 1 1 0.17 0.46 0.53 0.63 0.24 0.35 0.03 0 1 1 1 0.662 66.2 4
5 Arau Besar 0.77 1 1 0.17 0.46 0.56 0.63 0.24 0.35 0.03 1 1 1 1 0.647 64.7 5
6 Penyambungan 0.77 1 1 0.17 0.46 0.53 0.63 0.24 0.35 0.03 1 1 1 1 0.645 64.5 6
7 Baruga 1 1 1 0.17 0.53 1 0.63 0.24 0.35 0.19 0 1 1 1 0.592 59.2 7
8 Petudung 0.77 0 1 0.17 0.46 0.56 0.63 0.24 0.35 0.03 1 1 1 1 0.567 56.7 8
9 Air Batu 1 1 1 0.17 0.46 0.56 0.63 0.24 0.35 0.03 0 1 1 1 0.544 54.4 9
, 0 (2019) https://doi.org/10.1051/matecconf /201927601036MATEC Web of Conferences 276
ICAnCEE 2018
1036
9
References 1. V.H. Adriaan, L. Pintelon, Omega 42, 1 (2014) 2. Austroads, Bridge management using performance model (Austroads, Sydney, 2013) 3. S.A. Dabous, A decision support methodology for rehabilitation management of
concrete bridges (Thesis, Concordia University, Montréal, 2008) 4. V. Gattulli, L. Chiaramonte, Computer-Aided Civil and Infrastr. Eng. 20, 2 (2005) 5. S. Hasan, S. Setunge, W. David, Y.C. Koay, Int. J. of Eng. and Tech. 7, 1 (2015) 6. C. Jacques, J. Mohammadi, Computer-Aided Civil and Infrastr. Eng. 12, 6 (1997) 7. W.Y Ming, J. Liu, M.S.T. Elhag, Computers and Industr. Eng. 54, 3 (2008) 8. S. Nukul, B.H.W. Hadikusumo, J. of Construction in Dev. Countries 15, 1 (2010) 9. Austroads. Bridge management system state of the art (Austroads, Sydney, 2002) 10. Y.M. Wang, J. Liu, T.M.S. Elhag, Computers and Industr. Eng. 54, 3 (2008) 11. S. K. Walia, H.K. Vinayak, R. Parti, Int. J. of Scientific & Eng. Res. 5, 5 (2014)
, 0 (2019) https://doi.org/10.1051/matecconf /201927601036MATEC Web of Conferences 276
ICAnCEE 2018
1036
10
Copyright © 2022 FDOKUMEN