Identification and Prioritization of Grain Discharging Operations Risks by Using ORESTE Method
13
233 Identification and Prioritization of Grain Discharging Operations Risks by Using ORESTE Method Hassan Jafari Department of Marine Transportation, Faculty of Maritime Economics and Management, Khoramshahr Marine Science and Technology University, Khoramshahr, Iran Abstract Exposing the acts of unloader, sucker and Grab in the grain terminal of Imam Khomeini port by manipulating ORESTE and Shannon's Entropy Methods in the three phases will lead to identification and prioritization of the grain discharging processes risks from the ship. In the first phase, by the analysis of the events and occurred incidents information bank about the surveyed matters and also setting brainstorming sessions with the terminal’s experts, 22 risks were identified. In the second phase by using from the Shannon’s Entropy, the criteria (occurrence frequency, severity and detection) were weighted. Then based on the mentioned criteria the identified risks were scored in form of a scale from 1 to 10. Finally according to the obtained scores of each risk, the ORSTE decision matrix was conducted and subsequently in the third phase by using this method, all of the identified risks were prioritized. Keywords: Risk, grain discharging, Imam Khomeini port, ORESTE, grain terminal Introduction 1 Nowadays the security management standard and the workplace hygiene, OHSAS 18001 is considered one of the management way for promoting the security level and the workplace hygiene in a lot of organizations using the unity IMS standard frame that is in the initializing and designing mood. The first Corresponding author’s email address: [email protected] step towards the implementation work should be the operational plans and designs due to detecting the risks and evaluating their dangers and developing some processes that concern to decrease the risks. Hereby, the organizations, after this accomplishment should review the information and following to it, the personnel must be aware of the peripheral dangers that may occur alternatively. Journal of Asian Business Strategy journal homepage: http://aessweb.com/journal-detail.php?id=5006
Transcript of Identification and Prioritization of Grain Discharging Operations Risks by Using ORESTE Method
233
Identification and Prioritization of Grain Discharging Operations Risks by Using
ORESTE Method
Hassan Jafari
Department of Marine Transportation, Faculty of Maritime Economics and Management,
Khoramshahr Marine Science and Technology University, Khoramshahr, Iran
Abstract
Exposing the acts of unloader, sucker and Grab in the grain terminal of Imam Khomeini port by
manipulating ORESTE and Shannon's Entropy Methods in the three phases will lead to
identification and prioritization of the grain discharging processes risks from the ship. In the first
phase, by the analysis of the events and occurred incidents information bank about the surveyed
matters and also setting brainstorming sessions with the terminal’s experts, 22 risks were identified.
In the second phase by using from the Shannon’s Entropy, the criteria (occurrence frequency,
severity and detection) were weighted. Then based on the mentioned criteria the identified risks
were scored in form of a scale from 1 to 10. Finally according to the obtained scores of each risk,
the ORSTE decision matrix was conducted and subsequently in the third phase by using this
method, all of the identified risks were prioritized.
Keywords: Risk, grain discharging, Imam Khomeini port, ORESTE, grain terminal
Introduction1
Nowadays the security management standard
and the workplace hygiene, OHSAS 18001
is considered one of the management way
for promoting the security level and the
workplace hygiene in a lot of organizations
using the unity IMS standard frame that is in
the initializing and designing mood. The first
Corresponding author’s email address:
step towards the implementation work
should be the operational plans and designs
due to detecting the risks and evaluating
their dangers and developing some processes
that concern to decrease the risks.
Hereby, the organizations, after this
accomplishment should review the
information and following to it, the
personnel must be aware of the peripheral
dangers that may occur alternatively.
Journal of Asian Business Strategy
journal homepage: http://aessweb.com/journal-detail.php?id=5006
Journal of Asian Business Strategy, 3(9) 2013: 233-245
234
(Balmat et al., 2011). According to the above
mentioned matter, initializing and
implementing the unity IMS management
system in the dedicated grain terminal will
enhance the necessity to detecting and
analyzing the risks and evaluate their
prioritization (Bartolomei et al., 2008).
This study, based to the vast activity of this
terminal, exclusively probe the grain
discharging processes from the ship by using
unloader, sucker and Grab for detecting and
evaluating the risks. In this study by using
the ORESTE and Shannon’s Entropy
methods the identified risks were prioritized
based on their frequency of occurrence, the
impact which they will trace after the
occurrence (severity) and the probability of
the recognizing before the incident
(detection).
Risks and risks evaluation’s methods
Risk: In fact risk is the potential that a
chosen action or activity (including the
choice of inaction) will lead to an
undesirable outcome, and in the security
matter defines as the consequence and
probability of a hazardous event or
phenomenon (Brito et al., 2010).
Risk management: Without doubt, is one of
the most important matters that human
beings are involved in it and is continuous
especially in the complex matters (Clothier
& Walker, 2012).
So having the necessities and be a warring of
these matters may help to the preciosity of
the decision making and risk management is
considered one of these important asset that
can be a key of the solution for such matters
(Fabiano et al., 2010).
So this will enhance particularly when a
complex set of factors and consequences are
responsible for external and internal
vulnerabilities decision causes in the room
and the demands of the customers and the
nominee should be prepared according to
their benefits. This matter is of high
sensation.
Also a set of widespread activity is running
in the room of the ports per se that these
notions will implies an influence on the
outcome.in the most of the times, these
phenomenon are not carry a high stress but
they are so numerous that cause the
possibility of loss, injury, or other adverse or
unwelcome circumstance (McGraw, 1982).
However, by cursory and slight glance on the
matter of the ports security it may not
understand the risk management to its
profound meaning. Risk management is a
dynamic system that includes a set of risk
cause identification, risk values estimation,
risk programming and how to reduce and
control these risky actions (Fabiano et al.,
2010).
It is notable to mention here, that risk
management cannot eradicate the risk totally
but it is an action that reduces it to the lowest
point of the possibility (Sadounzadeh and
Jafari, 2013).
Journal of Asian Business Strategy, 3(9) 2013: 233-245
235
Risk management is not superseding with the
individuals’ experience but it can only help
the experienced individuals to use their
experience in the optimal situation. Risk
management with high quality prepared
information in the management delivery can
help the managers to select the cost of the
organization in the economic way of budget
and use it on its appropriate way. Risk
management can provide a far-sighted
prospect for the experts to foreseen the
probable risks and in order to prevent such
risks; they can plan and perform in a
preemptions manner (Jafari, 2013).
In whole it is performable in the quality and
quantity forms.In fact, Qualitative Risk
Management directly depends on experts
experience and their own judgments during
the process. However, such data and
information during the process may fail to
have correct and precise values and logic but
they are better than nothing. Risk quality
evaluation, in fact, is a degree and an outlet
to the quantifying achievement. Albeit
individuals’ attitudes and views for such
measures and criteria are different and have
their particular effect but manipulating this
methods can be very fruitful and impressive.
Qualitative Risk management is highly
dependent on the system subject’s domain,
judgments or acquired experience (Saeidi et
al., 2013). Hence this method for data
analysis and mathematical processes of the
information refer to the very simple
calculation because it is based on
uncompromising mental techniques.it is
worth of mention that the research carry
some numerical values and data, but all of its
work is founded on mental and subjective
methods even for quantity risk and this may
lead on the research with a little uncertainty
(Jafari and dadkhah, 2013).
Methodology
The present study in conducted on the
descriptive nature and seek for the applied
aims in which rest in the field and as the title
suggest, its goal is to identify and prioritizing
the following probable risks in the grain
discharging processes from the ship by using
ORESTE method and Shannon’s Entropy.
Hence toward a successful achievability for
its goal it has been accomplished in the three
phases. Pursuantly In the first phase, by the
analysis of the events and occurred incidents
information bank about the surveyed matters
and also setting brainstorming sections with
the terminal’s experts, these sessions were
conducted to list the probable risks that they
weren’t occurred yet. In the second phase by
using from the Shannon’s Entropy, the
criteria (occurrence frequency, severity and
detection) were weighted. Then based on the
criteria of determination of causes
occurrence probability (occurrence
frequency), the extent of its impact on
process after occurrence (severity) and
probability of its identification prior to
having impact on the process (detection), the
identified risks were scored in form of a
scale from 1 to 10.on which 1 is the least
class rank and 10 is the highest class rank.
Finally according to the obtained scores of
each risk, the ORESTE decision matrix was
conducted and subsequently in the third
Journal of Asian Business Strategy, 3(9) 2013: 233-245
236
phase by using this method, all of the
identified risks were prioritized.
ORESTE
If we consider A as a limited set, these
alternative shall be analyzed by the set
including k. in this method, the relative
importance of each index is not specified by
their weight, but it is stated by a superiority
structure on the index , which is described
under a weak level. The so called weak level
is stated in a full and transition Equation of
S, which is consisted of P and I Equations. P
or superiority show discrepancy and I shows
incuriosity, which the representative of
superiority coordination among the criteria.
Also for each of the criteria of j=1 … k, a
superiority structure in the set A is described,
which is similar to C criteria of the
superiority structure is transitional and
consisting of a set of P and I relationships
(Jafari et al., 2013). Thus, the 1st superiority
structure is established based on criteria’
relative importance to each other and the 2nd
superiority structure also created on the
optional set and according to each one of
them individually. After formation of the
abovementioned 2 superiority structures, we
should pay attention to the preliminary
ranking of these structures. To do so, we
may use Besson average ranking method. In
such a way to refer to the superiority
structure 1st and according to its rank in
comparison to all other criteria, dedicate
numbers 1-K (k index) and for all alternative
numbers 1-m (m criteria ). Then we obtain
the mean from the maximum or the
minimum dedicated number which is
constructed based on the superiority
structure enjoys similar superiority or I
(Equation1). In other words, instead of
dedicating grades 1and 2 to the so called two
criteria (alternative), we shall grant it to both
ranks (1/5); therefore, with Besson average
ranking, the priorities shall turn to ranks. The
obtained rank for criteria shall be represented
by rk and the gained rank for each option in
each index shall be represented by rk(m)
(Brans et al., 1986).
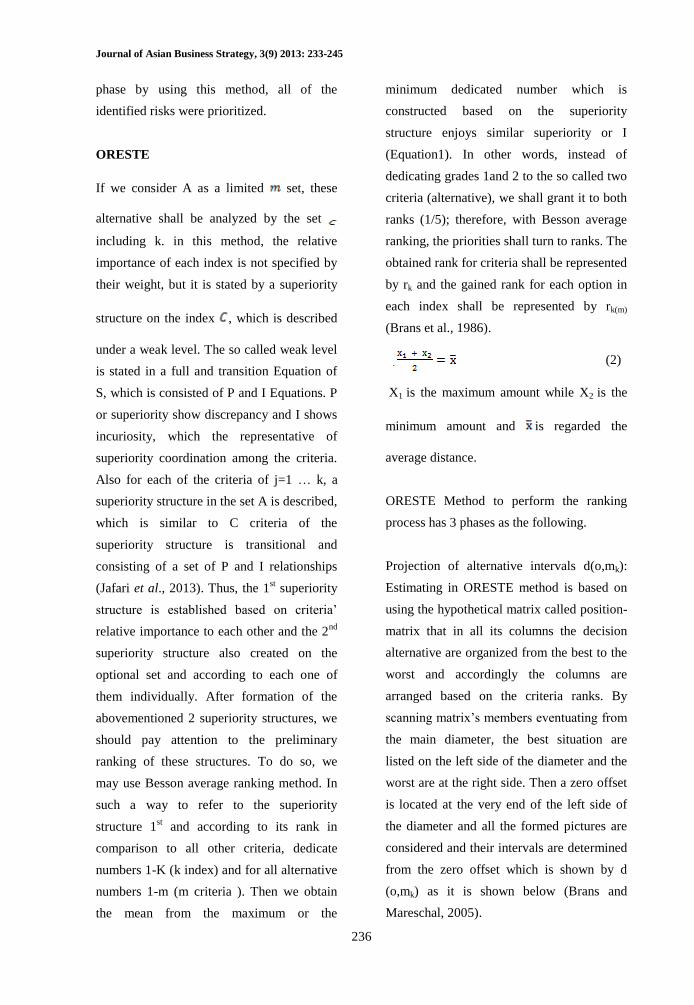
. (2)
X1 is the maximum amount while X2 is the
minimum amount and is regarded the
average distance.
ORESTE Method to perform the ranking
process has 3 phases as the following.
Projection of alternative intervals d(o,mk):
Estimating in ORESTE method is based on
using the hypothetical matrix called position-
matrix that in all its columns the decision
alternative are organized from the best to the
worst and accordingly the columns are
arranged based on the criteria ranks. By
scanning matrix’s members eventuating from
the main diameter, the best situation are
listed on the left side of the diameter and the
worst are at the right side. Then a zero offset
is located at the very end of the left side of
the diameter and all the formed pictures are
considered and their intervals are determined
from the zero offset which is shown by d
(o,mk) as it is shown below (Brans and
Mareschal, 2005).
Journal of Asian Business Strategy, 3(9) 2013: 233-245
237
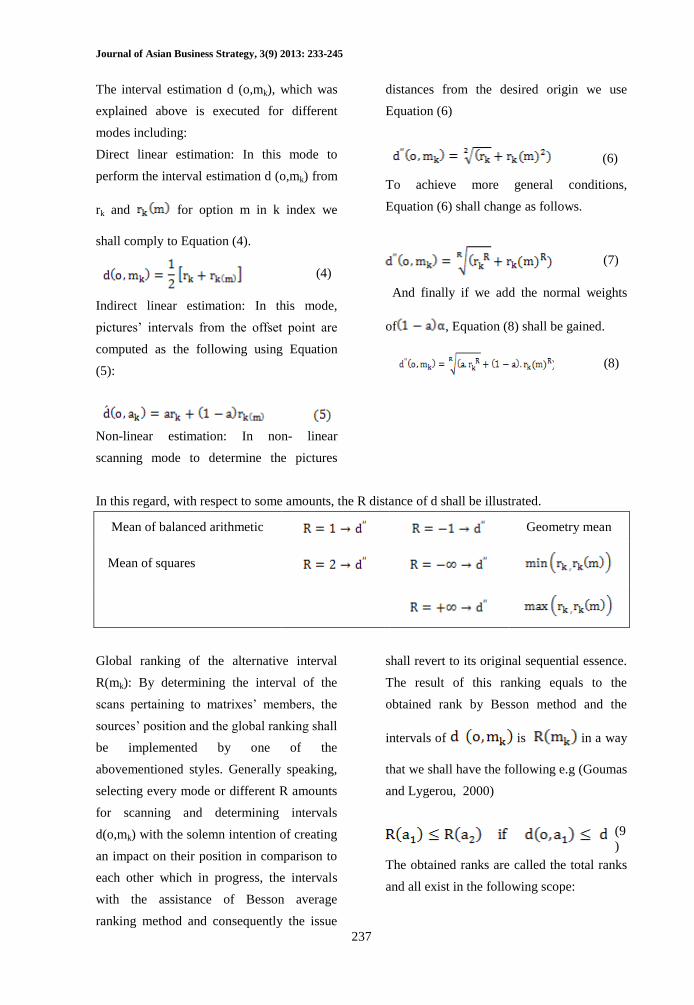
The interval estimation d (o,mk), which was
explained above is executed for different
modes including:
Direct linear estimation: In this mode to
perform the interval estimation d (o,mk) from
rk and for option m in k index we
shall comply to Equation (4).
(4)
Indirect linear estimation: In this mode,
pictures’ intervals from the offset point are
computed as the following using Equation
(5):
Non-linear estimation: In non- linear
scanning mode to determine the pictures
distances from the desired origin we use
Equation (6)
(6)
To achieve more general conditions,
Equation (6) shall change as follows.
(7)
And finally if we add the normal weights
of , Equation (8) shall be gained.
(8)
In this regard, with respect to some amounts, the R distance of d shall be illustrated.
Geometry mean
Mean of balanced arithmetic
Mean of squares
Global ranking of the alternative interval
R(mk): By determining the interval of the
scans pertaining to matrixes’ members, the
sources’ position and the global ranking shall
be implemented by one of the
abovementioned styles. Generally speaking,
selecting every mode or different R amounts
for scanning and determining intervals
d(o,mk) with the solemn intention of creating
an impact on their position in comparison to
each other which in progress, the intervals
with the assistance of Besson average
ranking method and consequently the issue
shall revert to its original sequential essence.
The result of this ranking equals to the
obtained rank by Besson method and the
intervals of is in a way
that we shall have the following e.g (Goumas
and Lygerou, 2000)
(9
)
The obtained ranks are called the total ranks
and all exist in the following scope:
Journal of Asian Business Strategy, 3(9) 2013: 233-245
238
(10)
Thus an incremental sequential structure is
modified based on and with regard to
the following Equations:
(12)
An option that the relative is smaller
is more appropriate and a better rank shall be
awarded to it; in other words, it is the top
option in which the total sum of all its
criteria is less than the others.
Shannon entropy and objective weights
Shannon and Weaver proposed the entropy
concept, which is a measure of uncertainty in
information formulated in terms of
probability theory. Since the entropy concept
is well suited for measuring the relative
contrast intensities of criteria to represent the
average intrinsic information transmitted to
the decision maker, conveniently it would be
a proper option for our purpose. Shannon
developed measure H that satisfied the
following properties for all pi within the
estimated joint probability distribution P
(Jafari et al., 2013):
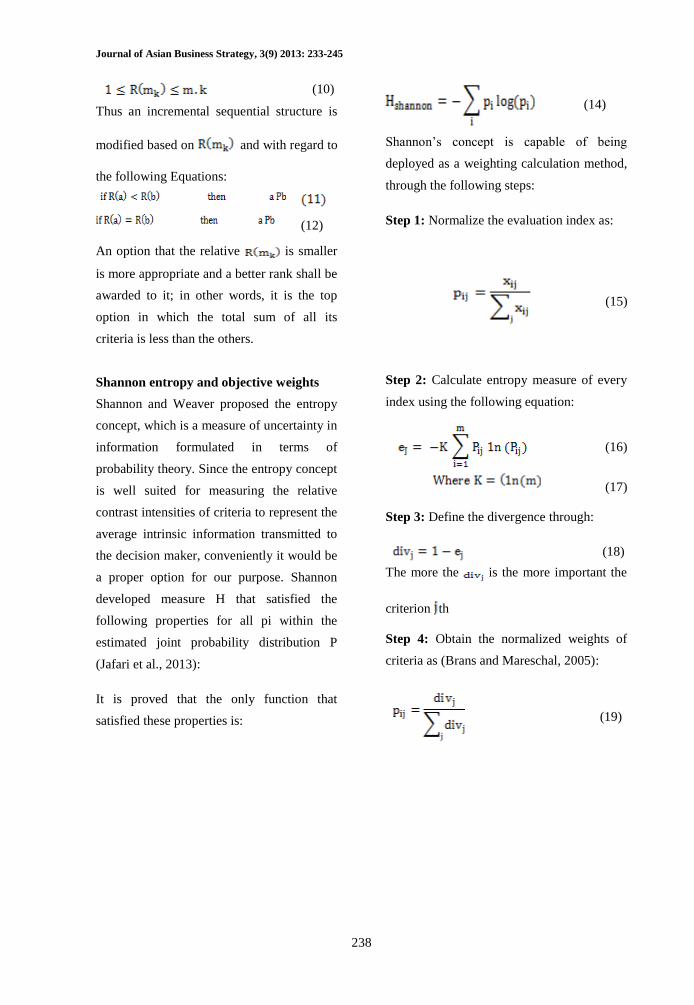
It is proved that the only function that
satisfied these properties is:
(14)
Shannon’s concept is capable of being
deployed as a weighting calculation method,
through the following steps:
Step 1: Normalize the evaluation index as:
Step 2: Calculate entropy measure of every
index using the following equation:
(16)
(17)
Step 3: Define the divergence through:
(18)
The more the is the more important the
criterion th
Step 4: Obtain the normalized weights of
criteria as (Brans and Mareschal, 2005):
(19)
(15)
Journal of Asian Business Strategy, 3(9) 2013: 233-245
239
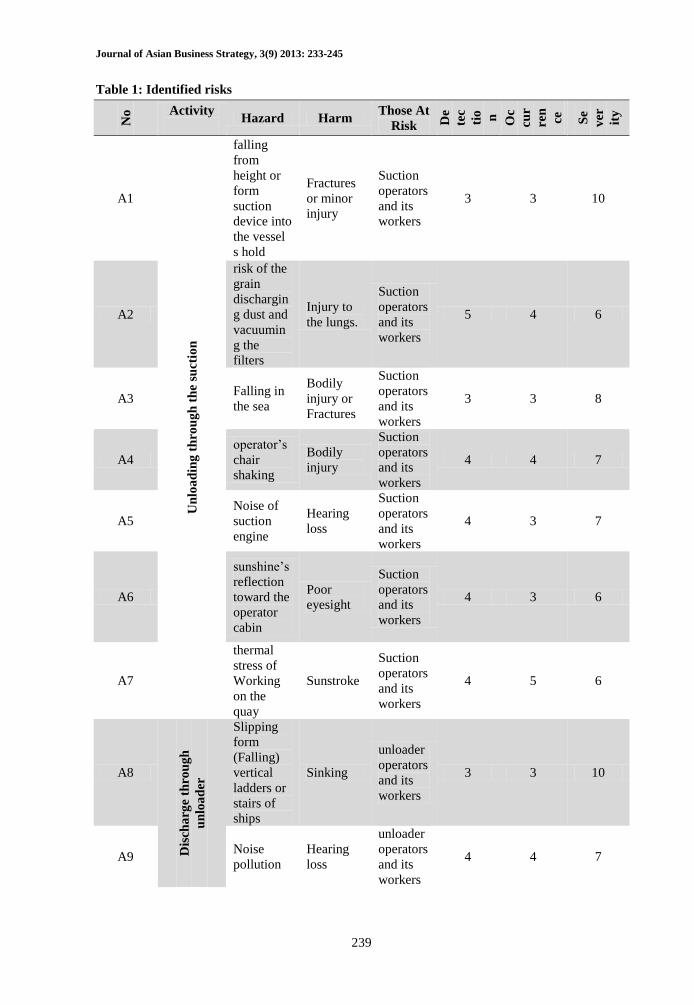
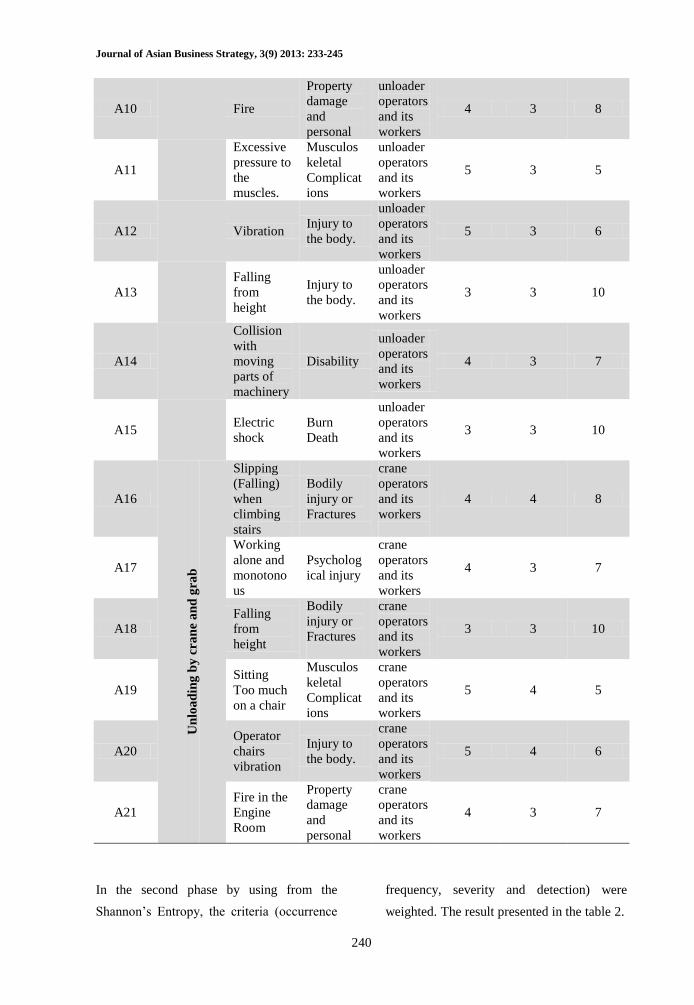
Table 1: Identified risks
Se
ver ity
Oc
cur
ren
ce
De
tec
tio n Those At
Risk Harm Hazard
Activity N
o
10 3 3
Suction
operators
and its
workers
Fractures
or minor
injury
falling
from
height or
form
suction
device into
the vessel
s hold
Un
loa
din
g t
hro
ug
h t
he
suct
ion
A1
6 4 5
Suction
operators
and its
workers
Injury to
the lungs.
risk of the
grain
dischargin
g dust and
vacuumin
g the
filters
A2
8 3 3
Suction
operators
and its
workers
Bodily
injury or
Fractures
Falling in
the sea A3
7 4 4
Suction
operators
and its
workers
Bodily
injury
operator’s
chair
shaking
A4
7 3 4
Suction
operators
and its
workers
Hearing
loss
Noise of
suction
engine
A5
6 3 4
Suction
operators
and its
workers
Poor
eyesight
sunshine’s
reflection
toward the
operator
cabin
A6
6 5 4
Suction
operators
and its
workers
Sunstroke
thermal
stress of
Working
on the
quay
A7
10 3 3
unloader
operators
and its
workers
Sinking
Slipping
form
(Falling)
vertical
ladders or
stairs of
ships
Dis
cha
rge
thro
ug
h
un
loa
der
A8
7 4 4
unloader
operators
and its
workers
Hearing
loss
Noise
pollution A9
Journal of Asian Business Strategy, 3(9) 2013: 233-245
240
8 3 4
unloader
operators
and its
workers
Property
damage
and
personal
Fire A10
5 3 5
unloader
operators
and its
workers
Musculos
keletal
Complicat
ions
Excessive
pressure to
the
muscles.
A11
6 3 5
unloader
operators
and its
workers
Injury to
the body. Vibration A12
10 3 3
unloader
operators
and its
workers
Injury to
the body.
Falling
from
height
A13
7 3 4
unloader
operators
and its
workers
Disability
Collision
with
moving
parts of
machinery
A14
10 3 3
unloader
operators
and its
workers
Burn
Death
Electric
shock A15
8 4 4
crane
operators
and its
workers
Bodily
injury or
Fractures
Slipping
(Falling)
when
climbing
stairs
Un
loa
din
g b
y c
ra
ne
an
d g
rab
A16
7 3 4
crane
operators
and its
workers
Psycholog
ical injury
Working
alone and
monotono
us
A17
10 3 3
crane
operators
and its
workers
Bodily
injury or
Fractures
Falling
from
height
A18
5 4 5
crane
operators
and its
workers
Musculos
keletal
Complicat
ions
Sitting
Too much
on a chair
A19
6 4 5
crane
operators
and its
workers
Injury to
the body.
Operator
chairs
vibration
A20
7 3 4
crane
operators
and its
workers
Property
damage
and
personal
Fire in the
Engine
Room
A21
In the second phase by using from the
Shannon’s Entropy, the criteria (occurrence
frequency, severity and detection) were
weighted. The result presented in the table 2.
Journal of Asian Business Strategy, 3(9) 2013: 233-245
241
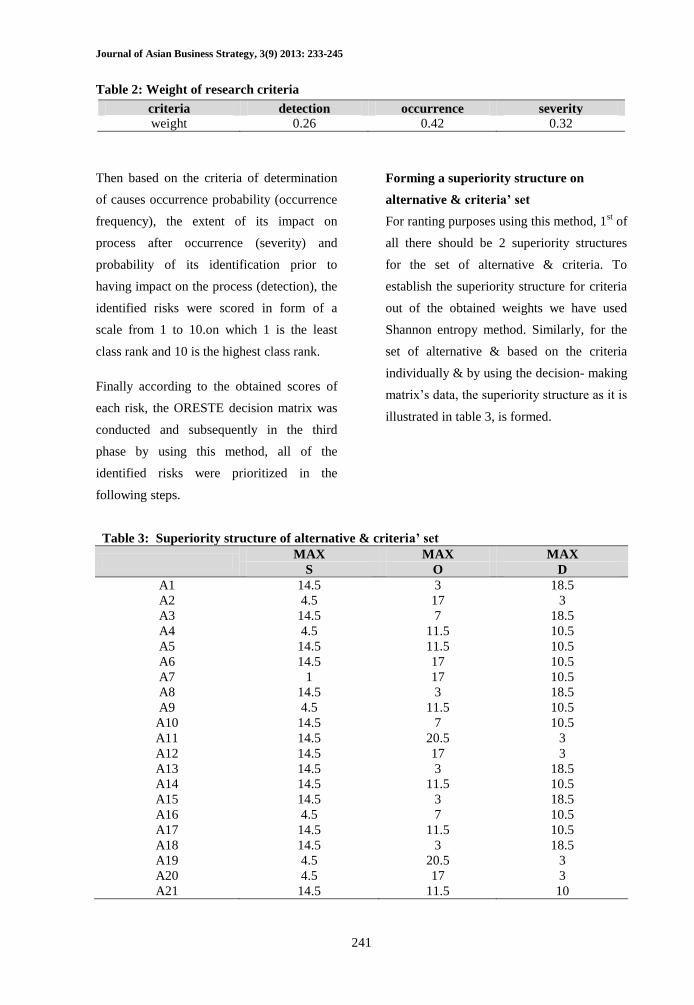
Table 2: Weight of research criteria
criteria detection occurrence severity
weight 0.26 0.42 0.32
Then based on the criteria of determination
of causes occurrence probability (occurrence
frequency), the extent of its impact on
process after occurrence (severity) and
probability of its identification prior to
having impact on the process (detection), the
identified risks were scored in form of a
scale from 1 to 10.on which 1 is the least
class rank and 10 is the highest class rank.
Finally according to the obtained scores of
each risk, the ORESTE decision matrix was
conducted and subsequently in the third
phase by using this method, all of the
identified risks were prioritized in the
following steps.
Forming a superiority structure on
alternative & criteria’ set
For ranting purposes using this method, 1st of
all there should be 2 superiority structures
for the set of alternative & criteria. To
establish the superiority structure for criteria
out of the obtained weights we have used
Shannon entropy method. Similarly, for the
set of alternative & based on the criteria
individually & by using the decision- making
matrix’s data, the superiority structure as it is
illustrated in table 3, is formed.
Table 3: Superiority structure of alternative & criteria’ set
MAX MAX MAX
S O D
A1 14.5 3 18.5
A2 4.5 17 3
A3 14.5 7 18.5
A4 4.5 11.5 10.5
A5 14.5 11.5 10.5
A6 14.5 17 10.5
A7 1 17 10.5
A8 14.5 3 18.5
A9 4.5 11.5 10.5
A10 14.5 7 10.5
A11 14.5 20.5 3
A12 14.5 17 3
A13 14.5 3 18.5
A14 14.5 11.5 10.5
A15 14.5 3 18.5
A16 4.5 7 10.5
A17 14.5 11.5 10.5
A18 14.5 3 18.5
A19 4.5 20.5 3
A20 4.5 17 3
A21 14.5 11.5 10
Journal of Asian Business Strategy, 3(9) 2013: 233-245
242
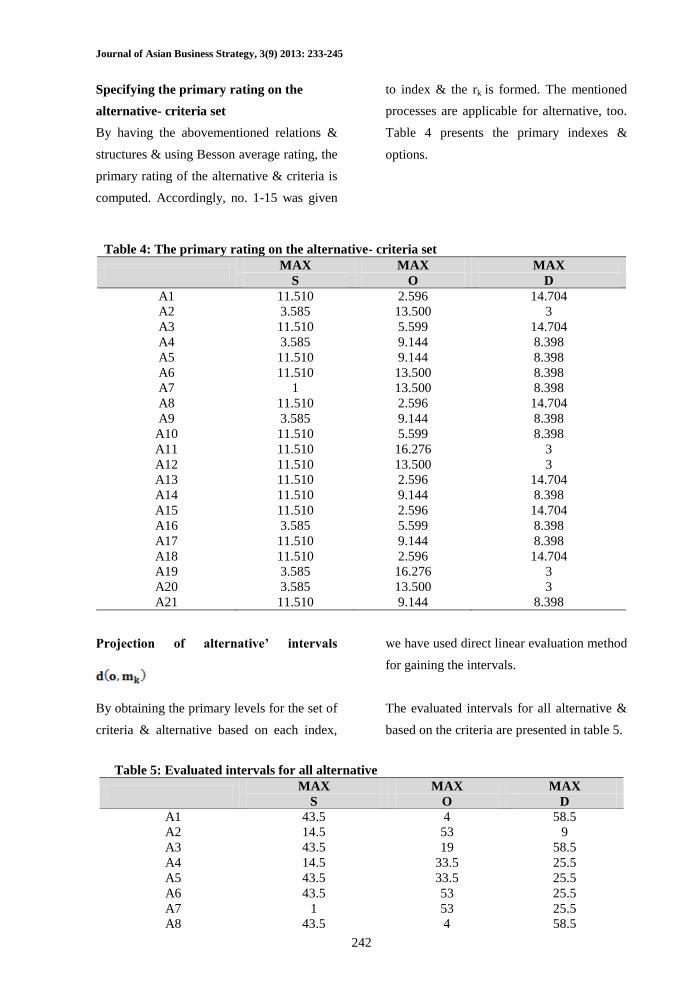
Specifying the primary rating on the
alternative- criteria set
By having the abovementioned relations &
structures & using Besson average rating, the
primary rating of the alternative & criteria is
computed. Accordingly, no. 1-15 was given
to index & the rk is formed. The mentioned
processes are applicable for alternative, too.
Table 4 presents the primary indexes &
options.
Table 4: The primary rating on the alternative- criteria set
MAX MAX MAX
S O D
A1 11.510 2.596 14.704
A2 3.585 13.500 3
A3 11.510 5.599 14.704
A4 3.585 9.144 8.398
A5 11.510 9.144 8.398
A6 11.510 13.500 8.398
A7 1 13.500 8.398
A8 11.510 2.596 14.704
A9 3.585 9.144 8.398
A10 11.510 5.599 8.398
A11 11.510 16.276 3
A12 11.510 13.500 3
A13 11.510 2.596 14.704
A14 11.510 9.144 8.398
A15 11.510 2.596 14.704
A16 3.585 5.599 8.398
A17 11.510 9.144 8.398
A18 11.510 2.596 14.704
A19 3.585 16.276 3
A20 3.585 13.500 3
A21 11.510 9.144 8.398
Projection of alternative’ intervals
By obtaining the primary levels for the set of
criteria & alternative based on each index,
we have used direct linear evaluation method
for gaining the intervals.
The evaluated intervals for all alternative &
based on the criteria are presented in table 5.
Table 5: Evaluated intervals for all alternative
MAX MAX MAX
S O D
A1 43.5 4 58.5
A2 14.5 53 9
A3 43.5 19 58.5
A4 14.5 33.5 25.5
A5 43.5 33.5 25.5
A6 43.5 53 25.5
A7 1 53 25.5
A8 43.5 4 58.5
Journal of Asian Business Strategy, 3(9) 2013: 233-245
243
A9 14.5 33.5 25.5
A10 43.5 19 25.5
A11 43.5 62.5 9
A12 43.5 53 9
A13 43.5 4 58.5
A14 43.5 33.5 25.5
A15 43.5 4 58.5
A16 14.5 19 25.5
A17 43.5 33.5 25.5
A18 43.5 4 58.5
A19 14.5 62.5 9
A20 14.5 53 9
A21 43.5 33.5 25.5
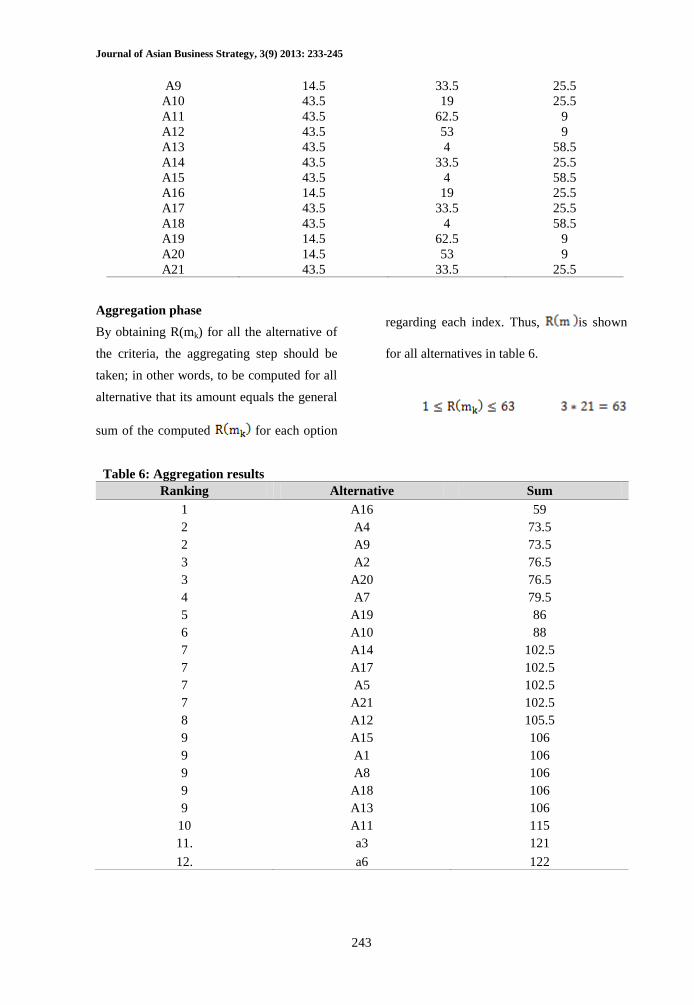
Aggregation phase
By obtaining R(mk) for all the alternative of
the criteria, the aggregating step should be
taken; in other words, to be computed for all
alternative that its amount equals the general
sum of the computed for each option
regarding each index. Thus, is shown
for all alternatives in table 6.
Table 6: Aggregation results
Ranking Alternative Sum
1 A16 59
2 A4 73.5
2 A9 73.5
3 A2 76.5
3 A20 76.5
4 A7 79.5
5 A19 86
6 A10 88
7 A14 102.5
7 A17 102.5
7 A5 102.5
7 A21 102.5
8 A12 105.5
9 A15 106
9 A1 106
9 A8 106
9 A18 106
9 A13 106
10 A11 115
11. a3 121
12. a6 122
Journal of Asian Business Strategy, 3(9) 2013: 233-245
244
Comparing the results & specifying the
top choice in ORESTE method
Finally to determine the top choice, we
compare the aggregation results from the
decision- making phase. In this section the
less the total sum, the higher the rank will
be.
Conclusion
Exposing the acts of unloaded, sucker and
Grab in the grain terminal of Persian Gulf by
manipulating ORESTE method and
Shannon's Entropy in the three phases will
lead to identification and prioritization of the
grain discharging processes risks from the
ship. In the first phase, by the analysis of the
events and occurred incidents information
bank about the surveyed matters and also
setting brainstorming sessions with the
terminal’s experts, 22 risks were identified.
In the second phase by using from the
Shannon’s Entropy, the criteria (occurrence
frequency, severity and detection) were
weighted.
Then based on the criteria of determination
of causes occurrence probability (occurrence
frequency), the extent of its impact on
process after occurrence (severity) and
probability of its identification prior to
having impact on the process (detection), the
identified risks were scored in form of a
scale from 1 to 10. Finally according to the
obtained scores of each risk, the ORSTE
decision matrix was conducted and
subsequently in the third phase by using this
method, all of the identified risks were
prioritized. According to the final result, the
risk of being slippery (falling) from the
stairs, operator chair shaking and the risk of
the dust of the discharging grain and
vacuuming the filters were obtained the
highest priority respectively and the risk of
the sunshine’s reflection toward the operator
cabin and the risk of the manifold pressure
toward the muscles and the risk of the falling
into a sea were obtained the least priority
respectively.
Reference
Balmat, J. F., Lafont, F., Maifret, R. &
Pessel, N. (2011). A decision-making
system to maritime risk assessment.
Ocean Engineering, 38(1): 171-176.
Bartolomei, A., Corigliano, M. & Lai, C. G.
(2008). Seismic risk assessment of
Italian seaports using GIS. Paper
presented at the AIP Conference
Proceedings.
Brito, A. J., de Almeida, A. T. & Mota, C.
M. M. (2010). A multicriteria model
for risk sorting of natural gas
pipelines based on ELECTRE TRI
integrating Utility Theory. European
Journal of Operational Research,
200(3): 812-821.
Clothier, R. A. & Walker, R. A. (2012). The
safety risk management of unmanned
aircraft systems. Handbook of
Unmanned Aerial Vehicles.
Fabiano, B., Currò, F., Reverberi, A. P. &
Pastorino, R. (2010). Port safety and
the container revolution. A statistical
study on human factor and
occupational accidents over the long
period. Safety Science, 48(8): 980-
990.
Journal of Asian Business Strategy, 3(9) 2013: 233-245
245
McGraw, H. (1982). Multiple Criteria
Decision Making. New York press.
Sadounzadeh, J. and Jafari, H. (2013).
Identification and prioritization of
preventive measures for encountering
piracy. Middle East Journal of
Scientific Research, 14(6): 806-813.
Jafari, H., (2013). Establishment of Total
Quality Management in the Iranian
Seaports. Journal of Asian Business
Strategy, 3(7): 140-153.
Saeidi, Jafari, H., Amli. Zaersoleymani.
(2013). Container Repositioning
Management in Liner Shipping
Industry. Management Science
Letters, 3(6): 1795–1804.
Jafari, H. and dadkhah, A. (2013). Risks
Analysis of Container Handling
Operation Using ELECTRE and
Shannon's Entropy Methods.
International Journal of Basic
Sciences & Applied Research. 2(4):
484-493.
Jafari, H., Noshadi, E. and khosheghbal, B.
(2013). Ranking Ports Based on
Competitive Criteria s by Using
ORESTE Method. International
Research Journal of Applied and
Basic Sciences. 4 (6): 1492-1498.
Brans, J. P. Vincke, Ph. Mareschal, B.
(1986). How to select and how to rank
projects: The ORESTE method.
European Journal of Operational
Research, 24: 228–238.
Brans, J. P. and Mareschal, B. (2005).
ORESTE methods, in Figueira, J.,
Greco, S. and Ehrgott, M. (Eds),
Multiple Criteria Decision Analysis:
State of the Art Surveys, Springer,
New York. NY. Pp: 163-198.
Goumas, M. and Lygerou, V. (2000). An
extension of the ORESTE method for
decision making in fuzzy
environment: ranking of alternative
energy exploitation. European Journal
of Operational Research. 1(23): 606–
613.