Candidate Project Evaluation and Prioritization Report
127
LRTP 2045 Candidate Project Evaluation and Prioritization Report Hampton Roads 2045 Long-Range Transportation Plan: January 2021 T21-02
-
Upload
khangminh22 -
Category
Documents
-
view
1 -
download
0
Transcript of Candidate Project Evaluation and Prioritization Report

LRTP2045
Candidate Project Evaluation and Prioritization Report
Hampton Roads 2045Long-Range Transportation Plan:
January 2021T21-02

HAM P T O N R OAD S T R AN S P O RTAT I O N P L AN N I N G O R GAN I Z AT I O N VO T I N G M E M B E R SRobert A. Crum, Jr. – Executive Director
VOTING MEMBERS:CHESAPEAKERick West, Vice ChairElla P. Ward – Alternate
FRANKLINFrank Rabil Vacant – Alternate
GLOUCESTER COUNTYPhillip BazzaniChristopher A. Hutson – Alternate
HAMPTONDonnie Tuck – ChairSteve Brown – Alternate
ISLE OF WIGHT COUNTYWilliam McCartyRudolph Jefferson - Alternate
JAMES CITY COUNTYMichael HippleVacant - Alternate
NEWPORT NEWSMcKinley L. PriceDavid H. Jenkins - Alternate
NORFOLKKenneth AlexanderMartin A. Thomas, Jr. – Alternate
POQUOSONW. Eugene Hunt, Jr.Herbert R. Green, Jr. – Alternate
PORTSMOUTHJohn Rowe Shannon E. Glover – Alternate
SOUTHAMPTON COUNTYWilliam GilletteVacant - Alternate
SUFFOLKLinda T. JohnsonLeroy Bennett - Alternate
VIRGINIA BEACHRobert DyerJames Wood- Alternate
WILLIAMSBURGDouglas Pons Pat Dent – Alternate
YORK COUNTYThomas G. Shepperd, Jr.Sheila Noll - Alternate
MEMBERS OF THE VIRGINIA SENATEThe Honorable Mamie E. LockeThe Honorable Lionell Spruill, Sr.
MEMBERS OF THE VIRGINIA HOUSE OF DELEGATESThe Honorable Stephen E. HeretickThe Honorable Jeion A. Ward
TRANSPORTATION DISTRICT COMMISSION OF HAMPTON ROADSWilliam E. Harrell, President/Chief Executive OfficerRay Amoruso – Alternate
VIRGINIA DEPARTMENT OF TRANSPORTATIONChristopher Hall, Hampton Roads District EngineerTodd Halacy – Alternate
VIRGINIA DEPARTMENT OF RAIL AND PUBLIC TRANSPORTATIONJennifer Mitchell, DirectorJennifer DeBruhl – Alternate
VIRGINIA PORT AUTHORITYJohn Reinhart, CEO/Executive DirectorCathie Vick – Alternate
WILLIAMSBURG AREA TRANSIT AUTHORITYZach Trogdon, Executive Director Joshua Moore – Alternate

HAM P TO N R OAD S T R AN S P O RTAT I O N P L AN N I N G O R GAN I Z AT I O N N O N -VOT I N G M E M B E R S
NON-VOTING MEMBERS:CHESAPEAKEChristopher M. Price
FRANKLINAmanda Jarratt
GLOUCESTER COUNTYJ. Brent Fedors
HAMPTONMary Bunting
ISLE OF WIGHT COUNTYRandy Keaton
JAMES CITY COUNTYScott Stevens
NEWPORT NEWSCynthia Rohlf
NORFOLKLarry “Chip” Filer
POQUOSONJ. Randall Wheeler
PORTSMOUTHLaVoris Pace
SOUTHAMPTON COUNTYMichael W. Johnson
SUFFOLKAlbert Moor
VIRGINIA BEACHPatrick Duhaney
WILLIAMSBURGAndrew Trivette
YORK COUNTYNeil A. Morgan
FEDERAL HIGHWAY ADMINISTRATIONThomas Nelson, Jr., Division Administrator, Virginia Division
FEDERAL TRANSIT ADMINISTRATIONTerry Garcia-Crews, Regional Administrator, Region 3
FEDERAL AVIATION ADMINISTRATIONJeffrey W. Breeden, Washington Airports District Office
VIRGINIA DEPARTMENT OF AVIATIONMark Flynn, Director
PENINSULA AIRPORT COMMISSIONMichael A. Giardino, Executive Director
NORFOLK AIRPORT AUTHORITYRobert S. Bowen, Executive Director
COMMUNITY ADVISORY COMMITTEETheresa Danaher, Chair
FREIGHT TRANSPORTATION ADVISORY COMMITTEELarry Ewan, Ewan & Associates, Co-ChairVacant, Co-Chair
MILITARY LIAISONSSam Stevens, Captain, U.S. Coast Guard Ed Vedder, Colonel, Langley-Eustis Tres Meek, Captain, U.S. NavyBrad Rosen, Captain U.S. Navy - Alternate
INVITED PARTICIPANTJohn Malbon, Commonwealth Transportation BoardStephen A. Johnsen, Commonwealth Transportation BoardW. Sheppard Miller, Commonwealth Transportation Board

R E P O RT D O C U M E N TAT I O NTITLE Hampton Roads 2045 Long-Range Transportation Plan: Candidate Project Evaluation and Prioritization
O R GAN IZ ATI O NHampton Roads Transportation Planning Organization 723 Woodlake Drive, Chesapeake, Virginia 23320 https://www.hrtpo.org/
AB S TR AC TThis document – part of the compendium of reports the comprise the 2045 Hampton Roads Long-Range Transportation Plan (LRTP) – summarizes the evaluation and prioritization of candidate projects being considered for the LRTP, utilizing the regional scenario planning framework and updated HRTPO Project Prioritization Tool. Results from this analysis will serve as a guiding tool in developing regional transportation priorities.
AC KN OW LE D G M E NT & D I S C L AI M E RSPrepared in cooperation with the U.S. Department of Transportation (USDOT), Federal Highway Administration (FHWA), and Virginia Department of Transportation (VDOT). The contents of this report reflect the views of the Hampton Roads Transportation Planning Organization (HRTPO). The HRTPO is responsible for the facts and the accuracy of the data presented herein. The contents do not necessarily reflect the official views or policies of the FHWA, VDOT, or Hampton Roads Planning District Commission. This report does not constitute a standard, specification, or regulation. FHWA or VDOT acceptance of this report as evidence of the fulfillment of the objectives of this planning study does not constitute endorsement/approval of the need for any recommended improvements, nor does it constitute approval of their location and design or a commitment to fund any such improvements. Additional project-level environmental impact assessments and/or studies of alternatives may be necessary.
N O N - D I S C R I M I NATI O N The HRTPO assures that no person shall, on the ground of race, color, national origin, handicap, sex, age, or income status as provided by Title VI of the Civil Rights Act of 1964 and subsequent authorities, be excluded from participation in, be denied the benefits of, or be otherwise subject to discrimination under any program or activity. The HRTPO Title VI Plan provides this assurance, information about HRTPO responsibilities, and a Discrimination Complaint Form.
AU TH O RS Dale M. Stith Steve Lambert
PR OJ E C T M AN AG E RDale M. Stith, AICP, GISP, Principal Transportation Planner
Dale M. Stith, AICP, GISP, Principal Transportation Planner Keith M. Nichols, PE, Principal Transportation Engineer Theresa K. Brooks, Transportation Engineer IIILeonardo Pineda, Transportation Planner IISteve Lambert, Transportation Planner II Sam S. Belfield, Senior Transportation Engineer Uros Jovanovic, Transportation Engineer Jeffrey K. Raliski, AICP, Transportation Analyst II Bishoy Kelleny, Transportation Engineer
Ben McFarlane, AICP, Senior Regional Planner Kathlene Grauberger, Transportation Planner Cynthia Mulkey, Administrative Assistant II Krista Lauro, Administrative Assistant II Andrew Margason, General Service Manager Christopher Vaigneur, Assistant General Services Manager
PR OJ E C T S TAF F

RE P O R T DATE JANUARY 2021
RE P O R T T21-02
H A M P T O N ROA D S 2045 LO N G - R A N G E TR A N SP O R TATI O N PL A N: C A ND IDATE PROJ E C T E VA LUATI O N A ND PRI O RITIZ ATI O N RE P O R T
AC KN OW LE D G E M E NT S S p e c i a l Th a n ks
HRTP O s t af f wo uld l ike to a ck n owle dge an d thank th e m emb er s of th e Lo ng - Range Tr ans p o r t at io n Pl an (LRTP) S ub co mmit te e an d VD OT Hamp to n Ro a ds Dis t r i c t s t af f fo r th e i r har d wo r k
an d d e d ic at io n in b oth p r ov i d ing an d r ev iew ing dat a an d r e s ult s as a p ar t of th is analys is .
HRTP O s t af f wo uld a l s o l ike to e x ten d a s p e c ia l thank yo u to VD OT Tr ans p o r t at io n Mob i l i t y an d Pl anning Di v is io n s t af f.
Th e i r as s is t an ce w i th th e Reg io nal Tr avel D eman d Mo d el an d in co n d u c t ing m o d el r uns was cr i t i c a l in co mple t ing th is analys is .

Chap ter 1: Int r o d u c t io n an d B a ckg r o un d . . . . . . . . . . . . . . . . . . . . . . . . . . . . . . . . . . . . . . . . . . . . . . . . 2
Chap ter 2: S cenar io P l anning . . . . . . . . . . . . . . . . . . . . . . . . . . . . . . . . . . . . . . . . . . . . . . . . . . . . . . . . . . . . . . . . . 5
Chap ter 3: 2045 LRTP Pr o je c t Pr io r i t i z at io n . . . . . . . . . . . . . . . . . . . . . . . . . . . . . . . . . . . . . . . . . . 9
Chap ter 4: 2045 LRTP Co mmit te d Pr o je c t s . . . . . . . . . . . . . . . . . . . . . . . . . . . . . . . . . . . . . . . . . . 15
Chap ter 5 : 2045 LRTP Pr o je c t Pr io r i t i z at io n S co r e s . . . . . . . . . . . . . . . . . . . . . . . . . . . . . 21
A p p en di x A . . . . . . . . . . . . . . . . . . . . . . . . . . . . . . . . . . . . . . . . . . . . . . . . . . . . . . . . . . . . . . . . . . . . . . . . . . . . . . . . . . . . . . . . . .4 8
LRTP D e s cr ip t io n of C alcul at io ns . . . . . . . . . . . . . . . . . . . . . . . . . . . . . . . . . . . . . . . . . . . . . . . . 49
2045 Weight ing Fa c to r s - Pr o je c t Ut i l i t y . . . . . . . . . . . . . . . . . . . . . . . . . . . . . . . . . . . . 95
2045 Weight ing Fa c to r s - Eco n o mic V i t a l i t y . . . . . . . . . . . . . . . . . . . . . . . . . . . . . . . 98
2045 Weight ing Fa c to r s - Pr o je c t V iab i l i t y . . . . . . . . . . . . . . . . . . . . . . . . . . . . . . . 100
A p p en di x B: P ubl i c Co mm ent s . . . . . . . . . . . . . . . . . . . . . . . . . . . . . . . . . . . . . . . . . . . . . . . . . . . . . . . . . . . . 102
TAB LE O F C O NTE NT S

I N T R O D U C T I O NP R OJ E C T E VA LUAT I O N A N D P R I O R IT I Z AT I O N 1
The 2045 Long-Range Transportation
Plan will use innovative
planning techniques to advance an
adaptive transportation system that
seamlessly integrates transportation
modes for all users while improving
quality of life and preserving the
unique character of Hampton Roads.

I N T R O D U C T I O NP R O J E C T E VA LUAT I O N A N D S C O R I N G 2 I N T R O D U C T I O NP R O J E C T E VA LUAT I O N A N D P R I O R I T I Z AT I O N 2
C HAP T E R 1 : I N T R O D U C T I O N AN D BAC KG R O U N D
1
Transportation designed to move people and goods in an efficient and reliable manner is essential for thriving communities. When considering transportation investments, it is important to not only take care of short-term demands, but also identify long-term needs. To accomplish this, the Hampton Roads Transportation Planning Organization (HRTPO) develops a long-range regional blueprint, or Long-Range Transportation Plan (LRTP) to help guide multi-modal transportation investments that promote system efficiency while maximizing the use of scarce transportation funds.
LRTPs have a planning horizon of at least twenty years and are updated regularly to reflect changing conditions and priorities. Changes in growth can impact travel demand on the regional transportation system just as changes in the environment and technology can impact how people will travel
in the future; therefore, transportation plans must consider alternatives to effectively address these conditions. Once alternatives are determined and prioritized, funds are identified to pay for the projects. This entire process takes approximately five years to complete and requires regional cooperation and public participation.
For the past few years, HRTPO staff has been working on updating the regional LRTP to the horizon year of 2045 which is scheduled to be adopted by the HRTPO Board in June 2021. This report, the fifth in the series documenting the development of the 2045 LRTP, summarizes the evaluation of candidate projects using the regional scenario planning framework and the updated HRTPO Project Prioritization Tool.

I N T R O D U C T I O NP R O J E C T E VA LUAT I O N A N D S C O R I N G 3 I N T R O D U C T I O NP R O J E C T E VA LUAT I O N A N D P R I O R I T I Z AT I O N 3
2045 LR TP D E V E LO PM E NT M ILE S T O NE S
4
APPROVED
SCENARIO
PLANNING
FRAMEWORK
APPROVED
SOCIOECONOMIC
FORECAST AND TAZ
ALLOCATION
UPDATED REGIONAL
TRAVEL DEMAND
MODEL
LRTP VISION &
GOALS
IDENTIFY
CANDIDATE
PROJECTS
FINALIZE
UPDATES TO
PROJECT
PRIORITIZATION
TOOL
SCENARIO
PLANNING
ANALYSIS
PROJECT
PRIORITIZATION
AND
EVALUATION OF
CANDIDATE
PROJECTS
DEVELOP
FINANCIAL PLAN
DEVELOP FINAL
LIST OF
PROJECTS
HRTPO BOARD
APPROVED 2045
LRTP
JUNE 2021

I N T R O D U C T I O NP R O J E C T E VA LUAT I O N A N D P R I O R I T I Z AT I O N 4
2045 LR TP RE P O R T S T O DATE The development of the 2045 LRTP is being documented in a series of reports. Listed below are the reports that have been produced to date. Please click on the highlighted links for more information.
The 2045 LRTP Socioeconomic Forecast and Transportation Analysis Zone Allocation report examines how the region may develop over the next twenty years based upon projected population and employment growth.
The 2045 LRTP Regional Needs report summarizes the visioning process as well as the collection and spatial analysis of candidate projects being considered for inclusion in the plan.
The 2045 LRTP Title VI/Environmental Justice Candidate Project Evaluation report documents the application of the HRTPO Title VI/Environmental Justice Methodology to assess transportation candidate projects being considered for inclusion in the plan.
The 2045 LRTP Transportation Challenges and Strategies report summarizes challenges related to the transportation system and strategies that are planned or in place to help address these challenges.

S C E N A R I O P L A N N I N GP R O J E C T E VA LUAT I O N A N D P R I O R I T I Z AT I O N 5
TECHNOLOGY
ADVANCES
CHANGING
VALUES
GLOBALIZATION
UNCERTAINTY
NEED FOR SCENARIO
PLANNING
Preparing long-range transportation plans can be challenging because the future is unpredictable and traditional planning tools and practices are not designed to adequately capture all this uncertainty. The changing nature of demographics, economics, the environment, and technology call for a more robust approach to long-range planning that explores how disruptive trends may interact, producing a range of future outcomes.
Scenario planning provides a framework to analyze dynamic, often competing factors in an organized and insightful manner. In terms of transportation, scenario planning can be utilized to consider how competing changes might affect connectivity, mobility, resiliency, and communities across the region. Specifically, in Hampton Roads, some factors that can impact how the region develops include the military, port, connected and autonomous vehicles, flooding vulnerabilities, an aging population, and transportation funding sources.
C HAP T E R 2 : S C E NAR I O P L AN N I N G
2

S C E N A R I O P L A N N I N GP R O J E C T E VA LUAT I O N A N D P R I O R I T I Z AT I O N 6
2045 LR TP S C E N A RI O PL A N NIN G C O N S ID E R ATI O N S
REGIONAL
ECONOMIC
DRIVERS
MULTIMODAL
CONNECTIVITY
AND
TECHNOLOGY
RESIL IENCY/
GEOGRAPHIC
CONSIDERATION
DEMOGRAPHIC
CONSIDERATION
FUNDING
Military
Port
Tourism
New Industries
High Capacity Transit
Corridors
Passenger Rail
Active Transportation
Connected and
Automated Vehicles
Transportation
Network Companies
(TNC)/Ride Sharing
Sea Level Rise and
Storm Surge
Coastal Resiliency
Flooding Resiliency
Aging Population
Millenials
Alternative Growth
Scenarios
Hampton Roads
Transportation Fund
Transportation
Revenue
SMART SCALE
To address the uncertainty in Hampton Roads, the 2045 LRTP and another regional effort, the Regional Connectors Study (RCS), are applying a unique scenario planning effort that specifically addresses how to investigate plausible alternate futures and their potential impacts on the transportation
system, providing quantitative inputs to enable the prioritization of regional investments. Because both the 2045 LRTP and RCS are regional efforts with a 2045 planning horizon, scenario planning between the two efforts are being coordinated.

S C E N A R I O P L A N N I N GP R O J E C T E VA LUAT I O N A N D P R I O R I T I Z AT I O N 7
The scenario planning effort being applied for the 2045 LRTP is exploratory as opposed to predictive or prescriptive (referred to as normative planning) and is therefore intended to examine What Could Happen in the region instead of What Should Happen. Since this effort is exploratory, a preferred scenario will not be selected. Instead, candidate transportation projects will be evaluated through each of the alternative scenarios to identify those projects that provide the most benefit to the region regardless of which
L O N G - R A N G E
T R A N S P O R T A T I O N P L A N N I N G
Identifies
preferred
scenario
Prescriptive
NORMATIVE:
WHAT SHOULD
HAPPEN?
PREDICTIVE
PLANNING
Trendlines, Expected,
Baseline
Explores
uncertainties,
opportunities,
risks
Plausible
futures
EXPLORATORY:
WHAT COULD
HAPPEN?
SCENARIO
PLANNING
Dynamic, Considers
impacts of competing
changes
Intent is not to predict the future,
but to have plausible alternative
futures against which to test
transportation alternatives
2045 LRTP
future assumption is analyzed – thereby highlighting smart investments for the Hampton Roads region.
Ultimately, this analysis approach will help position the HRTPO to make more resilient policy and investment choices for the future, with a focus on being prepared for what could happen under alternate scenarios regardless of the disruptive trends.

S C E N A R I O P L A N N I N GP R O J E C T E VA LUAT I O N A N D P R I O R I T I Z AT I O N 8
Over the past couple of years, HRTPO staff and the RCS consultant team, through a collaborative stakeholder process, established a Regional Scenario Planning Framework to guide the scenario analysis. In addition to preparing the 2045 baseline scenario, three additional future “Greater
2 0 4 5 G R E A T E R G R O W T H -
W A T E R
What happens if jobs focus on the waterfront, housing choices are varied,
and transportation technology adoption is moderate?
2 0 4 5 G R E A T E R G R O W T H -
U R B A N
What happens if jobs and housing focus in urban areas, with greater
multimodal availability and high adoption of connected vehicle
technology?
2 0 4 5 G R E A T E R G R O W T H -
S U B U R B A N
What happens if jobs and housing are developed in dispersed activity
centers, with a higher level of truck transportation and high adoption of
autonomous vehicle technology?
Growth” scenarios were developed. The process to create the regional framework also included identifying existing and future place types, scenario drivers (disruptive trends), alternate scenario narratives, and control totals for additional growth for the alternate scenarios.
2045 LR TP S C E N A RI O PL A N NIN G TH E M E S

P R O J E C T P R I O R I T I Z AT I O NP R O J E C T E VA LUAT I O N A N D P R I O R I T I Z AT I O N 9
ECONOMIC VITALITY:
POTENTIAL FOR ECONOMIC GAIN
PROJECT VIABILITY:
PROJECT READINESS
PROJECT UTILITY:
ABILITY TO SOLVE A PROBLEM
• Congestion
• Travel Time Reliability
• System Continuity and Connectivity/Regional Significance
• Safety and Security
• Modal Enhancements
• Travel Time and Delay Impacts
• Labor Market Access
• Address Needs of Basic Sector Industries
• Increased Opportunity
• Impact on Truck Movement
• Economic Distress Factors
• Project Readiness
• Land Use/Future Development Compatibility
• Environmental Considerations
• Cost Effectiveness
C HAP T E R 3 : 2 0 4 5 L RT P P R O J E C T P R I O R I T I Z AT I O N
3
Project Prioritization is an essential part of the development of the LRTP as scores produced from this process aid regional decision-makers in selecting transportation projects that will benefit the region while maximizing the use of scarce financial resources.
To prioritize projects, the HRTPO uses an objective and data-driven Project Prioritization Tool designed to evaluate and score candidate transportation projects based on technical merits and regional benefits. The Tool evaluates transportation projects based on three components:
• Project Utility (ability to solve an existing transportation issue)
• Economic Vitality (ability to support economic growth)
• Project Viability (project readiness and compatibility)
Each component is worth 100 points, combining for a maximum score of 300 points.
In addition to facilitating the selection of projects for the LRTP, the Tool also helps to position the region in the pursuit of additional Federal, State, and Regional transportation funds as they become available.

I N T R O D U C T I O NP R O J E C T E VA LUAT I O N A N D S C O R I N G 10 P R O J E C T P R I O R I T I Z AT I O NP R O J E C T E VA LUAT I O N A N D P R I O R I T I Z AT I O N 10
PR OJ E C T PR I O R ITIZ ATI O N T O O L U PDATE
The HRTPO Project Prioritization Tool has been used to evaluate and rank projects in the past two LRTPs and in the identification of Regional Priority Projects. The Tool was designed to be updated periodically to reflect current conditions and regional priorities.
In 2017, per the direction of the LRTP Subcommittee (comprised of representatives from localities, transit agencies, state and federal transportation agencies, etc.), HRTPO staff initiated a formal process to review and update the Tool to incorporate feedback received from regional stakeholders as well as ensure continued alignment with Federal and State planning factors. Recommended enhancements to the Tool were developed through a collaborative process with various HRTPO committees, regional stakeholders, and the public. The HRTPO Board approved the recommended enhancements to the Project Prioritization Tool at its July 16, 2020 meeting.
More information on the HRTPO Project Prioritization Tool and the enhancements can be found by clicking on the links below. Public comments received on the recommended enhancements to the Tool can be found in Appendix B.
• HRTPO Project Prioritization Tool
• HRTPO Project Prioritization: Summary of Enhancements
• HRTPO Project Prioritization: Summary of Enhancements – Additional Resource Slides
More Balanced Components (Project Utility, Economic Vitality, Project
Viability)
Added Economic Vitality to Active Transportation and ”Other” (smaller
scope) projects
Improved alignment with Federal Performance Measures
Improved alignment with SMART SCALE Measures (congestion, safety,
environmental considerations)
Incorporated Resiliency
Enhanced Accessibility and Social Equity considerations throughout
categories
Improved Intermodal/Freight, Transit, and Active Transportation
Measures
Improved “Other” category to use in RSTP scoring process (projects not
evaluated as part of the LRTP)
Modified calculation of Cost Effectiveness
SU M M A RY O F PROJ E C T PRI O RITIZ ATI O N T O O L E N H A N C E M E NT S

I N T R O D U C T I O NP R O J E C T E VA LUAT I O N A N D S C O R I N G 11 P R O J E C T P R I O R I T I Z AT I O NP R O J E C T E VA LUAT I O N A N D P R I O R I T I Z AT I O N 11
C AN D I DATE PR OJ E C T E VALUATI O N I N C O RP O R ATI O N O F S C E N AR I O P L AN N I N G
As described earlier in this report, exploratory scenario planning is being applied in the development of the 2045 LRTP. In addition to the 2045 baseline scenario, which represents “business as usual,” three Greater Growth scenarios were developed: Greater Growth on the Water, Greater Growth in Urban Areas, and Greater Growth in Suburban Areas. Each scenario narrative is designed to test different regional travel patterns as described in the figure below. Since scenario planning for the 2045 LRTP is exploratory in nature, the elements described in each scenario are not mutually exclusive and any combination of these scenarios can occur. An essential goal of this technique is not to predict the future but instead use these distinct scenario narratives to evaluate candidate projects and highlight projects strengths and weaknesses despite future uncertainty.
Growth in water-oriented
activity
Port of Virginia becomes
even more competitive
More dispersed housing
locations
Moderate assumptions
for CAV adoption and
network adaptation
Significant economic
diversification
Low space requirements per
job
Large role for “digital port”
New professionals prefer to
live/work in urban settings
High level of CV adoption
and low auto
ownership/high TNC mode
Growth is suburban/
exurban, but growth
includes walkable mixed-
use centers
Port of Virginia becomes
even more competitive
“Digital port” brings
additional jobs
Housing is more suburban
High level of AV adoption
and network adaptation
2045
GREATER
GROWTH
WATER
2045
GREATER
GROWTH
URBAN
2045
GREATER
GROWTH
SUBURBAN
Test greater cross-harbor
travel in particular
Test more urban and
multimodal travel
patterns
Test more overall regional
travel
WHAT THESE WILL HELP US TEST
For the 2045 LRTP, approximately 280 candidate projects were submitted by regional stakeholders and citizens from across the region. These projects range in scope from interstate bridges and tunnels to new bike paths and multi-use trails. For prioritization purposes, candidate projects are evaluated in separate categories: Highway, Interchange/Intersection, Bridge/Tunnel, Transit, Intermodal/Freight, and Active Transportation. Projects are separated into categories to align with potential funding sources (which are often tied to transportation mode or facility type). Because of funding constraints, as well as the differences in evaluation criteria, project scores are not compared across categories.
Prior to project evaluation, “committed” transportation projects were identified since they are not evaluated with the HRTPO Project Prioritization Tool. Committed Projects are defined as fully funded transportation projects programmed for construction in VDOT’s current Six-Year Improvement Program (SYIP) as well as the Regional Priority Projects under construction or fully funded for construction in the Hampton Roads Transportation Accountability Commission (HRTAC) six-year funding program. Committed Projects, since they are considered fully funded, are automatically included in the LRTP. See Chapter 4 for a list of the 2045 LRTP Committed Projects.
The remaining 2045 LRTP Candidate Projects were evaluated and prioritized using the HRTPO Project Prioritization Tool. Evaluating projects with the Tool requires substantial data and stakeholder input. A description of the calculations used to evaluate candidate projects can be found in Appendix A.
2045 LR TP S C E N A RI O N A RR ATIV E S

P R O J E C T P R I O R I T I Z AT I O NP R O J E C T E VA LUAT I O N A N D P R I O R I T I Z AT I O N 12
HRTPO 2045 Proposed
1,250
1,000
750
500
250
0
8 1 K
8 1 K
8 1 K
1 , 0 2 7 K 1 , 0 2 7 K
HRTPO 2015 EMPLOYMENT
BASELINE JOBS ADDED BY 2045
GREATER GROWTH SCENARIOS
+ 8 % I N C R E A S E 2 0 1 5 - 2 0 4 5 + 1 6 %
2045 G RE ATE R G ROW TH S C E N A RI0 E M PLOYM E NT C O NTRO L T O TA L S
To evaluate the candidate projects incorporating scenario planning, land use data for each Greater Growth scenario had to be developed. Using the regional scenario planning framework of existing and future place types, scenario drivers, and control totals for additional growth for the alternate scenarios, baseline population and employment data were modified to align with the Greater Growth scenario narratives.
As shown in the figure to the right, an additional 8% in employment was added to the Greater Growth scenarios. This increase in jobs also produced an associated increase in population for each of the Greater Growth scenarios. Using scenario dependent suitability and capacity factors, this additional growth was allocated across the region using the CommunityViz land use model. Outputs from the land use model were then plugged into the regional travel demand model (a planning tool used to forecast traffic and travel behavior). Assumptions regarding economic drivers (e.g. freight/port expansion and the military) and travel behavior (e.g. the use of connected and autonomous vehicles) were also specified for each scenario in the regional travel demand model. These scenario specific data inputs and assumptions resulted in varying travel behavior and traffic forecasts that were then used as inputs to the Project Prioritization Tool.

I N T R O D U C T I O NP R O J E C T E VA LUAT I O N A N D S C O R I N G 13
In addition to the land use and travel scenario dependent measures, flooding vulnerability scenarios were also explored. As part of a pilot project with Volpe, a Resilience and Disaster Recovery (RDR) tool is being developed that will enable users to incorporate the costs and benefits of resilience into the project prioritization process. The RDR is designed to address a variety of hazards, quickly assessing and comparing hundreds of scenarios covering various external factors (e.g. patterns of growth, sea level rise, frequency/severity of flooding inundation events). The RDR is still currently being refined, but upon completion, it will be another valuable tool to aid regional decision makers in selecting projects that are both robust and resilient.
MODELING
THE
SCENARIOS
PROJECT PRIORITIZATION
TOOL
TRAVEL
DEMAND
MODEL
LAND USE
MODEL
ECONOMIC
MODEL
ECONOMIC
VITALITY
PROJECT
VIABILITY
LAND USE
INDICATORS
TRANSPORTATION
INDICATORS
ECONOMIC
INDICATORS
PROJECT
UTILITY
HIGH
LOW
CRITICALITY
VULNERABILITY
P R O J E C T P R I O R I T I Z AT I O NP R O J E C T E VA LUAT I O N A N D P R I O R I T I Z AT I O N 13

P R O J E C T P R I O R I T I Z AT I O NP R O J E C T E VA LUAT I O N A N D P R I O R I T I Z AT I O N 14
To ensure that the best available data was used in the evaluation and prioritization of candidate projects, data inputs were reviewed by the LRTP Subcommittee at key points in the process.
During the months of November and December 2020, draft Project Prioritization scores were provided for review and comment to the Committees/Subcommittees listed in the figure below.
In addition to the technical stakeholder review, between December 2 - 16, 2020, the public was also provided an opportunity to learn more about the HRTPO Project Prioritization process as well as review and comment on draft scores.
RE VI E W O F DATA I N PU T S AN D D R AF T S C O RE S
LRTP SUBCOMMITTEE
HRTPO ADVISORY
COMMITTEES
Transportation Technical Advisory
Committee (TTAC)
Freight Transportation Advisory
Committee (FTAC)
Community Advisory Committee
(CAC)
HRTPO BOARD
PUBLIC
OTHER HRTPO
COMMITTEES/GROUPS
Active Transportation
Subcommittee (ATS)
Regional Transit Coordination
Working Group
The next step in the long-range transportation planning process is the development of a financial plan. Using the Project Prioritization Scores as well as the analysis from the Title VI and Environmental Justice Methodology, top-ranking projects will be selected for inclusion in the 2045 LRTP based on available funding. These top-ranking projects can include new or widened roadways, new or expanded transit services, intermodal projects to enhance the movement of freight, or new regional bicycle/pedestrian trails. The final 2045 LRTP list of projects will help to achieve the overall vision of the 2045 LRTP to use innovative planning techniques to advance an adaptive transportation system that seamlessly integrates transportation modes for all users while improving quality of life and preserving the unique character of Hampton Roads.
N E X T S TE P S I N D E VE LO P I N G TH E 2045 LR TP
SCENARIO MODELING TOOLS
Land Use Model Travel Demand Model
Economic Model Volpe RDR
PROJECT EVALUATION AND
RANKING ACROSS SCENARIOS
Other Performance Measures
Project Prioritization Tool
FISCAL-CONSTRAINT APPLIED
TO MOST ROBUST PROJECTS
Project Costs
Long-Range Transportation Revenue
S TA K E H O LD E R RE V IE W LR TP S C E N A RI O PL A N NIN G T O O L S

I N T R O D U C T I O NP R O J E C T E VA LUAT I O N A N D S C O R I N G 15 C O M M I T T E D P R O J E C T SP R O J E C T E VA LUAT I O N A N D P R I O R I T I Z AT I O N 15
C HAP T E R 4 : 2 0 4 5 L RT P C O M M I T T E D P R O J E C T S
4
Committed Projects are defined as fully funded transportation projects programmed for construction in VDOT’s current Six-Year Improvement Program (SYIP) as well as the Regional Priority Projects under construction or fully funded for construction in the Hampton Roads Transportation Accountability Commission (HRTAC) six-year funding program. Committed Projects, since they are considered fully funded, are automatically included in the LRTP.

C O M M I T T E D P R O J E C T SP R O J E C T E VA LUAT I O N A N D P R I O R I T I Z AT I O N 16
2045 LR TP C O M M IT TE D PROJ E C T S RE G I O N A L PRI O RIT Y (HR TAC) PROJ E C T S
HAMPTON ROADS COMMITTED REGIONAL
PRIORITY PROJECTS
Note: Project alignment is not set until final design is complete.
Hampton Roads Study Area
.
GLOUCESTERCOUNTY
ISLE OF WIGHTCOUNTY
POQUOSON
HAMPTON
NEWPORT NEWS
YORKCOUNTY
JAMES CITYCOUNTY
WILLIAMSBURG
SUFFOLK
CHESAPEAKE
VIRGINIA BEACH
NORFOLK
PORTSMOUTH
SOUTHAMPTONCOUNTY
FRANKLIN
ATLANTIC O
CEAN
J ames River
Chesapeake Bay
Hampton RoadsBridge-Tunnel
Monitor-MerrimacMemorial Bridge-Tunnel
64
64
17
199
64664
564
58
17
17
13
164
464
264460
664
58
258
17
168
64
I - 6 4 P E N I N S U L A W I D E N I N G : S E G M E N T 3• E s t i m a t e d P r o j e c t C o s t : $ 24 4 M i l l i o n• U n d e r C o n s t r u c t i o n• E s t i m a t e d C o m p le t i o n : 2021 • $ 121 M i l l i o n Fe d e r a l/S t a t e Fu n d s• $ 12 3 M i l l i o n HR TAC
I - 6 4 H A M P T O N R OA D S B R I D G E -T U N N E LW I D E N I N G• E s t i m a t e d P r o j e c t C o s t : $ 3 . 8 6 B i l l i o n• U n d e r C o n s t r u c t i o n• E s t i m a t e d C o m p le t i o n : 202 5 • $ 20 0 M i l l i o n Fe d e r a l/S t a t e Fu n d s • $ 10 8 M i l l i o n Fe d e r a l/S t a t e Fu n d s (fo r S o u t h
Tr e s t le s)• $ 3 . 55 B i l l i o n HR TAC
I - 6 4 S O U T H S I D E W I D E N I N G I N C LU D I N GH I G H R I S E B R I D G E• P h a s e 1 – U n d e r C o n s t r u c t i o n : $ 527 M i l l i o n• E s t i m a t e d C o m p le t i o n : 2021 • $ 95 M i l l i o n Fe d e r a l/S t a t e Fu n d s• $ 4 32 M i l l i o n HR TAC
I - 6 4/I -26 4 I N T E R C H A N G E• P h a s e 1: $ 15 7 M i l l i o n• O p e n e d t o Tr af f i c S e p t e m b e r 20 19 • P h a s e 2 – U n d e r C o n s t r u c t i o n : $ 195 M i l l i o n• E s t i m a t e d C o m p le t i o n : 2021 • P h a s e 3 - D e s i g n Fu n d e d : $ 10 M i l l i o n• $ 69 M i l l i o n Fe d e r a l/S t a t e Fu n d s• $ 3 M i l l i o n L o c a l • $ 29 0 M i l l i o n HR TAC

C O M M I T T E D P R O J E C T SP R O J E C T E VA LUAT I O N A N D P R I O R I T I Z AT I O N 17
2045 LR TP C O M M IT TE D PROJ E C T S
Note: Project alignment is not set until final design is complete.
Hampton Roads Study Area
Committed Projects
GLOUCESTERCOUNTY
ISLE OF WIGHTCOUNTY
POQUOSON
HAMPTON
NEWPORT NEWS
YORKCOUNTY
JAMES CITYCOUNTY
WILLIAMSBURG
SUFFOLK
CHESAPEAKE
VIRGINIA BEACH
NORFOLK
PORTSMOUTH
SOUTHAMPTONCOUNTY
FRANKLIN
ATLANTIC O
CEAN
James RiverChesapeake
Bay
Monitor-MerrimacMemorial Bridge-Tunnel
Hampton RoadsBridge-Tunnel
64
64
17
199
64664
564
58
17
17
13
164
464
264460
664
58
258
17168

C O M M I T T E D P R O J E C T SP R O J E C T E VA LUAT I O N A N D P R I O R I T I Z AT I O N 18
2045 LR TP C O M M IT TE D PROJ E C T S
2045 PROJECT
IDUPC PROJECT NAME FROM TO JURISDICTION PROJECT DESCRIPTION
EXISTING LANES
PROPOSED LANES
COMMITTED STATUS
2045-1 T15554 Chesapeake Bay Bridge-Tunnel Parallel Thimble Shoal Tunnel 1
Virginia Beach Northampton County Multi-jurisdictionalConstruct a new 2-lane tunnel across Thimble Shoal Channel
2 4Project under construction
2045-2 115008 I-64 Widening Including Hampton Roads Bridge-Tunnel
I-664 (Hampton Coliseum) I-564 Multi-jurisdictionalWidening to 6 lanes (1 full-time HOT, 1 part-time HOT shoulder)
4/6 6/8Advertised for construction
2045-7 106692 I-64 Southside Widening Including High Rise Bridge - Phase I
I-464 I-664 Multi-jurisdictionalWidening to 6 lanes (1 full-time HOT, 1 part-time HOT shoulder)
4 6/8Project under construction
2045-5 108665 22nd St Bridge Liberty St Wilson Rd Chesapeake Bridge replacement and re-alignment 4 2Project under construction
2045-6 109382Deep Crk AIW Bridge Replacement and G.W. Hwy/Moses Grandy Trail Intersection Improvements
Mill Creek Pkwy Diamond Ave ChesapeakeBridge replacement with additional improvements to approaching roadyways
2 5Committed for
2045 LRTP
2045-8 111002111032
Triple Decker Bridge (Interchange of US 13, US 460, and Norfolk Southern Rail Line)
N/A N/A Chesapeake Bridge rehabilitation N/A N/ACommitted (fully funded in SYIP)
2045-17 93077 Denbigh Blvd Bridge Replacement Richneck Rd Trailblazer Blvd Newport News Build replacement 4 4Project under construction
2045-21 102715 Churchland Bridge N/A N/A Portsmouth Build replacement 4 4Advertised for construction
2045-27 12546 Laskin Road Bridge Replacement Laskin Rd Laskin Rd Virginia Beach Build replacement with additional capacity 4 6Project under construction
2045-28 Sandbridge Rd Bridge Replacement N/A N/A Virginia Beach Build replacement 2 2Project under construction
2045-41 106689 I-64 Peninsula Widening Segment 31.05 miles west of Humelsine Pkwy/ Marquis Ctr Pkwy
1.15 miles west of Route 199, Lightfoot (Exit 234)
Multi-jurisdictional Widening to 6 lanes 4 6Project under construction
2045-105 I-64 Express Lanes - Segment 2 I-264 I-464 Multi-jurisdictional Conversion of HOV to HOT 2 2Pending
Amendment
2045-3 13427 97715
Wythe Creek Rd Alphus St Commander Shepard Blvd Multi-jurisdictional Widening 2 3Committed for
2045 LRTP
2045-11 108731 Coliseum Dr Extension A Hampton Roads Center Pkwy Butler Farm Rd Hampton New facility 0 4Committed for
2045 LRTP
2045-12 109314 Nike Park Road Extension Reynolds Dr US 17 Isle of Wight County New facility/roadway extention 0 2Committed for
2045 LRTP
2045-14 100920 Croaker Rd Richmond Rd (US 60) Rochambeau Rd James City County Widening 2 4Committed for
2045 LRTP
2045-15 100921 Longhill Rd (Phase 1) Humelsine Pkwy (Rte 199) Old Town Rd James City County Widening 2 4Project under construction
2045-16 100200 Skiffes Creek Connector Green Mount Pkwy Merrimac Trail (Rte 143) James City County New facility 0 4Committed for
2045 LRTP
2045 LRTP COMMITTED PROJECTS
BRIDGE/TUNNEL
HIGHWAY

C O M M I T T E D P R O J E C T SP R O J E C T E VA LUAT I O N A N D P R I O R I T I Z AT I O N 19
2045 LR TP C O M M IT TE D PROJ E C T S
2045 PROJECT
IDUPC PROJECT NAME FROM TO JURISDICTION PROJECT DESCRIPTION
EXISTING LANES
PROPOSED LANES
COMMITTED STATUS
2045 LRTP COMMITTED PROJECTS
2045-18 4483 Atkinson Blvd Jefferson Ave Warwick Blvd Newport News New facility 0 4Project under construction
2045-19 108725 Independence Blvd Denbigh Blvd (Rte 173) Fort Eustis Blvd Newport News New facility 0 4Committed for
2045 LRTP
2045-22 100937 Route 58 (Holland Rd) Suffolk Bypass 0.7 mi W. of Manning Bridge Rd
Suffolk Widening 4 6Project under construction
2045-222 Ferrell Pkwy Indian Lakes Blvd Indian River Rd Virginia Beach Widening 4 6Committed for
2045 LRTP
2045-240 Landstown Rd - Phase I Landstown Centre Way Landstown Rd Virginia Beach Widening 2 4Committed for
2045 LRTP
2045-259 Rosemont Road - Phase V Dam Neck Rd Lynnhaven Pkwy Virginia Beach Widening 2 4Committed for
2045 LRTP
2045-29 109381 Centerville Tnpk - Phase III Chesapeake CL Kempsville Rd Virginia Beach Widening 2 4Committed for
2045 LRTP
2045-30 103005 Centerville Turnpike Indian River Rd Kempsville Rd Virginia Beach Widening 2 6Project under construction
2045-31 Cleveland Street - Phase III Witchduck Road Clearfield Ave Virginia Beach Widening 2 4Committed for
2045 LRTP
2045-32 110803 Cleveland Street - Phase IV Witchduck Road Independence Blvd Virginia Beach Widening 2/4 4Committed for
2045 LRTP
2045-33 112318 Elbow Rd / Dam Neck Rd Indian River Rd Virginia Beach Amphitheater Virginia Beach Widening 2 4Committed for
2045 LRTP
2045-34 15829 Indian River Road - Phase VII-A Lynnhaven Pkwy Elbow Rd Virginia Beach Widening 2 4Committed for
2045 LRTP
2045-35 111711 Laskin Road - Phase IA Republic Rd Fremac Dr Virginia Beach Widening 4 8Project under construction
2045-36 107352 Princess Anne Rd - Phase VII Fisher Arch General Booth Blvd Virginia Beach Widening 2 4Project under construction
2045-264 Monticello Ave Richmond Rd (US 60) Treyburn Dr Williamsburg Widening 3 5Committed for
2045 LRTP
2045-37 112658 Capitol Landing Rd Corridor Improvements Bypass Rd Merrimac Trail Williamsburg Widening 4 2Committed (fully funded in SYIP)
2045-38 89062 Ironbound Rd (Rte 615) Richmond Rd (US 60)DePue Dr (formerly Longhill Connector)
Williamsburg Widening, including multi-use path 2 3Committed (fully funded in SYIP)
2045-39 115339 Lafayette St Richmond Rd (US 60) Virginia Ave WilliamsburgWidening, including shared-use path for bicycle accommodation on east side
2 2Committed for
2045 LRTP
2045-40 G.W. Mem Hwy (US 17) Wolf Trap Rd Old York-Hampton Hwy York County Widening 4 6Committed for
2045 LRTP

C O M M I T T E D P R O J E C T SP R O J E C T E VA LUAT I O N A N D P R I O R I T I Z AT I O N 20
2045 LR TP C O M M IT TE D PROJ E C T S
2045 PROJECT
IDUPC PROJECT NAME FROM TO JURISDICTION PROJECT DESCRIPTION
EXISTING LANES
PROPOSED LANES
COMMITTED STATUS
2045 LRTP COMMITTED PROJECTS
2045-42 Victory Blvd (Rte 171) G.W. Mem Hwy (US 17) Hampton Hwy (Rte 134) York County Widening 5 6Committed for
2045 LRTP
2045-4 I-64/I-264 Interchange - Phase II N/A N/A Multi-jurisdictionalInterchange improvements Newtown Rd to Witchduck Rd, eliminating weave and adding Greenwich Rd/Cleveland St flyover
5 6Committed for
2045 LRTP
2045-9 Mt. Pleasant Rd/Great Bridge Bypass N/A N/A ChesapeakeInterchange improvements 168 NB and EB and WB clover-leaf ramps on Mt. Pleasant Rd
5 6Committed for
2045 LRTP
2045-10 Freeman Ave Railroad Overpass N/A N/A Chesapeake Grade separation between roadway and railroad 2 2Committed for
2045 LRTP
2045-24 110634 Nansemond Pkwy (Rte 337) N/A N/A Suffolk Highway-rail grade separation N/A N/ACommitted (fully funded in SYIP)
2045-13 102980 Pocahontas Trail ReconstructionJames City County Fire Station #2
James River Elementary School
James City County5' sidewalk and 5' paved shoulder with pedestrian lighting and bus pull-offs
N/A N/ACommitted for
2045 LRTP
2045-20 102985 Westhaven Bicycle Improvements Clifford St at Powhatan Ave Bart St at Airline Blvd Portsmouth Shared use path N/A N/ACommitted for
2045 LRTP
2045-25 113196 Sandbridge Road - Nimmo VII-A Sandpiper Rd1.10 miles west of Sandpiper Rd
Virginia BeachOn-road bike lanes and shared used path on one side of the roadway
2 2Committed (fully funded in SYIP)
2045-26 113469 Violet Bank Dr Bike Trail Kittery Dr Selwood Dr Virginia Beach New faciilty - Shared Use Path N/A N/ACommitted for
2045 LRTP
Updated 10/29/20 Updated 10/29/20
ACTIVE TRANSPORTATION
INTERCHANGE
INTERMODAL/FREIGHT

I N T R O D U C T I O NP R O J E C T E VA LUAT I O N A N D S C O R I N G 21 P R O J E C T P R I O R I T I Z AT I O N S C O R E SP R O J E C T E VA LUAT I O N A N D P R I O R I T I Z AT I O N 21
C HAP T E R 5 : 2 0 4 5 L RT P P R O J E C T P R I O R I T I Z AT I O N S C O R E S
5
The following section contains maps and summary tables of Project Prioritization scores for the 2045 LRTP Candidate Projects. Projects are ranked by category and by system, based on Total Score (incorporating scenario variability). Top scores in each component (Project Utility, Economic Vitality, Project Viability) are also highlighted. Top-ranking candidate projects in each project category (by system) are also noted.

P R O J E C T P R I O R I T I Z AT I O N S C O R E SP R O J E C T E VA LUAT I O N A N D P R I O R I T I Z AT I O N 22
2045 LR TP C A ND IDATE PROJ E C T S B RID G E S A ND T U NNE L S2045
PROJECT ID
PROJECT NAME FROM TO JURISDICTION PROJECT DESCRIPTION EXISTING LANES
PROPOSED LANES
PROJECT UTILITY TOTAL
ECONOMIC VITALITY
TOTAL
PROJECT VIABILITY
TOTAL
TOTAL SCORE
2045-402 I-664/MMMBTBowers Hill Interchange
Hampton Coliseum Multi-jurisdictionalWidening (extension of the Hampton Roads Express Lanes network)
4 6/8 78 88 40 206
2045-401I-564/I-664 Connector and VA-164 Connector
I-564/MMMBT VA-164 Multi-jurisdictional New facility 0 4 70 86 33 189
2045-406I-64 Southside Widening Including High Rise Bridge Phase II
I-464 I-664 Multi-jurisdictional Widening 6 8 78 61 49 188
2045-403 I-664/MMMBT Terminal Ave College Dr Multi-jurisdictionalWidening (extension of the Hampton Roads Express Lanes network)
4 6/8 66 79 38 183
2045-409 Mills Godwin Bridge Quail Hollow Waterview Rd Suffolk Widening 2 4 37 51 30 118
2045-404 Upper James River BridgeJames City County/ Lower Peninsula
Surry County/Southside
Multi-jurisdictionalNew facility with walkable/bikeable options
0 4 55 44 16 115
2045-405 Sidney Bertram Hazelwood Sr. Bridge N/A N/A Multi-jurisdictional Widening 2 4 37 21 32 90
2045-408 Kings Hwy Bridge Godwin Blvd (Rte 10) Kings Hwy SuffolkNew facility (replacing previously closed facility)
0 2 33 30 30 93
IINNTTEERRSSTTAATTEE
PPRRIIMMAARRYY
UURRBBAANN

T O P P R I O R I T I Z E D P R O J E C T S C O R E SP R O J E C T E VA LUAT I O N A N D S C O R I N G 23
T O P PRI O RITIZ E D B RID G E A ND T U NNE L C A ND IDATE PROJ E C T (INTE RS TATE) 2045 - 402: I - 664/M M M B T
Esri, HERE, Garmin, © OpenStreetMap contributors, and the GIS user community
PROJECT DETAILS
PROJECT DESCRIPTIONProposed widening from four up to eight lanes to include the Hampton Roads Express Lanes Network
From Bowers Hill Interchange to Hampton Coliseum
PROJECT CATEGORY/SYSTEM: Bridge & Tunnel - Interstate
PRIORITIZATION SCORE
PROJECT
UTILITY TOTAL
ECONOMIC
VITALITY
TOTAL
PROJECT
VIABILITY
TOTAL
TOTAL SCORE
78 88 40 206
ESTIMATED COST
$4,538 Million
$8,195 Million
CURRENT YEAR
YEAR OF EXPENDITURE
P R O J E C T P R I O R I T I Z AT I O N S C O R E SP R O J E C T E VA LUAT I O N A N D P R I O R I T I Z AT I O N 23
664
64
64
BENEFITS:• Adds capacity across the Hampton Roads Harbor
and improves the movement of people and goods from the Peninsula to the Southside
• Improves regional congestion, travel time, and reliability
• Improves strategic military connectivity• Increases regional accessibility, including to high
density employment, major population, and economic distress areas
• Improves transit access across the Hampton Roads Harbor
• Improves safety and provides enhanced evacuation route for the region
• Project will have a positive impact on the region’s economy and will help meet growing needs of the Port

T O P P R I O R I T I Z E D P R O J E C T S C O R E SP R O J E C T E VA LUAT I O N A N D S C O R I N G 24
T O P PRI O RITIZ E D B RID G E A ND T U NNE L C A ND IDATE PROJ E C T (PRIM A RY )2045 - 409: M ILL S G O DW IN B RID G E
Esri, HERE, Garmin, © OpenStreetMap contributors, and the GIS user community
PROJECT DETAILS
PROJECT DESCRIPTIONBridge widening from two to four lanes to address
congestion
PROJECT CATEGORY/SYSTEM:
Bridge & Tunnel - Primary
PRIORITIZATION SCORE
PROJECT
UTILITY TOTAL
ECONOMIC
VITALITY
TOTAL
PROJECT
VIABILITY
TOTAL
TOTAL SCORE
37 51 30 118
ESTIMATED COST
$161 Million
$230 Million
CURRENT YEAR
YEAR OF EXPENDITURE
P R O J E C T P R I O R I T I Z AT I O N S C O R E SP R O J E C T E VA LUAT I O N A N D P R I O R I T I Z AT I O N 24
17
Fr o m Q uai l Hol low to Water v iew Ro a d
BENEFITS• Adds capacity across the Nansemond River,
improving connectivity between Suffolk and Isle of Wight
• Improves regional congestion, travel time, and reliability
• Improves the movement of both people and freight
• Increases regional accessibility• Improves safety and provides enhanced
evacuation route for the region

T O P P R I O R I T I Z E D P R O J E C T S C O R E SP R O J E C T E VA LUAT I O N A N D S C O R I N G 25
T O P PRI O RITIZ E D B RID G E A ND T U NNE L C A ND IDATE PROJ E C T (U RBA N)2045 - 408: K IN G S HI G H WAY B RID G E
Esri, HERE, Garmin, © OpenStreetMap contributors, and the GIS user community
PROJECT DETAILS
PROJECT DESCRIPTIONProvides for new alignment for Kings Highway Bridge that was previously closed due to deteriorated condition
PROJECT CATEGORY/SYSTEM:
Bridges & Tunnels - Urban
BENEFITS: • Replaces a key connection in the City of Suffolk • Improves travel time and delay for that area of
the region • Addresses an accessibility gap for that area of
the region
PRIORITIZATION SCORE
PROJECT
UTILITY TOTAL
ECONOMIC
VITALITY
TOTAL
PROJECT
VIABILITY
TOTAL
TOTAL SCORE
33 30 30 93
ESTIMATED COST
$106 Million
$151 Million
CURRENT YEAR
YEAR OF EXPENDITURE
P R O J E C T P R I O R I T I Z AT I O N S C O R E SP R O J E C T E VA LUAT I O N A N D P R I O R I T I Z AT I O N 25
Fr o m G o d w in B o ulevar d to K ing s Hw y

P R O J E C T P R I O R I T I Z AT I O N S C O R E SP R O J E C T E VA LUAT I O N A N D P R I O R I T I Z AT I O N 26
TA B LE 3: 2045 LR TP C A ND IDATE PROJ E C T S HI G H WAYHI G H WAY2045
PROJECT ID
PROJECT NAME FROM TO JURISDICTION PROJECT DESCRIPTION EXISTING LANES
PROPOSED LANES
PROJECT UTILITY TOTAL
ECONOMIC VITALITY
TOTAL
PROJECT VIABILITY
TOTAL
TOTAL SCORE
2045-110 I-664 Widening Hampton Coliseum Terminal Ave Multi-jurisdictional Widening 6 8 76 77 39 192
2045-129 Chesapeake Expressway Widening I-64 Hillcrest Pkwy Chesapeake Widening 4 6/8 76 68 31 175
2045-104 I-264 Widening Norfolk Virginia Beach Multi-jurisdictional Widening 8 10 or 12 66 77 26 169
2045-109 I-664 Widening Bowers Hill College Dr Multi-jurisdictional Widening 4/6 6 67 51 39 157
2045-160 I-64 Peninsula Widening Segment 41.15 miles west of Route 199, Lightfoot (Exit 234)
Hampton Roads MPA Boundary
Multi-jurisdictional Widening 4 6 47 62 38 147
2045-232 I-264 Preferred Alternative Independence Blvd Rosemont Rd Virginia Beach Widening 6/8 8/10 61 55 31 147
2045-119 VA-164 WideningPinners Point or APM Interchange
I-664 Multi-jurisdictional Widening 4 6 52 62 15 129
2045-210 Suffolk/ US 58 BypassTerminus west of SPSA landfill
US 460 Interchange Suffolk Widening 4 6 43 51 26 120
2045-117 US Route 460 Relocated Suffolk Bypass West of Zuni Multi-jurisdictional New 4-lane divided highway 0 4 43 61 14 118
2045-140 I-87 Chesapeake Expressway North Carolina Border ChesapeakeBring Dominion Blvd to interstate standards
4 4 41 30 16 87
2045-171J. Clyde Morris Blvd /G.W. Hwy (US 17) Widening
I-64 York CL Newport News Improve interstate access 4 6 62 47 58 167
2045-135 G.W. Hwy (US 17) Yadkin Rd Canal Dr Chesapeake Widening with pedestrian accomodations 2 4 65 42 56 163
2045-151 G.W. Mem Hwy (US 17)1 mi North of Coleman Bridge
Main St (@ Walmart) Gloucester Widening 4 6 55 56 47 158
2045-122 Battlefield Blvd Johnstown Rd I-64 Chesapeake Widening 4/6 6/8 68 54 35 157
2045-145 Military Hwy Campostella Rd Battlefield Blvd Chesapeake Widening 4 8 58 48 50 156
2045-246 Laskin Road - Phase III Republic Rd I-264 Virginia Beach Widening 4 6 49 51 54 154
2045-144 Military Hwy Allison Dr Virginia Beach CL Chesapeake Widening with pedestrian accomodations 4 6 52 60 38 150
2045-146 Military Hwy Virginia Beach CL I-464 Chesapeake Widening with bike/ped facilities 4 8 60 54 34 148
2045-157US 17/Carrollton Blvd (part of Route 17 corridor)
End of Chuckatuck Creek Bridge
James River Bridge Isle of Wight County Widening 4 6 57 52 34 143
2045-245 Laskin Road - Phase II Oriole Dr 30th/31st St Virginia Beach Widening 4 6 39 39 61 139
2045-244 Laskin Road - Phase IB Laskin Rd Bridge Oriole Dr Virginia Beach Widening 4 6 41 43 55 139
2045-234 Independence Blvd Pembroke Blvd Virginia Beach Blvd Virginia Beach Widening 6 8 49 60 30 139
2045-200 Elm Ave Realignment Project Victory Blvd (Rte 239) G.W. Hwy (US 17) PortsmouthWidening, including intersection improvements at Navy Gates 29 and 36
2 4 44 34 60 138
2045-266 G.W. Mem Hwy (US 17)Fort Eustis Blvd (Rte 105)
Coleman Bridge York County Widening 4 6 48 61 27 136
2045-180 Oyster Point Rd Widening Phase II Warwick Blvd Radcliff Ln Newport News Widening 4 6 56 52 28 136
2045-204 Bridge Rd (US 17) Mills Godwin Bridge Chesapeake CL Suffolk Widening 4 6 54 42 34 130
IINNTTEERRSSTTAATTEE
PPRRIIMMAARRYY

P R O J E C T P R I O R I T I Z AT I O N S C O R E SP R O J E C T E VA LUAT I O N A N D P R I O R I T I Z AT I O N 27
2045 LR TP C A ND IDATE PROJ E C T S HI G H WAY2045
PROJECT ID
PROJECT NAME FROM TO JURISDICTION PROJECT DESCRIPTION EXISTING LANES
PROPOSED LANES
PROJECT UTILITY TOTAL
ECONOMIC VITALITY
TOTAL
PROJECT VIABILITY
TOTAL
TOTAL SCORE
IINNTTEERRSSTTAATTEE2045-268
J. Clyde Morris Blvd/G.W. Mem Hwy (US 17)
Newport News CLHampton Hwy (Rte 134)
York County Widening 4 6 55 41 32 128
2045-116 US 460/58/13 Connector Bowers Hill InterchangeEastern end of Suffolk Bypass
Multi-jurisdictionalSafety improvements along corridor, including interchange at regional landfill
6 6 44 44 38 126
2045-188 Warwick Blvd Widening Phase III Bland Blvd Beechmont Dr Newport News Widening 4 6 62 52 12 126
2045-195 Little Creek Rd Tidewater Dr Shore Dr NorfolkWidening with pedestrian safety enhancements
4 6 42 49 32 123
2045-233 Independence Blvd Haygood Rd Northampton Blvd Virginia Beach Widening 4 6 45 39 39 123
2045-253 North Great Neck Virginia Beach Blvd Wolfsnare Rd Virginia Beach Widening 4 6 36 56 30 122
2045-120 Victory Blvd (Rte 171) Poquoson CLHampton Hwy (Rte 134)
Multi-jurisdictional Widening 2 4 51 23 47 121
2045-125 Cedar Rd Holt Dr Battlefield Blvd Chesapeake Widening with bike/ped facilities 2 4 48 20 50 118
2045-191 Warwick Blvd Widening Phase VI Lees Mill Dr Yorktown Rd Newport News Widening, including interchange work 2 4 56 47 11 114
2045-170 J. Clyde Morris Blvd Widening Jefferson Ave Warwick Blvd Newport News Widening, including CSX Overpass work 4 6 43 39 30 112
2045-207 Godwin Blvd Suffolk Bypass Kings Fork Rd Suffolk Widening 4 6 44 32 36 112
2045-174 Jefferson Ave Widening Phase II Industrial Park Dr Fort Eustis Blvd Newport News Widening 4 6 44 37 31 112
2045-187 Warwick Blvd Widening Phase II Oyster Point Rd Bland Blvd Newport News Widening 4 6 60 38 13 111
2045-199 Virginia Beach Blvd Glenrock Rd George St NorfolkRemove service lanes, widen with improved pedestrian accomodations
4 6 62 40 9 111
2045-179 Oyster Point Rd Widening Phase I Operations Dr Waterman Dr Newport News Widening 4 6 52 38 18 108
2045-267 G.W. Mem Hwy (US 17) Denbigh Blvd (Rte 173)Fort Eustis Blvd (Rte 105)
York County Widening 4 6 41 37 30 108
2045-118 US Route 60 Relocation James City County Line Green Mount Pkwy James City CountyNew facility (congestion relief for Route 60, enhanced access for freight movement)
0 4 35 44 29 108
2045-147 Mt Pleasant Rd, Phase 1 Chesapeake Expressway Etheridge Rd Chesapeake Widening with pedestrian accomodations 2 4 or 6 47 23 37 107
2045-196 Monticello Ave St Pauls Blvd Virginia Beach Blvd Norfolk Widening 4 6 41 47 18 106
2045-148 Mt Pleasant Rd, Phase 2 Etheridge Rd Centerville Tnpk Chesapeake Widening with bike/ped facilities 2 4 or 6 46 23 36 105
2045-181 Oyster Point Rd Widening Phase III CSX Overpass CSX Overpass Newport News Widening 4 6 51 42 12 105
2045-256 Princess Anne Road Providence Rd Salem Rd Virginia Beach Widening 4 6 37 22 44 103
2045-153 Proposed parallel facility for Route 17 TBD TBD Gloucester New facility 0 TBD 40 38 25 103
2045-121 Victory Blvd (Rte 171)Wythe Creek Rd (Rte 172)
York County CL Multi-jurisdictional Widening 2 4 42 8 51 101
2045-173 Jefferson Ave Widening Phase I Green Grove Ln Industrial Park Dr Newport News Widening 4 6 41 29 30 100
2045-156 Benns Church Blvd Turner Dr (Rte 644) Church St SIsle of Wight -
SmithfieldWidening 4 6 41 22 36 99
2045-197 Newtown Rd I-264 Virginia Beach Blvd Norfolk Widening 4 6 59 28 11 98
2045-152 G.W. Mem Hwy (US 17) Main St (@ Walmart) Ark Rd Gloucester Widening and safety improvements 4 6 40 26 31 97

P R O J E C T P R I O R I T I Z AT I O N S C O R E SP R O J E C T E VA LUAT I O N A N D P R I O R I T I Z AT I O N 28
2045 LR TP C A ND IDATE PROJ E C T S HI G H WAY2045
PROJECT ID
PROJECT NAME FROM TO JURISDICTION PROJECT DESCRIPTION EXISTING LANES
PROPOSED LANES
PROJECT UTILITY TOTAL
ECONOMIC VITALITY
TOTAL
PROJECT VIABILITY
TOTAL
TOTAL SCORE
IINNTTEERRSSTTAATTEE2045-186 Warwick Blvd Widening Phase I Nettles Dr Oyster Point Rd Newport News Widening 4 6 46 32 18 96
2045-205 Bridge Rd (US 17) Mills Godwin Bridge Isle of Wight CL Suffolk Widening 4 6 34 21 41 96
2045-198 Tidewater Dr City Hall Ave Norview Ave Norfolk Widening 4 6 47 38 10 95
2045-189 Warwick Blvd Widening Phase IV Beechmont Dr Atkinson Way Newport News Widening 4 6 49 34 10 93
2045-158 US 258 US 460 Sunset Dr Isle of Wight County Widening 2 4 39 20 30 89
2045-190 Warwick Blvd Widening Phase V Atkinson Way Lees Mill Dr Newport News Widening 4 6 47 34 8 89
2045-192 Ballentine Blvd I-264 Virginia Beach Blvd Norfolk Widening 4 6 39 22 27 88
2045-212 Whaleyville Blvd (US 13) - Phase 2 Carolina Rd (Rte 32) Village of Whaleyville SuffolkCorridor improvements to improve inter-state passenger and freight movements
2 4 19 38 29 86
2045-168 Harpersville Rd Widening Jefferson Ave Warwick Blvd Newport News Widening, including new CSX Overpass 2 4 31 20 29 80
2045-209 Nansemond Pkwy (Rte 337)Shoulder's Hill Rd (Rte 626)
Wilroy Rd (Rte 642) Suffolk Widening 2 4 27 26 27 80
2045-208 Godwin Blvd - Phase 1 Holly Hill Ln Village of Chuckatuck Suffolk Widening 2 4 32 21 27 80
2045-211 Whaleyville Blvd (US 13) - Phase 1 Village of Whaleyville North Carolina Border SuffolkCorridor improvements to improve inter-state passenger and freight movements
2 4 23 25 29 77
2045-101 Denbigh Blvd (Rte 173) Newport News CLG.W. Mem Hwy (US 17)
Multi-jurisdictional Widening 2 4 27 14 30 71
2045-167 Denbigh Blvd Widening Phase IICSX Overpass East Abuttment
Jefferson Ave Newport News Widening 4 6 34 20 16 70
2045-166 Denbigh Blvd Widening Phase I Warwick BlvdCSX Overpass West Abuttment
Newport News Widening 4 6 35 23 10 68
2045-103 Godwin Blvd - Phase 2 Village of Chuckatuck Isle of Wight CL Multi-jurisdictional Widening 2 4 19 16 4 39
2045-265 Commonwealth Dr Extension G.W. Mem Hwy (U.S. 17) Commonwealth Dr York County New facility/roadway extension 0 4 42 23 44 109
2045-111 Mooretown Rd Extension Lightfoot Rd Croaker Rd Multi-jurisdictional New facility/roadway extension 0 4 39 40 27 106
2045-161 Longhill Rd (Phase 2) Olde Towne Rd Warhill Trail James City County Widening 2 4 30 23 30 83
2045-202 Battery Park Rd S. Church St Nike Park RdIsle of Wight -
SmithfieldWidening 2 4 29 14 31 74
2045-162 Longhill Rd (Phase 3) Warhill Trail Centerville Rd James City County Widening 2 4 29 11 30 70
2045-114 Greenbelt Segment - Phase I London Bridge Rd Princess Anne Rd. Virginia BeachNew alignment to relieve congestion, provide new access
0 4 76 54 42 172
2045-235 Indian River Rd Centerville Tnpk Ferrell Pkwy Virginia Beach Widening 6 8 51 60 40 151
2045-236 Indian River Rd Centerville Tnpk I-64 Virginia Beach Widening 8 10 50 57 41 148
2045-114A Greenbelt - Phase II Princess Anne Rd Chesapeake CL Virginia BeachNew alignment to relieve congestion, provide new access
0 4 62 44 38 144
2045-219 Dam Neck Road - Phase III Drakesmile Rd London Bridge Rd Virginia Beach Widening 4 6 51 51 40 142
SSEECCOONNDDAARRYY
UURRBBAANN

P R O J E C T P R I O R I T I Z AT I O N S C O R E SP R O J E C T E VA LUAT I O N A N D P R I O R I T I Z AT I O N 29
2045 LR TP C A ND IDATE PROJ E C T S HI G H WAY2045
PROJECT ID
PROJECT NAME FROM TO JURISDICTION PROJECT DESCRIPTION EXISTING LANES
PROPOSED LANES
PROJECT UTILITY TOTAL
ECONOMIC VITALITY
TOTAL
PROJECT VIABILITY
TOTAL
TOTAL SCORE
IINNTTEERRSSTTAATTEE2045-218 Dam Neck Road - Phase II Holland Rd Drakesmile Rd Virginia Beach Widening 4 6 57 42 42 141
2045-220 Drakesmile Extended - Phase I Dam Neck Rd Holland Rd Virginia Beach New facility 0 4 55 30 50 135
2045-137 Greenbrier Pkwy Volvo Pkwy Woodlake Dr Chesapeake Widening 6 8 59 42 33 134
2045-227 General Booth Blvd - Phase II Oceana Blvd Dam Neck Rd Virginia Beach Widening 6 8 45 44 43 132
2045-258 Rosemont Rd Virginia Beach Blvd Holland Rd Virginia Beach Widening 4 6 51 35 43 129
2045-262 Shore Drive - Phase II Pleasure House Road Treasure Island Drive Virginia Beach Widening 4 6 40 42 46 128
2045-126 Centerville Tnpk Mount Pleasant Rd Virginia Beach CL Chesapeake Widening 2 6 67 29 31 127
2045-127 Centerville Tnpk - Phase 1 Mt Pleasant Rd Elbow Rd ChesapeakeWidening with bike/ped facilities, including replacement of existing bridge
2 6 70 26 29 125
2045-230 Holland Rd - Phase III Rosemont Rd Independence Blvd Virginia Beach Widening 4 6 63 22 38 123
2045-217 Dam Neck Road - Phase I Princess Anne Rd Holland Rd Virginia Beach Widening 4 6 43 38 41 122
2045-176 Lucas Creek Rd Extension Denbigh Blvd (Rte 173) Atkinson Blvd Newport NewsNew facility/roadway extension, including bridge
0 4 46 36 35 117
2045-150 Volvo Pkwy Widening Battlefield Blvd Greenbrier Pkwy Chesapeake Widening with bike/ped facilities 4 6 47 25 42 114
2045-225 First Colonial Rd Old Donation Pkwy Laskin Rd Virginia Beach Widening 4 6 44 31 39 114
2045-221 Drakesmile Extended - Phase II Holland Rd Princess Anne Rd Virginia Beach New facility 0 4 44 19 50 113
2045-149 Volvo Pkwy Extended Volvo Pkwy Medical Pkwy ChesapeakeNew facility/roadway extension with bike/ped facilities
0 4 45 27 41 113
2045-248 Lynnhaven Pkwy Holland Rd Princess Anne Rd Virginia Beach Widening 4 6 50 25 38 113
2045-112 Newtown Road Baker Rd Virginia Beach Blvd Multi-jurisdictional Widening 4 6 51 39 23 113
2045-175 Liberty Pkwy Extension Oyster Point Rd Freedom Way Newport News New facility 0 2 23 32 56 111
2045-215 Birdneck Road I-264 Virginia Beach Blvd Virginia Beach Widening 4 6 34 29 46 109
2045-229 General Booth Blvd Phase IV London Bridge Rd Nimmo Pkwy Virginia Beach Widening 4 6 45 21 43 109
2045-141 Johnstown Rd - Phase 1 Battlefield Blvd Parker Rd Chesapeake Widening with bike/ped facilities 2 4 38 20 47 105
2045-223 Ferrell Pkwy Indian Lakes Blvd Pleasant Valley Rd Virginia Beach Widening 4 6 32 34 39 105
2045-128 Centerville Tnpk - Phase 2 Elbow Rd Virginia Beach CL Chesapeake Widening with bike/ped facilities 2 4 42 26 35 103
2045-201 Harper Ave Rte 164/US 58Portsmouth Marine Terminal
Portsmouth Widening 2 3 or 4 35 28 39 102
2045-254 North Lynnhaven Rd Virginia Beach Blvd Lynnhaven Pkwy Virginia Beach Widening 2 4 37 31 34 102
2045-143 Johnstown Rd - Phase 3 Hanbury Rd Waters Rd Chesapeake Widening with bike/ped facilities 2 4 32 23 47 102
2045-224 Ferrell Pkwy Pleasant Valley Rd Salem Rd Virginia Beach Widening 4 6 35 38 28 101
2045-247 London Bridge Road Dam Neck Rd Shipps Corner Rd Virginia Beach Widening 2 4 34 29 37 100

P R O J E C T P R I O R I T I Z AT I O N S C O R E SP R O J E C T E VA LUAT I O N A N D P R I O R I T I Z AT I O N 30
2045 LR TP C A ND IDATE PROJ E C T S HI G H WAY2045
PROJECT ID
PROJECT NAME FROM TO JURISDICTION PROJECT DESCRIPTION EXISTING LANES
PROPOSED LANES
PROJECT UTILITY TOTAL
ECONOMIC VITALITY
TOTAL
PROJECT VIABILITY
TOTAL
TOTAL SCORE
IINNTTEERRSSTTAATTEE2045-142 Johnstown Rd - Phase 2 Parker Rd Hanbury Rd Chesapeake Widening with bike/ped facilities 2 4 35 17 47 99
2045-231 Holland Road Dam Neck Rd Rosemont Rd Virginia Beach Widening 4 6 41 21 36 98
2045-239 Jeanne St Constitution Dr Independence Blvd Virginia Beach Widening 3 4 30 22 44 96
2045-154 Coliseum Dr Extension B Butler Farm RdN. Campus Pkwy/ Magruder Blvd
Hampton New Facility 0 4 41 16 39 96
2045-131 Eden Way Extended Eden Way North Sam's Circle ChesapeakeNew facility/roadway extension with bike/ped facilities
0 4 28 30 36 94
2045-226 First Colonial Rd Old Donation Pkwy Great Neck Rd Virginia Beach Widening 4 6 41 23 30 94
2045-134Elbow Rd - Phase 2 East - existing alignment
Butts Station Rd Centerville Rd Chesapeake Widening with bike/ped facilities 2 4 27 20 46 93
2045-136 Green Tree Rd Extension Kempsville Rd Clearfield Ave ChesapeakeNew facility/roadway extension with bike/ped facilities
0 4 18 31 43 92
2045-124 Bruce Rd Tyre Neck Rd Taylor Rd Chesapeake Widening with bike/ped facilities 2 4 31 23 37 91
2045-252 Nimmo Pkwy - Phase VIIB Albuquerque RdSandbridge Rd - Nimmo VIIA
Virginia Beach New Facility 0 2 27 24 39 90
2045-216 Clearfield Ave Virginia Beach Blvd Cleveland St Virginia Beach Widening 2 4 26 31 32 89
2045-257 Providence Road Kempsville Rd Princess Anne Rd Virginia Beach Widening 2 4 33 20 35 88
2045-138 Hanbury Rd Johnstown Rd Battlefield Blvd Chesapeake Widening with bike/ped facilities 2 4 36 17 35 88
2045-228 General Booth Blvd - Phase I Birdneck Rd Oceana Blvd Virginia Beach Widening 4 6 26 32 26 84
2045-132 Elbow Rd Butts Station Rd Virginia Beach CL ChesapeakeWidening with additional safety improvements
2 4 34 23 27 84
2045-213 Wilroy Rd (Rte 642)Nansemond Pkwy (Rte 337)
Constance Rd Suffolk Widening 2 4 24 29 30 83
2045-133Elbow Rd - Phase 1 West - existing alignment
Centerville Tnpk Virginia Beach CL Chesapeake Widening with bike/ped facilities 2 4 28 23 31 82
2045-251 Nimmo Pkwy - Phase III Landstown Rd Extended Salem Rd Virginia Beach New Facility 0 2 28 16 36 80
2045-169 Harpersville Rd Widening J Clyde Morris Blvd Saunders Rd Newport News Widening 2 4 44 11 25 80
2045-261 Salem Road Independence Blvd Elbow Rd Virginia Beach Widening 2 4 22 17 39 78
2045-23 Shoulders Hill Rd (Rte 626)Nansemond Pkwy (Rte 337)
Bridge Rd (US 17) Suffolk Widening 2 4 27 20 29 76
2045-165 Chestnut Ave I-664 Briarfield Rd Newport News Widening 2 4 34 20 22 76
2045-243 Landstown Rd Extended - Phase IV North Landing Rd Indian River Rd Virginia Beach Widening from 2 lanes to 4 lanes. 0 4 24 22 30 76
2045-260 Salem Road - Phase II Elbow Rd North Landing Rd Virginia Beach Widening 2 4 24 17 34 75
2045-182 Patrick Henry Dr Widening Bland Blvd Turnberry Blvd Newport News Widening 2 4 19 29 27 75
2045-250 Nimmo Pkwy - Phase II West Neck RdLandstown Rd Extended
Virginia Beach New Facility 0 2 19 16 39 74
2045-242 Landstown Rd Extended - Phase III Nimmo Pkwy North Landing Rd Virginia Beach Widening from 2 lanes to 4 lanes. 0 4 20 22 32 74
2045-238 Indian River Road Elbow Rd North Landing Rd Virginia Beach Widening 2 4 32 17 24 73

P R O J E C T P R I O R I T I Z AT I O N S C O R E SP R O J E C T E VA LUAT I O N A N D P R I O R I T I Z AT I O N 31
2045 LR TP C A ND IDATE PROJ E C T S HI G H WAY2045
PROJECT ID
PROJECT NAME FROM TO JURISDICTION PROJECT DESCRIPTION EXISTING LANES
PROPOSED LANES
PROJECT UTILITY TOTAL
ECONOMIC VITALITY
TOTAL
PROJECT VIABILITY
TOTAL
TOTAL SCORE
IINNTTEERRSSTTAATTEE2045-214 Wilroy Rd (Rte 642) Suffolk Bypass Nansemond Pkwy Suffolk Widening 2 4 24 14 32 70
2045-237 Indian River Rd West Neck Rd North Landing Rd Virginia Beach Widening 2 4 34 11 24 69
2045-263 West Neck Rd North Landing Rd Indian River Rd Virginia Beach Widening 2 4 23 22 24 69
2045-163 Bland Blvd Widening Jefferson Ave Warwick Blvd Newport NewsWidening, including the I-64 and CSX overpass
4 6 42 18 8 68
2045-164 Briarfield Rd Jefferson Ave Hampton CL Newport News Widening 2 4 28 17 21 66
2045-130Chesapeake Regional Airport Access Rd
West Rd G.W. Hwy (US 17) Chesapeake New Facility 0 4 12 25 29 66
2045-183 Saunders Rd Widening Harpersville Rd Hampton CL Newport News Widening 2 4 18 29 19 66
2045-123 Ballahack Rd G.W. Hwy (US 17) Old Battlefield Blvd Chesapeake Widening 2 4 19 20 26 65
2045-206 Corridor Improvements - Suffolk Northern SuffolkCentral/ Downtown Suffolk
SuffolkNew facility connecting Northern Suffolk to central/downtown Suffolk
0 4 27 10 27 64
2045-269 Harpersville Rd Widening Saunders RdHampton Roads Center Pkwy
Newport News Widening, including I-64 overpass work 2 4 22 29 7 58
2045-241 Landstown Rd Extended - Phase II Landstown Road Nimmo Pkwy Virginia Beach New facility/roadway extension 0 4 12 16 27 55
2045-184 Turnberry Blvd Extension McManus Blvd Ridgewood Pkwy Newport News New facility/roadway extension 0 4 14 19 19 52
T O P P R I O R I T I Z E D P R O J E C T S C O R E SP R O J E C T E VA LUAT I O N A N D S C O R I N G 32
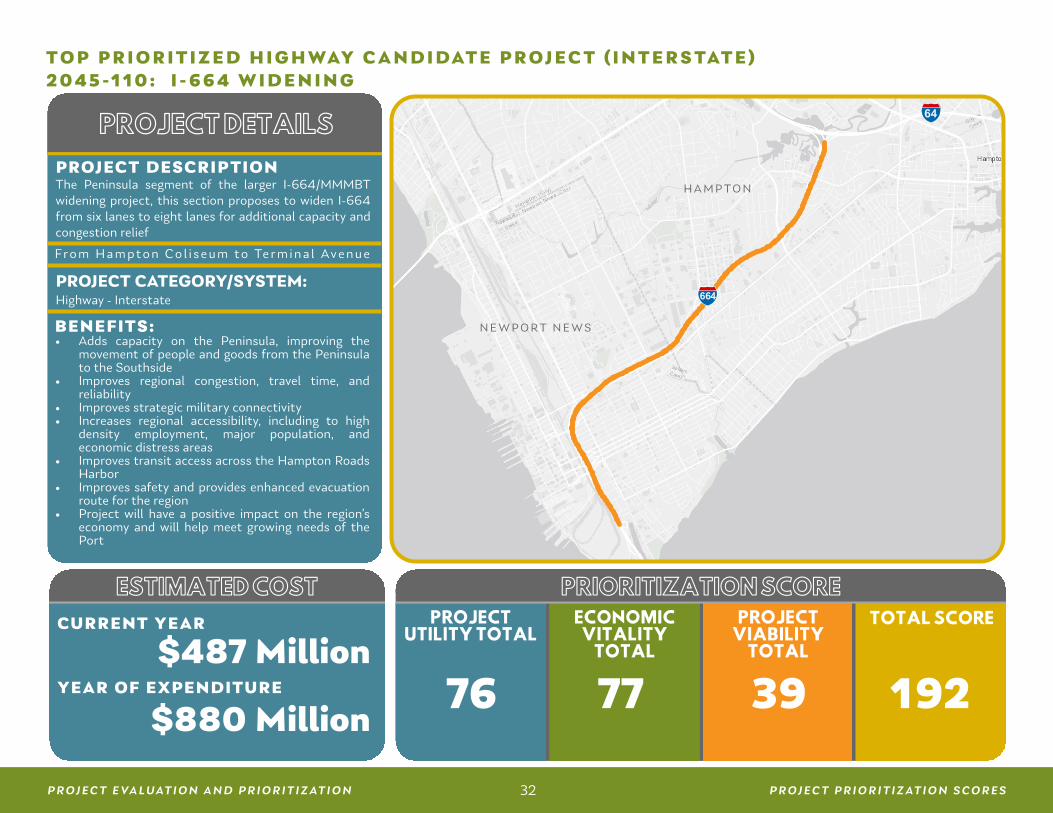
T O P PRI O RITIZ E D HI G H WAY C A ND IDATE PROJ E C T (INTE RS TATE)2045 -110: I - 664 W ID E NIN G
Esri, HERE, Garmin, © OpenStreetMap contributors, and the GIS user community
PROJECT DETAILS
PROJECT DESCRIPTIONThe Peninsula segment of the larger I-664/MMMBT widening project, this section proposes to widen I-664 from six lanes to eight lanes for additional capacity and congestion relief
PROJECT CATEGORY/SYSTEM: Highway - Interstate
PRIORITIZATION SCORE
PROJECT
UTILITY TOTAL
ECONOMIC
VITALITY
TOTAL
PROJECT
VIABILITY
TOTAL
TOTAL SCORE
76 77 39 192
ESTIMATED COST
$487 Million
$880 Million
CURRENT YEAR
YEAR OF EXPENDITURE
P R O J E C T P R I O R I T I Z AT I O N S C O R E SP R O J E C T E VA LUAT I O N A N D P R I O R I T I Z AT I O N 32
664
64
N E W P O R T N E W S
H A M P T O N
Fr o m Ha m p t o n Co l i s e um t o Te r m ina l Ave n u e
BENEFITS:• Adds capacity on the Peninsula, improving the
movement of people and goods from the Peninsula to the Southside
• Improves regional congestion, travel time, and reliability
• Improves strategic military connectivity• Increases regional accessibility, including to high
density employment, major population, and economic distress areas
• Improves transit access across the Hampton Roads Harbor
• Improves safety and provides enhanced evacuation route for the region
• Project will have a positive impact on the region’s economy and will help meet growing needs of the Port

T O P P R I O R I T I Z E D P R O J E C T S C O R E SP R O J E C T E VA LUAT I O N A N D S C O R I N G 33
T O P PRI O RITIZ E D HI G H WAY C A ND IDATE PROJ E C T (PRIM A RY )2045 -171: J . C LY D E M O RRI S B LV D / G.W. H W Y (U S 17 ) W ID E NIN G
Esri, HERE, Garmin, © OpenStreetMap contributors, and the GIS user community
PROJECT DETAILS
PROJECT DESCRIPTIONHighway widening facility from four to six lanes, improving interstate access on US Route 17 from York County
PROJECT CATEGORY/SYSTEM: Highway - Primary
BENEFITS:• Improves congestion and reliability• Increases regional accessibility, including to
high density employment, major population, and economic distress areas
• Improves safety and provides enhanced evacuation route for the region
• Improves the movement of both people and freight
PRIORITIZATION SCORE
PROJECT
UTILITY TOTAL
ECONOMIC
VITALITY
TOTAL
PROJECT
VIABILITY
TOTAL
TOTAL SCORE
62 47 58 167
ESTIMATED COST
$15 Million
$21 Million
CURRENT YEAR
YEAR OF EXPENDITURE
P R O J E C T P R I O R I T I Z AT I O N S C O R E SP R O J E C T E VA LUAT I O N A N D P R I O R I T I Z AT I O N 33
64
N E W P O R T N E W S
YO R K C O U N T Y
17
Fr o m I - 6 4 to Yo r k Co unt y L in e

T O P P R I O R I T I Z E D P R O J E C T S C O R E SP R O J E C T E VA LUAT I O N A N D S C O R I N G 34
T O P PRI O RITIZ E D HI G H WAY C A ND IDATE PROJ E C T (SE C O NDA RY )2045 -265: C O M M O N W E A LTH D R E X TE N S I O N
Esri, HERE, Garmin, © OpenStreetMap contributors, and the GIS user community
PROJECT DETAILS
PROJECT DESCRIPTIONNew roadway alignment extending Commonwealth Drive, connecting Victory Blvd to US Route 17
PROJECT CATEGORY/SYSTEM: Highway - Secondary
BENEFITS:• Relieves congestion on parallel facilities• Improves reliability for that area of the region• Increases regional accessibility to economic
distress areas
PRIORITIZATION SCORE
PROJECT
UTILITY TOTAL
ECONOMIC
VITALITY
TOTAL
PROJECT
VIABILITY
TOTAL
TOTAL SCORE
42 23 44 109
ESTIMATED COST
$4 Million
$6 Million
CURRENT YEAR
YEAR OF EXPENDITURE
P R O J E C T P R I O R I T I Z AT I O N S C O R E SP R O J E C T E VA LUAT I O N A N D P R I O R I T I Z AT I O N 34
YO R K C O U N T Y
17
From George Washington Memorial Highway (US Route 17) to Commonwealth Drive

T O P P R I O R I T I Z E D P R O J E C T S C O R E SP R O J E C T E VA LUAT I O N A N D S C O R I N G 35
T O P PRI O RITIZ E D HI G H WAY C A ND IDATE PROJ E C T (U RBA N)2045 -114: G RE E NB E LT SE G M E NT - PH ASE I
Esri, HERE, Garmin, © OpenStreetMap contributors, and the GIS user community
PROJECT DETAILS
PROJECT DESCRIPTIONNew alignment to relieve congestion and provide new access
PROJECT CATEGORY/SYSTEM: Highway - Urban
BENEFITS:• Improves congestion and reliability• Increases regional accessibility by providing
an alternative route to I-264 between Virginia Beach and Chesapeake
• Improves the movement of both people and freight
• Provides an additional evacuation route for the region
PRIORITIZATION SCORE
PROJECT
UTILITY TOTAL
ECONOMIC
VITALITY
TOTAL
PROJECT
VIABILITY
TOTAL
TOTAL SCORE
76 54 42 172
ESTIMATED COST
$37 Million
$53 Million
CURRENT YEAR
YEAR OF EXPENDITURE
P R O J E C T P R I O R I T I Z AT I O N S C O R E SP R O J E C T E VA LUAT I O N A N D P R I O R I T I Z AT I O N 35
165
165
V I R G I N I A B E AC H
N I M M O PA R K WAY
From London Bridge Rd to Princess Anne Rd

P R O J E C T P R I O R I T I Z AT I O N S C O R E SP R O J E C T E VA LUAT I O N A N D P R I O R I T I Z AT I O N 36
2045 LR TP C A ND IDATE PROJ E C T S INTE RC H A N G E2045
PROJECT ID
PROJECT NAME FROM TO JURISDICTION PROJECT DESCRIPTIONPROJECT UTILITY TOTAL
ECONOMIC VITALITY
TOTAL
PROJECT VIABILITY
TOTAL
TOTAL SCORE
2045-301 I-64/I-264 Interchange Phase IIIA N/A N/A Multi-jurisdictional Interchange improvements 69 89 56 214
2045-326 I-264 at Independence Blvd N/A N/A Virginia Beach Interchange improvements 85 78 45 208
2045-305 I-64/I-264 Interchange Phase IIIE N/A N/A Multi-jurisdictional Interchange improvements 67 83 56 206
2045-302 I-64/I-264 Interchange Phase IIIB N/A N/A Multi-jurisdictional Interchange improvements 57 77 57 191
2045-303 I-64/I-264 Interchange Phase IIIC N/A N/A Multi-jurisdictional Interchange improvements 44 86 58 188
2045-327 I-264 at Rosemont Rd N/A N/A Virginia Beach Interchange improvements 80 70 35 185
2045-304 I-64/I-264 Interchange Phase IIID N/A N/A Multi-jurisdictional Interchange improvements 45 76 57 178
2045-316 Air Terminal Interchange N/A N/A Norfolk New Interchange 75 64 38 177
2045-308 Bowers Hill Interchange Bowers Hill College Drive Multi-jurisdictional Improvement to interchange. 72 56 45 173
2045-306 I-64/I-264 Interchange Phase IIIF N/A N/A Multi-jurisdictional Interchange improvements 60 56 56 172
2045-313 I-64 at Settlers Landing Rd N/A N/A Hampton Ramp modifications (EB and WB) 56 61 53 170
2045-309I-64/I-464 Loop Ramp (I-64 EB to I-464 South and I-464 NB to I-64 WB)
N/A N/A ChesapeakeInterchange improvements (as part of Hampton Roads Express Lanes Network)
69 61 30 160
2045-320I-64/Northampton Blvd Interchange - EB Traffic from Northampton Blvd to I-264
N/A N/A Norfolk Interchange improvements to I-64 EB On Ramp from Northampton Blvd 56 73 27 156
2045-311 I-64 at Lasalle Ave I-64 WB Lasalle Ave HamptonAdd movement I-64 EB to NB and grade separated movement from I-64 WB to EB Armistead and NB LaSalle
61 44 48 153
2045-312 I-64 at N. King St N/A N/A Hampton New interchange; close EB existing off-ramp at Rip Rap Road 73 44 36 153
2045-314 I-64/Denbigh Blvd Interchange Project N/A N/A Newport News New Interchange 66 46 40 152
2045-321 Military Hwy at I-64 -- New EB On-Ramp N/A N/A Norfolk New I-64 Eastbound on-ramp 44 65 39 148
2045-318I-264 at Ballentine Blvd Diverging Diamond Interchange
N/A N/A Norfolk Interchange reconstruction 52 33 54 139
2045-317I-564/I-64 Interchange - Direct Ramp Access to HREL Network
N/A N/A Multi-jurisdictional Direct acces to Hampton Roads Express Lanes to/from I-564 54 72 7 133
2045-315 I-64/Fort Eustis Blvd Interchange N/A N/A Newport News Interchange improvements 65 40 14 119
2045-323 Frederick Blvd and I-264 Interchange Frederick Blvd I-264 Ramps Portsmouth Interchange improvements 44 44 28 116
2045-324 Victory Blvd and I-264 Interchange Victory Blvd (Rte 239) I-264 Ramps Portsmouth Interchange improvements 46 34 19 99
2045-325 VIG Interchange N/A N/A Portsmouth Interchange improvements 34 30 32 96
2045-319 I-264/Military Hwy Interchange N/A N/A Norfolk Interchange improvements 46 40 7 93
2045-322 Cedar Ln and VA-164 Interchange Cedar Ln VA-164 Portsmouth Interchange improvements associated with Craney Island Access Road 30 29 16 75
2045-307 US 58/258 Interchange N/A N/A Multi-jurisdictional Interchange improvements 33 25 58 116
IINNTTEERRSSTTAATTEE
PPRRIIMMAARRYY

T O P P R I O R I T I Z E D P R O J E C T S C O R E SP R O J E C T E VA LUAT I O N A N D S C O R I N G 37
T O P PRI O RITIZ E D INTE RC H A N G E C A ND IDATE PROJ E C T (INTE RS TATE)2045 -301: I - 64/I -264 INTE RC H A N G E PH ASE I I IA
!
PRIORITIZATION SCORE
PROJECT
UTILITY TOTAL
ECONOMIC
VITALITY
TOTAL
PROJECT
VIABILITY
TOTAL
TOTAL SCORE
69 89 56 214
ESTIMATED COST
$415 Million
$592 Million
CURRENT YEAR
YEAR OF EXPENDITURE
P R O J E C T P R I O R I T I Z AT I O N S C O R E SP R O J E C T E VA LUAT I O N A N D P R I O R I T I Z AT I O N 37
64 V I R G N I A B E AC H
64
264
264
N O R F O L K
C H E S A P E A K E
PROJECT DETAILS
PROJECT DESCRIPTIONInterchange improvements including widening I-64 Eastbound (EB) one/two lanes from Northampton Blvd, widening I-264 one lane to the collector/distributor merge with the interstate mainline, and improving the bridge structures from I-64 EB (over Kempsville Rd and Virginia Beach Blvd) and I-264 EB (over Newtown Rd)
PROJECT CATEGORY/SYSTEM: Interchange - Interstate
BENEFITS:• Relieves congestion and improves traffic operations
along I-264 and I-64 corridors• Improves regional travel time and reliability to
major employment centers, port facilities, military installations, and tourist destinations
• Provides congestion relief to the ramp, which carries 26,000 vehicles per weekday
• 66,000 people commute between Norfolk and Virginia Beach each day, many of which pass through this interchange
• Improves safety and accessibility on one of the most hazardous corridors in the region
From N/A to N/A

T O P P R I O R I T I Z E D P R O J E C T S C O R E SP R O J E C T E VA LUAT I O N A N D S C O R I N G 38
T O P PRI O RITIZ E D INTE RC H A N G E C A ND IDATE PROJ E C T (PRIM A RY )2045 -307: U S 58/258 INTE RC H A N G E
!
PROJECT DETAILS
PROJECT DESCRIPTIONSafety and operational improvements at the US Route 58/258 interchange and approaches in Franklin and Southampton
PROJECT CATEGORY/SYSTEM: Interchange - Primary
BENEFITS:
Improves safety and accessibility for both the movement of people and freight in the Franklin and Southampton area
PRIORITIZATION SCORE
PROJECT
UTILITY TOTAL
ECONOMIC
VITALITY
TOTAL
PROJECT
VIABILITY
TOTAL
TOTAL SCORE
33 25 58 116
ESTIMATED COST
$1.5 Million
$1.7 Million
CURRENT YEAR
YEAR OF EXPENDITURE
P R O J E C T P R I O R I T I Z AT I O N S C O R E SP R O J E C T E VA LUAT I O N A N D P R I O R I T I Z AT I O N 38
F R A N K L I N
S O U T H A M P T O N C O U N T Y
58
58258
258
From N/A to N/A

P R O J E C T P R I O R I T I Z AT I O N S C O R E SP R O J E C T E VA LUAT I O N A N D P R I O R I T I Z AT I O N 39
2045 LR TP C A ND IDATE PROJ E C T S INTE RM O DA L - FRE I G HT2045
PROJECT ID
PROJECT NAME FROM TO JURISDICTION PROJECT DESCRIPTIONPROJECT UTILITY TOTAL
ECONOMIC VITALITY
TOTAL
PROJECT VIABILITY
TOTAL
TOTAL SCORE
2045-603 Hampton Blvd at Terminal Blvd Trouville Ave/Portor St Hampton Blvd Norfolk New highway/rail underpass 91 61 38 190
2045-604 Craney Island Access Rd VA 164 and Median RailCraney Island Marine Terminal
Portsmouth Provides access to Craney Island Port Facility 93 49 19 161
2045-602 Portlock Rd Railroad Overpass N/A N/A ChesapeakeNew structure to replace at grade crossing along Portlock Rd between Varsity Dr and Reid St
63 31 52 146
2045-607 North Suffolk Connector Rd Nansemond Pkwy I-664 Suffolk New 2-lane divided roadway 42 53 47 142
2045-606 Nansemond Pkwy (Rte 337) N/A N/A Suffolk Highway-rail grade separation near Suffolk Meadows Blvd 55 36 39 130
2045-605 Finney Ave Flyover Pinner StRoute 13/337 E Washington St
Suffolk Highway-rail grade separation in core Suffolk downtown area 45 36 37 118
2045-601 VA-164 Extension VA-164 Suffolk Bypass Multi-jurisdictional Extend VA-164 on existing RR Right of Way 25 81 2 108

T O P P R I O R I T I Z E D P R O J E C T S C O R E SP R O J E C T E VA LUAT I O N A N D S C O R I N G 40
T O P PRI O RITIZ E D INTE RM O DA L/FRE I G HT C A ND IDATE PROJ E C T2045 - 603: H A M P T O N B O U LE VA RD AT TE RM IN A L B O U LE VA RD
!
!!
Esri, HERE, Garmin, © OpenStreetMap contributors, and the GIS user community
PROJECT DETAILS
PRIORITIZATION SCORE
PROJECT
UTILITY TOTAL
ECONOMIC
VITALITY
TOTAL
PROJECT
VIABILITY
TOTAL
TOTAL SCORE
91 61 38 190
ESTIMATED COST
P R O J E C T P R I O R I T I Z AT I O N S C O R E SP R O J E C T E VA LUAT I O N A N D P R I O R I T I Z AT I O N 40
N O R F O L K
PROJECT DETAILS
PROJECT DESCRIPTIONNew highway/ rail underpass
PROJECT CATEGORY/SYSTEM: Interchange - Primary
BENEFITS:
• Provides unimpeded traffic flow via a grade separation between rail and auto traffic
• Improves regional travel time and reliability to port facilities and military installations
• Improves safety by removing a conflict point between rail and autos
$147 Million
$210 Million
CURRENT YEAR
YEAR OF EXPENDITURE
From Trouville Avenue/Porter Street to Hampton Boulevard

P R O J E C T P R I O R I T I Z AT I O N S C O R E SP R O J E C T E VA LUAT I O N A N D P R I O R I T I Z AT I O N 41
2045 LR TP C A ND IDATE PROJ E C T S TR A N S IT2045
PROJECT ID
PROJECT NAME FROM TO JURISDICTION PROJECT DESCRIPTIONPROJECT UTILITY TOTAL
ECONOMIC VITALITY
TOTAL
PROJECT VIABILITY
TOTAL
TOTAL SCORE
2045-510 Peninsula High Capacity Transit Hampton/ Newport News Hampton/ Newport News Multi-jurisdictional Fixed Guideway 81 63 38 182
2045-518 Naval Station Norfolk Transit Extension Existing LRT Naval Station Norfolk Norfolk Fixed Guideway 84 60 36 180
2045-516 High Capacity Transit Extension to Greenbrier Area Existing Service Locations Greenbrier Area Chesapeake Fixed Guideway 87 55 31 173
2045-519 High Capacity Transit Extension to Suffolk Existing Service Locations Suffolk Suffolk Fixed Guideway 68 51 13 132
2045-504 Ferry Service Norfolk Hampton Multi-jurisdictional Ferry 76 50 52 178
2045-517 Elizabeth River Ferry Expansion Current Service Locations ODU Norfolk Ferry 60 60 54 174
2045-513 Southside Ferry Service Expansion Current Service LocationsHarbor Park (regular/recurring service)
Multi-jurisdictional Ferry 57 56 31 144
2045-506Higher-Speed and Intercity Passenger Rail - DRPT Tier I EIS ROD - Preferred Alternative
Hampton RoadsRichmond / Northeast Corridor
Multi-jurisdictional Heavy/Commuter Rail 72 50 46 168
2045-509 Peninsula Commuter Rail Newport News Williamsburg Multi-jurisdictional Heavy/Commuter Rail 62 60 25 147
2045-507High-Speed and Intercity Passenger Rail - HRTPO High Speed Rail Vision Plan - Option 4 Richmond Direct Improved
Hampton RoadsRichmond / Northeast Corridor
Multi-jurisdictional Heavy/Commuter Rail 88 30 18 136
MMAARRIITTIIMMEE TTRRAANNSSIITT
FFIIXXEEDD GGUUIIDDEEWWAAYY TTRRAANNSSIITT
RRAAIILL TTRRAANNSSIITT

T O P P R I O R I T I Z E D P R O J E C T S C O R E SP R O J E C T E VA LUAT I O N A N D S C O R I N G 42
T O P PRI O RITIZ E D TR A N S IT C A ND IDATE PROJ E C T (F IXE D G U ID E WAY )2045 -510: PE NIN SU L A HI G H C A PAC IT Y TR A N S IT
Esri, HERE, Garmin, © OpenStreetMap contributors, and the GIS user community
PROJECT DETAILS
PROJECT DESCRIPTIONProposed Bus Rapid Transit project connecting key areas in Hampton and Newport News
PROJECT CATEGORY/SYSTEM: Transit - Fixed Guideway
BENEFITS:• Provides new travel options • Improves access to population and employment
centers • Improves access to key destinations and activity
centers on the Peninsula • Improves air quality by reducing auto trips
PRIORITIZATION SCORE
PROJECT
UTILITY TOTAL
ECONOMIC
VITALITY
TOTAL
PROJECT
VIABILITY
TOTAL
TOTAL SCORE
81 63 38 182
ESTIMATED COST
$235 Million
$335 Million
CURRENT YEAR
YEAR OF EXPENDITURE
P R O J E C T P R I O R I T I Z AT I O N S C O R E SP R O J E C T E VA LUAT I O N A N D P R I O R I T I Z AT I O N 42
H A M P T O N
N E W P O R T N E W S
YO R K C O U N T YP O Q U O S O N
664
64
64
From Hampton/Newport News to Hampton/Newport News

T O P P R I O R I T I Z E D P R O J E C T S C O R E SP R O J E C T E VA LUAT I O N A N D S C O R I N G 43
T O P PRI O RITIZ E D TR A N S IT C A ND IDATE PROJ E C T (M A RITI M E)2045 -504: FE RRY SE RV I C E
PROJECT DETAILS
PRIORITIZATION SCORE
PROJECT
UTILITY TOTAL
ECONOMIC
VITALITY
TOTAL
PROJECT
VIABILITY
TOTAL
TOTAL SCORE
76 50 52 178
ESTIMATED COST
$12 Million
$22 Million
CURRENT YEAR
YEAR OF EXPENDITURE
P R O J E C T P R I O R I T I Z AT I O N S C O R E SP R O J E C T E VA LUAT I O N A N D P R I O R I T I Z AT I O N 43
ChesapeakeBay
J ames River
664
64
H A M P T O N
NEW
POR
T NEW
S
N O R F O L K
P O R T S M O U T H
PROJECT DETAILS
PROJECT DESCRIPTIONProposed ferry service connecting the Peninsula and Southside
PROJECT CATEGORY/SYSTEM: Transit-Maritime
BENEFITS:• Provides new travel options across the Hampton
Roads Harbor, connecting the Peninsula and Southside
• Improves access to population and employment centers
• Improves access to key destinations and activity centers
• Improves air quality by reducing auto trips
From Norfolkto Hampton

T O P P R I O R I T I Z E D P R O J E C T S C O R E SP R O J E C T E VA LUAT I O N A N D S C O R I N G 44
T O P PRI O RITIZ E D TR A N S IT C A ND IDATE PROJ E C T (R A IL)2045 -506 - HI G H SPE E D A ND INTE RC IT Y PAS SE N G E R R A IL- PRE FE RRE D A LTE RN ATIV E
.
GLOUCESTERCOUNTY
ISLE OF WIGHTCOUNTY
POQUOSON
HAMPTON
NEWPORT NEWS
YORKCOUNTY
JAMES CITYCOUNTY
WILLIAMSBURG
SUFFOLK
CHESAPEAKE
VIRGINIA BEACH
NORFOLK
PORTSMOUTH
SOUTHAMPTONCOUNTY
FRANKLIN
ATLANTIC O
CEAN
J ames River
Chesapeake Bay
Hampton RoadsBridge-Tunnel
Monitor-MerrimacMemorial Bridge-Tunnel
64
64
17
199
64664
564
58
17
17
13
164
464
264460
664
58
258
17
168
64
PROJECT DETAILS
PRIORITIZATION SCORE
PROJECT
UTILITY TOTAL
ECONOMIC
VITALITY
TOTAL
PROJECT
VIABILITY
TOTAL
TOTAL SCORE
72 50 46 168
ESTIMATED COST
$475 Million
$859 Million
CURRENT YEAR
YEAR OF EXPENDITURE
P R O J E C T P R I O R I T I Z AT I O N S C O R E SP R O J E C T E VA LUAT I O N A N D P R I O R I T I Z AT I O N 44
PROJECT DESCRIPTIONEnhanced passenger rail service connecting Hampton Roads to Richmond and the Northeast Rail Corridor
PROJECT CATEGORY/SYSTEM: Transit - Rail
BENEFITS:• Provides new travel options connecting
Hampton Roads to Richmond and the Northeast Rail Corridor
• Improves rail access to key population and employment centers along the East Coast
• Improves air quality by reducing auto trips
From Hampton Roads to Richmond/Northeast Corridor

P R O J E C T P R I O R I T I Z AT I O N S C O R E SP R O J E C T E VA LUAT I O N A N D P R I O R I T I Z AT I O N 45
2045 LR TP C A ND IDATE PROJ E C T S AC TIV E TR A N SP O R TATI O N2045
PROJECT IDPROJECT NAME FROM TO JURISDICTION PROJECT DESCRIPTION
PROJECT UTLITY TOTAL
ECONOMIC VITALITY
TOTAL
PROJECT VIABILITY
TOTAL
TOTAL SCORE
2045-704 Birthplace of America Trail Virginia Capital Trail Hampton Roads Multi-jurisdictional Regional bicycle/pedestrian facility 87 90 35 212
2045-707 South Hampton Roads Trail: Complete Trail (Suffolk to VB) Suffolk Virginia Beach Multi-jurisdictional Regional bicycle/pedestrian facility 87 90 29 206
2045-709 Southside Bike Trail Chesapeake Virginia Beach Oceanfront Multi-jurisdictional Bike trail corridor 87 90 24 201
2045-708Virginia Beach Trail (part of the regional South Hampton Roads Trail)
Newtown Rd Norfolk Ave Virginia Beach Regional bicycle/pedestrian facility 76 90 32 198
2045-754 Monticello Ave Shared-Use Path Treyburn Drive Ironbound Rd (Rte 615) Williamsburg Shared-use path 46 76 68 190
2045-703 Bike Path Along Shore Dr/Hampton Blvd/Little Creek Rd Norfolk Elizabeth River Trail Virginia Beach City Line Norfolk Bike Lanes 49 90 42 181
2045-732 Bike Lanes on Granby St W Ocean View Ave W Main St Norfolk Bike Lanes 60 80 36 176
2045-720 South Hampton Roads Trail: Western Branch Phase 1 Taylor Rd Poplar Hill Rd Chesapeake Shared-use path 33 66 71 170
2045-739 Portsmouth Rail-to-Trail Churchland Plaza Old Coast Guard Rd Portsmouth Shared Use Path 50 64 50 164
2045-741Rail-to-Trail (Suffolk Seabord Coastline Trail, part of the South Hampton Roads Trail)
Pughsville Rd Downtown Suffolk Suffolk Shared Use Path 57 65 38 160
2045-738 Complete High St Chesnut St MLK Overpass Portsmouth"Complete Streets" conversion (part of the South Hampton Roads Trail)
54 63 38 155
2045-748 Thalia Creek Greenway - Phase IV Constitution Dr Virginia Beach Trail Virginia Beach Bicycle / Pedestrian Facility 45 80 28 153
2045-752 I-264 Pedestrian Land Bridge/Flyover Thalia Creek Greenway Mt. Trashmore Park Virginia Beach Shared-use path 50 80 22 152
2045-749 Thalia Creek Greenway - Phase V Virginia Beach Trail Virginia Beach Blvd Virginia Beach Bicycle / Pedestrian Facility 46 80 26 152
2045-745 Northampton Blvd Right-of-Way Bayside Rd Greenwell Rd Virginia Beach Shared-use path 31 85 32 148
2045-729 Multi-use path on 26th St Jefferson Ave Parish Ave Newport News Road diet to provide mulit-use path 49 73 25 147
2045-726 Monticello Ave Bike Lane News Rd Centerville Rd James City CountyBike lanes (part of Birthplace of America Trail)
54 62 31 147
2045-728 Multi-use path on 25th St Jefferson Ave Parish Ave Newport News Road diet to provide mulit-use path 49 72 25 146
2045-750 Thalia Creek Greenway - Phase VI Constitution Dr I-264 Virginia Beach Bicycle / Pedestrian Facility 43 80 22 145
2045-735 Military Hwy Bike Access N/AShopping Areas and Outlet Mall
Norfolk Bike access 40 80 23 143
2045-730 Multi-use path on 27th St Jefferson Ave Parish Ave Newport News Road diet to provide mulit-use path 44 72 25 141
2045-731 Multi-use path on 28th St Jefferson Ave Parish Ave Newport News Road diet to provide mulit-use path 44 72 25 141
2045-734 Elizabeth River Trail Extension to Naval Station Norfolk Cloncurry Road Admiral Tausig Boulevard Norfolk Bike lane extension 37 70 30 137
2045-712 Battlefield Blvd Military Hwy Volvo Pkwy Chesapeake Bicycle / Pedestrian Facility 35 70 28 133
2045-737 Bike lanes on Churchland Blvd Portsmouth Trail High St Portsmouth Bike facility 15 69 46 130
2045-753 Carter's Grove Country Rd Shared Use Path South England St Ron Springs Dr WilliamsburgShared Use Path (part of Birthplace of America Trail)
33 70 27 130
2045-760 Shore Drive Protected Bike Lane Kendall Street 80th Street Virginia BeachConversion from traditional Bike Lane to Protected/Buffered Shared Use Path
45 58 26 129
2045-717 Construct multi-use path along Greenbrier Pkwy Eden Way Kempsville Rd Chesapeake Multi-use path 41 60 28 129

P R O J E C T P R I O R I T I Z AT I O N S C O R E SP R O J E C T E VA LUAT I O N A N D P R I O R I T I Z AT I O N 46
2045 LR TP C A ND IDATE PROJ E C T S AC TIV E TR A N SP O R TATI O N 2045
PROJECT IDPROJECT NAME FROM TO JURISDICTION PROJECT DESCRIPTION
PROJECT UTLITY TOTAL
ECONOMIC VITALITY
TOTAL
PROJECT VIABILITY
TOTAL
TOTAL SCORE
2045-723 Gloucester County Multi-use paths Beaverdam Park Main St Gloucester Bicycle / Pedestrian Facility 40 58 30 128
2045-742 Greenwich Rd conversion to Shared Use Path Newtown Rd South Witchduck Rd Virginia Beach Shared Use Path 36 60 32 128
2045-743 Level Green Powerline Corridor Reon DrChesapeake CL at S. Military Hwy
Virginia Beach Shared Use Path 37 70 21 128
2045-755 Strawberry Plains Rd Shared Use Path Ironbound Rd John Tyler Ln Williamsburg Multi-use path 52 41 29 122
2045-701 Bike Lanes on Indian River Rd Berkley Ave Sparrow Rd Norfolk Bike Lanes 43 54 25 122
2045-721 South Hampton Roads Trail: Western Branch Phase 2 Taylor Rd Suffolk CL Chesapeake Multi-use path 36 53 30 119
2045-727 16th St Revitalization Marshall Ave Peterson's Yacht Basin Newport News Multi-use path 38 54 27 119
2045-713 Bike lane along Great Bridge Blvd Battlefield Blvd Bainbridge Blvd Chesapeake On-street bike lanes 31 60 27 118
2045-746 Scarborough Bridge Magic Hollow Blvd Old Clubhouse Rd Virginia Beach Shared Use Path 38 49 31 118
2045-756 Penniman Rd (Sidewalk / Multi Use Path) Williamsburg CLMarquis Center Pkwy (Rte 199)
York County Sidewalk & Multi-Use Path 33 51 33 117
2045-725 Bike Lanes on Centerville Rd that connect to Capital Trail Jamestown Rd (Rte 31) John Tyler Hwy (Rte 5) James City County Bike Lanes 33 32 51 116
2045-702 Bike Lanes on Indian River Rd Campostella Rd Military Hwy Norfolk Bike Lanes 35 54 25 114
2045-715Construct multi-use path along Etheridge Manor Blvd/ Hanbury Rd
Centerville Tnpk Johnstown Rd Chesapeake Multi-use path 35 50 26 111
2045-718 Construct multi-use path along Shell Rd/Canal Rd G.W. Hwy (US 17) Military Hwy Chesapeake Multi-use path 38 46 27 111
2045-724 Five Mile Loop Trail Fort Monroe Fort Monroe Hampton Shared Use Path 39 33 32 104
2045-716 Construct multi-use path along George Washington Hwy Moses Grandy Trail Deep Creek Park Trailhead Chesapeake Multi-use path 33 35 33 101
2045-740 Twin Pines Rd Shared Use Path Swannanoa Dr Sunset Point Portsmouth Shared Use Path 22 52 27 101
2045-722 Hickory Fork RdAberdeen Creek Rd (Rte 632)
Old Pinetta (Rte 610) GloucesterShared use path to connect two regional parks (one state park and one national)
30 43 27 100
2045-758 Shared Use Path Along Yorktown Rd Cardinal Ln (Rte 670) Victory Blvd (Rte 171) York County Shared Use Path 29 30 37 96
2045-719 Construct multi-use path trail along Dismal Swamp Canal Existing Trailhead North Carolina Border Chesapeake Multi-use path 32 30 32 94
2045-714 Bike lane on Waters Rd Cedar Rd Washington Dr Chesapeake On-street bike lanes 21 50 23 94
2045-747 Seaboard Rd Shared Use Path and land acquisition North - Princess Anne Rd South - Princess Anne Rd Virginia Beach Shared Use Path 28 33 27 88
2045-759 Victory Boulevard Shared Use Path Big Bethel Rd (Rte 600) Carys Chapel Rd (Rte 762) York County Shared Use Path 24 22 37 83
2045-736 Bike Path on Hunts Neck Rd (Rte 172) Yorktown Rd Pasture Rd Poquoson Shared Use Path 18 31 33 82
2045-757 Shared Use Path - Yorktown Road Tabb High SchoolHampton Hwy (Rte 134) at Brick Kiln Creek Bridge
York County Shared Use Path 24 20 38 82

T O P P R I O R I T I Z E D P R O J E C T S C O R E SP R O J E C T E VA LUAT I O N A N D S C O R I N G 47
T O P PRI O RITIZ E D AC TIV E TR A N SP O R TATI O N C A ND IDATE PROJ E C T2045 -704: B IR THPL AC E O F A M E RI C A TR A IL
PROJECT DETAILS
PRIORITIZATION SCORE
PROJECT
UTILITY TOTAL
ECONOMIC
VITALITY
TOTAL
PROJECT
VIABILITY
TOTAL
TOTAL SCORE
87 90 35 212
ESTIMATED COST
$155 Million
$279 Million
CURRENT YEAR
YEAR OF EXPENDITURE
P R O J E C T P R I O R I T I Z AT I O N S C O R E SP R O J E C T E VA LUAT I O N A N D P R I O R I T I Z AT I O N 47
PROJECT DETAILS
PROJECT DESCRIPTIONA regional trail that will connect the southern terminus of the Virginia Capital Trail to Fort Monroe in Hampton and the South Hampton Roads Trail in Suffolk
PROJECT CATEGORY/SYSTEM: Active Transportation: Shared-Use Path
BENEFITS:• Provides new bicycle and pedestrian travel
options connecting major trails in the region and the state
• Improves bicycle and pedestrian access to key destinations and activity centers
• Improves air quality by reducing auto trips
From Virginia Capital Trail in Jamestown to Fort Monroe and Suffolk
BIRTHPLACE OF AMERICA TRAIL
Proposed Shared-Use Path
SUFFOLK
CHESAPEAKE
VIRGINIA BEACH
NORFOLK
PORTSMOUTH
iSLE OF WIGHT COUNTY
ATLANTIC OCEAN
James River
Chesapeake Bay
Monitor-MerrimacMemorial Bridge-Tunnel
Hampton RoadsBridge-Tunnel
GLOUCESTERCOUNTY
POQUOSON
HAMPTONNEWPORT
NEWS
YORKCOUNTY
JAMES CITYCOUNTY WILLIAMSBURG
JAMES CITYCOUNTY
64
64
664
564
58
17
13
464
264
664
58 17 168
64
64

D E S C R I P T I O N O F C A LC U L AT I O N SP R O J E C T E VA LUAT I O N A N D P R I O R I T I Z AT I O N 48
LRTP D e s cr ip t io n of C alcul at io ns . . . . . . . . . . . . . . . . . . . . . . . . . . . . . . . . . . . . . . . . . . . . . . . . . . . . . . . . . 49
2045 Weight ing Fa c to r s - Eco n o mic V i t a l i t y . . . . . . . . . . . . . . . . . . . . . . . . . . . . . . . . . . . . . . . 95
2045 Weight ing Fa c to r s - Pr o je c t Ut i l i t y . . . . . . . . . . . . . . . . . . . . . . . . . . . . . . . . . . . . . . . . . . . . . 98
2045 Weight ing Fa c to r s - Pr o je c t V iab i l i t y . . . . . . . . . . . . . . . . . . . . . . . . . . . . . . . . . . . . . . . . 100
AP P E N D IX A : D E S C R I P T I O N O F C AL C U L AT I O N S
A

I N T R O D U C T I O NP R O J E C T E VA LUAT I O N A N D S C O R I N G 49 D E S C R I P T I O N O F C A LC U L AT I O N SP R O J E C T E VA LUAT I O N A N D P R I O R I T I Z AT I O N 49
M E TH O D O LO GY O F APPLYIN G HR TP O PROJ E C T PRI O RITIZ ATI O N T O O L T O THE S C O RIN G O F 2045 LO N G - R AN G E TR AN SP O R TATI O N
D E S C RI P TI O N O F C ALC U L ATI O N S:
PR OJ E C T U TI LIT Y, E C O N O MI C VITALIT Y, AN D PROJ E C T VIAB I LIT Y
N OVE M B E R 2020
I N T R O D U C T I O NP R O J E C T E VA LUAT I O N A N D S C O R I N G 50 D E S C R I P T I O N O F C A LC U L AT I O N SP R O J E C T E VA LUAT I O N A N D P R I O R I T I Z AT I O N 50
A PPE ND IX A: LR TP D E S C RIP TI O N O F C A LC U L ATI O N S
BAC KG RO U ND S E C TI O N
The following “background” columns in the Project Prioritization Tool are used to calculate values for certain Tool Performance Measures, mostly for the Project Utility leg of the Tool.
I N R IX DATADescribes whether travel time and speed data collected by INRIX is available on that roadway segment for the analysis.
E XI S TI N G C A PAC IT YFor both Highways and Bridges/Tunnels, the existing capacity is based on the daily volume that is the threshold between LOS E & F based on the existing roadway class of that segment.
F U T U R E C A PAC IT YFor both Highways and Bridges/Tunnels, the future capacity is based on the daily volume that is the threshold between LOS E & F based on that segment's proposed roadway class.
A DTFor both Highways and Bridges/Tunnels, ADT was determined by using the existing weekday volumes for each segment within the project limits weighted by each segment length. If the facility does not currently exist, a value of “N/A” is listed and the existing weekday volume for the parallel facility is used.
F U T U R E A DTThe Regional Travel Demand Model was used to calculate the Future Average Daily Traffic (ADT) for highway, interchange, bridge & tunnel, and intermodal projects. Model forecasts were conducted for each scenario: Baseline, Greater Growth on the Water, Greater Growth in Urban Areas, and Greater Growth in Suburban Areas based on the scenario narratives (population and employment, freight, Connected and Autonomous Vehicle, Mobility as a Service/Ride Sharing, etc.). Forecasted volumes across scenarios were averaged.
E S TI M ATE D C O S T O F P R OJ E C TEstimated costs of projects are expressed in both Year-of-Expenditure (YOE) and Current Year dollars. For prioritization purposes, Current Year dollars are used to evaluate Cost Effectiveness. For fiscal-constraint purposes, YOE dollars will be used.
Cost estimates were submitted by stakeholders in either YOE or Current Year dollars. To convert estimates, a 3% planning level inflation factor was used based on the estimated project opening year. Planning level time bands were created (Near, Middle, Far) and a midpoint inflation factor assigned to each time band.

I N T R O D U C T I O NP R O J E C T E VA LUAT I O N A N D S C O R I N G 51 D E S C R I P T I O N O F C A LC U L AT I O N SP R O J E C T E VA LUAT I O N A N D P R I O R I T I Z AT I O N 51
A PPE ND IX A: LR TP D E S C RIP TI O N O F C A LC U L ATI O N S
M i d p o i n t In f l a t i o n Fa c t o r fo r e a c h T i m e B a n d
N E AR 2 0 2 2 - 2 0 2 9 1 .1 2 6
M I D D L E 2 0 3 0 - 2 0 3 7 1 . 4 2 6
FAR 2 0 3 8 - 2 0 4 5 1 . 8 0 6
Mi dp o int Inf l at io n Fa c to r fo r ea ch T im e B an d:
F U T U R E DA I LY VMTFuture ADT multiplied by length of project.
B R I D G E D E T O U R LE N G TH (B R I D G E A N D T U N N E L)The bridge detour length is the length in miles of the shortest path from one end of the bridge/tunnel to the other end, in the event that the bridge/tunnel is out of service.
B R I D G E D E T O U R VMTThe bridge detour VMT was calculated by multiplying the most recent weekday count by the segment length for each segment along the shortest detour route.

Level of service is a measure used to describe congestion levels based on Highway Capacity Manual analysis methods.
Congestion levels based on Levels-of-Service are shown in the following table:
C O N G E S T I O N L E V E L H C M L O SL OW A - C
M O D E R AT E D
S E V E R E E - F
The worst TTI and LOS during the day for that roadway segment is used, regardless of direction or peak period.
P R O J E C T U T I L I T Y – R OADWAYS
A PPE ND IX A: LR TP D E S C RIP TI O N O F C A LC U L ATI O N S
C O N G E S TI O N LE VE L (H I G HWAY AN D B R I D G E/T U N N E L)
(a) Percent Reduction between Existing and Future V/C Ratios
(Existing V/C-Future V/C)/Existing V/C
For new roadways: Existing V/C and Future V/C of parallel facility
(b) Existing Peak Period Congestion Level (TTI) and Existing Peak Period Level of Service (No Inrix Data)
Congestion levels were determined using the travel time index (TTI) for roadways with INRIX data and using Level of Service for roadways where INRIX data is not available. The travel time index is a ratio that compares travel times on a particular roadway segment during peak travel periods with travel times during uncongested, free-flow conditions. The higher the travel time index, the more congested the roadway is.
HRTPO uses the following thresholds to determine congestion levels based on the travel time index:
T R AV E L T I M E I N D E X F R E E WAY ART E R IAL S
L OW T T I < 1 .1 5 T T I < 1 . 2 5
M O D E R AT E 1 .1 5 ≤ T T I < 1 . 3 0 1 . 2 5 ≤ T T I < 1 . 4 0
S E V E R E T T I ≥ 1 . 3 0 T T I ≥ 1 . 4 0
D E S C R I P T I O N O F C A LC U L AT I O N SP R O J E C T E VA LUAT I O N A N D P R I O R I T I Z AT I O N 52

I N T R O D U C T I O NP R O J E C T E VA LUAT I O N A N D S C O R I N G 53 D E S C R I P T I O N O F C A LC U L AT I O N SP R O J E C T E VA LUAT I O N A N D P R I O R I T I Z AT I O N 53
A PPE ND IX A: LR TP D E S C RIP TI O N O F C A LC U L ATI O N S
(c) Person Throughput and Delay
The 2045 LRTP Project Prioritization Process uses two measures from the SMART SCALE prioritization process to evaluate congestion mitigation: Change in Person Throughput and Change in Person Hours of Delay.
Person throughput measures the change in corridor total (multimodal) person throughput attributed to the project. More information on how person throughput is calculated for each project type can be found in the SMART SCALE Technical Guide.
The thresholds for person throughput are as follows:
P E R S O N T H R O U G H P U T
V E RY H I G H 8 0 0 +
H I G H 6 0 0 - 79 9
M E D I U M - H I G H 4 0 0 - 5 9 9
M E D I U M 2 0 0 - 3 9 9
M E D I U M - L OW 1 - 1 9 9
L OW 0
Person hours of delay measures the change in the number of peak period person hours of delay in the project corridor. More information on how person hours of delay is calculated for each project type can be found in the SMART SCALE Technical Guide.
The thresholds for person hours of delay are as follows:
P E R S O N H O U R S O F D E L AY
V E RY H I G H 2 0 0 +
H I G H 1 0 0 - 2 0 0
M E D I U M - H I G H 5 0 - 1 0 0
M E D I U M 2 5 - 5 0
M E D I U M - L OW 1 - 2 5
L OW < 1
(d) Impact to Nearby Roadway
Future ADT – Existing ADT
For new roadways: Future ADT

I N T R O D U C T I O NP R O J E C T E VA LUAT I O N A N D S C O R I N G 54 D E S C R I P T I O N O F C A LC U L AT I O N SP R O J E C T E VA LUAT I O N A N D P R I O R I T I Z AT I O N 54
A PPE ND IX A: LR TP D E S C RIP TI O N O F C A LC U L ATI O N S
C O N G E S TI O N LE VE L (I NTE R C H AN G E)
(a) Existing Queue Conditions
Based on Number of Interstate and Arterial Approaches from where queues currently form (1 to 4 approaches).
(b) Queue Improvements
Number of Interstate and Arterial Approaches improved by project (1 to 4 approaches).
(c) Person Throughput and Delay
These measures are the same as the ones used for the Highway type projects.
(d) Number of Movements Added or Improved
Based on improved left and right movements (Max: 8 movements).
TR AVE L TI M E RE LIAB I LIT Y
(a) Level of Travel Time Reliability (LOTTR)
Although roadway congestion is prevalent in many areas of Hampton Roads, congestion levels are not always the same each day. Congestion levels can vary greatly from day to day due to a variety of factors such as crashes, bad weather, special events, or work zones. Travel time reliability is defined as how steady travel times are over the course of time, as measured generally from day to day.
The measure used in the 2045 LRTP Project Prioritization Process is the Level of Travel Time Reliability (LOTTR). The LOTTR is defined as the ratio of the 80th percentile travel time to the mean (50th percentile) travel time over the course of a year for four reporting periods: weekday morning peak (6-10 am), weekday midday (10 am – 4 pm), weekday afternoon peak (4 pm – 8 pm), and weekends (6 am – 8 pm). The highest of these four periods and the highest direction is the LOTTR used in this process.
The thresholds for Level of Travel Time Reliability are as follows:
L E V E L O F T R AV E L T I M E R E L IAB I L I T Y
V E RY H I G H 1 . 5 0 +
H I G H 1 . 4 0 – 1 . 4 9
M E D I U M - H I G H 1 . 3 0 – 1 . 3 9
M E D I U M 1 . 2 0 – 1 . 2 9
M E D I U M - L OW 1 .1 0 – 1 .1 9
L OW 1 . 0 0 – 1 . 0 9

I N T R O D U C T I O NP R O J E C T E VA LUAT I O N A N D S C O R I N G 55 D E S C R I P T I O N O F C A LC U L AT I O N SP R O J E C T E VA LUAT I O N A N D P R I O R I T I Z AT I O N 55
A PPE ND IX A: LR TP D E S C RIP TI O N O F C A LC U L ATI O N S
(b) Truck Travel Time Reliability (TTTR)
The reliability of freight movement can be calculated using a new metric referred to as the Truck Travel Time Reliability (TTTR) Index. The TTTR ratio is defined as the ratio of the 95th percentile travel time for trucks to the mean (50th percentile) travel time for trucks over the course of a year for five reporting periods: weekday morning peak, weekday midday, weekday afternoon peak, weekends, and overnight.
The highest of these five periods and the highest direction is the TTTR used in this process.
The thresholds for Truck Travel Time Reliability are as follows:
T R U C K T R AV E L T I M E R E L IAB I L I T Y
V E RY H I G H 2 . 0 0 +
H I G H 1 . 8 5 – 1 . 9 9
M E D I U M - H I G H 1 .7 0 – 1 . 8 4
M E D I U M 1 . 5 5 – 1 . 6 9
M E D I U M - L OW 1 . 4 0 – 1 . 5 4
L OW 1 . 0 0 – 1 . 3 9
I N F R A S TRU C T U RE C O N D ITI O N (B R I D G E AN D T U N N E L O N LY)
(a) Bridge State of Good Repair Ratings
The 2045 LRTP Project Prioritization Process uses four measures from VDOT’s State of Good Repair (SGR) maintenance prioritization program to evaluate bridge condition: Importance Factor, Condition Factor, Design Redundancy Factor, and Structure Capacity. Information on how VDOT calculates these four factors are included on VDOT’s SGR Bridge website. The scores from these four factors are weighted based on the weights used in the SGR program. These weights are 30/80 for Importance Factor, 25/80 for Condition Factor, 15/80 for Design Redundancy Factor, and 10/80 for Structure Capacity.
(b) Age of Tunnel
The age of tunnel reported is the oldest tunnel within the project limits.
(c) Last Major Repair
Provided by stakeholders (based on horizon year).
(d) Costs for Necessary Repairs/Upgrades
Provided by stakeholders.

I N T R O D U C T I O NP R O J E C T E VA LUAT I O N A N D S C O R I N G 56 D E S C R I P T I O N O F C A LC U L AT I O N SP R O J E C T E VA LUAT I O N A N D P R I O R I T I Z AT I O N 56
A PPE ND IX A: LR TP D E S C RIP TI O N O F C A LC U L ATI O N S
SYS TE M C O NTI N U IT Y AN D C O N N E C TIVIT Y
(a) Degree of Regional Impact
Regional, Multi-jurisdictional, Local. Provided by stakeholders.
(b) Project Improves Vehicular Access to Major Employment and Population Centers
Medium and High density (population and employment) TAZs were identified in GIS. Access was determined via a spatial overlay analysis using GIS. Results were combined with Regional Significance. Scoring opportunities: Yes-Regional, Yes-Multi-jurisdictional, Yes-Local, No.
(c) Resiliency
1. Project is in a vulnerable area for sea level rise/storm surge/recurrent flooding
Using the Hampton Roads Sea Level Rise (SLR) Policy of 3-feet for medium-term planning (2050-2080), a spatial overlay analysis using GIS was conducted to determine candidate project vulnerability. Additionally, using the Volpe Resilience and Disaster Recovery tool, additional flooding scenarios were analyzed: 3-ft SLR with a 10-year storm surge and 3-ft SLR with a 100-year storm-surge. Vulnerability was assessed for each inundation scenario. Results were then averaged across scenarios.
2. If vulnerable, planned improvements, design features, or adaptation strategies have been developed to address future sea level rise/storm surge/recurrent flooding
Improvements/strategies developed, No, or N/A (if not vulnerable). Provided by stakeholders.
3. If vulnerable, level of access provided by the candidate project to critical areas or facilities (e.g. hospitals, Fire-EMS, emergency shelters, dense employment area, and single entry/exit point for flood prone areas or neighborhoods)
Critical areas and facilities were identified in GIS. Level of access determined via a spatial overlay analysis using GIS. High, Medium, Low, No disruption due to flooding anticipated responses.
(d) Addresses a Gap
GIS spatial overlay analysis conducted to determine if candidate project provides improved access crossing a barrier such as a body of water or rail. Stakeholders could also indicate if candidate project addresses a social equity gap. Yes/No response.
SAF E T Y AN D S E C U R IT Y
(a) Reduction of EPDO of Fatal and Serious Injury Crashes
For Highways, Bridges/Tunnels, and Interchanges, the 2045 LRTP Project Prioritization Process uses two measures from the SMART SCALE prioritization process to evaluate safety: Reduction of EPDO of Fatal and Serious Injury Crashes and Reduction of EPDO Rate of Fatal and Serious Injury Crashes.

I N T R O D U C T I O NP R O J E C T E VA LUAT I O N A N D S C O R I N G 57 D E S C R I P T I O N O F C A LC U L AT I O N SP R O J E C T E VA LUAT I O N A N D P R I O R I T I Z AT I O N 57
A PPE ND IX A: LR TP D E S C RIP TI O N O F C A LC U L ATI O N S
Reduction of EPDO of Fatal and Serious Injury Crashes measures the weighted fatal and injury crashes expected to be reduced due to project implementation using VDOT crash modification factors. Using EPDO crashes and crash rates provide more weight to those more severe crashes by placing a weight of 85 on fatal and severe injury crashes, a weight of 10 on moderate injury crashes, and a weight of 5 on minor injury crashes. These are the same weights as are used in the SMART SCALE process. The crash data used in this analysis is from the years 2014-2018, as is the VMT for calculating the rate.
More information on how Reduction of EPDO of Fatal and Serious Injury Crashes is calculated for each project type can be found in the SMART SCALE Technical Guide.
The thresholds for Reduction of EPDO of Fatal and Serious Injury Crashes are as follows:
R E D U C T I O N O F E P D O O F FATAL AN D S E R I O U S I N J U RY C R AS H E S
V E RY H I G H 8 0 +
H I G H 6 0 – 8 0
M E D I U M - H I G H 4 0 – 6 0
M E D I U M 2 0 – 4 0
M E D I U M - L OW 0 – 2 0
L OW I N C R E A S E I N E P D O
(b) Reduction of EPDO Rate of Fatal and Serious Injury Crashes
Reduction of EPDO Rate of Fatal and Serious Injury Crashes measures the weighted fatal and injury crashes expected to be reduced per 100 million vehicle-miles of travel due to project implementation using VDOT crash modification factors. The weights and crash data used is the same as is used in the Reduction of EPDO of Fatal and Serious Injury Crashes section. More information on how Reduction of EPDO Rate of Fatal and Serious Injury Crashes is calculated for each project type can be found in the SMART SCALE Technical Guide.
The thresholds for Reduction of EPDO Rate of Fatal and Serious Injury Crashes are as follows:
R E D U C T I O N O F E P D O R AT E O F FATAL AN D S E R I O U S I N J U RY C R AS H E S
V E RY H I G H 4 0 0 +
H I G H 3 0 0 – 4 0 0
M E D I U M - H I G H 2 0 0 – 3 0 0
M E D I U M 1 0 0 – 2 0 0
M E D I U M - L OW 0 – 1 0 0
L OW I N C R E A S E I N E P D O R AT E

I N T R O D U C T I O NP R O J E C T E VA LUAT I O N A N D S C O R I N G 58 D E S C R I P T I O N O F C A LC U L AT I O N SP R O J E C T E VA LUAT I O N A N D P R I O R I T I Z AT I O N 58
A PPE ND IX A: LR TP D E S C RIP TI O N O F C A LC U L ATI O N S
(c) Improvement to Incident Management or Evacuation
Yes/No. Provided by stakeholders.
(d) Diversion Impact Due to Failure (Bridges and Tunnels Only)
The diversion impact due to failure is calculated by multiplying the Existing ADT by the detour length, plus the existing detour route VMT.
M O DAL E N H AN C E M E NT S
(a) Enhances Other Modes
0 to 3+ Enhancements. Provided by stakeholders.
(b) Provides Improved Access to Multimodal Choices
0 to 3+ Multimodal Choices. Provided by stakeholders.

I N T R O D U C T I O NP R O J E C T E VA LUAT I O N A N D S C O R I N G 59 D E S C R I P T I O N O F C A LC U L AT I O N SP R O J E C T E VA LUAT I O N A N D P R I O R I T I Z AT I O N 59
A PPE ND IX A: LR TP D E S C RIP TI O N O F C A LC U L ATI O N S
P R O J E C T U T I L I T Y – I N T E R M O DAL / F R E I G H T
B E T TE R AC C O MM O DATE S I NTE RM O DAL M OVE M E NT S
Degree of Conflict for Intermodal Movements
Conflict Free Intermodal Movements, Limited Conflict Intermodal Movements, Intermodal Movements Conflict. Provided by stakeholders.
I M PR OVE S R AI L O R VE H I C U L AR AC C E S S
Project Improves Vehicular or Rail Access to Major Employment and Population Centers
Yes and Regional, Yes but Not Regional, No. Provided by stakeholders.
TR AVE L TI M E RE LIAB I LIT Y
(a) Level of Travel Time Reliability (LOTTR)
Although roadway congestion is prevalent in many areas of Hampton Roads, congestion levels are not always the same each day. Congestion levels can vary greatly from day to day due to a variety of factors such as crashes, bad weather, special events, or work zones. Travel time reliability is defined as how steady travel times are over the course of time, as measured generally from day to day.
The measure used in the 2045 LRTP Project Prioritization Process is the Level of Travel Time Reliability (LOTTR). The LOTTR is defined as the ratio of the 80th percentile travel time to the mean (50th percentile) travel time over the course of a year for four reporting periods: weekday morning peak (6-10 am), weekday midday (10 am – 4 pm), weekday afternoon peak (4 pm – 8 pm), and weekends (6 am – 8 pm). The highest of these four periods and the highest direction is the LOTTR used in this process.
The thresholds for Level of Travel Time Reliability are as follows:
L E V E L O F T R AV E L T I M E R E L IAB I L I T Y
V E RY H I G H 1 . 5 0 +
H I G H 1 . 4 0 – 1 . 4 9
M E D I U M - H I G H 1 . 3 0 – 1 . 3 9
M E D I U M 1 . 2 0 – 1 . 2 9
M E D I U M - L OW 1 .1 0 – 1 .1 9
L OW 1 . 0 0 – 1 . 0 9

I N T R O D U C T I O NP R O J E C T E VA LUAT I O N A N D S C O R I N G 60 D E S C R I P T I O N O F C A LC U L AT I O N SP R O J E C T E VA LUAT I O N A N D P R I O R I T I Z AT I O N 60
A PPE ND IX A: LR TP D E S C RIP TI O N O F C A LC U L ATI O N S
(b) Truck Travel Time Reliability (TTTR)
The reliability of freight movement can be calculated using a new metric referred to as the Truck Travel Time Reliability (TTTR) Index. The TTTR ratio is defined as the ratio of the 95th percentile travel time for trucks to the mean (50th percentile) travel time for trucks over the course of a year for five reporting periods: weekday morning peak, weekday midday, weekday afternoon peak, weekends, and overnight. The highest of these five periods and the highest direction is the TTTR used in this process.
The thresholds for Truck Travel Time Reliability are as follows:
T R U C K T R AV E L T I M E R E L IAB I L I T Y
V E RY H I G H 2 . 0 0 +
H I G H 1 . 8 5 – 1 . 9 9
M E D I U M - H I G H 1 .7 0 – 1 . 8 4
M E D I U M 1 . 5 5 – 1 . 6 9
M E D I U M - L OW 1 . 4 0 – 1 . 5 4
L OW 1 . 0 0 – 1 . 3 9
SYS TE M C O NTI N U IT Y AN D C O N N E C TIVIT Y
(a) Degree of Regional Impact
Regional, Multi-jurisdictional, Local. Provided by stakeholders
(b) Resiliency
1. Project is in a vulnerable area for sea level rise/storm surge/recurrent flooding
Using the Hampton Roads Sea Level Rise (SLR) Policy of 3-feet for medium-term planning (2050-2080), a spatial overlay analysis using GIS was conducted to determine candidate project vulnerability. Additionally, using the Volpe Resilience and Disaster Recovery tool, additional flooding scenarios were analyzed: 3-ft SLR with a 10-year storm surge and 3-ft SLR with a 100-year storm-surge. Vulnerability was assessed for each inundation scenario. Results were then averaged across scenarios.
2. If vulnerable, planned improvements, design features, or adaptation strategies have been developed to address future sea level rise/storm surge/recurrent flooding
Improvements/strategies developed, No, or N/A (if not vulnerable). Provided by stakeholders.

I N T R O D U C T I O NP R O J E C T E VA LUAT I O N A N D S C O R I N G 61 D E S C R I P T I O N O F C A LC U L AT I O N SP R O J E C T E VA LUAT I O N A N D P R I O R I T I Z AT I O N 61
A PPE ND IX A: LR TP D E S C RIP TI O N O F C A LC U L ATI O N S
(c) Addresses a Gap
GIS spatial overlay analysis conducted to determine if candidate project provides improved access crossing a barrier such as a body of water or rail. Stakeholders could also indicate if candidate project addresses a social equity gap.
M O DAL E N H AN C E M E NT S
(a) Enhances Other Modes
0 to 3+ Enhancements. Provided by stakeholders.
(b) Provides Improved Access to Multimodal Choices
0 to 3+ Multimodal Choices. Provided by stakeholders.

I N T R O D U C T I O NP R O J E C T E VA LUAT I O N A N D S C O R I N G 62 D E S C R I P T I O N O F C A LC U L AT I O N SP R O J E C T E VA LUAT I O N A N D P R I O R I T I Z AT I O N 62
A PPE ND IX A: LR TP D E S C RIP TI O N O F C A LC U L ATI O N S
P R O J E C T U T I L I T Y – T R AN S I T
C O N G E S TI O N
Potential Trips Removed from Roadways.
Based on congestion of parallel highway facility. High, Medium, Low.
E XI S TI N G U SAG E AN D/O R PR O S P E C TIVE R I D E RS H I P
Estimated Usage/Ridership
Passengers per Day. Computed by dividing Estimated Annual Ridership (provided by stakeholders) by assumed 250 working days per year.
SYS TE M C O NTI N U IT Y AN D C O N N E C TIVIT Y
(a) Degree of Regional Impact
Regional, Multi-jurisdictional, Local. Provided by stakeholders.
(b) Project Improves Vehicular Access to Major Employment and Population Centers
Medium and High density (population and employment) TAZs were identified in GIS. Access was determined via a spatial overlay analysis using GIS. Results were combined with Regional Significance. Scoring opportunities: Yes and Regional, Yes but Not Regional, No.
(c) Resiliency
1. Project is in a vulnerable area for sea level rise/storm surge/recurrent flooding
Using the Hampton Roads Sea Level Rise (SLR) Policy of 3-feet for medium-term planning (2050-2080), a spatial overlay analysis using GIS was conducted to determine candidate project vulnerability.
2. If vulnerable, planned improvements, design features, or adaptation strategies have been developed to address future sea level rise/storm surge/recurrent flooding
Improvements/strategies developed, No, or N/A (if not vulnerable). Provided by stakeholders.
3. If vulnerable, level of access provided by the candidate project to critical areas or facilities (e.g. hospitals, Fire-EMS, emergency shelters, dense employment area, and single entry/exit point for flood prone areas or neighborhoods)
Critical areas and facilities were identified in GIS. Level of access determined via a spatial overlay analysis using GIS. High, Medium, Low, No disruption due to flooding anticipated responses.

I N T R O D U C T I O NP R O J E C T E VA LUAT I O N A N D S C O R I N G 63 D E S C R I P T I O N O F C A LC U L AT I O N SP R O J E C T E VA LUAT I O N A N D P R I O R I T I Z AT I O N 63
A PPE ND IX A: LR TP D E S C RIP TI O N O F C A LC U L ATI O N S
(d) Addresses a Gap
GIS spatial overlay analysis conducted to determine if candidate project provides improved access crossing a barrier such as a body of water or rail. Stakeholders could also indicate if candidate project addresses a social equity gap. Yes/No response.
U S E R B E N E F IT
(a) Annual Travel Time Savings
For each transit project, an average travel speed of 24 mph was assumed. This was compared to an inferior transit average travel speed of 10 mph for the same distance that would be covered by each proposed project. The resulting improvement in travel time was then doubled (to account for round trip) and multiplied by an assumed 250 working days per year; this result was then multiplied by the forecasted Passengers per Day to obtain the Annual Travel Time Savings associated with each project. To calculate Total Annual Travel Time Savings per Rider, the Annual Travel Time Savings was divided by the Estimated Annual Ridership (Annual Travel Time Savings in Hours per Year/Estimated Annual Ridership).
(b) New Project
Yes/No. Provided by stakeholders.
(c) Increased Travel Time Reliability
New o r in cr eas e d s er v ice i s as s um e d to in cr eas e t r ave l t im e r e l iab i l i t y. Ye s/No r e s p o ns e .
(d) Operating Efficiency
Assesses the project’s potential to provide significantly more cost-effective provision of service. More information on how Operating Efficiency is calculated for transit projects can be found in the DRPT Program Prioritization Technical Documentation.
(e) Accessibility (including ADA) and/or Customer Experience
Assesses the project’s potential to significantly improve a customer’s ability to access the system or a significant improvement in the ease of use of the system. More information on how Accessibility and/or Customer Experience is calculated for transit projects can be found in the DRPT Program Prioritization Technical Documentation.
(f) Safety and Security
Assesses the project’s potential to significantly improve in safety or security. More information on how Safety and Security is calculated for transit projects can be found in the DRPT Program Prioritization Technical Documentation.

I N T R O D U C T I O NP R O J E C T E VA LUAT I O N A N D S C O R I N G 64 D E S C R I P T I O N O F C A LC U L AT I O N SP R O J E C T E VA LUAT I O N A N D P R I O R I T I Z AT I O N 64
A PPE ND IX A: LR TP D E S C RIP TI O N O F C A LC U L ATI O N S
M O DAL E N H AN C E M E NT S
(a) Enhances Other Modes
0 to 3+ Enhancements. Provided by stakeholders.
(b) Provides Improved Access to Multimodal Choices
0 to 3+ Multimodal Choices. Provided by stakeholders.

I N T R O D U C T I O NP R O J E C T E VA LUAT I O N A N D S C O R I N G 65 D E S C R I P T I O N O F C A LC U L AT I O N SP R O J E C T E VA LUAT I O N A N D P R I O R I T I Z AT I O N 65
A PPE ND IX A: LR TP D E S C RIP TI O N O F C A LC U L ATI O N S
P R O J E C T U T I L I T Y – AC T I V E T R AN S P O RTAT I O N
F O RE C A S TE D U S E R D E M AN DForecasted user demand calculated based off present of adult commuters and regional commute share.
SYS TE M C O NTI N U IT Y AN D C O N N E C TIVIT Y
(a) Provides Access to Transit or Regional Activity Centers
Transit facilities and Regional Activity Centers (collected through stakeholder input) identified in GIS.
Access improvement determined via a spatial overlay analysis using GIS.
0 to 3+ C atego r ie s .
(b) Regional Significance
Regional, Multi-jurisdictional, Local. Determined using the following Active Transportation Regional Classification Matrix below (approved by ATS at its August 23, 2019 meeting).
S H A R E D - U S E PAT H , PAVE D
A N D U N PAVE D
O N E -WAY & T WO -WAY
C YC L E T R AC T S
B U F F E R E D B I K E L A N E
B I K E L A N E
OT H E R B I K E / P E D FAC I L I T I E S ( E .G . B I C YC L E B LVD,
S H A R R OW S, S I G N E D R O U T E S, PAVE D
S H O U L D E R S, E TC . )
F U T U R E R E G I O N A L
T R A I L S T U DY
PA R T O F R E G I O N A L T R A I L
S Y S T E M ( E C G , S H R T, B OAT, E R T )
R E G I O N A L R E G I O N A L R E G I O N A L S U B - R E G I O N A L S U B - R E G I O N A L R E G I O N A L
2 + LO C A L I T I E S R E G I O N A L R E G I O N A L R E G I O N A L S U B - R E G I O N A L LO C A L N/ A
1 LO C A L I T Y S U B - R E G I O N A L S U B - R E G I O N A L S U B - R E G I O N A L S U B - R E G I O N A L LO C A L N/ A

I N T R O D U C T I O NP R O J E C T E VA LUAT I O N A N D S C O R I N G 66 D E S C R I P T I O N O F C A LC U L AT I O N SP R O J E C T E VA LUAT I O N A N D P R I O R I T I Z AT I O N 66
A PPE ND IX A: LR TP D E S C RIP TI O N O F C A LC U L ATI O N S
(c) Connections to Existing Bike/Pedestrian Facilities
Yes/No. Provided by stakeholders.
(d) Elimination of Barriers or Completion of Gaps Across a Major Barrier
GIS spatial overlay analysis conducted to determine if candidate project provides improved access crossing a barrier such as a body of water, rail, or provide an alternate bicycle/pedestrian path away from a major roadway. Stakeholders could also indicate if candidate project addresses a social equity gap. Yes/No response.
(c) Resiliency
1. Project is in a vulnerable area for sea level rise/storm surge/recurrent flooding
Using the Hampton Roads Sea Level Rise (SLR) Policy of 3-feet for medium-term planning (2050-2080), a spatial overlay analysis using GIS was conducted to determine candidate project vulnerability.
2. If vulnerable, planned improvements, design features, or adaptation strategies have been developed to address future sea level rise/storm surge/recurrent flooding
Improvements/strategies developed, No, or N/A (if not vulnerable). Provided by stakeholders.
3. If vulnerable, level of access provided by the candidate project to critical areas or facilities (e.g. hospitals, Fire-EMS, emergency shelters, dense employment area, and single entry/exit point for flood prone areas or neighborhoods)
Critical areas and facilities were identified in GIS. Level of access determined via a spatial overlay analysis using GIS. High, Medium, Low, No disruption due to flooding anticipated responses.
SAF E T Y
(a) Crash History
Average Number of Bike/Ped Crashes per Year (2014-2018).
(b) Level of Separation/Network Quality
Responses: Physically Separated, Visually Separated – Additional Separation Not Needed, Visually Separated – Additional Separation Needed, No Separation – Separation Needed. Provided by stakeholders.
(c) Associated with Safe Routes to School
Yes/No. Provided by stakeholders.

I N T R O D U C T I O NP R O J E C T E VA LUAT I O N A N D S C O R I N G 67 D E S C R I P T I O N O F C A LC U L AT I O N SP R O J E C T E VA LUAT I O N A N D P R I O R I T I Z AT I O N 67
A PPE ND IX A: LR TP D E S C RIP TI O N O F C A LC U L ATI O N S
M O DAL E N H AN C E M E NT S
(a) Enhances Other Modes
0 to 3+ Enhancements. Provided by stakeholders.
(b) Project Enhances First Mile/Last Mile Connections
Yes/No. Provided by stakeholders.
(c) Provides Improved Access to Multimodal Choices
0 to 3+ Multimodal Choices. Provided by stakeholders.

I N T R O D U C T I O NP R O J E C T E VA LUAT I O N A N D S C O R I N G 68 D E S C R I P T I O N O F C A LC U L AT I O N SP R O J E C T E VA LUAT I O N A N D P R I O R I T I Z AT I O N 68
A PPE ND IX A: LR TP D E S C RIP TI O N O F C A LC U L ATI O N S
E C O N O M I C V I TAL I T Y – R OADWAYS
TR AVE L TI M E AN D D E L AY I M PAC T S
(a) Total Forecasted Reduction in Regional Travel Time
Total forecasted reduction in regional travel time is obtained from the regional travel demand model and is based on the total regional travel time savings (in vehicle hours) between build and no build conditions for each scenario. Scenario results in total forecasted reduction in regional travel time were averaged.
The thresholds for total forecasted reduction in regional travel time are as follows:
F O R E C AS T E D R E D U C T I O N I N R E G I O NAL T R AV E L T I M E ( I N V E H I C L E H O U R S )
V E RY H I G H > 5 , 0 0 0
H I G H 3 ,7 5 0 – 4 , 9 9 9
M E D I U M 2 . 5 0 0 – 3 ,74 9
L OW 1 , 2 5 0 – 2 , 4 9 9
V E RY L OW 0 – 1 , 24 9
N O N E I N C R E A S E I N R E G I O N A L T R AVE L T I M E
(b) Forecasted Reduction in Regional Delay
Forecasted reduction in regional delay is obtained from the regional travel demand model and is based on the difference between congested and free flow travel times between build and no build conditions for each scenario. Scenario results in forecasted reduction in regional delay were averaged.
The thresholds for total forecasted reduction in regional travel time are as follows:
F O R E C AS T E D R E D U C T I O N I N R E G I O NAL D E L AY
V E RY H I G H > 3 5
H I G H 2 5 – 3 4 . 9
M E D I U M 1 5 – 24 . 9
L OW 5 – 1 4 . 9
V E RY L OW 0 – 4 . 9
N O N E < 0

I N T R O D U C T I O NP R O J E C T E VA LUAT I O N A N D S C O R I N G 69 D E S C R I P T I O N O F C A LC U L AT I O N SP R O J E C T E VA LUAT I O N A N D P R I O R I T I Z AT I O N 69
L AB O R M ARKE T AC C E S S
Increases Access for High Density Employment Areas
Based on forecasted future employment using the HRTPO Board approved 2045 employment projections for the Baseline and the three Greater Growth employment assumptions. Densities were calculated per square mile for each scenario.
Thresholds were determined using natural breaks.
E M P L OY M E N T D E N S I T Y( TA Z F O R E C AS T E D E M P L OY M E N T/ S Q UAR E M I L E )
H I G H 7, 8 0 0 . 0 1 +
M E D I U M 1 , 4 0 1 – 7,78 0
L OW 0 . 0 0 – 1 , 4 0 0
Access to High Density Employment TAZs is determined using a spatial overlay analysis, applying the following buffer:
AC C E S S B U F F E R
D I R E C T < = 0 . 2 5 M I L E S
N E AR 0 . 2 5 – 1 M I L E
L I T T L E / N O AC C E S S > 1 M I L E
AD D RE S S E S TH E N E E D S O F BA S I C S E C T O R I N D U S TR I E S
(a) Improves Access to Major Military Bases
“Major” based on DOD report (“Base Structure Report”, DOD, 2014). Nine (9) facilities have much higher employment than the rest.
Major Military Facilities:
• Dam Neck
• Fort Eustis
• Fort Story
• Langley AFB
• Little Creek Naval Amphibious Base
• Naval Medical Center Portsmouth
• Norfolk Naval Shipyard
• Norfolk Naval Base
• Oceana Naval Air Station
A PPE ND IX A: LR TP D E S C RIP TI O N O F C A LC U L ATI O N S

I N T R O D U C T I O NP R O J E C T E VA LUAT I O N A N D S C O R I N G 70 D E S C R I P T I O N O F C A LC U L AT I O N SP R O J E C T E VA LUAT I O N A N D P R I O R I T I Z AT I O N 70
A PPE ND IX A: LR TP D E S C RIP TI O N O F C A LC U L ATI O N S
Access improvement determined via a spatial overlay analysis using GIS, applying the following buffer:
AC C E S S B U F F E R
D I R E C T < = 0 . 2 5 M I L E S
N E AR 0 . 2 5 – 5 M I L E S
L I T T L E / N O AC C E S S > 5 M I L E S
Points assigned based on the following matrix:
AC C E S S N O N - M I L I TARY R OAD R OAD S E RV I N G T H E M I L I TARY S T R AH N E T
D I R E C T M E D I U M H I G H H I G H
N E AR LOW M E D I U M M E D I U M
L I T T L E / N O AC C E S S LOW LOW LOW
(b) Military/STRAHNET
Based on whether the roadway is part of the Strategic Highway Network (STRAHNET) or is a roadway serving the military. Roadways serving the military were determined in the HRTPO Military Transportation Needs Study.
(c) Improves Access to Major Tourist Areas
Major Tourist Areas: Oceanfront, Historic Triangle (Williamsburg, Jamestown, Yorktown), and Busch Gardens.
Access improvement determined via a spatial overlay analysis using GIS, applying the following buffer:
AC C E S S B U F F E R
D I R E C T < = 0 . 2 5 M I L E S
N E AR 0 . 2 5 – 5 M I L E S
L I T T L E / N O AC C E S S > 5 M I L E S
Points assigned based on the following matrix:
AC C E S S L O C AL P R I N C I PAL I N T E R S TAT E
D I R E C T M E D I U M H I G H H I G H
N E AR LOW M E D I U M M E D I U M
L I T T L E / N O AC C E S S LOW LOW LOW

I N T R O D U C T I O NP R O J E C T E VA LUAT I O N A N D S C O R I N G 71 D E S C R I P T I O N O F C A LC U L AT I O N SP R O J E C T E VA LUAT I O N A N D P R I O R I T I Z AT I O N 71
A PPE ND IX A: LR TP D E S C RIP TI O N O F C A LC U L ATI O N S
(d) Increases Access to Port Facilities
This measure reflects truck access based on the total amount of truck hours of delay per mile during the peak periods. The direction and peak period with the highest amount of truck delay is used for this measure. For interchange/intersection projects, the leg of the interchange/intersection with the highest truck delay per mile value is used.
Points are assigned based on the following thresholds:
P O RT AC C E S S ( T R U C K H O U R S O F D E L AY P E R M I L E D U R I N G P E AK P E R I O D S )
V E RY H I G H > 1 . 2 5 H O U R S P E R M I L E
H I G H 1 . 0 0 – 1 . 24 H O U R S P E R M I L E
M E D I U M - H I G H 0 .7 5 - 0 . 9 9 H O U R S P E R M I L E
M E D I U M 0 . 5 0 - 0 .74 H O U R S P E R M I L E
L OW 0 . 2 5 - 0 . 4 9 H O U R S P E R M I L E
V E RY L OW < 0 . 2 5 H O U R S P E R M I L E
(e) Improved Access to Truck Zones
Truck zones are a feature in the regional travel demand model and are defined as zones that contain a concentration of industrial or warehousing land uses or a specific truck generating activity, such as a truck stop, an intermodal transfer facility, or a trucking firm office. Truck Zones are anticipated to have a rate of truck trip ends per employee higher than other zones. Truck Zones have been identified through a review of satellite photos or local knowledge, coordinated with staff from the Virginia Port Authority.
Access improvement determined via a spatial overlay analysis using GIS, applying the following buffer:
AC C E S S B U F F E R
D I R E C T < = 0 . 2 5 M I L E S
N E AR 0 . 2 5 – 5 M I L E S
L I T T L E / N O AC C E S S > 5 M I L E S
Points assigned based on the following matrix:
AC C E S S L O C AL P R I N C I PAL I N T E R S TAT E
D I R E C T M E D I U M H I G H H I G H
N E AR LOW M E D I U M M E D I U M
L I T T L E / N O AC C E S S LOW LOW LOW

I N T R O D U C T I O NP R O J E C T E VA LUAT I O N A N D S C O R I N G 72 D E S C R I P T I O N O F C A LC U L AT I O N SP R O J E C T E VA LUAT I O N A N D P R I O R I T I Z AT I O N 72
A PPE ND IX A: LR TP D E S C RIP TI O N O F C A LC U L ATI O N S
I N C RE A S E D O PP O R T U N IT Y
(a) Provides New or Increased Access Opportunities
Based on change in capacity or reliability:
• New al ig nm ent : New O p p o r tun i t y
• Widening: Increased Opportunity
• Removal of Obstacle (e.g. rail crossing): Increased Opportunity
• Improvements without additional capacity (e.g. bridge replacement or road reconstruction): No Additional Opportunity
(b) Supports Plans for Future Growth
Based on “Land Use/Future Development Compatibility” in Project Viability component:
• For “Compatible and Officially Documented”: Yes, supports plans for future growth
• For “Compatible and Not Officially Documented”: No, does not support plans for future growth, unless stakeholder input provides otherwise, with documentation
• “Not Compatible”: No, does not support plans for future growth
(c) Provides Access to Institutions of Higher Education or Work Force Development Sites
Institutions of Higher Education and Work Force Development Sites were identified in GIS. Data was obtained from HRGEO and includes colleges, universities, professional, technical, and trade schools. HRTPO staff also included Virginia Career Works workforce development sites.
Access improvement determined via a spatial overlay analysis using GIS, applying the following buffer:
AC C E S S B U F F E R
D I R E C T < = 0 . 2 5 M I L E S
N E AR 0 . 2 5 – 1 M I L E
L I T T L E / N O AC C E S S > 1 M I L E
Points assigned based on the following matrix:
AC C E S S L O C AL P R I N C I PAL I N T E R S TAT E
D I R E C T M E D I U M H I G H H I G H
N E AR LOW M E D I U M M E D I U M
L I T T L E / N O AC C E S S LOW LOW LOW

I N T R O D U C T I O NP R O J E C T E VA LUAT I O N A N D S C O R I N G 73 D E S C R I P T I O N O F C A LC U L AT I O N SP R O J E C T E VA LUAT I O N A N D P R I O R I T I Z AT I O N 73
A PPE ND IX A: LR TP D E S C RIP TI O N O F C A LC U L ATI O N S
(d) Provides Access to Urban Development Areas/Governor’s Opportunity Zones
Urban Development Areas (UDA) and Governor’s Opportunity Zones (GOZ) were identified in GIS. Data was obtained from the Virginia Economic Development Partnership on UDAs and GOZs.
Access improvement determined via a spatial overlay analysis using GIS, applying the following buffer:
AC C E S S B U F F E R
D I R E C T < = 0 . 2 5 M I L E S
N E AR 0 . 2 5 – 1 M I L E
L I T T L E / N O AC C E S S > 1 M I L E
Po int s as s ig n e d b as e d o n th e fo l low ing mat r i x :
AC C E S S L O C AL P R I N C I PAL I N T E R S TAT E
D I R E C T M E D I U M H I G H H I G H
N E AR LOW M E D I U M M E D I U M
L I T T L E / N O AC C E S S LOW LOW LOW
E C O N O M I C D I S TRE S S FAC T O RS
(a) Provides Access to Low-Income Areas
Low-Income Areas were identified using 2012-2016 data from the American Community Survey (ACS) to identify the location and concentration of households below the poverty level at the Census Block Group level. Census Block Groups that contained low income households greater than the regional average were identified as Low-Income Areas.
Access improvement determined via a spatial overlay analysis using GIS, applying the following buffer:
AC C E S S B U F F E R
D I R E C T C A N D I DAT E B U F F E R I N T E R S E C T S WI T H LOW I N C O M E A R E A
N E AR < 0 . 5 M I L E S
L I T T L E / N O AC C E S S > 0 . 5 M I L E SPoints assigned based on the following matrix:

I N T R O D U C T I O NP R O J E C T E VA LUAT I O N A N D S C O R I N G 74 D E S C R I P T I O N O F C A LC U L AT I O N SP R O J E C T E VA LUAT I O N A N D P R I O R I T I Z AT I O N 74
A PPE ND IX A: LR TP D E S C RIP TI O N O F C A LC U L ATI O N S
AC C E S S L O C AL P R I N C I PAL I N T E R S TAT E
D I R E C T M E D I U M H I G H H I G H
N E AR LOW M E D I U M M E D I U M
L I T T L E / N O AC C E S S LOW LOW LOW
(b) Provides Access to Areas with High Unemployment
High Unemployment Areas were identified using 2012-2016 data from the American Community Survey (ACS) to identify the location and concentration of high unemployment at the Census Block Group level. Census Block Groups that contained low unemployment greater than the regional average were identified as High Unemployment Areas.
Access improvement determined via a spatial overlay analysis using GIS, applying the following buffer:
AC C E S S B U F F E R
D I R E C T C A N D I DAT E B U F F E R I N T E R S E C T S WI T H LOW I N C O M E A R E A
N E AR < 0 . 5 M I L E S
L I T T L E / N O AC C E S S > 0 . 5 M I L E S
Points assigned based on the following matrix:
AC C E S S L O C AL P R I N C I PAL I N T E R S TAT E
D I R E C T M E D I U M H I G H H I G H
N E AR LOW M E D I U M M E D I U M
L I T T L E / N O AC C E S S LOW LOW LOW

I N T R O D U C T I O NP R O J E C T E VA LUAT I O N A N D S C O R I N G 75 D E S C R I P T I O N O F C A LC U L AT I O N SP R O J E C T E VA LUAT I O N A N D P R I O R I T I Z AT I O N 75
A PPE ND IX A: LR TP D E S C RIP TI O N O F C A LC U L ATI O N S
E C O N O M I C V I TAL I T Y – I N T E R M O DAL / F R E I G H T
TR AVE L TI M E AN D D E L AY I M PAC T S
(a) Total Forecasted Reduction in Regional Travel Time
Total forecasted reduction in regional travel time is obtained from the regional travel demand model and is based on the total regional travel time savings (in vehicle hours) between build and no build conditions for each scenario. Scenario results in total forecasted reduction in regional travel time were averaged.
The thresholds for total forecasted reduction in regional travel time are as follows:
F O R E C AS T E D R E D U C T I O N I N R E G I O NAL T R AV E L T I M E ( I N V E H I C L E H O U R S )
V E RY H I G H > 5 , 0 0 0
H I G H 3 ,7 5 0 – 4 , 9 9 9
M E D I U M 2 . 5 0 0 – 3 ,74 9
L OW 1 , 2 5 0 – 2 , 4 9 9
V E RY L OW 0 – 1 , 24 9
N O N E I N C R E A S E I N R E G I O N A L T R AVE L T I M E
(b) Forecasted Reduction In Regional Delay
Forecasted reduction in regional delay is obtained from the regional travel demand model and is based on the difference between congested and free flow travel times between build and no build conditions for each scenario. Scenario results in forecasted reduction in regional delay were averaged.
The thresholds for total forecasted reduction in regional travel time are as follows:
F O R E C AS T E D R E D U C T I O N I N R E G I O NAL D E L AY
V E RY H I G H > 3 5
H I G H 2 5 – 3 4 . 9
M E D I U M 1 5 – 24 . 9
L OW 5 – 1 4 . 9
V E RY L OW 0 – 4 . 9
N O N E < 0

I N T R O D U C T I O NP R O J E C T E VA LUAT I O N A N D S C O R I N G 76 D E S C R I P T I O N O F C A LC U L AT I O N SP R O J E C T E VA LUAT I O N A N D P R I O R I T I Z AT I O N 76
A PPE ND IX A: LR TP D E S C RIP TI O N O F C A LC U L ATI O N S
L AB O R M ARKE T AC C E S S
(a) Impact on Truck Movements
This measure reflects truck access based on the total amount of truck hours of delay per mile during the peak periods. The direction and peak period with the highest amount of truck delay is used for this measure. For interchange/intersection type intermodal projects, the leg of the interchange/intersection with the highest truck delay per mile value is used.
Points are assigned based on the following thresholds:
P O RT AC C E S S ( T R U C K H O U R S O F D E L AY P E R M I L E D U R I N G P E AK P E R I O D S )
V E RY H I G H > 1 . 2 5 H O U R S P E R M I L E
H I G H 1 . 0 0 – 1 . 24 H O U R S P E R M I L E
M E D I U M - H I G H 0 .7 5 - 0 . 9 9 H O U R S P E R M I L E
M E D I U M 0 . 5 0 - 0 .74 H O U R S P E R M I L E
L OW 0 . 2 5 - 0 . 4 9 H O U R S P E R M I L E
V E RY L OW < 0 . 2 5 H O U R S P E R M I L E
(b) Increases Access for High Density Employment Areas
Based on forecasted future employment using the HRTPO Board approved 2045 employment projections for the Baseline and the three Greater Growth employment assumptions. Densities were calculated per square mile for each scenario.
Thresholds were determined using natural breaks.
E M P L OY M E N T D E N S I T Y( TA Z F O R E C AS T E D E M P L OY M E N T/ S Q UAR E M I L E )
H I G H 7, 8 0 0 . 0 1 +
M E D I U M 1 , 4 0 1 – 7,78 0
L OW 0 . 0 0 – 1 , 4 0 0
Access to High Density Employment TAZs is determined using a spatial overlay analysis, applying the following buffer:
AC C E S S B U F F E R
D I R E C T < = 0 . 2 5 M I L E S
N E AR 0 . 2 5 – 1 M I L E
L I T T L E / N O AC C E S S > 1 M I L E

I N T R O D U C T I O NP R O J E C T E VA LUAT I O N A N D S C O R I N G 77 D E S C R I P T I O N O F C A LC U L AT I O N SP R O J E C T E VA LUAT I O N A N D P R I O R I T I Z AT I O N 77
A PPE ND IX A: LR TP D E S C RIP TI O N O F C A LC U L ATI O N S
I M PR OVE S I NTE R AC TI O N B E T W E E N M O D E S O F TR AVE L F O R BA S I C S E C T O R I N D U S TR I E S
(a) Increases Access to the Port
Port facilities were identified in GIS and a spatial overlay analysis was conducted to determine if candidate project would increase direct access. Yes/No response.
(b) Improved Access to Truck Zones
Truck zones are a feature in the regional travel demand model and are defined as zones that contain a concentration of industrial or warehousing land uses or a specific truck generating activity, such as a truck stop, an intermodal transfer facility, or a trucking firm office. Truck Zones are anticipated to have a rate of truck trip ends per employee higher than other zones. Truck Zones have been identified through a review of satellite photos or local knowledge, coordinated with staff from the Virginia Port Authority
Access improvement determined via a spatial overlay analysis using GIS, applying the following buffer:
AC C E S S B U F F E R
D I R E C T < = 0 . 2 5 M I L E S
N E AR 0 . 2 5 – 5 M I L E S
L I T T L E / N O AC C E S S > 5 M I L E S
Points assigned based on the following matrix:
AC C E S S L O C AL P R I N C I PAL I N T E R S TAT E
D I R E C T M E D I U M H I G H H I G H
N E AR LOW M E D I U M M E D I U M
L I T T L E / N O AC C E S S LOW LOW LOW
(c) Improves Flow of Rail
Based on whether facility will improve mobility of rail. Mobility improvement of rail determined using project description and spatial overlay analysis. A 250-foot tolerance was used to establish a buffer around existing rail. Yes/No response.

I N T R O D U C T I O NP R O J E C T E VA LUAT I O N A N D S C O R I N G 78 D E S C R I P T I O N O F C A LC U L AT I O N SP R O J E C T E VA LUAT I O N A N D P R I O R I T I Z AT I O N 78
A PPE ND IX A: LR TP D E S C RIP TI O N O F C A LC U L ATI O N S
(d) Increases Access to Airports
Airports were identified in GIS and a spatial overlay analysis was conducted applying the following buffer:
AC C E S S B U F F E R
D I R E C T < = 0 . 2 5 M I L E S
N E AR 0 . 2 5 – 5 M I L E S
L I T T L E / N O AC C E S S > 5 M I L E S
Points assigned based on the following matrix:
AC C E S S L O C AL P R I N C I PAL I N T E R S TAT E
D I R E C T M E D I U M H I G H H I G H
N E AR LOW M E D I U M M E D I U M
L I T T L E / N O AC C E S S LOW LOW LOW
I N C RE A S E D O PP O R T U N IT Y
(a) Provides New or Increased Access Opportunities
Based on change in capacity or reliability:
• New alignment: New Access
• Widening: Expanded Capability
• Removal of Obstacle (e.g. rail crossing): Expanded Capability
(b) Supports Plans for Future Growth
Based on “Land Use/Future Development Compatibility” in Project Viability component:
• For “Compatible and Officially Documented”: Yes, supports plans for future growth
• For “Compatible and Not Officially Documented”: No, does not support plans for future growth, unless stakeholder input provides otherwise, with documentation
• “Not Compatible”: No, does not support plans for future growth

I N T R O D U C T I O NP R O J E C T E VA LUAT I O N A N D S C O R I N G 79 D E S C R I P T I O N O F C A LC U L AT I O N SP R O J E C T E VA LUAT I O N A N D P R I O R I T I Z AT I O N 79
A PPE ND IX A: LR TP D E S C RIP TI O N O F C A LC U L ATI O N S
(c) Improves Access to Urban Development Areas/Governor’s Opportunity Zones
Urban Development Areas (UDA) and Governor’s Opportunity Zones (GOZ) were identified in GIS. Data was obtained from the Virginia Economic Development Partnership on UDAs and GOZs.
Access improvement determined via a spatial overlay analysis using GIS, applying the following buffer:
AC C E S S B U F F E R
D I R E C T < = 0 . 2 5 M I L E S
N E AR 0 . 2 5 – 1 M I L E
L I T T L E / N O AC C E S S > 1 M I L E
Points assigned based on the following matrix:
AC C E S S L O C AL P R I N C I PAL I N T E R S TAT E
D I R E C T M E D I U M H I G H H I G H
N E AR LOW M E D I U M M E D I U M
L I T T L E / N O AC C E S S LOW LOW LOW

I N T R O D U C T I O NP R O J E C T E VA LUAT I O N A N D S C O R I N G 80 D E S C R I P T I O N O F C A LC U L AT I O N SP R O J E C T E VA LUAT I O N A N D P R I O R I T I Z AT I O N 80
A PPE ND IX A: LR TP D E S C RIP TI O N O F C A LC U L ATI O N S
E C O N O M I C V I TAL I T Y – T R AN S I T
L AB O R M ARKE T AC C E S S
(a) Increases Access for Major Employment Centers
TAZs within ½ mile of transit alignment identified. HRTPO Board approved 2045 forecasted total employment for the Baseline and three Greater Growth scenarios were summed for these TAZs.
Points awarded on a sliding scale 0-20 points:
20 Points (max): Total Employment >= 250,000
0 Points: Total Employment <=75,000
(b) Increases Frequency of Service
New LRT, Fixed Guideway, and Ferry projects automatically increase frequency of transit service; bus transfer stations do not.
AD D RE S S E S TH E N E E D S O F BA S I C S E C T O R I N D U S TR I E S
(a) Improves Access to Major Military Bases
“Major” based on DOD report (“Base Structure Report”, DOD, 2014). Nine (9) facilities have much higher employment than the rest.
• Major Military Facilities:
• Dam Neck
• Fort Eustis
• Fort Story
• Langley AFB
• Little Creek Naval Amphibious Base
• Naval Medical Center Portsmouth
• Norfolk Naval Shipyard
• Norfolk Naval Base
• Oceana Naval Air Station

I N T R O D U C T I O NP R O J E C T E VA LUAT I O N A N D S C O R I N G 81 D E S C R I P T I O N O F C A LC U L AT I O N SP R O J E C T E VA LUAT I O N A N D P R I O R I T I Z AT I O N 81
A PPE ND IX A: LR TP D E S C RIP TI O N O F C A LC U L ATI O N S
Access improvement determined via a spatial overlay analysis using GIS, applying the following buffer and point allocation:
AC C E S S B U F F E R P O I N T S
D I R E C T < = 0 . 2 5 M I L E S 1 0 P O I N T S
N E AR 0 . 2 5 – 5 M I L E S 5 P O I N T S
L I T T L E / N O AC C E S S > 5 M I L E S 0 P O I N T S
(b) Improves Access to Major Tourist Areas
Major Tourist Areas: Oceanfront, Historic Triangle (Williamsburg, Jamestown, Yorktown), and Busch Gardens.
Access improvement determined via a spatial overlay analysis using GIS, applying the following buffer and point allocation:
AC C E S S B U F F E R P O I N T S
D I R E C T < = 0 . 2 5 M I L E S 1 0 P O I N T S
N E AR 0 . 2 5 – 5 M I L E S 5 P O I N T S
L I T T L E / N O AC C E S S > 5 M I L E S 0 P O I N T S
I N C RE A S E D O PP O R T U N IT Y
(a) Provides New Access to the Network
New LRT, Fixed Guideway, and Ferry projects provide new access; transfer stations do not.
(b) Supported by Plans for Increased Density and Economic Activity
Stakeholder input: Designated Strategic Growth Area, Planning Supports Increased Density
(c) Provides Access to Institutions of Higher Education or Work Force Development Sites
Institutions of Higher Education and Work Force Development Sites were identified in GIS. Data was obtained from HRGEO and includes colleges, universities, professional, technical, and trade schools. HRTPO staff also included Virginia Career Works workforce development sites.
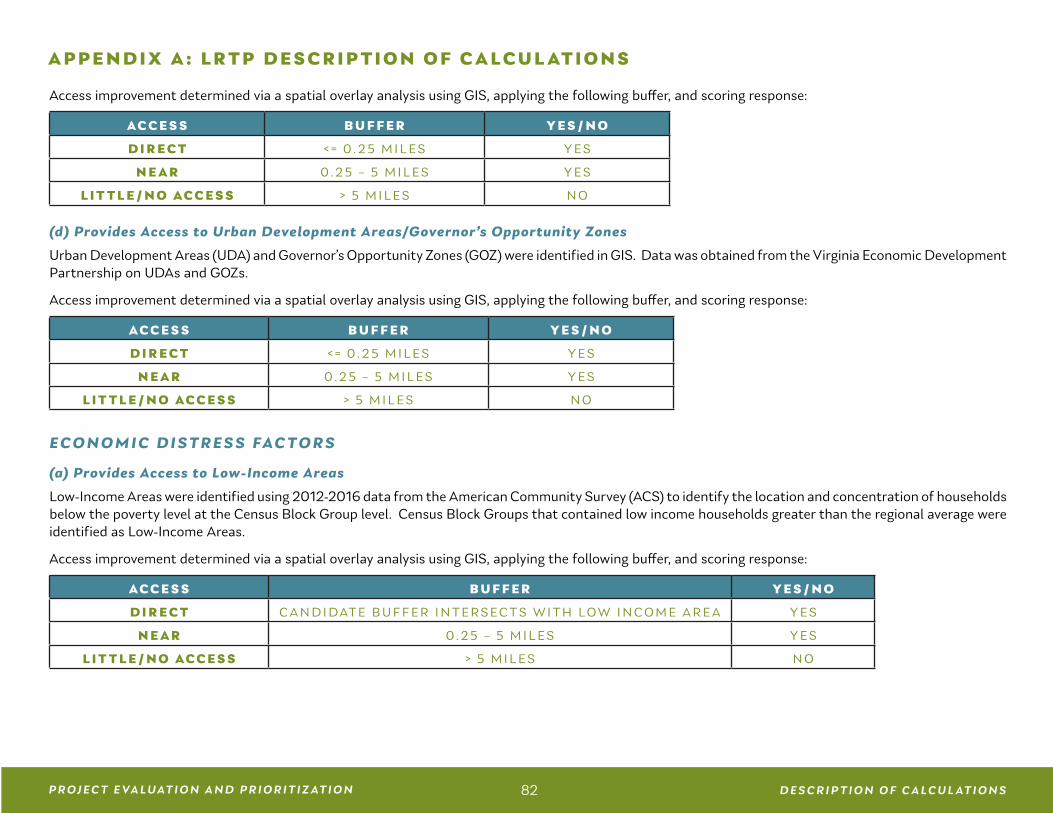
I N T R O D U C T I O NP R O J E C T E VA LUAT I O N A N D S C O R I N G 82 D E S C R I P T I O N O F C A LC U L AT I O N SP R O J E C T E VA LUAT I O N A N D P R I O R I T I Z AT I O N 82
A PPE ND IX A: LR TP D E S C RIP TI O N O F C A LC U L ATI O N S
Access improvement determined via a spatial overlay analysis using GIS, applying the following buffer, and scoring response:
AC C E S S B U F F E R Y E S / N O
D I R E C T < = 0 . 2 5 M I L E S Y E S
N E AR 0 . 2 5 – 5 M I L E S Y E S
L I T T L E / N O AC C E S S > 5 M I L E S N O
(d) Provides Access to Urban Development Areas/Governor’s Opportunity Zones
Urban Development Areas (UDA) and Governor’s Opportunity Zones (GOZ) were identified in GIS. Data was obtained from the Virginia Economic Development Partnership on UDAs and GOZs.
Access improvement determined via a spatial overlay analysis using GIS, applying the following buffer, and scoring response:
AC C E S S B U F F E R Y E S / N O
D I R E C T < = 0 . 2 5 M I L E S Y E S
N E AR 0 . 2 5 – 5 M I L E S Y E S
L I T T L E / N O AC C E S S > 5 M I L E S N O
E C O N O M I C D I S TRE S S FAC T O RS
(a) Provides Access to Low-Income Areas
Low-Income Areas were identified using 2012-2016 data from the American Community Survey (ACS) to identify the location and concentration of households below the poverty level at the Census Block Group level. Census Block Groups that contained low income households greater than the regional average were identified as Low-Income Areas.
Access improvement determined via a spatial overlay analysis using GIS, applying the following buffer, and scoring response:
AC C E S S B U F F E R Y E S / N O
D I R E C T C A N D I DAT E B U F F E R I N T E R S E C T S WI T H LOW I N C O M E A R E A Y E S
N E AR 0 . 2 5 – 5 M I L E S Y E S
L I T T L E / N O AC C E S S > 5 M I L E S N O

I N T R O D U C T I O NP R O J E C T E VA LUAT I O N A N D S C O R I N G 83 D E S C R I P T I O N O F C A LC U L AT I O N SP R O J E C T E VA LUAT I O N A N D P R I O R I T I Z AT I O N 83
A PPE ND IX A: LR TP D E S C RIP TI O N O F C A LC U L ATI O N S
(b) Provides Access to Areas with High Unemployment
High Unemployment Areas were identified using 2012-2016 data from the American Community Survey (ACS) to identify the location and concentration of high unemployment at the Census Block Group level. Census Block Groups that contained low unemployment greater than the regional average were identified as High Unemployment Areas.
Access improvement determined via a spatial overlay analysis using GIS, applying the following buffer, and scoring response:
AC C E S S B U F F E R Y E S / N O
D I R E C T C A N D I DAT E B U F F E R I N T E R S E C T S WI T H LOW I N C O M E A R E A Y E S
N E AR 0 . 2 5 – 5 M I L E S Y E S
L I T T L E / N O AC C E S S > 5 M I L E S N O
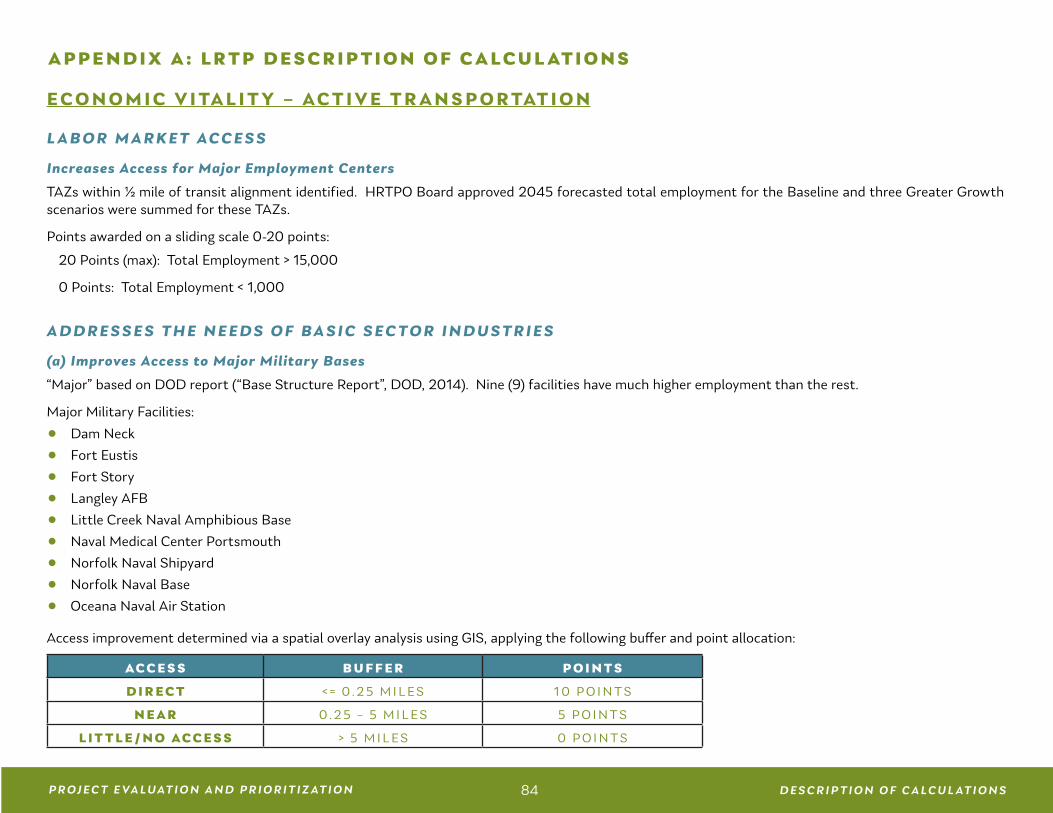
I N T R O D U C T I O NP R O J E C T E VA LUAT I O N A N D S C O R I N G 84 D E S C R I P T I O N O F C A LC U L AT I O N SP R O J E C T E VA LUAT I O N A N D P R I O R I T I Z AT I O N 84
A PPE ND IX A: LR TP D E S C RIP TI O N O F C A LC U L ATI O N S
E C O N O M I C V I TAL I T Y – AC T I V E T R AN S P O RTAT I O N
L AB O R M ARKE T AC C E S S
Increases Access for Major Employment Centers
TAZs within ½ mile of transit alignment identified. HRTPO Board approved 2045 forecasted total employment for the Baseline and three Greater Growth scenarios were summed for these TAZs.
Points awarded on a sliding scale 0-20 points:
20 Points (max): Total Employment > 15,000
0 Points: Total Employment < 1,000
AD D RE S S E S TH E N E E D S O F BA S I C S E C T O R I N D U S TR I E S
(a) Improves Access to Major Military Bases
“Major” based on DOD report (“Base Structure Report”, DOD, 2014). Nine (9) facilities have much higher employment than the rest.
Major Military Facilities:
• Dam Neck
• Fort Eustis
• Fort Story
• Langley AFB
• Little Creek Naval Amphibious Base
• Naval Medical Center Portsmouth
• Norfolk Naval Shipyard
• Norfolk Naval Base
• Oceana Naval Air Station
Access improvement determined via a spatial overlay analysis using GIS, applying the following buffer and point allocation:
AC C E S S B U F F E R P O I N T S
D I R E C T < = 0 . 2 5 M I L E S 1 0 P O I N T S
N E AR 0 . 2 5 – 5 M I L E S 5 P O I N T S
L I T T L E / N O AC C E S S > 5 M I L E S 0 P O I N T S
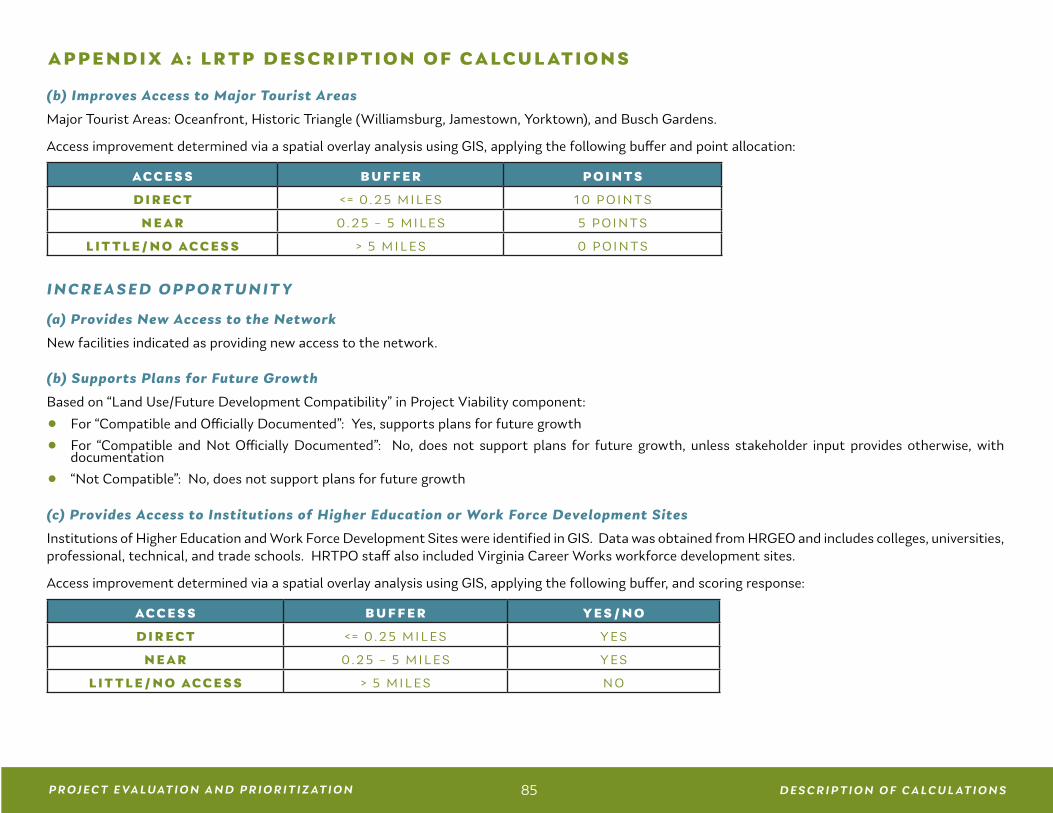
I N T R O D U C T I O NP R O J E C T E VA LUAT I O N A N D S C O R I N G 85 D E S C R I P T I O N O F C A LC U L AT I O N SP R O J E C T E VA LUAT I O N A N D P R I O R I T I Z AT I O N 85
A PPE ND IX A: LR TP D E S C RIP TI O N O F C A LC U L ATI O N S
(b) Improves Access to Major Tourist Areas
Major Tourist Areas: Oceanfront, Historic Triangle (Williamsburg, Jamestown, Yorktown), and Busch Gardens.
Access improvement determined via a spatial overlay analysis using GIS, applying the following buffer and point allocation:
AC C E S S B U F F E R P O I N T S
D I R E C T < = 0 . 2 5 M I L E S 1 0 P O I N T S
N E AR 0 . 2 5 – 5 M I L E S 5 P O I N T S
L I T T L E / N O AC C E S S > 5 M I L E S 0 P O I N T S
I N C RE A S E D O PP O R T U N IT Y
(a) Provides New Access to the Network
New facilities indicated as providing new access to the network.
(b) Supports Plans for Future Growth
Based on “Land Use/Future Development Compatibility” in Project Viability component:
• For “Compatible and Officially Documented”: Yes, supports plans for future growth
• For “Compatible and Not Officially Documented”: No, does not support plans for future growth, unless stakeholder input provides otherwise, with documentation
• “Not Compatible”: No, does not support plans for future growth
(c) Provides Access to Institutions of Higher Education or Work Force Development Sites
Institutions of Higher Education and Work Force Development Sites were identified in GIS. Data was obtained from HRGEO and includes colleges, universities, professional, technical, and trade schools. HRTPO staff also included Virginia Career Works workforce development sites.
Access improvement determined via a spatial overlay analysis using GIS, applying the following buffer, and scoring response:
AC C E S S B U F F E R Y E S / N O
D I R E C T < = 0 . 2 5 M I L E S Y E S
N E AR 0 . 2 5 – 5 M I L E S Y E S
L I T T L E / N O AC C E S S > 5 M I L E S N O

I N T R O D U C T I O NP R O J E C T E VA LUAT I O N A N D S C O R I N G 86 D E S C R I P T I O N O F C A LC U L AT I O N SP R O J E C T E VA LUAT I O N A N D P R I O R I T I Z AT I O N 86
A PPE ND IX A: LR TP D E S C RIP TI O N O F C A LC U L ATI O N S
(d) Provides Access to Urban Development Areas/Governor’s Opportunity Zones
Urban Development Areas (UDA) and Governor’s Opportunity Zones (GOZ) were identified in GIS. Data was obtained from the Virginia Economic Development Partnership on UDAs and GOZs.
Access improvement determined via a spatial overlay analysis using GIS, applying the following buffer, and scoring response:
AC C E S S B U F F E R Y E S / N O
D I R E C T < = 0 . 2 5 M I L E S Y E S
N E AR 0 . 2 5 – 5 M I L E S Y E S
L I T T L E / N O AC C E S S > 5 M I L E S N O
E C O N O M I C D I S TRE S S FAC T O RS
(a) Provides Access to Low-Income Areas
Low-Income Areas were identified using 2012-2016 data from the American Community Survey (ACS) to identify the location and concentration of households below the poverty level at the Census Block Group level. Census Block Groups that contained low income households greater than the regional average were identified as Low-Income Areas.
Access improvement determined via a spatial overlay analysis using GIS, applying the following buffer, and scoring response:
AC C E S S B U F F E R Y E S / N O
D I R E C T C A N D I DAT E B U F F E R I N T E R S E C T S WI T H LOW I N C O M E A R E A Y E S
N E AR 0 . 2 5 – 5 M I L E S Y E S
L I T T L E / N O AC C E S S > 5 M I L E S N O
(b) Provides Access to Areas with High Unemployment
High Unemployment Areas were identified using 2012-2016 data from the American Community Survey (ACS) to identify the location and concentration of high unemployment at the Census Block Group level. Census Block Groups that contained low unemployment greater than the regional average were identified as High Unemployment Areas.
Access improvement determined via a spatial overlay analysis using GIS, applying the following buffer, and scoring response:
AC C E S S B U F F E R Y E S / N O
D I R E C T C A N D I DAT E B U F F E R I N T E R S E C T S WI T H LOW I N C O M E A R E A Y E S
N E AR 0 . 2 5 – 5 M I L E S Y E S
L I T T L E / N O AC C E S S > 5 M I L E S N O

I N T R O D U C T I O NP R O J E C T E VA LUAT I O N A N D S C O R I N G 87 D E S C R I P T I O N O F C A LC U L AT I O N SP R O J E C T E VA LUAT I O N A N D P R I O R I T I Z AT I O N 87
A PPE ND IX A: LR TP D E S C RIP TI O N O F C A LC U L ATI O N S
P R O J E C T V IAB I L I T Y - R OADWAYS
PR OJ E C T RE AD I N E S S
(a) Percent of Committed Funding
0-100%. Provided by stakeholders.
(b) Prior Commitment
Prior commitment for Roadway Projects is inclusion in currently adopted LRTP. Yes/No. Provided by stakeholders.
(c) Percentage of Project Design Complete
0-100%. Provided by stakeholders.
(d) Environmental Documents Status
Full (NEPA has been completed), Partial (NEPA has been initiated), None. Provided by stakeholders.
(e) Environmental Decisions Obtained
Yes/No. Provided by stakeholders.
(f) ROW Obtained/Utilities Coordinated
Full (both ROW and Utilities have been coordinated), Partial (either ROW or Utilities have been coordinated), None. Provided by stakeholders.
L AN D U S E/FU T U RE D E VE LO PM E NT C O M PATI B I LIT YCompatible and Officially Documented, Compatible but Not Officially Documented, Not Compatible. Provided by stakeholders.
E NVI R O N M E NTAL C O N S I D E R ATI O N S
(a) Environmental Measures of Effectiveness (MOE)
Evaluates the potential of a project to address the reduction of pollutant emissions and energy consumption. More information on how environmental MOEs are calculated can be found in the SMART SCALE Technical Guide. Responses include 0 to 3+ MOEs.

I N T R O D U C T I O NP R O J E C T E VA LUAT I O N A N D S C O R I N G 88 D E S C R I P T I O N O F C A LC U L AT I O N SP R O J E C T E VA LUAT I O N A N D P R I O R I T I Z AT I O N 88
A PPE ND IX A: LR TP D E S C RIP TI O N O F C A LC U L ATI O N S
(b) Acres of Natural and Cultural Resources
Evaluates potential of project to minimize the impact on natural and cultural resources. More information on how impacts to natural and cultural resources are calculated can be found in the SMART SCALE Technical Guide. Responses include High, Medium, Low, or No Impact.
I M PAC T T O NAT U R AL / C U LT U R AL R E S O U R C E S
NAT U R AL / C U LT U R AL R E S O U R C E S DATA S O U R C E T Y P E
C O N S E RVAT I O N L AN D SVD C R
C O N S E RVAT I O N L A N D S
E A S E M E N T S
N AT U R A L H E R I TAG E S C R E E N S
VD O F AG R I C U LT U R A L / FO R E S T D I S T R I C T S
S P E C I E S AN D HAB I TAT VD G I F T H R E AT E N E D & E N DA N G E R E D S P E C I E S
C U LT U R AL R E S O U R C E S
N P S A M E R I C A N B AT T L E F I E L D P R OT E C T I O N P R O G R A M
VD H RA R C H I T E C T U R E
A R C H A E O LO GY
WE T L AN D S U S F W S N AT I O N A L WE T L A N D S I NVE N TO RY
(c) Project Reduces traffic delay at a congested bottleneck with a high percentage of truck traffic and/or includes improvements to
freight/rail/intermodal facilities
Yes/No, based on the travel time and LOS analysis used in the Project Utility section.
(d) Percentage of truck traffic (for congested bottlenecks with high truck traffic)
Percent of truck traffic was calculated for congested intersections, interchanges, or other bottlenecks that have a high percentage of truck traffic (defined as 8%, based on the threshold used in the SMART SCALE prioritization process.)
C O S T E F F E C TIVE N E S SAn index created by dividing the combined benefits of a project by the estimated cost. Costs are expressed in millions and in current year dollars.

I N T R O D U C T I O NP R O J E C T E VA LUAT I O N A N D S C O R I N G 89 D E S C R I P T I O N O F C A LC U L AT I O N SP R O J E C T E VA LUAT I O N A N D P R I O R I T I Z AT I O N 89
A PPE ND IX A: LR TP D E S C RIP TI O N O F C A LC U L ATI O N S
P R O J E C T V IAB I L I T Y – I N T E R M O DAL / F R E I G H T
PR OJ E C T RE AD I N E S S
(a) Percent of Committed Funding
0-100%. Provided by stakeholders.
(b) Prior Commitment
Prior commitment for Roadway Projects is inclusion in currently adopted LRTP. Yes/No. Provided by stakeholders.
(c) Percentage of Project Design Complete
0-100%. Provided by stakeholders.
(d) Environmental Documents Status
Full (NEPA has been completed), Partial (NEPA has been initiated), None. Provided by stakeholders.
(e) Environmental Decisions Obtained
Yes/No. Provided by stakeholders.
(f) ROW Obtained/Utilities Coordinated
Full (both ROW and Utilities have been coordinated), Partial (either ROW or Utilities have been coordinated), None. Provided by stakeholders.
L AN D U S E/FU T U RE D E VE LO PM E NT C O M PATI B I LIT YCompatible and Officially Documented, Compatible but Not Officially Documented, Not Compatible. Provided by stakeholders.
E NVI R O N M E NTAL C O N S I D E R ATI O N S
(a) Environmental Measures of Effectiveness (MOE)
Evaluates the potential of a project to address the reduction of pollutant emissions and energy consumption. More information on how environmental MOEs are calculated can be found in the SMART SCALE Technical Guide. Responses include 0 to 3+ MOEs.

I N T R O D U C T I O NP R O J E C T E VA LUAT I O N A N D S C O R I N G 90 D E S C R I P T I O N O F C A LC U L AT I O N SP R O J E C T E VA LUAT I O N A N D P R I O R I T I Z AT I O N 90
A PPE ND IX A: LR TP D E S C RIP TI O N O F C A LC U L ATI O N S
(b) Acres of Natural and Cultural Resources
Evaluates potential of project to minimize the impact on natural and cultural resources. More information on how impacts to natural and cultural resources are calculated can be found in the SMART SCALE Technical Guide. Responses include High, Medium, Low, or No Impact.
I M PAC T T O NAT U R AL / C U LT U R AL R E S O U R C E S
NAT U R AL / C U LT U R AL R E S O U R C E S DATA S O U R C E T Y P E
C O N S E RVAT I O N L AN D SVD C R
C O N S E RVAT I O N L A N D S
E A S E M E N T S
N AT U R A L H E R I TAG E S C R E E N S
VD O F AG R I C U LT U R A L / FO R E S T D I S T R I C T S
S P E C I E S AN D HAB I TAT VD G I F T H R E AT E N E D & E N DA N G E R E D S P E C I E S
C U LT U R AL R E S O U R C E S
N P SA M E R I C A N B AT T L E F I E L D P R OT E C T I O N
P R O G R A M
VD H RA R C H I T E C T U R E
A R C H A E O LO GY
WE T L AN D S U S F W S N AT I O N A L WE T L A N D S I NVE N TO RY
(c) Percentage of truck traffic (for congested bottlenecks with high truck traffic)
Percent of truck traffic was calculated for congested intersections, interchanges, or other bottlenecks that have a high percentage of truck traffic.
C O S T E F F E C TIVE N E S SAn index created by dividing the combined benefits of a project by the estimated cost. Costs are expressed in millions and in current year dollars.

I N T R O D U C T I O NP R O J E C T E VA LUAT I O N A N D S C O R I N G 91 D E S C R I P T I O N O F C A LC U L AT I O N SP R O J E C T E VA LUAT I O N A N D P R I O R I T I Z AT I O N 91
A PPE ND IX A: LR TP D E S C RIP TI O N O F C A LC U L ATI O N S
P R O J E C T V IAB I L I T Y – T R AN S I T
PR OJ E C T RE AD I N E S S
(a) Percent of Committed Funding
0-100%. Provided by stakeholders.
(b) Prior Commitment
Prior commitment for Transit Projects is inclusion in currently adopted LRTP or Transit Vision Plan. Yes/No. Provided by stakeholders.
(c) Percentage of Project Design Complete
0-100%. Provided by stakeholders.
(d) Environmental Documents Status
Full (NEPA has been completed), Partial (NEPA has been initiated), None. Provided by stakeholders.
(e) Environmental Decisions Obtained
Yes/No. Provided by stakeholders.
(f) ROW Obtained/Utilities Coordinated
Full (both ROW and Utilities have been coordinated), Partial (either ROW or Utilities have been coordinated), None. Provided by stakeholders.
L AN D U S E/FU T U RE D E VE LO PM E NT C O M PATI B I LIT YCompatible and Officially Documented, Compatible but Not Officially Documented, Not Compatible. Provided by stakeholders.
E NVI R O N M E NTAL C O N S I D E R ATI O N S
(a) Environmental Measures of Effectiveness (MOE)
Evaluates the potential of a project to address the reduction of pollutant emissions and energy consumption. More information on how environmental MOEs are calculated can be found in the SMART SCALE Technical Guide. Responses include 0 to 3+ MOEs.

I N T R O D U C T I O NP R O J E C T E VA LUAT I O N A N D S C O R I N G 92 D E S C R I P T I O N O F C A LC U L AT I O N SP R O J E C T E VA LUAT I O N A N D P R I O R I T I Z AT I O N 92
A PPE ND IX A: LR TP D E S C RIP TI O N O F C A LC U L ATI O N S
(b) Acres of Natural and Cultural Resources
Evaluates potential of project to minimize the impact on natural and cultural resources. More information on how impacts to natural and cultural resources are calculated can be found in the SMART SCALE Technical Guide. Responses include High, Medium, Low, or No Impact.
I M PAC T T O NAT U R AL / C U LT U R AL R E S O U R C E S
NAT U R AL / C U LT U R AL R E S O U R C E S DATA S O U R C E T Y P E
C O N S E RVAT I O N L AN D SVD C R
C O N S E RVAT I O N L A N D S
E A S E M E N T S
N AT U R A L H E R I TAG E S C R E E N S
VD O F AG R I C U LT U R A L / FO R E S T D I S T R I C T S
S P E C I E S AN D HAB I TAT VD G I F T H R E AT E N E D & E N DA N G E R E D S P E C I E S
C U LT U R AL R E S O U R C E S
N P SA M E R I C A N B AT T L E F I E L D P R OT E C T I O N
P R O G R A M
VD H RA R C H I T E C T U R E
A R C H A E O LO GY
WE T L AN D S U S F W S N AT I O N A L WE T L A N D S I NVE N TO RY
(c) Air Quality/Emissions Reduction
The difference between total carbon dioxide, methane, and nitrous oxide emissions (in tons per commuter) of single-occupant passenger cars and transit was calculated. Then, this difference was multiplied by the number of estimated annual trips for each project.
T R AV E L M O D E C O 2 , C H 4 , AN D N 2 O E M I S S I O N S ( T O N S P E R PAS S E N G E R - M I L E )
C AR S 4 .7 07 × 1 0 - 4
T R AN S I T 1 . 8 63 × 1 0 - 4
C O S T E F F E C TIVE N E S SAn index created by dividing the combined benefits of a project by the estimated cost. Costs are expressed in millions and in current year dollars.

I N T R O D U C T I O NP R O J E C T E VA LUAT I O N A N D S C O R I N G 93 D E S C R I P T I O N O F C A LC U L AT I O N SP R O J E C T E VA LUAT I O N A N D P R I O R I T I Z AT I O N 93
A PPE ND IX A: LR TP D E S C RIP TI O N O F C A LC U L ATI O N S
P R O J E C T V IAB I L I T Y – AC T I V E T R AN S P O RTAT I O N
PR OJ E C T RE AD I N E S S
(a) Percent of Committed Funding
0-100%. Provided by stakeholders.
(b) Prior Commitment
Prior commitment for Active Transportation Projects is inclusion in currently adopted LRTP or local Comprehensive Plan. Yes/No. Provided by stakeholders.
(c) Percentage of Project Design Complete
0-100%. Provided by stakeholders.
(d) Environmental Documents Status
Full (NEPA has been completed), Partial (NEPA has been initiated), None. Provided by stakeholders.
(e) Environmental Decisions Obtained
Yes/No. Provided by stakeholders.
(f) ROW Obtained/Utilities Coordinated
Full (both ROW and Utilities have been coordinated), Partial (either ROW or Utilities have been coordinated), None. Provided by stakeholders.
L AN D U S E/FU T U RE D E VE LO PM E NT C O M PATI B I LIT YCompatible and Officially Documented, Compatible but Not Officially Documented, Not Compatible. Provided by stakeholders.
E NVI R O N M E NTAL C O N S I D E R ATI O N S
(a) Environmental Measures of Effectiveness (MOE)
Evaluates the potential of a project to address the reduction of pollutant emissions and energy consumption. More information on how environmental MOEs are calculated can be found in the SMART SCALE Technical Guide. Responses include 0 to 3+ MOEs.

I N T R O D U C T I O NP R O J E C T E VA LUAT I O N A N D S C O R I N G 94 D E S C R I P T I O N O F C A LC U L AT I O N SP R O J E C T E VA LUAT I O N A N D P R I O R I T I Z AT I O N 94
A PPE ND IX A: LR TP D E S C RIP TI O N O F C A LC U L ATI O N S
(b) Acres of Natural and Cultural Resources
Evaluates potential of project to provide access to natural and cultural resources. Responses include High, Medium, Low, or No Access.
I M PAC T T O NAT U R AL / C U LT U R AL R E S O U R C E S
NAT U R AL / C U LT U R AL R E S O U R C E S DATA S O U R C E T Y P E
C O N S E RVAT I O N L AN D SVD C R
C O N S E RVAT I O N L A N D S
E A S E M E N T S
N AT U R A L H E R I TAG E S C R E E N S
VD O F AG R I C U LT U R A L / FO R E S T D I S T R I C T S
S P E C I E S AN D HAB I TAT VD G I F T H R E AT E N E D & E N DA N G E R E D S P E C I E S
C U LT U R AL R E S O U R C E S
N P SA M E R I C A N B AT T L E F I E L D P R OT E C T I O N
P R O G R A M
VD H RA R C H I T E C T U R E
A R C H A E O LO GY
WE T L AN D S U S F W S N AT I O N A L WE T L A N D S I NVE N TO RY
(c) Air Quality/Emissions Reduction
Eliminated vehicle trips and estimated reductions in VMT are calculated to analyze estimated impact of the project on VOC and NOx reductions.
C O S T E F F E C TIVE N E S SAn index created by dividing the combined benefits of a project by the estimated cost. Costs are expressed in millions and in current year dollars.

I N T R O D U C T I O NP R O J E C T E VA LUAT I O N A N D S C O R I N G 95 D E S C R I P T I O N O F C A LC U L AT I O N SP R O J E C T E VA LUAT I O N A N D P R I O R I T I Z AT I O N 95
A PPE ND IX A: 2045 W E I G HTIN G FAC T O RS - PROJ E C T U TILIT Y
Congestion Level 40.00% Reduction in Existing and Future V/C Ratios (Daily Delay) 10.00Existing Peak Period Congestion/Level of Service 10.00Person Throughput 5.00Person Hours of Delay 5.00Impact to Nearby Roadways 10.00
Travel Time Reliabililty 15.00Level of Travel Time Reliability (LOTTR) 10.00Truck Travel Time Reliability (TTTR) 5.00
System Continuity and Connectivity 25.00Degree of Regional Impact 15.00Improves Access to Major Employment or Population Centers 3.00Resiliency 5.00Addresses a Gap 2.00
Safety and Security 15.005.005.00
Improvement to Incident Management or Evacuation Routes 5.00Modal Enhancements 5.00
3.002.00
PROJECT UTILITY TOTAL 100.00
2045 LRTP Project Prioritization Weighting Factors - Project Utility
PROJECT UTILITY
Highway Projects
Enhances Other Modal CategoriesAccess to Multimodal Choices
Reduction of EPDO of Fatal and Serious Injury CrashesReduction of EPDO Rate of Fatal and Serious Injury Crashes
2045 LRTP Project Prioritization Weighting Factors - Project Utility
Congestion Level 40.00Existing Queue Conditions: Number of Approaches with Queues 10.00Queue Improvements: Number of Approaches Improved 10.00Person Throughput 5.00Person Hours of Delay 5.00Number of Movements Added or Improved 10.00
Travel Time Reliabililty 15.00Level of Travel Time Reliability (LOTTR) 10.00Truck Travel Time Reliability (TTTR) 5.00
System Continuity and Connectivity 25.00Degree of Regional Impact 15.00Improves Access to Major Employment or Population Centers 3.00Resiliency 5.00Addresses a Gap 2.00
Safety and Security 15.005.005.00
Improvement to Incident Management or Evacuation Routes 5.00Modal Enhancements 5.00
3.002.00
PROJECT UTILITY TOTAL 100.00
Reduction of EPDO of Fatal and Serious Injury CrashesReduction of EPDO Rate of Fatal and Serious Injury Crashes
PROJECT UTILITY
Enhances Other Modal CategoriesAccess to Multimodal Choices
Interchange Projects

I N T R O D U C T I O NP R O J E C T E VA LUAT I O N A N D S C O R I N G 96 D E S C R I P T I O N O F C A LC U L AT I O N SP R O J E C T E VA LUAT I O N A N D P R I O R I T I Z AT I O N 96
A PPE ND IX A: 2045 W E I G HTIN G FAC T O RS - PROJ E C T U TILIT Y
2045 LRTP Project Prioritization Weighting Factors - Project Utility
Congestion Level 40.00% Reduction in Existing and Future V/C Ratios (Daily Delay) 10.00Existing Peak Period Congestion/Level of Service 10.00Person Throughput 5.00Person Hours of Delay 5.00Impact to Nearby Roadways 10.00
Travel Time Reliabililty 15.00Level of Travel Time Reliability (LOTTR) 10.00Truck Travel Time Reliability (TTTR) 5.00
Infrastructure Condition 15.00
5.50Importance Factor 4.50Design Redundancy Factor 3.00
2.00
Age of Tunnel 5.00Last Major Repair 5.00Costs for Necessary Repairs/Upgrades 5.00
System Continuity and Connectivity 15.00Degree of Regional Impact 5.00Improves Access to Major Employment or Population Centers 3.00Resiliency 5.00Addresses a Gap 2.00
Safety and Security 10.002.502.50
Improvement to Incident Management or Evacuation Routes 3.00Diversion Impact Due to Failure (Impact of Detour to Alternate Crossing) 2.00
Modal Enhancements 5.002.002.001.00
PROJECT UTILITY TOTAL 100.00
Tunnels:
PROJECT UTILITY
Bridge State of Good Repair Ratings:Condition Factor
Bridge & Tunnel Projects
Structure Capacity
Provides Continuous Maritime Crossing
Enhances Other Modal Categories
Reduction of EPDO of Fatal and Serious Injury CrashesReduction of EPDO Rate of Fatal and Serious Injury Crashes
Access to Multimodal Choices
2045 LRTP Project Prioritization Weighting Factors - Project Utility
30.0030.00
Travel Time Reliabililty 15.00Level of Travel Time Reliability (LOTTR) 5.00Truck Travel Time Reliability (TTTR) 10.00
System Continuity and Connectivity 15.00Degree of Regional Impact 10.00Resiliency 3.00Addresses a Gap 2.00
Modal Enhancements 10.006.004.00
PROJECT UTILITY TOTAL 100.00
10.0020.00
System Continuity and Connectivity 25.00Degree of Regional Impact 9.00Improves Access to Major Employment or Population Centers 9.00Resiliency 5.00Addresses a Gap 2.00
User Benefit 35.00Annual Travel Time Savings per Rider 10.00New Project 5.00Increased Travel Time Reliability 5.00Operating Efficiency 5.00Accessibility (including ADA) and/or Customer Experience 5.00Safety and Security 5.00
Modal Enhancements 10.006.004.00
PROJECT UTILITY TOTAL 100.00
Enhances Other Modal CategoriesAccess to Multimodal Choices
Enhances Other Modal CategoriesAccess to Multimodal Choices
Congestion - Percent of Trips Removed from Roadways
Transit Projects
PROJECT UTILITY
Existing Usage and/or Prospective Ridership, Coverage Area/ Population Served
PROJECT UTILITYBetter Accommodates Intermodal MovementsImproves Rail/Vehicular Access
Intermodal/Freight Projects
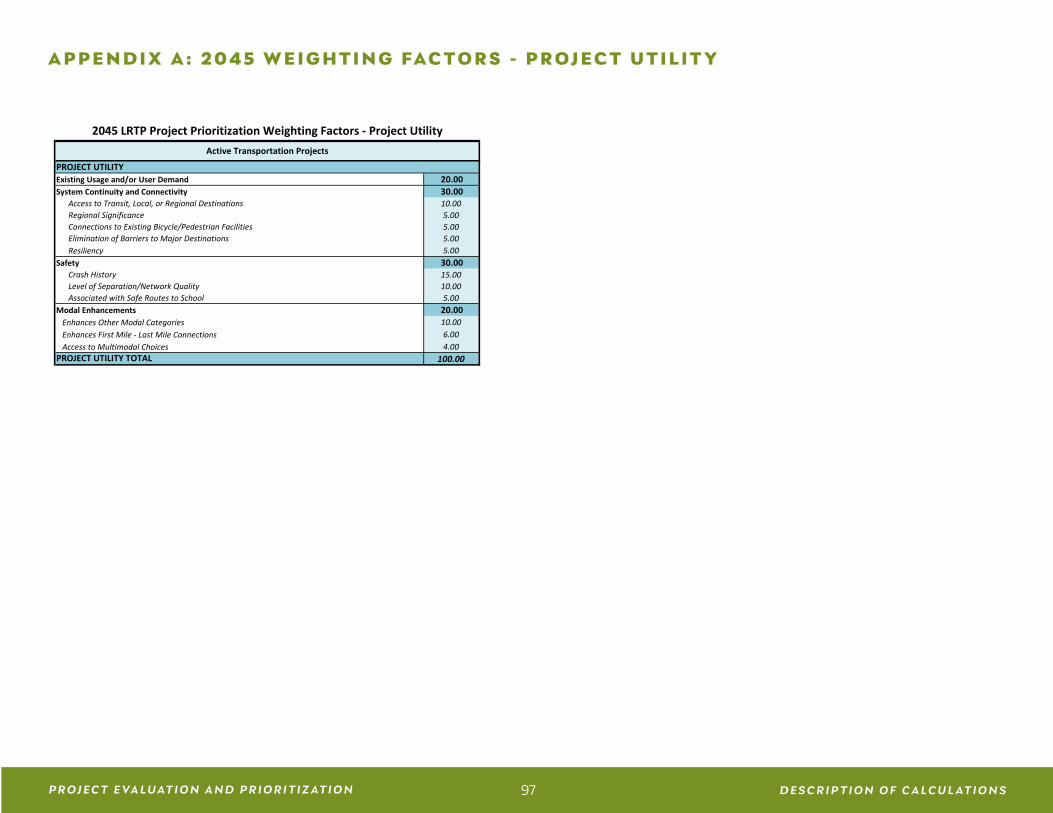
I N T R O D U C T I O NP R O J E C T E VA LUAT I O N A N D S C O R I N G 97 D E S C R I P T I O N O F C A LC U L AT I O N SP R O J E C T E VA LUAT I O N A N D P R I O R I T I Z AT I O N 97
A PPE ND IX A: 2045 W E I G HTIN G FAC T O RS - PROJ E C T U TILIT Y
2045 LRTP Project Prioritization Weighting Factors - Project Utility
Existing Usage and/or User Demand 20.00System Continuity and Connectivity 30.00
Access to Transit, Local, or Regional Destinations 10.00Regional Significance 5.00Connections to Existing Bicycle/Pedestrian Facilities 5.00Elimination of Barriers to Major Destinations 5.00Resiliency 5.00
Safety 30.00Crash History 15.00Level of Separation/Network Quality 10.00Associated with Safe Routes to School 5.00
Modal Enhancements 20.0010.00
Enhances First Mile - Last Mile Connections 6.004.00
PROJECT UTILITY TOTAL 100.00
Enhances Other Modal Categories
Access to Multimodal Choices
Active Transportation Projects
PROJECT UTILITY
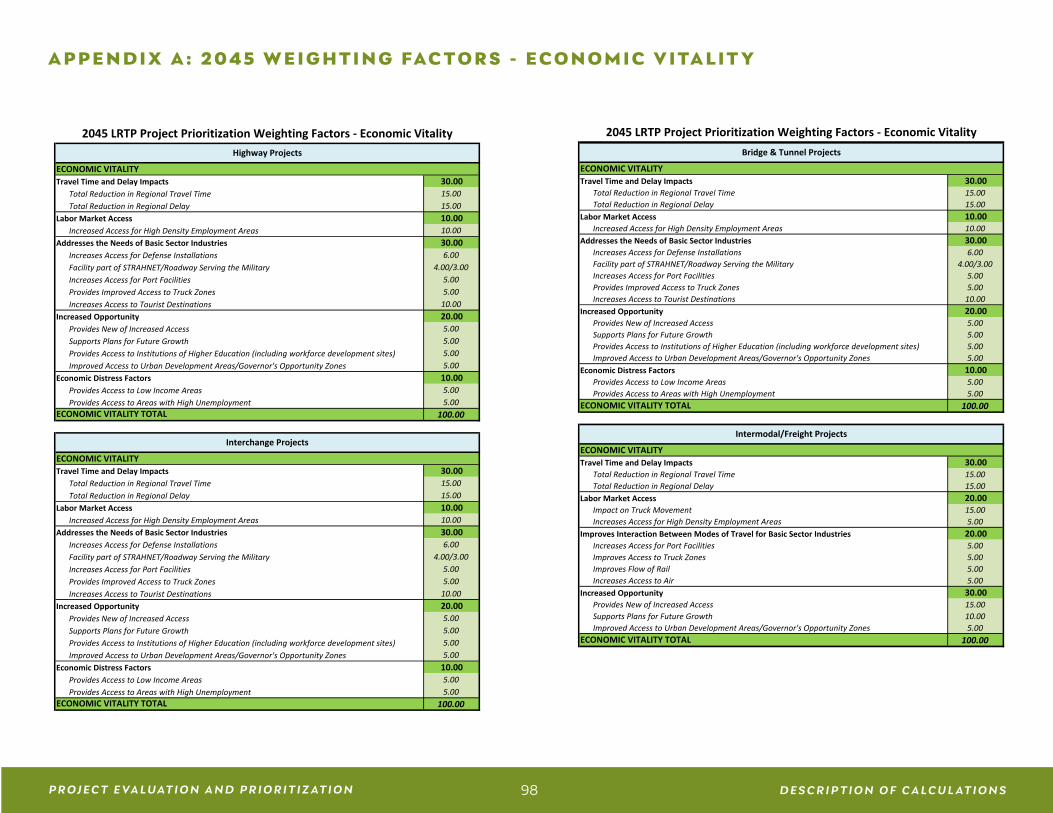
I N T R O D U C T I O NP R O J E C T E VA LUAT I O N A N D S C O R I N G 98 D E S C R I P T I O N O F C A LC U L AT I O N SP R O J E C T E VA LUAT I O N A N D P R I O R I T I Z AT I O N 98
A PPE ND IX A: 2045 W E I G HTIN G FAC T O RS - E C O N O M I C V ITA LIT Y
Travel Time and Delay Impacts 30.00Total Reduction in Regional Travel Time 15.00Total Reduction in Regional Delay 15.00
Labor Market Access 10.00Increased Access for High Density Employment Areas 10.00
Addresses the Needs of Basic Sector Industries 30.00Increases Access for Defense Installations 6.00Facility part of STRAHNET/Roadway Serving the Military 4.00/3.00Increases Access for Port Facilities 5.00Provides Improved Access to Truck Zones 5.00Increases Access to Tourist Destinations 10.00
Increased Opportunity 20.00Provides New of Increased Access 5.00Supports Plans for Future Growth 5.00Provides Access to Institutions of Higher Education (including workforce development sites) 5.00Improved Access to Urban Development Areas/Governor's Opportunity Zones 5.00
Economic Distress Factors 10.00Provides Access to Low Income Areas 5.00Provides Access to Areas with High Unemployment 5.00
ECONOMIC VITALITY TOTAL 100.00
2045 LRTP Project Prioritization Weighting Factors - Economic Vitality
ECONOMIC VITALITY
Interchange Projects
ECONOMIC VITALITY
Highway Projects
2045 LRTP Project Prioritization Weighting Factors - Economic Vitality
Travel Time and Delay Impacts 30.00Total Reduction in Regional Travel Time 15.00Total Reduction in Regional Delay 15.00
Labor Market Access 10.00Increased Access for High Density Employment Areas 10.00
Addresses the Needs of Basic Sector Industries 30.00Increases Access for Defense Installations 6.00Facility part of STRAHNET/Roadway Serving the Military 4.00/3.00Increases Access for Port Facilities 5.00Provides Improved Access to Truck Zones 5.00Increases Access to Tourist Destinations 10.00
Increased Opportunity 20.00Provides New of Increased Access 5.00Supports Plans for Future Growth 5.00Provides Access to Institutions of Higher Education (including workforce development sites) 5.00Improved Access to Urban Development Areas/Governor's Opportunity Zones 5.00
Economic Distress Factors 10.00Provides Access to Low Income Areas 5.00Provides Access to Areas with High Unemployment 5.00
ECONOMIC VITALITY TOTAL 100.00
Travel Time and Delay Impacts 30.00Total Reduction in Regional Travel Time 15.00Total Reduction in Regional Delay 15.00
Labor Market Access 20.00Impact on Truck Movement 15.00Increases Access for High Density Employment Areas 5.00
Improves Interaction Between Modes of Travel for Basic Sector Industries 20.00Increases Access for Port Facilities 5.00Improves Access to Truck Zones 5.00Improves Flow of Rail 5.00Increases Access to Air 5.00
Increased Opportunity 30.00Provides New of Increased Access 15.00Supports Plans for Future Growth 10.00Improved Access to Urban Development Areas/Governor's Opportunity Zones 5.00
ECONOMIC VITALITY TOTAL 100.00
Bridge & Tunnel Projects
ECONOMIC VITALITY
Intermodal/Freight Projects
ECONOMIC VITALITY

I N T R O D U C T I O NP R O J E C T E VA LUAT I O N A N D S C O R I N G 99 D E S C R I P T I O N O F C A LC U L AT I O N SP R O J E C T E VA LUAT I O N A N D P R I O R I T I Z AT I O N 99
A PPE ND IX A: 2045 W E I G HTIN G FAC T O RS - E C O N O M I C V ITA LIT Y
2045 LRTP Project Prioritization Weighting Factors - Economic Vitality
Labor Market Access 30.00Increases Access for Major Employment Centers 20.00Increases Frequency of Service 10.00
Addresses the Needs of Basic Sector Industries 20.00Provides or Improves Access for Defense Installations 10.00Provides/Improves Access for Tourist Destinations 10.00
Increased Opportunity - Provides New Access to the Network 30.00Supported by Plans for Increased Density and Economic Activity 15.00Provides New Access to the Network 5.00Provides Access to Institutions of Higher Education (including workforce development sites) 5.00Improved Access to Urban Development Areas/Governor's Opportunity Zones 5.00
Economic Distress Factors 20.00Provides Access to Low Income Areas 10.00Provides Access to Areas with High Unemployment 10.00
100.00
Labor Market Access 20.00Increases Access for Major Employment Centers 20.00
Addresses the Needs of Basic Sector Industries 20.00Provides or Improves Access for Defense Installations 10.00Provides/Improves Access for Tourist Destinations 10.00
Increased Opportunity - Provides New Access to the Network 40.00Supports Plans for Future Growth 10.00Provides New Access to the Network 10.00Provides Access to Institutions of Higher Education (including workforce development sites) 10.00Improved Access to Urban Development Areas/Governor's Opportunity Zones 10.00
Economic Distress Factors 20.00Provides Access to Low Income Areas 10.00Provides Access to Areas with High Unemployment 10.00
100.00
Active Transportation Projects
ECONOMIC VITALITY
ECONOMIC VITALITY TOTAL
Transit Projects
ECONOMIC VITALITY
ECONOMIC VITALITY TOTAL

I N T R O D U C T I O NP R O J E C T E VA LUAT I O N A N D S C O R I N G 100 D E S C R I P T I O N O F C A LC U L AT I O N SP R O J E C T E VA LUAT I O N A N D P R I O R I T I Z AT I O N 100
A PPE ND IX A: 2045 W E I G HTIN G FAC T O RS - PROJ E C T V IA B ILIT Y
Project Readiness 50.00Percentage of Committed Funding 15.00
10.005.005.005.005.005.00
Land Use/Future Development Compatibility 20.00Environmental: 10.00
3.003.00
2.00
2.00Cost Effectiveness 20.00PROJECT VIABILITY TOTAL 100.00
Project Readiness 50.00Percentage of Committed Funding 15.00
10.005.005.005.005.005.00
Land Use/Future Development Compatibility 20.00Environmental: 10.00
3.003.00
2.00
2.00Cost Effectiveness 20.00PROJECT VIABILITY TOTAL 100.00
Prior CommitmentProject alignment statusPercentage of Project Design Complete
Environmental Decisions ObtainedROW Obtained/Utilities Coordinated
Environmental MOEsAcres of Natural and Cultural ResourcesProject reduces traffic delay at a congested bottleneck with high percentage of truck traffic and/or includes improvements to freight/rail/intermodal facilitiesPercentage of truck traffic (for congested bottlenecks with high truck traffic)
Environmental Documents Status
2045 LRTP Project Prioritization Weighting Factors - Project ViabilityHighway Projects
Project alignment statusPercentage of Project Design Complete
Environmental MOEs
PROJECT VIABILITY
Prior Commitment
Environmental Documents Status
Interchange Projects
PROJECT VIABILITY
Acres of Natural and Cultural Resources
Environmental Decisions ObtainedROW Obtained/Utilities Coordinated
Project reduces traffic delay at a congested bottleneck with high percentage of truck traffic and/or includes improvements to freight/rail/intermodal facilitiesPercentage of truck traffic (for congested bottlenecks with high truck traffic)
2045 LRTP Project Prioritization Weighting Factors - Project Viability
Project Readiness 50.00Percentage of Committed Funding 15.00
10.005.005.005.005.005.00
Land Use/Future Development Compatibility 20.00Environmental: 10.00
3.003.00
2.00
2.00Cost Effectiveness 20.00PROJECT VIABILITY TOTAL 100.00
Project Readiness 50.00Percentage of Committed Funding 15.00
10.005.005.005.005.005.00
Land Use/Future Development Compatibility 20.00Environmental: 10.00
3.004.003.00
Cost Effectiveness 20.00PROJECT VIABILITY TOTAL 100.00
Environmental Decisions ObtainedROW Obtained/Utilities Coordinated
Environmental MOEsAcres of Natural and Cultural ResourcesPercentage of truck traffic (for congested bottlenecks with high truck traffic)
Environmental Documents Status
Environmental Decisions ObtainedROW Obtained/Utilities Coordinated
Environmental MOEsAcres of Natural and Cultural ResourcesProject reduces traffic delay at a congested bottleneck with high percentage of truck traffic and/or includes improvements to freight/rail/intermodal facilitiesPercentage of truck traffic (for congested bottlenecks with high truck traffic)
Intermodal/Freight Projects
PROJECT VIABILITY
Prior CommitmentProject alignment statusPercentage of Project Design Complete
Environmental Documents Status
Bridge & Tunnel Projects
PROJECT VIABILITY
Prior CommitmentProject alignment statusPercentage of Project Design Complete

I N T R O D U C T I O NP R O J E C T E VA LUAT I O N A N D S C O R I N G 101 D E S C R I P T I O N O F C A LC U L AT I O N SP R O J E C T E VA LUAT I O N A N D P R I O R I T I Z AT I O N 101
A PPE ND IX A: 2045 W E I G HTIN G FAC T O RS - PROJ E C T V IA B ILIT Y
2045 LRTP Project Prioritization Weighting Factors - Project Viability
Project Readiness 50.00Percentage of Committed Funding 15.00
10.005.005.005.005.005.00
Land Use/Future Development Compatibility 20.00Environmental: 10.00
3.004.003.00
Cost Effectiveness 20.00PROJECT VIABILITY TOTAL 100.00
Project Readiness 50.00Percentage of Committed Funding 15.00
10.005.005.005.005.005.00
Land Use/Future Development Compatibility 20.00Environmental: 10.00
6.004.00
Cost Effectiveness 20.00PROJECT VIABILITY TOTAL 100.00
ROW Obtained/Utilities Coordinated
Access to Natural and Cultural ResourcesAir Quality/Emissions Reduction (Tons of emissions (HC and Nox) reduced per year)
PROJECT VIABILITY
Prior CommitmentProject alignment statusPercentage of Project Design CompleteEnvironmental Documents StatusEnvironmental Decisions Obtained
Active Transportation Projects
Transit Projects
PROJECT VIABILITY
Prior CommitmentProject alignment statusPercentage of Project Design CompleteEnvironmental Documents StatusEnvironmental Decisions ObtainedROW Obtained/Utilities Coordinated
Environmental MOEsAcres of Natural and Cultural ResourcesAir Quality/Emissions Reduction (Tons of emissions (HC and Nox) reduced per year)

P U B L I C C O M M E N T SP R O J E C T E VA LUAT I O N A N D P R I O R I T I Z AT I O N 102
HRTP O Pr o j e c t Pr i o r i t i z a t i o n To o l U p d a t e
HRTP O Pr o je c t Pr io r i t i z at io n To ol : Re co mm en d e d Enhan cem ent s P ubl i c Not ice . . . . . . . . . . . . . . . . . . . . . . .103
SELC Co mm ent s . . . . . . . . . . . . . . . . . . . . . . . . . . . . . . . . . . . . . . . . . . . . . . . . . . . . . . . . . . . . . . . . . . . . . . . . . . . . . . . . . . . . . . . . . . . . . . . . . . . . . . . . . . . . . . . . . . . . . . . . . . .104
HRTP O Jun e Pr e s ent at io n (r e s p o ns e to co mm ent s) . . . . . . . . . . . . . . . . . . . . . . . . . . . . . . . . . . . . . . . . . . . . . . . . . . . . . . . . . . . . . . . . . . . . . .107
Fol low- up SLEC Co mm ent s . . . . . . . . . . . . . . . . . . . . . . . . . . . . . . . . . . . . . . . . . . . . . . . . . . . . . . . . . . . . . . . . . . . . . . . . . . . . . . . . . . . . . . . . . . . . . . . . . . . . . . . . . . . .111
HRTP O Pr o j e c t Pr i o r i t i z a t i o n
2045 LRTP : DR AF T C an di date Pr o je c t Evaluat io n an d Pr io r i t i z at io n Rep o r t P ubl i c Not ice . . . . . . .116
SELC Co mm ent s . . . . . . . . . . . . . . . . . . . . . . . . . . . . . . . . . . . . . . . . . . . . . . . . . . . . . . . . . . . . . . . . . . . . . . . . . . . . . . . . . . . . . . . . . . . . . . . . . . . . . . . . . . . . . . . . . . . . . . . . . . . . .117
HRTP O r e s p o ns e to SELC Co mmm ent s . . . . . . . . . . . . . . . . . . . . . . . . . . . . . . . . . . . . . . . . . . . . . . . . . . . . . . . . . . . . . . . . . . . . . . . . . . . . . . . . . . . . . . . . .120
Cit y of V i r g in ia B ea ch r e s p o ns e to SELC co mm ent s . . . . . . . . . . . . . . . . . . . . . . . . . . . . . . . . . . . . . . . . . . . . . . . . . . . . . . . . . . . . . . . . . . . . . .121
AP P E N D IX B : P U B L I C C O M M E N T S
B

I N T R O D U C T I O NP R O J E C T E VA LUAT I O N A N D S C O R I N G 103 P U B L I C C O M M E N T SP R O J E C T E VA LUAT I O N A N D P R I O R I T I Z AT I O N 103
A PPE ND IX B: PROJ E C T PRI O RITIZ ATI O N T O O L U PDATE PU B LI C N O TI C E
HRTPO Project Prioritization Tool: Recommended Enhancements
The HRTPO Project Prioritization Tool was developed to assist regional decision-makers in prioritizing transportation projects based off technical merits and regional benefits, evaluating projects based on Project Utility, Economic Vitality, and Project Viability. The Tool, which has been used in the past two Long-Range Transportation Plan (LRTP) updates and in the identification of the Regional Priority Projects, was designed to be updated periodically to reflect current conditions and regional priorities. On April 5, 2017, the LRTP Subcommittee unanimously voted for HRTPO staff to initiate the process of updating the Project Prioritization Tool based on recommendations received by staff. Since that time, HRTPO staff has been conducting research and soliciting additional feedback from regional stakeholders. Since 2018, HRTPO staff has been working with the Project Prioritization Working Group and the LRTP Subcommittee, along with other HRTPO advisory committees, to develop and refine potential measures to incorporate or enhance in the Tool, and adjust weighting factors based on these recommended improvements. The Project Prioritization Task Force and the LRTP Subcommittee have both recommended approval of the recommended enhancements and updated weighting factors. On February 5, 2020, the Transportation Technical Advisory Committee also recommended approval of the recommended enhancements and updated weighting factors. Please click on the following link for more information on the HRTPO Project Prioritization Tool and to review the recommended enhancements: https://www.hrtpo.org/page/project-prioritization/ All interested parties are encouraged to review the draft recommended enhancements to the HRTPO Project Prioritization Tool. Please send comments to Dale Stith, Principal Transportation Planner, at [email protected] or by mail to 723 Woodlake Drive, Chesapeake, VA, 23320 by March 6, 2020.

I N T R O D U C T I O NP R O J E C T E VA LUAT I O N A N D S C O R I N G 104 P U B L I C C O M M E N T SP R O J E C T E VA LUAT I O N A N D P R I O R I T I Z AT I O N 104
A PPE ND IX B: PU B LI C C O M M E NT S - SE LC
March 5, 2020
Dale Stith Principal Transportation Planner Hampton Roads Transportation Planning Organization 723 Woodlake Drive Chesapeake, VA 23320 [email protected] VIA EMAIL
Dear Ms. Stith,
The Southern Environmental Law Center (SELC) offers the following comments on the proposed modifications to the Hampton Roads Transportation Planning Organization’s Project Prioritization Tool (PPT). SELC is a non-partisan, non-profit organization headquartered in Virginia that works throughout the southeast to promote policies and laws that protect our natural resources, strengthen our communities, and improve our quality of life.
SELC strongly supports using objective criteria to evaluate and prioritize transportation proposals, and we commend the HRTPO for being one of the pioneers in Virginia in this regard.Further, recognizing that project prioritization tools and their associated methodologies should be evaluated and updated over time as the quality and quantity of available data improve and as regional priorities shift in response to new or growing challenges, we applaud the HRTPO for taking the initiative to review the PPT. We also want to thank you again for taking the time to speak with us and exchange emails to answer some of our questions about the proposed changes, and we hope these comments can help strengthen key aspects of the proposed changes before they are finalized.
I. Enhancing Consideration of a Project’s Environmental Impacts
A. Factoring in Impacts to Natural Resources
We strongly support adding consideration of projects’ environmental impacts to the PPT, as this crucial component of a project’s viability and overall value is not captured in the current PPT criteria. As noted in slide 31 in the Additional Resource Slides presentation available on the HRTPO’s Project Prioritization webpage (https://www.hrtpo.org/page/project-prioritization/), the current PPT criteria assess the status of a project’s environmental review and permits, but provide no real indication of the project’s actual environmental impact.
2
Further, we support the proposal to assess a project’s impact on natural and cultural resource acreage as a primary element of its environmental impact score (the “Acres of Natural and Cultural Resources” criterion), similar to one of the ways environmental impacts are evaluated in Virginia’s SMART SCALE project prioritization tool. Slide 13 in the Additional Resource Slides presentation indicates that the specific types of resources assessed for this criterion will be conservation lands, protected habitats for threatened and endangered species, cultural resources, and wetlands. In addition to their purely ecological value, wetlands and other types of conservation lands and wildlife habitats are of particular importance in Hampton Roads because of the vital protections they provide to communities by slowing and storing floodwaters and by buffering against storm surges and rising seas. In a region that is already facing significant impacts from climate change, and with new data showing sea level rise accelerating in Virginia and along the East Coast,1 it is imperative that the PPT take into account the extent to which a transportation proposal would negatively impact these natural resiliency resources.
B. Valuing Impacts to Natural and Cultural Resource Acreage Adequately
Although we are glad that these natural resource acreage impacts would now be assessed under the PPT, we are concerned by the minimal value this criterion would have in proportion to a project’s overall score. As proposed, the “Acres of Natural and Cultural Resources” criterion would only account for up to 3 points (or 1% of a project’s overall score) for the Highway, Interchange, and Bridge & Tunnel project categories, and up to 4 points (or 1.33% of a project’s overall score) for the Intermodal and Transit project categories. This strikes us as far too few points to adequately reflect the value of these resources to the region or the detrimental effect that damaging these resources can have on project viability (since projects with greater impacts to environmental and cultural resources are more likely to encounter permitting delays and litigation, among other challenges). We therefore urge the HRTPO to increase the value of the “Acres of Natural and Cultural Resources” criterion to better reflect its importance.
One way to do this would be to reallocate value from the “Basic Environmental Review” criterion to the “Acres of Natural and Cultural Resources” criterion. In our view, the proposed “Basic Environmental Review” criterion misses the mark as an assessment of environmental impacts. Based on the Additional Resource Slides presentation (and slide 33, specifically), the criterion appears to consist of a few “Yes/No” questions such as: (1) “Is there a fatal flaw for permitting?” and (2) “Is the intrusion into sensitive areas justified?”. Answering these questions requires a high degree of subjectivity, diverting sharply from the objective and data-driven approach that we understand the HRTPO strives for the PPT to embody. Further, these questions fail to capture a project’s environmental impact in a meaningful way. Indeed, the question asking whether the intrusion into sensitive areas is justified seems to provide an opportunity for
1 David Malmquist, Sea-level Report Cards: 2019 Data Adds to Trend in Acceleration, Va. Inst. of Marine Sci. (Jan. 30, 2020), https://www.vims.edu/newsandevents/topstories/2020/slrc_2019.php.

I N T R O D U C T I O NP R O J E C T E VA LUAT I O N A N D S C O R I N G 105 P U B L I C C O M M E N T SP R O J E C T E VA LUAT I O N A N D P R I O R I T I Z AT I O N 105
A PPE ND IX B: PU B LI C C O M M E NT S - SE LC
3
an applicant to summarily dismiss a project’s environmental impacts based on the applicant’s view of the value of other aspects of the proposal.
We understand that the HRTPO first considered incorporating certain environmental measures of effectiveness (MOEs) from SMART SCALE to serve as the portion of a project’s score that is now proposed to be represented in the “Basic Environmental Review” criterion, but that the “Environmental MOEs” criterion was ultimately rejected due to a concern that several of the environmental MOEs from SMART SCALE are fairly design-specific and do not translate well to projects in the more conceptual stage of development that are typically included in long-range transportation plans. Although that rationale makes some sense to us, we still have the serious doubts we outlined above about the effectiveness of the “Basic Environmental Review” criterion that has been proposed in place of the “Environmental MOEs” criterion. We therefore recommend against including the “Basic Environmental Review” criterion at this time, and we urge the HRTPO instead to allocate its share of point value (3 points in most project categories) to the far more objective and informative “Acres of Natural and Cultural Resources” criterion, providing a much-needed boost to its overall value within the project scoring methodology.
C. Assessing Natural and Cultural Resource Acreage Impacts for Active Transportation Projects
As we understand the current proposal, the “Acres of Natural and Cultural Resources” criterion for projects in the Active Transportation category will award points based on the extent to which a project would increase access to these resources. That approach is in contrast to how this criterion will be assessed for the other project categories; points will be awarded to proposals in those other categories based on avoiding impacts to natural and cultural resources.
We are concerned that the approach proposed for this criterion in the Active Transportation category could in some cases inadvertently reward projects that adversely impact the very areas to which they are providing access (for example, a pedestrian trail leading to a natural area that results in the clearing and paving of a path through part of the natural area).Providing better access to natural and cultural resources can be beneficial for many reasons, but it does not always result in a positive environmental impact—particularly where the proposed infrastructure would directly or indirectly damage some portion of the resource.
We urge the HRTPO not to use this different approach to assessing this criterion for Active Transportation projects. Rather, we believe that for all project categories, the “Acres of Natural and Cultural Resources” criterion should focus on the potential damage to these resources. The improved access that active transportation projects might provide to natural and cultural resources would be more appropriately captured in a different measure, such as the “Increased Opportunity” criteria under the Economic Vitality measure.
4
D. Rewarding Projects that Improve Freight Rail Networks or Intermodal Facilities
Slide 34 in the Additional Resource Slides presentation indicates that at one point during the review process, an environmental criterion was considered that would reward projects that “include[] improvements to the freight rail network or intermodal (truck to rail) facilities/ports/terminals.” We believe this is a suitable environmental criterion because transportation improvements that help move freight from our highways to other modes of transportation can provide significant air quality benefits (in addition to improving highway safety and reducing congestion). However, that same slide indicates that one of the regional stakeholders expressed concern that this criterion “appears to double dip from the Economic Vitality section,” and it seems that it is no longer being considered as a result.
It is unclear to us how the Economic Vitality measure captures enhancements to the freight rail network and/or intermodal facilities. We assume the stakeholder comment cited in Slide 34 may refer to the “Addresses the Needs of Basic Sector Industries” criterion, which includes an element for increasing access to port facilities. However, any slight potential for overlap with respect to port facilities does not, in our view, justify eliminating a proposed criterion that is based on a much broader set of transportation modes and facility types, and we recommend that it be added back to the changes that will be presented to the HRTPO Board later this month.
II. Including Resiliency in the Project Prioritization Tool
For many of the same reasons we strongly support adding to the PPT an environmental criterion that assesses a project’s impacts to natural areas, we are also in favor of adding a resiliency component that would generally work to discourage the building of new transportation projects in areas threatened by flooding and other effects of climate change. For this reason, we think the current proposal’s default position of rewarding points to projects that are not located in areas vulnerable to sea level rise, storm surge, or recurrent flooding is a good one.
Under the proposed changes, projects that are proposed in vulnerable areas would be awarded points if: (1) the applicant has “developed planned improvements or adaptation strategies to address future sea level rise/storm surge/recurrent flooding” (see slide 6 in the Additional Resource Slides presentation); or (2) the project provides access to critical areas or facilities such as hospitals, emergency shelters, and dense employment areas.2
We are concerned that the first of these two prongs is too vague and could be read to cover situations as broad as one in which a locality is awarded points for a project proposed in a
2 We note that the criterion related to providing access to critical facilities was adjusted in the most recent proposal to reflect our previous suggestion to limit it to facilities that are actually located in vulnerable areas (so that a new road linking to a hospital in an area that is not at risk for flooding would not receive resiliency points), and we appreciate our suggestion being incorporated.

I N T R O D U C T I O NP R O J E C T E VA LUAT I O N A N D S C O R I N G 106 P U B L I C C O M M E N T SP R O J E C T E VA LUAT I O N A N D P R I O R I T I Z AT I O N 106
A PPE ND IX B: PU B LI C C O M M E NT S - SE LC
5
vulnerable area simply because the locality has developed a locality-wide sea level rise plan, regardless of whether the project itself is designed to withstand projected flooding. We recommend being clear about what would qualify as “planned improvements or adaptation strategies” to help limit this criterion to a more focused and appropriate set of situations in which the project design clearly incorporates climate resiliency.
Taking this a step further, we recommend that projects proposed in vulnerable areas should only be eligible for resiliency points if they include design features that make them resilient to flooding and fall into one (or both) of two categories: (1) the project is an improvement to an existing transportation facility that currently floods or is projected to flood in the reasonable future (e.g., raising an existing roadway that regularly floods); or (2) the project—either an improvement to an existing project or a new project—would significantly improve access to critical areas or facilities that are currently disrupted, or projected to be disrupted in the reasonable future, by flooding or related effects of climate change. We urge the HRTPO to consider adjusting the resiliency measure along these lines to help ensure that the types of projects that would be awarded points for providing a resiliency benefit would actually do so.
III. Diluting Project Viability Measure through Application of the Cost Effectiveness Criterion
SELC is concerned with the proposed move of the Cost Effectiveness criterion from the Project Utility measure to the Project Viability measure for all categories of projects, particularly in conjunction with the proposed change to the way Cost Effectiveness would be measured.
As proposed, Cost Effectiveness would be measured by comparing a project’s estimated cost to the sum of its scores under the Project Utility measure and the Economic Vitality measure, and it would comprise twenty percent (20 of total 100 points) of a proposal’s Project Viability score. We believe that basing twenty percent of the Project Viability score on the sum of the Project Utility and Economic Vitality scores would exaggerate the value of those two measures at the expense of the Project Viability measure and the important criteria it includes, such as a project’s environmental impact.
Instead, we urge the HRTPO to either move the Cost Effectiveness criterion to the Economic Vitality measure, or to include it as a fourth, stand-alone measure. In both cases, we also recommend reallocating its 20-point allotment within the Project Viability measure to the environmental criteria in order to help boost these criteria’s overall value to a more significant level.
6
IV. Ensuring Economic Distress Factor Takes Broad View of Potential Impacts
We support adding an “economic distress” factor to the PPT that would reward projects benefitting areas with lower-income neighborhoods or high unemployment. Past and current transportation policies and decision-making have too often generated more adverse impacts and fewer benefits for poor communities, burdening them with a disproportionate share of transportation pollution while often inadequately investing in mobility options. As a result, it is essential that we address these flaws in our policies and decision-making going forward. However, the proposed “economic distress” factor could have the opposite effect if it is measured in a way that rewards projects that would further disrupt or harm these communities by, for example, routing a new highway right next to—or even through—them.
It appears the economic distress factor will focus on the extent to which a project would improve congestion and travel time in and around lower-income and high unemployment areas. Using the example of a new highway project again, the traffic modeling for a new freeway proposed next to a low-income neighborhood may well indicate that residents of that neighborhood would have a faster route to a nearby area of high job concentration. But if the freeway would take land from the neighborhood or negatively impact its air quality, faster travel times or reduced congestion may be of small solace—particularly for those residents of the neighborhood who cannot afford a car or are unable to drive. We therefore urge the HRTPO to make sure the “economic distress” factor is measured and applied in a way that takes the potential for detrimental impacts to low-income areas into account.
Thank you again for engaging us in the process of updating the PPT and for your consideration of our comments and recommendations. Please do not hesitate to contact me if you would like to discuss any of this further.
Sincerely,
Morgan Butler Senior Attorney

I N T R O D U C T I O NP R O J E C T E VA LUAT I O N A N D S C O R I N G 107 P U B L I C C O M M E N T SP R O J E C T E VA LUAT I O N A N D P R I O R I T I Z AT I O N 107
A PPE ND IX B: HR TP O PRE SE NTATI O N
2045 LONG-RANGE TRANSPORTATION PLAN
Long-Range Transportation Plan SubcommitteeJune 3, 2020Dale M. Stith, AICP, GISPPrincipal Transportation Planner
PROJECT PRIORITIZATIONRECOMMENDED ENHANCEMENTS –PUBLIC COMMENTS
Agenda Item #7
Hampton Roads 2045 Long-Range Transportation Plan
PROJECT PRIORITIZATION ENHANCEMENTS: PUBLIC COMMENTS
▪ Public comment received from Southern Environmental Law Center (SELC)
▪ In preparation for this LRTP Subcommittee meeting, HRTPO staff requested members of the Prioritization Task Force (PTF) to review these public comments and initial staff responses and provide feedback via email
3
Hampton Roads 2045 Long-Range Transportation Plan
PROJECT PRIORITIZATION RECOMMENDED ENHANCEMENTS: REVIEW
▪ April 2017 – LRTP Subcommittee recommended HRTPO staff update Project Prioritization Tool
▪ 2018-2019: Coordination with regional stakeholders▪ January 2020 – Prioritization Task Force approval▪ February 2020 – LRTP Subcommittee and TTAC approval▪ Public Review: February 6 – March 6, 2020
• Created new webpage on HRTPO website to aid in public review• Posted Summary of Recommended Enhancements and Additional Resource
Slides
2
Hampton Roads 2045 Long-Range Transportation Plan
HRTPO STAFF NOTE
▪ It is important to keep in mind that the application of the Project Prioritization Tool provides flexibility for the fine-tuning or adjustment of measures and points during the project evaluation phase in instances where consistent data cannot be obtained or when all responses are the same (e.g. all “yes” responses), providing no distinction between projects, etc.
▪ Due to this flexibility, some of the suggestions from SELC (or others that come up during project evaluation) can be considered and incorporated if the LRTP Subcommittee deems them appropriate as we evaluate the candidate projects.
4

I N T R O D U C T I O NP R O J E C T E VA LUAT I O N A N D S C O R I N G 108 P U B L I C C O M M E N T SP R O J E C T E VA LUAT I O N A N D P R I O R I T I Z AT I O N 108
A PPE ND IX B: HR TP O PRE SE NTATI O N
Hampton Roads 2045 Long-Range Transportation Plan
SUMMARY OF SELC COMMENTS
SELC General Comments▪ SELC “strongly supports using
objective criteria to evaluate and prioritize transportation proposals”
▪ Commends “the HRTPO for being pioneers in Virginia in this regard”
▪ Applauds the HRTPO for taking the initiative to review and update the Tool to consider improvements in available data and examine potential shifts in regional priorities in response to growing challenges
SELC Specific Comments▪ Enhancing Consideration of a Project’s
Environmental Impacts• Factoring in Impacts to Natural Resources• Valuing Impacts to Natural and Cultural
Resource Acreage Adequately• Assessing Natural and Cultural Resource
Acreage Impacts for Active Transportation Projects
• Rewarding Projects that Improve Freight Rail Networks or Intermodal Facilities
▪ Including Resiliency in the Tool▪ Diluting Project Viability Measure through
Application of the Cost Effectiveness Criterion▪ Ensuring Economic Distress Factor Takes Broad
View of Potential Impacts
5
Hampton Roads 2045 Long-Range Transportation Plan
SUMMARY OF SELC COMMENTS
▪ Valuing Impacts to Natural and Cultural Resource Acreage Adequately• SELC urges the HRTPO to increase the value of the “Acres of Natural and Cultural Resources” criterion
to better reflect its importance▪ Suggests reallocating value from the “Environmental MOEs/Basic Environmental Review” to “Acres of Natural
and Cultural Resources” ▪ The “Basic Environmental Review” criterion as presented on the Additional Resource Slides (slide 33) “misses
the mark as an assessment of environmental impacts.”▪ Note: these measures (slide 33 of the Additional Resource Slides) are meant as placeholder measures, which
was noted at Prioritization Task Force and LRTP Subcommittee meetings. Initial suggestion for this criteria was to use SMART SCALE measures (fairly design-specific and not necessarily suited to many LRTP projects in the early planning phase)
▪ HRTPO staff recommendation: as previously discussed with the PTF and LRTP Subcommittee, wait until staff has real data to better evaluate how to best apply these 3 points
• If data collected for these MOEs are deemed inconsistent, then re-allocating points to “Acres of Natural and Cultural Resources” criterion can be done easily as they are in same category and section
▪ PTF Feedback: Pushing points into acreage values doesn’t always help (e.g. large project with completed EA and vetted alternative could score worse than a medium-size project with no environmental work)
7
Hampton Roads 2045 Long-Range Transportation Plan
SUMMARY OF SELC COMMENTS
▪ Factoring in Impacts to Natural Resources• SELC strongly supports “adding consideration of projects’ environmental impacts”
and using “natural and cultural resource acreage as a primary element”• SELC supports the resources to be used to assess this criterion, stating specifically
that “wetlands and other types of conservation lands and wildlife habitats are of particular importance in Hampton Roads because of the vital protections they provide to communities by slowing and storing floodwaters and by buffering against storm surges and rising seas” adding that “it is imperative that the [Tool] take into account the extent to which a transportation proposal would negatively impact these natural resiliency resources.”
▪ HRTPO staff response: no action required▪ PTF Feedback: Environmental measure in previous rounds of SMART SCALE was tied to
acres of disturbance. Smaller projects would score higher not because of benefit but because they were small. Modifications have been made for Round 3 of SMART SCALE.
6
Hampton Roads 2045 Long-Range Transportation Plan
DRAFT ENVIRONMENTAL MOES
▪ Environmental MOEs (3 points max)• Project includes special accommodations for hybrid or electric vehicles or space or
infrastructure for electric vehicle parking/charging• Project includes energy efficient infrastructure or fleets, including: hybrid or
electric buses, electronic/open road tolling, alternative energy infrastructure (e.g. roadside solar panels)
• Project includes transit system improvements or reduces delay on a roadway with scheduled peak service or 1 transit vehicle per hour
• Add new point opportunity: Project includes improvements to passenger rail/rail facilities, the freight rail network, or intermodal (truck to rail) facilities/ports/terminals – refer to Slide 10 of this slide deck
8

I N T R O D U C T I O NP R O J E C T E VA LUAT I O N A N D S C O R I N G 109 P U B L I C C O M M E N T SP R O J E C T E VA LUAT I O N A N D P R I O R I T I Z AT I O N 109
A PPE ND IX B: HR TP O PRE SE NTATI O N
Hampton Roads 2045 Long-Range Transportation Plan
SUMMARY OF SELC COMMENTS
▪ Assessing Natural and Cultural Resource Acreage Impacts for Active Transportation Projects• SELC expressed concern over awarding points for Active Transportation (AT)
projects that provide/increase access to natural/cultural resources (as opposed to awarding points based on avoiding impacts for other project categories) as these AT projects could “impact the very areas to which they are providing access”
• Note: the suggestion to award points for AT projects providing access came from an LRTP Subcommittee member and was supported by other members
▪ HRTPO staff recommendation: if the majority still agrees with this approach, then retain; otherwise, use same approach as other project categories
▪ PTF Feedback: In favor of keeping this as-is. Scoring system is in place to address concerns of impact to resources outweighing the ability to access them. Positive impact is improving access to the resource instead of improved access will make more money.
9
Hampton Roads 2045 Long-Range Transportation Plan
SUMMARY OF SELC COMMENTSOriginal Proposed Enhancement Modified (and approved) Proposed Enhancement
• Modifications for Project Reduces Traffic Delay at a Congested Intersection, Interchange, or Other Bottleneck still captures air quality benefits but isn’t limited to Intermodal/Freight projects
• Reassigning the 2 points from the Project Includes Improvements to Freight Rail to Congested intersection/ interchange/bottleneck with a High Percentage of Truck Traffic captures the added air quality benefits of reducing truck idling times at congested bottlenecks
• Note: Add an additional point opportunity response to the Environmental MOEs (3 Point section) capturing the removed measure (see slide 12 of this slide deck)
11
Hampton Roads 2045 Long-Range Transportation Plan
SUMMARY OF SELC COMMENTS
▪ Rewarding Projects that Improve Freight Rail Networks or Intermodal Facilities• There was a criterion being considered that would reward points to projects that
improved the freight rail network or intermodal facilities• SELC believes this is a suitable environmental criterion because transportation
improvements that help move freight from highways to other modes can provide significant air quality benefits.
• Note: originally proposed as an Environmental criterion to capture air quality benefits (2 points). Modified as discussed on slide 10.
▪ HRTPO staff recommendation: • Leave these modifications as approved• Add an additional point opportunity response to the Environmental MOEs (3 Point
section) capturing the removed measure (see slide 7 of this slide deck)▪ PTF Feedback: Agree with HRTPO staff recommendation
10
Hampton Roads 2045 Long-Range Transportation Plan
SUMMARY OF SELC COMMENTS
▪ Including Resiliency in the Tool• SELC supports resiliency criterion that generally discourages “the building of new
transportation projects in areas threatened by flooding and other effects of climate change” but recommends making scoring language more clear
▪ HRTPO staff recommendation: refine language to award points (3 points) for projects in vulnerable areas that have:• developed planned improvements or adaptation strategies to address future sea level
rise/storm surge/recurrent flooding and the project includes design features that make it resilient to flooding
▪ For Access to Critical Facilities (2 points):• reword current measure to assess what level of access is or will be provided by the
candidate project to critical areas or facilities (e.g. hospitals, Fire-EMS, emergency shelters, dense employment areas, and single entry/exit points) that are projected to be disrupted by flooding or related effects of climate change
▪ PTF Feedback: Agree with adding design features note12

I N T R O D U C T I O NP R O J E C T E VA LUAT I O N A N D S C O R I N G 110 P U B L I C C O M M E N T SP R O J E C T E VA LUAT I O N A N D P R I O R I T I Z AT I O N 110
A PPE ND IX B: HR TP O PRE SE NTATI O N
Hampton Roads 2045 Long-Range Transportation Plan
SUMMARY OF SELC COMMENTS
▪ Diluting Project Viability Measure through Application of the Cost Effectiveness Criterion• SELC is concerned Cost Effectiveness, now a criterion in the Project Viability
component (moved from Project Utility), would exaggerate the value of the Project Utility and Economic Vitality scores at the expense of Project Viability measures which includes a project’s “environmental impact”
• HRTPO staff has noted in previous meetings that the revised calculation for Cost Effectiveness will be finalized when we evaluate candidate projects (and have real data scores)
▪ HRTPO staff recommendation: Keep measure in Project Viability and wait until we evaluate 2045 LRTP candidate projects to finalize calculation
13
Hampton Roads 2045 Long-Range Transportation Plan
RECOMMENDED ACTION
▪ For discussion and modify Project Prioritization Tool Recommended Enhancements as necessary
15
Hampton Roads 2045 Long-Range Transportation Plan
SUMMARY OF SELC COMMENTS
▪ Ensuring Economic Distress Factor Takes Broad View of Potential Impacts• SELC supports adding “economic distress” factors to the Tool• Concerned that the proposed economic distress factors, if not measured
appropriately, could further disrupt or harm lower-income neighborhoods or areas of high unemployment
▪ HRTPO staff response: In addition to these economic distress measures, there are other Title VI/Environmental Justice measures in the Tool. Also, 2045 LRTP candidate projects are analyzed separately using the HRTPO Title VI/Environmental Justice Methodology.
14

I N T R O D U C T I O NP R O J E C T E VA LUAT I O N A N D S C O R I N G 111 P U B L I C C O M M E N T SP R O J E C T E VA LUAT I O N A N D P R I O R I T I Z AT I O N 111
A PPE ND IX B: A D D ITI O N A L PU B LI C C O M M E NT S - SE LC
1
Dale Stith
Subject: FW: SELC comments on proposed changes to HRTPO's project prioritization tool
From: Dale Stith Sent: Friday, July 03, 2020 1:02 PM To: Morgan Butler ([email protected]) <[email protected]> Subject: RE: SELC comments on proposed changes to HRTPO's project prioritization tool Hi Morgan, We’re all still doing well and getting better at being productive working remotely (as soon as we’re experts at it, it’ll be time to go back into the office). Thank you for the words of support regarding your comments. We appreciate all the time you’ve dedicated to thoroughly reviewing our products and processes, helping us ensure we have appropriate and relevant tools in developing regional plans and recommendations. I’ve included responses to your questions below, in red. Please let me know if I can be of further assistance. Enjoy your holiday weekend! Dale Dale M. Stith, AICP, GISP Principal Transportation Planner Hampton Roads Transportation Planning Organization The Regional Building | 723 Woodlake Drive | Chesapeake, VA 23320 [email protected] | www.hrtpo.org | Phone: 757.420.8300 | Fax: 757.523.4881
From: Morgan Butler <[email protected]> Sent: Thursday, July 02, 2020 1:14 PM To: Dale Stith <[email protected]> Subject: RE: SELC comments on proposed changes to HRTPO's project prioritization tool Good afternoon, Dale, I hope you’re doing well and looking forward to the holiday weekend! We finally had a chance to review the presentation you shared from the LRTP subcommittee and compare it to your summary of the meeting below. We wanted to be sure to let you know that we appreciate you taking the time to really understand our recommendations and then walk through each of them with the subcommittee. Among other resulting improvements, we think the refinements you proposed to the language for some of the resiliency considerations are helpful, and we also appreciate you proposing to add the new point opportunity for rail‐related improvements (I’m using
2
shorthand there, of course) to the Environmental MOEs. In short, we thank you for carefully considering our comments and proposing some minor but beneficial tweaks based on them! I do have two (hopefully quick) questions for you. First, are the Environmental MOEs listed on page 7 of your LRTP subcommittee presentation the ones you are proposing to start with (understanding that you may make changes once you see how they are working in practice)? For what it may be worth, we think the four MOEs listed on page 7 of your presentation are much better than the three MOEs that were included on page 33 of the Additional Resource Slides (which were: (a) Is there a fatal flaw for permitting?; (b) Is the intrusion into sensitive areas justified?; and (c) Does the project significantly reduce emissions?), and we wanted to make sure we’re reading your intent there correctly. Correct, the Environmental MOEs listed on slide 8 are the ones we’re currently collecting data for. If, after collecting all the project data, we see any issues with the consistency/accuracy/applicability of the data received, we will re‐address these measures with the LRTP Subcommittee. Second, I noticed from your presentation that there may have been some minor pushback from one of the subcommittee members to using acreage to measure impacts to natural and cultural resources (seemingly based on a concern that doing so might hurt larger projects). But as I read your summary, you all are still planning to go with that approach in the updated tool. I just wanted to make sure I have that right since we believe that measuring impacts to natural resources such as wetlands is one of the most important improvements being made to the tool during this update. As you’re likely well aware, there are ways to address concerns about potential bias against larger projects resulting from measuring acreage impacts, and I would be happy to discuss those with you if it might be helpful. Correct, we are not adjusting the approach of using acreage to measure potential impacts to natural and cultural resources. The point made by the subcommittee member wasn’t so much directed at having us change the recommended approach but instead to make sure we were all aware of potential issues. Thank you for any light you can shed on these two questions, and thank you for the responsiveness you have shown to public comment throughout this entire process. Best, Morgan From: Dale Stith [mailto:[email protected]] Sent: Wednesday, June 10, 2020 10:56 AM To: Morgan Butler Subject: RE: SELC comments on proposed changes to HRTPO's project prioritization tool We plan on presenting the recommended enhancements to the Board at their July meeting. In order to keep the 2045 LRTP on schedule, we’ve already started collecting data for the candidate projects and anticipate having draft scores in the Fall. These draft scores will be available for public review. Once finalized, the scores will be used in our fiscal‐constraint process (late 2020/early 2021). Thanks, Dale From: Morgan Butler <[email protected]> Sent: Wednesday, June 10, 2020 10:36 AM To: Dale Stith <[email protected]> Subject: RE: SELC comments on proposed changes to HRTPO's project prioritization tool Thanks, Dale. No need to apologize; we appreciate you all working to provide the public an opportunity to listen in. I think we’re all constantly working out kinks as we make adjustments to keep people safe under the current circumstances.

I N T R O D U C T I O NP R O J E C T E VA LUAT I O N A N D S C O R I N G 112 P U B L I C C O M M E N T SP R O J E C T E VA LUAT I O N A N D P R I O R I T I Z AT I O N 112
A PPE ND IX B: A D D ITI O N A L PU B LI C C O M M E NT S - SE LC
3
I’ll read through the presentation and your summary and let you know if I have any questions on any of it. In the meantime, I was hoping you could give me a rough sense of next steps and when you expect the updated PPT to be formally adopted and in place. Thanks! Morgan From: Dale Stith [mailto:[email protected]] Sent: Wednesday, June 10, 2020 10:14 AM To: Morgan Butler Subject: RE: SELC comments on proposed changes to HRTPO's project prioritization tool Good Morning Morgan, I apologize the call wasn’t more clear for Carroll to hear all the dialogue. I will mention this to our technical staff so they can hopefully improve that for future meetings. Our minutes are generally summary, so I’m not sure at this point how much detail will be included (I expect to review the draft minutes later this week). These minutes will be included for approval at our next LRTP Subcommittee Meeting which is scheduled for July 1, 2020. In the interim, I can hopefully speak to specific questions you may have. For reference, the presentation for this item has been posted to our website: https://www.hrtpo.org/uploads/docs/060320%2007‐Presentation%202045%20LRTP%20Prioritization%20Public%20Comments.pdf In terms of actions, the LRTP Subcommittee moved to retain the proposed enhancements, but did refine some measures and acknowledged that many of the suggestions in your letter can be further addressed as we score candidate projects for the Plan (noted in the presentation). Below is a summary of the discussion:
will revisit how best to score/allocate the points for the Environmental MOEs as we obtain real project data (starting with SMART SCALE measures for this criterion) – refer to slide 7
added a new point opportunity to the Environmental criterion (projects that improve passenger rail/rail facilities, the freight network, or intermodal facilities/ports/terminals) – refer to slides 8, 10, 11
retained awarding points for Active Transportation projects that provide access to Natural and Cultural Resources – refer to slide 9
refined resiliency language – refer to slide 12 will refine Cost Effectiveness measure once all the data is collected – refer to slide 13 Economic Distress Factors – refer to slide 14. We also have 2 draft reports currently out for review:
o Draft Regional Needs Report: https://www.hrtpo.org/uploads/docs/HR_2045LRTP_RegionalNeeds.pdf o Draft Title VI/Environmental Justice Candidate Project
Evaluation: https://www.hrtpo.org/uploads/docs/HR_2045LRTP_TitleVI‐EJ‐CandidateProjectEvaluation.pdf
Please let me know if you have further questions. As always, we appreciate your interest and engagement in helping improve our products/processes. Thanks and take care, Dale Dale M. Stith, AICP, GISP
4
Principal Transportation Planner Hampton Roads Transportation Planning Organization The Regional Building | 723 Woodlake Drive | Chesapeake, VA 23320 [email protected] | www.hrtpo.org | Phone: 757.420.8300 | Fax: 757.523.4881
From: Morgan Butler <[email protected]> Sent: Monday, June 08, 2020 3:05 PM To: Dale Stith <[email protected]> Subject: RE: SELC comments on proposed changes to HRTPO's project prioritization tool Hi Dale, Thank you again for your efforts to make sure we were aware of, and able to listen to, the LRTP subcommittee meeting last week. My colleague, Carroll, was able to call in, but she mentioned it was quite tough to hear at certain points, so she wasn’t able to get a great sense of what, if any, new changes the subcommittee recommended. Are those recommended changes something you plan to list in the meeting minutes? If so, we’ll look forward to receiving a copy of those, but if it might be a while before those are completed, is it possible for you to let us know any new changes the subcommittee recommended last week? Also, what are the next steps for the PPT at this point? I believe at one point you mentioned you would need to take the full package of recommended changes to the HRTPO. Am I remembering that right? If so, what’s your best guess at this point for when that’s likely to occur? I know all you have put a lot of hard work into the changes and I assume you’re wanting them to be adopted in time for use in developing the 2045 LRTP’s list of projects? Thank you for any additional information you can provide! Best, Morgan Morgan Butler Senior Attorney Southern Environmental Law Center 201 West Main Street, Suite 14 Charlottesville, VA 22902 (434) 977‐4090 From: Dale Stith [mailto:[email protected]] Sent: Wednesday, June 03, 2020 10:46 AM To: Morgan Butler Subject: Re: SELC comments on proposed changes to HRTPO's project prioritization tool
Hi Morgan,
The TTAC meeting has been moving quickly. I think it will be wrapping up soon.

I N T R O D U C T I O NP R O J E C T E VA LUAT I O N A N D S C O R I N G 113 P U B L I C C O M M E N T SP R O J E C T E VA LUAT I O N A N D P R I O R I T I Z AT I O N 113
A PPE ND IX B: A D D ITI O N A L PU B LI C C O M M E NT S - SE LC
5
Dale
From: Morgan Butler <[email protected]> Sent: Wednesday, June 3, 2020 9:38:50 AM To: Dale Stith Subject: RE: SELC comments on proposed changes to HRTPO's project prioritization tool Thanks, Dale. Based on this, I think I’ll recommend to Carroll that she call in around 11:15 or so. And we’ll be sure to follow up after the meeting if we have any questions. Best, Morgan From: Dale Stith [mailto:[email protected]] Sent: Wednesday, June 03, 2020 9:11 AM To: Morgan Butler Subject: RE: SELC comments on proposed changes to HRTPO's project prioritization tool Good Morning Morgan, If the TTAC finishes before 11:30 AM, we’ll start the LRTP Subcommittee Meeting early. I imagine we’d take a few minutes between meetings to “switch” between TTAC and LRTP. This being our first time using WebEx in this fashion, I’m not completely sure how smooth/unsmooth the transition will be (and if we’re going to ask participants to stay on the line or call back in), so bear with us. Also, you’ll hear me say this in the meeting today, but most of your suggestions are things that I think we can address as we evaluate the candidate projects (as our Tool provides us flexibility in how we calculate scores based on data available, issues we may run into, etc.). Thanks and please follow up with me if you have additional questions after the meeting. Dale Dale M. Stith, AICP, GISP Principal Transportation Planner Hampton Roads Transportation Planning Organization The Regional Building | 723 Woodlake Drive | Chesapeake, VA 23320 [email protected] | www.hrtpo.org | Phone: 757.420.8300 | Fax: 757.523.4881
From: Morgan Butler <[email protected]> Sent: Wednesday, June 03, 2020 7:17 AM To: Dale Stith <[email protected]> Subject: RE: SELC comments on proposed changes to HRTPO's project prioritization tool Good morning, Dale,
6
I wanted to let you know that I do plan to call in for the LRTP Subcommittee today meeting to hear the discussion on the PPT, but I have an 11:00 meeting that may run past the 11:30 start time. My colleague, Carroll Courtenay, plans to call in and listen until I’m able to join. One quick question – you mentioned the LRTP Subcommittee meeting starts immediately after the TTAC meeting. I’m just curious how you handle the start time of the LRTP Subcommittee meeting if the TTAC meeting ends before 11:30. I’d like to let Carroll know if she should plan to call in a little before 11:30 just to be safe. Thanks! Morgan From: Dale Stith [mailto:[email protected]] Sent: Friday, May 29, 2020 5:12 PM To: Morgan Butler Subject: RE: SELC comments on proposed changes to HRTPO's project prioritization tool Hi Morgan, Hope you’re experiencing better weather in your area – it’s been dreary all day here in Virginia Beach. Hopefully the sun will show itself this weekend. I wanted to suggest adding you to the LRTP Subcommittee copy list. This will ensure that you receive all meeting notifications, agendas, and Minutes of each meeting. The public is invited to attend LRTP Subcommittee meetings and we would welcome your attendance. Please let me know if you should be the point of contact for this committee mailing and if not, who would be the appropriate person(s) to add to this list. With regards to your request that we provide you with the comments provided by the LRTP prioritization task force to HRTPO staff, our protocol is that task force comments first feed directly into the LRTP Subcommittee itself. Those comments will be reviewed and discussed during the subcommittee meeting, along with the comments submitted by SELC, and as such, be read into Minutes of the meeting which are subsequently made available on the HRTPO website. I do recommend that if you would like to be present during the discussion of this item, that you listen in on next week’s electronic LRTP Subcommittee meeting. In addition to listening in, members of the public are invited to submit a public comment before Noon the day before the meeting. Should you have any point of clarification or any subsequent questions after the meeting, we encourage you to reach back out to us and/or submit additional comments. If you are able to listen in on next week’s LRTP Subcommittee meeting, I believe the meeting discussion will highlight the flexibility and responsiveness of the Prioritization Tool. Because the Tool is dynamic and able to be quickly adjusted to respond to and consider current trends, data issues, etc., HRTPO staff is confident that some of the issues raised in SELC’s comments will in fact be addressed by the Tool’s functionality. However, I am excited to present your comments to the subcommittee and again, hope you can listen to the ensuing discussion. Thanks and have a great weekend! Dale Dale M. Stith, AICP, GISP Principal Transportation Planner Hampton Roads Transportation Planning Organization The Regional Building | 723 Woodlake Drive | Chesapeake, VA 23320 [email protected] | www.hrtpo.org | Phone: 757.420.8300 | Fax: 757.523.4881

I N T R O D U C T I O NP R O J E C T E VA LUAT I O N A N D S C O R I N G 114 P U B L I C C O M M E N T SP R O J E C T E VA LUAT I O N A N D P R I O R I T I Z AT I O N 114
A PPE ND IX B: A D D ITI O N A L PU B LI C C O M M E NT S - SE LC
7
From: Morgan Butler <[email protected]> Sent: Thursday, May 28, 2020 9:52 PM To: Dale Stith <[email protected]> Subject: RE: SELC comments on proposed changes to HRTPO's project prioritization tool Thanks for keeping us in the loop, Dale. I notice the description of agenda item 7 mentions that the City of Hampton provided feedback on our comments. Was that done in a format you could share with us? I’d like to be able to offer any clarifications or provide answers to any questions they may have raised if it could be helpful. Best, Morgan From: Dale Stith [mailto:[email protected]] Sent: Thursday, May 28, 2020 6:49 PM To: Morgan Butler Subject: RE: SELC comments on proposed changes to HRTPO's project prioritization tool Hi Morgan, Hope you’re doing well. I wanted to let you know that we will be having an electronic LRTP Subcommittee meeting on Wednesday, June 3, immediately following our electronic Transportation Technical Advisory Committee meeting. The agenda for the LRTP Subcommittee meeting was posted today (link below). The public comments SELC submitted regarding the prioritization enhancements is an agenda item. https://www.hrtpo.org/events/details/796/lrtp‐subcommittee‐meeting/ Members of the public may listen to the meeting via telephone using toll‐free Dial‐In 1‐866‐345‐9178. Members of the public may also submit comments to the LRTP Subcommittee. However, due to the COVID‐19 crisis, public comments must be submitted in advance of the meeting by email to [email protected] or phone (757) 366‐4370. Each comment is limited to three minutes. All comments received by Noon on June 2, 2020 will be provided to the LRTP Subcommittee Members and included in the official record. Please let me know if you have any questions or if I can be of further assistance. Thanks, Dale Dale M. Stith, AICP, GISP Principal Transportation Planner Hampton Roads Transportation Planning Organization The Regional Building | 723 Woodlake Drive | Chesapeake, VA 23320 [email protected] | www.hrtpo.org | Phone: 757.420.8300 | Fax: 757.523.4881
8
From: Morgan Butler <[email protected]> Sent: Wednesday, May 20, 2020 3:32 PM To: Dale Stith <[email protected]> Subject: RE: SELC comments on proposed changes to HRTPO's project prioritization tool Thanks for the helpful update, Dale. Hang in there, and stay safe! Best, Morgan From: Dale Stith [mailto:[email protected]] Sent: Wednesday, May 20, 2020 9:49 AM To: Morgan Butler Subject: RE: SELC comments on proposed changes to HRTPO's project prioritization tool Good Morning Morgan, Hope you and your family are doing well. Cabin fever definitely gets worse for us as the weather improves. We’re hoping to be able to hold a virtual LRTP meeting soon. We’re holding our first virtual Board Meeting tomorrow and are hoping things run smooth enough that we feel confident about holding additional meetings using this same format. The comments your submitted on the PPT are included on the agenda under Correspondence of Interest (https://www.hrtpo.org/uploads/docs/052120%2009C%20Comment%20Letter%20on%20the%20Recommended%20Enhancements%20to%20the%20HRTPO%20Project%20Prioritization%20Tool.pdf) In terms of addressing the comments, since we haven’t been able to hold an LRTP meeting yet, I summarized and forwarded the comments via email to Prioritization Task Force members for their review and feedback. When we are able to hold a meeting (hoping to in early June), we will present SELC’s comments along with any feedback we receive from Task Force members. I’ll keep you posted once we schedule a meeting date/time. Stay well and let me know if you have any additional questions. Dale Dale M. Stith, AICP, GISP Principal Transportation Planner Hampton Roads Transportation Planning Organization The Regional Building | 723 Woodlake Drive | Chesapeake, VA 23320 [email protected] | www.hrtpo.org | Phone: 757.420.8300 | Fax: 757.523.4881

I N T R O D U C T I O NP R O J E C T E VA LUAT I O N A N D S C O R I N G 115 P U B L I C C O M M E N T SP R O J E C T E VA LUAT I O N A N D P R I O R I T I Z AT I O N 115
A PPE ND IX B: A D D ITI O N A L PU B LI C C O M M E NT S - SE LC
9
From: Morgan Butler <[email protected]> Sent: Wednesday, May 20, 2020 9:03 AM To: Dale Stith <[email protected]> Subject: RE: SELC comments on proposed changes to HRTPO's project prioritization tool Good morning, Dale, I wanted to touch base with you to see if there’s any update on the HRTPO’s consideration of the proposed changes to the project prioritization tool. I’m guessing you all are still in a holding pattern on the LRTP subcommittee meetings? Any update you could provide would be appreciated. I hope you and your family are doing well. Best, Morgan From: Morgan Butler Sent: Wednesday, March 18, 2020 10:39 PM To: 'Dale Stith' Subject: RE: SELC comments on proposed changes to HRTPO's project prioritization tool Hi Dale, Thanks for getting back to me, and no need to apologize. We’re doing okay so far, though the walls of our house seem to be starting to close in and I now have even more respect for teachers and for stay‐at‐home parents. I hope you and your family are all healthy and hanging in there during these tumultuous times. We appreciate your interest in our comments and in sharing them with the PWG and/or LRTP Subcommittee for their reaction and feedback. If you have any questions about any of our input, I’m happy to speak with you and could even try to attend the PWG/LRTP Subcommittee meetings if that would be helpful (though I definitely understand that timing of those is anything but clear at the moment). In other words, please feel free to follow up for more information, and I would appreciate it if you could keep me in the loop on the scheduling of those meetings in case it might be worthwhile for us to try to attend. All the best to you, Morgan From: Dale Stith [mailto:[email protected]] Sent: Wednesday, March 18, 2020 1:21 PM To: Morgan Butler Subject: Re: SELC comments on proposed changes to HRTPO's project prioritization tool
Good Afternoon Morgan,
Hope you, your family, and your staff are doing well and staying healthy during this coronavirus pandemic. I apologize it has taken me this long to confirm receipt of your comments on our Prioritization enhancements. It's been a little hectic to say the least as we adjust to working remotely.
10
In terms of your agency's submitted comments, we want to thank you and your staff for the time and attention you all have invested in reviewing the potential enhancements. Our plan is to bring these comments to our Prioritization Working Group and/or the LRTP Subcommittee, and will hold off on bringing the recommended enhancements to our HRTPO Board until after we receive feedback on your comments from the LRTP Subcommittee. We will also formally respond to your submitted comments, incorporating the feedback we receive from the LRTP Subcommittee.
Unfortunately at this point, I don't know when we will be able to hold the next LRTP Subcommittee. However, if you have any additional concerns or questions in the meantime, please don't hesitate to reach out to me.
Thank you again and stay safe.
Dale
From: Morgan Butler <[email protected]> Sent: Thursday, March 5, 2020 5:47:34 PM To: Dale Stith Subject: SELC comments on proposed changes to HRTPO's project prioritization tool Dear Ms. Stith, Attached please find comments from the Southern Environmental Law Center on the proposed changes to the HRTPO’s Project Prioritization Tool. Thank you for your hard work on this effort and for your consideration of our comments. Please do not hesitate to contact me with any questions or if you would like to discuss any of our recommendations further. Sincerely, Morgan Butler Morgan Butler Senior Attorney Southern Environmental Law Center 201 West Main Street, Suite 14 Charlottesville, VA 22902 (434) 977‐4090

I N T R O D U C T I O NP R O J E C T E VA LUAT I O N A N D S C O R I N G 116 P U B L I C C O M M E N T SP R O J E C T E VA LUAT I O N A N D P R I O R I T I Z AT I O N 116
A PPE ND IX B: D R A F T C A ND IDATE PROJ E C T E VA LUATI O N A ND PRI O RITIZ ATI O N RE P O R T PU B LI C N O TI C E
2 0 4 5 L O N G - R AN G E T R AN S P O RTAT I O N P L AN : D R AF T C AN D I DAT E P R O J E C T E VAL UAT I O N AN D
P R I O R I T I Z AT I O N R E P O RT
A co r e fun c t io n of th e HRTP O, th e m e t r o p ol i t an p l anning o r g an iz at io n (MP O) fo r th e Hamp to n Ro a ds ar ea , i s to d evelo p an d maint a in a Lo ng - Range Tr ans p o r t at io n Pl an (LRTP) . Th e LRTP is a b lu ep r int fo r p l ann e d t r ans p o r t at io n imp r ovem ent s over a 20 -year p l ann ing h o r izo n b as e d o n th e v is io n an d go al s of th e r eg io n . S in ce 2016, HRTP O s t af f has b e en co o r d inat ing w i th r eg io nal s t akeh old er s to up date th e LRTP to th e h o r izo n year of 2045.
HRTP O s t af f has d evelo p e d th e Ha m p t o n Ro a d s 204 5 L o n g Ra n g e Tra n s p o r t a t i o n Pl a n: C a n d i d a t e Pr o j e c t Eva l u a t i o n a n d Pr i o r i t i z a t i o n r ep o r t , th e f i f th in th e s er ie s of r ep o r t s d o cum ent ing th e d evelo p m ent of th e 2045 LRTP. Th is dr af t r ep o r t s ummar ize s th e evaluat io n an d p r io r i t i z at io n of c an d i date p r o je c t s b e ing co ns i d er e d fo r in c lus io n in th e LRTP, ut i l i z ing th e r eg io nal s cenar io p l ann ing f r am ewo r k an d up date d HRTP O Pr o je c t Pr io r i t i z at io n To ol . Re s ult s f r o m th is analys is w i l l s er ve as a g u i d ing to o l in d evelo p ing r eg io nal t r ans p o r t at io n p r io r i t i e s .
To r ev iew th e dr af t r ep o r t , c l i ck o n th e l ink b e low :
ht tp s://w w w.h r tp o.o r g/u p lo a d s/d o c s/HR _ 2045LRTP_ Pr o j e c tPr i o r i t iz a t i o n.p df
Fo r m o r e info r mat io n o n th e 2045 LRTP an d Pr o je c t Pr io r i t i z at io n , c l i ck o n th e l inks b e low :
2045 LRTP : ht tp s://w w w.h r tp o.o r g/p a g e/2045 - lo n g _ r a n g e -tr a n s p o r t a t i o n - p l a n/
Pr o je c t Pr io r i t i z at io n: ht tp s://w w w.h r tp o.o r g/p a g e/p r o j e c t- p r i o r i t iz a t i o n/
All inter e s te d p ar t ie s ar e en co ur age d to r ev iew th e dr af t r ep o r t an d s en d co mm ent s to Dale St i th , Pr in c ip al Tr ans p o r t at io n Pl ann er, at ds t i th @hr t p o.o r g o r by mai l to 723 Wo o dl ake D r i ve , Ch e s ap eake , V i r g in ia 23320 by D e c e m b e r 16, 2020 .
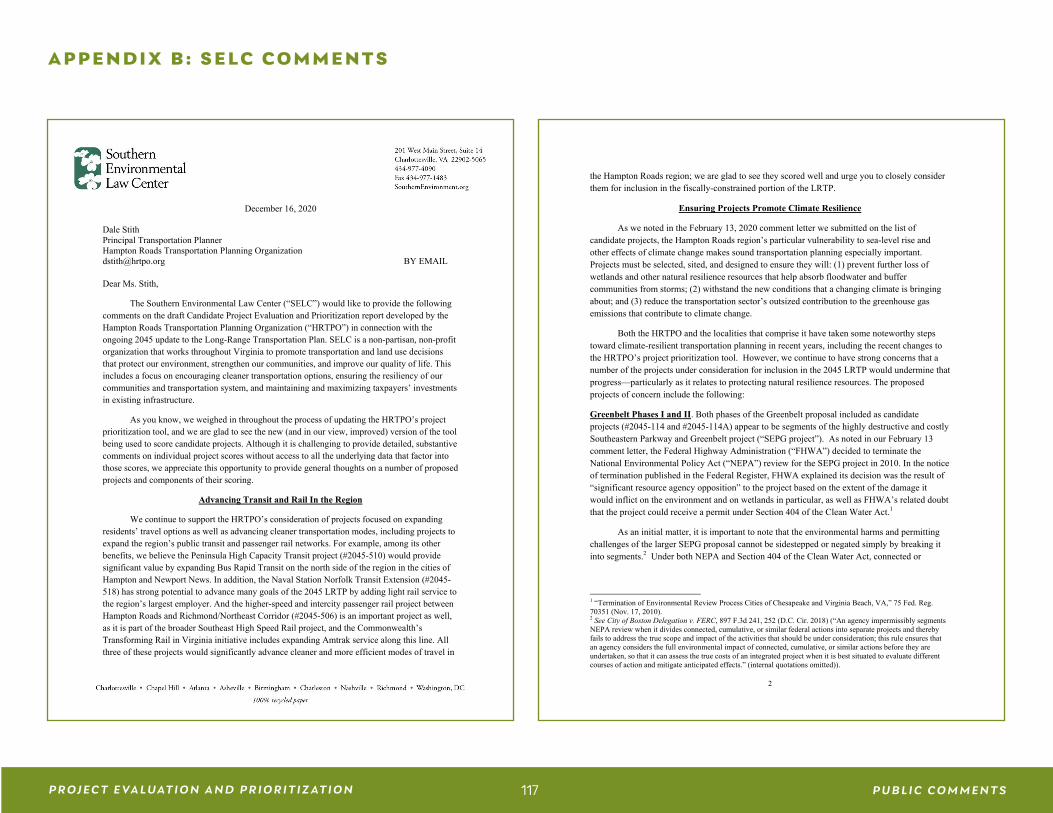
I N T R O D U C T I O NP R O J E C T E VA LUAT I O N A N D S C O R I N G 117 P U B L I C C O M M E N T SP R O J E C T E VA LUAT I O N A N D P R I O R I T I Z AT I O N 117
A PPE ND IX B: SE LC C O M M E NT S
December 16, 2020
Dale Stith Principal Transportation Planner Hampton Roads Transportation Planning Organization [email protected] BY EMAIL
Dear Ms. Stith,
The Southern Environmental Law Center (“SELC”) would like to provide the following comments on the draft Candidate Project Evaluation and Prioritization report developed by the Hampton Roads Transportation Planning Organization (“HRTPO”) in connection with the ongoing 2045 update to the Long-Range Transportation Plan. SELC is a non-partisan, non-profit organization that works throughout Virginia to promote transportation and land use decisions that protect our environment, strengthen our communities, and improve our quality of life. This includes a focus on encouraging cleaner transportation options, ensuring the resiliency of our communities and transportation system, and maintaining and maximizing taxpayers’ investments in existing infrastructure.
As you know, we weighed in throughout the process of updating the HRTPO’s project prioritization tool, and we are glad to see the new (and in our view, improved) version of the tool being used to score candidate projects. Although it is challenging to provide detailed, substantive comments on individual project scores without access to all the underlying data that factor into those scores, we appreciate this opportunity to provide general thoughts on a number of proposed projects and components of their scoring.
Advancing Transit and Rail In the Region
We continue to support the HRTPO’s consideration of projects focused on expanding residents’ travel options as well as advancing cleaner transportation modes, including projects to expand the region’s public transit and passenger rail networks. For example, among its other benefits, we believe the Peninsula High Capacity Transit project (#2045-510) would provide significant value by expanding Bus Rapid Transit on the north side of the region in the cities of Hampton and Newport News. In addition, the Naval Station Norfolk Transit Extension (#2045-518) has strong potential to advance many goals of the 2045 LRTP by adding light rail service to the region’s largest employer. And the higher-speed and intercity passenger rail project between Hampton Roads and Richmond/Northeast Corridor (#2045-506) is an important project as well, as it is part of the broader Southeast High Speed Rail project, and the Commonwealth’s Transforming Rail in Virginia initiative includes expanding Amtrak service along this line. All three of these projects would significantly advance cleaner and more efficient modes of travel in
2
the Hampton Roads region; we are glad to see they scored well and urge you to closely consider them for inclusion in the fiscally-constrained portion of the LRTP.
Ensuring Projects Promote Climate Resilience
As we noted in the February 13, 2020 comment letter we submitted on the list of candidate projects, the Hampton Roads region’s particular vulnerability to sea-level rise and other effects of climate change makes sound transportation planning especially important. Projects must be selected, sited, and designed to ensure they will: (1) prevent further loss of wetlands and other natural resilience resources that help absorb floodwater and buffer communities from storms; (2) withstand the new conditions that a changing climate is bringing about; and (3) reduce the transportation sector’s outsized contribution to the greenhouse gas emissions that contribute to climate change.
Both the HRTPO and the localities that comprise it have taken some noteworthy steps toward climate-resilient transportation planning in recent years, including the recent changes to the HRTPO’s project prioritization tool. However, we continue to have strong concerns that a number of the projects under consideration for inclusion in the 2045 LRTP would undermine that progress—particularly as it relates to protecting natural resilience resources. The proposed projects of concern include the following:
Greenbelt Phases I and II. Both phases of the Greenbelt proposal included as candidate projects (#2045-114 and #2045-114A) appear to be segments of the highly destructive and costly Southeastern Parkway and Greenbelt project (“SEPG project”). As noted in our February 13 comment letter, the Federal Highway Administration (“FHWA”) decided to terminate the National Environmental Policy Act (“NEPA”) review for the SEPG project in 2010. In the notice of termination published in the Federal Register, FHWA explained its decision was the result of “significant resource agency opposition” to the project based on the extent of the damage it would inflict on the environment and on wetlands in particular, as well as FHWA’s related doubt that the project could receive a permit under Section 404 of the Clean Water Act.1
As an initial matter, it is important to note that the environmental harms and permitting challenges of the larger SEPG proposal cannot be sidestepped or negated simply by breaking it into segments.2 Under both NEPA and Section 404 of the Clean Water Act, connected or
1 “Termination of Environmental Review Process Cities of Chesapeake and Virginia Beach, VA,” 75 Fed. Reg. 70351 (Nov. 17, 2010). 2 See City of Boston Delegation v. FERC, 897 F.3d 241, 252 (D.C. Cir. 2018) (“An agency impermissibly segments NEPA review when it divides connected, cumulative, or similar federal actions into separate projects and thereby fails to address the true scope and impact of the activities that should be under consideration; this rule ensures that an agency considers the full environmental impact of connected, cumulative, or similar actions before they are undertaken, so that it can assess the true costs of an integrated project when it is best situated to evaluate different courses of action and mitigate anticipated effects.” (internal quotations omitted)).

I N T R O D U C T I O NP R O J E C T E VA LUAT I O N A N D S C O R I N G 118 P U B L I C C O M M E N T SP R O J E C T E VA LUAT I O N A N D P R I O R I T I Z AT I O N 118
A PPE ND IX B: SE LC C O M M E NT S
3
cumulative projects cannot be evaluated in a piecemeal manner in order to minimize the appearance of adverse environmental impacts.3
Further, both of these Greenbelt segments would likely face major permitting challenges in their own right. Phases I and II appear to overlap with large portions of Segments F and E, respectively, of the SEPG project, which would have been routed through areas of significant ecological value, including high-quality wetlands and significant wildlife habitat located in the North Landing River and West Neck Creek watersheds and in the vicinity of Gum Swamp. These are important natural resilience resources that the region should be preserving. Moreover, it would be extremely difficult to mitigate the damage that a highway would cause to the ecological values these resources provide, and the cost of attempting to do so would be significant.
Turning to the draft scores for these two proposals, we question the ten points both projects received under the “project readiness” factor merely for being included in the current LRTP. It appears that the proposed projects received these points because the current LRTP includes a planned study of the Southeastern Parkway and Greenbelt proposal (Project 2040-86) in its list of fiscally-constrained studies. We question, however, whether either of these projects (or any other project) should receive points for merely being included in a previous LRTP as a study. In addition, due to the ecologically valuable areas these proposals would traverse and the likely difficulty and cost of minimizing impacts to those areas, we were also surprised to see both projects ranked only as “intermediate” for potential damage to natural and cultural resources.4
In short, there were good reasons why federal agencies decided against advancing the unduly destructive SEPG proposal after studying it. The two pieces of that project that are now represented by the Greenbelt Phase 1 and 2 proposals appear to impact a significant amount of the environmentally sensitive land along the SEPG project’s proposed route and would very 3 See Colony Fed. Sav. & Loan Ass’n v. Harris, 482 F. Supp. 296, 302 (W.D. Pa. 1980) (“There is substantial case law establishing that large projects may not be artificially segmented into smaller ones for the purpose of avoiding NEPA or minimizing the appearance of adverse environmental impact.”); Nat’l Res. Def. Council, Inc. v. Hodel, 865 F.2d 288, 297–98 (D.C.Cir.1988); Preserve Endangered Areas of Cobb’s History, Inc. v. U.S. Army Corps of Eng’rs, 87 F.3d 1242, 1247 (11th Cir.1996) (An applicant “cannot evade [its] responsibilities under [NEPA] by artificially dividing a major federal action into smaller components, each without a ‘significant’ impact.” (internal quotations omitted)). The 404(b)(1) guidelines, which the Corps use to evaluate Section 404 permits under the Clean Water Act, also “provide that the review may not be ‘piecemeal’ – a few acres here, a small tract there.” Buttrey v. United States, 690 F.2d 1170, 1180 (5th Cir. 1982); United States v. Rueth Dev. Co., 335 F.3d 598, 600 (7th Cir. 2003) (noting that the Corps denied a Section 404 permit application because the applicant had “present[ed] his development plans in a piecemeal fashion in an attempt to avoid a comprehensive review of their cumulative environmental impact”). 4 When we looked across the entire highway project category to see how the roughly 150 candidate highway projects were scored on this measure, we noted that more than 100 were ranked as “low” impact; roughly 40 were ranked as “intermediate” impact; and only four were ranked as “high” impact. This unlikely result leads us to ask what acreage thresholds were used to define those categories and to urge you to consider whether the thresholds should be adjusted to ensure a more realistic and more even dispersal of projects into the different categories, which would help give this component of project scoring greater utility in comparing and contrasting different projects.
4
likely encounter similar permitting challenges; yet their scores do not appear to sufficiently reflect these problematic issues. The environmental threats posed by these projects, the difficulty and cost of developing adequate mitigation for those threats, and the resulting permitting challenges strongly weigh against pursuing them. For all of these reasons, we recommend against including either of these projects in the fiscally-constrained portion of the LRTP.
US Route 460 Relocated. As noted in our February 13 letter, we continue to have serious concerns with the US Route 460 Relocated (#2045-117) proposal to build a new four-lane divided highway from the Suffolk Bypass to Zuni. The Virginia Department of Transportation’s (“VDOT”) previous plans for a new highway parallel to existing Route 460 along this stretch were extremely expensive relative to their limited benefits, and the HRTPO’s candidate project scoring process indicates that this continues to be the case. This $945 million project is expected to carry just 27,000 vehicles per day (a small fraction of its proposed capacity), and ranks near the very bottom of all projects scored in terms of cost-effectiveness. Further, VDOT’s previous plans faced major environmental permitting difficulties due to the severe impacts the project would have had on wetlands and streams along the corridor. We were therefore puzzled to see this proposal receive only a score of “low” for its potential damage to natural and cultural resources, providing further evidence that the scaling for this factor should be reconsidered.Nevertheless, the overall scoring clearly indicates that this proposal should not be included in the fiscally-constrained project list.
Nimmo Parkway Phase VII-B. We remain troubled by the proposal (# 2045-252) to extend the Nimmo Parkway across nearly a mile of the Back Bay National Wildlife Refuge in Virginia Beach. Wetlands and marsh make up 75 percent of the Refuge’s territory, and routing a road along the proposed path would likely destroy and disrupt important carbon sinks and wildlife habitat, while also altering the area’s hydrology in a way that could increase flooding in nearby communities. The project’s environmental impacts were ranked as “intermediate,” and its overall project score places it in roughly the bottom one-third of candidate highway projects that were scored. We urge you not to include Nimmo Parkway Phase VII-B in the fiscal-constraint list and to explore less damaging alternatives instead.
I-564/I-664 Connector and VA-164 Connector. We also have concerns with the project scoring second-highest overall in the “Bridges and Tunnels” category—the proposed I-564/I-664 Connector and VA-164 Connector (#2045-401). In evaluating proposed improvements for the recent Hampton Roads Crossing Study, VDOT found that the improvement segment representing the VA-164 Connector (“Alignment Segment 13”) would destroy far more wetlands (61 acres) and impact much more endangered and threatened species habitat (101.7 acres) than any other segment assessed in the study.5 Not surprisingly, this is one of the few projects that received a score of “high” in terms of its potential natural and cultural resource impacts in this LRTP
5 See Hampton Roads Crossing Study Supplemental Environmental Impact Statement, Natural Resources Technical Report at A-6, A-9 (July 2016).

I N T R O D U C T I O NP R O J E C T E VA LUAT I O N A N D S C O R I N G 119 P U B L I C C O M M E N T SP R O J E C T E VA LUAT I O N A N D P R I O R I T I Z AT I O N 119
A PPE ND IX B: SE LC C O M M E NT S
5
process. Despite its high overall scoring rank, it is also important to note that due to its exorbitant $5.1 billion estimated cost, this proposal was also found to be one of the least cost-effective of all projects scored. For these reasons, we recommend against including this project in the fiscally-constrained project list.
Bowers Hill Interchange. Another project we were surprised to see scoring “low” in the natural and cultural resource impacts category is the Bowers Hill Interchange (#2045-308) project. While we recognize the importance of this interchange to the Hampton Roads transportation network, it is located in an area with significant natural resources, including substantial wetlands, forests, and floodplains. This area also includes significant historic and cultural resources, as well as several communities—including a number of environmental justice communities—that could be adversely affected by proposed improvements at this interchange. The adverse effects of any proposals for this interchange thus need to be carefully considered, along with any alternatives and mitigation measures to minimize these impacts. Among other things, serious consideration should be given to options to upgrade transit service in this area, as well as cost-effective operational enhancements, transportation demand management strategies, and other targeted improvements that can be accommodated within existing right-of-way.
US 460/58/13 Connector. Finally, in our February 13 letter, we raised concerns about previous proposals for the US 460/58/13 Connector project (now designated as #2045-116) that involved widening this highway, which runs alongside the Great Dismal Swamp National Wildlife Refuge and some of Virginia’s most important habitat areas. Although we are encouraged to see that the proposal scored in the LRTP process has been pared down to primarily consist of safety improvements, we continue to urge HRTPO to ensure that any proposals advanced along this corridor—and particularly any proposals for an interchange at the regional landfill—be sited and designed to first avoid and then minimize any adverse effects to sensitive resources in this area to the greatest possible extent.
Thank you for your consideration of these comments as you finalize project scores and prepare to turn to the fiscal-constraint portion of the LRTP update. Please do not hesitate to contact us if you have any questions or would like to discuss any of our comments further.
Sincerely,
Morgan Butler Travis Pietila Senior Attorney Staff Attorney

I N T R O D U C T I O NP R O J E C T E VA LUAT I O N A N D S C O R I N G 120
P U B L I C C O M M E N T SP R O J E C T E VA LUAT I O N A N D P R I O R I T I Z AT I O N 120
A PPE ND IX B: HR TP O RE SP O N SE T O SE LC C O M M E NT S
From: Dale StithTo: "Morgan Butler"Cc: Travis PietilaSubject: RE: SELC comments on HRTPO"s draft project scores and evaluation reportDate: Tuesday, January 05, 2021 2:56:48 PMAttachments: image001.png
Good Afternoon Morgan and Happy New Year!
Thank you for taking the time to review the 2045 LRTP draft project prioritization scores andproviding comments. The feedback your agency provides helps us to see issues from otherperspectives and ultimately helps us to produce better products.
Regarding your comments, we are pleased to hear support for advancing transit and rail in theregion. Staff agrees that considering multimodal passenger projects improves travel options and canresult in cleaner transportation modes. Furthermore, with the establishment of the new regionaltransit funds, an enhanced regional transit backbone will further promote transit choices inHampton Roads.
Regarding the project comments related to ensuring projects promote climate resilience, we haveforwarded these comments to the sponsoring localities/agencies so that they are aware of yourconcerns and have also asked for specific feedback. When we receive their feedback, we will forwardthose responses to you. We will also make note of your concerns during the fiscal-constraint phaseof the 2045 LRTP.
Again, thank you for your time in reviewing the draft project prioritization scores and providingfeedback. Please let me know if you have further questions or comments.
Thank you,
Dale
Dale M. Stith, AICP, GISPPrincipal Transportation Planner | Hampton Roads Transportation Planning Organization723 Woodlake Drive | Chesapeake, VA [email protected] | www.hrtpo.org | Phone: 757.420.8300 | Fax: 757.523.4881TPOHeartbeatLogoEMAIL
From: Morgan Butler Sent: Wednesday, December 16, 2020 12:09 PMTo: Dale Stith Cc: Travis Pietila Subject: SELC comments on HRTPO's draft project scores and evaluation reportDear Ms. Stith,Attached please find comments from the Southern Environmental Law Center on theHRTPO’s draft Candidate Project Evaluation and Prioritization report.Thank you for the work the HRTPO is doing to update the region’s long-rangetransportation plan and for your consideration of our comments. Please let us know if youhave any questions or would like to discuss further.Best regards,MorganMorgan ButlerSenior AttorneySouthern Environmental Law Center201 West Main Street, Suite 14
Charlottesville, VA 22902(434) 977-4090This information is intended for the use of the addressee and may contain information that is privilegedand confidential. If you are not the intended addressee, any copying or other dissemination of thismessage or any attachment is strictly prohibited.
I N T R O D U C T I O NP R O J E C T E VA LUAT I O N A N D S C O R I N G 121 P U B L I C C O M M E N T SP R O J E C T E VA LUAT I O N A N D P R I O R I T I Z AT I O N 121
A PPE ND IX B: V IRG INIA B E AC H C O M M E NT S
January 12, 2021
Robert A. Crum, Jr.Executive DirectorHampton Roads Transportation Planning OrganizationThe Regional Building723 Woodlake DriveChesapeake, VA 23320
Subject: LRTP Comment Response for Greenbelt Phases 1 & 2 and Nimmo ParkwayPhase VII-B
Dear Mr. Crum:
The City has reviewed the December 16, 2020 public comments regarding the Evaluation and Prioritization Report for the 2045 Long Range Transportation Plan (LRTP). We would like to offer the following response:
Greenbelt Phase 1 & 2: The City is currently working on the next Comprehensive Plan Update (Comp Plan). One of the major changes with the new Comp Plan will be the reduction of the Southeastern Parkway and Greenbelt (SEPG) from five (5) phases to two (2) phases. The City does not intend to pursue piecemeal permitting of the original SEPG project to circumnavigate the environmental process. Rather, the City’s is proposing to reduce the overall project and explore other transportation options that could include roadway, bikeway, trail, or a combination thereof. The roadway classification would also change from expressway to arterial. Impacts from COVID-19 have limited the City’s ability to conduct public meetings. As a result, it may be late 2021 or even 2022 before public input on these changes can be assessed. The City already owns a significant amount of property along the revised corridor, however, any revisions would have to be re-evaluated for environmental impacts before moving forward.
Nimmo Parkway Phase VII-B: The proposed roadway project, Nimmo Parkway Phase VII-B, is an important transportation project within the City of Virginia Beach’s Capital Improvement Program (CIP). The purpose of the project is to provide a safer and more reliable route for traffic accessing the Sandbridge
MUNICIPAL CENTERBUILDING 23
2473 N. LANDING ROADVIRGINIA BEACH, VA 23456
DEPARTMENT OF PUBLIC WORKSOFFICE OF THE CITY ENGINEER(757)385-4131FAX (757) 467-5602
Robert A. Crum, Jr.LRTP Comment ResponseJanuary 12, 2021Page 2
Beach community. The proposed roadway will be more resilient to frequent flooding in the area and provide an improved hurricane evacuation route. The project has been included in the City’s Master Transportation Plan as far back as 1971.
The City has reviewed the comments submitted by the Southern Environmental Law Center (SELC) in regards to the Nimmo Parkway Phase VII-B project. The City is currently developing a NEPA Environmental Assessment (EA) document that addresses the environmental impact of the project in accordance with the NEPA process. The project development process also includes stormwater design that will assess the area hydrology and conveyance. Additionally, the City would like to clarify that Nimmo Parkway Phase VII-B is proposed to be within existing City-owned right-of-way and will not require any property from Back Bay National Wildlife Refuge.
We appreciate the opportunity to respond to these comments. Please feel free to contact me if you have any questions or need additional information at 757-385-4131 or [email protected].
Sincerely,
David S. Jarman, P.E.Transportation Division Manager
cc: Susan Wilson, Virginia Department of TransportationKatie Shannon, P.E., CVB Public Works/EngineeringWilliam C. Haggerty, P.E., Transportation Project Management SupervisorRyan A. Johnson, P.E., Project ManagerJohn Mihaly, Hampton Roads Transportation Planning Organization