Identification of Fungal Pathogens to Control Postharvest ...
Upload
khangminh22Category
view
3download
0
1
PRIORITIZATION OF PATHOGENS TO GUIDE DISCOVERY,
RESEARCH AND DEVELOPMENT OF NEW ANTIBIOTICS FOR DRUG-RESISTANT
BACTERIAL INFECTIONS, INCLUDING TUBERCULOSIS

PRIORITIZATION OF PATHOGENS TO GUIDE DISCOVERY,
RESEARCH AND DEVELOPMENT OF NEW ANTIBIOTICS FOR DRUG-RESISTANT
BACTERIAL INFECTIONS, INCLUDING TUBERCULOSIS

PRIORITIZATION OF PATHOGENS TO GUIDE DISCOVERY,
RESEARCH AND DEVELOPMENT OF NEW ANTIBIOTICS FOR DRUG-RESISTANT
BACTERIAL INFECTIONS, INCLUDING TUBERCULOSIS

WHO/EMP/IAU/2017.12
© World Health Organization 2017
Some rights reserved. This work is available under the Creative Commons Attribution-NonCommercial-ShareAlike 3.0 IGO licence (CC BY-NC-SA 3.0 IGO; https://creativecommons.org/licenses/by-nc-sa/3.0/igo).
Under the terms of this licence, you may copy, redistribute and adapt the work for non-commercial purposes, provided the work is appropriately cited, as indicated below. In any use of this work, there should be no suggestion that WHO endorses any specific organization, products or services. The use of the WHO logo is not permitted. If you adapt the work, then you must license your work under the same or equivalent Creative Commons licence. If you create a translation of this work, you should add the following disclaimer along with the suggested citation: “This translation was not created by the World Health Organization (WHO). WHO is not responsible for the content or accuracy of this translation. The original English edition shall be the binding and authentic edition”.
Any mediation relating to disputes arising under the licence shall be conducted in accordance with the mediation rules of the World Intellectual Property Organization.
Suggested citation. Prioritization of pathogens to guide discovery, research and development of new antibiotics for drug-resistant bacterial infections, including tuberculosis. Geneva: World Health Organization; 2017(WHO/EMP/IAU/2017.12). ( Licence: CC BY-NC-SA 3.0 IGO..
Cataloguing-in-Publication (CIP) data. CIP data are available at http://apps.who.int/iris.
Sales, rights and licensing. To purchase WHO publications, see http://apps.who.int/bookorders. To submit requests for commercial use and queries on rights and licensing, see http://www.who.int/about/licensing.
Third-party materials. If you wish to reuse material from this work that is attributed to a third party, such as tables, figures or images, it is your responsibility to determine whether permission is needed for that reuse and to obtain permission from the copyright holder. The risk of claims resulting from infringement of any third-party-owned component in the work rests solely with the user.
General disclaimers. The designations employed and the presentation of the material in this publication do not imply the expression of any opinion whatsoever on the part of WHO concerning the legal status of any country, territory, city or area or of its authorities, or concerning the delimitation of its frontiers or boundaries. Dotted and dashed lines on maps represent approximate border lines for which there may not yet be full agreement.
The mention of specific companies or of certain manufacturers’ products does not imply that they are endorsed or recommended by WHO in preference to others of a similar nature that are not mentioned. Errors and omissions excepted, the names of proprietary products are distinguished by initial capital letters.
All reasonable precautions have been taken by WHO to verify the information contained in this publication. However, the published material is being distributed without warranty of any kind, either expressed or implied. The responsibility for the interpretation and use of the material lies with the reader. In no event shall WHO be liable for damages arising from its use.
Printed in Geneva, Switzerland

Foreword
Infectious diseases are among the top 10 causes of
death and the leading cause of disability-adjusted life
years worldwide. Among these, acute lower respiratory
tract infections, diarrhoeal diseases and tuberculosis
(TB) are responsible for significant global morbidity
and mortality. The overall burden of communicable
diseases is strongly linked to poverty and, as a result,
the African continent still suffers from the highest
mortality from infectious diseases.
The reasons for the emergence and re-emergence
of infectious diseases worldwide include a
breakdown of public health measures in the face of
epidemic transitions, increasing international travel,
immigration for political, social and economic
reasons, microbe adaptation and ability to change,
and transmission of several pathogens between
animals and humans. Of great concern is the global
emergence of resistance of infectious pathogens to
many first-line medicines.
Equitable access to medicines is another major concern
in many low- and middle-income countries where
common, treatable infections like pneumonia and TB
are still associated with high numbers of deaths, often in
children. The emergence of pathogenic microbes with
drug resistance, not only to the most commonly used
antibiotics but also to second-line, “reserve” medicines,
further increases the burden of infectious diseases.
Low-income countries are particularly vulnerable
because of conditions that enable the spread of these
diseases, such as poor sanitation, lack of control of
and guidance on antibiotic use, inadequate health-
care services and systems, and limited or inadequate
infection control measures.
Middle- and upper-middle-income countries are not
free of the burden of drug resistance, however. BRICS
countries (Brazil, Russian Federation, India, China and
South Africa) and several European countries face
major epidemics of multidrug-resistant infections
caused by common Gram-negative bacteria and
multidrug-resistant-TB (MDR-TB), with devastating
public health and economic consequences. Sadly, the
pipeline for new antibiotics currently includes only a
small number of novel compounds in development.
In the past 20 years, only two new antibiotic classes,
both active only against Gram-positive bacteria, have
received global regulatory approval by international
regulatory agencies. In the same time period, no new
antibiotics against Gram-negative bacteria have been
approved. In addition, only two completely new drugs
for MDR-TB treatment (bedaquiline and delamanid)
have reached the market in over 70 years.
In 2016, at the high-level meeting of the UN General
Assembly on antimicrobial resistance, Heads of State
directed an unprecedented level of attention to curbing
the spread of infections that are resistant to antimicrobial
medicines. They reaffirmed their commitment to
stopping the misuse of antimicrobial medicines
in human health, animal health and agriculture,
and recognized the need for stronger systems to
monitor drug-resistant infections and the amounts
of antimicrobials used in humans and animals. In the
wake of the increasing global awareness of the need
for new antibiotics, Member States highlighted market
failures, and called for new incentives for investment
in research and development of new, effective and
affordable medicines, rapid diagnostic tests, and other
important therapies to replace those that are losing
their effectiveness. In response to this and in line with
the Global Action Plan on Antimicrobial Resistance to
support the identification of pathogens of greatest
concern, WHO developed a priority list of antibiotic-
resistant bacteria to underpin renewed efforts for the
research and development of new antibiotics.

2016 was also the first year of implementation of
the WHO End TB Strategy, which was adopted by
the World Health Assembly in 2014 and aimed at
attaining universal access to TB prevention, diagnosis
and treatment. Global TB care and control measures
saved an estimated 49 million lives between 2000 and
2015, yet widespread MDR-TB threatens to reverse
the gains made from decades of effort to contain the
TB epidemic. MDR-TB was declared a global crisis by
WHO in 2014, 21 years after TB had been declared
a global emergency (in 1993) and despite greatly
improved cure rates in patients with drug-susceptible
TB. The TB emergency prompted the establishment
of new financing mechanisms to support countries
in tackling the TB epidemic, most notably the Global
Fund and Unitaid. However, investment in research
and development for TB has major gaps in the funding
needed to develop new tools that would help achieve
the targets of the WHO End TB Strategy.
The overall goal of the following report is to present
the priority pathogens to be targeted for research and
development of new antibiotics to treat drug-resistant
bacterial infections and TB. It is acknowledged that
viral, fungal and parasitic infections may well need a
similar strategy in the near future. The development
of new antibiotics to tackle the serious problem of
drug-resistant infections needs to be prioritized
in the global political agenda of world leaders and
health policy-makers. It also needs to be linked to
the development of appropriate health-care delivery
services and to proper stewardship to safeguard the
use of current and future medicines. This challenge
cannot be simplified in a “one size fits all” approach.
The only possible defence against the threat of
antimicrobial resistance and the (very real) possibility
of a post-antibiotic era is a global and coordinated
effort by all stakeholders. This document reflects
the commitment and contribution of WHO and
its partners to help establish priorities for critically
needed research and development on new antibiotics
against drug-resistant bacterial infections and TB, in
line with our mission of ensuring health for all.
Dr Tedros Adhanom Ghebreyesus
WHO Director-General
Contents
Acknowledgements
Executive summary
Introduction
Section 1: Tuberculosis
1.1 A top infectious disease killer
1.2 MDR-TB: a global public health crisis and health security threat
1.3 Arduous, toxic and limited treatment options
1.4 Profound human suffering and health service dilemmas
1.5 Critical gaps in investment in research and development
Section 2: Ranking of other drug-resistant bacterial infections
2.1 Background
2.2 Selection of prioritization methodology
2.3 Multi-criteria decision analysis: methodology for the prioritization exercise
2.3.1 Expert group selection
2.3.2 Selection of antibiotic-resistant bacteria to be prioritized
2.3.3 Selection of criteria for prioritization
2.3.4 Data extraction and criteria synthesis into the MCDA model
2.3.5 Summary of the evidence assessment methods: strengths and limitations
2.3.6 Summary of the evidence
2.3.7 Ranking
2.4 Survey results
2.5 Ranking of other drug-resistant bacterial infections: overall results
2.6 Conclusions
References
8
10
14
15
15
17
21
21
22
25
25
29
39
40
40
44
46
62
64
75
76
79
80
83

8
Acknowledgements
The development of this report was a collaborative
process between the WHO Department of Essential
Medicines and Health Products (EMP) and the WHO
Global Tuberculosis Programme (GTB), overseen by
Suzanne Hill (Director, EMP) and Mario Raviglione
(Director, GTB).
The report comprises two main sections.
Section 1 describes the current situation with respect
to TB and was prepared by Karin Weyer (WHO, GTB).
Sections 2 reports the methods and results of the
multi-criteria decision analysis used to prioritize other
antibiotic-resistant bacteria and was prepared by
Evelina Tacconelli (Tübingen University Hospital, DZIF
Partner Center, Germany), and Nicola Magrini (WHO
EMP) in collaboration with members of the WHO
Priority Pathogens List (PPL) coordinating, advisory and
working groups. The contributions of the following
individuals are gratefully acknowledged:
Coordinating group
∞ Yehuda Carmeli: Tel Aviv University, Tel Aviv, Israel
∞ Elena Carrara: Tübingen University Hospital, DZIF Center, Tübingen, Germany
∞ Stephan Harbarth: Geneva University Hospitals and Faculty of Medicine, Geneva, Switzerland
∞ Gunnar Kahlmeter: Central Hospital, Växjö, Sweden
∞ Jan Kluytmans: University Medical Center, Utrecht, Amphia Hospital, Breda, the Netherlands
∞ Marc Mendelson: Groote Schuur Hospital, University of Cape Town, Cape Town, South Africa
∞ Céline Pulcini: Nancy University Hospital, Lorraine University, EA 4360 APEMAC, Nancy, France
∞ Alessia Savoldi: Tübingen University Hospital, DZIF Center, Tübingen, Germany
∞ Nalini Singh: Children’s National Health System, George Washington University, Washington, USA
∞ Ursula Theuretzbacher: Center for Anti-infective Agents, Vienna, Austria
Advisory group
∞ Marco Cavaleri: European Medicines Agency, London, UK
∞ Edward M. Cox: US Food and Drug Administration, Washington, USA
∞ Paul Hansen: University of Otago, Dunedin, New Zealand
∞ Chris R. Houchens: Antibacterials Program Biomedical Advanced Research and Development Authority, Washington, USA
∞ M. Lindsay Grayson: Austin Health, University of Melbourne, Melbourne, Australia
∞ Dominique L. Monnet: European Centre for Disease Prevention and Control, Stockholm, Sweden
∞ Marc Ouellette: Laval University and Canadian Institutes for Health Research, Québec, Canada
∞ Kevin Outterson: Combating Antibiotic Resistant Bacteria Biopharmaceutical Accelerator, Boston University, Boston, USA
∞ Jean Patel: Centers for Disease Control and Prevention, Atlanta, USA
Working group
Aaron O. Aboderin (Nigeria), Seif S. Al-Abri (Oman),
Nordiah Awang Jalil (Malaysia), Nur Benzonana
(Turkey), Sanjay Bhattacharya (India), Adrian John Brink
(South Africa), Francesco Robert Burkert (Germany),
Otto Cars (Sweden), Giuseppe Cornaglia (Italy), Oliver
James Dyar (Sweden), Alexander W. Friedrich (the
Netherlands), Ana C. Gales (Brazil), Sumanth Gandra
(India), Christian G. Giske (Sweden), Debra A. Goff
(USA), Herman Goossens (Belgium), Thomas Gottlieb
(Australia), Manuel Guzman Blanco (Venezuela),
Waleria Hryniewicz (Poland), Deepthi Kattula (India),
Timothy Jinks (UK), Souha S. Kanj (Lebanon), Lawrence
Kerr (USA), Marie-Paule Kieny (WHO), Yang Soo
Kim (South Korea), Roman S. Kozlov (Russia), Jaime
Labarca (Chile), Ramanan Laxminarayan (USA), Karin
Leder (Australia), Leonard Leibovici (Israel), Gabriel
Levy Hara (Argentina), Jasper Littman (Germany),
Surbhi Malothra-Kumar (Belgium), Vikas Manchanda

9
(India), Lorenzo Moja (WHO), Babacar Ndoye (Senegal),
Angelo Pan (Italy), David Paterson (Australia), Mical Paul
(Israel), Haibo Qiu (China), Pilar Ramon-Pardo (USA),
Jesús Rodríguez-Baño (Spain), Maurizio Sanguinetti
(Italy), Sharmila Sengupta (India), Mike Sharland (UK),
Massinissa Si-Mehand (WHO), Lynn L. Silver (USA),
Wonkeung Song (South Korea), Martin Steinbakk
(Norway), Jens Thomsen (United Arab Emirates), Guy
E. Thwaites (UK), Jos van der Meer (the Netherlands),
Nguyen Van Kinh (Vietnam), Silvio Vega (Panama), Maria
Virginia Villegas (Colombia), Agnes Wechsler-Fördös
(Austria), Heiman F. L. Wertheim (the Netherlands),
Evelyn Wesangula (Kenya), Neil Woodford (UK), Fidan
O. Yilmaz (Azerbaijan), Anna Zorzet (Sweden).
For all experts, advice was provided in their personal
capacity. The views in this report do not necessarily
reflect and should not be interpreted as being the
official position of any agency or institution.
Funding provided by the Government of Germany
for the development of the Priority Pathogens List is
gratefully acknowledged.
10
Executive summary
Antimicrobial resistance is one of the most complex
global health challenges today. The world has long
ignored warnings that antibiotics and other medicines
are losing their effectiveness after decades of overuse
and misuse in human medicine, animal health and
agriculture. Common illnesses like pneumonia, post-
operative infections, diarrhoeal and sexually transmitted
diseases, as well as the world’s largest infectious
disease killers – tuberculosis (TB), HIV and malaria –
are increasingly becoming untreatable because of the
emergence and spread of drug resistance.
Worsening antimicrobial resistance could have serious
public health, economic and social implications. The
threat of antimicrobial resistance is also becoming
a key consideration for programmes addressing
maternal and child health, sexual and reproductive
health, foodborne diseases, water and sanitation, and
infection prevention and control. The World Bank
has warned that antimicrobial resistance could cause
more economic damage than the 2008 financial crisis.
And although the 21st century is being shaped by
technology and innovation, humans could soon find
themselves in an era where simple infections once
again kill millions every year.
The past three years have seen unprecedented
global political momentum to address antimicrobial
resistance: in 2015, governments adopted a global
action plan at the World Health Assembly and in 2016
passed a political declaration at the United Nations
General Assembly. Antimicrobial resistance has made
it onto the agendas of the G7 and G20 groups and is a
core component of the Global Health Security Agenda.
WHO is working closely with the Food and Agriculture
Organization of the United Nations and the World
Organization for Animal Health in leading global efforts
against antimicrobial resistance and ensuring that the
necessary momentum is consolidated and sustained.
These efforts are guided by an ad-hoc interagency
coordination group established in 2017. A global
development and stewardship framework to combat
antimicrobial resistance is being drafted to support
the development of new antimicrobial medicines,
diagnostics, vaccines and other tools.
One of the gravest global concerns about antimicrobial
resistance currently is that antibiotic resistance has
emerged in so many pathogens, including TB. In 2016, in
the wake of the increasing global awareness of the need
for new antibiotics, and to support the implementation
of the Global Action Plan on Antimicrobial Resistance,
WHO developed a priority pathogens list (PPL) of
antibiotic-resistant bacteria to support research and
development into new and effective drugs. This action
also followed recommendations in the 2016 United
Nations report of a high-level panel on the global
response to health crises, which emphasized the
threat posed to humanity from a number of under-
researched antibiotic-resistant bacteria that urgently
require enhanced and focused investment in research
and development.
2016 was also the first year of implementation of the
WHO End TB strategy, which was adopted by the World
Health Assembly in 2014. The End TB Strategy serves
as the core strategic document for all WHO Member
States on TB prevention, control and elimination,
including the prevention and management of TB drug
resistance. The End TB strategy is an evolution of the
2006 WHO Stop TB Strategy and its predecessor,
the 1995 WHO DOTS Strategy, which Member States
started to implement after WHO declared TB a global
health emergency in 1993. Twenty-one years later, in
2014, multidrug-resistant TB (MDR-TB) was declared a
global public health crisis by WHO, with a call urging
increased investment in research and development,
especially for new drugs and diagnostics.
Prioritization of pathogens for research and
development is highly challenging given the absence
of established criteria defining the impact of pathogens
on human health. As a result, no consensus exists
on the most effective methodology to develop
prioritization in infectious diseases. Ranking antibiotic-
resistant organisms to direct future research and
development requires a detailed identification and
integration of extensive information that defines the
burden of antimicrobial resistance (microbiological,
epidemiological, and clinical). Moreover, communicable
diseases differ in clinical presentation and duration
(e.g. acute versus chronic), treatment approaches (e.g.
multidrug versus single drug therapy), and etiology (e.g.
bacterial, viral, fungal).
The diversity of communicable diseases is a major
challenge for prioritization of pathogens. As a
result, the scope and focus of the work underlying
this document was agreed beforehand to allow
the deliverables requested by Member States to be

11
achieved within a realistic timeframe. Pathogens
were considered separately, according to their
natural history in terms of acute or chronic course
of the diseases. It was not possible to apply the
same framework to both TB and to other bacterial
pathogens, thus they were considered and are
reported separately. Several criteria applicable to
resistant bacteria do not apply to MDR-TB, e.g. the
treatment approach (combinations of drugs are
needed for TB and drug-resistant TB while one
antibiotic could suffice for several other bacteria)
and modes of transmission (TB is almost exclusively
airborne while transmission of the other bacteria is
by food, animal and human interactions, such as the
hands of health-care workers).
This document therefore addresses Mycobacterium
tuberculosis, a prioritized programme of WHO, and
other antibiotic-resistant bacteria, which have been
overlooked until recently despite their considerable
health and economic burden. It is acknowledged that
similar assessments would be useful for communicable
diseases caused by viral and fungal pathogens (e.g.
following the recent publication of the WHO HIV
drug resistance report1). Pesticide, parasitic and vector
resistance fall outside of the scope of this document.
The priority of TB for research and development has
been previously articulated by WHO and is reiterated
here. The rationale for TB – and multidrug-resistant
forms of the disease – being a global priority for research
and development is illustrated in the figure below.
Section 1 of this report therefore focuses on TB and
Mycobacterium tuberculosis as a priority pathogen.
Section 2 reports the priority list of other antibiotic-
resistant bacteria developed through a multicriteria
decision analysis.
This report recommends the following:
∞ Drug discovery and development strategies should focus urgently on new antibiotics specifically active against Mycobacterium tuberculosis (including multi- and extensively drug-resistant strains) and against multi- and extensively drug-resistant Gram-negative bacteria that cause acute clinical infections in both hospital and community settings worldwide.
∞ Global research and development strategies should include antibiotics active against more common community bacteria, such as antibiotic-resistant Salmonella spp., Campylobacter spp., Helicobacter pylori, Neisseria gonorrhoeae, and third-generation cephalosporin-resistant Enterobacteriaceae.
∞ Discovery and development of new antibiotic classes with novel targets and mechanisms of action without cross-resistance to existing classes is of the utmost priority.
∞ Development strategies should include the important need for new antibiotics for paediatric use and user-friendly (e.g. oral) formulations.
∞ Specific attention should be paid to the implementation of antibiotic stewardship initiatives at the global level, especially in combination with educational activities and public awareness campaigns.
∞ Long-term plans of pharmaceutical and research agencies involved in the development of new antibiotics must be aligned with increased political awareness in a global, multifaceted strategy to reduce the burden of resistant infections.
∞ Improved coordination and governance between different initiatives against antimicrobial resistance and communities should be explored to exploit synergies and create a basis of mutual understanding and collaboration.
1 http://apps.who.int/iris/bitstream/10665/255896/1/9789241512831-eng.pdf
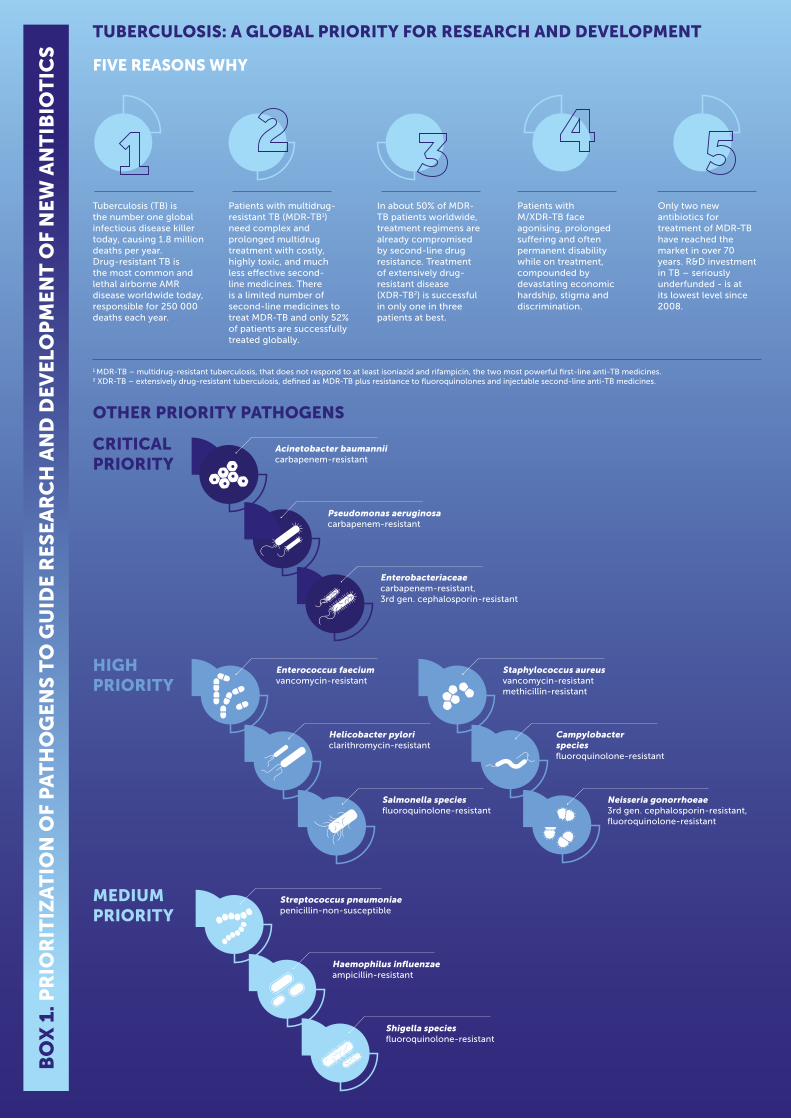
There is very little treatment
Acinetobacter baumannii, CR
Enterobacteriaceae, CR
Pseudomonas aeruginosa, CR
12
TUBERCULOSIS: A GLOBAL PRIORITY FOR RESEARCH AND DEVELOPMENT
OTHER PRIORITY PATHOGENS
FIVE REASONS WHY
1 MDR-TB – multidrug-resistant tuberculosis, that does not respond to at least isoniazid and rifampicin, the two most powerful first-line anti-TB medicines.2 XDR-TB – extensively drug-resistant tuberculosis, defined as MDR-TB plus resistance to fluoroquinolones and injectable second-line anti-TB medicines.
Only two new antibiotics for treatment of MDR-TB have reached the market in over 70 years. R&D investment in TB – seriously underfunded - is at its lowest level since 2008.
Patients with M/XDR-TB face agonising, prolonged suffering and often permanent disability while on treatment, compounded by devastating economic hardship, stigma and discrimination.
In about 50% of MDR-TB patients worldwide, treatment regimens are already compromised by second-line drug resistance. Treatment of extensively drug-resistant disease (XDR-TB2) is successful in only one in three patients at best.
Patients with multidrug-resistant TB (MDR-TB1) need complex and prolonged multidrug treatment with costly, highly toxic, and much less effective second-line medicines. There is a limited number of second-line medicines to treat MDR-TB and only 52% of patients are successfully treated globally.
Tuberculosis (TB) is the number one global infectious disease killer today, causing 1.8 million deaths per year.Drug-resistant TB is the most common and lethal airborne AMR disease worldwide today, responsible for 250 000 deaths each year.
Haemophilus influenzae ampicillin-resistant
Streptococcus pneumoniae penicillin-non-susceptible
Shigella species fluoroquinolone-resistant
MEDIUM PRIORITY
HIGH PRIORITY
Neisseria gonorrhoeae 3rd gen. cephalosporin-resistant,fluoroquinolone-resistant
Helicobacter pylori clarithromycin-resistant
Campylobacter species fluoroquinolone-resistant
Staphylococcus aureus vancomycin-resistantmethicillin-resistant
Salmonella species fluoroquinolone-resistant
Enterococcus faecium vancomycin-resistant
BO
X 1
. PR
IOR
ITIZ
AT
ION
OF
PA
TH
OG
EN
S T
O G
UID
E R
ES
EA
RC
H A
ND
DE
VE
LOP
ME
NT
OF
NE
W A
NT
IBIO
TIC
S
CRITICAL PRIORITY
Acinetobacter baumannii carbapenem-resistant
Pseudomonas aeruginosa carbapenem-resistant
Enterobacteriaceae carbapenem-resistant, 3rd gen. cephalosporin-resistant

13

14
Introduction
Aim
The main aims of prioritizing pathogens are to allow
for priority setting in research and development,
to catalyse public and private funding for research
and development, and to accelerate global research
and development strategies for the discovery of
new antibacterial agents to treat multidrug-resistant
tuberculosis (MDR-TB) and other drug-resistant
bacterial infections.
Target audience
The target audience includes pharmaceutical
companies, universities, public research institutions
and public-private partnerships likely to invest in
the research and development of new antibacterial
agents.
Approach
Prioritization of pathogens for research and development is
highly challenging given the absence of established criteria
that define the impact of pathogens on human health (1).
As a result, no consensus exists on the most effective
methodology to develop prioritization of infectious
diseases. Ranking antibiotic-resistant organisms in order to
direct future research and development requires a detailed
identification and integration of extensive information
that defines the burden of antimicrobial resistance
(microbiological, epidemiological and clinical). Moreover,
communicable diseases differ in clinical presentation and
duration (e.g. acute versus chronic), treatment approaches
(e.g. multidrug versus single drug therapy), and in etiology
(e.g. bacterial, viral, fungal).
While in some instances, such as chemical hazards (2),
food safety (3) and noncommunicable diseases (4), a
number of tools and guidelines have been developed,
the diversity of communicable diseases presents
major challenges for prioritization of pathogens. As
a result, the scope and focus of the work underlying
this document were agreed beforehand to allow the
deliverables requested by Member States to be achieved
within a realistic timeframe. This document therefore
addresses prioritization of pathogens responsible for
MDR-TB and other drug-resistant bacterial infections.
It is acknowledged that similar assessments would be
useful for communicable diseases caused by viral and
fungal pathogens as well.
The diversity of communicable diseases presents
major challenges for prioritization of pathogens.
Pathogens were therefore considered separately.
Mycobacterium tuberculosis, the etiological agent of
TB, differs to a great extent from the other diseases/
bacteria considered. In particular, several of the criteria
suitable for other bacteria do not apply to MDR-TB,
for example duration of illness (TB tends to be more
chronic in nature compared with the acute diseases
caused by most of the other bacteria), the treatment
approach (combinations of medicines are needed for
both drug-susceptible and drug-resistant TB while
one antibiotic can be used for most other bacteria)
and modes of transmission (TB is almost exclusively
airborne while transmission of the other bacteria is by
food, animal and direct human interactions, such as
the hands of health-care workers).
Thus, Section 1 deals with TB separately describing
the current situation and the urgent need for new
TB treatments and reiterating the priority of TB for
research and development as has been articulated by
WHO previously.
Sections 2 reports the methodology and results of the
multi-criteria decision analysis used to prioritize other
antibiotic-resistant bacteria.

15
Section 1: Tuberculosis
1.1 A top infectious disease killer
Tuberculosis (TB) is one of the top 10 causes of death
worldwide (5). Caused by Mycobacterium tuberculosis
– an obligate pathogenic bacterial species in the family
Mycobacteriaceae - and spread exclusively by airborne
transmission - TB is the top global infectious disease
killer from a single infectious pathogen (Fig. 1). TB caused
an estimated 1.8 million deaths in 2015, including 0.4
million deaths associated with HIV co-infection (6).
Ischaemic heart disease
Lower respiratory infection
Stroke
Trachea, bronchus, lung cancers
Chronic obstructive pulmonary disease
Diarrhoeal diseases
Tuberculosis Deaths from TB among HIV-positive people
Road injury
Diabetes mellitus
Alzheimer disease and other dementias
0 1 2 3 4 5 6 7 8 9
Millions (2015)
Fig 1. Top ten causes of death in 2015
Ending the TB epidemic is one of the targets of the
Sustainable Development Goals and requires the
implementation of a mix of biomedical, public health
and socioeconomic interventions, often beyond
the health sector, as well as major breakthroughs in
research and innovation.
Worldwide, the rate of decline in TB incidence
remained at only 1.5% from 2014 to 2015 (Fig. 2). This
needs to accelerate to a 4–5% annual decline by 2020
in order to reach the first milestone of the WHO End
TB Strategy (7).

16
140
50
100 Optimize use of current and new tools emerging from
the pipeline: pursue universal health coverage and social
protection.
Introduce new tools: a vaccine, new anti-TB agents and treatment
regimens for treatment for active TB disease an latent TB infection, and
point-of-care test .
Current gobal trend: -1.5%/year
-10%/year by 2025
-5%/year
-17%year
10
2015 2020 2025 2030 2035
Year
Fig 2. Projected global trajectory of TB incidence rate 2015-2035 required to reach 2035 targets of END TB Strategy
Fig 3. The WHO End TB Strategy: three pillars based on four underlining principles
Intensified research and innovation is therefore one of
the three pillars of the WHO End TB Strategy, which,
together with the other two pillars of patient-centred
care and bold policies, are founded on four underlying
principles (Fig. 3) (7).

17
Fig 4. Top 30 countries with a high-burden of TB, multidrug-resistant TB (MDR-TB) and HIV-associated TB
According to the 2016 WHO Global Tuberculosis
Report, six countries accounted for 60% of new TB
cases globally in 2015: China, India, Indonesia, Nigeria,
Pakistan and South Africa (6). G20 nations accounted
for 54% of all global cases of TB (5.6 million in 2015)
and 46% of deaths (816 000 in 2015). Global progress
against TB depends on major advances in TB prevention
and care in these countries.
Treatment of TB disease requires multidrug therapy
for extended periods. Drug-susceptible TB is treated
with a combination of four first-line medicines
(rifampicin, isoniazid, pyrazinamide and ethambutol).
When rifampicin is compromised by resistance - often
associated with concurrent resistance to isoniazid, and
defined as multidrug-resistance (MDR2) - treatment
options become much more complicated.
Patients with rifampicin-resistant TB (RR-TB) or MDR-
TB need prolonged treatment (often up to two years)
with costly, highly toxic, and much less effective
second-line medicines, of which there are only a
limited number. Inadequate treatment of MDR-TB
and RR-TB (hereafter collectively called “MDR-TB”
as treatment for both conditions requires second-
line medicines) often leads to increased resistance.
Extensively drug-resistant TB (XDR-TB)3 – occurring
when fluoroquinolones and other injectable TB drugs
(kanamycin, amikacin, capreomycin) are compromised
by resistance – makes further treatment very difficult
or even impossible in many patients. WHO declared
MDR-TB a global public health emergency in 2014 (8).
1.2 MDR-TB: a global public health crisis and health security threat
The 2016 WHO Global TB Report indicated that there
were 580 000 (range: 520 000 - 640 000) new cases
of MDR-TB in 2015 (6). Of these, an estimated 250 000
(160 000 - 340 000) patients died in 2015, making
MDR-TB the most common and deadly disease caused
by antimicrobial resistance worldwide.
Most of the burden of MDR-TB in the world is
concentrated in populous countries with a large
burden of TB, although several small countries have
high MDR-TB incidence rates per population number.
Thirty countries account for about 90% of the global
disease burden of MDR-TB (Fig. 4) based on data
reported to WHO (6).
2 MDR-TB is defined as resistance to rifampicin and isoniazid.3 XDR-TB defined as MDR plus resistance to fluoroquinolones and injectables (kanamycin, amikacin, capreomycin).

18
Unlike drug-susceptible TB epidemics, MDR-TB is
often an epidemic of more affluent countries. Wide
geographical and country variations occur, with China,
India, Indonesia, Nigeria, Pakistan and the Russian
Federation, together accounting for 60% of the global
MDR-TB burden (6). G20 nations have 55% of the
total burden of MDR-TB (322 000 estimated cases in
2015). These countries also have most of the deaths
and future costs from MDR-TB. As TB predominantly
affects people of working age, the human, social and
economic impact will continue to be profound. WHO
drug resistance surveillance data (since 1994) show
that almost no country has escaped the threat of MDR-
TB (9). Globally, 3.9% (2.7 - 5.1%) of new and 21% (15
- 28%) of previously treated TB cases had MDR-TB in
2015 (Fig. 5) (6).
Among countries with representative data for at least
three years, the burden of MDR-TB is either increasing
faster or decreasing more slowly than the overall TB
burden (6).
Only 52% of the MDR-TB patient cohorts reported to
WHO in 2015 were successfully treated, while 17% of
patients died, 22% were lost to follow up or not evaluated,
and treatment failed in 9% of patients (Fig. 6) (6).
Fig 5. Estimated incidence of multidrug-resistant TB in 2015 (for countries with at least 1 000 incident cases)

19
Furthermore, second-line treatment regimens are
already compromised – in 2015, over half of the patients
with MDR-TB had additional resistance to either a
fluoroquinolone or a second-line injectable agent or
both (6). Pooled surveillance data show that in 2015, 9.5%
(7.0-12.1%) of MDR-TB cases globally had XDR-TB, with
data reported from 118 countries. Levels of XDR-TB are
much higher than the global average in several countries
of Eastern Europe. The numbers of XDR-TB cases
reported were highest in Europe (Russian Federation and
Kazakhstan) while nearly all of the cases in Africa were
from South Africa.
Among 4 086 XDR-TB patients in 47 countries for whom
outcomes were reported to WHO in 2015 (Fig. 7), 28%
successfully completed treatment, 27% died, 21% had
treatment failure and 24% were lost to follow up or were
not evaluated (6).
Fig 6. Outcomes of treatment of multidrug-resistant TB, annual cohorts by WHO region and globally, 2007-2013
45705496614361768260
1024614553
45705496614361768260
1024614553
45705496614361768260
1024614553
45705496614361768260
1024614553
45705496614361768260
1024614553
1464173222982413291628742920
1464173222982413291628742920
1464173222982413291628742920
1464173222982413291628742920
1464173222982413291628742920
128262511676874
12711950
128262511676874
12711950
128262511676874
12711950
128262511676874
12711950
128262511676874
12711950
422071821213220599318893770142463
422071821213220599318893770142463
422071821213220599318893770142463
422071821213220599318893770142463
422071821213220599318893770142463
315483
159731134305
1574318538
315483
159731134305
1574318538
315483
159731134305
1574318538
315483
159731134305
1574318538
315483
159731134305
1574318538
45375810272455423861766512
45375810272455423861766512
45375810272455423861766512
45375810272455423861766512
45375810272455423861766512
11150159132370835432524827401186936
11150159132370835432524827401186936
11150159132370835432524827401186936
11150159132370835432524827401186936
11150159132370835432524827401186936
African The Americas
Eastern Mediterranean European
South−East Asian Western Pacific
Global
2013201220112010200920082007
2013201220112010200920082007
2013201220112010200920082007
2013201220112010200920082007
0% 25% 50% 75% 100%Percentage of cohort
Treatment success Failure Died Lost to follow−up Not evaluated
Treatment outcomes for MDR/RR−TB patients, by WHO Region, 2007−2013 cohorts
The total number of cases with outcome data is shown beside each bar

20
Treatment outcomes for patients with multi and
extensively drug-resistant TB (M/XDR-TB) have
remained static for many years despite improvements
in the coverage of treatment and availability of more
effective (later generation fluoroquinolones) or
new medicines (bedaquiline and delamanid). Cases
with resistance to most (if not all) available anti-TB
medications have been reported in several settings
over the past 10 years (10-12).
M/XDR-TB threatens years of progress made in global
TB control and is a threat to global health security.
Transmission occurs almost exclusively by the air to close
contacts of M/XDR-TB cases, often in congregate settings
and in vulnerable groups, such as those with HIV co-
infection, migrants, health-care workers, prisoners and
miners, or in children. Contrary to earlier assumptions,
acquisition of drug resistance does not lower the
transmissibility or virulence of TB strains (13-15).
Explosive outbreaks of M/XDR-TB have been reported
in the literature (16-18). Moreover, modelling studies
and recent publications from several countries clearly
show that transmission is a much more important
driver of outbreaks or undetected epidemics than
previously thought (17,19,20). Furthermore, the 2016
WHO global TB report showed that over 50% of the
estimated global burden of M/XDR-TB now occurs in
previously untreated TB patients, reflecting ongoing
high levels of community and household transmission.
M/XDR-TB outbreaks with high mortality have resulted
in public health emergencies in several countries.
The risk of MDR-TB replacing drug-susceptible TB
epidemics has been flagged in modelling studies
and is not implausible (21,22). The persistent lack of
effective treatment for latent MDR-TB infection further
compounds the problem (23-25).
Fig 7. Treatment outcomes for patients with extensively drug-resistant TB, globally and by WHO region, 2013
630
90
67
2756
261
282
4086
630
90
67
2756
261
282
4086
630
90
67
2756
261
282
4086
630
90
67
2756
261
282
4086
630
90
67
2756
261
282
4086
African
Americas
E. Mediterranean
European
S−E. Asian
W. Pacific
Global
0% 25% 50% 75% 100%Percentage of cohort
Treatment success Failure Died Lost to follow−up Not evaluated
Treatment outcomes for XDR−TB patients, by WHO Region, 2013 cohorts
The total number of cases with outcome data is shown beside each bar
21
1.3 Arduous, toxic and limited treatment options
The frequency and severity of adverse drug reactions
are much higher in patients on regimens for MDR-TB
than in those on treatment for drug-susceptible TB.
Several of the second-line medicines used in MDR-TB
treatment are old drugs which are often associated with
severe or serious harm, at times leading to permanent
disabilities such as deafness and chronic neuropathy,
depression and suicidal tendencies.
Recommended second-line regimens need to contain
at least five medicines - including an injectable drug
usually given intramuscularly every day for several
months. These medicines have well-known adverse
effects and they often need to be stopped temporarily,
or even replaced. Some of the most common and
troublesome effects are nausea and vomiting, hearing
loss (irreversible), peripheral neuropathy, depression,
allergic reactions, rashes, visual disturbances, seizures,
psychosis, and kidney and liver failure.
Prolongation of the QT interval in patients on new
TB medicines (bedaquiline and delamanid) may
predispose to serious heart dysrhythmias (26,27).
This risk may increase when fluoroquinolones and
clofazimine - repurposed drugs commonly used in
MDR-TB regimens – are used at the same time. Close
monitoring of patients, including special testing (e.g.
audiometry, electrocardiography, biochemistry), at
regular intervals is therefore necessary to ensure that
adverse drug reactions are detected and managed
quickly.
Hospitalization of patients with MDR-TB is still the
main model of care in many countries despite WHO
recommendations for a decentralized approach to
treatment. Hospitalization cost is one of the main
contributors (together with medicines) to the overall
cost per patient treated in countries with a high-
burden of MDR-TB. The cost of medicines can range
from US$ 2 000 to more than US$ 20 000 per patient
depending on the regimen that has to be used based
on drug-resistance profiles, compared with US$ 50 to
US$ 100 per patient for first-line TB medicines (28).
1.4 Profound human suffering and health service dilemmas
Patients with M/XDR-TB face agonizing, prolonged
suffering and often permanent disability while on
treatment, as well as devastating economic hardship,
stigma and discrimination. Health services are
confronted by numerous ethical, legal and human
rights challenges, given the ongoing airborne
transmission of the bacteria, with explosive outbreaks
described in congregate settings such as prisons and
health-care facilities.
The adverse drug reactions from medicines used
to treat M/XDR-TB greatly increase the suffering of
patients and negatively affect their quality of life. They
also add substantial costs to the health system because
of the need to monitor and manage adverse effects.
The clinical and programmatic management of MDR-
TB also raises ethical challenges because of the limited
therapeutic options. The lack of sufficient effective
medicines frequently induces doctors to adopt
practices that, although probably well-intentioned, are
often ethically unacceptable. Unethical practices that
have been observed in the field include (but are not
limited to) involuntary isolation of patients, denial of
diagnosis because of limited treatment options, a lack
of patient-centred approaches to support delivery of
treatment, a lack of informed patient consent, and a
lack of support to patients who reach the end of their
treatment pathway without any further prospects of
cure.

22
Fig 8. TB research funding targets of the Annual Global Plan and actual funding, 2015 (29) (reproduced with permission)
Based on research category, the 2016 TAG report
indicated that TB research funders invested as follows:
∞ Drug research and development: US$ 231.9 million
∞ Basic science: US$ 139.8 million
∞ Vaccine research and development: US$ 80.7 million
∞ Diagnostics: US$ 62.8 million
∞ Operational research: US$ 61.0 million
∞ Infrastructure/unspecified: US$ 44.4 million
Every category of research saw a decline in spending
compared with 2014, with the exception of operational
research, where funding increased by a modest US$
8.2 million. The drop in funding for drug research and
development was the second consecutive year of
declining funding, with funding at its lowest level since
2010. Changing the course of the TB epidemic requires
major technological breakthroughs – including short
and effective treatment for latent TB infection, and
completely new, universal, short treatment regimens
that would be effective despite the presence of drug
1.5 Critical gaps in investment in research and development
Investment in research to develop new and better
interventions for TB (including drug-resistant forms
of the disease) is insufficient. Funding for TB research
is at its lowest level since 2011, according to the US-
based Treatment Action Group (TAG), which tracks
research and development funding annually. In 2015,
only US$ 620 million was invested in TB research,
against the estimated global annual need of at least
US$ 2 billion per year (26). Funding during 2005–2014
never exceeded US$ 0.7 billion per year (Fig. 8), which
resulted in modest development pipelines, especially
for medicines and vaccines (29,30).

23
Fig 9. Pipeline of TB drug development (repurposed and new drugs)
resistance. However, the greatest innovations in TB
drug development over the past five years have come
from optimizing and repurposing existing drugs rather
than discovering and advancing new compounds
through the early stages of clinical development (Fig.
9) (6). Research and development for TB – as with
other forms of antimicrobial resistance – is hampered
by the lack of commercial incentives to develop new
medicines. This market failure is compounded by the
fact that combinations of drugs are required to treat
M/XDR-TB successfully, which further dilutes already
weak commercial incentives.
At the end of 2015, the pipeline of TB drugs had only
five new compounds in the active phase of clinical
development. These included bedaquiline and
delamanid, the first completely new MDR-TB drugs ever
developed (6), which were marketed after accelerated
or conditional regulatory approval (based on Phase IIb
data). As of May 2017, four additional new compounds
have entered the clinical development pipeline (30).

24
Fig 10. TB drug R&D progress report. Research targets of the 2011–2015 Stop TB Partnership Global Plan compared with actual products developed by 2015 (29) (reproduced with permission)
2011-2015 Global Plan indicators of success
Number of new and/or re-purposed drugs in phase I trials 21 2
34 17
3 8
2 5
2-3 months 3 months
Number of single or combination phase II trials investigating new and/or repurposed drugs
Number of new regimens for DR-TB in phase III trials
Number of new regimens for DR-TB in phase III trials
Duration of treatment of LTBI
Target (2015) Reality (2015)
The very modest pipeline for TB drugs is a major
concern. In 2010, there were three compounds in phase
I trials. In the targets for drug research and development
in the 2011–2015 Stop TB Partnership Global Plan, this
number was predicted to increase to 21 by 2015, if given
full funding (Fig. 10) (29). However, in reality, by January
2016 the pipeline had regressed to only two candidates
in phase I trials (31). Although several new regimens are
in phase III trials, the 2011 targets for completely new
regimens (for drug-susceptible and drug-resistant TB)
have also not been reached. Expectations that these
new regimens will reach the market before 2025 (32),
the first milestone for measuring progress in the WHO
End TB Strategy, are tempered.

25
Section 2: Ranking of other drug-resistant bacterial infections
2.1 Background
Antibiotic resistance is a growing threat to public
health and to the provision of health care worldwide.
Infections caused by antibiotic-resistant pathogens
substantially increase the burden of both health-
care-associated infections and community-acquired
infections (33,34). Several factors can contribute to
the emergence and spread of antibiotic resistance
worldwide; these include inappropriate antibiotic
use and prescriptions in health-care settings and the
community, extensive use in agricultural and veterinary
sectors, ageing populations, increasing numbers of
immunocompromised individuals, growing global
travel and migration from countries that have
higher levels of antibiotic-resistant pathogens, and
an inadequate number of new antibiotics in the
development pipeline (35).
Although differences in the distribution of risk factors
between countries are evident, gaps in surveillance, and
a lack of standards for methodology and data sharing
particularly affect the assessment of the antibiotic
resistance burden (36). The current knowledge of the
burden of antibiotic resistance is based on prevalence
data mainly of health-care infections. Incidence data
are limited to a few high- and middle-income countries,
are focused on nosocomial infections and are derived
through complex estimations. In the United States of
America (USA), the National Healthcare Safety Network
reported high levels of resistance to several antibiotic
classes in both Gram-positive and Gram-negative
bacteria responsible for health-care infections between
2011 and 2014. Methicillin resistance was detected in
more than 50% of staphylococcal isolates; carbapenem
resistance was reported in 45-65% of Acinetobacter
baumannii isolates and vancomycin resistance among
enterococci was higher than 80% in all the surveyed
years (37) (Table 1). When compared to the US data, the
European Centre for Disease Prevention and Control
(ECDC) surveillance network showed overall lower rates
of resistance in Gram-positive bacteria (although with
large differences between countries), and the same
worrying rates among Gram-negative bacteria (38) (Table
1). In 2014, WHO published the results of an extensive
effort that aimed to summarize the global prevalence
of seven antibiotic-resistant bacteria of international
concern (Table 1). Although substantial differences in
reporting were noted, very high rates of resistance were
observed in both community-acquired and health-care-
associated infections in all WHO regions (39).

26
Table I. Antibiotic-resistant bacteria in the United States of America, Europe and the world
USA 2011–2014: health-care-associated infections (CLABSI, CAUTI, SSI, VAP) (37)
Staphylococcus aureus: >50% methicillin resistance
Enterococcus faecium: 80-85% vancomycin resistance
Klebsiella pneumoniae: 10% carbapenem resistance
Escherichia coli: 16-36% third-generation cephalosporin resistance
Pseudomonas aeruginosa: 25% carbapenem resistance
Acinetobacter baumannii: 45-65% carbapenem resistance, 40-70% multidrug resistance
Europe 2015: invasive isolates (blood and cerebrospinal fluids) (38)
Staphylococcus aureus: 17% methicillin resistance
Enterococcus faecium: 8% vancomycin resistance
Klebsiella pneumoniae: 31% third-generation cephalosporin resistance, 8% carbapenem resistance
Escherichia coli: 12% third-generation cephalosporin resistance
Pseudomonas aeruginosa: 19% carbapenem resistance
Acinetobacter baumannii: 56% carbapenem resistance
Worldwide 2013: all isolates (39)
Staphylococcus aureus: 12-80% (AFR), 4-84% (WPR) methicillin resistance
Escherichia coli: 2-70% (AFR), 16-68% (SEAR), 0-77% (WPR) third-generation cephalosporin resistance
Klebsiella pneumoniae: 8-77% (AFR), 34-81% (SEAR), 1-72% (WPR), 0-54% (EMR) third-generation cephalosporin-
resistance
Non-typhoidal Salmonella: 2-49% (EMR) fluoroquinolone-resistance
Neisseria gonorrhoeae: 0-36% (EUR), 0-31% (WPR), 0-31% (AMR) third-generation cephalosporin resistance
Shigella spp.: 3-28% (WPR) fluoroquinolone-resistance
Streptococcus pneumoniae: 57-60% (AFR) penicillin non-susceptible
CLABSI: central line associated bloodstream infection; CAUTI: catheter associated urinary tract infection; SSI: surgical site Infection; VAP: ventilator associated pneumonia.
WHO regions - AFR: Africa Region, EMR: Eastern Mediterranean Region, EUR: European Region, SEAR: South-East Asia Region, WPR: Western Pacific Region.
An accurate definition of mortality associated with
antibiotic-resistant infections is difficult to formulate
and the absolute number of deaths globally is also
difficult to define because of the lack of national data
and the difficulty of controlling for confounding factors
such as comorbidities, access to and availability of
antibiotics, and proper hospital care (40). Among the
few incidence data available, the Centers for Disease
Control and Prevention (CDC) estimated that in 2013
more than 2 million people in the USA acquired a
serious infection from an antibiotic-resistant pathogen
and at least 22 000 died from these infections (41)
(Fig. 11). Similar yearly figures for cases and deaths
were reported from Europe and Thailand in 2007 and
2012 respectively (42,43) (Fig. 11). An estimated 56 500
neonates in India and 19 400 in Nigeria died in 2012
from sepsis caused by bacteria resistant to first-line
antibiotics (44) (Fig. 11).

27
Fig. 11. Number of infections and deaths associated with antibiotic-resistant bacteria in selected countries
USA: Centers for Disease Control and Prevention, 2013 (41)
Population: 300 million
Bacteria: CR Enterobacteriaceae, DR Neisseria gonhorroeae, MDR Acinetobacter, DR Campylobacter, ESBL Enterobacteriaceae, VRE & MDR Pseudomonas spp., DR non-typhoidal Salmonella, FQR Salmonella Typhi, DR Shigella spp., MRSA & DR Streptococcus pneumoniae, VRSA
No. cases: 20 36100
No. deaths: 22 618
Thailand: Thailand Antimicrobial Resistance Containment and Prevention Program, 2012 (43)
Population: 70 million
Bacteria (nosocomial infections): MDR Escherichia coli, MDR Klebsiella pneumoniae, MDR Acinetobacter baumannii, MDR Pseudomonas aeruginosa, MRSA
No. cases: 87 751
No. deaths: 38 481
Europe: European Centre for Disease Prevention and Control, 2007 (42)
Population: 500 million
Bacteria: MRSA, VRE, Pen-R Streptococcus pneumoniae, 3GCR Escherichia coli, 3GCR Klebsiella pneumoniae, CR Pseudomonas aeruginosa
No. cases: 386 100
No. deaths: 25 100
China, Democratic Republic of the Congo, India, Nigeria, Pakistan (44)
Population: 3 billion
Bacteria: Gram-negative and Gram-positive bacteria resistant to first-line treatment
No. cases: 214 457 (uncertainty range: 139 130-3 318 379) global estimate of neonatal sepsis caused by bacteria resistant to first-line treatment (ampicillin/gentamicin)
No. of neonatal deaths: China 7 128 (uncertainty range 5 702-8 554)Dem. Rep. Congo 23 497 (18 798-28 196)India 121 395 (97 116-145 674)Nigeria 62 221 (49 777-74 665)Pakistan 56 337 (45 070-67 604)
CR: carbapenem-resistant; DR: drug-resistant; ESBL: extended-spectrum beta-lactamases; FQR: fluoroquinolone-resistant; MDR: multidrug-resistant; MRSA: methicillin-resistant Staphylococcus aureus; Pen-R: penicillin-resistant; 3GCR: third-generation cephalosporin-resistant; VRE: vancomycin-resistant enterococci, VRSA: vancomycin-resistant Staphylococcus aureus
28
The impaired effectiveness of antibiotics due to
resistance is not only compromising the clinical
outcome of infections, but could also affect the
efficacy of standard antibiotic prophylaxis. For example,
it has been recently estimated that between 39% and
51% of bacteria causing surgical site infections and
27% of those causing infections after chemotherapy
are resistant to standard prophylactic antibiotics in
the USA. A 30% reduction in the efficacy of antibiotic
prophylaxis for these procedures would result in 120
000 additional surgical site infections and infections
after chemotherapy per year in the USA and 6 300
infection-related deaths (45).
Estimates of the total number of infections caused by
antibiotic-resistant bacteria are usually derived from
the proportion of resistant isolates in blood cultures,
which is more easily defined and more likely to have
a clinical impact, and then generalized to infections
at other sites. In the O’Neill report (46), to overcome
this problem, the number of resistant strains from
other culture sites was calculated by applying a ratio
between each one and the estimated national numbers
of resistant bloodstream infections. This methodology
has several biases and has been criticized (47).
Although the spread of antibiotic-resistant bacteria
poses a significant threat to patient health worldwide,
pharmaceutical research and development has failed
to meet the clinical need for the development of
new antibiotics. Indeed, only a few classes of new
molecules are currently in development (30,36,39).
In the past 20 years, only two new antibiotic classes
(lipopeptides and oxazolidinones), both against Gram-
positive bacteria, have been developed and approved
(48). The last new drug class against Gram-negative
bacteria was discovered in 1962.
Currently, of 42 new therapeutic agents in the
pipeline for clinical use, only 12 antibiotics show
some activity against Gram-negative priority bacteria
- Pseudomonas aeruginosa, Acinetobacter baumannii
and Enterobacteriaceae - and five of them, all modified
agents of known antibiotic classes, have progressed to
Phase III testing (30).
The decline in interest in antibiotic research and
development in the past few decades is because of
difficulties in clinical development and several scientific,
regulatory and economic issues. It is very difficult to
discover new antibiotic classes that are highly active,
have acceptable pharmacokinetic properties and are
reasonably safe. Clinical antibiotic trials to evaluate
the efficacy of new antibiotics can be difficult and
expensive to conduct, especially when targeting
multidrug-resistant Gram-negative bacteria, and time-
consuming because of the lack of rapid diagnostic
tests to facilitate patient recruitment. One of the
main challenges of modified agents of old classes of
antibiotics is the potential for the rapid development of
resistance when widely used, including the risk of co-
selecting resistance through the use of other agents.
Stimulating antibacterial drug research and
development plays a pivotal role in strategies to address
the global threat of antibiotic-resistant bacteria.
Recently, in support of the global action plan on
antimicrobial resistance, WHO, in collaboration with
the Drugs for Neglected Diseases initiative, launched
the Global Antibiotic Research and Development
Partnership to develop new antibiotic treatments
and promote their responsible use for optimal
conservation. The Broad Spectrum Antimicrobial
(BSA) and Combatting Antibiotic Resistant Bacteria
Biopharmaceutical Accelerator (CARB-X) programmes
of the US Biomedical Advanced Research and
Development Authority, co-sponsored by the
Wellcome Trust, and the Innovative Medicine Initiative’s
New Drugs for Bad Bugs (ND4BB) are new models of
collaboration between pharmaceutical companies and
academia to promote innovation in the research and
development of new antibiotics. In parallel, regulatory
agencies such as the US Food and Drug Administration
and the European Medicines Agency are working on
simplification of the approval pathway for antibiotics
for selected unmet medical needs.

29
2.2 Selection of prioritization methodology
Ranking antibiotic-resistant bacteria to direct future
research and development requires a detailed
identification and integration of extensive information
to define the burden of the hazard (microbiological,
epidemiological and clinical). In some settings,
such as chemical hazards (2), food safety (3) and
noncommunicable diseases (4), several tools and
guidelines are available; however, for communicable
diseases, the process can be very challenging because
established criteria to define the effect of pathogens
on human health are lacking (1). No consensus has
been reached on the most effective methodology to
prioritize infectious diseases.
In 2015 the ECDC made a qualitative assessment of the
methodologies used in existing prioritization exercises
in communicable diseases (49). Searches were made
of biomedical databases (Medline, Embase, Cochrane
Library and Centre for Reviews and Dissemination),
grey literature (official documents, non-peer-
reviewed reports) and specialist databases (Google
Advanced search, WHO, World Bank). The references
of relevant articles were also checked to find other
related publications for inclusion. The criteria for
inclusion in the ECDC review were: description of a
method of prioritization/ranking; published in a peer-
reviewed journal or by a government or a national/
supra-national charity, nongovernmental organization
or other authoritative institutions; and published in
English from January 2000 to December 2014. A total
of 17 studies that undertook a ranking of emerging
infectious diseases were included, using five different
prioritization methods [bibliometric index, Delphi,
multi-criteria decision analysis (MCDA), qualitative
algorithms and questionnaires]. The ECDC report
concluded that, on the basis of current evidence, a
single, definitive approach could not be recommended.
In order to select the best methodology to be used in
this prioritization exercise, the ECDC systematic review
was updated and studies published after January 2015
up to September 2016 were evaluated. Only studies
dealing with human infectious diseases and specifying
precisely the methodology and criteria for determining
priorities were considered.
In total, 80 publications (63 from the new search,
17 from the ECDC publication) were reviewed in
detail and eight were included in the final evaluation
(1,41,50-55). Four studies used MCDA, two a Delphi
method, one a questionnaire-based survey and
one based the prioritization on expert opinion but
without a scoring system to assess criteria value. The
prioritization studies we included aimed mainly to
assess national priorities for improving surveillance,
raise public/government awareness, or identify areas
where further research is most needed. Two studies
were conducted at the international level, mainly
with the aim of drawing public and political attention
to the problem of resistant pathogens or directing
new investments (51,52). None of the selected
prioritizations studies specifically aimed to identify
priorities for the development of new drugs.
Only two of the studies referred specifically to
antibiotic-resistant bacteria (41,50) while in the
remaining six antimicrobial resistance was considered
an emerging issue (1,51-55), but the prioritization of
pathogens was assessed for resistant and susceptible
strains together (with the exception of methicillin-
resistant Staphylococcus aureus and vancomycin-
resistant enterococci). Table 2 summarizes the
methodologies of previous prioritization exercises
in human infectious diseases in the publications
selected.

30
Table 2. Summary of the methodologies of previous prioritization exercises for human infectious diseases
Public Health Agency of Canada (PHAC), 2015 (50)
Study aim To provide a picture of the magnitude of antimicrobial resistance and the current state of surveillance in Canada.
Methodology Multi-criteria analysis: pathogen selection for ranking, criteria selection and definition, weighting of criteria, data capture and pathogen scoring, data quality review, sensitivity analysis of the criteria weighting, and expert review.
Criteria selection 10 criteria selected: 7 were developed based on work of PHAC, Robert Koch Institute, and CDC; 3 criteria were based on the CDC Threat Report criteria and cut-off points were modified for the Canadian context.
Criteria scoring Criteria were scored by one of the five working group members according to national data and available literature. Scoring was on a three-point scale: 0 = nil or low; 1 = moderate; 2 = high. Each score was verified by a second working group member, with discussion when scoring differed. The larger working group came to a consensus decision on remaining issues after the verification stage.
Criteria included Definition of criteria thresholds for scoring
Incidence ∞ <100 cases/year ∞ 100-1000 cases/year ∞ >1000 cases/year
Mortality ∞ <10 deaths/year ∞ 10-100 deaths/year ∞ >100 deaths/year
Case fatality ∞ <5% ∞ 5-25% ∞ >25%
Communicability (ability of resistant pathogens to spread between people and cause new infections)
∞ little to no spread between people ∞ can spread readily in health-care settings, but rarely in
the community ∞ can spread readily in health-care and community
settings
Treatability (effective treatment currently available)
∞ medical treatment rarely necessary or available treatment successful
∞ 1-2 classes of antimicrobial agents available to treat infections, but therapy is usually successful
∞ no effective antimicrobial agents exist
Public/political attention ∞ public perception/political awareness low ∞ public perception/political awareness moderate ∞ demands international actions and political attention
Preventability ∞ no preventive measures ∞ preventive measures exist, but are difficult to
implement ∞ spread is easily preventable
Clinical impact of untreated infection (morbidity/attributable mortality)
∞ mild disease that may require an outpatient visit ∞ rarely life-threatening but can require hospitalization ∞ can cause life-threatening infections

31
Table 2. Summary of the methodologies of previous prioritization exercises for human infectious diseases (cont.)
European Centre for Disease Prevention and Control (ECDC), 2014 (51)
Study aim To prioritize, with regard to Europe, the infectious diseases occurring worldwide that represent a risk to public health during mass gatherings.
Methodology Delphi consensus method and development of a qualitative risk matrix (3 separate teams with different backgrounds, total of 56 ECDC experts).
Criteria selection Literature review and expert opinion.
Criteria scoring Infectious diseases were scored on the matrix against two main parameters: likelihood of occurring during a mass gathering and public health impact (1-5 points for each criterion). According to the output of the matrix, pathogens were ranked qualitatively as: highest, high, medium, low and lower risk.
Criteria included
for public health impact
Criteria included
for likelihood of occurring
Definition of criteria thresholds
for scoring
Morbidity Incidence
No further definition of criteria or thresholds for scoring from 1 to 5
Case fatality rate Geographical distribution
Potential for sequelae Seasonal trend
Existence of disease-specific treatment
Mode of transmission
Potential to cause outbreaks Incubation period
Potential media interest

32
Table 2. Summary of the methodologies of previous prioritization exercises for human infectious diseases (cont.)
Centers for Disease Control and Prevention (CDC), 2013 (41)
Study aim To prioritize antimicrobial-resistant pathogens according to their need for monitoring and prevention activities in the USA.
Methodology Expert opinion: antimicrobial-resistant pathogens were ranked by experts into three levels of threat: urgent, serious, concerning.
Criteria selection Consultation with nongovernmental experts in antibiotic resistance who serve on the Antimicrobial Resistance Working Group of the CDC Office of Infectious Diseases Board of Scientific Counselors, National Institute of Health and Food and Drug Administration.
Criteria included Definition of criteria /
thresholds for scoring
Comments
Mortality (estimate of number of deaths in the USA per year)
Not required (expert opinion) Number of deaths if the disease is notifiable and/or national tracking available (Clostridium. difficile, methicillin-resistant Staphylococcus aureus, Salmonella spp.). Estimation of deaths or cases attributed to antimicrobial resistance (using % of resistances tested from the national laboratory and number of deaths in hospital due to antimicrobial-susceptible pathogens)
Economic impact (cost attributable to all cases of disease caused by antimicrobial resistance in 1 year)
Not required (expert opinion) US$/year (national data)
Incidence (estimate of number of cases in the USA per year)
Not required (expert opinion) Number of diseases if the disease is notifiable/national tracking available. Estimation of number of cases attributed to antimicrobial resistance (using % of resistances tested from national laboratory, and number of in-hospital infections caused by antimicrobial susceptible pathogens)
10-year projection of incidence
Not required (expert opinion) -
Transmissibility Not required (expert opinion) -
Availability of effective antibiotics
Not required (expert opinion) -
Barriers to prevention Not required (expert opinion) -

33
Table 2. Summary of the methodologies of previous prioritization exercises for human infectious diseases (cont.)
Public Health Agency of Sweden and ECDC, 2015 (52)
Study aim To prioritize pathogens according to their public health importance in Sweden.
Methodology A Delphi process with five experts scoring pathogens on 10 variables.
Criteria selection The same criteria used by the Robert Koch Institute 2011.
Criteria scoring Same as the Robert Koch Institute 2011.
Criteria included Definition of criteria thresholds for scoring
Incidence (symptomatic and asymptomatic, no colonization)
∞ <1/100 000 population ∞ 1-20/100 000 population ∞ >20/100 000 population
Severity (proportion of work/school absenteeism due to infectious diseases)
∞ negligible ∞ small-moderate ∞ large
Healthcare utilization (primary health care and hospitalization)
∞ negligible ∞ small-moderate ∞ large
Chronic illnesses or sequelae ∞ negligible ∞ moderate ∞ large
Case fatality rate ∞ <0.01% ∞ 0.01-1% ∞ >1%
Proportion of events requiring public health action
∞ small (<25%) ∞ moderate (25-75%) ∞ large (>75%)
Trend ∞ diminishing ∞ stable ∞ increasing
Public attention (including political agenda and public perception)
∞ low ∞ moderate ∞ high
Preventability (need for prevention improvement, including vaccines)
∞ low ∞ moderate ∞ high
Treatability (treatment possibility and needs) ∞ rarely necessary or available treatment effective ∞ available but needing improvement ∞ no effective treatment available or treatment severely
limited for resistant pathogens

34
Table 2. Summary of the methodologies of previous prioritization exercises for human infectious diseases (cont.)
Robert Koch Institute, Berlin, 2011 (53)
Study aim To develop a rational system for prioritizing infectious diseases in Germany according to their importance for national surveillance and epidemiological research.
Study method Delphi consensus method including 10 senior external experts and 10 internal experts from the Robert Koch Institute and multi-criteria decision analysis.
Criteria selection 10 modified from a previous prioritization process and reviewed by the panel.
Criteria scoring Quantitative and qualitative criteria were scored by experts as -1, 0, 1.
Criteria included and definition Definition of criteria thresholds for scoring
Incidence (illness and symptomatic infection) ∞ <1/100 000 population ∞ 1-20/100 000 population ∞ >20/100 000 population
Severity (work loss/school absenteeism assessed against the total burden of infectious diseases)
∞ negligible-small ∞ moderate ∞ large
Health-care utilization (primary health care and hospitalization)
∞ negligible ∞ small-moderate ∞ large
Chronicity (illness or sequelae) ∞ negligible ∞ moderate ∞ large
Case fatality rate ∞ <0.01% ∞ 0.01-1% ∞ >1%
Proportion of events requiring public health action(
∞ small (<25%) ∞ moderate (25-75%) ∞ large (>75%)
Trend ∞ diminishing ∞ stable ∞ increasing
Public attention (including political agenda and public perception)
∞ low ∞ moderate ∞ high
Preventability (prevention possibilities needs, including vaccines)
∞ few possibilities for prevention, or there is no need ∞ established prevention measures but need to be
improved ∞ preventive measure are needed but not effective
Treatability ∞ treatment is rarely necessary, or effective treatments are available
∞ established treatments but need to be improved ∞ no effective treatment available or treatment severely
limited for antimicrobial resistant pathogens

35
Table 2. Summary of the methodologies of previous prioritization exercises for human infectious diseases (cont.)
Robert Koch Institute, Berlin, 2008 (1)
Study aim To prioritize infectious diseases to inform resource allocation for research, surveillance and other activities in Germany.
Study method Expert consensus and multi-criteria decision analysis.
Criteria selection Selected to represent all relevant areas (epidemiology, clinical burden, etc.)
Criteria scoring A working group of 11 epidemiologists and infectious disease specialists scored the diseases (-1, 0, +1) according to criteria.
Criteria included Definition of criteria thresholds for scoring
Incidence (illness and symptomatic infection) ∞ <1/100 000 ∞ 1-20/100 000 ∞ >20/100 000
Severity ∞ Hospitalization rare/work loss <2 days, no persisting handicaps
∞ Hospitalization rare/work loss >5 rare, few persisting handicaps
∞ Hospitalization frequent/work loss >5 frequent, persisting handicaps
Mortality ∞ <50 deaths/year in Germany ∞ 50-500 deaths/year in Germany ∞ >500 deaths/year in Germany
Outbreak potential (probability of outbreaks occurrence)
∞ rare ∞ outbreaks with ≥5 cases are rare ∞ outbreaks with ≥5 cases are frequent
Trend ∞ diminishing ∞ stable ∞ increasing
Emerging potential ∞ endemic - unlikely to be introduced to Germany ∞ potential to be introduced to Germany sporadically ∞ likely to emerge in Germany as a public health threat
Evidence for risk factors/groups ∞ risk factors/groups have been identified based on scientific evidence
∞ risk factors/groups are known but scientific evidence is missing
∞ risk factors/groups are unknown
Validity of epidemiological information ∞ epidemiological situation well known and scientifically valid
∞ information exists but is not scientifically valid ∞ information insufficient
International action and public attention ∞ no international action or political agenda, little public attention
∞ no international action but informal political expectations, moderate public attention
∞ international action or explicit political agendas, high public attention

36
Evidence for pathogenesis ∞ information on pathogenesis and transmission route is available and well supported by scientific evidence
∞ information is available but not well supported by scientific evidence
∞ information rarely available
Preventability ∞ few possibilities for prevention, or there is no need ∞ prevention measures are available but there is a need
for further research ∞ strong need for further research on preventive
measures
Treatability ∞ medical treatment is rarely necessary, or effective treatments are available to positively affect the burden of the disease or the prognosis
∞ medical treatments are frequently indicated but have a limited effect on the burden of the disease or the prognosis
∞ medical treatment is needed but currently there is no treatment available that positively affects the burden of the disease or the prognosis

37
Table 2. Summary of the methodologies of previous prioritization exercises for human infectious diseases (cont.)
World Health Organization, 2003 (54)
Study aim To prioritize areas for investment in infectious diseases, including antimicrobial resistance and nosocomial infections.
Study method Modified 1-round Delphi.
Criteria selection Not specified.
Criteria scoring 24 workshop participants ranked the diseases according to eight criteria on a 1-5 scale. Overall mean score was used for final ranking.
Criteria included Definition of criteria thresholds for scoring
Disease impact 1-5 according to importance
Present burden of ill health 1-5 according to importance
Potential threat (5–10 years) 1-5 according to importance
Necessity for immediate public health response
1-5 according to importance
Low incidence only maintained by current public health activities
1-5 according to importance
Long-term effects on communicable diseases 1-5 according to importance
Social and economic impact 1-5 according to importance
Opportunity for health gains 1-5 according to importance
Public concern 1-5 according to importance

38
Table 2. Summary of the methodologies of previous prioritization exercises for human infectious diseases (cont.)
Public Health Laboratory Service United Kingdom, 2001 (55)
Study aim To assess the relative priority of communicable diseases and identify priority areas for work.
Study method Survey questionnaire: 1 130 questionnaires were distributed to professionals in communicable diseases control (518 were returned).
Criteria selection Not specified.
Criteria scoring Respondents scored each disease against four criteria on a 1-5 scale (low to high importance). A mean score for each criterion was calculated by summing the scores (range 1-5) and dividing by the number of respondents who gave a score (blank entries were disregarded). Diseases were ranked for each criterion based on the mean score.
Criteria included Definition of criteria thresholds for scoring
Present burden of ill-health Assessed according to age and sex-related morbidity and
mortality and data on quality-adjusted life years
Health, social and economic impact Assessed by considering the cost of infection to individuals
and health-care providers
Opportunity for health gains Assessed by considering specific activities or areas for
further work that could improve the present and future
burden of disease
Public concern and confidence Assessed by considering media and public attention

39
2.3 Multi-criteria decision analysis: methodology for the prioritization exercise
MCDA was used to prioritize pathogens as it is a
systematic approach to integrate information from
a range of sources, and a structured method for
comparing and ranking alternative decisions. Relevant
criteria were identified against which each alternative
(the antibiotic-resistant bacterium) was rated
according to predefined levels of performance, based
on the available evidence (56). In the past decade,
MCDA has been increasingly used for decision-making
in environmental and health-care-related processes
(allocation of limited resources, prioritization of
research ideas and management of risk) (57,58).
In order not to influence the output of the process, the
selection of the criteria should follow the established
MCDA best practice requirements (completeness, non-
redundancy, non-overlap and preference independence)
(59). In the scoring process, the criteria are rated by
the designated participants, who quantify their relative
importance based on their expertise. A total score for
each option is determined by adding the weights given
by the participants to each evidence-based criterion
level, which represents both its relative importance and
its degree of achievement on a particular performance
dimension (59). Therefore, one of the main strengths of
MCDA is its ability to incorporate both expert opinion
and evidence-based data.
Several methods for scoring and weighting are available,
using specially designed software (60). The most
traditional approaches of MCDA applied to infectious
diseases are based on value models where each
criterion is divided into mutually exclusive categories.
The simplest way to make such measurements is
weighted linear combination, which requires the
creation of a scale with identical ranges, capable of
incorporating the entire criteria value model. After
the weighting process, normalized values of criteria
weights are used in order to incorporate the relative
importance and to reach final values (1,50). Since
traditional scoring requires that the same change in the
value score for each criterion corresponds to the same
change in the degree of the alternative desirable option,
central to most of these methodologies are ratio or
interval scale measurements established by decision-
makers. This method assumes that all the criteria can
be represented on a homogenous and universal value
scale. This assumption may not hold when including
both quantitative and qualitative criteria, when criteria
do not have a linear relationship (i.e. odds ratios) or
when there is a lack of homogeneous evidence-based
data (such as, in this case, differences in surveillance
systems or patient data) (59). Moreover, the weighting
process in the more traditional methodologies requires
the expression of the relative importance of the criteria
through arbitrary ranking or attribution of values that
are practically meaningless and difficult to assess.
The methodology selected for our prioritization
exercise overcomes both above-mentioned
limitations, because it does not require an arbitrarily
predefined assumption about the scoring and the
weighting process. The ranking in our prioritization
is based on pairwise comparison of alternatives (i.e.
choosing one alternative from two) and uses the
PAPRIKA method (potentially all pairwise rankings of all
possible alternatives), supported by an on-line survey
software (www.1000minds.com).
In the PAPRIKA method, each survey participant is
asked to rank a series of pairs of hypothetical bacteria
defined on only two criteria at a time (61). Each time
the participant ranks a pair of bacteria, all other
hypothetical bacteria that can be ranked pairwise,
by transitivity, are identified and removed from the
participant’s survey. For example, if an expert ranks
bacterium A over bacterium B and then ranks B over
bacterium C, then logically (by transitivity), A is ranked
over C (and so a question on this third pair of pathogens
would not be asked). The number of questions and
the two criteria in each question are different for
each participant, as the questions asked depend on
the answer given to the preceding questions (i.e. the
software adapts as each question is answered). From
each participant’s individual ranking, criteria weights
for each level are calculated by the software using a
mathematical method based on linear programming.
Thus, the calculation of criteria weights is based on the
preferences expressed in pairwise ranking and not on
the arbitrary attribution of relative values to the criteria
nor on the assumption of an a priori linear relationship
within each criterion or a universal scale expressing all
criteria values.
In this specific prioritization exercise, criteria levels
were defined a priori, according to the available
evidence. However, their numerical values (i.e. the
intra-criterion relative importance) were based on the
answers of individual participants. Another advantage
of this methodology is that pairwise comparison is a
natural type of decision that everyone experiences
in daily life. Furthermore, differentiating the two
hypothetical pathogens in each question based on just
two criteria – in contrast to full-profile methods which
involve all criteria together at once – greatly reduces
the cognitive burden on participants.
40
Previous research-focused applications of 1000Minds
software include prioritization of health technology
(62), prioritizing patients for elective surgery in New
Zealand (63) and access to health-care services in
Canada (64), disease classification for rheumatoid
arthritis (65) and systemic sclerosis (66), measuring
clinical trial responses for gout patients (67), and testing
physical function for hip or knee replacement patients
(68). In a previous prioritization by WHO of vaccines
research and development, the PAPRIKA method and
the more traditional weighted summation model were
used together and provided reliable results (69).
The methodology has five steps:
∞ Expert group selection
∞ Selection of the antibiotic-resistant bacteria to be prioritized
∞ Selection of criteria for prioritization
∞ Data extraction and criteria synthesis into an MCDA model
∞ Ranking of bacteria using dedicated software (i.e. 1000 minds)
2.3.1 Expert group selection
Experts in infectious diseases, clinical microbiology,
epidemiology, public health and pharmaceutical
research and development were selected to discuss
and validate the steps of the project to reduce the
potential uncertainty of the available evidence.
Three groups of experts were selected: a coordinating
group, that was involved in all the main steps of the
project; a wider advisory group, whose involvement
was limited to the survey and review of the results; and
a WHO working group with experts directly involved
in the survey. All the experts were internationally
recognized leaders in antibiotic resistance and had
published widely in top-ranked, peer-reviewed
journals. All coordinating group members have made
major contributions to the antibiotic resistance field,
which have influenced health policy-making.
The survey participants were selected through
consultation with WHO representatives, the
coordinating and advisory groups and the international
affairs committee of ESCMID (European Society
of Clinical Microbiology and Infectious Diseases).
The selection process aimed to achieve a balance
of participants from different geographic regions,
genders and expertise.
2.3.2 Selection of antibiotic-resistant bacteria to be
prioritized
The coordinating group and WHO representatives
selected 20 bacteria with 25 patterns of resistance for
prioritization based on WHO surveillance reports on
antibiotic resistant bacteria of international concern
(39), previous prioritization exercises and their
knowledge in disease surveillance and burden. Table 3
shows the bacteria included for prioritization and the
health burden they represent.

41
Table 3. Bacteria included for prioritization
Bacteria Health burden
Acinetobacter baumanniicarbapenem-resistant
HIGH HEALTH-CARE BURDEN
∞ Great capacity to spread within hospital and to colonize environmental surfaces
∞ Leading cause of ventilator-associated pneumonia, and bloodstream and wound infections
∞ Intrinsically resistant to several classes of antibiotics and readily capable of acquiring resistance
∞ High mortality in invasive infections, especially in carbapenem-resistant strain
Serious threat for CDC and medium-high priority for PHAC
Campylobacter spp.fluoroquinolone-resistant
MAJOR CAUSE OF ACUTE DIARROHEA
∞ Foodborne disease ∞ Campylobacter coli and Campylobacter jejuni are the most important
species causing acute diarrhoea in humans ∞ Resistance increasing in both high-income and low-and middle-income
countries, particularly in the WHO South-East Asia region ∞ Estimated annual cases: 4.4-9.3/1 000 patients in high-income countries
Serious threat for CDC and medium-high priority for PHAC
Enterococcus faeciumvancomycin-resistant
FREQUENT CAUSE OF SEVERE INFECTION IN IMMUNOCOMPROMISED POPULATIONS
∞ High propensity for persistence in the hospital environment ∞ Frequent cause of hospital-acquired infections (bloodstream and urinary
tract infections) in patients with underlying conditions ∞ Limited treatment options
Serious threat for CDC and medium-high priority for PHAC
Enterobacteriaceaecarbapenem-resistant
Escherichia coliEnterobacter spp.Klebsiella spp.
HIGH HEALTH-CARE BURDEN
∞ Global spread of carbapenem resistance, mainly due to the production of carbapenemase enzymes
∞ Increasing rates of resistance reported in most countries ∞ High mortality rates ∞ Very limited treatment options
Urgent threat for CDC and high priority for PHAC
Enterobacteriaceaethird-generation cephalosporin-resistant
Escherichia coliKlebsiella spp.Enterobacter spp.Citrobacter spp.Morganella spp.Providencia spp.Proteus spp.Serratia spp.
HIGH COMMUNITY AND HEALTH-CARE BURDEN
∞ Resistance to third-generation cephalosporins is conferred through extended-spectrum beta-lactamase or Amp-C beta-lactamase production (plasmid or chromosomally transmitted)
∞ Community- and hospital-acquired extended-spectrum beta-lactamase-producing Enterobacteriaceae are widespread
∞ Responsible for community-acquired (urinary tract infections) and hospital-acquired (urinary tract and bloodstream infections, ventilator-associated pneumonia) infections
∞ The presence of chromosomally determined AmpC is associated with clinical failure with third-generation cephalosporin therapy despite in vitro susceptibility
Serious threat for CDC and high priority for PHAC
42
Haemophilus influenzae ampicillin-resistant
CAUSE OF SEVERE INFECTION IN PAEDRIATIC POPULATIONS
∞ Before the routine use of Haemophilus influenzae type b (Hib) conjugate vaccines in infants, invasive Hib was the leading cause of bacterial meningitis in children under five years of age
∞ High morbidity in low-income countries with limited vaccine coverage ∞ Ampicillin resistance is a well-documented globally. Two resistance
mechanisms have been described: production of beta lactamases (beta-lactamase-positive ampicillin resistance) and alterations in penicillin binding protein 3, resulting in decreased affinity for beta-lactams (beta-lactamase-negative ampicillin resistance)
∞ The beta-lactamase-negative ampicillin resistance phenotype could lead to clinical failure with empirical antibiotic treatment
Not ranked by CDC and low priority tier for PHAC
Helicobacter pylori clarithromycin-resistant
VERY COMMON INFECTION IN ALL-INCOME COUNTRIES ASSOCIATED WITH NON-CARDIA GASTRIC CANCER
∞ Very common infection in countries of all income levels and affecting both adults and children
∞ Because of the increase of antibiotic resistance, the eradication rate has fallen to inadequate levels: current guidelines do not recommend standard triple therapy if the regional level of clarithromycin resistance is >20% and the eradication rate is <85%
∞ The effectiveness of the remaining treatments for clarithromycin-resistant infection is debated
∞ The treatment options in the paediatric population are limited
Not ranked by CDC and medium-low priority for PHAC
Neisseria gonorrhoeae fluoroquinolone-resistantthird-generation cephalosporin-resistant
HIGH COMMUNITY BURDEN
∞ Common sexually transmitted infection: 78 million cases of gonorrhoea estimated globally in 2012
∞ Estimated 2012 global incidence of 19/1000 females and 24/1000 males ∞ Incidence is underestimated because of the lack of diagnostic capability in
some parts of the world ∞ Resistance reported to all drugs recommended for empirical monotherapy ∞ Current recommended dual empirical treatment (fluoroquinolone-
free) does not guarantee clinical efficacy, will not entirely prevent the development of resistance and is used in only a few parts of the world
Urgent threat for CDC and medium-high priority for PHAC
Non-typhoidal Salmonellafluoroquinolone-resistant
FREQUENT CAUSE OF MORBIDITY AND MORTALITY IN LOW- AND MIDDLE-INCOME COUNTRIES
∞ Responsible for most of the deaths caused by a bacterial foodborne agent in 2010 (over 59 000)
∞ Estimated global incidence of invasive infections in 2010: 49 cases/100 000 people; burden greatest in Africa: 227 cases/100 000 people, especially in children under five years
∞ Increasing fluoroquinolone resistance detected in many countries
Serious threat for CDC and medium-low priority for PHAC
Pseudomonas aeruginosacarbapenem-resistant
HIGH HEALTH-CARE BURDEN
∞ Primarily opportunistic nosocomial pathogen: one of the commonest causes of pneumonia in immunocompromised patients and those with lung diseases
∞ Carbapenem resistance increases the risk of mortality among patients with bloodstream infections
∞ Very limited treatment options
Serious threat for CDC and medium-low priority for PHAC

43
Salmonella Typhifluoroquinolone-resistant
FREQUENT CAUSE OF DEATH IN LOW- AND MIDDLE-INCOME COUNTRIES
∞ Most prevalent in low- and middle-income countries with poor access to sanitation
∞ 17.8 million cases of enteric fever estimated each year in low- and middle-income countries (mainly central Africa and Asia)
∞ 1 488 000 deaths estimated worldwide in 2015 ∞ After the development of resistance to the first-line recommended
treatments (chloramphenicol, ampicillin and trimethoprim-sulfamethoxazole) in the mid-1980s, resistance to cephalosporin and fluoroquinolones has been increasingly reported
Serious threat for CDC and low priority for PHAC
Shigella spp.fluoroquinolone-resistant
FREQUENT CAUSE OF MORBIDITY AND MORTALITY IN LOW- AND MIDDLE-INCOME COUNTRIES
∞ Major cause of morbidity and mortality worldwide, especially in developing countries: 165 million cases estimated to occur annually worldwide
∞ One million estimated deaths ∞ Resistance to traditional first-line medicines (ampicillin, sulfonamides,
nalidixic acid) is high globally and resistance to fluoroquinolones is increasingly reported worldwide
Serious threat for CDC and low priority for PHAC
Staphylococcus aureusmethicillin-resistantvancomycin-resistanta
MAJOR CAUSE OF MORBIDITY AND MORTALITY WORLDWIDE
∞ Methicillin-resistant Staphylococcus aureus (MRSA) is a frequent cause of hospital-acquired infections, especially in patients with risk factors or underlying conditions
∞ Methicillin-susceptible Staphylococcus aureus (MSSA) infections are also reported in community settings, especially community-acquired infections, and skin and soft tissue infections; also in individuals with no risk factors
∞ Infections caused by MRSA increase morbidity, mortality, length of hospital stay and costs compared with infections caused by MSSA
∞ Heterogeneous vancomycin-intermediate Staphylococcus aureus and vancomycin-intermediate Staphylococcus aureus, which are associated with poor outcomes, especially in invasive infections, are still rarely reported
MRSA: Serious threat for CDC and high priority for PHAC
Vancomycin-resistant Staphylococcus aureus: Concerning threat for CDC and
medium-low priority for PHAC
Streptococcus pneumoniae penicillin non-susceptibleb
HIGH COMMUNITY BURDEN
∞ Leading cause of pneumonia in children under 5 years of age ∞ Before widespread pneumococcal vaccination, pneumococcus caused an
estimated 826 000 deaths worldwide in 2000 and 541 000 deaths among children under 5 years in 2008
∞ Low grade penicillin non-susceptibility associated with increased mortality when meningitis is treated with benzylpenicillin
∞ It remains a major public health problem in low- and middle-income countries because of the vaccine cost
Serious threat for CDC and medium-low priority for PHAC
CDC: Centers for Diseae Control and Prevention; PHAC: Public Health Agency of Canada.a EUCAST (European Committee on Antimicrobial Susceptibility) breakpoint (minimum inhibitory concentration >2 mg/L);b EUCAST breakpoint (minimum inhibitory concentration >0.06 mg/L).
References: (70-94).

44
2.3.3 Selection of criteria for prioritization
The selection of criteria definition was based on the
research and development focus of the priority list
and followed MCDA best-practice (completeness,
non-redundancy, non-overlap and preference
independence).
The experts also considered it essential to include a
global view and One Health approach (www.who.
int/features/qa/one-health/en/). Criteria included in
previous prioritization were evaluated (Table 4). The
final criteria selected for the prioritization exercise are
shown in Table 5.
Table 4. Most relevant criteria in previous prioritization exercises
Criterion Previous priority pathogens lists (PPLs)
Comments
Incidence Reported in 6/8 PPLs; as number of cases/year in 4/8
Lack of incidence data for most pathogens in the lists
Future trend Reported in 3/8 PPLs Based on assumptions on incidence rates over period of times
Potential outbreaks Reported in 2/8 PPLs as probability of outbreaks occurring
Limited data available
Mortality Reported in 3/8 PPLs as mortality rate (not specified if attributable or overall mortality)
Reported in 4/8 PPLs as case fatality rate
Reported in 2/8 PPLs as estimated number of deaths
No global data available to assess incidence of mortality or real number of deaths
Severity Reported in 3/8 PPLs as work absenteeism or need for hospitalization
Reported in 3/8 PPLs as potential for sequelae
Reported in 1/8 PPLs as morbidity (clinical impact of untreated infection)
Reported in 2/8 PPLs as health-care utilization
Reported in 2/8 PPLs as events requiring public health action
No evidence data available. Qualitative review in all PPLs. Difficult to select a measure valid for all the included antibiotic-resistant pathogens because of the heterogeneity of their clinical manifestations
Risk factors Reported in 1/8 PPL as evidence of risk factors/populations at risk
Emphasizes the importance of the burden in selected populations
Transmissibility Reported in 2/8 PPLs as ability of the diseases to spread among humans
Reported in 2/8 PPLs as level of awareness/knowledge about transmission
Allows inclusion of animal, food and environment sectors to assess the likelihood of transmission between them
Preventability Reported in 5/8 PPLs as presence or absence of preventive measures
Presence of effective preventive measures can draw attention to the need for public health interventions
Treatment Reported in 6/8 PPLs as presence or absence of effective available treatment

45
Table 5. Criteria selected for the prioritization exercise
Criterion Definition
Mortality Pooled prevalence of all-cause mortality in patients with infections caused by antibiotic-resistant bacteria
Health-care burden Need for hospitalization and increase in length of stay in patients with infections caused by antibiotic-resistant bacteria compared to patients infected by susceptible strains
Community burden Prevalence of resistance and type of infections in community settings
Transmissibility Isolation and transmission among three sectors: animal-human, food-human, and human-human in community and hospital settings
Prevalence of
resistance
Pooled prevalence of resistance in clinically significant isolatesa, stratified by WHO region
10-year trend of
resistance
Linear increase in 10-year prevalence of resistance in clinically significant isolatesa, stratified by WHO region
Preventability in
community and
health-care setting
Availability and effectiveness of preventive measures in community and health-care settings
Treatability Availability of effective treatments (number of antibiotic classes, residual activity of antibiotics, and oral and paediatric formulations)
Pipeline Likelihood of future development (5-7 years) of new antibiotics based on the current drug development pipeline
a Clinically significant isolates: isolates from blood and cerebrospinal fluid for bacteria commonly causing invasive infections;
other samples were included (i.e. stools for Campylobacter spp. or swabs for Neisseria gonorrhoeae) depending on the most
common clinical diseases.

46
2.3.4 Data extraction and criteria synthesis into the
MCDA model
Mortality
Methods
Systematic review
∞ Inclusion criteria: published studies reporting data on mortality in patients infected with antibiotic-resistant bacteria and including a comparison group (either patient population with infections due to susceptible bacteria or non-infected control population). No restrictions on patient characteristics and study settings
∞ Exclusion criteria: non-English language publications, studies evaluating colonization, study protocols, diagnostic studies, reviews, non-clinical studies, and abstracts presented at conferences
Main outcome
All-cause mortality: pooled prevalence of mortality
(percentage) and 95% confidence intervals in patients
with infections caused by antibiotic-resistant bacteria.
Data sources
∞ PubMed and OvidSP databases
∞ Databases of the Workpackage 1B of the DRIVE-AB-IMI project (DRIVE-AB, contract number 115618; coordinator S. Harbarth, WP leader: Y. Carmeli).
∞ Study period: no time restriction, last update in September 2016.
∞ Search terms (example for Staphylococcus aureus, methicillin-resistant): (mortality[MeSH term] OR mortality[tw] OR death rate[tw] OR fatality[tw] OR survival rate[tw] OR death[tw] OR died[tw] OR dead[tw]) AND (methicillin resistant[tw] OR methicillin resistance[tw] OR "methicillin resistance"[MeSH term] OR meticillin resistant[tw] OR meticillin resistance[tw] OR MRSA[tw] OR "methicillin-resistant staphylococcus aureus"[MeSH term]) AND ("staphylococcus aureus"[MeSH term] OR Staphylococcus aureus[tw] OR S. aureus[tw]).
Data extraction
The following data were extracted: author, title,
journal, country and year of study, study population,
study setting, study design, related variables, type of
comparison group, number of patients in each arm
who completed the follow up, antibiotic-resistant
bacterium, type of infection, outcome reported
(definition, value, unadjusted and adjusted effect
measures, adjusting variables). For each outcome, the
values for both the arms and its precision measures
(standard deviation, standard error, 95% confidence
intervals) and the number of patients who contributed
to the measurement were collected for a pooled
estimate of the data.
The full text of the eligible articles was carefully read
by two reviewers to extract and enter the data into a
standardized data sheet. The databases were cross-
checked for any discrepancies, and inconsistencies
were discussed among the study team and resolved by
consensus. All major decisions were documented and
differences of opinion within the research team about
the extracted variables were resolved by discussion
with the senior researcher. Authors of the articles
included were contacted about missing data.
Data synthesis into MCDA model
Quantitative variables were reported as mean and
standard deviation or median and interquartile range.
Qualitative (categorical) variables were reported
as relative frequencies. Pooled estimates of the
prevalence of all-cause mortality were computed by
meta-analysis based on a random effect model with
Freeman–Tukey double arcsine transformation for
variance stability using the metaprop command of
STATA (Statacorp LLC, Texas).
All-cause mortality rate (30-day and in-hospital) with
95% confidence intervals was selected as the best
measure for scoring the bacteria against the mortality
criterion because of data availability. Four levels were
defined for rating antibiotic-resistant pathogens for
the mortality criterion.
Criterion Criterion levels Level definition
Mortality
LOW <10%
MEDIUM 10-20%
HIGH 21-40%
VERY HIGH >40%

47
Summary of sources of data on mortality
∞ Number of studies: 292 (105 Americas Region, 104 European Region, 58 Western Pacific Region, 17 South-East Asia Region, 4 Eastern Mediterranean Region, 4 African Region)
∞ 80% of the studies were carried out in high-income countries
∞ Number of patients: 21 127
∞ Infection type (studies): 155 bloodstream infections, 45 pneumonia, 92 other types of infections
∞ Study setting (studies): 37 intensive care unit, 11 onco-haematology wards, 9 surgical wards, 235 all hospital
∞ Patient populations (studies): 29 paediatric populations
Pooled data were reviewed in detail and the final
scoring was validated through discussion among
the coordinating group. No studies were found
on mortality in patients infected with antibiotic-
resistant strains of Helicobacter pylori and Neisseria
gonorrhoeae. These pathogens were rated in the low
level of all-cause mortality, based on available data on
susceptible strains and expert opinion.
Figure 12 shows the antibiotic-resistant bacteria with
very high and high mortality.
Fig. 12. Antibiotic-resistant bacteria with very high and high mortality CR: carbapenem-resistant, MR: methicillin-resistant, 3GCR: third-generation cephalosporin-resistant, VR: vancomycin-resistant
Mortality
VERY HIGH
Acinetobacter baumannii, CR Enterobacter spp., CR Enterococcus faecium, VR Klebsiella spp., CR Pseudomonas aeruginosa, CR
HIGH
Enterobacter spp., 3GCR Escherichia coli, 3GCR Escherichia coli, CR Klebsiella spp., 3GCR Morganella spp., 3GCR
Proteus spp., 3GCR Providencia spp., 3GCR Serratia spp., 3GCR Staphylococcus aureus, MR Staphylococcus aureus, VR
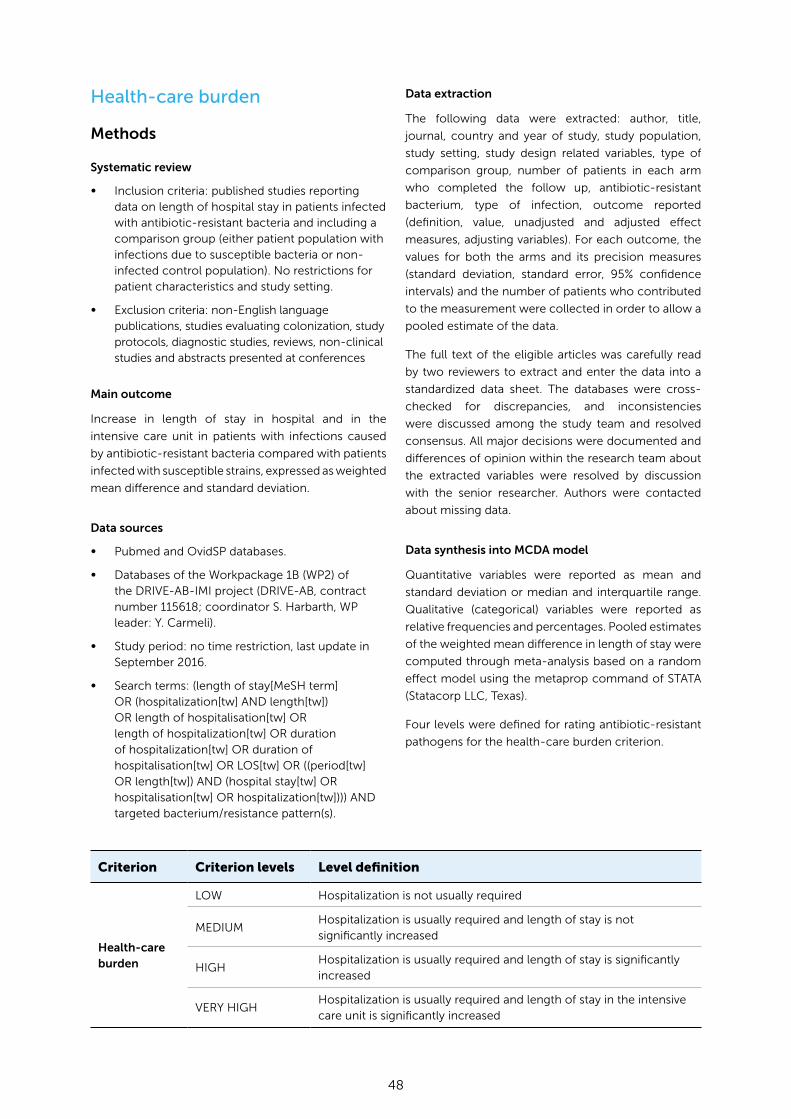
48
Health-care burden
Methods
Systematic review
∞ Inclusion criteria: published studies reporting data on length of hospital stay in patients infected with antibiotic-resistant bacteria and including a comparison group (either patient population with infections due to susceptible bacteria or non-infected control population). No restrictions for patient characteristics and study setting.
∞ Exclusion criteria: non-English language publications, studies evaluating colonization, study protocols, diagnostic studies, reviews, non-clinical studies and abstracts presented at conferences
Main outcome
Increase in length of stay in hospital and in the
intensive care unit in patients with infections caused
by antibiotic-resistant bacteria compared with patients
infected with susceptible strains, expressed as weighted
mean difference and standard deviation.
Data sources
∞ Pubmed and OvidSP databases.
∞ Databases of the Workpackage 1B (WP2) of the DRIVE-AB-IMI project (DRIVE-AB, contract number 115618; coordinator S. Harbarth, WP leader: Y. Carmeli).
∞ Study period: no time restriction, last update in September 2016.
∞ Search terms: (length of stay[MeSH term] OR (hospitalization[tw] AND length[tw]) OR length of hospitalisation[tw] OR length of hospitalization[tw] OR duration of hospitalization[tw] OR duration of hospitalisation[tw] OR LOS[tw] OR ((period[tw] OR length[tw]) AND (hospital stay[tw] OR hospitalisation[tw] OR hospitalization[tw]))) AND targeted bacterium/resistance pattern(s).
Data extraction
The following data were extracted: author, title,
journal, country and year of study, study population,
study setting, study design related variables, type of
comparison group, number of patients in each arm
who completed the follow up, antibiotic-resistant
bacterium, type of infection, outcome reported
(definition, value, unadjusted and adjusted effect
measures, adjusting variables). For each outcome, the
values for both the arms and its precision measures
(standard deviation, standard error, 95% confidence
intervals) and the number of patients who contributed
to the measurement were collected in order to allow a
pooled estimate of the data.
The full text of the eligible articles was carefully read
by two reviewers to extract and enter the data into a
standardized data sheet. The databases were cross-
checked for discrepancies, and inconsistencies
were discussed among the study team and resolved
consensus. All major decisions were documented and
differences of opinion within the research team about
the extracted variables were resolved by discussion
with the senior researcher. Authors were contacted
about missing data.
Data synthesis into MCDA model
Quantitative variables were reported as mean and
standard deviation or median and interquartile range.
Qualitative (categorical) variables were reported as
relative frequencies and percentages. Pooled estimates
of the weighted mean difference in length of stay were
computed through meta-analysis based on a random
effect model using the metaprop command of STATA
(Statacorp LLC, Texas).
Four levels were defined for rating antibiotic-resistant
pathogens for the health-care burden criterion.
Criterion Criterion levels Level definition
Health-care burden
LOW Hospitalization is not usually required
MEDIUMHospitalization is usually required and length of stay is not significantly increased
HIGHHospitalization is usually required and length of stay is significantly increased
VERY HIGHHospitalization is usually required and length of stay in the intensive care unit is significantly increased

49
Summary of sources of data on health-care burden
∞ Number of studies: 119 (57 Americas Region, 31 European Region , 23 Western Pacific Region, 7 South-East Asia Region, 1 African Region and 0 Eastern Mediterranean Region)
∞ 86% of the studies were in high-income countries
∞ Number of patients: 6 813 cases, 15 862 comparison group
∞ Infection type (studies): 66 bloodstream infections, 13 pneumonia, 40 other infection types.
∞ Study setting (studies): 13 intensive care unit , 3 onco-haematology wards, 4 surgical wards; 99 all hospital
∞ Patient populations (studies): 14 paediatric populations
Length of stay data were available for 16 out of the
25 antibiotic-resistant pathogens, seven also had
information on length of stay in the intensive care unit.
When data were not available, rating was done based
on available data on susceptible strains and expert
opinion.
Figure 13 shows the shows the antibiotic-resistant
bacteria with very high and high health-care burden.
Fig. 13. Antibiotic-resistant bacteria with very high and high health-care burden CR: carbapenem-resistant, MR: methicillin-resistant, 3GCR: third-generation cephalosporin-resistant, VR: vancomycin-resistant
Health-care burden
VERY HIGH
Acinetobacter baumannii, CR Escherichia coli, 3GCR Klebsiella spp., 3GCR Staphylococcus aureus, MR
HIGH
Enterococcus faecium, VR, VR Escherichia coli, CR Klebsiella spp., CR Proteus spp., 3GCR
Providencia spp., 3GCR Pseudomonas aeruginosa, CR Staphylococcus aureus, VR

50
Community burden
Methods
Literature review
∞ Inclusion criteria: published studies reporting data on the incidence and/or prevalence of infections and/or colonization caused by the selected antibiotic-resistant bacteria in community settings
Main outcome
Incidence and/or prevalence of infections and/or
colonization caused by antibiotic-resistant bacteria in
the community.
Data sources
∞ PubMed and OvidSP databases
∞ Study period: 2006 to September 2016
Data extraction
The following data were extracted: author, title, journal,
country and year of study, study population, time of
data collection, study setting, study design, number
of patients/individuals, type of infections, number
and type of sampling, antibiotic-resistant bacteria,
definition of outcomes.
Data synthesis into MCDA model
A qualitative assessment of the literature was done and
three levels were defined for rating antibiotic-resistant
pathogens for community burden.
Criterion Criterion levels Level definition
Community burden
LOWResistance in the community: rarely reported and
Type of infection: non-systemic
MODERATE
Resistance in the community: well reported and
Type of infection: non-systemic
OR
Resistance in the community: rarely reported and
Type of infection: non-systemic and systemic
HIGHResistance in the community: well reported and
Type of infection: non-systemic and systemic
Well reported: ≥10 studies/surveillance/reports; rarely reported: <10 studies/surveillance/reports.

51
Summary of sources of data on community burden
∞ Number of studies: 266
Figure 14 shows the antibiotic-resistant bacteria with a
high community burden
Fig. 14. Antibiotic-resistant bacteria with a high community burden CR: carbapenem-resistant, MR: methicillin-resistant, 3GCR: third-generation cephalosporin-resistant, VR: vancomycin-resistant
Community burden
HIGH
Campylobacter spp., FQR Escherichia coli, 3GCR Haemophilus influenzae, Amp-R Klebsiella spp., 3GCR
Salmonella Typhi, FQR Staphylococcus aureus, MR Streptococcus pneumoniae, PNS

52
Prevalence and 10-year trend of resistance
Methods
Review of surveillance systems and the literature
∞ Mapping of national and international surveillance systems reporting data on prevalence of resistance (number of resistant isolates/all tested isolates)
∞ Extraction of prevalence data in dedicated datasets
∞ Systematic review and meta-analysis of published literature reporting prevalence data for the bacteria not included in any surveillance systems
Main outcome
∞ Prevalence of resistance in clinically significant isolates
∞ 10-year trend of resistance (2005-2015)
Data sources
Existing databases: European surveillance systems
mapped from the SUSPIRE project (IMI project;
COMBACTE Magnet-EPI-Net: COMBACTE-MAGNET
(contract number 115737-2; coordinator M. Bonten;
WP leader: E. Tacconelli, A. Sifakis). No time and
language restriction. Last update: September 2016.
Websites of international stakeholders promoting
active surveillance on antibiotic-resistant bacteria:
WHO, ECDC, CDC, Centre for Disease Dynamics
Control and Policy, and national and international
surveillance systems. All were searched across the six
WHO regions. When no information was retrieved,
representatives of a country’s public health authority,
infectious diseases/clinical microbiology societies
and national agencies collecting epidemiological data
were contacted by email.
For countries with no data available or partly available
on the above-mentioned sources, national data
reported in the WHO Global Report on Surveillance
(39) were used.
For the two bacteria not surveyed through the
surveillance systems network, data were extracted
from the literature.
Helicobacter pylori, clarithromycin-resistant
∞ A systematic review of the literature was done including the following data sources: PubMed and OvidSP databases.
∞ Study period: 2005 to September 2016.
∞ Inclusion criteria: primary studies and systematic reviews, published and reporting data on resistance of Helicobacter pylori to the main antibiotics in use (clarithromycin, metronidazole and levofloxacin, amoxicillin, and tetracycline). Studies analysing at least 50 isolates and reporting results at regular time intervals, up to two years, to allow secular trend analyses. Both primary and secondary resistance was considered. No language restriction.
∞ Search terms: Helicobacter pylori resistance, antibiotic, clarithromycin, metronidazole, amoxicillin, levofloxacin, ciprofloxacin, quinolones, and tetracycline. Boolean operators (NOT, AND, OR) were also used to narrow and widen the search.
Staphylococcus aureus, vancomycin-resistant
∞ Prevalence data were extracted from an already published systematic review and meta-analysis reporting data on prevalence worldwide (95).
Data extraction
The following information was extracted from
surveillance data: surveillance systems information
and characteristics (period surveyed and country,
type of samples, population coverage); type and
numbers of laboratories included; number of tested
and resistant clinically significant isolates in the study
period, when available. To reduce an overestimation
of prevalence, especially for bacteria causing frequent
colonization, only clinically significant samples relevant
to the selected bacterium were considered (blood,
cerebrospinal fluid, stools and swabs), when available.
Resistance data were extracted according to the
breakpoint guidelines followed by each surveillance
system.
For the literature search, information was extracted on:
author, title, journal, country and year of publication,
study population, time of data collection, study setting,
study design, number of patients/individuals, sampling,
name of the bacterium and pattern(s) of resistance.
Data synthesis into MCDA model
For each bacterium, both prevalence and trend results
were grouped by WHO region. The most recent point
prevalence value from each country was used for
calculating the pooled estimate of prevalence for each
WHO region. Only the countries providing prevalence
data for at least three time points in the study period
were included for the trend analysis.

53
Summary of sources of data on prevalence and
10-year trend of resistance
∞ 23 surveillance systems were retrieved from the search, providing resistance data for 66 countries worldwide (supplementary Table 1: surveillance systems).
∞ Prevalence data extracted from the WHO surveillance report on antimicrobial resistance.
∞ No data were available from surveillance systems for Helicobacter pylori, clarithromycin-resistant and Staphylococcus aureus, vancomycin-resistant. Prevalence of resistance in these two bacteria was derived from systematic reviews of the literature.
∞ For the Eastern Mediterranean and Africa regions very few surveillance data were available. The data included for the Eastern Mediterranean Region were obtained from the WHO report on antibiotic resistance (39). For the Africa Region, South Africa and Kenya had active surveillance activities. The Europe and America regions had good coverage by surveillance systems (36 out of 53 and 22 out of 35 countries provided data, respectively).
Criterion Criterion levels Level definition
Prevalence of resistance
LOW <15% in the majority of WHO regions
MODERATE 15-30% in the majority of WHO regions
MODERATE-HIGH >30% in one WHO region (with the others ≤30%)
HIGH > 30% in two WHO regions (with the others ≤ 30%)
VERY HIGH > 30% in the majority of WHO regions
10-year trend of resistance
DECREASING Significant decrease of resistance rate in all WHO regions
STABLE Stable resistance rate in all WHO regions
LOW increase Significant increase of resistance rate in one WHO region
MODERATE increase Significant increase of resistance rate in two WHO regions
HIGH increase Significant increase of resistance rate in in the majority of WHO regions
Pooled prevalence was expressed as percentage of
resistance with 95% confidence intervals for each
WHO region providing data and computed through a
meta-analysis based on a random effects model.
Linear regression was used to assess the 10-year trend
of resistance (2005-2016) and the beta coefficient to
calculate the yearly change. Both positive and negative
coefficients with a P-value < 0.05 were considered
statistically significant.
WHO region Countries providing prevalence data Numbers of countries
AfricaBenin, Botswana, Burkina Faso, Burundi, Central Africa Republic, Congo, Ethiopia, Ghana, Guinea, Guinea Bissau, Lesotho, Malawi, Mauritania, Mauritius, Namibia, Swaziland, Uganda, Zambia, Zimbabwe
19
Americas 0 0
Eastern
Mediterranean
Bahrain, Iran (Islamic Republic of), Jordan, Morocco, Oman, United
Arab Emirates6
Europe Albania, Georgia, Moldova (Republic of), Russian Federationa 4
South-East Asia Bhutan, Myanmar, Nepal, Sri Lanka 4
Western PacificBrunei, Cambodia, China, Kiribati, Fiji, Lao People´s Democratic Republic; Micronesia, New Caledonia, Papua New Guinea, Samoa, Singapore, Solomon Island, Tonga
13
a Except for Neisseria gonorrhoeae (data available through the Russian Gonococcal Antimicrobial Surveillance Programme),
isolates were collected between 2009 and 2013, depending on the type of bacterium

54
Transmissibility
Methods
Review of the literature
∞ Inclusion criteria: studies published between 2007 and December 2016 on humans and animals, reporting data on transmission.
Main outcomes
∞ Percentage of antibiotic-resistant bacteria isolated in the environment, food and animals (food-producing animals and companion animals)
∞ Number of reported animal-human transmissions (zoonotic potential or proven zoonosis/foodborne transmission)
∞ Number of environment-human transmission (suspected or proven)
∞ Transmission among humans in community and health-care settings in terms of outbreak capability (attack rate or outcome measure reported by the study’s authors).
Data sources
∞ MEDLINE and OvidSP databases
∞ Study period: 2006 to December 2016. No language restriction
∞ The systematic review protocol EpideMiology and control measures of outBreaks due to Antibiotic-Resistant orGanisms in EurOpe (EMBARGO) (unpublished data) was used to obtain the number of nosocomial outbreaks up to December 2014 and the attack rate, when available
Data extraction
The following information was extracted: author, title,
journal, country and year of study, study population
variables, time of data collection, study setting, study
design, number of subjects and sampling, antibiotic-
resistant bacteria, type and setting of transmission.
Data synthesis into MCDA model
A qualitative assessment of the literature was done for
data synthesis and three levels were defined for rating
antibiotic-resistant pathogens.
Criterion Criterion levels
Level definitions
Transmissibility
LOWOutbreaks: rarely or not reported/Isolation in HAFE: uncommon/Transmission: not reported
MODERATEOutbreaks: commonly reported/Isolation in HAFE: common/Transmission: low zoonotic potentiala
HIGH
Outbreaks: commonly reported (high attack rateb)/Isolation in HAFE: uncommon/Transmission: not reported
OR
Outbreaks: commonly reported/Isolation in HAFE: common/Transmission: high zoonotic potentialc
HAFE: humans, animals, food and the environment.a Low zoonotic potential: reports of possible transmissions between animals and humans.b High attack rate: >10% (number of new cases in the population at risk/number of persons at risk in the population).c High zoonotic potential: transmission between animal and humans proven by molecular methods.

55
Summary of sources of data on transmissibility
∞ Number of studies: 181
Figure 15 shows the antibiotic-resistant bacteria with
high transmissibility
Fig. 15. Antibiotic-resistant bacteria with high transmissibility CR: carbapenem-resistant, FQR: fluoroquinolone-resistant, MR: methicillin-resistant, 3GCR: third-generation cephalosporin-resistant
Transmissibility
HIGH
Acinetobacter baumannii, CR Campylobacter spp., FQR Escherichia coli, 3GCR Klebsiella spp., 3GCR Neisseria gonorrhoeae, 3GCR Neisseria gonorrhoeae, FQR
Pseudomonas aeruginosa, CR Salmonella Typhi, FQR Non-typhoidal Salmonella, FQR Serratia spp., 3GCR Staphylococcus aureus, MR
56
Preventability in community and health-care settings
Methods
Review of the literature
∞ Inclusion criteria: guidelines and guidance documents published in English between 2004 and October 2016.
Main outcome
∞ Availability and effectiveness of preventive measures aimed at reducing the spread of antibiotic-resistant bacteria in both community and health-care settings.
Data sources
∞ PubMed, Cochrane Library and Centre for Reviews and Dissemination, specialist databases (Google Advanced search, WHO, World Bank, Tripdatabase) and websites of international stakeholders (including the European Society of Clinical Microbiology and Infectious Diseases, ECDC, WHO, Society for Healthcare Epidemiology of America)
∞ Study period: 2006 to September 2016
Data extraction
The following information was extracted: author/
society, title, journal, country and year of publication,
study setting, population profile/relevant population for
the guideline, specific characteristics of the antibiotic-
resistant bacterium, setting where the intervention
is recommended/carried out (community/hospital),
epidemiological situation where the intervention is
recommended/carried out (endemic/outbreaks),
outcome of the intervention reported (definition,
value, unadjusted and adjusted effect measures,
adjusting variables), strength of recommendation in
the guidelines and level of evidence for the selected
recommendation (if reported).
Data synthesis into MCDA model
Data synthesis was done through a qualitative
assessment of guidelines and published literature.
Two levels were defined for rating antibiotic-resistant
pathogens.
Criterion Criterion levels
Level definitions
Preventability in community and health-care settings
HIGHPreventive measures available (moderate/high-quality evidence) and effective
LOWPreventive measures not well defined (low-quality evidence) or only partly effective
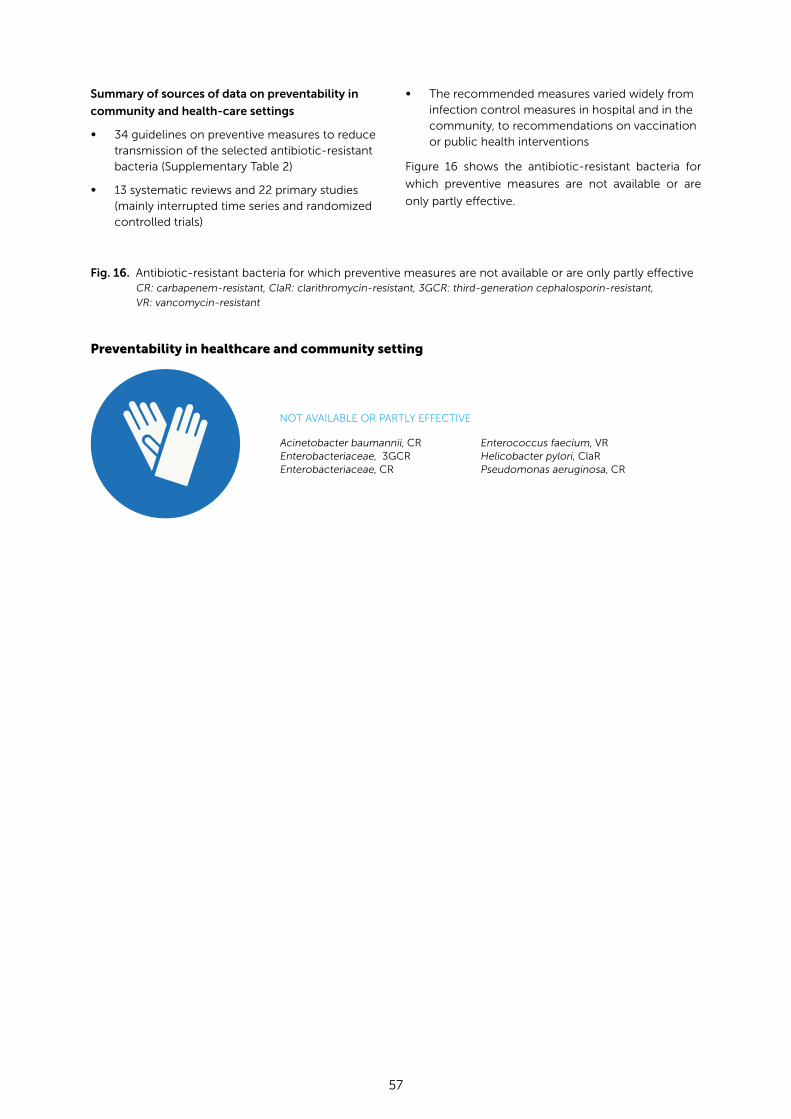
57
Summary of sources of data on preventability in
community and health-care settings
∞ 34 guidelines on preventive measures to reduce transmission of the selected antibiotic-resistant bacteria (Supplementary Table 2)
∞ 13 systematic reviews and 22 primary studies (mainly interrupted time series and randomized controlled trials)
∞ The recommended measures varied widely from infection control measures in hospital and in the community, to recommendations on vaccination or public health interventions
Figure 16 shows the antibiotic-resistant bacteria for
which preventive measures are not available or are
only partly effective.
Fig. 16. Antibiotic-resistant bacteria for which preventive measures are not available or are only partly effective CR: carbapenem-resistant, ClaR: clarithromycin-resistant, 3GCR: third-generation cephalosporin-resistant, VR: vancomycin-resistant
Preventability in healthcare and community setting
NOT AVAILABLE OR PARTLY EFFECTIVE
Acinetobacter baumannii, CR Enterobacteriaceae, 3GCR Enterobacteriaceae, CR
Enterococcus faecium, VR Helicobacter pylori, ClaR Pseudomonas aeruginosa, CR

58
Treatability
Methods
Review of the literature
∞ Inclusion criteria: guidelines and literature studies reporting data on available treatment options of infections caused by the selected antibiotic-resistant bacteria.
Main outcomes
∞ Number of classes of antibiotics recommended as first-line treatment in the most recent guidelines
∞ Resistance to the first-line antibiotics reported in post-marketing and cohort studies (expressed as percentage of residual activity)
∞ Availability of oral formulations
∞ Registration for paediatric use
∞ Recommendation on combination treatment in the most recent guidelines.
Data sources
Published guidelines and guidance: review of guidelines
and guidance documents published between 2005
and November 2016 proposing antibiotic therapy for
infections caused by antibiotic-resistant bacteria in both
community and health-care settings. The literature
search was limited to English language publications
on humans. In case of multiple documents from the
same group, the most recent update was included.
PubMed, Cochrane Library and Centre for Reviews and
Dissemination, specialist databases (Google Advanced
search, WHO, World Bank, Tripdatabase) and websites
of international stakeholders (including the European
Society of Clinical Microbiology and Infectious
Diseases, ECDC, and the Infectious Diseases Society of
America were searched.
Update of published guidelines: review of randomized
controlled trials for antibiotics approved after the
guideline development or for new indications/
combinations of antibiotics already included in
guidelines. The literature search was limited to English
language publications on humans. MEDLINE and
OvidSP databases, clinicaltrial.org, Cochrane Library
and Centre for Reviews and Dissemination, specialist
databases (Google Advanced search, WHO, World
Bank, Trip database) were searched.
When guidelines were not available, systematic reviews
and reviews published between 2005 and November
2016 were examined, adopting the same eligibility
criteria.
Review of publications reporting data on old antibiotics
with potential effectiveness against antibiotic resistant
bacteria: List of forgotten antibiotics (96).
Review of case reports reporting data on effectiveness
of antibiotic(s) against the antibiotic-resistant bacteria:
the same sources as the published guidelines were
searched, adopting the same eligibility criteria.
Assessment of antibiotic sensitivity in vitro: Breakpoints
and phenotypic in vitro antimicrobial susceptibility
testing provided by the Clinical and Laboratory
Standard Institute and the European Committee on
Antimicrobial Susceptibility.
Review of publications reporting data on resistance:
review of cohort, surveillance, prevalence studies
published between 2007 and November 2016,
reporting resistance rate to the selected antibiotics.
Data extraction
The following information was extracted: author/
society, title, journal, country and year of publication,
study population, study setting, population profile/
relevant population for the guideline, name of antibiotic,
route of administration, level of indication and of
strength of recommendation according to the Grading
of Recommendations Assessment, Development
and Evaluation (GRADE) (97) or similar approaches,
when available, treatment registration/indications
(for randomized controlled trials), percentage of the
antibiotic-resistant bacterium resistant to the current
treatments available, availability of oral formulations,
registration for the paediatric population.
Data synthesis into MCDA model
Data synthesis was performed through a qualitative
assessment of guidelines and published literature.
Three levels were defined for rating antibiotic-resistant
pathogens.

59
Summary of sources of data on treatability
∞ Literature review retrieved a total of 43 guidelines (Supplementary Tables 3 and 4), 38 randomized controlled trials, 43 systematic reviews, 54 reviews, 30 primary studies (including retrospective or prospective studies, case series or case reports).
∞ A total of 60 studies were also retrieved for evaluation of the residual susceptibility.
∞ Availability and effectiveness of old antibiotics was based on one specific review on the topic (96).
Figure 17 shows the antibiotic-resistant bacteria for
which treatments are not available or are limited.
Criterion Criterion levels
Level definitions
Treatability
SUFFICIENTAt least 2 classes of antibiotics (first-line therapy) with high residual activitya (>80%) and availability of oral and paediatric formulations
LIMITED
One class (first-line therapy) with high residual activity (>80%) or at
least two classes (first-line therapy) with reduced residual activity
(<80%) and availability of oral and/or paediatric formulations
OR
Guidelines requiring combination treatment as first-line treatment
because of resistance or pathogen-related factors
ABSENTOne class (first-line therapy) with reduced residual activity (<80%) and/or last resort antibiotics
a Residual activity: rate of resistance to a first-line antibiotic detected in surveys or post-marketing-studies.
Fig. 17. Antibiotic-resistant bacteria for which preventive measures are not available or are only partly effective CR: carbapenem-resistant, ClaR: clarithromycin-resistant, 3GCR: third-generation cephalosporin-resistant, VR: vancomycin-resistant
Treatability
ABSENT
Acinetobacter baumannii, CR Enterobacteriaceae, CR Pseudomonas aeruginosa, CR
LIMITED
Campylobacter spp., FQR Enterobacteriaceae, 3GCR Neisseria gonorrhoeae, FQR Neisseria gonorrhoeae, 3GCR

60
Pipeline
MethodsReview of currently available information on antibiotics
in the pipeline (in clinical development and pre-clinical
projects).
Main outcome
Likelihood of the development in the future (5-7 years)
of new antibiotics potentially targeting the selected
antibiotic-resistant bacteria based on the current
pipeline
Data sources
Review of scientific and commercial presentations,
clinical trial registries, partnering meetings, scientific
abstracts, company websites, selected patents, clinical
phase analysis and other unrestricted material and
information on drugs in the current pipeline.
Data extraction
The following information was extracted on new
molecules currently in development: likelihood of
inclusion in future registered indication, number of
molecules with a potential coverage included in current
clinical pipeline and pre-clinical projects, challenges in
discovery and development of new molecules for the
selected antibiotic-resistant bacteria.
Data synthesis into MCDA model
Data synthesis was done by expert scoring of the
following:
∞ Likelihood of selected antibiotic resistant bacteria to be a future drug target: unlikely (1 point); possibly (2 points); very likely (3 points)
∞ No. of drugs included in clinical pipeline: no drugs (1 point); at least one drug (2 points); several drugs (3 points)
∞ No. of pre-clinical projects: no projects (1 point); insufficient number (2 points); sufficient number (3 points)
∞ Challenges in discovery: very few (3 points); several (2 points); many (1 point)
∞ Challenges in clinical development: very few (3 points); several (2 points); many (1 point).
Three levels were defined for rating the antibiotic-
resistant pathogens.
Criterion Criterion levels Level definitions
Pipeline
LIKELY TO BE INCLUDED >8 points
WILL POSSIBLY BE INCLUDED 7-8 points
UNLIKELY TO BE INCLUDED < 7 points
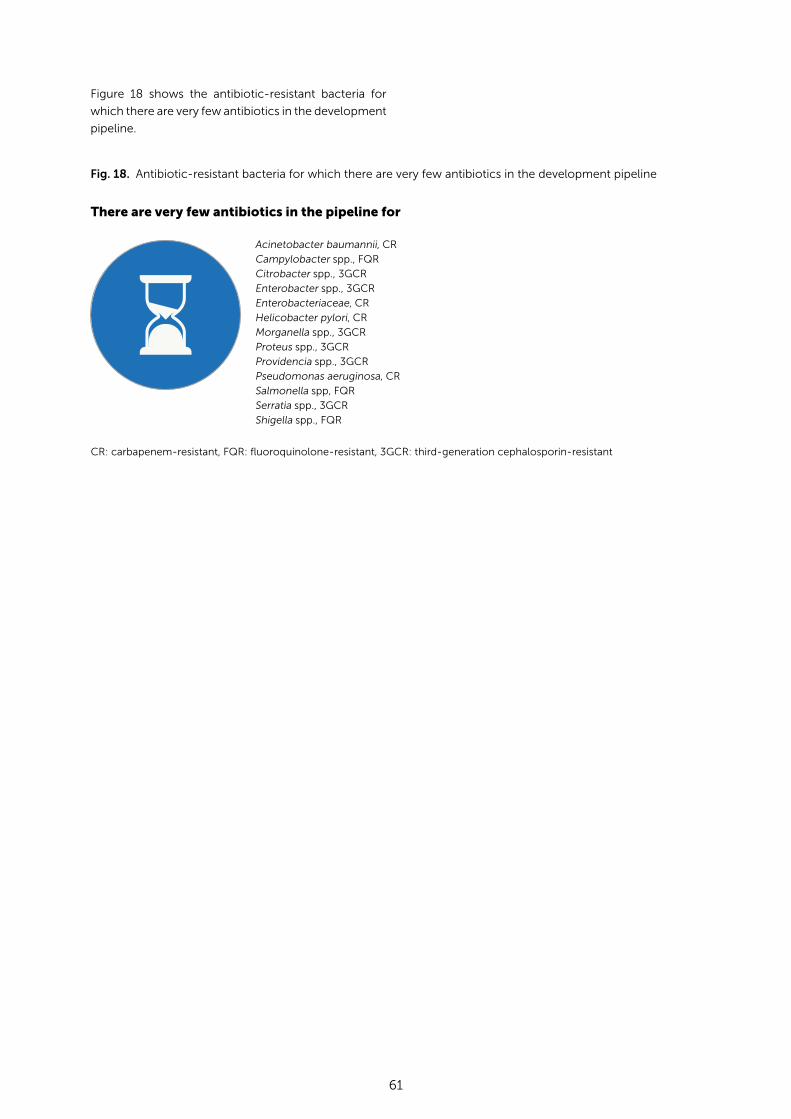
61
Figure 18 shows the antibiotic-resistant bacteria for
which there are very few antibiotics in the development
pipeline.
Fig. 18. Antibiotic-resistant bacteria for which there are very few antibiotics in the development pipeline
There are very few antibiotics in the pipeline for
Acinetobacter baumannii, CR
Campylobacter spp., FQR
Citrobacter spp., 3GCR
Enterobacter spp., 3GCR
Enterobacteriaceae, CR
Helicobacter pylori, CR
Morganella spp., 3GCR
Proteus spp., 3GCR
Providencia spp., 3GCR
Pseudomonas aeruginosa, CR
Salmonella spp, FQR
Serratia spp., 3GCR
Shigella spp., FQR
CR: carbapenem-resistant, FQR: fluoroquinolone-resistant, 3GCR: third-generation cephalosporin-resistant

62
2.3.5 Summary of the evidence assessment methods:
strengths and limitations
A summary of the methodologies for the evidence
assessment of the criteria and their strengths and
limitations are shown in Table 6.
Table 6. Summary of the methodologies for the evidence assessment of the criteria
Criterion Methodology Strengths and limitations
Mortality Systematic reviews and meta-analyses of studies assessing mortality in patients infected with antibiotic-resistant bacteria compared to patients infected with susceptible strains. No restriction for patient population, infection type and setting
∞ Allows the rating of antibiotic-resistant pathogens according to the severity of the disease.
∞ Does not take into account the total number of deaths among patients infected by antibiotic-resistant pathogens.
∞ Adjusted analysis could not be done because of the scarcity of information on specific populations for all the pathogens included.
∞ Overall crude mortality was calculated instead of infection-attributable mortality because of lack of data.
∞ 80% of the studies were conducted in high-income countries.
Health-care
burden
Systematic reviews and meta-
analyses of studies assessing
hospitalization and total length
of stay in patients infected with
antibiotic-resistant bacteria
compared to patients infected
with susceptible strains. No
restriction for patient population,
infection type and setting
∞ Expresses the severity of infections by antibiotic-resistant pathogens, especially for pathogens that may not cause death.
∞ Reflects the excess burden due to antibiotic resistance.
∞ Does not take into account the total number of hospitalizations.
∞ 80% of the studies were conducted in high-income countries.
∞ Does not consider the differences in determinants of hospitalization for different national health plans and economies.
Community
burden
Review of cohort and surveillance
studies evaluating the prevalence
of antibiotic resistance and type
of infections in the community.
No restriction for patient
population
∞ Summarizes qualitatively the importance of the burden of antimicrobial resistance in the community in terms of frequency of infections and clinical severity.
∞ Data were extracted mainly from observational studies with good representativeness of almost all the WHO regions for most of the pathogens included.
∞ National and international surveillance in the community or high-quality, multicentre studies were only available for a few pathogens.

63
Transmissibility Review of studies assessing
the isolation and transmission
of antibiotic-resistant bacteria
between four sectors (humans,
animals, food, environment)
∞ Qualitative assessment of antibiotic resistance in the community, hospital setting, the environment, food and animals based on the One Health approach.
∞ Very limited data for precise assessment of the potential for outbreaks and calculation of the attack rate.
Prevalence of
resistance
Data extraction from 23 national
and international surveillance
systems reporting data on
antibiotic-resistant bacteria (last
available data reported); and
national data from the 2014 WHO
report (39)
∞ Prevalence data were extracted from national and international surveillance systems with good and precise representativeness of the surveyed countries.
∞ Coverage range was wide in some WHO regions (EUR, AMR, WPR), but limited in others (AFR, EMR).
∞ Final values were pooled through meta-analysis, attributing more weight to countries reporting greater sample size.
∞ Only clinically significant samples were considered (i.e. blood and cerebrospinal fluid for pathogens causing severe infections; stools for Campylobacter spp., Shigella spp. and Salmonella spp.; and swabs for Neisseria gonorrhoeae), which provided a more precise assessment of the prevalence of resistance in infected patients, rather than colonized individuals.
10-year trend
of resistance
Data extraction from the same
dataset searched for prevalence
of resistance (reported in the past
10 years)
∞ Provides a dynamic picture of the threat of emerging resistance.
∞ Both clinical significance and statistical power for the increasing/decreasing trend were considered for each WHO region.
∞ Pooled prevalence allows weighting according to the sample size of the available isolates.
∞ Not all the countries contributing to the prevalence analysis provided enough data to calculate trend (especially in EMR and AFR).
Preventability
in community
and health-care
settings
Review of: 34 national and
international guidelines assessing
preventability of transmission
of antibiotic-resistant bacteria
in health-care and community
settings; randomized controlled
trials; interrupted time series; and
large cohort studies assessing
effectiveness of preventive
measures after last published
guidelines
∞ Qualitative assessment was necessary because of the difficulty in determining actual efficacy and availability of preventive measures.
∞ The quality of the studies was poor and there was great variation in the preventive measures available in different parts of the world.
∞ Availability of preventive measures does not necessarily equate to their universal implementation.

64
Treatability Review of: 47 international
guidelines for treatment of
infections caused by antibiotic-
resistant bacteria; antibiotics
evaluation forms of the European
Committee on Antimicrobial
Susceptibility; case reports and
cohort studies of last resort
antibiotics (past 5 years); list of
forgotten antibiotics (96); and
post-marketing surveillance data
∞ Only a qualitative assessment of current treatments available was possible because of the difficulty in defining a single outcome in such diverse infections.
∞ Assessment of guidelines assumed equal availability of each antibiotic worldwide. Adjustment for unequal supply of each antibiotic in the WHO regions was not possible.
∞ Data on residual activity were available mainly from studies on post-marketed drugs and they may not be representative of the global distribution of concomitant resistance to other classes in the selected antibiotic-resistant strains.
∞ No account was taken of side-effects and toxicity of the antibiotics.
Pipeline Review of: scientific and pharmaceutical company presentations; clinical trial registries; partnering meetings; scientific abstracts; pharmaceutical company websites; selected patents; clinical trial phase analysis (98); and other unrestricted material and information on drugs in the current pipeline. All the variables included were summarized in a pipeline index
∞ Expert opinion of the current pipeline.
∞ Data on drug development are rarely made publicly available.
∞ The pipeline is continuously and rapidly changing and this evaluation represents only a snapshot of the current pipeline.
AFR: African Region, AMR: Americas Region, EMR: Eastern Mediterranean Region, EUR: European Region,
WPR: Western Pacific Region.
2.3.6 Summary of the evidence
The following graphics summarize the prevalence and
trend evidence, and other criteria l, for each antibiotic-
resistant bacterium. The world map shows five ranges in
prevalence of resistance indicated by different colours.
The 10-year trend of resistance is represented by arrows
indicating the direction of the trend across different
WHO regions. Mortality, health-care and community
burden, preventability, transmissibility, pipeline, and
treatability are scored according to their criteria levels.

65
Acinetobacter baumannii, carbapenem-resistant (CR)
Prevalence of resistance
> 50 %
31 –50 %
16 – 30 %
5 – 15 %
< 5 %
No data
10-year trend of resistance
Americas Europe Eastern Mediterranean Africa South-East Asia Western Pacific
Preventability in the community
Preventability in healthcare setting
Community burden
Transmissibilty
Healthcare burden
Mortality Treatability
Pipeline
Campylobacter spp., fluoroquinolone-resistant (FQR)
Prevalence of resistance
> 50 %
31 –50 %
16 – 30 %
5 – 15 %
< 5 %
No data
10-year trend of resistance
Americas Europe Eastern Mediterranean Africa South-East Asia Western Pacific
Preventability in the community
Preventability in healthcare setting
Community burden
Transmissibilty
Healthcare burden
Mortality Treatability
Pipeline
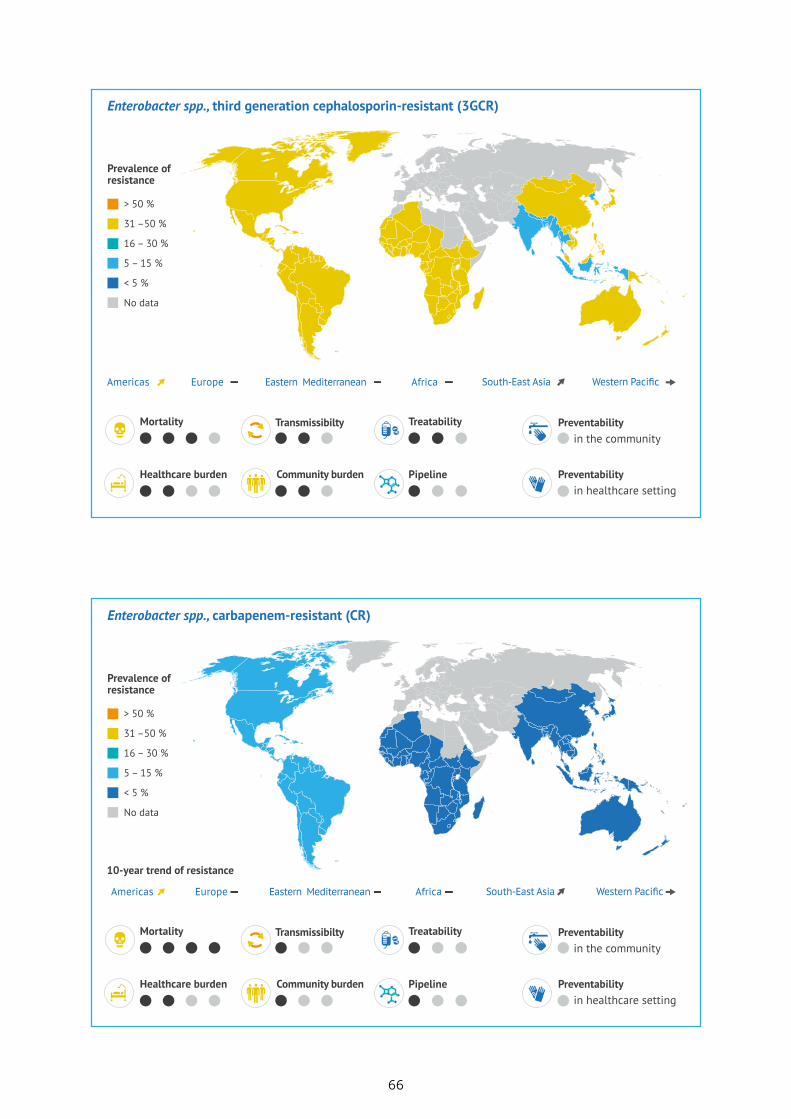
66
Enterobacter spp., carbapenem-resistant (CR)
Prevalence of resistance
> 50 %
31 –50 %
16 – 30 %
5 – 15 %
< 5 %
No data
10-year trend of resistance
Americas Europe Eastern Mediterranean Africa South-East Asia Western Pacific
Preventability in the community
Preventability in healthcare setting
Community burden
Transmissibilty
Healthcare burden
Mortality Treatability
Pipeline
Enterobacter spp., third generation cephalosporin-resistant (3GCR)
Prevalence of resistance
> 50 %
31 –50 %
16 – 30 %
5 – 15 %
< 5 %
No data
Americas Europe Eastern Mediterranean Africa South-East Asia Western Pacific
Preventability in the community
Preventability in healthcare setting
Community burden
Transmissibilty
Healthcare burden
Mortality Treatability
Pipeline
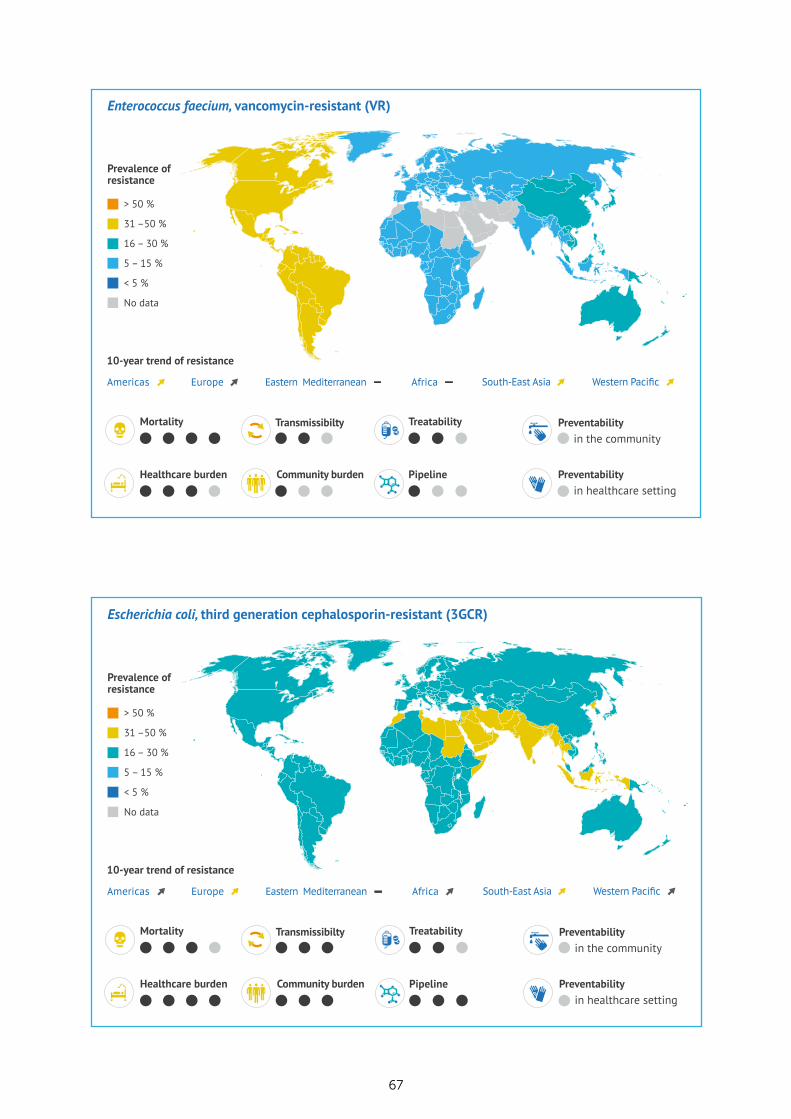
67
Enterococcus faecium, vancomycin-resistant (VR)
Prevalence of resistance
> 50 %
31 –50 %
16 – 30 %
5 – 15 %
< 5 %
No data
10-year trend of resistance
Americas Europe Eastern Mediterranean Africa South-East Asia Western Pacific
Preventability in the community
Preventability in healthcare setting
Community burden
Transmissibilty
Healthcare burden
Mortality Treatability
Pipeline
Escherichia coli, third generation cephalosporin-resistant (3GCR)
Prevalence of resistance
> 50 %
31 –50 %
16 – 30 %
5 – 15 %
< 5 %
No data
10-year trend of resistance
Americas Europe Eastern Mediterranean Africa South-East Asia Western Pacific
Preventability in the community
Preventability in healthcare setting
Community burden
Transmissibilty
Healthcare burden
Mortality Treatability
Pipeline

68
Escherichia coli, carbapenem-resistant (CR)
Prevalence of resistance
> 50 %
31 –50 %
16 – 30 %
5 – 15 %
< 5 %
No data
10-year trend of resistance
Americas Europe Eastern Mediterranean Africa South-East Asia Western Pacific
Preventability in the community
Preventability in healthcare setting
Community burden
Transmissibilty
Healthcare burden
Mortality Treatability
Pipeline
Haemophilus influenzae, ampicillin-resistant (AmpR)
Prevalence of resistance
> 50 %
31 –50 %
16 – 30 %
5 – 15 %
< 5 %
No data
10-year trend of resistance
Americas Europe Eastern Mediterranean Africa South-East Asia Western Pacific
Preventability in the community
Preventability in healthcare setting
Community burden
Transmissibilty
Healthcare burden
Mortality Treatability
Pipeline
69
Klebsiella spp., third generation cephalosporin-resistant (3GCR)
Prevalence of resistance
> 50 %
31 –50 %
16 – 30 %
5 – 15 %
< 5 %
No data
10-year trend of resistance
Preventability in the community
Preventability in healthcare setting
Community burden
Transmissibilty
Healthcare burden
Mortality Treatability
Pipeline
Americas Europe Eastern Mediterranean Africa South-East Asia Western Pacific
Helicobacter pylori, clarithromycin-resistant (ClaR)
10-year trend
Prevalence of resistance
> 50 %
31 –50 %
16 – 30 %
5 – 15 %
< 5 %
No data
10-year trend of resistance
Americas Europe Eastern Mediterranean Africa South-East Asia Western Pacific
Preventability in the community
Preventability in healthcare setting
Community burden
Transmissibilty
Healthcare burden
Mortality Treatability
Pipeline
70
Klebsiella spp., carbapenem-resistant (CR)
Prevalence of resistance
> 50 %
31 –50 %
16 – 30 %
5 – 15 %
< 5 %
No data
10-year trend of resistance
Preventability in the community
Preventability in healthcare setting
Community burden
Transmissibilty
Healthcare burden
Mortality Treatability
Pipeline
Americas Europe Eastern Mediterranean Africa South-East Asia Western Pacific
Neisseria gonorrhoeae, third generation cephalosporin-resistant (3GCR)
Prevalence of resistance
> 50 %
31 –50 %
16 – 30 %
5 – 15 %
< 5 %
No data
10-year trend of resistance
Americas Europe Eastern Mediterranean Africa South-East Asia Western Pacific
Preventability in the community
Preventability in healthcare setting
Community burden
Transmissibilty
Healthcare burden
Mortality Treatability
Pipeline

71
Non-typhoidal Salmonella, fluoroquinolone-resistant (FQR)
Prevalence of resistance
> 50 %
31 –50 %
16 – 30 %
5 – 15 %
< 5 %
No data
10-year trend of resistance
Americas Europe Eastern Mediterranean Africa South-East Asia Western Pacific
Preventability in the community
Preventability in healthcare setting
Community burden
Transmissibilty
Healthcare burden
Mortality Treatability
Pipeline
Pseudomonas aeruginosa, carbapenem-resistant (CR)
Prevalence of resistance
> 50 %
31 –50 %
16 – 30 %
5 – 15 %
< 5 %
No data
10-year trend of resistance
Americas Europe Eastern Mediterranean Africa South-East Asia Western Pacific
Preventability in the community
Preventability in healthcare setting
Community burden
Transmissibilty
Healthcare burden
Mortality Treatability
Pipeline

72
Salmonella Typhi, fluoroquinolone-resistant (FQR)
Prevalence of resistance
> 50 %
31 –50 %
16 – 30 %
5 – 15 %
< 5 %
No data
10-year trend of resistance
Americas Europe Eastern Mediterranean Africa South-East Asia Western Pacific
Preventability in the community
Preventability in healthcare setting
Community burden
Transmissibilty
Healthcare burden
Mortality Treatability
Pipeline
Shigella spp., fluoroquinolone-resistant (FQR)
Prevalence of resistance
> 50 %
31 –50 %
16 – 30 %
5 – 15 %
< 5 %
No data
10-year trend of resistance
Americas Europe Eastern Mediterranean Africa South-East Asia Western Pacific
Preventability in the community
Preventability in healthcare setting
Community burden
Transmissibilty
Healthcare burden
Mortality Treatability
Pipeline

73
Staphylococcus aureus, methicillin-resistant (MR)
Prevalence of resistance
> 50 %
31 –50 %
16 – 30 %
5 – 15 %
< 5 %
No data
10-year trend of resistance
Americas Europe Eastern Mediterranean Africa South-East Asia Western Pacific
Preventability in the community
Preventability in healthcare setting
Community burden
Transmissibilty
Healthcare burden
Mortality Treatability
Pipeline
Staphylococcus aureus, vancomycin-resistant (VR)
10-year trend of resistance
Prevalence of resistance
> 50 %
31 –50 %
16 – 30 %
5 – 15 %
< 5 %
No data
Americas Europe Eastern Mediterranean Africa South-East Asia Western Pacific
Preventability in the community
Preventability in healthcare setting
Community burden
Transmissibilty
Healthcare burden
Mortality Treatability
Pipeline

74
Streptococcus pneumoniae, penicillin-non-susceptible (PNS)
Prevalence of resistance
> 50 %
31 –50 %
16 – 30 %
5 – 15 %
< 5 %
No data
10-year trend of resistance
Americas Europe Eastern Mediterranean Africa South-East Asia Western Pacific
Preventability in the community
Preventability in healthcare setting
Community burden
Transmissibilty
Healthcare burden
Mortality Treatability
Pipeline

75
2.3.7 Ranking
After rating the pathogens into the evidence-based
priority matrix and following MCDA methodology,
criteria weighting was assessed by expert opinion
of the relative importance of the selected criteria. In
this prioritization exercise, many international experts
completed a preference-based survey based on
the PAPRIKA method and supported by 1000 minds
software (www.1000minds.com/). Details of the
methodology are provided in Section 3.2.
The survey-software elicits the participants´
preferences between two options, defined on two
criteria at the time. For the purpose of this specific
prioritization exercise, each expert was iteratively
asked which one of two hypothetical bacteria was
more antibiotic-resistant and should be targeted
first for future research and development of new
antibiotics. To check internal consistency, the experts
were presented with three pairs of identical questions
in random order during the survey.
The number of questions and time taken to answer
each question were recorded by the software and
reported as medians and interquartile range. From
each participant´s individual ranking, criteria weights
for each level were calculated by the software. Each
bacterium’s total score – calculated by summing their
weights for the different criteria – was established on
a scale of 0 to 100%, where 100% corresponds to a
hypothetical bacterium reaching the worst levels on all
the criteria and 0% to reaching the best levels on all the
criteria. Mean values and relative standard deviations
of the bacteria’s total scores were calculated. The final
priority list was based on the mean total score for each
antibiotic-resistant bacterium.
Ranking stability assessment
The ordinal association between the participant´s final
ranking was assessed by the Kendall rank correlation
coefficient.
The final weights and rankings of the criteria were
stratified according to the participants’ scientific
expertise (infectious diseases, clinical microbiology,
epidemiology, public health and pharmaceutical
research and development) and geographical origin
(WHO region) in order to assess variations in the relative
importance of the criteria and the bacteria ranking
because of differences in background. Significant
changes in criteria mean weights (P < 0•05) were
assessed by one-way ANOVA and the Kruskal-Wallis
rank test for normally and non-normally distributed
variables, respectively. The final ranking was calculated
for the whole panel of experts and grouped according
to WHO region.
A sensitivity analysis was done after excluding the
responses of the experts who gave a different answer
in more than one repeated question. The hypothesis
that the final ranking could have been influenced by
the unbalanced geographic distribution of the experts
was assessed by re-running the prioritization and
attributing the same weights to each WHO region.
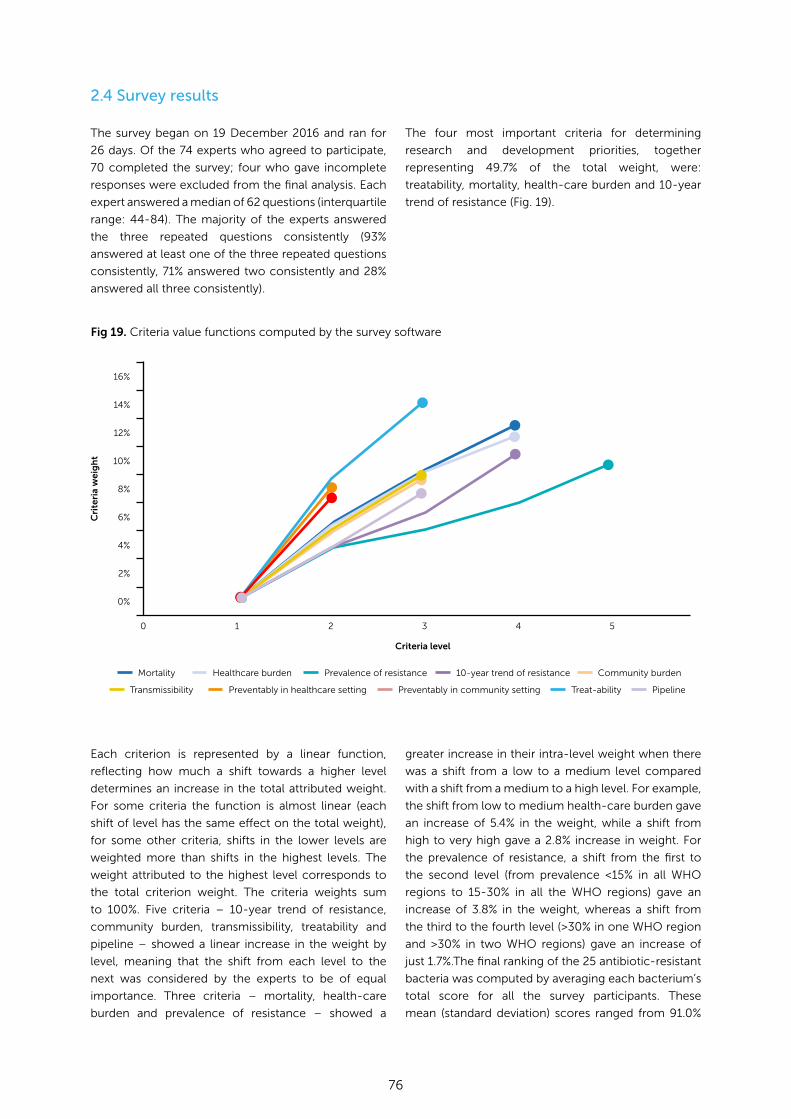
76
2.4 Survey results
The survey began on 19 December 2016 and ran for
26 days. Of the 74 experts who agreed to participate,
70 completed the survey; four who gave incomplete
responses were excluded from the final analysis. Each
expert answered a median of 62 questions (interquartile
range: 44-84). The majority of the experts answered
the three repeated questions consistently (93%
answered at least one of the three repeated questions
consistently, 71% answered two consistently and 28%
answered all three consistently).
The four most important criteria for determining
research and development priorities, together
representing 49.7% of the total weight, were:
treatability, mortality, health-care burden and 10-year
trend of resistance (Fig. 19).
16%
12%
14%
10%
8%
6%
4%
2%
0%
0 21 3 4 5
Criteria level
Cri
teri
a w
eig
ht
Fig 19. Criteria value functions computed by the survey software
Mortality Healthcare burden Prevalence of resistance 10-year trend of resistance Community burden
Transmissibility Preventably in healthcare setting Preventably in community setting Treat-ability Pipeline
Each criterion is represented by a linear function,
reflecting how much a shift towards a higher level
determines an increase in the total attributed weight.
For some criteria the function is almost linear (each
shift of level has the same effect on the total weight),
for some other criteria, shifts in the lower levels are
weighted more than shifts in the highest levels. The
weight attributed to the highest level corresponds to
the total criterion weight. The criteria weights sum
to 100%. Five criteria – 10-year trend of resistance,
community burden, transmissibility, treatability and
pipeline – showed a linear increase in the weight by
level, meaning that the shift from each level to the
next was considered by the experts to be of equal
importance. Three criteria – mortality, health-care
burden and prevalence of resistance – showed a
greater increase in their intra-level weight when there
was a shift from a low to a medium level compared
with a shift from a medium to a high level. For example,
the shift from low to medium health-care burden gave
an increase of 5.4% in the weight, while a shift from
high to very high gave a 2.8% increase in weight. For
the prevalence of resistance, a shift from the first to
the second level (from prevalence <15% in all WHO
regions to 15-30% in all the WHO regions) gave an
increase of 3.8% in the weight, whereas a shift from
the third to the fourth level (>30% in one WHO region
and >30% in two WHO regions) gave an increase of
just 1.7%.The final ranking of the 25 antibiotic-resistant
bacteria was computed by averaging each bacterium’s
total score for all the survey participants. These
mean (standard deviation) scores ranged from 91.0%

77
(5.2%) for the top-ranked bacterium (Acinetobacter
baumannii, carbapenem-resistant) to 22.1% (6.7%)
for the bottom-ranked one (Staphylococcus aureus,
vancomycin-resistant). Antibiotic-resistant Gram-
negative bacteria were rated at the highest level on the
four most heavily weighted criteria. The highest ranked
Gram-positive bacteria were vancomycin-resistant
Enterococcus faecium [54.5% (7.2%)] and methicillin-
resistant Staphylococcus aureus [52.7% (11.2%)].
Among bacteria typically responsible for community-
acquired infections, the highest ranked were
clarithromycin-resistant Helicobacter pylori [44.8%
(10.1%)], fluoroquinolone-resistant Campylobacter
spp. [41.0% (7.8%)], fluoroquinolone-resistant Neisseria
gonorrhoeae [35.8% (8.9%)] and fluoroquinolone-
resistant Salmonella Typhi [37.6% (9•2%)] (Fig. 20).
Fig 20. Final ranking of other antibiotic-resistant bacteria (mean weight and standard deviation)
AmpR: ampicillin-resistant, CR: carbapenem-resistant, ClaR: clarithromycin-resistant, FQR: fluoroquinolone-resistant, MR:
methicillin-resistant, PNS: penicillin non susceptible 3GCR: third-generation cephalosporin-resistant, VR: vancomycin-resistant
Acinetobacter baumannii, CR 91·0 ± 5·2%
81·7 ± 6·3%
76·5 ± 8·1%
76·5 ± 8·1%
70·3 ± 8·5%
69·0 ± 7·8%
65·2 ± 8·1%
59·7 ± 9·5%
58·7 ± 10·6%
55·4 ± 11·0%
54·8 ± 9·9%
54·5 ± 7·2%
52·7 ± 11·2%
51·7 ± 10·1%
45·9 ± 11·1%
44·8 ± 10·1%
41·0 ± 7·8%
37·6 ± 9·2%
35·8 ± 8·9%
33·3 ± 9·9%
32·3 ± 6·8%
26·4 ± 7·1%
26·2 ± 8·1%
22·9 ± 6·5%
22·1 ± 6·7%
Escherichia coli, 3GCR
Pseudomonas aetuginosa, CR
Klebsiella spp., CR
Klebsiella spp., 3GCR
Proteus spp., 3GCR
Enterobacter spp., CR
Escherichia coli, CR
Providencia spp., 3GCR
Enterococcus faecium, VR
Straphtlococcus aureus, MR
Citrobacter spp., 3GCR
Morganella spp., 3GCR
Helicobacter pylori, ClaR
Campylobacter spp., FQR
Salmonella Typhi, FQR
Neisseria gonorrhoeae, FQR
Streptococcus pneumoniae, PNS
Non-typhoidal Salmonella, FQR
Haemophilus influenzae, AmpR
Neisseria gonorrhoeae, 3GCR
Shigella spp., FQR
Staphylococcus aureus, VR
Enterobacter spp., 3GCR
Serratia spp., 3GCR
0 10 20 30 40 50 60 70 80 90 100
Percentage
Criteria weights attributed by the experts were
stratified according to WHO region and compared to
identify any significant changes in relative importance.
The only criterion that showed a significant change
was community burden with a mean value of 14•6%
for experts from the Africa region and 5•9% for experts
from the Americas region (P = 0•0046) (Fig. 21). No
significant differences in criteria ranking were found
after stratifying by the scientific background of the
experts.

78
Fig 21. Subgroup analysis of criteria weights by geographic region
AFR: African region, AMR: Americas region, EMR: Eastern Mediterranean region, EUR: European region, SEAR: South-East
Asian region, WPR: Western Pacific region
Source: WHO
AFR: African region, AMR: Americas region, EMR: Eastern Mediterranean region, EUR: European region, SEAR: South-East Asian region,
WPR: Western Pacific region
Mortality
Prevalence of resistance
Helathcare burden
Community burden
10-year trend of resistance
Preventability in community
Treatability
Pipeline
Transmissibility
Preventability in healthcare setting
0 2 4 6 8 10 12 14 16 18 20
Percentage
AFR AMR EMR EUR WPR SEAR
Ranking by region was relatively stable compared
with the overall final ranking. The only statistically
significant difference was in the priority list of experts
from Africa, who gave an additional 8.1% of the total
weight to Staphylococcus aureus, methicillin-resistant
compared to the overall ranking.
The final ranking of pathogens after excluding the
results of the 20 experts who consistently answered
fewer than two repeated questions did not show
significant differences. An additional sensitivity analysis
was done assuming an equal number of participants
from each WHO region, with no significant changes to
the final ranking order.
The final ranking computed through the software
showed a high level of agreement between the
whole group of participants (Kendall coefficient of
concordance 0.869).

79
2.5 Ranking of other drug-resistant bacterial infections: overall results(Note: Mycobacterium tuberculosis is covered in Section 1)
The survey ranking was reviewed by the coordinating group
and an expert panel to evaluate the results and the sensitivity
analyses and to develop the dissemination plan. To simplify
the presentation of results and comply with the research
and development focus, bacteria of the same species
with multiple resistance patterns were grouped together
in the highest ranked position (Fig. 23)”. For example, if
different carbapenem-resistant Enterobacteriaceae were
ranked in 3rd, 5th and 6th position, they were grouped
and ranked in the 3rd position. The priority pathogen list
was then stratified into three tiers using a cut-off at the
33rd percentile of the pathogen total scores. The critical
priority tier included the bacteria that scored over 66%:
Acinetobacter baumannii, Pseudomonas aeruginosa, and
Enterobacter spp., carbapenem-resistant and Enterobacter
spp., third-generation cephalosporin-resistant. The
high priority tier included bacteria scoring between
65% and 34%: Enterococcus faecium, vancomycin-
resistant; Staphylococcus aureus, methicillin-resistant and
vancomycin-resistant; Helicobacter pylori, clarithromycin-
resistant; Campylobacter spp., Salmonella spp., and
Neisseria gonorrhoeae, fluoroquinolone-resistant; and
Neisseria gonorrhoeae, third-generation cephalosporin-
resistant. The medium priority tier included bacteria scoring
less than 33%: Streptococcus pneumoniae, penicillin-non-
susceptible; Haemophilus influenzae, ampicillin-resistant
and Shigella spp., fluoroquinolone-resistant.
Fig 23. Priority pathogens for R&D of new antibiotics
Haemophilus influenzae ampicillin-resistant
Streptococcus pneumoniae penicillin-non-susceptible
Shigella species fluoroquinolone-resistant
MEDIUM PRIORITY
HIGH PRIORITY
Neisseria gonorrhoeae 3rd gen. cephalosporin-resistant,fluoroquinolone-resistant
Helicobacter pylori clarithromycin-resistant
Campylobacter species fluoroquinolone-resistant
Staphylococcus aureus vancomycin-resistantmethicillin-resistant
Salmonella species fluoroquinolone-resistant
Enterococcus faecium vancomycin-resistant
CRITICAL PRIORITY
Acinetobacter baumannii carbapenem-resistant
Pseudomonas aeruginosa carbapenem-resistant
Enterobacteriaceae carbapenem-resistant, 3rd gen. cephalosporin-resistant
80
2.6 Conclusions
∞ The WHO prioritization exercise suggests that drug research and development strategies should focus urgently on new antibiotics specifically active against tuberculosis and multi- and extensively drug-resistant Gram-negative bacteria that cause acute infections in both hospital and community settings.
∞ Global research and development strategies should also include antibiotics active against more common community bacteria, such as antibiotic-resistant Salmonella spp., Campylobacter spp. and Helicobacter pylori.
∞ Further efforts should address how to incentivize the development of oral formulations for community infections caused by antibiotic-resistant bacteria with a high morbidity burden, such as drug-resistant Neisseria gonorrhoeae and third-generation cephalosporin-resistant Enterobacteriaceae.
∞ To drive long-term plans of pharmaceutical and research centres working in research and development of new antibiotics, the WHO list must be aligned with increased political awareness in a global, multifaceted strategy to reduce the burden of resistant infections.
∞ Although this prioritization exercise does not cover all the possible patterns of resistance and co-resistance, the results clearly support prioritization in the development of new antibiotic classes with new targets and mechanisms of action without cross-resistance to existing classes.
∞ The WHO Priority Pathogens List underlines the important need for new antibiotics for the paediatric population and for user-friendly (e.g.
oral) formulations for diseases caused by drug-resistant bacteria with high morbidity in both high-income and low- and middle-income countries, such as multidrug- and extensively drug-resistant Mycobacterium tuberculosis, drug-resistant Neisseria gonorrhoeae, fluoroquinolone-resistant Campylobacter spp. and Salmonella spp., clarithromycin-resistant Helicobacter pylori, and third-generation cephalosporin-resistant Enterobacteriaceae.
∞ The expert working group acknowledges that the availability of prevention measures does not necessarily equate with their universal implementation and that dedicated efforts should be made to increase public health prevention interventions when their effectiveness is proven. A dedicated programme led by WHO should be responsible for increasing and standardizing the implementation of infection control strategies.
∞ Specific attention should be paid to the implementation of antibiotic stewardship initiatives globally, especially in combination with educational activities and public awareness campaigns. The rational and sustainable use of existing antibiotics is essential to preserve their residual efficacy. Moreover, extensive promotion of different and responsible prescribing behaviour would protect new drugs from the rapid development of new bacterial resistance. Long-term investment in educational activities and innovative tools to support appropriate use, and adequate financing plans for projects are therefore urgently needed globally.

81
Strengths of the prioritization exercise
∞ The prioritization of pathogens is an innovative international effort to standardize and prioritize research and development for new medicines for tuberculosis and other drug-resistant bacterial infections. It includes a multi-component definition of treatability as available therapeutic options and an analysis of the current clinical pipeline for antibacterial agents.
∞ Assessment of the current treatments available included a detailed evaluation of the evidence, coupled with data on residual susceptibility of existing drugs (i.e. the rate of resistance to a first-line antibiotics in surveys or post-marketing studies), and availability of oral and paediatric formulations. An assessment by experts of antibiotics in development highlighted that, for the majority of the priority pathogens, new drugs will not be available in the short term.
∞ The list of pathogens can be updated by either including other resistant bacteria or defining new criteria. Because of the flexibility of the methodology, it would be possible to re-run the analyses including more experts, new bacteria or new criteria levels, whenever updated or better quality data become available or new resistance threats are identified.
∞ Data on transmission potential between humans, animals, food and the environment were collected and included in the transmissibility criterion, following the One Health approach. Antibiotics are widely used in human medicine, livestock production and aquaculture (for disease prevention and treatment, and growth promotion). Mycobacterium tuberculosis is almost exclusively found in humans, although human-to-animal transmission has been described in the scientific literature. Resistant bacteria are reported in humans, animals, food and the environment, and one of the main drivers of the spread of resistance is the overuse
of antibiotics in one or more of these sectors. The One Health approach recognizes that the health of humans, animals and ecosystems are interconnected and interdependent. Animals and the environment could represent a reservoir for pathogens, facilitate the exchange and spread of resistance, and lead to infectious diseases driven by highly varied and dynamic human-animal and human-environment interactions.
∞ The results of the modelling showed that the final ranking was stable, even after stratifying the data by WHO region, and analysing the consistency and sensitivity.
∞ The development of the priority criteria used the PAPRIKA method, which has two main advantages. First, the method generates a set of weights for each individual participant in the preferences survey, in contrast to most other methods which produce aggregated data across a group of participants only. Individual-level data allowed us to investigate differences in the experts’ preferences, and the extent to which they were associated with demographic and background characteristics. Second, pairwise ranking is less difficult for decision-makers than choosing between more than two alternatives (in this instance, the bacteria) or between alternatives defined on more than two criteria at a time. Prioritization exercises based only on consensus have several drawbacks: they can lead to a diluted version of the best opinion with the result representing the lowest common denominator; disagreement is difficult to explore and could result in artificial consensus; the facilitator’s opinion may dominate; and the success of the method depends mainly on the quality of the participants.

82
Limitations
∞ Incidence rates and future burden of diseases were not estimated. With the exception of TB, for which strong surveillance and monitoring systems have been in place since 1994, there are almost no global routine surveillance systems for other bacteria. These could be used to calculate the true mortality burden associated with resistant infections in the future. To define the global prevalence of resistance more precisely, only clinically relevant samples (blood and cerebrospinal fluid for severe infections, swabs for Neisseria gonorrhoeae, and stools for Shigella spp. and Campylobacter spp.) were included. Incidence data could have significantly increased the precision of the modelling but these are limited to a few countries, focus on health facility-associated infections and are mainly derived through complex estimations.
∞ With the exception of TB, absolute numbers of deaths globally, which would have increased the precision of the mortality criterion, were not available from most WHO regions. Available estimates have been criticized mainly for the same reasons as estimates of the number of cases. The choice of overall crude mortality instead of the preferred infection-attributable mortality was also because of a lack of available data.
∞ The economic costs of infections caused by resistant bacteria were not included because of the lack of global data (TB excluded); what estimations there were, were mainly from high-income countries. These costs are difficult to extrapolate to lower income regions because of the very different health-care systems.
Gaps in understanding the burden of antibiotic resistance
∞ With the exception of TB, there is a large gap in the current evidence on infections caused by antibiotic-resistant bacteria in community and health-care settings, in particular for data on the frequency and burden of infections. High-quality data were missing, especially for community-acquired infections and from middle- and low-income countries.
∞ Major data gaps in surveillance (except TB) are evident, especially in the African and Eastern Mediterranean regions. Gaps in prevalence estimations are not only due to the lack of surveillance systems but also to scarce or low-quality diagnostic tools in many low-income countries. International surveillance programmes, such as those promoted by WHO, the Center for Disease Dynamics, Economics & Policy and ReAct, are trying to fill these gaps, but results from these initiatives are not yet available and were not included in this prioritization process. The value of surveillance data is clearly seen in the case of TB, which has greatly facilitated the prioritization of Mycobacterium tuberculosis as a target pathogen for research and development.
∞ As antibiotic resistance is a multifaceted and cross-sectoral issue affecting humans, animals, food and the environment, much more integrated surveillance is needed through an interconnected and integrated One Health surveillance framework across these four compartments.
∞ Great differences in the implementation of infection prevention and control measures were seen and interventions to increase the implementation of standardized infection prevention and control measures are urgently needed. The lack of microbiology laboratory capacity in low- and middle-income countries further complicates patient-specific treatment. For some microorganisms such as Neisseria gonorrhoeae the absence of a network of laboratories means that routine testing is difficult and the infection is often misdiagnosed. The infection might be not treated even though effective treatments are available.

83
References
1. Krause G. How can infectious diseases be prioritized in public health? A standardized prioritization scheme for discussion. EMBO Rep. 2008;9 Suppl 1:S22-7.
2. World Health Organization, International Labour Organization, United Nations Environment Programme. WHO human health risk assessment toolkit: chemical hazards. Geneva: World Health Organziation; 2010.
3. Food and Agriculture Organization of the United Nations/World Health Organization. Risk characterization of microbiological hazards in food: guidelines. 2009 (http://www.fao.org/docrep/012/i1134e/i1134e.pdf, accessed 23 August 2017) .
4. Lim SS, Vos T, Flaxman AD, Danaei G, Shibuya K, Adair-Rohani H, et al. A comparative risk assessment of burden of disease and injury attributable to 67 risk factors and risk factor clusters in 21 regions, 1990-2010: a systematic analysis for the Global Burden of Disease Study 2010. Lancet. 2012;380(9859):2224-60.
5. World Health Organization. Global Health Observatory (GHO) Data [Online] 7 August 2017 (http://www.who.int/gho/en/, accessed 23 August 2017).
6. World Health Organization. Global tuberculosis report 2016. Geneva: World Health Organization; 2016 (http://www.who.int/tb/publications/global_report/en/, accessed 23 August 2017)
7. World Health Organization. The end TB strategy: global strategy and targets for tuberculosis prevention, care and control after 2015. Geneva: World Health Organization; 2014 (http://www.who.int/tb/strategy/End_TB_Strategy.pdf?ua=1, accessed 23 August 2017).
8. World Health Organization. Global tuberculosis report 2014. Geneva: World Health Organization; 2014 (http://apps.who.int/iris/bitstream/10665/137094/1/9789241564809_eng.pdf, accessed 23 August 2017).
9. Zignol M, Dean AS, Falzon D, van Gemert W, Wright A, van Deun A, et al. Twenty years of global surveillance of antituberculosis-drug resistance. N Engl J Med. 2016;375(11):1081-9.
10. Migliori GB, De Iaco G, Besozzi G, Centis R, Cirillo DM. First tuberculosis cases in Italy resistant to all tested drugs. Euro Surveill. 2007;12(5):E070517.1.
11. Velayati AA, Masjedi MR, Farnia P, Tabarsi P, Ghanavi J, ZiaZarifi AH, et al. Emergence of new forms of totally drug-resistant tuberculosis bacilli: super extensively drug-resistant tuberculosis or totally drug-resistant strains in iran. Chest. 2009;136(2):420-5.
12. Udwadia ZF, Amale RA, Ajbani KK, Rodrigues C. Totally drug-resistant tuberculosis in India. Clin Infect Dis. 2012;54(4):579-81.
13. Gagneux S. Fitness cost of drug resistance in Mycobacterium tuberculosis. Clin Microbiol Infect. 2009;15 Suppl 1:66-8.
14. Borrell S, Gagneux S. Infectiousness, reproductive fitness and evolution of drug-resistant Mycobacterium tuberculosis. Int J Tuberc Lung Dis. 2009;13(12):1456-66.
15. Dharmadhikari AS, Basaraba RJ, Van Der Walt ML, Weyer K, Mphahlele M, Venter K, et al. Natural infection of guinea pigs exposed to patients with highly drug-resistant tuberculosis. Tuberculosis (Edinb). 2011;91(4):329-38.
16. Frieden TR, Sherman LF, Maw KL, Fujiwara PI, Crawford JT, Nivin B, et al. A multi-institutional outbreak of highly drug-resistant tuberculosis: epidemiology and clinical outcomes. Jama. 1996;276(15):1229-35.
17. Shah NS, Auld SC, Brust JC, Mathema B, Ismail N, Moodley P, et al. Transmission of Extensively Drug-Resistant Tuberculosis in South Africa. N Engl J Med. 2017;376(3):243-53.
18. Gandhi NR, Moll A, Sturm AW, Pawinski R, Govender T, Lalloo U, et al. Extensively drug-resistant tuberculosis as a cause of death in patients co-infected with tuberculosis and HIV in a rural area of South Africa. Lancet. 2006;368(9547):1575-80.
19. Leung EC, Leung CC, Kam KM, Yew WW, Chang KC, Leung WM, et al. Transmission of multidrug-resistant and extensively drug-resistant tuberculosis in a metropolitan city. Eur Respir J. 2013;41(4):901-8.
20. Kendall EA, Fofana MO, Dowdy DW. Burden of transmitted multidrug resistance in epidemics of tuberculosis: a transmission modelling analysis. Lancet Respir Med. 2015;3(12):963-72.
21. Dye C, Williams BG, Espinal MA, Raviglione MC. Erasing the world's slow stain: strategies to beat multidrug-resistant tuberculosis. Science. 2002;295(5562):2042-6.
84
22. McBryde ES, Meehan MT, Doan TN, Ragonnet R, Marais BJ, Guernier V, et al. The risk of global epidemic replacement with drug-resistant Mycobacterium tuberculosis strains. Int J Infect Dis. 2017;56:14-20.
23. Schaaf HS, Gie RP, Kennedy M, Beyers N, Hesseling PB, Donald PR. Evaluation of young children in contact with adult multidrug-resistant pulmonary tuberculosis: a 30-month follow-up. Pediatrics. 2002;109(5):765-71.
24. Denholm JT, Leslie DE, Jenkin GA, Darby J, Johnson PD, Graham SM, et al. Long-term follow-up of contacts exposed to multidrug-resistant tuberculosis in Victoria, Australia, 1995-2010. Int J Tuberc Lung Dis. 2012;16(10):1320-5.
25. Fox GJ, Anh NT, Nhung NV, Loi NT, Hoa NB, Ngoc Anh LT, et al. Latent tuberculous infection in household contacts of multidrug-resistant and newly diagnosed tuberculosis. Int J Tuberc Lung Dis. 2017;21(3):297-302.
26. The use of delamanid in the treatment of multidrug-resistant tuberculosis. Interim policy guidance. Geneva: World Health Organization; 2014 (http://apps.who.int/iris/bitstream/10665/137334/1/WHO_HTM_TB_2014.23_eng.pdf?ua=1, accessed 15 September 2017).
27. The use of bedaquiline in the treatment of multidrug-resistant tuberculosis Interim policy guidance. Geneva: World Health Organization; 2013 (http://apps.who.int/iris/bitstream/10665/84879/1/9789241505482_eng.pdf?ua=1, accessed 15 September 2017).
28. Weyer K, Dennis Falzon D, Jaramillo E, Zignol M, Mirzayev F, Raviglione M. Drug-resistant tuberculosis: what is the situation, what are the needs to roll it back. AMR control, 2017 (http://resistancecontrol.info/2017/drug-resistant-tuberculosis-what-is-the-situation-what-are-the-needs-to-roll-it-back-2/, accessed 15 September 2017).
29. Frick M. 2016 Report on tuberculosis research funding trends, 2005-2015: no time to lose. New York, NY: Treatment Action Group; 2016 (http://www.treatmentactiongroup.org/sites/default/files/TB_FUNDING_2016_WEB.pdf, accessed 23 August 2017).
30. World Health Organization. Antibacterial agents in clinical development: analysis of the clinical development pipeline against priority pathogens and Mycobacterium tuberculosis. Geneva: World Health Organization; 2017.
31. Global Alliance for Tuberculosis Drug Development. Our pipeline. TB Alliance (http://w.pdpaccess.org/pipeline/pipeline.php, accessed 23 August 2017).
32. Unitaid. Tuberculosis medicines technology and market landscape. 1st Edition. [Online] Geneva: World Health Organization; 2013 (https://unitaid.eu/assets/UNITAID-TB_Medicines_Landscape-1st_edition.pdf, accessed 23 August 2017).
33. de Kraker ME, Davey PG, Grundmann H. Mortality and hospital stay associated with resistant Staphylococcus aureus and Escherichia coli bacteremia: estimating the burden of antibiotic resistance in Europe. PLoS Med. 2011;8(10):e1001104.
34. Stewardson AJ, Allignol A, Beyersmann J, Graves N, Schumacher M, Meyer R, et al. The health and economic burden of bloodstream infections caused by antimicrobial-susceptible and non-susceptible Enterobacteriaceae and Staphylococcus aureus in European hospitals, 2010 and 2011: a multicentre retrospective cohort study. Euro Surveill. 2016;21(33).
35. Kostyanev T, Bonten MJ, O'Brien S, Steel H, Ross S, Francois B, et al. The Innovative Medicines Initiative's New Drugs for Bad Bugs programme: European public-private partnerships for the development of new strategies to tackle antibiotic resistance. J Antimicrob Chemother. 2016;71(2):290-5.
36. Centre for Disease Dynamics Economics & Policy. State of the world’s antibiotics. Washington, DC: CDDEP; 2015 (http://cddep.org/sites/default/files/swa_2015_final.pdf, accessed 23 August 2017).
37. Weiner LM, Webb AK, Limbago B, Dudeck MA, Patel J, Kallen AJ, et al. Antimicrobial- resistant pathogens associated with healthcare-associated infections: summary of data reported to the National Healthcare Safety Network at the Centers for Disease Control and Prevention, 2011-2014. Infect Control Hosp Epidemiol. 2016;37(11):1288-301.
38. Weist K, Hogberg LD. ECDC publishes 2015 surveillance data on antimicrobial resistance and antimicrobial consumption in Europe. Euro Surveill. 2016;21(46).
39. World Health Organization. Antimicrobial resistance: global report on surveillance 2014 Geneva: World Health Organization; 2014 (http://apps.who.int/iris/bitstream/10665/112642/1/9789241564748_eng.pdf?ua=1, accessed 23 August 2017).
85
40. Woolhouse M, Waugh C, Perry MR, Nair H. Global disease burden due to antibiotic resistance - state of the evidence. J Glob Health. 2016;6(1):010306.
41. Centers for Disease Control and Prevention. Antibiotic resistance threats in the United States 2013 (www.cdc.gov/drugresistance/threat-report-2013/, accessed 23 August 2017).
42. European Centre for Disease Control and Prevention, European Medicines Agency. ECDC/EMEA Joint Technical Report. The bacterial challenge: time to react. Stockholm: European Centre for Disease Control and Prevention; 2009. (http://ecdc.europa.eu/en/publications/Publications/0909_TER_The_Bacterial_Challenge_Time_to_React.pdf, accessed 23 August 2017).
43. Pumart P, Phodha T, Thamlikitkul V, Riewpaiboon A, Prakongsai P, Limwattananon S. Health and economic impacts of antimicrobial resistance in Thailand. J Health Systems Res. 2012;6(3):352-60.
44. Laxminarayan R, Matsoso P, Pant S, Brower C, Rottingen JA, Klugman K, et al. Access to effective antimicrobials: a worldwide challenge. Lancet. 2016;387(10014):168-75.
45. Teillant A, Gandra S, Barter D, Morgan DJ, Laxminarayan R. Potential burden of antibiotic resistance on surgery and cancer chemotherapy antibiotic prophylaxis in the USA: a literature review and modelling study. Lancet Infect Dis. 2015;15(12):1429-37.
46. O´Neill J. Tackling drug-resistant infections globally: final report and recommendations. Review on antimicrobial resistance, 2016 (https://amr-review.org/Publications.html, accessed 23 August 2017).
47. de Kraker ME, Stewardson AJ, Harbarth S. Will 10 Million people die a year due to antimicrobial resistance by 2050? PLoS Med. 2016;13(11):e1002184.
48. Luepke KH, Suda KJ, Boucher H, Russo RL, Bonney MW, Hunt TD, et al. Past, present, and future of antibacterial economics: increasing bacterial resistance, limited antibiotic pipeline, and societal implications. Pharmacotherapy. 2017;37(1):71-84.
49. European Centre for Disease Prevention and Control. Technical report: Best practices in ranking emerging infectious disease threats. A literature review. Stockholm: ECDC; 2015. (https://ecdc.europa.eu/sites/portal/files/media/en/publications/Publications/emerging-infectious-disease-threats-best-practices-ranking.pdf, accessed 23 August 2017).
50. Garner MJ, Carson C, Lingohr EJ, Fazil A, Edge VL, Trumble Waddell J. An assessment of antimicrobial resistant disease threats in Canada. PLoS One. 2015;10(4):e0125155.
51. Economopoulou A, Kinross P, Domanovic D, Coulombier D. Infectious diseases prioritisation for event-based surveillance at the European Union level for the 2012 Olympic and Paralympic Games. Euro Surveill. 2014;19(15).
52. Dahl V, Tegnell A, Wallensten A. Communicable diseases prioritized according to their public health relevance, Sweden, 2013. PLoS One. 2015;10(9):e0136353.
53. Balabanova Y, Gilsdorf A, Buda S, Burger R, Eckmanns T, Gartner B, et al. Communicable diseases prioritized for surveillance and epidemiological research: results of a standardized prioritization procedure in Germany, 2011. PLoS One. 2011;6(10):e25691.
54. Ciotti M. Establishing a list of priority diseases for the countries of the Dubrovnik pledge. In: The Dubrovnik pledge on surveillance and priotrization of infectious diseases. Report on a WHO Meeting. Bucharest, Romania, 21-23 November 2002. Copenhagen: WHO Regional Office for Europe; 2003 (http://www.euro.who.int/__data/assets/pdf_file/0005/128039/E78888.pdf, accessed 23 August 2017).
55. Horby P, Rushdy A, Graham C, O'Mahony M. PHLS overview of communicable diseases 1999. Commun Dis Public Health. 2001;4(1):8-17.
56. Thokala P, Devlin N, Marsh K, Baltussen R, Boysen M, Kalo Z, et al. Multiple criteria decision analysis for health care decision making--an introduction: report 1 of the ISPOR MCDA Emerging Good Practices Task Force. Value Health. 2016;19(1):1-13.
57. Marsh K, Lanitis T, Neasham D, Orfanos P, Caro J. Assessing the value of healthcare interventions using multi-criteria decision analysis: a review of the literature. Pharmacoeconomics. 2014;32(4):345-65.
58. Cromwell I, Peacock SJ, Mitton C. "Real-world" health care priority setting using explicit decision criteria: a systematic review of the literature. BMC Health Serv Res. 2015;15:164.
59. Marsh K, IJzerman M, Thokala P, Baltussen R, Boysen M, Kalo Z, et al. Multiple criteria decision analysis for health care decision making--emerging good practices: report 2 of the ISPOR MCDA Emerging Good Practices Task Force. Value Health. 2016;19(2):125-37.

86
60. Weistroffer HR, Li Y. Multiple criteria decision analysis software. In: Greco S, Ehrgott M, Figueira JR, editors. Multiple criteria decision analysis: state of the art surveys. New York, NY: Springer New York; 2016:1301-41.
61. Hansen P, Ombler F. A new method for scoring additive multi-attribute value models using pairwise rankings of alternatives. Journal of Multi-Criteria Decision Analysis. 2008;15(3-4):87-107.
62. Golan O, Hansen P, Kaplan G, Tal O. Health technology prioritization: which criteria for prioritizing new technologies and what are their relative weights? Health Policy. 2011;102(2-3):126-35.
63. Hansen P, Hendry A, Naden R, Ombler F, Stewart R. A new process for creating points systems for prioritising patients for elective health services. Clinical Governance: An International Journal. 2012;17(3):200-9.
64. Fitzgerald A, de Coster C, McMillan S, Naden R, Armstrong F, Barber A, et al. Relative urgency for referral from primary care to rheumatologists: the Priority Referral Score. Arthritis Care Res (Hoboken). 2011;63(2):231-9.
65. Aletaha D, Neogi T, Silman AJ, Funovits J, Felson DT, Bingham CO, 3rd, et al. 2010 rheumatoid arthritis classification criteria: an American College of Rheumatology/European League Against Rheumatism collaborative initiative. Ann Rheum Dis. 2010;69(9):1580-8.
66. van den Hoogen F, Khanna D, Fransen J, Johnson SR, Baron M, Tyndall A, et al. 2013 classification criteria for systemic sclerosis: an American college of rheumatology/European league against rheumatism collaborative initiative. Ann Rheum Dis. 2013;72(11):1747-55.
67. Taylor WJ, Brown M, Aati O, Weatherall M, Dalbeth N. Do patient preferences for core outcome domains for chronic gout studies support the validity of composite response criteria? Arthritis Care Res (Hoboken). 2013;65(8):1259-64.
68. Dobson F, Hinman RS, Roos EM, Abbott JH, Stratford P, Davis AM, et al. OARSI recommended performance-based tests to assess physical function in people diagnosed with hip or knee osteoarthritis. Osteoarthritis Cartilage. 2013;21(8):1042-52.
69. World Health Organization. Report on the Immunization and Vaccines Related Implementation Research (IVIR) Advisory Committee Meeting Geneva, 26-28 June 20132014. (http://apps.who.int/iris/bitstream/10665/112457/1/WHO_IVB_14.02_eng.pdf, accessed 23 August 2017).
70. Ang TL, Fock KM. Clinical epidemiology of gastric cancer. Singapore Med J. 2014;55(12):621-8.
71. Ao TT, Feasey NA, Gordon MA, Keddy KH, Angulo FJ, Crump JA. Global burden of invasive nontyphoidal Salmonella disease, 2010(1). Emerg Infect Dis. 2015;21(6).
72. Cosgrove SE, Qi Y, Kaye KS, Harbarth S, Karchmer AW, Carmeli Y. The impact of methicillin resistance in Staphylococcus aureus bacteremia on patient outcomes: mortality, length of stay, and hospital charges. Infect Control Hosp Epidemiol. 2005;26(2):166-74.
73. GBD Diarrhoeal Diseases Collaborators. Estimates of global, regional, and national morbidity, mortality, and aetiologies of diarrhoeal diseases: a systematic analysis for the Global Burden of Disease Study 2015. Lancet Infect Dis. 2017 Jun 1.
74. Eskola J, Kayhty H, Takala AK, Peltola H, Ronnberg PR, Kela E, et al. A randomized, prospective field trial of a conjugate vaccine in the protection of infants and young children against invasive Haemophilus influenzae type b disease. N Engl J Med. 1990;323(20):1381-7.
75. Gaunt PN, Piddock LJ. Ciprofloxacin resistant Campylobacter spp. in humans: an epidemiological and laboratory study. J Antimicrob Chemother. 1996;37(4):747-57.
76. Gniadek TJ, Carroll KC, Simner PJ. Carbapenem-resistant non-glucose-fermenting gram-negative bacilli: the missing piece to the puzzle . J Clin Microbiol. 2016;54(7):1700-10.
77. Kariuki S, Gordon MA, Feasey N, Parry CM. Antimicrobial resistance and management of invasive Salmonella disease. Vaccine. 2015;33 Suppl 3:C21-9.
78. Klontz KC, Singh N. Treatment of drug-resistant Shigella infections. Expert Rev Anti Infect Ther. 2015;13(1):69-80.
79. Kotloff KL, Winickoff JP, Ivanoff B, Clemens JD, Swerdlow DL, Sansonetti PJ, et al. Global burden of Shigella infections: implications for vaccine development and implementation of control strategies. Bull World Health Organ. 1999;77(8):651-66.
80. Kotloff KL, Nataro JP, Blackwelder WC, Nasrin D, Farag TH, Panchalingam S, et al. Burden and aetiology of diarrhoeal disease in infants and young children in developing countries (the Global Enteric Multicenter Study, GEMS): a prospective, case-control study. Lancet. 2013;382(9888):209-22.
87
81. Logan LK, Weinstein RA. The epidemiology of carbapenem-resistant Enterobacteriaceae: the Impact and evolution of a global menace. J Infect Dis. 2017;215(suppl_1):S28-S36.
82. Magill SS, Edwards JR, Bamberg W, Beldavs ZG, Dumyati G, Kainer MA, et al. Multistate point-prevalence survey of health care-associated infections. N Engl J Med. 2014;370(13):1198-208.
83. GBD 2013 Mortality and Causes of Death Collaborators. Global, regional, and national age-sex specific all-cause and cause-specific mortality for 240 causes of death, 1990-2013: a systematic analysis for the Global Burden of Disease Study 2013. Lancet. 2015;385(9963):117-71.
84. Richards AM, Abu Kwaik Y, Lamont RJ. Code blue: Acinetobacter baumannii, a nosocomial pathogen with a role in the oral cavity. Mol Oral Microbiol. 2015;30(1):2-15.
85. Tsang RSW, Shuel M, Whyte K, Hoang L, Tyrrell G, Horsman G, et al. Antibiotic susceptibility and molecular analysis of invasive Haemophilus influenzae in Canada, 2007 to 2014. J Antimicrob Chemother. 2017;72(5):1314-9.
86. Unemo M. Current and future antimicrobial treatment of gonorrhoea - the rapidly evolving Neisseria gonorrhoeae continues to challenge. BMC Infect Dis. 2015;15:364.
87. Wain J, Hendriksen RS, Mikoleit ML, Keddy KH, Ochiai RL. Typhoid fever. Lancet. 2015;385(9973):1136-45.
88. Wenger JD, Hightower AW, Facklam RR, Gaventa S, Broome CV. Bacterial meningitis in the United States, 1986: report of a multistate surveillance study. The Bacterial Meningitis Study Group. J Infect Dis. 1990;162(6):1316-23.
89. World Health Organization. WHO guidelines for the treatment of Neisseria gonorrhoaeae Geneva: World Health Organization; 2016 (http://apps.who.int/iris/bitstream/10665/246114/1/9789241549691-eng.pdf?ua=1, accessed 23 August 2017).
90. Woerther PL, Burdet C, Chachaty E, Andremont A. Trends in human fecal carriage of extended-spectrum beta-lactamases in the community: toward the globalization of CTX-M. Clin Microbiol Rev. 2013;26(4):744-58.
91. Antillon M, Warren JL, Crawford FW, Weinberger DM, Kurum E, Pak GD, et al. The burden of typhoid fever in low- and middle-income countries: A meta-regression approach. PLoS Negl Trop Dis. 2017;11(2):e0005376.
92. Palavecino E. Community-acquired methicillin-resistant Staphylococcus aureus infections. Clin Lab Med. 2004;24(2):403-18.
93. World Health Organization, Food and Agriculture Organization of the United Nations, World Organisation for Animal Health. The global view of campylobacteriosis: report of an expert consultation, Utrecht, Netherlands, 9-11 July 2012 Geneva: World Health Organization; 2013 (http://apps.who.int/iris/bitstream/10665/80751/1/9789241564601_eng.pdf, accessed 23 August 2017).
94. Cherkaoui A, Diene SM, Emonet S, Renzi G, Francois P, Schrenzel J. Ampicillin-resistant Haemophilus influenzae isolates in Geneva: serotype, antimicrobial susceptibility, and beta-lactam resistance mechanisms. Eur J Clin Microbiol Infect Dis. 2015;34(10):1937-45.
95. Zhang S, Sun X, Chang W, Dai Y, Ma X. Systematic review and meta-analysis of the epidemiology of vancomycin-intermediate and heterogeneous vancomycin-intermediate Staphylococcus aureus isolates. PLoS One. 2015;10(8):e0136082.
96. Pulcini C, Bush K, Craig WA, Frimodt-Moller N, Grayson ML, Mouton JW, et al. Forgotten antibiotics: an inventory in Europe, the United States, Canada, and Australia. Clin Infect Dis. 2012;54(2):268-74.
97. Guyatt GH, Oxman AD, Vist GE, Kunz R, Falck-Ytter Y, Alonso-Coello P, et al. GRADE: an emerging consensus on rating quality of evidence and strength of recommendations. BMJ. 2008;336(7650):924-6.
98. A data table from the Pew Charitable Trusts. Antibiotics currently in clinical development. May 2017 (www.pewtrusts.org/~/media/assets/2017/05/antibiotics-currently-in-clinical-development-03-2017.pdf?la=en, accessed 15 September 2017).

88
World Health Organization
Department of Essential Medicines and Health Products
Innovation, Access and Use
20 Avenue Appia
1211 Geneva 27
Switzerland
http://www.who.int/medicines/en/
Copyright © 2022 FDOKUMEN