Improving CVSS-based vulnerability prioritization and response with context information
10
Improving CVSS-based vulnerability prioritization and response with context information Christian Frühwirth BIT Research Center Helsinki University of Technology Otaniementie 17, Espoo, Finland [email protected] Tomi Männistö Software Business and Engineering Institute Helsinki University of Technology Innopoli 2, Tekniikantie 14, Espoo, Finland [email protected] Abstract The growing number of software security vulnerabilities is an ever-increasing challenge for organizations. As security managers in the industry have to operate within limited budgets they also have to prioritize their vulnerability responses. The Common Vulnerability Scoring System (CVSS) aids in such prioritization by providing a metric for the severity of vulnerabilities. In its most prominent application, as the severity metric in the U.S. National Vulnerability Database (NVD), CVSS scores omit information pertaining the potential exploit victims’ context. Researchers and managers in the industry have long understood that the severity of vulnerabilities varies greatly among different organizational contexts. Therefore the CVSS scores provided by the NVD alone are of limited use for vulnerability prioritization in practice. Security managers could address this limitation by adding the missing context information themselves to improve the quality of their CVSS-based vulnerability prioritization. It is unclear for them, however, whether the potential improvements are worth the additional effort. We present a method that enables practitioners to estimate these improvements. Our method is of particular use to practitioners who do not have the resources to gather large amounts of empirical data, because it allows them to simulate the improvement potential using only publicly available data in the NVD and distribution models from the literature. We applied the method on a sample set of 720 vulnerability announcements from the NVD and found that adding context information significantly improved the prioritization and selection of vulnerability response process. Our findings contribute to the discourse on returns on security investment, measurement of security processes and quantitative security management. 1. Introduction Analyzing and resolving software security vulnerabilities are core tasks of security incident management, one of the most complex activities in organizational security management [7]. Resolving vulnerabilities is also labor intensive and thus a significant cost factor for IT departments world wide. Security vulnerabilities in software can originate from a variety of problems, such as errors in design, misconfigured systems, or defects, commonly known as bugs. Research found that between 1 to 5 % of software bugs are also security risks [2]. The problem of software vulnerabilities is growing and according to records of the U.S. National Vulnerability Database (NVD) [24], as of October 2008, almost 20 new software vulnerabilities are being published every day [9]. By July 2009, the number of software vulnerability records in the NVD had grown to over 37,000 [24]. The actions that are necessary to resolve certain vulnerabilities are called vulnerability response processes and described in an organization's security management policy. Today, all larger companies that comply with the Sarbanes-Oxley (SOX) legislation apply IT service management frameworks, such as the IT Infrastructure Library (ITIL) [17][20] or COBIT [5][11][26], and thus have to have vulnerability response processes in place. Security managers who live with limited budgets are challenged to balance their companies' need for security with the available resources to ensure that vulnerabilities are resolved in an efficient manner. Aside from other issues, this means that each vulnerability should be addressed by a response process that is appropriate to its severity and that more severe vulnerabilities should be prioritized over less severe ones. The inner workings of the actual vulnerability response activities lie outside the scope of this paper. We encourage the reader to refer to standards like the Third International Symposium on Empirical Software Engineering and Measurement 978-1-4244-4841-8/09/$25.00 ©2009 IEEE 535
-
Upload
independent -
Category
Documents
-
view
1 -
download
0
Transcript of Improving CVSS-based vulnerability prioritization and response with context information
Improving CVSS-based vulnerability prioritization and response with context information
Christian Frühwirth BIT Research Center
Helsinki University of Technology Otaniementie 17, Espoo, Finland
Tomi Männistö Software Business and Engineering Institute
Helsinki University of Technology Innopoli 2, Tekniikantie 14, Espoo, Finland
Abstract
The growing number of software security vulnerabilities is an ever-increasing challenge for organizations. As security managers in the industry have to operate within limited budgets they also have to prioritize their vulnerability responses. The Common Vulnerability Scoring System (CVSS) aids in such prioritization by providing a metric for the severity of vulnerabilities. In its most prominent application, as the severity metric in the U.S. National Vulnerability Database (NVD), CVSS scores omit information pertaining the potential exploit victims’ context. Researchers and managers in the industry have long understood that the severity of vulnerabilities varies greatly among different organizational contexts. Therefore the CVSS scores provided by the NVD alone are of limited use for vulnerability prioritization in practice. Security managers could address this limitation by adding the missing context information themselves to improve the quality of their CVSS-based vulnerability prioritization. It is unclear for them, however, whether the potential improvements are worth the additional effort. We present a method that enables practitioners to estimate these improvements. Our method is of particular use to practitioners who do not have the resources to gather large amounts of empirical data, because it allows them to simulate the improvement potential using only publicly available data in the NVD and distribution models from the literature. We applied the method on a sample set of 720 vulnerability announcements from the NVD and found that adding context information significantly improved the prioritization and selection of vulnerability response process. Our findings contribute to the discourse on returns on security investment, measurement of security processes and quantitative security management.
1. Introduction
Analyzing and resolving software security vulnerabilities are core tasks of security incident management, one of the most complex activities in organizational security management [7]. Resolving vulnerabilities is also labor intensive and thus a significant cost factor for IT departments world wide.
Security vulnerabilities in software can originate from a variety of problems, such as errors in design, misconfigured systems, or defects, commonly known as bugs. Research found that between 1 to 5 % of software bugs are also security risks [2]. The problem of software vulnerabilities is growing and according to records of the U.S. National Vulnerability Database (NVD) [24], as of October 2008, almost 20 new software vulnerabilities are being published every day [9]. By July 2009, the number of software vulnerability records in the NVD had grown to over 37,000 [24].
The actions that are necessary to resolve certain vulnerabilities are called vulnerability response processes and described in an organization's security management policy. Today, all larger companies that comply with the Sarbanes-Oxley (SOX) legislation apply IT service management frameworks, such as the IT Infrastructure Library (ITIL) [17][20] or COBIT [5][11][26], and thus have to have vulnerability response processes in place.
Security managers who live with limited budgets are challenged to balance their companies' need for security with the available resources to ensure that vulnerabilities are resolved in an efficient manner. Aside from other issues, this means that each vulnerability should be addressed by a response process that is appropriate to its severity and that more severe vulnerabilities should be prioritized over less severe ones.
The inner workings of the actual vulnerability response activities lie outside the scope of this paper. We encourage the reader to refer to standards like the
Third International Symposium on Empirical Software Engineering and Measurement
978-1-4244-4841-8/09/$25.00 ©2009 IEEE 535
ITIL[17][20] or ISO/17999 for more details on that matter [5][19]. For the purpose of this work it shall be sufficient to note that vulnerability response processes can differ among characteristics like response time, involved roles, impact on or disruption of production operations and ultimately total costs. We define the total costs of a vulnerability response process as the sum of its direct costs (employed human resources, license fees, etc.) and indirect costs (productivity losses, interruption of production processes due to unscheduled reboots after patching, etc.)
Choosing an efficient process means to choose one which resolves the targeted vulnerability in a timely manner while generating the lowest total costs compared to alternative solutions. 1.1. CVSS
The Common Vulnerability Scoring System (CVSS) was introduced by the National Infrastructure Advisory Council (NIAC) and is now managed by the Forum of Incident Response and Security Teams (FIRST). CVSS aids security managers in the prioritization of vulnerabilities by providing a metric for their relative severity [22]. CVSS assigns each vulnerability a value, or “score” on a scale of 0 to 10 where higher values indicate greater severity. CVSS was designed as an open framework, consisting of three different metric groups: 1.) the “Base Metric”, which describes the general characteristics of vulnerabilities 2.) the optional “Temporal Metric”, which represents changes in the severity over time and 3.) the optional “Environmental Metric”, which introduces context information that is unique to a particular user, organization or business environment. The base metric can either be used alone or in combination with the other two optional metrics. A full description of all the information used to calculate CVSS scores is available in [22]. Details that are relevant for the scope of this work will be laid out in section 4.4. and pictured in Figure 1.
2. Problem description
Where CVSS is employed in its most basic form, using only the input defined in the “Base Metric”, the scoring omits all information about a vulnerability’s context and will thus output the same severity scores regardless of the characteristics of the affected organization. Authors like Rieke [26] acknowledge that problem and advise that “prioritizing of vulnerabilities based on such measures should be used with caution” [26].
Empirical research has also shown that the actual impact of security incidents varies significantly among different types of organizations, businesses and users [18][30]. Since different organizations perceive the severity of a particular vulnerability differently they also prioritize its mitigation differently [21]. CVSS can account for these differences to a certain extent if the temporal- and environmental metric groups are applied in the scoring process together with the base metric. Therefore we argue that by using the two optional metrics, the quality of the scores can be improved because they better reflect the actual impact of a vulnerability in a particular organization’s environment. Higher quality scores can in turn be used to improve the prioritization of vulnerabilities from a security management perspective. 2.1. Need
CVSS’s most prominent application is its use in the National Vulnerability Database (NVD) of the National Institute of Standards and Technology (NIST). The NVD is a public directory of software vulnerabilities and serves as one of the standard data-sources for security management applications. The NVD employs the CVSS Base-Metric as a severity indicator for all recorded vulnerabilities. The two context aware CVSS metrics (Environmental- and Temporal), however, are omitted. Since the Base-Metric is unaware of an organization’s context, the NVD scoring alone is of limited use for vulnerability prioritization in practice [26].
A practical example for this discrepancy between scored- and actual severity could be a denial-of-service (DoS) vulnerability: The NVD entry “CVE-2009-0609” describes such a vulnerability in the Sun Java System Directory Server that received a base score of 7.8 points. This score may render it “important”, but not “critical” in the minds of most security managers. If the affected company’s business, however, has a high availability requirement (which is endangered by a DoS attack) for the directory server and vulnerability exploits are already available to the hacker community, the vulnerability suddenly becomes of “critical” importance to the business. In this case, the information about the existence of an exploit and the high availability requirement of the affected server is context information that improves the vulnerability prioritization. If such information is applied at the time of the score’s calculation in the CVSS environmental and temporal metric-group, the output score would increase from 7.8 to 10, and thus be closer to the real world severity of the vulnerability.
Third International Symposium on Empirical Software Engineering and Measurement
978-1-4244-4841-8/09/$25.00 ©2009 IEEE 536

In practice, severity scores are further used to categorize vulnerabilities in classes [21]. Vulnerabilities with scores of, for example, more than 9 can be classified as “critical” while scores of less than 4 are considered “low”. The class of a vulnerability then determines how and when a certain response process is triggered within the organization to resolve it.
Even though vulnerabilities of different severity classes can often be resolved using the same methods, e.g., automated patch-distribution systems, the total execution costs of the individual response processes still vary. A response to critical vulnerabilities, for example, needs faster response times and may require unscheduled reboots of critical systems that affect the organization’s productivity. Additional indirect costs can occur when critical patches with potential side effects on other systems have to be rolled-out without prior testing. Lower priority response processes can avoid these problems and the associated costs by resolving vulnerabilities during regularly scheduled system maintenance windows and using system test environments.
Triggering a “critical” response process to resolve a “low” vulnerability thus creates unnecessary costs. Hence, improving the quality of vulnerability classification has a direct impact on the cost-effectiveness of its response process.
Even though adding contextual information has the up side of improving the quality of vulnerability prioritization and classification, the down side lies with the additional effort that is necessary for acquiring the context information. For instance, security managers would have to determine the availability of exploits or patches for every vulnerability, or purchase that information from 3rd parties.
Because it is unclear for them whether the potential improvements are worth the additional effort, managers hesitate to invest in improving the scoring mechanisms of vulnerabilities. The ability to estimate these improvements prior to the investment could thus encourage more managers to engage in scoring improvement activities.
In this work we present such a method that aims at enabling managers to estimate the effects of additional context information on vulnerability scores using only input data that is available at no additional costs to the organization and at the time of the investment decision.
We use real-world vulnerability announcements gathered from the NVD in combination with empirical models from the literature as input for our method. The questions we seek to answer with the method are:
1. How does the use of context information change the value of CVSS scores on a larger scale?
2. What is the impact of these score changes on the prioritization of vulnerabilities and the selection of vulnerability response processes?
In the presented method we compare the NVD’s CVSS Base-scores with context-enriched scores that apply CVSS’s additional Temporal- and Environmental-Metric. Our results exemplify the potential improvements in an organization. The presented methodology enables security managers to make informed decisions on whether investing in improved vulnerability prioritization in their organization is worth the costs.
The remainder of this work is structured as follows: Section 3 analyzes related work on the issue, Section 4 introduces the methodology, Section 5 describes the results and Section 6 presents the conclusions.
3. Related work The issue of vulnerability prioritization has been actively discussed in the literature and the need for vulnerability prioritization in organizations is widely recognized [9][12][21][27]. This work uses the notion that organizations should prioritize their remediation efforts based on the value of their assets and the severity of the vulnerability [12]. The literature further supports the concept that every organization evaluates vulnerabilities differently, based on their individual context [9][12][21][27] and that vulnerability metrics should account for these context differences. Chen[9] describes this challenge as moving from value-neutral to value-based metrics. More research has found that companies also experience the occurrence of vulnerabilities differently. Ishiguro et al. [18] and Telang et al. [30] empirically showed that the impact of security vulnerabilities or incidents varies with a company’s context. The estimation of this impact influences the ability to determine the return on security investment (ROSI). Researchers have addressed that estimation problem from technological, organizational and economical perspectives [6] [15]. In the scope of our work, we will be mostly concerned with the latter. Al-Humaigani et al. [1], Cavusoglu et al. [8], Sonnenreich [28], and Neubauer et al. [23] investigated the issue of security investments from a quantitative perspective and found that one of the major issues is the determination of the indirect costs induced by security problems [3][4]. Given these problems in measuring the costs and severity of vulnerabilities in absolute terms, the usage of relative metrics is a practical alternative. The Common Vulnerability Scoring System (CVSS) [22] provides such relative metrics. CVSS is further
Third International Symposium on Empirical Software Engineering and Measurement
978-1-4244-4841-8/09/$25.00 ©2009 IEEE 537
recommended by the National Institute of Standards and Technology (NIST) and used in NIST’s National Vulnerability Database [24] as well as by numerous authors [9][12] [21].
Our work stands in line with other research in this area of security management that tries to investigate the possibilities of context and value based security measurement [9][23][29].. 4. Methodology
The goal of this work was to create a method as an artifact that can be used by practitioners to estimate the vulnerability response improvements they can achieve within their organization’s information systems by investing in better vulnerability scoring. Hevner et al [16] has described a comprehensive framework for creating such artifacts in information systems’ research, the “Design Science Approach”. We follow the steps laid out by Hevner in designing, evaluating and communicating our research. For the evaluation of the method in particular, we chose Hevner’s suggestion [16] of using a simulation and executed the developed method with artificial data. 4.1. Assumptions
The method is designed to analyze possible efficiency improvements in security vulnerability prioritization and response process selection in an organization. We assume that the organization in question has an established IT security policy and documented vulnerability response processes in place. We further assume that the organization knows the costs of their security operations (for example, through internal accounting practices, payroll or other means). By knowing the costs of their IT security and having documented processes, the organization is also able to determine the costs of an execution of a vulnerability response process instance. 4.1. Scenarios In order to make an investment decision, one has to compare different investment alternatives. For our work, this means comparing the baseline of context insensitive vulnerability scoring with improved, context-aware vulnerability scoring. The method is based on comparing these two alternatives by simulating the vulnerability scoring in two corresponding scenarios.
The first scenario gives an example of vulnerability prioritization in an organization that is based on the CVSS base scores provided by the NVD. The second
scenario improves upon the first by introducing additional context-aware metrics to the scoring.
Scenario Setting A: A company uses CVSS based software vulnerability scores to prioritize the vulnerability patching activities of affected systems. The NVD is the main source of software vulnerabilities announcement. Staff members review the vulnerability announcements on a daily basis. Security managers use the NVD’s CVSS Base-scores to prioritize the vulnerabilities and select the corresponding response processes based on the vulnerabilities’ classification. Vulnerabilities are classified in four different severity-categories. Scores below 5 are classified as ‘Low’, greater or equal than 5: ‘Medium’, ≥7: ‘High‘ and ≥9: ‘Critical’. The vulnerability response processes vary in their response time, the involved organizational roles and their total costs. Vulnerabilities which are classified as ‘critical’ are addressed immediately by members of the security staff. They are resolved using quick-response processes that can require the interruption of production processes or render the affected systems temporarily unavailable outside scheduled maintenance windows (e.g., due to unscheduled reboots of database systems during weekday working hours).
Lower vulnerability classes are delegated to the helpdesk staff and are resolved in bulk during scheduled maintenance and without interrupting production processes. In total, all vulnerabilities are addressed by at least one instance of a response process, and no vulnerabilities are left unattended.
Scenario Setting B: is the same as Scenario A, except that CVSS base scores are not accepted ‘as is’ from the NVD. Instead, security managers re-calculate the scores, using the additional context information specified in the CVSS Environmental and Temporal Metric groups[22]:
Third International Symposium on Empirical Software Engineering and Measurement
978-1-4244-4841-8/09/$25.00 ©2009 IEEE 538
- Exploitability of the vulnerability: [Unproven, Proof-of-Concept, Functional or High]
- Remediation Level: [Official Fix, Temporary Fix, Workaround or Unavailable]
- Confidentiality-, integrity- and availability requirement of the system which is affected by the vulnerability: [Low, Medium or High]
The re-calculation is performed using CVSS’s standard “Temporal-” and “Environmental Metric”, thus no alternations are made in the scoring method itself.. 4.3. Data The input data for the presented method is defined by the data points needed to calculate the Base-, Temporal-, and Environmental-score according to the CVSS specification [22]. The data is used to calculate and subsequently compare the vulnerabilities’ Base-scores in scenario A with the Temporal- and Environmental scores in scenario B.
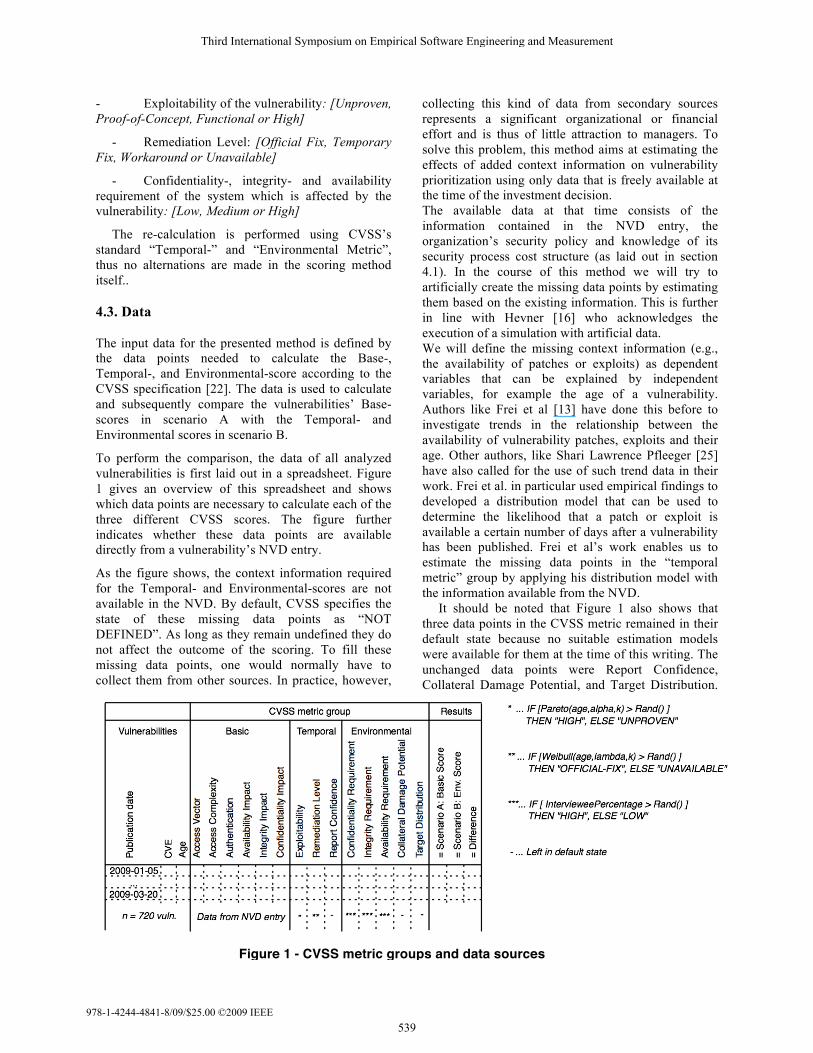
To perform the comparison, the data of all analyzed vulnerabilities is first laid out in a spreadsheet. Figure 1 gives an overview of this spreadsheet and shows which data points are necessary to calculate each of the three different CVSS scores. The figure further indicates whether these data points are available directly from a vulnerability’s NVD entry.
As the figure shows, the context information required for the Temporal- and Environmental-scores are not available in the NVD. By default, CVSS specifies the state of these missing data points as “NOT DEFINED”. As long as they remain undefined they do not affect the outcome of the scoring. To fill these missing data points, one would normally have to collect them from other sources. In practice, however,
collecting this kind of data from secondary sources represents a significant organizational or financial effort and is thus of little attraction to managers. To solve this problem, this method aims at estimating the effects of added context information on vulnerability prioritization using only data that is freely available at the time of the investment decision. The available data at that time consists of the information contained in the NVD entry, the organization’s security policy and knowledge of its security process cost structure (as laid out in section 4.1). In the course of this method we will try to artificially create the missing data points by estimating them based on the existing information. This is further in line with Hevner [16] who acknowledges the execution of a simulation with artificial data. We will define the missing context information (e.g., the availability of patches or exploits) as dependent variables that can be explained by independent variables, for example the age of a vulnerability. Authors like Frei et al [13] have done this before to investigate trends in the relationship between the availability of vulnerability patches, exploits and their age. Other authors, like Shari Lawrence Pfleeger [25] have also called for the use of such trend data in their work. Frei et al. in particular used empirical findings to developed a distribution model that can be used to determine the likelihood that a patch or exploit is available a certain number of days after a vulnerability has been published. Frei et al’s work enables us to estimate the missing data points in the “temporal metric” group by applying his distribution model with the information available from the NVD.
It should be noted that Figure 1 also shows that three data points in the CVSS metric remained in their default state because no suitable estimation models were available for them at the time of this writing. The unchanged data points were Report Confidence, Collateral Damage Potential, and Target Distribution.
Figure 1 - CVSS metric groups and data sources
Third International Symposium on Empirical Software Engineering and Measurement
978-1-4244-4841-8/09/$25.00 ©2009 IEEE 539
Because CVSS specifies the default state of these data points as “Not defined”, their omission does not affect the outcome of the scoring.
4.3.1. Temporal Metrics. Frei et al. [13] used the age of a vulnerability announcement as an independent variable and found that the likelihood of the availability of a patch- and exploit for the vulnerability follows the form of a Weibull- and Pareto distribution function. Frei et al. further determined the distribution function’s parameters based on an empirical analysis of 14,000 vulnerabilities [13]. The age of a vulnerability is calculated by counting the days between the date of its first disclosure and the date the CVSS scoring is conducted (e.g. ‘Today’). Exploitability: Figure 1 shows how we can use the result of Frei’s model [13] to fill the missing data in the temporal score section of each analyzed vulnerability in the spreadsheet. The likelihood that an exploit is available for the given vulnerability is calculated using a Frei’s Pareto distribution [13] of the form:
a = 0.26, k = 0.00161
x denotes the age of a vulnerability. A random variable rand, with a value between 0 and 1, is generated and compared to the output of the Pareto function F(x). If the value of rand is less than or equal to F(x), the exploitability data point for this particular vulnerability is assigned to “HIGH”. In all other cases it was set to “UNPROVEN“. Remediation Level: Similar to the case above, the patch availability is calculated with Frei’s Weibull distribution [13]:
λ = 0.209, k = 4.04
If the value of rand was less than or equal to F(x), the remediation level was assigned to “OFFICIAL-PATCH”. In all other cases it was set to “UNAVAILABLE”. 4.3.2. Environmental Metrics. Security Requirements: The calculation of the CVSS environmental scores requires information about the confidentiality, integrity and availability requirements for each system that is affected by a vulnerability.
According to CVSS, these requirements need to specify the system’s need for high, medium (the default setting) or low confidentiality, integrity and availability. Ideally, this requirement data can be obtained from an organization’s security policy. In many cases, however, the security policy documentation only states high-level requirements, without specifying details for every single system in an organization. If these detailed requirements are not easily available, the necessary data points can be estimated, based either on the available guidelines in the security policy or a survey among the organization’s management team. To exemplify the latter we chose to base the requirements used in the example application of this method in section 5 on a series of interviews with 13 security managers of 9 different companies. The interviews had been conducted as part of related research in 2007 [14]. The interviewees were asked to prioritize three different security factors according to their importance in their company. CVSS already specified “MEDIUM” as the default requirement for each of the factors [22], thus we only counted the times an interviewee ranked a factor first or last in their prioritization to determine whether they had “HIGH” or “LOW” requirements for it. (This means that security factors that were neither prioritized first nor last by the interviewees would not change the default state of the data points in the spreadsheet, thus they could be omitted). The results of the interviews are presented in Table 1.
Table 1 - Security Requirements
The interviewees’ responses showed that in 11 out of 13 cases Availability was the top priority, thus there was an availability high requirement. This finding was in line with earlier research results in the literature [14]. High confidentiality was required in only 2 of 13 cases, however none of the respondents ranked it last either. Integrity requirements were ranked last by 8 out of 13 interviewees. The answers presented in Table 1 are used to determine the likelihood p that each of the data points confidentiality-, integrity- or availability-requirement of a vulnerability entry in the spreadsheet (Figure 1) is assigned a different requirement than the CVSS default (“Medium”). Using the example results shown in Table1, this means that, the chance of an availability-
Nr. of Interviewees who ranked the factor: Security
factor First (=High security
requirement) Last (=Low security
requirement) Confident. 2 (p = .15) 0
Integrity 0 8 (p = .62) Availability 11 (p = .85) 0
Third International Symposium on Empirical Software Engineering and Measurement
978-1-4244-4841-8/09/$25.00 ©2009 IEEE 540
requirement to be set to high was 85%, the chance of a low integrity requirement was 62% and the chance of a high confidentiality requirement was 15%. It has to be noted that this estimation does not consider the possibility that systems can have, for example, high confidentiality requirements but are still of relatively low overall importance to the organization. One way to address this issue would be to add an additional layer on top of the CVSS environmental metric to account for the relative importance of a system compared to others. This is however not part of the current CVSS 2.0 specification and shall thus remain outside the scope of this particular work.
4.4. Conducting the evaluation
Section 4.2 describes the two scenarios that are
evaluated and later compared in the presented method. To conduct the evaluation we collected a sample set of vulnerability announcements (vulnerability entries), in a specific time frame from the NVD. Even though both scenarios state that the organization reviews new vulnerability announcements on a daily basis, research by Eschelbeck [12] found that the half-life of critical vulnerabilities in organizations is up to 21 days. Thus we decided to collect at least a sample size of 3 times that half-life. In the example application presented in Section 5 we used 74 days of NVD data (720 vulnerability entries).
Once vulnerability entries are collected from the NVD, they are ordered by their publication date and fed into the spreadsheet depicted in Figure 1. For each vulnerability, the CVSS base score is calculated using the information provided by the NVD entry. The missing data points for the calculation of the temporal and environmental CVSS scores are then artificially generated as described in sections 4.3.1 and 4.3.2.
After the scores for every vulnerability in the spreadsheet have been calculated, the scenario results are analyzed and compared to quantify the improvements
4.5. Analysis Changes in vulnerability scores and prioritization: The addition of context information into the scoring process changes the score of a vulnerability and thus its ranking in a prioritization. We use the number of score changes as a metric of how much the prioritization is affected by the context information.
In particular, larger score changes of +2 or more indicate that a vulnerability has moved up in the prioritization and was thus previously undervalued. We
refer to such situations as the prevention of a false-negative. Score changes of -2 or more mean that a vulnerability was previously over-valued and would have attracted more attention than justified. Hence, we consider these score drops the prevention of a false-positive.
Vulnerability classifications: Vulnerabilities are categorized in severity-classes, according to their CVSS scores. In the simulation we used the following boundaries for the classification: Scores of <5 are classified as ‘Low’, <7: ‘Medium’, <9: ‘High‘ and ≥9: ‘Critical’. We measure changes in the number of vulnerabilities that are allocated to each of the classes.
Total costs of resolving vulnerabilities: A cost-factor is assigned to each vulnerability class. As already described in section 2.1, the factor represents the total costs created by an instance of a vulnerability response process that resolves a vulnerability of that particular class. In practice, managers can assign absolute, monetary values to the factors; for our example, however, it is sufficient to use relative values. We assume that the execution of a vulnerability response which resolves a “medium” class vulnerability creates costs of 1 unit. Respectively, lower class vulnerabilities create less and higher class ones more costs. We assigned the following example cost factors to the vulnerability classes: Low: 0.25, Medium: 1, High: 1.50, Critical: 3.00. To determine the total costs of resolving all vulnerabilities, the cost-factors are multiplied with the number of vulnerabilities in their corresponding class.
Savings potential: We compare the total costs of resolving all vulnerabilities in both simulation scenarios to determine the more efficient solution. The cost difference between the scenarios represents the potential savings that can be achieved through changes in the scoring mechanisms. The calculated savings are subsequently compared with the anticipated costs of improving the scoring mechanism.
5. Example method application and results To test the methodology that was presented in section 4, it was applied to a sample set of 720 vulnerability reports, recorded in a timeframe of 74 days by the NVD, between January 5th and March 20th, 2009 (First entry: CVE-2009-0022, last entry: CVE-2009-1036). The sample set was analyzed to ensure that it did not contain a disproportionate number of entries that affected only one of the three security factors. The analysis was conducted by comparing the number of
Third International Symposium on Empirical Software Engineering and Measurement
978-1-4244-4841-8/09/$25.00 ©2009 IEEE 541
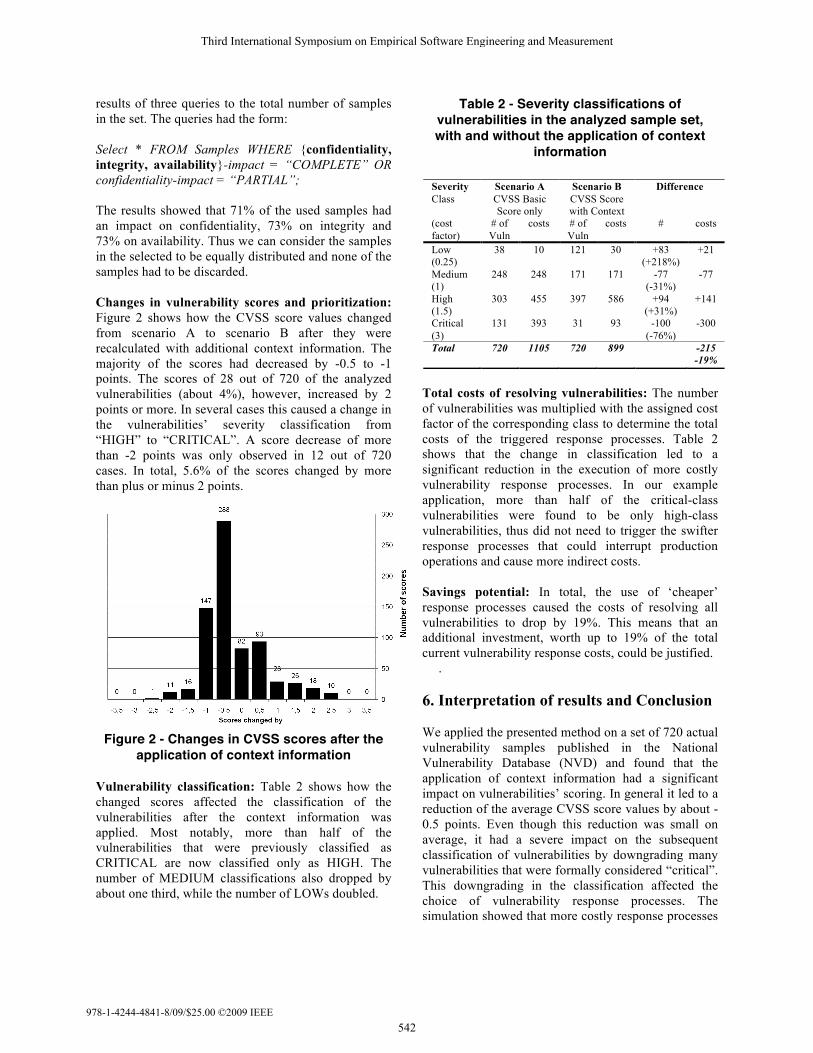
results of three queries to the total number of samples in the set. The queries had the form: Select * FROM Samples WHERE {confidentiality, integrity, availability}-impact = “COMPLETE” OR confidentiality-impact = “PARTIAL”; The results showed that 71% of the used samples had an impact on confidentiality, 73% on integrity and 73% on availability. Thus we can consider the samples in the selected to be equally distributed and none of the samples had to be discarded. Changes in vulnerability scores and prioritization: Figure 2 shows how the CVSS score values changed from scenario A to scenario B after they were recalculated with additional context information. The majority of the scores had decreased by -0.5 to -1 points. The scores of 28 out of 720 of the analyzed vulnerabilities (about 4%), however, increased by 2 points or more. In several cases this caused a change in the vulnerabilities’ severity classification from “HIGH” to “CRITICAL”. A score decrease of more than -2 points was only observed in 12 out of 720 cases. In total, 5.6% of the scores changed by more than plus or minus 2 points.
Figure 2 - Changes in CVSS scores after the
application of context information Vulnerability classification: Table 2 shows how the changed scores affected the classification of the vulnerabilities after the context information was applied. Most notably, more than half of the vulnerabilities that were previously classified as CRITICAL are now classified only as HIGH. The number of MEDIUM classifications also dropped by about one third, while the number of LOWs doubled.
Table 2 - Severity classifications of vulnerabilities in the analyzed sample set, with and without the application of context
information
Total costs of resolving vulnerabilities: The number of vulnerabilities was multiplied with the assigned cost factor of the corresponding class to determine the total costs of the triggered response processes. Table 2 shows that the change in classification led to a significant reduction in the execution of more costly vulnerability response processes. In our example application, more than half of the critical-class vulnerabilities were found to be only high-class vulnerabilities, thus did not need to trigger the swifter response processes that could interrupt production operations and cause more indirect costs. Savings potential: In total, the use of ‘cheaper’ response processes caused the costs of resolving all vulnerabilities to drop by 19%. This means that an additional investment, worth up to 19% of the total current vulnerability response costs, could be justified.
. 6. Interpretation of results and Conclusion We applied the presented method on a set of 720 actual vulnerability samples published in the National Vulnerability Database (NVD) and found that the application of context information had a significant impact on vulnerabilities’ scoring. In general it led to a reduction of the average CVSS score values by about -0.5 points. Even though this reduction was small on average, it had a severe impact on the subsequent classification of vulnerabilities by downgrading many vulnerabilities that were formally considered “critical”. This downgrading in the classification affected the choice of vulnerability response processes. The simulation showed that more costly response processes
Severity Class
Scenario A CVSS Basic Score only
Scenario B CVSS Score with Context
Difference
(cost factor)
# of Vuln
costs # of Vuln
costs # costs
Low (0.25)
38 10 121 30 +83 (+218%)
+21
Medium (1)
248 248 171 171 -77 (-31%)
-77
High (1.5)
303 455 397 586 +94 (+31%)
+141
Critical (3)
131 393 31 93 -100 (-76%)
-300
Total 720 1105 720 899 -215 -19%
Third International Symposium on Empirical Software Engineering and Measurement
978-1-4244-4841-8/09/$25.00 ©2009 IEEE 542

were triggered significantly less in the context aware Scenario B than in the original Scenario A. Especially the number of “Critical” response processes that could interrupt production systems was reduced by more than half. This reduction of “red-alerts” is of particular importance for security management, because it also reduces the risk that staff members get accustomed to seeing critical alarms and tune down their alertness. The vulnerability prioritization quality was improved as well. In 5,6% of the cases we saw a score change of more than 2 points, which meant that the improved scoring prevented false-negatives or false-positive prioritizations in those cases. We found that the cost savings potential of 19% resulted largely from a reduction in the use of the most expensive vulnerability response processes. The absolute extent of the saving potential, however, depends strongly on the cost factors used by the individual organization. This is also the main limitation of our method: without prior knowledge of the total costs that are created by different vulnerability response processes, an estimation of the possible improvements is not possible. In summary, this work investigated the impact of adding context information to the scoring process of software vulnerabilities. We found that the addition of context information improves the scores’ reflection of the actual severity of a vulnerability from the organization’s point of view. A better reflection of reality in the scores further improved the prioritization of vulnerabilities and the selection of more efficient response processes. Managers hesitated to invest in the improvement of scoring methods because it is hard to quantify the potential cost savings that such investments would yield. We presented a method that can be applied by security managers to estimate the cost savings from improved scoring mechanisms in their particular organizational settings. Our method is of particular use to practitioners who do not have the resources to gather large amounts of empirical data, because it allows them to simulate the improvement potential using only publicly available data in the NVD and distribution models from the literature. Finally, the presented method demonstrates the application of simulation of the availability of software vulnerability patches and exploits in security metrics and adds to the body of knowledge in quantitative security management. Further empirical research will be needed to compare the projected cost savings in this method with actually realized savings in firms and evaluate the applicability of the method in different industries and organizational settings.
10. References [1] M. Al-Humaigani and D. Dunn, “A model of return on investment for information systems security,” Micro-NanoMechatronics and Human Science, 2003 IEEE International Symposium on, 2003, pp. 483-485 Vol. 1. [2] O. Alhazmi, Y. Malaiya, and I. Ray, “Security vulnerabilities in software systems: A quantitative perspective,” Lecture Notes in Computer Science, vol. 3654, 2005, p. 281. [3] R. Anderson, “Why information security is hard-an economic perspective,” Computer Security Applications Conference, 2001. ACSAC 2001. Proceedings 17th Annual, 2001, pp. 358-365. [4] R. Anderson and T. Moore, “The economics of information security,” Science, vol. 314, 2006, pp. 610-613. [5] Basie, “Information Security governance: COBIT or ISO 17799 or both?,” Computers & Security, vol. 24, Mar. 2005, pp. 99-104. [6] R. Bojanc and B. Jerman-Blazic, “An economic modelling approach to information security risk management,” International Journal of Information Management, vol. 28, Oct. 2008, pp. 413-422. [7] M. Brenner, “Classifying ITIL Processes; A Taxonomy under Tool Support Aspects,” Business-Driven IT Management, 2006. BDIM '06. The First IEEE/IFIP International Workshop on, 2006, pp. 19-28. [8] H. Cavusoglu, B. Mishra, and S. Raghunathan, “A model for evaluating IT security investments,” Commun. ACM, vol. 47, 2004, pp. 87-92. [9] Y. Chen, “Stakeholder Value Driven Threat Modeling for Off The Shelf Based Systems,” International Conference on Software Engineering, IEEE Computer Society Washington, DC, USA, 2007, pp. 91-92. [10] Y. Chen, B. Boehm, and L. Sheppard, “Value Driven Security Threat Modeling Based on Attack Path Analysis,” Hawaii International Conference on System Sciences, IEEE, 2007, p. 4698. [11] COBIT, “Information Systems Audit and Control Association,” p. available online at www.isaca.org/COBIT. [12] G. Eschelbeck, “The Laws of Vulnerabilities: Which security vulnerabilities really matter?,” Information Security Technical Report, vol. 10, 2005, pp. 213-219. [13] S. Frei, M. May, U. Fiedler, and B. Plattner, “Large-scale vulnerability analysis,” Proceedings of the 2006 SIGCOMM workshop on Large-scale attack defense, Pisa, Italy: ACM, 2006, pp. 131-138.
Third International Symposium on Empirical Software Engineering and Measurement
978-1-4244-4841-8/09/$25.00 ©2009 IEEE 543
[14] C. Frühwirth, “On Business-Driven IT Security Management and Mismatches between Security Requirements in Firms, Industry Standards and Research Work,” Product-Focused Software Process Improvement, 2009, pp. 375-385. [15] L.A. Gordon and M.P. Loeb, “The economics of information security investment,” ACM transactions on information and system security, vol. 5, 2002, pp. 438-457. [16] A.R. Hevner, S.T. March, J. Park, and S. Ram, “Design science in information systems research,” Management Information Systems Quarterly, vol. 28, 2004, pp. 75-106. [17] A. Hochstein, R. Zarnekow, and W. Brenner, “ITIL as common practice reference model for IT service management: formal assessment and implications for practice,” e-Technology, e-Commerce and e-Service, 2005. EEE '05. Proceedings. The 2005 IEEE International Conference on, 2005, pp. 704-710. [18] M. Ishiguro, H. Tanaka, K. Matsuura, and I. Murase, “The Effect of Information Security Incidents on Corporate Values in the Japanese Stock Market,” International Workshop on the Economics of Securing the Information Infrastructure (WESII), 2006. [19] ISO/IEC, “Std. ISO 17799:2005, Information Technology – Security Techniques - Code of Practice for Information Security Management,” ISO, 2005. [20] ITIL, “The Open Guide. ITIL Incident Management,” 2007, p. Available online at: www.itlibrary.org/index.php? page=Incident_Management. [21] Y. Lai and P. Hsia, “Using the vulnerability information of computer systems to improve the network security,” Computer Communications, vol. 30, Jun. 2007, pp. 2032-2047. [22] P. Mell, K. Scarfone, and S. Romanosky, “A Complete Guide to the Common Vulnerability Scoring System Version
2.0,” Published by FIRST-Forum of Incident Response and Security Teams, 2007. [23] T. Neubauer, M. Klemen, and S. Biffl, “Business process-based valuation of IT-security,” Proceedings of the seventh international workshop on Economics-driven software engineering research, St. Louis, Missouri: ACM, 2005, pp. 1-5. [24] National Institute of Standards and Technology (NIST), “National Vulnerability Database (NVD).,” p. Available online at http://nvd.nist.gov/. [25] S.L. Pfleeger and R. Rue, “Cybersecurity Economic Issues: Clearing the Path to Good Practice,” IEEE Software, vol. 25, 2008, pp. 35-42. [26] G. Ridley, J. Young, and P. Carroll, “COBIT and its utilization: a framework from the literature,” System Sciences, 2004. Proceedings of the 37th Annual Hawaii International Conference on, 2004, p. 8 pp. [27] R. Rieke, “Modelling and Analysing Network Security Policies in a Given Vulnerability Setting,” Critical Information Infrastructures Security, 2006, pp. 67-78. [28] W. Sonnenreich, J. Albanese, and B. Stout, “Return On Security Investment (ROSI)-A Practical Quantitative Model,” Journal of Research and Practice in Information Technology, vol. 38, 2006, pp. 45-56. [29] I. Tashi and S. Ghernaouti-Helie, “Efficient Security Measurements and Metrics for Risk Assessment,” Internet Monitoring and Protection, 2008. ICIMP '08. The Third International Conference on, 2008, pp. 131-138. [30] R. Telang and S. Wattal, “An empirical analysis of the impact of software vulnerability announcements on firm stock price,” IEEE Transactions on Software Engineering, vol. 33, 2007, pp. 544-557.
Third International Symposium on Empirical Software Engineering and Measurement
978-1-4244-4841-8/09/$25.00 ©2009 IEEE 544