Aging and Vulnerability to Environmental Chemicals
505
Issues in Toxicology Aging and Vulnerability to Environmental Chemicals Age-related Disorders and their Origins in Environmental Exposures Edited by Bernard Weiss
-
Upload
khangminh22 -
Category
Documents
-
view
0 -
download
0
Transcript of Aging and Vulnerability to Environmental Chemicals

Issues in Toxicology
Aging and Vulnerability to Environmental ChemicalsAge-related Disorders and their Origins in Environmental Exposures
Edited by Bernard Weiss
Aging and V
ulnerability to Environmental C
hemicals
Weiss

Aging and Vulnerability to Environmental ChemicalsAge-related Disorders and their Origins in Environmental Exposures

Issues in Toxicology
Series Editors:Professor Diana Anderson, University of Bradford, UKDr Michael D Waters, Integrated Laboratory Systems, Inc., N Carolina, USADr Martin F Wilks, University of Basel, SwitzerlandDr Timothy C Marrs, Edentox Associates, Kent, UK
Titles in the Series:1: Hair in Toxicology: An Important Bio-Monitor2: Male-mediated Developmental Toxicity3: Cytochrome P450: Role in the Metabolism and Toxicity of Drugs and other
Xenobiotics4: Bile Acids: Toxicology and Bioactivity5: The Comet Assay in Toxicology6: Silver in Healthcare7: In Silico Toxicology: Principles and Applications8: Environmental Cardiology9: Biomarkers and Human Biomonitoring, Volume 1: Ongoing Programs and
Exposures10: Biomarkers and Human Biomonitoring, Volume 2: Selected Biomarkers of
Current Interest11: Hormone-Disruptive Chemical Contaminants in Food12: Mammalian Toxicology of Insecticides13: The Cellular Response to the Genotoxic Insult: The Question of Threshold
for Genotoxic Carcinogens14: Toxicological Effects of Veterinary Medicinal Products in Humans:
Volume 115: Toxicological Effects of Veterinary Medicinal Products in Humans:
Volume 216: Aging and Vulnerability to Environmental Chemicals: Age-related
Disorders and their Origins in Environmental Exposures
How to obtain future titles on publication:A standing order plan is available for this series. A standing order will bringdelivery of each new volume immediately on publication.
For further information please contact:Book Sales Department, Royal Society of Chemistry, Thomas Graham House,Science Park, Milton Road, Cambridge, CB4 0WF, UKTelephone: +44 (0)1223 420066, Fax: +44 (0)1223 420247Email: [email protected] our website at www.rsc.org/books

Aging and Vulnerability toEnvironmental ChemicalsAge-related Disorders and their Origins inEnvironmental Exposures
Edited by
Bernard WeissDepartment of Environmental Medicine, University of Rochester, NY, USAEmail: [email protected]

Issues in Toxicology No. 16
ISBN: 978-1-84973-418-9ISSN: 1757-7179
A catalogue record for this book is available from the British Library
r The Royal Society of Chemistry 2013
All rights reserved
Apart from fair dealing for the purposes of research for non-commercial purposes or forprivate study, criticism or review, as permitted under the Copyright, Designs and PatentsAct 1988 and the Copyright and Related Rights Regulations 2003, this publication may notbe reproduced, stored or transmitted, in any form or by any means, without the priorpermission in writing of The Royal Society of Chemistry or the copyright owner, or in thecase of reproduction in accordance with the terms of licences issued by the CopyrightLicensing Agency in the UK, or in accordance with the terms of the licences issued by theappropriate Reproduction Rights Organization outside the UK. Enquiries concerningreproduction outside the terms stated here should be sent to The Royal Society ofChemistry at the address printed on this page.
The RSC is not responsible for individual opinions expressed in this work.
Published by The Royal Society of Chemistry,Thomas Graham House, Science Park, Milton Road,Cambridge CB4 0WF, UK
Registered Charity Number 207890
For further information see our website at www.rsc.org
Printed in the United Kingdom by Henry Ling Limited, Dorchester, DT1 1HD, UK

Preface
Aging. We all do it from the moment we are born and it could be likened to thefinest wine reaching its prime. It sure looked like aging was on our side in thebeginning. We liked it. Think back to all the things you looked forward to as achild or a teenager, like reaching ‘‘driving age’’ and then ‘‘drinking age’’. Wecould not wait until we got ‘‘old enough’’. But while all that took place agingkept plodding on in its phantom-like manner. For some, acknowledging aginghas not been easy as they sought surgical options to cover it on the surface. Buteven with or without wrinkles and sags, reality soon sets in when we realize thataging is no longer an asset. And near the end when more and more of ourdiverse body systems let us down, un-relentlessly limiting our bounds, that iswhen we really understand what aging is all about.
But that’s normal aging. In this book Dr. Bernard Weiss tackles a serioushealth problem that has long been ignored, rapid aging, by bridging numerousdisciplines and leaning on the most eminent scientists in the field of publichealth for their perspective. In so doing he opens the door for discussion onhow could this have happened? And, why, since the 1950s, accelerated aginghas become more prevalent and over the same time period many chronicendocrine related disorders have reached pandemic level, at a tremendous costto society?
This book could not be more timely. Globally, over the past several decades,hundreds of professional society and government meetings have been devotedto rapid aging and endocrine disruption to the point where it appears that itmay be impossible to reverse the trend unless something is done immediately.The technology that has provided this information is based on entirely newlaboratory protocols that test genes, molecules, cells, and tissue at realisticconcentrations encountered each day in the environment. You might call it abottom up approach. It is rich in its discoveries and the use of new words
Issues in Toxicology No. 16
Aging and Vulnerability to Environmental Chemicals: Age-related Disorders and their Origins in
Environmental Exposures
Edited by Bernard Weiss
r The Royal Society of Chemistry 2013
Published by the Royal Society of Chemistry, www.rsc.org
v

creating a whole new vocabulary and a whole new generation of multi-disciplinary researchers. Despite this wealth of knowledge governments havenot changed how they test chemicals for their safety. Currently we are at animpasse because the use of toxicological standards based on risk analysis isdeeply embedded in the language of federal regulations. While millions havebeen increasingly succumbing to early onset of chronic disorders, and earlymortality, this new language has not been translated into policy for regulatorypurposes. For those doing the research who understand the overarching prin-ciples of endocrinology it is as though no one has been listening.
Looking back might help understand how this could have happened. RachelCarson quoted in her 1962 book, Silent Spring ‘‘A change at one point, in onemolecule even, may reverberate throughout the entire system to initiate changesin seemingly unrelated organs and tissues. This concept, familiar in physics, isgaining validity in all fields of biology and medicine.’’ Then she went on to writehow difficult it is to demonstrate cause and effect where the ultimate effect maynot be expressed for a long time after the initial change in a molecule, or cell, ortissue. Amazingly, she was describing endocrine disruption.
Carson’s citations in Silent Spring reveal that she had been reading about thechanges that were taking place in medical research in the 1950s. I expect thatshe was looking for clues about cancer, specifically because of her owncondition and trying to determine its etiology. She read about the work thatwas being done in 50s with the adrenal hormones, cortisol and aldosterone, andthe anterior pituitary and ACTH. And it was about that time that hormonereplacement therapy was being explored and estrogen had caught the interest ofthe pharmaceutical industry.
I am certain that if Rachel Carson had lived only a few more years she wouldhave discovered the phenomenon called endocrine disruption and I’ll just betthat she would have found a better name for it. And perhaps many of theendocrine disorders such as diabetes, obesity, autism, ADHD, fertilityproblems, Parkinsons, Alzheimers, and the cancers of the sex organs wouldnever have reached current epidemic proportions. There was a big push in the50s for fundamental research to understand the living organism in order toprovide better diagnosis and treatment — and the need to expand on theconcept of medicine as a life science and to include biology (Carson’s love).Although some advances along these lines have taken place they were notenough to slow down rapid aging.
But there is another reason why it has taken endocrine disruption with itsproclivity for rapid aging so long to become accepted as a major threat tohumankind. The same trade associations, other industry funded institutions,and corporations that attacked Rachel Carson are still out there 50 years laterprotecting their products and padding their bottom lines using some of thelargest public relations firms in the world to marginalize the science and vilifythose doing this 21st century research. And when one takes into considerationthat practically every endocrine disrupting chemical in use today was derivedfrom the toxic by-products from coal, oil, and natural gas it becomes even moreevident why today, federal health regulations are still based on the odds of
vi Preface
getting cancer at one in million or a thousand, not on the most unthinkableodds like diabetes where today one out of every third child born — and if youare among a minority group — every other child born will suffer the disease.
Humankind is in the midst of a dire health crisis that requires immediateintensive care to survive. The paradigm upon which current governmentpolicies and regulations have evolved has failed to protect us. A new level ofdiscourse is needed immediately between science and decision makers creating atoxic chemicals platform or framework using a disease-driven approach thatemploys the principles of endocrinology. This entity should over-see thecreation of an entirely new set of 21st century public health rules that wouldenable governments to reverse the current crisis. This could happen by makingpossible the merging of the dialogue between the most brilliant statespersonswith a record of independence and integrity and the brilliant spokes personswithin the community of scientists who understand the endocrine system. I seethis book providing the first major break through in that dialogue andcontributing to an urgently needed paradigm shift in how governments protectpublic health.
Theo ColbornThe Endocrine Disruption Exchange,
Paonia, Colorado
Preface vii


Contents
Introduction 1
Bernard Weiss
Chapter 1 Exposure to Lead and Cognitive Dysfunction 5
Jennifer Weuve and Marc G. Weisskopf
1.1 Lead Exposure: Long at Hand and in Mind 51.2 How Humans were and Continue to be Exposed
to Lead 6
1.2.1 Historical Exposures 61.2.2 Contemporary Sources of Exposure 9
1.3 Mechanisms of Neurotoxicity 111.4 Assessment of Lead Exposure 131.5 Cognitive Effects of Lead Exposures in Adults 14
1.5.1 Effects of High-Dose, Occupational Exposure 151.5.2 Effects of Low-Dose, Non-Occupational
Exposure 171.5.3 Modification by Psychosocial Factors 201.5.4 Modification by Genes 211.5.5 Does Exposure to Lead Contribute to
Dementia Risk? 221.6 Closing Remarks: Shifting Exposures, Continuing
Risks 22
References 24
Issues in Toxicology No. 16
Aging and Vulnerability to Environmental Chemicals: Age-related Disorders and their Origins in
Environmental Exposures
Edited by Bernard Weiss
r The Royal Society of Chemistry 2013
Published by the Royal Society of Chemistry, www.rsc.org
ix

Chapter 2 Cognitive Deterioration and Related Neuropathology in
Older People with Alzheimer’s Disease could Result from
Life-Long Exposure to Aluminium Compounds 31
J. R. Walton
2.1 Introduction 312.2 The Context for Aluminium in AD Causality 33
2.2.1 Some Ingested Al is Absorbed into Blood andTaken up by the Brain 34
2.3 Al Neuroxicity 372.3.1 Al Disrupts Cell Metabolism by Substituting
for Essential Metal Ions in Key RegulatoryProteins 37
2.3.2 Al Produces Oxidative Damage in Cells 372.3.3 All Epidemiological Studies Evaluating the Al
Exposure-AD Link have been Based on CrudeEstimates of Single Sources of Al Exposureand are Rife with Confounders 38
2.3.4 A Randomly Controlled Human Study ofTotal Chronic Al Exposure would beImpractical to Perform and Most Likely beUnethical 39
2.3.5 Surrogate Animals are Required to Investigatethe Effects of Chronic Exposure to the AlNeurotoxicant 40
2.4 Evidence that Supports Al Causality of AD 412.4.1 Cognitive Deterioration in Animals with
Chronic Al Neurotoxicity and Humans withAD is Associated with More Efficient AlAbsorption and Higher Serum/Plasma AlLevels 41
2.4.2 Certain Brain Regions Show More Damagethan Others in AD and Chronic AlNeurotoxicity 41
2.4.3 Cognitive Deterioration in AD and Chronic AlNeurotoxicity 43
2.4.4 Cognitive Deterioration in AD and Chronic AlNeurotoxicity Occur from the SameMechanism of Damage 44
2.4.5 Calcium (Ca21) Metabolism is Disrupted inAD and Chronic Al Neurotoxicity 48
2.4.6 Iron Metabolism is Disrupted in AD and inChronic Al Neurotoxicity 49
2.4.7 Neurotransmitter Levels are Diminished inAD and Al Neurotoxicity 51
2.4.8 AD and Chronic Al Neuroxocity areInflammatory Conditions 52
x Contents

2.5 Al and Neuropathological Hallmarks of AD 532.5.1 Microtubules 532.5.2 Cortical Atrophy in AD 562.5.3 Hyperphosphorylated Tau and NFTs 562.5.4 Hippocampal Granulovacuolar Degeneration
(GVD) 592.5.5 b-Amyloid and Presenilins in AD and Al
Neurotoxicity 602.5.6 APOE-Dependent Neuroplasticity 63
2.6 Aging Increases Human Vulnerability to AD and
Chronic Al Neurotoxicity 65
2.6.1 Kidney Aging and Functional Loss 652.6.2 Bone Aging and Osteoporosis 662.6.3 Brain Aging and Loss of
Neuroplasticity 672.6.4 Al-Containing Dietary Supplements
Specifically Marketed for OlderIndividuals 68
2.7 Conclusions 68Declaration 70Acknowledgments 70References 70
Chapter 3 Do Polychlorinated Biphenyls and Associated Chemicals
Exacerbate Aging-Related Declines in Brain Function? 83
R. F. Seegal
3.1 Introduction 833.2 What are PCBs? 843.3 Why are PCBs Still of Concern in the
21st Century? 88
3.4 Neurological Sequelae of High Level Occupational
Exposure to PCBs in Adults 90
3.5 Sequelae of High Level Non-Occupational Exposure
to PCBs on Cognitive Function 91
3.6 Effects of Environmental Exposure to PCBs on Motor
and Cognitive Function in Adults 93
3.7 Are PCBs the only ‘Bad Actors’? 953.8 PCBs as Etiologic Factors in Diabetes/Insulin
Resistance 97
References 99
Chapter 4 Parkinson Disease 104
G. Nelson and B. A. Racette
4.1 Introduction 104
xiContents

4.2 Environmental Toxins 1084.2.1 Metals 1084.2.2 Pesticides 1154.2.3 Solvents 116
4.3 Conclusion 117Acknowledgements 118References 118
Chapter 5 Mercury 125
Hiroshi Satoh
5.1 Mercury and its Compounds 1255.1.1 Classification of Mercury Compounds 125
5.2 Mercury Vapor (Elemental Mercury) 1265.2.1 Physical and Chemical Properties 1265.2.2 Exposure and Metabolism 1265.2.3 Health Effects of Mercury Vapor 127
5.3 Inorganic Mercury Compounds 1275.3.1 Mercuric and Mercurous Mercury
Compounds 1275.3.2 Exposure and Metabolism 1275.3.3 Health Effects of Mercuric Mercury
Compounds 1285.4 Organic Mercury Compounds (Methylmercury) 129
5.4.1 Organic Mercury Described in this Section 1295.4.2 Exposure and Metabolism 1295.4.3 Health Effects of Methyl Mercury
Compounds 1315.5 Developmental Toxicity of Mercury 132
5.5.1 Fetal Minamata Disease Patients 1325.6 Behavioral Teratology Studies of Methylmercury 134
5.6.1 Behavioral Teratology 1345.6.2 Postnatal Effects of Prenatal Exposure to
Methylmercury in Experimental Animals 1345.6.3 Effects of Fetal Methylmercury Exposure
among Humans Under General Environment 1355.7 Aging and Toxicity of Mercury 138
5.7.1 Minamata Disease Patients 1385.7.2 Residual or Remote Effects Among Workers
Exposed to Mercury Vapor 1395.7.3 Age-Related Increase in Auditory Impairment 140
5.8 Effects of Mercury Vapor Exposure During the
Perinatal Period 140
5.8.1 Effects of Prenatal Mercury Vapor Exposure 1415.8.2 Effects of Neonatal Mercury Vapor Exposure 1425.8.3 Effects of Coexposure to Mercury Vapor
and Methylmercury During Gestation 143
xii Contents

5.9 Conclusions 1455.9.1 Prenatal Methylmercury Exposure in
Humans 1455.9.2 Prenatal Methylmercury Exposure in
Animal Experiments 1455.9.3 Mercury Vapor Exposure and Aging in
Exposed Miners and Workers 1465.9.4 Prenatal Mercury Vapor Exposure in
Animal Experiments 146References 147
Chapter 6 Manganese 151
Roberto G Lucchini, Donald R. Smith and
Ronald B Tjalkens
6.1 Introduction 1516.2 Environmental Occurrence of Manganese and
Exposure Sources 152
6.3 Essential and Toxicological Roles of Manganese
in Humans 153
6.4 Manganese Toxicity in Adults and
the Elderly 154
6.5 Early Life Exposure to Manganese and Adult
Disease 156
6.6 Biological Markers of Manganese Exposure in
Humans 157
6.7 Animal Studies - Dosimetry 1596.8 Animal Studies - Early Life Manganese Exposure
as a Determinant of Late Onset Disease 161
6.9 Mechanisms of Manganese Toxicity 1616.9.1 Manganese Induces Oxidative Stress and
Mitochondrial Dysfunction 1626.9.2 Manganese Causes Dysregulation of Cellular
Iron Homeostasis 1636.9.3 Manganese Targets Dopaminergic and
Glutamatergic Systems 1646.9.4 Glial Activation and Nitrosative Stress in
Manganese Neurotoxicity 1656.9.5 Neuroinflammation may Link Between
Early Life Exposure to Manganese andSusceptibility to Late Onset NeurologicalDisease 165
6.10 Conclusion 168References 169
xiiiContents

Chapter 7 The Role of Persistent Organic Pollutants and
Plastic-Associated Chemicals in Cardiovascular Disease
and Metabolic Syndrome 182
Lars Lind and P. Monica Lind
7.1 Introduction 1827.2 Metabolic Syndrome 1847.3 Cardiovascular Disease 1907.4 Atherosclerosis 1927.5 Mechanisms of Action 1937.6 Conclusions 193References 194
Chapter 8 Obesity and Diabetes: Role of Environmental Chemical
Exposures 201
Thaddeus T. Schug, Sarah G. Howard, Kyla W. Taylor and
Jerrold J. Heindel
8.1 Background 2018.2 Comorbidities and Complications 2028.3 Genetics and Obesity and Diabetes 2038.4 Endocrine Mechanisms Controlling Weight Gain 2048.5 Causes of Obesity 2068.6 Metabolic Programming, Epigenetics and Obesity 2088.7 The Obesogen Hypothesis 2118.8 Animal Studies 211
8.8.1 Bisphenol A 2118.8.2 Organotins 2128.8.3 Cigarette Smoke/Nicotine 2128.8.4 Polyfluoroalkynes (PFOAs) 213
8.9 Human Studies 2138.9.1 Maternal Smoking 2138.9.2 Persistent Organic Pollutants 215
8.10 Type 2 diabetes 2178.10.1 Background 2178.10.2 Control of Blood Glucose Levels 2198.10.3 Developmental Programming, Environmental
Exposures and Type 2 Diabetes 2208.10.4 Developmental Exposures in Humans 2228.10.5 Human Adult Exposures 2228.10.6 Exposure During Pregnancy 223
8.11 Type 1 Diabetes 2238.11.1 Background 2238.11.2 Incidence 224
xiv Contents

8.11.3 Endocrine Role and Endocrine Disruption 2248.11.4 Evidence from Human and Animal Studies 225
8.12 Conclusion 227References 227
Chapter 9 Bisphenol A and Aging 241
Laura N. Vandenberg
9.1 Introduction 2419.2 Mechanisms of BPA Action 2419.3 BPA Sources 2439.4 Human Exposures 2449.5 Overview of Animal Studies 245
9.5.1 Determining what is a Low Dose Exposureto BPA 246
9.5.2 Dealing with Controversy & Conflicting Datain the BPA Literature 246
9.6 BPA & Mammary Cancer 2479.7 BPA & Prostate Cancer 2489.8 BPA & Metabolic syndrome, Liver Disease &
Cardiovascular Disease 249
9.9 BPA & Infertility 2519.10 Summary of Animal Studies 251
9.10.1 Overview of Epidemiology Studies 2529.10.2 BPA & Cancer 2539.10.3 BPA,Metabolic Syndrome & Cardiovascular
Disease 2539.10.4 BPA & Male Reproduction 2549.10.5 BPA & Female Reproduction 255
9.11 Summary & Conclusions 256References 256
Chapter 10 Male Reproductive Tract Disorders 267
John D. Meeker and Kelly K. Ferguson
10.1 Introduction 26710.2 Semen Quality and Sperm DNA Damage 26810.3 Persistent Organochlorines 26810.4 Non-Persistent Pesticides 27010.5 Heavy Metals 27110.6 Phthalates 27210.7 Other Environmental Chemicals 27310.8 Reproductive Hormones 275
10.8.1 Persistent Organochlorines 27510.8.2 Non-Persistent Pesticides 276
xvContents

10.8.3 Heavy Metals 27610.8.4 Phthalates 27710.8.5 Other Environmental Chemicals 278
10.9 Thyroid Hormones 27910.9.1 Persistent Organochlorines 27910.9.2 Non-Persistent Pesticides 28010.9.3 Heavy Metals and Other Environmental
Chemicals 28010.10 Cancers of the Male Reproductive Tract 28110.11 Summary and Conclusion 282Abbreviations 283References 284
Chapter 11 Breast Cancer – Importance of Life Stage with Respect to
Environmental Influences 293
Sally S. White and Suzanne E. Fenton
11.1 Introduction 29311.1.1 Breast Cancer & Aging Overview 29311.1.2 Contemporary Breast Issues of Public
Concern 29511.2 Breast Development 298
11.2.1 Overview of Unique Developmental Features 29811.2.2 Human Breast Development Timing and
Regulation 29911.3 Altered Breast Development 302
11.3.1 Altered Development in Humans 30211.3.2 Altered Development in Rodent Studies 304
11.4 Breast Cancer 30511.4.1 It’s not all about Genetics 30511.4.2 Known/Accepted, Non-Genetic Risk Factors 30511.4.3 Possible Environmental Risk Factors 31111.4.4 Effect-Modifying Factors 312
11.5 Conclusions 31611.5.1 Life-Stage Consideration is Crucial 31611.5.2 Prevention – a Primary Purpose or an
Afterthought? 31911.5.3 Future Research – Age or Stage? 319
References 320
Chapter 12 Environmental Chemicals and Prostate Cancer Risk 331
Jaspreet S. Joneja, Wen-Yang Hu,
Ricardo R. Rios and Gail S. Prins
12.1 Introduction 331
xvi Contents

12.2 Evidence and Mechanisms 33212.2.1 Farming and Pesticides 33212.2.2 Environmental Estrogens 33412.2.3 Anti-Androgens 33712.2.4 Dioxins 338
12.3 Environmental Chemicals and Prostate
Stem/Progenitor Cells 339
12.4 Conclusion 341References 341
Chapter 13 The Aging Kidney and Exposure to the Nephrotoxic Metals
Cadmium and Mercury 346
Christy C. Bridges and Rudolfs K. Zalups
13.1 Introduction 34613.2 Aging and the Normal Kidneys 347
13.2.1 Structural Changes within the Glomerulus 34713.2.2 Structural Changes in Renal Tubules and
Interstitium 35013.2.3 Physiologic Changes in the Kidney 350
13.3 Aging and Kidney Disease 35213.4 Aging and Exposure to Toxic Metals 353
13.4.1 Cadmium 35413.4.2 Mercury 359
13.5 Summary 364References 365
Chapter 14 Age Related Effects of Cadmium and Possible Roles in
Aging Processes 376
Bruce A Fowler
14.1 Introduction 37614.1.1 Cadmium Exposures 37614.1.2 Cadmium from Diet and Tobacco 377
14.2 Cadmium Accumulation and Effects in Humans 37714.2.1 Kidney and Skeletal Effects 37714.2.2 Effects on the Blood Vasculature 378
14.3 Cadmium Accumulation and Effects in Experimental
Animal Studies 379
14.3.1 Rodent Studies 37914.3.2 Effects of In Utero Exposures 380
14.4 Molecular Mechanisms of Cadmium Toxicity 38114.4.1 Roles of Cd-Induced Oxidative Stress and
Anti-Oxidant Systems 38114.4.2 Oxidative Stress, Protein Turnover and
Chromosomal Effects 382
xviiContents

14.5 Potential Roles of Cadmium in Aging Processes 38314.6 Summary and Conclusions 383References 384
Chapter 15 Lead Exposure and Osteoporosis: Mechanisms and Clinical
Manifestations 388
J. Edward Puzas, Catherine A. Muzytchuk and
Jonathan D. Holz
15.1 Introduction 38815.2 Lead in the Environment 389
15.2.1 Is Lead a Physiologically ImportantEnvironmental Toxicant? 389
15.2.2 Routes of Exposure 39015.2.3 Bioaccumulation of Lead 39115.2.4 Blood Levels, Intracellular Concentrations,
Mitochondrial Storage 39115.2.5 Lead in the Skeleton and Teeth 391
15.3 Skeletal Effects of Lead 39215.3.1 Suppression of 1,25-Dihydroxycholecalciferol 39215.3.2 Developmental Effects 39215.3.3 Delayed Tooth Development and Increased
Incidence of Dental Caries 39415.3.4 Fracture Healing and Incidence of
Non-Union 39415.4 Osteoporosis and the Mechanism of Lead Toxicity in
Bone Cells 395
15.4.1 Osteoporosis 39515.4.2 Mechanisms of Action for Lead Toxicity 39515.4.3 Bone Mass and Osteoporosis 39615.4.4 Lead and Osteoporosis 39815.4.5 Measurement of Bone Lead 39915.4.6 Skeletal Effects of Lead Exposure – in vitro
and Animal Studies 40015.4.7 Skeletal Effects of Lead Exposure – Clinical
Studies 40015.5 Summary 401References 402
Chapter 16 Liver Disease 409
Matt Cave, Mohammad K. Mohammad, Gavin Arteel,
Keith Cameron Falkner and Craig J. McClain
16.1 Introduction 409
xviii Contents

16.2 Aging Associated Changes in Liver Structure and
Function 410
16.2.1 Morphologic Changes 41016.2.2 Physiologic Changes 41116.2.3 Biochemical Changes 41116.2.4 Regeneration 416
16.3 Occupational and Environmental Hepatotoxicants 41716.3.1 Pathologic Forms of Liver Injury Attributed
to Industrial Chemicals 41816.3.2 Vinyl Chloride 41816.3.3 Aflatoxin 42216.3.4 Arsenic 423
16.4 Aging and Clinical Liver Disease 42416.4.1 Alcoholic Liver Disease 42416.4.2 Nonalcoholic Fatty Liver Disease 42516.4.3 Viral Hepatitis 42616.4.4 Drug Induced Liver Injury 427
16.5 Conclusions 428Abbreviations 428References 429
Chapter 17 Immune System Disorders 436
Rodney R. Dietert
17.1 Introduction 43617.2 Immune Cells as Environmental Sentries at the
Portals of Entry 437
17.3 Early-Life Origins of Adult Immune-Based Diseases 43817.3.1 Development Origins of Disease: The Barker
Hypothesis 43817.3.2 Critical Windows of Immune Vulnerability 43817.3.3 The Scope of Adverse Outcomes Occurring
with DIT 44017.3.4 Sex-Specific Adverse Outcomes and
Diseases Implications 44317.4 Chronic Misregulated Inflammation Links Most
Chronic Diseases 444
17.5 Environmental Triggers of Chronic Diseases 44617.6 Environmental Risk Factors Including
Environmental Chemicals 446
17.7 Summary 447Acknowledgements 448References 448
xixContents

Chapter 18 Aging and Vulnerability to Ambient Air Pollution 455
Morton Lippmann
18.1 Background 45518.2 Introduction to Contemporary Ambient Air
Pollution and its Health Effects 458
18.2.1 Vulnerability 45818.2.2 Age 45918.2.3 Ambient Air Pollutants 45918.2.4 Human Responses to Ambient Air
Pollutants 46018.3 Health-Related Effects of Ambient Air Pollutants 460
18.3.1 Ozone 46018.3.2 Particulate Matter 46418.3.3 Carbon Monoxide 46818.3.4 Lead 47018.3.5 Sulfur Dioxide 47018.3.6 Nitrogen Dioxide 470
References 471
Subject Index 473
xx Contents

Introduction
BERNARD WEISS
Email: [email protected]
Progressively aging populations introduce a situation never before encoun-tered in human history. Of all the problems this demographic surge creates,the foremost is declining health. As populations age, they impose risingdemands on medical care systems and facilities; at the same time, they nolonger produce the wealth required to sustain such facilities.Aging is not a disease. We possess no therapies for it, only for its manifes-
tations. But the stresses it inflicts on society would be more manageable couldits burden of disease and disability be diminished or slowed. We have learnedduring the past four decades that, in fact, it can be. The Framingham Heartstudy is testimony to that possibility. It identified risk factors that led to newstrategies for the prevention and subsequent reduction of coronary heart dis-ease. We have also learned that diet, exercise, and intellectual activity also delayor attenuate the burdens of aging and, in fact, help sustain productive lives.These and other strategies for reducing the health risks of aging now receiveprofuse publicity.In this volume, we address another set of risks, one to which we have given
hardly more than a glance. These risks arise from the chemical revolution thatbegan about seventy years ago. It flooded the world with chemicals thatpenetrated every aspect of our lives. Although they have brought us significantbenefits, they have also exacted a heavy price. In our ignorance and greed wehave so contaminated our environment that we are now exposed to thousandsof chemical agents that remain largely untested, despite their residence in our
Issues in Toxicology No. 16
Aging and Vulnerability to Environmental Chemicals: Age-related Disorders and their Origins in
Environmental Exposures
Edited by Bernard Weiss
r The Royal Society of Chemistry 2013
Published by the Royal Society of Chemistry, www.rsc.org
1

bodies and surroundings. Even those that are permanent residents of ourenvironment, such as metals, have appeared in new guises, such as fuel addi-tives, that spawn new questions.Now we propose to ask how these chemical agents may alter the health status
of aging populations. It is a question currently accorded a relatively lowpriority by investigators and funding agencies. Early development is the periodof the lifespan that has dominated research during the past few decades, withoccasional attempts to determine how exposures early in life play out duringlate adulthood and senescence.Early development, however, is not the only life stage during which we see
heightened responses to the adverse effects of chemicals. Vulnerability to toxicprocesses climbs again late in life and in many ways recapitulates the imperfectdefenses deployed by the immature organism. Traced across the life cycle, thisprogression takes the form of a U-shaped function, with the greatest potentialfor damage early and late in life. One feature common to both early and latephases is a reduced capacity to activate defenses against toxic effects. Immatureorganisms do not yet possess robust defense mechanisms. In aging organisms,they have passed into what might be called a post-mature decline. Older bodiesare already high-maintenance properties, so exposure to substances with toxicproperties may accelerate the process of decline, or exploit their dwindlingcapacities to resist such effects. ‘‘Aging’’ is not a mechanistic explanation forthe diminished functions we suffer later in life. Sometimes, the roots of suchdeclines merely unfold late in life, having lain dormant for decades, much likethe herpes zoster virus. Sometimes, the waning compensatory capacities thataccompany aging magnify vulnerability to exposure, a problem with pharma-ceuticals and one which is discussed at length in the medical literature.This volume has assembled a group of scientists who have thought about and
investigated the environmental exposures that may imperil what might becalled the natural or optimal course of aging. As editor, what I find moststriking is how closely and unexpectedly the different chapters fit together andhow they intersect.Six of the chapters touch on metals: lead (two chapters), mercury, cadmium,
manganese, and aluminum. Of these, only cadmium doesn’t feature brainfunction directly. There, it is the kidney that receives the most attention, butlead and mercury also affect kidney function. Kidney function, however, exertspotent effects on brain function. For example, chronic kidney disease mayinduce neurological disorders, such as ischemic brain injury, as well as cognitiveimpairment. And patients with chronic kidney disease have a higher prevalenceof cardiovascular disease, another chapter topic. The liver, too, cannot beoverlooked as a source of neurotoxicity. Hepatic encephalopathy is a classicexample. The liver can also be the source of the Ab-amyloid in the brain that isassociated with Alzheimer’s disease.Other chapters also examine brain function, and the chapter on Parkinson’s
disease discusses manganese in detail, but also examines lead. The chapter onpolychlorinated biphenyls (PCBs) is focused on the brain, while the chapter oncardiovascular function features related chemicals, the Persistent Organic
2 Introduction

Pollutants (POPs) and plastics, as well as PCBs. The chapter on obesity anddiabetes also takes account of brain function because food intake is governedby hormonal processes in brain. It is centered on endocrine-disrupting chemi-cals (EDCs) and what we have learned about their contribution to the currentsurge in obesity and allied disorders. But we also know that POPs and similarchemicals are also risk factors for diabetes, as well as for cardiovascular disease.And it has now been established, and discussed in the chapter on air pollution,that adverse cardiovascular effects are a major source of the associationbetween air pollution and mortality.Hormonal function and EDCs are addressed in other chapters as well. One is
an extensive review of the compound bisphenol A and exemplifies the range ofquestions and issues surrounding EDCs. The chapters on prostate and breastcancer also address EDCs, as does the chapter on cardiovascular disease, andall three point to their association with POPs such as dioxins. Like otherchapters, these also emphasize the association between exposures early in lifeand the emergence of adverse effects decades later, a phenomenon termed‘‘silent damage’’. One reason for the long latency may be the diminution ofcompensatory mechanisms late in life. But another may stem from earlier, silentdamage that renders the target tissues more vulnerable to a second exposure or‘‘hit’’. Many of the findings that first pointed us to the possibility of environ-mental chemicals causing endocrine disruption arose from questions aboutmale reproductive function, the subject of one chapter. Many chemicals, wenow know, besides those directly associated with the endocrine system, alsoexert endocrine-disrupting effects. Cadmium, for example, interacts with theestrogen receptor to induce such actions.Two organ systems in particular play a large role in how we process and
defend against environmental exposures. The liver and the immune systemcarry out these functions, but both suffer diminished efficiency as we age.Chemicals are processed by the liver to detoxify them, but the products (i.e.their metabolites) are sometimes the entities carrying the toxic message. Theimmune system is also a defense system that may respond in such a fashion thatthe protective response itself inflicts harm on the individual.Although lead is the focus of the chapter on osteoporosis, cadmium is also
stored in bone, and both have a half-life measured in decades. Cadmium, too, istoxic to bone. And both may contribute to osteotoxicity, not only through theireffects on calcium but via endocrine-disrupting properties acting on estrogenicreceptors. Osteoporosis, in effect, also releases lead stored in bone, raisingblood lead levels, and in this way contributes to the neurotoxic effects observedin older populations and described in one chapter.Figure 1 is a schematic depiction of how the course of aging might be
influenced by environmental chemical exposures and other factors. The base-line age is taken as 20 years, a time that health statistics indicate is followed byprogressively increasing rates of disabilities such as heart disease, for example.With ‘‘normal’’ aging, functional capacity—the ability of the model organ orsystem to perform its function—has declined to about 50% of its baseline value(shown by the horizontal line) by age 80 years. Exposed individuals are shown
3Introduction

to have reached that value by age 60 years, while those who have been able toavoid exposure and undertaken other positive behaviors have suffered a declineof around only 25%. Although only a schematic, the graph emphasizes howdifferent rates of decline can cause the gaps between the different courses ofaging to widen with time.I expect this volume to receive wide recognition and to serve as a foundation
for policy decisions. We are all aware of how the combination of aging popu-lations, their health challenges, and rising medical care costs is a priority issuefor governments throughout the world. As we gain more knowledge of how ourcontaminated environment contributes to these disorders and disabilities, I amhopeful that we will act to avert further strains on our beleaguered societies.The great baseball pitcher Satchel Paige, whose race confined him to the
‘‘Negro’’ baseball leagues until late in his career, was also a philosopher ofaging. Taking a somewhat fatalistic view, he observed, ‘‘Don’t look back.Something may be gaining on you.’’ But he was also sanguine about it, pointingout that, ‘‘Aging is a question of mind over matter. If you don’t mind, it doesn’tmatter.’’ This volume aligns itself with those optimists who believe thatknowledge gives us the power to make aging matter less.
Figure 1 A model depicting changes in functional capacity during the course of aging.Age 20 years is taken as the 100% baseline. Three different progressions areshown: a ‘‘normal’’ rate of decline; a rate accelerated by chemical exposure;and a rate slowed by lower exposures and lifestyle modifications.
4 Introduction

CHAPTER 1
Exposure to Lead and CognitiveDysfunction
JENNIFER WEUVEa,b AND MARC G. WEISSKOPF*b,c
aRush Institute for Healthy Aging, Rush University Medical Center,Chicago, IL, USA; bDepartment of Environmental Health, Harvard Schoolof Public Health, Boston, MA, USA; cDepartment of Epidemiology,Harvard School of Public Health, Boston, MA, USA*E-mail: [email protected]
1.1 Lead Exposure: Long at Hand and in Mind
Humans’ use of lead dates back at least to 7000 BC.1 And knowledge oflead’s neurotoxicity has been with us since the observations of Nicander,Vitruvius, and the ancient Greek physician, Dioscorides, who wrote that‘‘[l]ead makes the mind give way’’. Nonetheless, between 1925 and 1980,human exposure to lead in the US environment reached historically highlevels owing to the dominance of leaded gasoline for automobile fuel and thewidespread use of lead-based paint. In the present US environment, as aresult of long-sought regulations that removed lead from gasoline andminimized the use of lead-based paint, exposure to lead happens spor-adically, and most individuals’ exposures occur at low doses. Nonetheless,exposure to lead remains relevant to the cognitive function of aging adults,because exposures in the past were substantial. These exposures mayinfluence adult cognition either through their effects on the developingnervous system or, because lead is stored in the skeleton for periods of years
Issues in Toxicology No. 16
Aging and Vulnerability to Environmental Chemicals: Age-related Disorders and their Origins in
Environmental Exposures
Edited by Bernard Weiss
r The Royal Society of Chemistry 2013
Published by the Royal Society of Chemistry, www.rsc.org
5

and decades, through re-exposure to lead in adulthood with age-related boneturnover.
In this chapter, we describe historical and contemporary sources of leadexposure and scientific findings on its effects on cognitive function in adults. Wegive particular consideration to the history of lead’s use in gasoline and theincremental acknowledgement of its neurotoxicity by industrial and regulatorystakeholders. It is this history that underlies an epidemic of elevated leadexposure that spanned several generations and may be responsible for cognitivedecrements in many adults. This history is also instructive for how futureadditives to gasoline and other widely used consumer products should bescrutinized.
1.2 How Humans were and Continue to be Exposed to
Lead
1.2.1 Historical Exposures
1.2.1.1 Early Uses: the Emergence of Lead into theEnvironment
Unlike metals such as iron, copper, and manganese, lead is not essential tophysiological function. Yet humans have been introducing lead into theirenvironments—and often directly into their bodies—for millennia.1–4 Inancient Chinese, Mediterranean, and Middle Eastern societies, lead was a keyingredient in glassware, pots and vessels, solder, paints, cosmetics, eyemedicines, and contraceptive methods. It was also used in food and wine as asweetener and preservative. The Romans, taking advantage of its malleabilityand availability, made lead the centerpiece of their infrastructure with theirextensive web of lead pipes, promoting lead to a quotidian status unprece-dented in human civilizations. These uses were joined by new ones—e.g., as aningredient in inks, ammunitions, and even poisons—and continued throughoutthe early twentieth century. Then, in the 1920s, humans in the burgeoning USautomotive industry, aided and abetted by others in the US government,developed a use for lead that would expose much more of the population, atmuch higher doses than ever before.
1.2.1.2 How Leaded Gasoline Became the Major Source ofExposure to Lead
The market for automobiles in the US had grown increasingly competitive bythe early 1920s, and General Motors (GM) sought to distinguish its auto-mobiles from Ford’s reliable but sedate Model T by unveiling new models everyyear and, critically, improving engine power and efficiency.5,6 A challengecentral to this latter goal was eliminating the pinging ‘‘knock’’ that arose whenthe fuel ignited prematurely in high-performance, high-compression engines. In
6 Chapter 1

1921, Thomas Midgley, Jr., an engineer at GM, discovered that addingtetraethyl lead (TEL) to gasoline decreased this knock. Curiously, several yearsearlier, GM’s engineers had established that ethyl alcohol (grain alcohol) wasalso an effective anti-knock agent. However, the competitive advantage ofhaving a proprietary fuel and GM’s entwinement with the production of TELfuel meant that the lead-based agent prevailed while the alcohol-based agentwas maligned. This occurred even though, since TEL’s first synthesis by aGerman chemist in 1854, it had a ‘‘known deadliness.’’7
In response to protests from industrial hygienists, physiologists, andchemists, the Surgeon General inquired with GM and the DuPont company,a manufacturer of TEL, who responded with evidence-free reassurances.Nonetheless, seeking a governmental ‘‘stamp of approval’’ for their product,GM and DuPont entered into an agreement to study TEL’s safety withoversight from the Bureau of Mines.8 This oversight was merely symbolic,because GM and DuPont negotiated contractual control over all TEL data andany communications regarding it.5 The first gallon of leaded gasoline was soldin 1923.5,6
The momentum behind the ambition of GM and its affiliates was nearlystaunched when, in October 1924, five employees at Standard Oil’s TEL facilitydied violent, psychotic deaths, and 35 other workers were smitten with seriousneurologic symptoms such as hallucinations, tremors, and palsies. Even thoughStandard Oil dismissed suspicions with such claims as the victims ‘‘had probablyworked too hard’’,9 officials in New Jersey, Philadelphia, New York state, andNew York City were unconvinced and officially banned the sale of leadedgasoline for varying periods – in New York City, the ban lasted for 3 years.5
By this time, the Bureau of Mines had formally exonerated leaded gasoline,and yet at the TEL plants, poisonings and deaths continued, many of themclosely guarded by industry. Still, the neurotoxicity of lead in these occupa-tional settings was difficult to miss. Among workers at the Standard Oil plant,the TEL building was known as ‘‘The Looney Gas Building,’’ and at theDuPont plant, the TEL building was known as ‘‘The House of Butterflies,’’ intribute to its occupants’ tendency to have hallucinations involving insects.6
Yielding to the perception that a governmental body (the Bureau of Mines) wasin the pocket of industry, and thus any ill effects of TEL were being ignored, in1925, the Surgeon General assembled a conference of public health andindustry scientists. The argument that prevailed was that TEL would contributeso substantially to the progress of the US as to advance civilization itself, thusmaking TEL a ‘‘gift from God.’’5 And although public health advocates arguedthat it was incumbent on industry to demonstrate TEL’s safety, ultimately, theSurgeon General commissioned a ‘‘Blue Ribbon Panel’’ to investigate lead’sharm, giving this panel only seven months to do so.2 It is not surprising thenthat the committee concluded that ‘‘. . .at present, there are no good groundsfor prohibiting the use of ethyl gasoline. . . .’’5 However, the committeerecognized that seven months was insufficient for the job. Presciently, itpredicted that, given the insidious and cumulative toxicity of lead poisoning,‘‘[l]onger experience may show that even such slight storage of lead [in the
Exposure to Lead and Cognitive Dysfunction 7

body] as was observed in these studies may lead eventually in susceptibleindividuals to recognizable or to chronic degenerative diseases. . . .’’5,6 This wasthe last time for several decades that the US government would come close toconsidering major regulatory action on leaded gasoline.8
1.2.1.3 Lead-Based Paints Added to the Burden of Lead Exposure
Running in parallel to the emergence of leaded gasoline was the emergence oflead-based paint. Humans have been adding lead to paint for centuries, and theneurologic hazards to children of exposure to lead-based paint have beenknown since at least the early 1900s.10 The players in the saga of lead-basedpaint were the archetypes seen in the saga of leaded gasoline. The paint sagadiffered in its focus on children, both as potential victims of exposure and assubjects in advertising for lead-based paint manufacturers.11,12 In a perversetwist, the medical director for the Ethyl Gasoline Corporation advocatedreducing children’s exposures to lead by eliminating lead from paint, but clearlysaw no problem with lead in gas.11
1.2.1.4 Leaded Gasoline and Lead-Based Paint Were Phased out,but Many Were Exposed
The US Environmental Protection Agency, born in 1970, instituted regulationsthat initiated the gradual phase-down of lead content in gasoline for on-roadvehicles, beginning in 1976 and concluding with a complete ban in 1995.2,13,14
(Excluded from this phase-down were fuels used for off-road vehicles andmarine vessels, and in farming and aviation. In addition, it was only in 2008that the National Association for Stock Car Racing completely switched itsracing fuels to unleaded varieties.15,16)
In 1978, the Consumer Products Safety Commission banned the sale and useof lead-based paint.11 By then, human exposures to lead, primarily from leadedgasoline and paint, had reached common and chronic proportions. As of 1980,the estimated per capita consumption of lead-based products in the US was 5.2kilograms per American per year, around 10 times the estimated exposures ofancient Romans.2 Over the 20th century, the US had burned an estimated7million tons of lead in its gasoline,7 the source of about 90% of the leademitted into the environment.17
While leaded gasoline and paint were being removed from publicconsumption, interventions were occurring on other sources of exposure.For example, in the 1970s, many US-based food can manufacturersvoluntarily ceased using leaded solder in their cans,18 which resulted in asubstantial reduction in human exposure from this source between 1979 and1989.17 In 1995, the US Food andDrug Administration formally banned the useof lead-based solder in all canned food sold in theUS, including imported food.18
The removal of lead from gasoline, paint, and other sources markedlyreduced Americans’ lead exposures. For example, in early 1976, at the start of
8 Chapter 1

the phase-down of lead in gasoline, the average blood lead level in the civilian,non-institutionalized US population was 15 mg dL�1,19 well above what isdefined today as an elevated level for children (around 5 mg dL�1).y (In someareas in the early 1970s, including rural areas, the average blood lead levelsamong children exceeded 20 mg dL�1.23–25) By 1980, the average blood leadlevel had sunk to 10 mg dL�1,19 and it had plummeted to 2.8 mg dL�1 about adecade after that.z,26 Nonetheless, millions of children and adults had beenexposed to biologically relevant doses of lead, often for many years, andemerging evidence was suggesting that while removing the exposures hadestablished health benefits, the legacies of those exposures could go on toinfluence myriad health risks, including risks for impaired cognition inadulthood.
1.2.2 Contemporary Sources of Exposure
Lead exposure results from inhalation of air contaminated with lead, oringestion of food, water, or dust that contains lead. The highest exposures tolead have always been occupational, where workers can experience extremelyhigh levels of exposure. The action level for medical removal from theworkplace in the Occupational Safety and Health Administration’s (OSHA)standard for blood lead is 50 mg dL�1 or above for construction and 60 mg dL�1
or above for all other occupation settings;27–29 that is, when workers arefound to have blood lead levels above these levels, they are required to beremoved from that work environment until two consecutive blood leadmeasurements are below 40 mg dL�1. This level is still over 10 times greater thanthe current average blood lead concentration of adults in the US population(see also Section 1.2.1.4).
In the US, while occupational lead exposure has generally been decreasing, itremains a problem in construction,30 and this sector has become the dominantsource of lead exposure for adults (to a large extent the result of lead in paint).Lead paint can contain up to 50% lead by weight, and workers who remove
yIn May 2012, the US Centers for Disease Control and Prevention altered and, in effect, lowered itsrecommended pediatric threshold of concern from 10mg/dL, the level set in 1991, to any levelexceeding the current 97.5th percentile of blood lead levels for children ages 1–5. As of 2012, thiswas about 5 mg/dL. Sources: [1] Centers for Disease Control. 1991. Preventing lead poisoning inyoung children 1991. Centers for Disease Control and Prevention. [2] CDC Response to AdvisoryCommittee on Childhood Lead Poisoning Prevention Recommendations in ‘‘Low Level LeadExposure Harms Children: a Renewed Call of Primary Prevention.’’ 2012. Atlanta, GA.zOverall, as documented by data from the National Health and Nutrition Examination Survey,blood lead levels in the civilian, non-institutionalized U.S. population dropped from about15mg/dL in 1976 to 10 mg/dL in 1980 and then to 2.3, 1.7, 1.5, 1.4 and 1.3mg/dL, respectively, in the1991–1994, 1999–2000, 2001–2002, 2003–2004 and 2005–2006 monitoring periods. It remained at1.3mg/dL for 2007–2008. Sources: [1] J. L. Annest, J. L. Pirkle, D. Makuc, J. W. Neese, D. D.Bayse, M. G. Kovar. Chronological trend in blood lead levels between 1976 and 1980. N. Engl. J.Med., 1983; 308(23):1373–1377. [2] Update: blood lead levels–United States, 1991–1994. MMWRMorb Mortal Wkly Rep. 1997; 46(7):141–146. [3] Centers for Disease Control and Prevention.Fourth National Report on Human Exposure to Environmental Chemicals, Updated Tables,February 2012, Atlanta, Georgia.
Exposure to Lead and Cognitive Dysfunction 9

paint are at extremely high risk of lead exposure.31 The majority of houses builtbefore 1978 (estimated at 42–47million houses in the US) have lead-based paintinside and outside,32 and lead paint was also used in commercial buildings andother structures such as bridges. Scraping and, in particular, sanding lead paintcreates a fine lead dust that can be easily inhaled. Absorption of lead is highlyefficient following inhalation, particularly if the particles are small. Hand-to-mouth behavior of construction workers, for example eating and smokingcigarettes without prior hand washing, can also lead to significant absorption oflead. Lead dust on the hands can be ingested and absorbed through thegastrointestinal tract as can lead dust on cigarettes, which can be heated duringsmoking, generating lead fumes that are especially well absorbed by the lungs.Much more commonly in countries outside the US, Canada, and Europe,workers in many other industries, such as battery manufacturing plants, arealso at high risk of extremely high lead exposure.
Aside from occupationally exposed individuals, people who present withblood lead levels that exceed the Centers for Disease Control and Prevention(CDC) current pediatric action limit of 5 mg dL�1 were often exposed fromsources such as contaminated traditional medications and cosmetics, accidentalexposures to lead from commercial uses (e.g., leaded batteries), or use of lead-containing materials in several common hobbies. For example, persons whocreate pottery and stained glass often use materials that contain lead, which canresult in exposure, as can chewing on or making lead bullets or lead fishing linesinkers. Current exposures can also occur as a result of past activities, unfor-tunately sometimes unwittingly. Recent reports revealed elevated blood leadlevels among children in areas where houses were built on the site of formerlead manufacturing plants, of which the residents were unaware.33,34 In othercommunities, tap water has been inadvertently contaminated due to partialreplacement of service lines,35 or to water treatment processes that render thechemistry of the water more amenable to dissolving corroded lead in waterpipes.36 Outside of the US, many more examples of very high lead exposures ofnon-workers are found. A very recent and devastating example of this was thedeath of an estimated 400 children, and severe lead poisoning of many more, inNigeria as a result of artisanal gold ore processing in their family compounds.37,38
Common current sources of environmental lead exposure in the United Statesand around the world include lead in plumbing (which can contaminatedrinking water), lead paint in older housing, contaminated house dust,contaminated soil, lead crystal, and lead-glazed pottery. However, pastexposures to lead are still an important consideration. By far the predominantpast general environmental exposure to lead was through exposure to lead in air,which was very largely a result of lead in gasoline. Although a few countries,including Canada and Japan, led the US in banning leaded gasoline, bans inother parts of the world have occurred more recently or not at all, and in thesecountries, past cumulative exposures are likely to have been much higher.39–42
There are many reasons why—even in the US—we may still be seeing theeffects of those past high levels of environmental exposures. First, for thosewho were alive during the times of leaded gasoline, toxic effects of lead
10 Chapter 1

exposure at that time may manifest as health impairments later in life. Forexample, the cumulative exposure to lead in the past could have caused neuro-toxicity at the time, which in turn may result in more rapid cognitive decline inlater years. Second, while lead initially enters the bloodstream after beinginhaled or ingested—from where it is delivered to different tissues and causesdifferent toxicities—the major repository for lead in the body is the skeletalsystem. Lead deposited in bone stays there a long time—the half life of lead inbone is of the order of years or decades, depending on the bone type43—but itis slowly resorbed into blood as bone turnover occurs. Thus bone turnoverleads to a remobilization of lead, from exposure potentially many years earlier,back into the bloodstream, where it can again exert toxic effects on othertissues.44 In fact, in the present environment, in the US and many othercountries, of low levels of lead, the current major exposure to lead for manyolder people may be from lead in their own bones.
1.3 Mechanisms of Neurotoxicity
Several mechanisms by which lead can cause central nervous systemdysfunction exist. These have been reviewed elsewhere in greater detail,45–47 butwe will touch on some key aspects of particular relevance to the nervous systemhere. Many of the neurotoxic actions of lead relate to lead’s ability to substitutefor calcium, and to a lesser extent zinc. At a very broad view level, nerve cellsgenerally communicate by releasing compounds (neurotransmitters) from onecell (the pre-synaptic neuron) to act on a neighboring cell (the post-synapticneuron) in some way. The release of these neurotransmitters is finely tuned tothe activity of the pre-synaptic neuron in ways that are critically dependent oncalcium-dependent mechanisms. The released neurotransmitter acts on thepost-synaptic neuron by setting off signalling systems within the neuron; thesecan have a myriad effects on the intracellular state of the neuron, includingaltering cytoplasmic molecules as well as intranuclear molecules. Many of theseintracellular signalling processes are also calcium-dependent. These processesunderlie basic neural communication and functioning and underlie the abilityof the nervous system to change. This includes changes that drive the estab-lishment and refining of neural architecture during development and thechanges that occur in the adult as a result of experience, changes that arethought to underlie learning and memory. Lead is recognized by many of thesemolecules in much the same way calcium is recognized, but because lead theneither blocks or disrupts the function of the protein it interacts with, leaddisrupts communication in the nervous system, with the ultimate concern that itthereby disrupts behaviors that are dependent on those neural processes,behaviors such as adult cognitive function.
Many other effects of lead are relevant to adult cognitive function. Geneexpression is critical to the normal function of any cell, including neurons, andis also thought to be critical for encoding learning in the brain. Lead candisrupt gene expression in different ways. Many gene transcription factors
Exposure to Lead and Cognitive Dysfunction 11

require calcium or zinc as co-factors, therefore lead’s ability to substitute forcalcium and zinc can lead to disruption of resultant gene expression.
An exciting new direction of research related to gene expression actions ofexposure to lead and other environmental chemicals is epigenetics. Epigeneticsrefers to several different ways that the read out of the underlying DNAsequence (gene expression) can be modified without an alteration in the DNAsequence itself. An example of this is methylation of the DNA at particularsites. More methylation tends to be associated with less gene expression andvice versa. Critical to the importance of epigenetics is that the epigenetic patterncan be altered by the environment and, at the same time, epigenetic changescan persist after the environmental modifier is gone. And in fact thesechanges can be heritable, i.e. passed on to daughter cells. Lead exposure hasbeen found to be associated with increased concentrations of homocysteine.48
Increased homocysteine reduces the demethylation of S-adenosylmethionine(SAM)—which provides methyl groups for DNA methylation—thus possiblyreducing DNA methylation levels. In fact, lead exposure has been shown toinduce global hypomethylation of hepatic DNA in rats, which was associatedwith an increase in cell proliferation.49 Two recent studies in humans found thathigher bone lead levels were associated with patterns of lower DNAmethylation in adults and the cord blood of newborns.50,51 Of particular note,epigenetic effects have been proposed to potentially underlie intriguing findingsfrom recent animal studies that link in utero and neonatal exposure to lead toAlzheimer’s disease neuropathology in later life.52–54 These findings are relatedto amyloid beta (Ab) plaques, which are the pathological hallmark ofAlzheimer’s disease.55–57 Ab is the amyloidogenic product derived from theamyloid precursor protein (APP), with the help of the b-site APP-cleavingenzyme, BACE1. Early life lead exposure—but not later life exposure—in ratshas been found to be associated with increased expression of the APP gene,increased activity of the Sp1 transcription factor that regulates the APP gene,and increased levels of APP and Ab.58 Similar changes are seen in early lifelead-exposed monkeys, as is increased BACE1 mRNA and amyloid plaques.59
Moreover, it has been suggested that age-related demethylation—perhapswith a contribution from lead exposure—is related to Ab production inthe brain.60
Lead also adversely affects the central nervous system (CNS) through themany ways in which it causes cell damage and death. Lead causes oxidativestress through several pathways, including: the inhibition of enzymes in theheme synthesis pathway (d-ALA synthetase, d-ALAD, and ferrochelatase);stimulation of ferrous ion initiated membrane lipid peroxidation;61,62 changesin the fatty acid composition of membranes;63 and increased activation ofNAD(P)H oxidase.64,65 Lead also disrupts enzymes involved in antioxidantdefense systems. Lead has been shown to alter the function of superoxidedismutase, catalase, glucose-6-phosphate dehydrogenase and enzymes involvedin glutathione metabolism, glutathione peroxidase, glutathione-S-transferase,and glutathione reductase.66 Lead also accumulates in and damages themitochondria, causing release of calcium and apoptotic cell death.67–70
12 Chapter 1

In addition to the actions of lead within the nervous system, lead may alsoaffect neural function indirectly: for example, via effects on the cardiovascularsystem. There is abundant evidence of effects of lead on the cardiovascularsystem, including increasing homocysteine levels, atherosclerosis, bloodpressure, and risk of hypertension.48,71 Homocysteine is toxic to the CNS byinfluencing neurotransmitter synthesis, and causing excitotoxicity and celldeath.72,73 Atherosclerosis, increased blood pressure, and hypertension can allcontribute to silent (or not) cerebrovascular damage, leading to neuronal death.These types of cardiovascular factors are suspected to result in neurobehavioraldisturbances and may play a role in other brain disorders as well.
1.4 Assessment of Lead Exposure
The primary biological assessment of exposure to lead is to measure lead inwhole blood. The half-life of lead in blood is approximately 30 days, thus asingle blood lead concentration measurement only provides a metric of recentexposures, although if external exposures are constant over time, a single bloodlead measurement can provide an estimate of exposure to lead over longerperiods. In occupational settings where exposures are expected to be high, serialblood lead measurements are often taken at regular intervals for surveillance.These are measured to identify incidents of possible high level exposures (seeSections 2.2 and 2.6), but serial measurements can also be used to construct anindex of cumulative exposure over longer work periods, which can be useful forstudies of exposures of longer or varying durations. Some epidemiologicalstudies evaluate the effect of lead exposure on the health of workers withoutaccess to blood lead measurements. Instead, these studies use job exposurematrices (JEMs), which link specific jobs and tasks to different levels of likelyexposure to lead. These exposure levels are inferred from studies in othersettings where more direct measures of exposure—e.g. workers’ blood leadmeasurements or air lead measurements—are available. In these settings, therelation of specific jobs and tasks to lead exposure levels can be determined toconstruct a JEM that can then be applied in settings where actualmeasurements are not available.
Determining exposure levels among those exposed non-occupationally ismuch more difficult without biomarkers because exposure levels are typicallymuch lower and sources of exposure are more widespread and varied. Althoughblood lead concentration is by far the most commonly used biomarker of leadexposure, this measure is less useful when one wants to consider the effects ofcumulative exposure to lead over a longer time period. While serial blood leadmeasurements have been used to quantify lead exposure over longer durationsin occupational settings, this practice is less commonly used in non-occupational settings as it is time-consuming and labor intensive to implementif not required for surveillance. This conundrum created problems for the studyof the effects of lead on cognitive function, and the literature related to bloodlead measurements was quite inconsistent.74 Great advances in these research
Exposure to Lead and Cognitive Dysfunction 13

endeavors came with the development of technology to non-invasively measurelead in bone: x-ray fluorescence (XRF).44
Bone is the primary reservoir for lead in the human body, and measures ofthe concentration of lead in bone provide an integrated estimate of long-term,cumulative exposure to lead. The half-life of lead in the patella—whichcomprises mainly trabecular bone—is of the order of years, while the half-life oflead in the tibia—which comprises mainly cortical bone—is of the order ofdecades.43 It is important to keep in mind however, that bone leadmeasurements cannot provide information on the temporal pattern ofexposures during the years over which it integrates exposure. For example, twopeople may have the same bone lead concentration, but one may have haduniformly low exposures to lead except for one or more short periods of highexposure, while the other may have experienced a constant level of moderatelead exposure over the same time frame. We may not know whether thosedifferences in exposure patterns matter for the health outcome of interest, butwe need to keep in mind that if they do, these are distinctions we cannot makebased on bone lead. Distinguishing different effects of those two patterns ofexposure would be possible however with serial blood lead measurements.
1.5 Cognitive Effects of Lead Exposures in Adults
Prior to the mid-20th century, the prevailing view of lead poisoning was one ofan acute clinical event—involving tremors, vomiting, encephalopathy, andanemia, among other signs—that, if treated prior to encephalopathy, wouldhave no enduring neurologic effects.75,76 Work in 1943 by Randolph Byers andElizabeth Lord contradicted both these assumptions.75 They documented 20cases of lead exposure among children, most of whom did not exhibit the mostsevere effects of lead exposure and none of whom exhibited the severe extremeneurologic symptoms believed to be indicative of lead poisoning. However, allof the children exhibited demonstrable neurologic problems, includingattention deficits, behavioral problems, and impaired motor function. Over theyears that they were followed by their physicians, some of the children’sproblems resolved, but most had impaired intellectual development and manydeveloped new behavioral problems. In most cases, these enduring effectsoccurred even after the exposures, mainly from eating chips of lead-basedpaints, and were removed and treatment given. Indeed, a clinical trialconducted nearly 60 years later indicated that chelation therapy was ineffectiveat reducing the neurologic effects of lead exposure.77
In this section, we describe research on the relation of lead exposure tocognitive function in adulthood. The studies discussed document effects oncognition and subserving brain structures resulting from lead exposure at levelsfar lower than the doses associated with acute lead poisoning. This body ofevidence also extends the pioneering work of Byers and Lord by showing thatthe cognitive effects of lead exposure may continue well past the point at whichthe exposure has ended.
14 Chapter 1
1.5.1 Effects of High-Dose, Occupational Exposure
1.5.1.1 Evidence from Studies of Cognition and CognitiveDecline
With the accrual of several decades of research, it is clear that exposure to leadexerts adverse cognitive effects on cognitive functioning in adulthood. The TEL-related events of the 1920s and beyond were sentinels that eventually led tostudies focused on adults who experiences high-doses and/or frequent exposuresas part of their occupations. The most rigorous early meta-analysis of these studyfindings included 12 studies, published between 1977 and 1997, that reportedquantitative information about the exposed participants’ levels of exposure andthe cognitive scores, in addition to accounting for age and ‘‘premorbid intel-ligence.’’ Participants’ blood lead levels were relatively high by today’s standards;among the occupationally exposed participants, study cohort averages exceeded30mg dL�1, and in over half of the ‘‘unexposed’’ participant groups, the averagesexceeded 10mg dL�1. Overall, higher blood lead levels corresponded to worseperformance on tests of visuospatial ability, memory, and motor function.78
Although these conclusions were contested,79 the findings were consonant witha subsequent review,80 as well as several studies that have confirmed andextended these findings by distinguishing the acute effects of exposure from theeffects that remain after exposure has ceased and by exploring the realms ofcognitive decline over time, cerebral vascular ischemia, and brain volumes.
Since 1997, 16 new studies emerged that, in addition to measuring exposuresusing blood lead, also measured cumulative exposures.80 All of these studieswere adjusted for several potential sources of confounding, including age (and,unless otherwise specified, this is true of all the other studies that we will discussin the remainder of this section). In some of the 16 studies, the cumulativeexposure estimates came from integrating serial blood lead concentrations.Other studies measured lead concentrations at specific bone sites, takingadvantage of in vivo K-x-ray fluorescent (KXRF) spectroscopic methods thathad been refined for use in research settings (see Section 1.4). As described in areview of these studies,80 higher blood lead concentration—a measure of recentexposure—predicted worse performance on tests of cognition among workerscurrently exposed in their occupations. Measures of cumulative exposure werenot as strongly associated, a finding that the reviewers attributed to acuteeffects masking the effects of chronic or past exposures. By contrast, amongworkers whose occupational exposures had ended, measures of cumulativeexposure were more strongly associated with poor performance on cognitivetests than were measures of current exposure (e.g. blood lead level). Leadexposure appeared to adversely affect a wide range of cognitive functions, mostnotably visuospatial ability, executive function, and verbal memory. Higherexposures were also associated with worse performance on tests of motorability, including dexterity.
Among these studies were two investigations of change in cognition overtime. This outcome is of interest because it distinguishes effects of lead that
Exposure to Lead and Cognitive Dysfunction 15

persist over time—i.e. cognitive function remains diminished but does notcontinue to worsen after the exposure ends—from effects that worsen overtime.81 Moreover, decline in cognitive function is more directly related thanpoor cognition to the pathogenesis and progression of dementia. In thesestudies, higher cumulative exposure, indicated by tibia bone lead concentration,corresponded to greater decline in several cognitive functions, even after theoccupational exposure had ended.80 These findings were consistent with asubsequent study of 83 previously exposed workers in lead battery plants and51 unexposed workers.82 In spite of this study’s small size—and even afteraccounting for factors such as current blood lead level, years of employmentwith lead, age, education, income, alcohol intake, smoking history, and bloodpressure—exposed workers with higher peak tibia lead levels (current tibiabone lead concentration corrected for time since last occupational exposure)experienced significantly faster declines over 22 years on measures of visuos-patial ability, general intelligence, and memory ability, as well as overallcognition. Higher peak tibia lead level was also associated with more rapidcognitive decline among the ‘‘unexposed’’ workers, but these findings were notstatistically significant.
1.5.1.2 Evidence from Brain Imaging Studies
To further explore the mechanisms by which lead exposure may influencecognitive function and decline in occupationally exposed adults, severalresearchers have examined findings on brain imaging. A study of 536 men whopreviously had worked in organolead (e.g. tetraethyl lead) manufacturingplants found that higher cumulative exposure to lead, indicated by peak tibialead level, was associated with significantly elevated cerebral ischemic burden,as assessed by white matter lesion score on magnetic resonance images.83 Thisobservation provides support for a vascular mechanism underlying at leastsome of lead’s cognitive effects.
In this same study, higher cumulative exposure also appeared to be linked tostructural differences in the brain, including reduced total brain volume andtotal grey matter volume. In addition, frontal, cingulate gyrus and insulavolumes were smaller with higher cumulative lead exposure, but cerebellar andoccipital volumes were not, consistent with the observed associations of leadexposure with decline in cognitive functions, such as learning and executiveabilities, that are subserved by these affected regions.83 Indeed, a subsequentstudy found evidence that reduced volumes in brain regions specified a prioriseemed to explain the association between lead exposure and impaired visuo-construction ability. Similar but weaker evidence was found for eye-handcoordination and executive function.84 By contrast, when the investigatorsexamined changes in these imaging indices over a five year interval among 362of the original 536 participants, they found little association with cumulativelead exposure.85 It is possible that lead exposure has progressive effects oncerebral ischemia and brain structure but that these effects are too modest to beobserved in a study of this size that is reliant on these measures of exposure and
16 Chapter 1

outcomes. It is also possible that lead’s effects on these outcomes are merelypersistent rather than progressive and that the progressive effects seen oncognitive function are attributable to other mechanisms, such as effects onmicrostructure and neural function.
Magnetic resonance spectroscopy (MRS) is another brain imagingtechnique that integrates data on brain metabolites and structural features ofan imaged brain. Because MRS can assess brain metabolites, it can potentiallydetect changes in brain metabolism that occur before changes in the volume ofbrain structures can be seen. Using this technique in a study of 71 year oldidentical twin brothers, Weisskopf and colleagues found additional evidencefor the neurotoxic effects of lead.86 Both twins were retired painters butdiffered in the extent to which they were involved in paint removal, a task thatinvolves high levels of exposure to lead via inhaled leaded paint dust. Despitethe twins’ many similarities, the MRS results showed lower levels ofN-acetylaspartate (NAA)—a brain metabolite indicative of neuronaldensity—in frontal and hippocampal regions in the more highly lead-exposedtwin, as well as greater dysfunction on learning, memory, and executivefunction tasks, which are dependent on frontal and hippocampal regions.A subsequent study of 22 workers at a lead paint factory in Taiwan, alongwith 18 controls, found similar results, with higher levels of blood and patellalead concentrations exhibiting associations with decreased NAA, particularlyin the frontal lobe.87
1.5.2 Effects of Low-Dose, Non-Occupational Exposure
Against the backdrop of evidence suggesting that the cognitive effects of earlieroccupational exposures linger well into middle and old age, the hypothesis thatprotracted non-occupational (‘‘community-level’’), and therefore lower-level,exposure might also influence cognitive function and cognitive decline inadulthood emerged. This hypothesis is particularly important in light of twodemographic phenomena. The first is that an enormous number of individualsexperienced relatively high levels of these types of exposures between the 1920sand 1980s, merely by virtue of being exposed to emissions from leaded fuel, lead-based paint, or both. The second demographic feature is the impending surge,fuelled by the aging of the post-war ‘‘baby boom’’ population, in the number ofadults expected to develop dementia over the coming decades.88,89 Impairedcognition and, to a greater extent, cognitive decline in adulthood both signalfuture dementia risk.90–93 Thus understanding the relation of community-levellead exposure to impaired cognition and cognitive decline may offer directiontoward ameliorating lead’s effects among those already exposed and impetustoward continuing to minimize exposures among future generations.
Evidence that the effects of long-term, ‘‘low-level’’ exposure to lead early inlife may reverberate to impaired cognition later in life has begun to emerge instudies of animals52–54 and humans.94 Additionally, in a recent follow-up studyof adults who had participated in a study of prenatal lead exposure, bloodplasma indices of Ab production and deposition were higher among those who
Exposure to Lead and Cognitive Dysfunction 17

had elevated early life blood levels.95 One mechanism underlying these obser-vations is irreversible change to neural structures and function caused by earlyexposure. This mechanism may be especially relevant in situations in whichexposures have ceased. A second mechanism may involve the cumulativeburden of long-term exposure. Such exposure may be exogenous, as for anindividual who endured decades of exposure to ambient lead from leadedgasoline. Exposure may also be endogenous, because about 95% of lead in thebody is stored in the skeleton (see Section 1.4). The duration of its storage thereis a function of the bone characteristics and other metabolic factors thatinfluence the rate of bone turnover. However, when lead-containing bone isresorbed, that lead re-enters the circulation, from where it may access the brainand other susceptible organs and tissues (see Section 1.2.2).
1.5.2.1 Evidence from Studies of Cognition and CognitiveDecline
In comparison with studies of occupational lead exposure, studies ofcommunity-level lead exposure and cognitive outcomes in adults are relativelyfew. However, aided by KXRF technology, their numbers have beenincreasing. Blood lead levels of most participants in these studies were less than10 mg dL�1, much lower than those in the occupational studies. A review of 6such studies, published between 1998 and 2007, in which researchers assessedparticipants’ recent and cumulative exposures to lead, found that higherlevels of cumulative exposure—as assessed by KXRF-based bone leadmeasurements—were associated with worse performance on tests of a varietyof cognitive functions, including visuospatial abilities, verbal learning andmemory, executive functioning, eye-hand coordination, and overall cognitiveability.80 Blood lead levels were associated with significantly worseperformance on some cognitive tests in some studies, but, overall, these findingswere less consistent than those for bone lead.
Since this review, several other studies of community-level exposure to leadand adult cognition have been conducted. In a study of 1812 adults, aged 65and over and living in rural China, concentration of lead in blood plasma wasassociated with worse combined performance on 6 cognitive tests, but thisresult was not statistically significant.96 Similarly, a study of older adults,aged 60 and over, participating in the US-based National Health andNutrition Examination Survey (NHANES) found that blood lead levels wereassociated with increased likelihood of self-reported confusion and problemswith memory (N¼7277) and worse performance on a test of working memoryand attention (N¼2299), but neither of these findings was statisticallysignificant.97 In spite of the large study populations, the findings from thesestudies are not necessarily surprising. The study in China relied on plasma leadconcentrations. Although it is thought that the fraction of lead in plasmarepresents the most bioavailable lead in blood,98 levels are typically very low,and this concentration is notoriously difficult to measure.98,99 Indeed, a large
18 Chapter 1

proportion of participants had plasma lead levels that were effectively zero. Inthe NHANES study, concentrations of lead in whole blood ranged between0.18 and 54 mg dL�1, but average (2.45 mg dL�1) and median (2.00 mg dL�1)concentrations indicate low levels of recent exposure in most of the studypopulation. More importantly, neither of these studies employed indices ofcumulative exposure to lead. These measures would likely have revealed pastexposures to leaded gasoline, a major source of community-based exposure inboth study’s countries, and which had been officially banned by the time thesestudies were conducted.
Measures of cumulative exposure were available in 3 other studies ofcommunity-exposed adults. In a pilot study of 47 adults, aged 55 to 67 years,investigators gauged participants’ cumulative exposure to lead by usingKXRF-based measurements of lead concentrations in sites representative ofboth cortical (tibia) and trabecular (calcaneus) bone.100 They administered abattery of cognitive tests assessing visual memory, as well as the MontrealCognitive Assessment (MoCA), a separate battery assessing cognitive functionssuch as visuospatial ability, attention, executive function, and language.Participants with higher calcaneus lead concentrations performed worse on allof the visual memory tests, two of which were borderline significant (Po0.10).Findings for the tibia were somewhat similar but less consistent and not stat-istically significant. In unadjusted analyses, neither bone lead concentrationwas significantly associated with MoCA score.
A larger study of 587 women, aged 47 to 74, participating in the Nurses’Health Study measured lead concentrations in tibia and patella (representativeof trabecular) bone as well as in whole blood.101 In general, higher levels of allthree exposure biomarkers were associated with worse performance on the 6individual cognitive metrics assessed, which included tests of verbal memory,attention, and executive function. Curiously, the only result that was stat-istically significant was the single association indicating better performance (ona test of phonemic fluency) with higher exposure (as measured by patellar lead).The investigators also evaluated associations between the lead biomarkers andglobal cognition, accounting for scores on all cognitive tests completed. Theyrepeated these analyses without the aforementioned fluency test, which wassupported by a significant formal test of heterogeneity. Higher levels of all threeexposure biomarkers was associated with worse global cognition. In particular,although the women’s current exposures to lead were quite low (as indicated byan average blood lead level of 2.9 mg dL�1) higher tibia lead level correspondedto significantly worse global cognition when the fluency test was excluded.(Preliminary data from a subsequent cycle of cognitive testing have failed toconfirm the patella lead-fluency association.)
The third study—the Baltimore Memory Study, a population-based cohort ofmen and women living in a racially diverse collection of neighbourhoods inBaltimore, Maryland—involved 1140 participants, aged from 50 to 70.102
Investigators measured participants’ tibia bone lead concentrations andassessed their cognitive functioning at three study cycles approximately 14months apart, allowing them to evaluate cumulative exposure to lead in relation
Exposure to Lead and Cognitive Dysfunction 19

to cognitive decline. Decline in all six cognitive domains tested was generallyworse with higher levels of tibia lead, although only the association with declinein eye-hand coordination was statistically significant. However, higher tibia leadlevels were significantly associated with persistently worse performance on thetests over time (i.e., worse performance but not greater declines in performance).With further adjustment for socioeconomic status, the associations corre-sponding to executive function, verbal memory, and visual memory remainedsignificant. Nonetheless, in analyses stratified by race, the deleterious associationbetween tibia lead and cognitive function was present only among whiteparticipants (and statistically significant only for eye-hand coordination andexecutive function) and not among African-American participants.
1.5.2.2 Evidence from Brain Imaging Studies
In contrast to the brain imaging research conducted among occupationallyexposed individuals, brain imaging research has been scarce amongcommunity-exposed individuals. To date, the only such study conductedexamined the associations of both patella and tibia bone lead concentration tobrain metabolites measured with MRS in 31 older men, none of whomhad dementia, participating in the Normative Aging Study.103 Higherconcentrations of lead in both bone sites corresponded to higher levels ofhippocampal myoinositol, a metabolite believed to be related to glia(non-neuronal cells in the brain that fill roles including immune function andstructural and biochemical support). By contrast, bone lead levels were notassociated with neuronal density, as indicated by levels of NAA. While onemight expect a reduction in NAA with increasing lead exposure if lead exposureultimately results in neuronal loss, it is intriguing that others have suggestedthat one of the earliest spectroscopic signs of Alzheimer’s disease is an increasein myoinositol without a change in NAA.104
1.5.3 Modification by Psychosocial Factors
An emerging body of animal data suggests that early life exposure to psychologicalstress may further exacerbate lead exposure’s effects on cognitive outcomes.105–107
This interaction is potentially important because psychological stress and leadexposure frequently occur together in community settings. The mechanismunderlying this enhanced susceptibility may involve actions by both factors on thehypothalamic–pituitary–adrenal (HPA) axis, which, via the alteration in cortisolhomeostasis108 and other pathways, is linked to cognitive functioning.109 Exposureto lead and psychological stress may amplify each other’s effects on the HPA axis:lead exposure may alter reactivity to psychological stressors,110–112 and psycho-logical stress may promote the mobilization of lead from bone into the blood,113
thus making more lead available to act on the HPA axis and other systems. Bothlead and psychological stress also act on the dopaminergic and glutamatergicsystems in the brain’s mesocorticolimbic regions, which encompass key structuresand functions involved in cognition.105,106
20 Chapter 1

Because lead exposure and psychological stress may both occur repeatedlyover different stages of the lifespan, evaluating their joint effect on cognitiveoutcomes in adulthood is enormously challenging. Nonetheless, two studies incommunity-exposed populations offer a start—importantly, using measures ofcumulative lead exposure. Their results provide evidence to suggest that adverseeffects of lead on cognitive function are worse among persons exposed to greaterpsychological stress. In a study of 1001 participants, ages 50 to 70 years, of theBaltimore Memory Study, the associations of tibia lead level with poorperformance on tests of language, processing speed, and executive function weresignificantly stronger among those living in neighbourhoods characterized bygreater psychosocial hazards (e.g. 9-1-1 emergency calls, violent crime).114 Astudy of 811 men (mean age, 68 years) participating in the Normative AgingStudy found associations between lead exposure biomarkers and performance ona test of global cognition that were more deleterious among men who hadexperienced greater levels of perceived stress than among men with lower levelsof perceived stress.115 These differences in association were significant or,borderline significant, for both patella bone lead level and blood lead level.
1.5.4 Modification by Genes
Identifying genetic variants that modify the health effects of lead can, in theory,define sub-populations with elevated susceptibility to lead’s effects. Forexample, in the previously discussed cohort of former organolead workers, theadverse association between tibia lead concentration and several cognitiveabilities was heightened among men carrying at least one e4 variant— a variantwhose association with increased risk of late-onset alzheimer disease has beenwell-documented—of the apolipoprotein E gene.116,117
Genetic studies may also provide insights into the molecular mechanisms bywhich cumulative exposure to lead may affect adult cognition. A particularlyclear example of this type of inquiry was in a study of variants of thehemochromatosis (HFE) gene.118 Two HFE variants are associated withhemochromatosis, a disease of iron overload and consequently excess oxidativestress. Among a group of 358 men in the Normative Aging Study, those whocarried at least one of these alleles experienced significantly faster rates ofdecline in global cognition, compared with non-carriers, for a given increase inbone lead (tibia or patella). These findings provide support for the role ofoxidative stress and, potentially, iron–lead interactions in lead’s relation tocognition.
These two sets of findings have not, however, been replicated in other settingsthus far. And, on the whole, reports on lead–gene interactions have either beenisolated, as for the aforementioned interactions, or shown inconsistent results.A well-characterized variant in the gene encoding d-aminolevulinic acid (ALAD)has received the most attention. This variant, known as ALAD-2, produces anenzyme sub-unit that is more electronegative than that produced by the wild typeALAD-1 variant.119 Thus lead may have greater affinity for the isozymecomposed of a greater number of ALAD-2 sub-units.120 Whether ALAD-2
Exposure to Lead and Cognitive Dysfunction 21

carriers are more susceptible to lead’s cognitive effects is unclear. The moreelectronegative ALAD-2 isozyme could more effectively distribute leadthroughout the body or, conversely, bind lead so tightly as to reduce its bioa-vailability.121 In addition, lead inhibits ALAD, resulting in an increase in theneurotoxic substrate, 5-aminolevulic acid (ALA). The lead-induced increase inplasma ALA is more pronounced in ALAD-1 homozygotes,122–124 implyingdecreased cognitive susceptibility inALAD-2 in carriers. For a given increment inlead exposure biomarker, one study of older adult men found more deleteriousassociations with cognitive function among ALAD-2 carriers, although none ofthese lead exposure-ALAD genotype interactions was statistically significant.125
Findings in two other studies were mixed.126,127 A fourth study of occupationallyexposed and unexposed middle-aged adults found greater susceptibility to lead’seffects on motor function among ALAD-1 homozygotes.128
An emerging area of inquiry, that may produce more promising findings,is how lead exposure affects cognitive function through its effects onthe epigenome. Specifically, lead may influence when and how much a particulargene is expressed,50,51 providing a potentially powerful way, above and beyondlead’s interaction with traits of the static genome, for understanding lead’s effectson neurodevelopment and cognitive function over the lifespan. (For furtherdiscussion on the epigenetic effects of lead, see Section 1.3.)
1.5.5 Does Exposure to Lead Contribute to Dementia Risk?
Taken as a whole, in combination with new findings on childhood leadexposure and adult cognitive functioning, the findings on cumulative exposureto lead among both occupationally and non-occupationally exposed indi-viduals suggest that lead exposure earlier in life has residual neurocognitiveramifications many years later. A mechanistically logical extension of leadexposure’s associations with impaired cognition and accelerated cognitivedecline is that lead may be associated with increased risk of dementia. Becausestudies with high-quality assessments of lead exposure rarely also entail high-quality assessments of dementia, and vice versa, the data required to answer thisimportant public health question is essentially absent. A few studies haveattempted to evaluate this association, but the exposure assessments in thesestudies were poor, and the studies were underpowered to detect subtle effects,which are common in the study of environmental toxicants on health. Withincreased interest in the late life effects of early and mid life exposures, moreopportunities should arise for addressing the effect of lead exposure ondementia risk.
1.6 Closing Remarks: Shifting Exposures, Continuing
Risks
The removal of lead from gasoline and the prohibition of lead-based paint useresulted in substantially reduced exposures for millions of children and adults.
22 Chapter 1

While this achievement has been hailed as a public health victory, the excru-ciatingly slow pace at which it came about has incurred great costs to theintellectual capacity and economic productivity of the United States,129 andlikely other countries as well, prompting one observer to bemoan the victory asa pyrrhic one.130
A surprising dimension of this success is that as average exposure levels havefallen over time, researchers have continued to identify adverse cognitive effects onchildren at progressively lower levels of exposure.76 In a recent pooled analysis,adverse effects on children were detectable at levels below 30mg dL�1 (thescreening threshold from 1975–1985), and in fact, the steepest interval of the dose-response curve appeared at the lowest levels of exposure, below 10mg dL.131 Withthese discoveries of cognitive effects at lower blood lead levels, the CDC haslowered its pediatric screening threshold repeatedly over time.20–22,76 Followingadvocacy for lowering the threshold even further,132 the CDC recently changedits recommendations to intervene on children whose levels fall in the 97.5thpercentile, effectively reducing the threshold in 2012 to around 5mgdL�1.20–22
In contrast, in occupational settings in the US, the blood lead level thresholdsthat trigger various actions (e.g. removal from the workplace) were last prom-ulgated in an era in which addressing acute toxicity was the primary goal as far asadult health was concerned. The Occupational Health and Safety Adminis-tration (OSHA) last set these standards in 1978 and 1993 respectively forconstruction and general industry. But, as argued by Schwartz andHu, as well asthe American College of Occupational and Environmental Medicine, thesecurrent standards may still permit too much risk, especially in light of data thathas emerged in the past 15 years.133,134 For example, a worker with a single bloodlead level exceeding 60 mg dL�1 must be removed from further exposure; thislevel is far in excess of the level at which lead exposure exerts its cognitive effects.In 1978, the average blood lead level in the population exceeded 10 mg dL�1,19
and even though it had dropped substantially by 1993,135 most workers whowere covered by these standards had started working when average blood leadlevels were what are now considered elevated.133,134
All told, while lead exposures in the US have been decreasing, they remainrelevant to the cognitive well-being of several generations of adults who havesustained substantial exposures during at least parts of their lives. Nearly 90%of US children in 1976 had blood lead levels exceeding 10 mg dL�1.136 And bythe time the most recent OSHA standards for lead exposure came into effect, in1978 and 1993, most adults had already accrued substantial exposures.Moreover, progress in preventing exposures and their cognitive aftermath willlikely not occur at the same pace in all population sectors. Within the US,historic exposures to lead followed marked racial and socioeconomic gradients,with higher exposures more common among individuals of minority race orethnicity and/or who were economically disadvantaged.136–138 These gradientshave lessened over time, but to a modest degree still remain.139–141 Progressoutside of the US is likely to be uneven as well (see Section 1.2.2). Clearly, thecognitive legacy of lead exposure will likely be a protracted one, as sources ofexposure persist or new sources emerge over time.
Exposure to Lead and Cognitive Dysfunction 23

References
1. M. A. Lessler, Ohio J. Sci., 1988, 88, 78–84.2. J. Lewis, EPA Journal, 1985. Available online, http://www.epa.gov/
aboutepa/history/topics/epa/15c.html.3. E. H. Schafer, T’oung Pao, 1956, 44, 413–438.4. S. Hernberg, Am. J. Ind. Med., 2000, 38, 244–354.5. D. Rosner and G. Markowitz, Am. J. Public Health, 1985, 75, 344–352.6. H. L. Needleman, Environ. Res., 1997, 74, 95–103.7. J. L. Kitman, in The Nation, 2000. Available online, http://www.
thenation.com/article/secret-history-lead.8. D. Ozonoff, Am. J. Public Health, 1985, 75, 338–340.9. ‘‘Odd gas kills one, makes four insane,’’ New York Times, October 27,
1924, p. 1.10. J. L. Gibson, Public Health Rep., 2005, 120, 301–304.11. G. Markowitz and D. Rosner, Am. J. Public Health, 2000, 90, 36–46.12. C. Warren, Public Health Rep., 2005, 120, 322–329.13. United States Environmental Protection Agency (1997). Clean Air Act,
Section 112(c)(6), Specific Pollutants, Docket N. A097-05; FRL-5843-6,Federal Register. 62: 33625–33639.
14. United States Environmental Protection Agency, ‘‘Press release: EPAtakes final step in phaseout of leaded gasoline,’’ January 29,1996.
15. D. Caldwell, ‘‘Racing to make the pit stops a little bit greener,’’ New YorkTimes, February 25, 2007.
16. V. Bernstein, ‘‘Nascar plans to switch to unleaded fuel in ’08,’’ New YorkTimes, January 20, 2006.
17. Agency for Toxic Substances and Disease Registry, ‘‘Toxicological profilefor lead’’ (Public Health Service, US Department of Health and HumanServices, Altanta, GA, 2007).
18. Food and Drug Administration, in 21 CFR Part 189 Department ofHealth and Human Services, ed. (1995), vol. Docket Nos. 82P–0371 and91N–0165.
19. J. L. Annest, J. L. Pirkle, D. Makuc, J. W. Neese, D. D. Bayse andM. G. Kovar, N. Engl. J. Med., 1983, 308, 1373–1377.
20. Centers for Disease Control and Prevention, CDC Response to AdvisoryCommittee on Childhood Lead Poisoning Prevention Recommendationsin Low Level Lead Exposure Harms Children: a Renewed Call of PrimaryPrevention (Atlanta, GA, 2012).
21. Centers for Disease Control and Prevention (2012). Fourth NationalReport on Human Exposure to Environmental Chemicals, UpdatedTables, February 2012. Atlanta, Georgia.
22. Morbity and Mortality Weekly Report, 2012, 61, 383.23. I. H. Billick, A. S. Curran and D. R. Shier, Environ. Health Perspect.,
1980, 34, 213–217.24. P. R. Fine, C. W. Thomas, R. H. Suhs, R. E. Cohnberg and
B. A. Flashner, JAMA, 1972, 221, 1475–1479.
24 Chapter 1

25. C. J. Cohen, G. N. Bowers and M. L. Lepow, JAMA, 1973, 226,1430–1433.
26. J. L. Pirkle, D. J. Brody, E. W. Gunter, R. A. Kramer, D. C. Paschal,K. M. Flegal and T. D. Matte, JAMA, 1994, 272, 284–291.
27. Occupational Safety and Health Administration, in Subpart D - Occu-pational Health and Environmental Controls, 2011, vol. 1926.26(k) - Lead -Medical removal protection.
28. Occupational Safety and Health Administration, in Subpart Z - Toxic andHazardous Substances, 2011, vol. 1926.1025(k) - Lead - Medical removalprotection.
29. R. Rabin, D. R. Brooks and L. K. Davis, Am. J. Public Health, 1994, 84,1483–1485.
30. A. Okun, G. Cooper, A. J. Bailer, J. Bena and L. Stayner, Am. J. Ind.Med., 2004, 45, 558–572.
31. S. M. Levin and M. Goldberg, Am. J. Ind. Med., 2000, 37, 23–43.32. Agency for Toxic Substances and Disease Registry, ‘‘Toxicological profile
for lead’’ (Public Health Service, US Department of Health and HumanServices, Altanta, GA, 1999).
33. A. Young, ‘‘Long-gone lead factories leave poisons in nearby yards,’’USA Today, April 19, 2012.
34. A. Young and P. Eisler, ‘‘Some neighborhoods dangerously contaminatedby lead fallout,’’ USA Today, April 19, 2012.
35. R. Renner, Environ. Health Perspect., 2010, 118, A202–A208.36. R. Renner, Environ. Health Perspect., 2009, 117, A542–A547.37. C. A. Dooyema, A. Neri, Y. C. Lo, J. Durant, P. I. Dargan, T. Swarthout,
O. Biya, S. O. Gidado, S. Haladu, N. Sani-Gwarzo, P. M. Nguku,H. Akpan, S. Idris, A. M. Bashir and M. J. Brown, Environ. HealthPerspect., 2012, 120, 601–607.
38. Human Rights Watch. (February 7, 2012). ‘‘Nigeria: child lead poisoningcrisis.’’ Retrieved April 30, 2012, from http://www.hrw.org/news/2012/02/07/nigeria-child-lead-poisoning-crisis.
39. P. J. Landrigan, ‘‘The worldwide problem of lead in petrol.’’ Bull WorldHealth Organ, 2002, 80(10), 768.
40. A. Pruss-Ustun, L. Fewtrell, P. J. Landrigan and J. L. Ayuso-Mateos, inComparative Quantification of Health Risks: Global and Regional Burdenof Disease Attributable to Selected Major Risk Factors, eds. M. Ezzati,A. D. Lopex, A. Rodgers and C. J. L. Murray, World Health Organ-ization, Geneva, 2004, vol. 2, pp. 1495–1542.
41. D. Todd and H. Todd, Outcome and Influence Evaluation of the UNEPBased Partnership for Clean Fuels and Vehicles (PCFV), United NationsEnvironment Programme, Nairobi, Kenya, 2010.
42. G. Lean, ‘‘UN hails green triumph as leaded petrol banned throughoutAfrica,’’ The Independent, January 1, 2006.
43. E. Wilker, S. Korrick, L. H. Nie, D. Sparrow, P. Vokonas, B. Coull,R. O. Wright, J. Schwartz and H. Hu, J. Occup. Environ. Med., 2011, 53,850–855.
Exposure to Lead and Cognitive Dysfunction 25

44. H. Hu, M. Rabinowitz and D. Smith, Environ. Health Perspect., 1998,106, 1–8.
45. J. Bressler, K. A. Kim, T. Chakraborti and G. Goldstein, Neurochem.Res., 1999, 24, 595–600.
46. A. Garza, R. Vega and E. Soto, Med. Sci. Monit., 2006, 12, RA57–RA65.
47. T. I. Lidsky and J. S. Schneider, Brain, 2003, 126, 5–19.48. J. H. Schafer, T. A. Glass, J. Bressler, A. C. Todd and B. S. Schwartz,
Environ. Health Perspect., 2005, 113, 31–35.49. D. Kanduc, M. R. Rossiello, A. Aresta, C. Cavazza, E. Quagliariello and
E. Farber, Arch. Biochem. Biophys., 1991, 286, 212–216.50. J. R. Pilsner, H. Hu, A. Ettinger, B. N. Sanchez, R. O. Wright,
D. Cantonwine, A. Lazarus, H. Lamadrid-Figueroa, A. Mercado-Garcia,M. M. Tellez-Rojo and M. Hernandez-Avila, Environ. Health Perspect.,2009, 117, 1466–1471.
51. R. O. Wright, J. Schwartz, R. J. Wright, V. Bollati, L. Tarantini,S. K. Park, H. Hu, D. Sparrow, P. Vokonas and A. Baccarelli, Environ.Health Perspect., 2010, 118, 790–795.
52. J. Wu, M. R. Basha and N. H. Zawia, J. Mol. Neurosci., 2008, 34, 1–7.53. N. H. Zawia and M. R. Basha, Rev. Neurosci., 2005, 16, 325–337.54. N. H. Zawia, D. K. Lahiri and F. Cardozo-Pelaez, Free Radical Biol.
Med., 2009, 46, 1241–1249.55. G. G. Glenner and C. W. Wong, Biochem. Biophys. Res. Commun., 1984,
122, 1131–1135.56. D. J. Selkoe, C. R. Abraham, M. B. Podlisny and L. K. Duffy,
J. Neurochem., 1986, 46, 1820–1834.57. R. E. Tanzi, J. F. Gusella, P. C. Watkins, G. A. Bruns, P. St George-
Hyslop, M. L. Van Keuren, D. Patterson, S. Pagan, D. M. Kurnit andR. L. Neve, Science, 1987, 235, 880–884.
58. M. R. Basha, W. Wei, S. A. Bakheet, N. Benitez, H. K. Siddiqi, Y. W. Ge,D. K. Lahiri and N. H. Zawia, J. Neurosci., 2005, 25, 823–829.
59. J. Wu, M. R. Basha, B. Brock, D. P. Cox, F. Cardozo-Pelaez,C. A. McPherson, J. Harry, D. C. Rice, B. Maloney, D. Chen,D. K. Lahiri and N. H. Zawia, J. Neurosci., 2008, 28, 3–9.
60. H. Tohgi, K. Utsugisawa, Y. Nagane, M. Yoshimura, Y. Genda andM. Ukitsu, Brain Research. Molecular Brain Research, 1999, 70, 288–292.
61. V. N. Adonaylo and P. I. Oteiza, Toxicology, 1999, 132, 19–32.62. G. J. Quinlan, B. Halliwell, C. P. Moorhouse and J. M. Gutteridge,
Biochim. Biophys. Acta., 1988, 962, 196–200.63. L. J. Lawton and W. E. Donaldson, Biol. Trace Elem. Res., 1991, 28,
83–97.64. Z. Ni, S. Hou, C. H. Barton and N. D. Vaziri, Kidney Int., 2004, 66,
2329–2236.65. N. D. Vaziri, C. Y. Lin, F. Farmand and R. K. Sindhu, Kidney Int., 2003,
63, 186–194.66. M. Ahamed and M. K. Siddiqui, Clin. Chim. Acta, 2007, 383, 57–64.
26 Chapter 1

67. A. C. Anderson, S. M. Pueschel and J. G. Linakis, in Lead Poisoningin Children, eds. S. M. Pueschel, J. G. Linakis, A. C. Anderson and P.H.Brookes, Baltimore, 1996, pp. 75–96.
68. D. A. Fox, M. L. Campbell and Y. S. Blocker, Neurotoxicology, 1997, 18,645–664.
69. L. He, A. T. Poblenz, C. J. Medrano and D. A. Fox, J. Biol. Chem., 2000,275, 12175–12184.
70. E. K. Silbergeld, FASEB J., 1992, 6, 3201–3206.71. A. Navas-Acien, E. Guallar, E. K. Silbergeld and S. J. Rothenberg,
Environ. Health Perspect., 2007, 115, 472–482.72. A. McCaddon and C. L. Kelly, Med. Hypotheses, 1992, 37, 161–165.73. L. Parnetti, T. Bottiglieri and D. Lowenthal, Aging (Milano, Italy), 1997,
9, 241–257.74. J. M. Balbus-Kornfeld, W. Stewart, K. I. Bolla and B. S. Schwartz,
Occup. Environ. Med., 1995, 52, 2–12.75. R. K. Byers and E. E. Lord, Am. J. Dis. Child., 1943, 66, 471–494.76. D. C. Bellinger and A. M. Bellinger, J. Clin. Invest., 2006, 116, 853–857.77. W. J. Rogan, K. N. Dietrich, J. H. Ware, D. W. Dockery, M. Salganik,
J. Radcliffe, R. L. Jones, N. B. Ragan, J. J. Chisolm, Jr. andG. G. Rhoads, N. Engl. J. Med., 2001, 344, 1421–1426.
78. M. Meyer-Baron and A. Seeber, Arch. Toxicol., 2001, 75, 441–442.79. M.Goodman,N.LaVerda and J.Mandel,Arch. Toxicol., 2001, 75, 439–442.80. R. A. Shih, H. Hu, M. G. Weisskopf and B. S. Schwartz, Environ. Health
Perspect., 2007, 115, 483–942.81. W. F. Stewart and B. S. Schwartz, Am. J. Ind. Med., 2007, 50, 729–739.82. N. Khalil, L. A. Morrow, H. Needleman, E. O. Talbott, J. W. Wilson and
J. A. Cauley, Neuropsychology, 2009, 23, 10–109.83. W. F. Stewart, B. S. Schwartz, C. Davatzikos, D. Shen, D. Liu, X. Wu, A. C.
Todd, W. Shi, S. Bassett and D. Youssem, Neurology, 2006, 66, 1476–1484.84. B. Caffo, S. Chen, W. Stewart, K. Bolla, D. Yousem, C. Davatzikos and
B. S. Schwartz, Am. J. Epidemiol., 2008, 167, 429–437.85. B. S. Schwartz, B. Caffo, W. F. Stewart, H. Hedlin, B. D. James,
D. Yousem and C. Davatzikos, J. Occup. Environ. Med., 2010, 52, 407–414.86. M. G. Weisskopf, H. Hu, R. V. Mulkern, R. White, A. Aro, S. Oliveira
and R. O. Wright, Environ. Health Perspect., 2004, 112, 620–625.87. T. J. Hsieh, Y. C. Chen, C. W. Li, G. C. Liu, Y. W. Chiu and
H. Y. Chuang, Environ. Health Perspect., 2009, 117, 941–945.88. R. Brookmeyer, S. Gray and C. Kawas, Am. J. Public Health, 1998, 88,
1337–1342.89. L. E. Hebert, P. A. Scherr, J. L. Bienias, D. A. Bennett and D. A. Evans,
Arch. Neurol., 2003, 60, 1119–1122.90. R. T. Linn, P. A. Wolf, D. L. Bachman, J. E. Knoefel, J. L. Cobb,
A. J. Belanger, E. F. Kaplan and R. B. D’Agostino, Arch. Neurol., 1995,52, 485–490.
91. B. J. Small, L. Fratiglioni, M. Viitanen, B. Winblad and L. Backman,Arch. Neurol., 2000, 57, 839–844.
Exposure to Lead and Cognitive Dysfunction 27

92. D. A. Bennett, R. S. Wilson, J. A. Schneider, D. A. Evans, L. A. Beckett,N. T. Aggarwal, L. L. Barnes, J. H. Fox and J. Bach, Neurology, 2002, 59,198–205.
93. C. H. Kawas, M. M. Corrada, R. Brookmeyer, A. Morrison, S. M. Resnick,A. B. Zonderman and D. Arenberg, Neurology, 2003, 60, 1089–1093.
94. M. Mazumdar, D. C. Bellinger, M. Gregas, K. Abanilla, J. Bacic andH. L. Needleman, Environ. Health, 2011, 10, 24.
95. M. Mazumdar, W. Xia, O. Hofmann, M. Gregas, S. Ho Sui, W. Hide,T. Yang, H. L. Needleman and D. C. Bellinger, Environ. Health Perspect.,2012, 120(5), 702–707.
96. S. Gao, Y. Jin, F. W. Unverzagt, F. Ma, K. S. Hall, J. R. Murrell,Y. Cheng, J. Shen, B. Ying, R. Ji, J. Matesan, C. Liang andH. C. Hendrie, J. Gerontol., Ser. A, 2008, 63, 635–641.
97. E. van Wijngaarden, P. C. Winters and D. A. Cory-Slechta, Neuro-toxicology, 2011, 32, 110–115.
98. F. Barbosa, Jr. and J. E. Tanus-Santos, et al., A critical review ofbiomarkers used for monitoring human exposure to lead: advantages,limitations, and future needs. Environ. Health Perspect., 2005, 113(12),1669–1674.
99. D. Smith, M. Hernandez-Avila, M. M. Tellez-Rojo, A. Mercado andH. Hu, Environ. Health Perspect., 2002, 110, 263–268.
100. E. van Wijngaarden, J. R. Campbell and D. A. Cory-Slechta, Neurotox-icology, 2009, 30, 572–580.
101. J. Weuve, S. A. Korrick, M. A. Weisskopf, L. M. Ryan, J. Schwartz,H. Nie, F. Grodstein and H. Hu, Environ. Health Perspect., 2009, 117,574–580.
102. K. Bandeen-Roche, T. A. Glass, K. I. Bolla, A. C. Todd andB. S. Schwartz, Epidemiology, 2009, 20, 831–839.
103. M. G. Weisskopf, H. Hu, D. Sparrow, R. E. Lenkinski and R. O. Wright,Environ. Health Perspect., 2007, 115, 519–523.
104. K. Kantarci, C. R. Jack, Jr., Y. C. Xu, N. G. Campeau, P. C. O’Brien,G. E. Smith, R. J. Ivnik, B. F. Boeve, E. Kokmen, E. G. Tangalos andR. C. Petersen, Neurology, 2000, 55, 210–217.
105. D. A. Cory-Slechta, S. Stern, D. Weston and J. L. Allen, S. Liu, Toxicol.Sci., 2010, 117, 427–438.
106. D. A. Cory-Slechta, M. B. Virgolini, A. Rossi-George, M. Thiruchelvam,R. Lisek and D. Weston, Basic Clin. Pharmacol. Toxicol., 2008, 102,218–227.
107. M. B. Virgolini, A. Rossi-George, R. Lisek, D. D.Weston, M. Thiruchelvamand D. A. Cory-Slechta, Neurotoxicology, 2008, 29, 812–827.
108. S. J. Lupien, M. de Leon, S. de Santi, A. Convit, C. Tarshish, N. P. Nair,M. Thakur, B. S. McEwen, R. L. Hauger and M. J. Meaney, Nat.Neurosci., 1998, 1, 69–73.
109. B. S. McEwen and P. J. Gianaros, Annu. Rev. Med., 2011, 62, 431–445.110. M. B. Virgolini, M. R. Bauter, D. D. Weston and D. A. Cory-Slechta,
Neurotoxicology, 2006, 27, 11–21.
28 Chapter 1

111. B. B. Gump, P. Stewart, J. Reihman, E. Lonky, T. Darvill, P. J. Parsonsand D. A. Granger, Environ. Health Perspect., 2008, 116, 249–255.
112. M. B. Virgolini, A. Rossi-George, D. Weston and D. A. Cory-Slechta,Neurotoxicology, 2008, 29, 928–939.
113. P. J. Bushnell, S. E. Shelton and R. E. Bowman, Bull. Environ. Contam.Toxicol., 1979, 22, 819–826.
114. T. A. Glass, K. Bandeen-Roche, M. McAtee, K. Bolla, A. C. Todd andB. S. Schwartz, Am. J. Epidemiol., 2009, 169, 683–692.
115. J. L. Peters, M. G. Weisskopf, A. Spiro, 3rd, J. Schwartz, D. Sparrow,H. Nie, H. Hu, R. O. Wright and R. J. Wright, Environ. Health Perspect.,2010, 118, 505–510.
116. W. F. Stewart, B. S. Schwartz, D. Simon, K. Kelsey and A. C. Todd,Environ. Health Perspect., 2002, 110, 501–505.
117. L. Bertram, M. B. McQueen, K. Mullin, D. Blacker and R. E. Tanzi, Nat.Genet., 2007, 39, 17–23.
118. F. T. Wang, H. Hu, J. Schwartz, J. Weuve, A. S. Spiro, D. Sparrow,H. Nie, E. K. Silverman, S. T. Weiss and R. O. Wright, Environ. HealthPerspect., 2007, 115, 1210–1215.
119. J. G. Wetmur, A. H. Kaya, M. Plewinska and R. J. Desnick, Am. J. Hum.Genet., 1991, 49, 757–763.
120. J. G. Wetmur, Environ. Health Perspect., 1994, 102(Suppl 3), 215–219.121. A. O. Onalaja and L. Claudio, Environ. Health Perspect., 2000, 108(Suppl
1), 23–28.122. S. E. Chia, E. Yap and K. S. Chia, Neurotoxicology, 2004, 25, 1041–1047.123. T. Sakai, Y. Morita, T. Araki, M. Kano and T. Yoshida, Am. J. Ind.
Med., 2000, 38, 355–360.124. P. Sithisarankul, B. S. Schwartz, B. K. Lee, K. T. Kelsey and
P. T. Strickland, Am. J. Ind. Med., 1997, 32, 15–20.125. J. Weuve, K. T. Kelsey, J. Schwartz, D. Bellinger, R. O. Wright, P. Rajan,
A. Spiro, 3rd, D. Sparrow, A. Aro and H. Hu, Occup. Environ. Med.,2006, 63, 746–753.
126. P. Rajan, K. T. Kelsey, J. D. Schwartz, D. C. Bellinger, J. Weuve,A. Spiro, 3rd, D. Sparrow, T. J. Smith, H. Nie, M. G. Weisskopf, H. Huand R. O. Wright, J. Occup. Environ. Med., 2008, 50, 1053–1061.
127. E. F. Krieg, Jr., M. A. Butler, M. H. Chang, T. Liu, A. Yesupriya,M. L. Lindegren and N. Dowling, Neurotoxicol. Teratol., 2009, 31, 364–371.
128. G. Zheng, L. Tian, Y. Liang, K. Broberg, L. Lei, W. Guo, J. Nilsson,I. A. Bergdahl, S. Skerfving and T. Jin,Neurotoxicology, 2011, 32, 374–382.
129. S. D. Grosse, T. D. Matte, J. Schwartz and R. J. Jackson, Environ. HealthPerspect., 2002, 110, 563–569.
130. B. P. Lanphear, Environ. Health Perspect., 2007, 115, A484–A485.131. B. P. Lanphear, R. Hornung, J. Khoury, K. Yolton, P. Baghurst,
D. C. Bellinger, R. L. Canfield, K. N. Dietrich, R. Bornschein, T. Greene,S. J. Rothenberg, H. L. Needleman, L. Schnaas, G. Wasserman,J. Graziano and R. Roberts, Environ. Health Perspect., 2005, 113,894–899.
Exposure to Lead and Cognitive Dysfunction 29

132. Advisory Committee on Childhood Lead Poisoning Prevention, ‘‘LowLevel Lead Exposure Harms Children: a Renewed Call for PrimaryPrevention’’ (Centers for Disease Control and Prevention, 2012).
133. B. S. Schwartz and H. Hu, Environ. Health Perspect., 2007, 115, 451–454.134. American College of Occupational and Environmental Medicine Task
Force on Blood Lead, ‘‘Recommendation to OSHA Regarding BloodLead Levels’’ (American College of Occupational and EnvironmentalMedicine, 2010).
135. P. Muntner, A. Menke, K. B. DeSalvo, F. A. Rabito and V. Batuman,Arch. Intern. Med., 2005, 165, 2155–2161.
136. K. R. Mahaffey, J. L. Annest, J. Roberts and R. S. Murphy, N. Engl. J.Med., 1982, 307, 573–579.
137. R. A. Shih, T. A. Glass, K. Bandeen-Roche, M. C. Carlson, K. I. Bolla,A. C. Todd and B. S. Schwartz, Neurology, 2006, 67, 1556–1562.
138. J. L. Peters, L. D. Kubzansky, A. Ikeda, A. Spiro, 3rd, R. O. Wright,M. G. Weisskopf, D. Kim, D. Sparrow, L. H. Nie, H. Hu and J. Schwartz,Am. J. Epidemiol., 2011, 174, 1345–1353.
139. MMWR Morb Mortal Wkly Rep., 2005, 54, 513–516.140. Centers for Disease Control and Prevention, ‘‘Fourth National Report on
Human Exposure to Environmental Chemicals, Updated Tables,February 2012’’ (Atlanta, Georgia, 2012).
141. M. Bouchard, F. Laforest, L. Vandelac, D. Bellinger and D. Mergler,Environ. Health Perspect., 2007, 115, 122–127.
30 Chapter 1

CHAPTER 2
Cognitive Deterioration andRelated Neuropathology in OlderPeople with Alzheimer’s Diseasecould Result from Life-LongExposure to AluminiumCompounds
J. R. WALTON
University of New South Wales, St George Hospital Campus, Sydney,NSW 2217, AustraliaE-mail: [email protected]
2.1 Introduction
Some records are available that reliably describe the health of older humans inthe early industrial era. A monograph entitled Old Age, published inCambridge in 1889, and papers published in the British Medical Journalbetween 1886 and 1889 describe results of a health survey carried out by theBritish Medical Council,1 where British general practitioners systematicallyassessed the health of their oldest patients during the mid-1880s. The studygroup consisted of almost 900 subjects, aged 80 years and older, including 74centenarians.
Issues in Toxicology No. 16
Aging and Vulnerability to Environmental Chemicals: Age-related Disorders and their Origins in
Environmental Exposures
Edited by Bernard Weiss
r The Royal Society of Chemistry 2013
Published by the Royal Society of Chemistry, www.rsc.org
31

The author states: ‘‘[Dementia, the] saddest state of all, was witnessed only intwo of our centenarians. . . Indeed, the brain in many held out as well or betterthan other organs – which may be regarded one of the bright rays, if not thebrightest, in the centenarian landscape’’. In contrast, a study conducted at thebeginning of the 21st century found that 88%, of all centenarians, or 15 out ofthe 17, living in three Dutch towns with populations of at least 250 000 haddementia and the other two could not be examined.2 This dementia increasecould relate to living conditions that changed during the 20th century.
Before the industrial era, most humans lived in villages, towns anddeveloping cities, where they consumed food produced from their own gardensor market gardens, and from local or traded farm crops. They drank waterfrom naturally-occurring sources (rivers, springs and ground water from wells)and without chemical treatment. Urban life today has changed again with theincreasing consolidation of industrialized products and practices, includingdrinking water treatment, industrialized food production and marketing,pharmaceutical treatments (as opposed to herbal treatments), and greaterreliance on vaccinations and topical applications to treat or prevent medicalproblems.
Such change in human behaviors can significantly alter the prevalence of adisease in a relatively short time span, such as one to three decades. Between1997 and 2010, health behaviors, such as dietary choices and rates of physicalexercise, increased the number of overweight or obese adults from 42% to 54%in the Australian state of New South Wales. The number of overweight orobese adults correlates with a greater prevalence of self-reported diabetes,which rose from 4.7% to 7.4% over the same 13 year time period in this largelyurban population.3
In 1907, Alzheimer described a 51–year old woman as the first known case ofthe disease that now bears his name as a new phenomenon, stating, ‘‘The casepresented even in the clinic such a different picture, that it could not becategorised under known disease headings, and also anatomically it provided aresult which departed from all previously known disease pathology.’’4 Severalyears later, Alzheimer realized that Alzheimer’s Disease (AD) also affects olderpatients, writing, ‘‘Similar cases of disease appear in advanced age’’.5 Over the20th century, the prevalence of AD markedly increased in industrializedcountries with little if any prevalence in rural regions of some developingcountries.6,7 Estimates indicate that 35.6million people throughout the worldare currently living with dementia.8 Around 75% of this population,9 or27million people, are currently affected by AD.
Epidemiological studies based on identical and fraternal twin pairs haveconsistently shown that AD causality has both environmental and geneticcomponents.10–12 The vast majority of AD patients have late-onset ‘‘sporadicAD’’, lacking the mutations found in familial AD, a minority subgroup withautosomal dominant inheritance and early-onset AD. The observation that oldage is a main risk factor for AD has prompted the suggestion that AD involvesaccrual of a toxic substance that produces biological insult on brain tissue overtime.13 Aluminium (Al) is a candidate for that role.
32 Chapter 2

2.2 The Context for Aluminium in AD Causality
Aluminium, an element that is non-essential to cell metabolism, is classified asdefinitely neurotoxic to humans.14 Al salts have been linked to AD causalitysince 1973,15 and they remain the most likely candidate for AD’s environmentalcomponent. The genetic component may represent how well the individual’sbody is able to absorb, exclude or chelate Al and limit its effects therein. Al saltsare now available for many applications in everyday life.
In 1906, the US Congress passed the Food and Drugs Act, which prohibitsthe use of poisonous agents in confectionery and for coloring food. Respon-sibility for enforcing this act was given to the United States Food and DrugAdministration (FDA), established in 1927.16
There were warnings against Al usage both well before and around thattime.17,18 For example, a Columbia University biochemist wrote: ‘‘During aperiod of about seven years I have occasionally conducted experiments on theeffects of aluminium salts. These studies have convinced me that the use in foodof alum or any other aluminium compound is a dangerous practice. That thealuminium ion is very toxic is well known. That ‘aluminized’ food yields solublealuminium compounds to gastric juice (and stomach contents) has beendemonstrated. That such soluble aluminium is in part absorbed and carried toall parts of the body by the blood can no longer be doubted. That the organismcan ‘tolerate’ such treatment without suffering harmful consequences has notbeen shown. It is believed that the facts in this paper will give emphasis to myconviction that aluminium should be excluded from food’’.19 The US FDArates Al as ‘‘GRAS’’ (Generally Recognized As Safe), despite the earlywarnings about Al and subsequent publications on Al neurotoxicity.
Government regulatory agencies currently allow various Al compounds to beincluded in store-bought and take-away foods, bottled waters and urbandrinking water supplies. Al compounds have versatile properties and servemany useful functions in these applications: as anti-caking agents in salt, coffeewhitener, pancake mix and other powdered foods, emulsifiers and meltingagents in cheeses, clarifying agents in water, puddings and other processedfoods where precipitates may form, pickling agents, meat binders for sausagesand luncheon meats, hardening agents for candied fruits, gravy and saucethickeners, rising agents in baking powder, self-raising flour and baked goods,as buffering and neutralizing agents and as an agent that binds food dyes toconfectionaries to make them colorful.
Americans, representative of humans living in a contemporary westernizedsociety, consume 1–10 mg Al each day from natural sources such as fresh fruits,vegetables and meat.20 In addition, 50% of Americans are now estimated toconsume up to 25mg per day, 45% between 25 and 95 mg per day, and 5%more than 95 mg per day in the form of additives.20,21 For an average-sized (70kg) human, these amounts involve up to 0.4mg kg�1 bodyweight (bw) per day,between 0.4 and 1.5mg kg�1 bwper day, and more than 1.5mg kg�1 bw per dayor more, respectively. Higher and lower estimates of total dietary Al ingestionhave been reported. The described figures are more accurate since these
Life-Long Exposure to Aluminium Compounds may Cause Alzheimer’s Disease 33

estimates consider survey data from food manufacturers listing Al quantityadded.22
Other significant sources of Al exposure are Al-based pharmaceuticals,topical applications, Al-adjuvanted vaccines and certain other medicaltreatments, including some that have caused fatal encephalopathies.23,24
2.2.1 Some Ingested Al is Absorbed into Blood and Taken up by
the Brain
2.2.1.1 Al Absorption into Plasma
The body’s first and main line of defence against dietary Al is the mucus layerthat lines the gastrointestinal tract (GIT). GIT mucus traps most ingested Al,including precipitates of larger Al complexes25 that are excreted together withenterocyes that have sloughed from the GIT lining and undigested food.26
Soluble Al salts (e.g. Al sulfate, or ‘‘alum’’, and Al chloride) more readilytraverse the mucus layer and are more easily absorbed than poorly soluble salts(e.g. Al phosphate). Salts of Al with food acids, in particular Al citrate, Allactate and Al maltolate, remain soluble over a relatively wide pH range,including neutrality. Some Al-food acid salts, previously available only inminute amounts, are now synthesized for use as food additives. Even poorlysoluble forms can raise plasma Al levels in normal humans.27 As we shall see,routine Al exposure, particularly at the high end of the human dietary Al range,can overwhelm the protective barrier of the GIT mucus layer.
Normally, 0.1% to 0.3% of ingested Al passes through the mucus layer andenterocyte lining of the GIT to reach the circulation.28,29 Some plasma Al isavailable for uptake into the brain and other tissues. Al values in the plasma orserum of typical humans are usually 6 mgL�1 or less.30 Around 80–85% ofabsorbed Al binds to transferrin (Al-transferrin), an iron transport protein,about 10% to albumin and 5% to low molecular weight species, mainly citrate,that are excretable by the kidneys.31,32
Many experiments have shown that some asymptomatic humans andlaboratory animals have plasma or serum Al levels that are 2- to 3-fold higherthan others after ingesting a standardized amount of Al (for an example, seeFigure 2.133). Efficient Al absorption may increase an individual’s susceptibilityto chronic Al neurotoxicity and/or AD.
2.2.1.2 Al Uptake into the Brain
Approximately 0.01% of plasma Al passes through the blood-brain barrier intothe brain.34 Al uptake into the human brain from drinking a single glass of alum-treated water was simulated by gavaging rats with nanomolar quantities ofaqueous 26Al, a synthetic radioactive tracer.35 Measurable 26Al levels were detectedin the rat brains two weeks later.The presence of 26Al in brain tissue can only beexplained by 26Al exposure, since it is virtually absent in nature. Other laboratorieshave confirmed brain 26Al uptake following oral 26Al consumption.36,37
34 Chapter 2

Al exposure occurs continuously throughout life. Many newborn humans,with their immature blood-brain barriers, are exposed to Al. Sucklings take upAl from their mothers’ milk38 and from soy-based infant formulae that have Allevels of up to 700 mgL1.39 Infants are injected with a course of Al-adjuvanteddiphtheria-pertussis-tetanus (DPT) vaccines.40 Injections bypass the mucus andenterocyte barriers of the intestine, increasing the exposure level to a given doseof bioavailable Al up to 1000 fold. Intraperitoneal injection of a simulated Alhydroxide-adjuvanted DPT vaccine into mice produces a surge in their brain Allevel that peaks at 2–3 days post-injection.41
Each individual exposure, from one vaccine with an Al adjuvant, or one mealcontaining Al-rich foods, might produce an insignificant effect with respect tothe risk of developing dementia; but above all, cumulative exposure frommultiple sources,—such as decades of exposure to alum-treated drinkingwater—leads to slow but progressive Al increase in the brain. Brain Almeasurements confirm that more Al enters the brain than exits, resulting in agradual net Al accumulation in the hippocampus and cortex with advancing age,even in the brains of non-demented controls.15,42–44 Brain concentrations of theessential metals remain stable or decrease with age.45 The significant age-relatedincrease in brain Al that occurs reflects accumulation from the environment.
Figure 2.1 Plasma 26Al levels in humans who drank 26alum-treated water and then26alum-treated water supplemented by silica. Silica lowers the amount ofAl absorbed. Note the spread of values from A to E. Notice that theranking of subjects’ absorption values is almost in the same order underboth conditions.Reproduced from reference 33 with permission from Elsevier.
Life-Long Exposure to Aluminium Compounds may Cause Alzheimer’s Disease 35

Al is already the recognized cause of another dementia, dialysis encepha-lopathy, or dialysis dementia.46 It is also a contributing factor to otherdementias, including amyotrophic lateral sclerosis/parkinsonism-dementia(ALS/PD) of Guam47–49 and Balint’s syndrome, which results from occupa-tional Al exposure.50
2.2.1.3 Al accumulates in Aged Pyramidal Neurons eitherWithout or With Neurofibrillary Tangles (NFTs)
Al can be visualized in most large pyramidal cells, particularly in the cortex andhippocampus of aged humans and laboratory animals, processed either withthe Walton histological stain for Al or a monoclonal antibody stain for Al.51–54
Al is first recognizable in the nucleolus and later in the condensed chromatin ofpost-mortem human pyramidal cells. As Al continues to accumulate, itdistributes throughout the nucleoplasm of cells without NFTs.52–54 Eighty-ninepercent of 26Al in rat neurons was observed to be chromatin-bound followingsubcutaneous injection of 26Al.55 Rat and human hippocampal and corticalpyramidal neurons without NFTs show the same stages of nuclear Alaccumulation (Figure 2.2).54
Figure 2.2 Stages of Al accumulation in rat and human hippocampal neurons. StageI: All sections of hippocampal pyramidal neurons from older humanbrain, that contained a visible nucleolus, exhibited at least stage I Alaccumulation (staining only the nucleolus). Neuronal shape appearsnormal in stage I cells. Stages II and III: The nucleoplasm progressivelydeepens in hue, appearing pink at stage II and purple at stage III. Thenucleus and overall cell shape show subtle shrinkage and dendritic changesat these stages. Stages IV and V: By stage IV, the nuclear Al appears brightmagenta. The cell is obviously shrunken and its neurites appear tortuousand retracted. At stage V, Al is distributed throughout the nucleus pluscytoplasm. These deformed cells are still viable (exhibiting neither necrosisnor apoptosis) but are apparently dysfunctional as they no longer immu-nostain for neuron-specific proteins. Magnification bar¼ 5mM.Reproduced from reference 54 with permission from Elsevier.
36 Chapter 2

Al also appears in the cytoplasm of cells able to form NFTs, specificallystaining these fibrillar structures.56 NFT formation affects only a portion of thepyramidal cells in the AD hippocampal CA1 field and cortex. Pyramidal cellsthat either exhibit Al in the form of NFTs or throughout the nucleus (stages IVand V) first appear sporadically, then in clusters and eventually as large bandsof cells.54,57–59 Al-affected cell bands are referred to here as ‘‘lesions’’. Beforeexploring potential consequences of these lesions it is useful to review thenature of Al toxicity.
2.3 Al Neurotoxicity
Ionic Al (Al31) is regarded as the most toxic form of Al. Al31 has uniquephysical properties. Neurotoxicity of Al31 usually requires chronic exposure asmost Al activity depends on its accumulation in brain cells, unlike many othertoxicants and toxins that produce acute systemic effects.60
2.3.1 Al Disrupts Cell Metabolism by Substituting for Essential
Metal Ions in Key Regulatory Proteins
Al31 is a small ion with a high (3þ) fixed charge.61 Picomolar quantities of Alcan successfully compete with the mM quantities of Mg21 that occur in cells.62
The small size of Al allows it to substitute for essential metal ions such as Mg21
in active sites of proteins and protein co-factors such as ATP and GTP.63,64
Mg21 regulates over 300 proteins, giving Al31 many opportunities to disruptcellular metabolism. The larger electrochemical charge of Al31 results in a muchhigher association constant than that of Mg21 for Mg21 binding sites. Theassociation constant of Al for GTP and transducin is approximately 107 timeshigher than that for Mg21, the physiological regulator of microtubules withinneurons. This allows Al31 to substitute for Mg21 in the Mg21/GTP/tubulincomplex,64 with damaging consequences for microtubule function.
Al31 dissociates from biological ligands 105 times more slowly than Mg21
and 108 times more slowly than Ca21.61 Rapid dissociation is required forbiological reactions, and the slow dissociation of Al31 from its biologicalligands precludes Al31 from being useful in cellular metabolism.
2.3.2 Al Produces Oxidative Damage in Cells
Al31 is a highly reactive ion. The nearly maximal charge density of ionic Alpromotes its binding to almost any oxygen or nitrogen atom.60 Al generatesreactive oxygen species (ROS) despite its non-redox status.65 Al31 acts as astrong Lewis acid, attracting pairs of electrons from oxygen in phosphates andother small ligand groups. Al is thus a pro-oxidant, both on its own andsynergistically with iron.65–67 In view of its Lewis acidity, AlO2
d21 is expectedto be a stronger oxidant than either HO2
�d or O2�d.67 Al facilitates the
production of the superoxide ion (O2�d) in biological oxidations that can be
Life-Long Exposure to Aluminium Compounds may Cause Alzheimer’s Disease 37

photochemical, enzymatic, chemical or biomolecular.67–69 Al oxidativereactions are countered by superoxide dismutase and vitamin E.67,70,71
Al31 cross-links proteins with proteins, proteins with nucleic acids, andnucleic acids with each other.72 Al has polymerizing properties, e.g. as aZiegler-Natta catalyst. Al has a particularly high affinity for myelinmembranes73 and Al incorporation in membranes changes their fluidity. Al31
can thus a substitute for essential metals in important regulatory reactions incells and cause oxidative damage.
2.3.3 All Epidemiological Studies Evaluating the Al
Exposure-AD Link have been Based on Crude Estimates
of Single Sources of Al Exposure and are Rife with
Confounders
The highest standard of proof is generally considered to be a prospective,well-designed, randomly-controlled study, based on a large number ofparticipants. We need to consider whether this standard is reasonable andnecessary for assessing the toxicity of neurotoxicants, particularly those with along prodromal phase.
Many epidemiological studies have already investigated the putative rela-tionship between Al ingestion and an increased risk for AD (reviewedby Flaten).74 Most of these studies have shown an increased risk of AD in peoplewho have routinely consumed water containing more than 0.1mgL�1Al.
To date, the most rigorous of these studies was conducted by Rondeau andher colleagues75 and consisted of a prospective trial carried out on a sample of1925 normal subjects at baseline, with 15 years of follow-up. The study showedthat the risk for cognitive decline was significantly greater in subjects that livedin districts supplied by water with an Al content greater than 0.1 mgL�1 and/ordrank bottled waters clarified by alum, compared to those living in a regionsupplied by water with a lower Al content (p¼ 0.005).75 Food Al was not takeninto account.
A single study has investigated AD risk in subjects who routinely consumedprocessed foods with high levels of Al additives. In this case, water Al levelswere not taken into account. The crude odds ratio of this small case-controlstudy was equal to 8.6 when adjusted for covariates.76
Most routine exposure to Al is from the diet: from food, water and Aladditives. Each of the epidemiological studies performed to date has inves-tigated a single source of Al exposure, usually Al levels in drinking water. Whiletheir almost-consistent results suggest a relationship between chronic Alexposure and AD, all are plagued by confounding factors that make therelationship appear considerably weaker than it probably is.
Epidemiological studies that take into account human exposure to totaldietary Al31 from both food and drinking water have yet to be carried out.Such studies are necessary to control for confounding. Otherwise, studies basedon people who live in a region with low Al content in their municipal drinking
38 Chapter 2

water supply (the low Al group) may consume a fast food diet with Al-richfoods and drink alum-treated bottled water; this would elevate their plasmaAl levels and cancel out the potentially beneficial effect of low Al content inthe public drinking water supply. Thus, unless total Al ingestion fromall dietary Al sources is taken into consideration, the results are severelyconfounded.
2.3.4 A Randomly Controlled Human Study of Total Chronic Al
Exposure would be Impractical to Perform and Most
Likely be Unethical
Information as to whether or not the total dietary amounts of Al thatcontemporary humans routinely ingest can be safely tolerated over the life spancould theoretically be obtained in a human study that requires the participantsto measure and record the total amount of Al they consume each day from theirfood and beverages, including water and Al additives. An accurate study wouldtake five to eight decades to complete. This should be sufficient to learnwhether, and how, people are affected in old age from continuous Al exposureover the life span.
Such studies would be made more difficult by dietary products that areconstantly entering and leaving the marketplace. Humans have very differentlifestyles and are exposed to Al in many different forms, some without theirknowledge. Current labeling laws do not require the Al content of packagedfoods to be revealed in milligram quantities. Al additives on food packaging areonly identified by code numbers in some countries. Thus, the task of deter-mining how much Al one routinely consumes from their foods and beverageswould be close to insurmountable.
The second approach would require groups of blinded human subjects toadhere to one of several prescribed diets that provide specific amounts of low,medium and high levels of Al additives, contained in measured amounts of foodand drinking water, throughout their youth, middle age and old age. If true thatAD is a form of human aluminum neurotoxicity, a dose-dependent effectshould occur with more subjects in the high Al group developing AD. Thisapproach would obviously be impractical to administer and unethical toperform. Nevertheless, that is what would be needed for a human study toconvincingly prove that aluminum causes AD.
Participants of the study would have to restrict their caloric intake to theprescribed dietary regimen over the five or more decades of the study and wouldalso have to measure and record the amounts of food and water they consume.
Ganrot60 notes the difficulty in performing such a study, of a disease withinsidious onset that requires decades of exposure to an etiological agent(to which most humans are abundantly exposed) and to then link the disease tothat agent.
It is therefore necessary, and much more convenient, to rely on long-termstudies involving surrogate animals given known amounts of Al at equivalent
Life-Long Exposure to Aluminium Compounds may Cause Alzheimer’s Disease 39

levels and duration to those experienced by humans, thus mimicking human Alexposure conditions.
2.3.5 Surrogate Animals are Required to Investigate the Effects
of Chronic Exposure to the Al Neurotoxicant
Towards this end we carried out two animal studies: a pilot study77 with two ratgroups, and a main study78 with three rat groups. Both were designed asrandomly-controlled longitudinal studies to learn whether outbred Wistar ratscould age successfully while ingesting known quantities of Al—at equivalentlevels to those routinely ingested by humans from their foods and beverages,including alum-treated drinking water—throughout much of their lives. Altreatment was postponed until early middle age in order to ensure normal braindevelopment. Inclusion criteria included: (1) survival till at least age 28 monthsand (2) ability to complete the 11–choice rewarded continuous alternationT-maze task within five minutes. The experimental design and timeline fortreatment of rats in the main study are shown in Figure 2.3.
At age 6 months, the rats were trained to perform the continuous alternationT-maze task,78 which is commonly used to assess memory performance.79 Theywere fed twice weekly from this age onwards, with their diet consisting ofmeasured amounts of a feed formulated for mature animals, in quantities justsufficient to maintain their bodies at a healthy weight of 500� 50 g. The Alcontent of their feed was 9 ppm. With this protocol the rats drank some wateron an empty stomach77,78 to simulate its consumption by humans, who oftendrink water on a fasted stomach. The low pH of the empty stomach increasesthe ionic Al31 level of ingested alum-treated drinking water and facilitates Al31
absorption.36,61 Some rats on this protocol developed cognitive deterioration inold age after chronic Al exposure; this is described in more detail in the nextsection.
Figure 2.3 Experimental design and timeline for treatment of the three rat groups.Reproduced from reference 78 with permission from Elsevier.
40 Chapter 2
2.4 Evidence that Supports Al Causality of AD
2.4.1 Cognitive Deterioration in Animals with Chronic Al
Neurotoxicity and Humans with AD is Associated with More
Efficient Al Absorption and Higher Serum/Plasma Al Levels
2.4.1.1 Al Absorption in Humans with AD26Al absorption measurements showed that AD-affected humans absorbed 1.4times as much 26Al from a standardized 26Al dose contained in an orange drinkthan age-matched non-demented controls.80 Plasma and serum Al levels ofAD-affected humans were also reported to be higher than in those withoutAD.30,81–84 Moreover, serum Al levels were higher in patients with AD than incontrols with vascular dementia.85 Only one small study was unable to findsuch difference. This study has very low statistical power so it is susceptible to atype II error, i.e. a false negative error.86
Subjects with Down’s syndrome (DS) absorbed 6 times more 26Al than age-matched controls from a dietary Al dose (140 ng) added to a citric drink. TheDS group also absorbed four times more Al than age-matched controls from apharmacological (antacid-sized) dose equating to 280 mg of Al with citrate.87
DS is commonly regarded as a human model for AD in that DS is associatedwith an unusually high rate of dementia.88 DS brains exhibit AD neuro-pathology prematurely, by 50 years of age.89
2.4.1.2 Al Absorption in Rats that Develop CognitiveDeterioration
The serum Al values of the three rat groups78 in the main study were measuredand found to be proportional to the rats’ Al dose levels. The high Al group hadserum levels that were significantly higher than those of the low Al group(po0.05). The latter remained cognitively intact. The range of serum Al valuesfor rats in the high Al group was much larger than those of the two lower dosegroups. Rats that developed cognitive deterioration also had significantlyhigher serum Al levels than the low Al rats (po0.01). Moreover, the rats thatdeveloped cognitive deterioration in the intermediate and high Al groups werethose with the highest serum Al levels in their treatment group, implying moreefficient Al absorption than the others.78
2.4.2 Certain Brain Regions Show More Damage than Others in
AD and Chronic Al Neurotoxicity
2.4.2.1 Damaged Cell Types and Brain Regions in AD
Pyramidal cells that project over great distances—especially those located in thetransentorhinal and entorhinal cortex, hippocampus, subiculum, temporal,parietal and frontal cortices, amygdala, olfactory bulb, nucleus basalis, locus
Life-Long Exposure to Aluminium Compounds may Cause Alzheimer’s Disease 41

coeruleus and the dorsal raphe nucleus—are particularly damaged in AD.90,91
These are the regions in humans that show NFT damage.90,92,93 These brainregions are connected by cortico-cortical projections, implying that pathologyin AD brains may spread across synaptic connections.58
2.4.2.2 Pyramidal Cells and Stellate Cells in Brain RegionsPreferentially Damaged in Humans and Rats withChronic Al Neurotoxicity and Humans with RenalFailure Associated with High Serum Al Levels are theSame or Equivalent to those Preferentially Damagedin AD
Al is most prone to concentrate in large pyramidal cells, that project over greatdistances, in the entorhinal cortex, hippocampus, subiculum, temporal, parietaland frontal cortices, amygdala, nucleus basalis, olfactory lobe and other AD-vulnerable brain regions of experimental animals subjected to chronic Alexposure.78,94 Al also deposits in these brain regions of humans with renalfailure, and who have had high serum Al levels arising from their use of Al-based phosphate binders and/or dialysis with Al-contaminated water, despitetheir limited renal capacity for efficient Al removal.95,96
Fe-transferrin and Al-transferrin complexes circulating in the plasma attachto transferrin receptors located on the surface of blood-brain barriercapillaries.97 The transferrin complexes transcytose the endothelium and enterthe neuropil, where they can attach to, and become internalized by, transferrinreceptors on large pyramidal cells.98
Elevated Al levels in AD cortex and hippocampus have been demonstratedby instrumental Al measurements,15,44,99 as well as staining techniques.52–54
2.4.2.3 Al Levels are Higher in AD-Vulnerable Regions ofAD-Affected Brains than in Age-Matched Controls
At least seven laboratories have reported that AD neocortex has higher Allevels than the neocortex of non-demented age-matched controls.99–105 AD-vulnerable brain regions in AD cases contain mean Al values of approximately4 mg g�1 brain tissue (dry weight), whereas the same regions in age-matchednon-demented cases averager2 mg g�1 brain tissue.15,99,100 Approximately 1/4of the AD samples contain Al levels up to 11 mg g�1 brain tissue.15
Thus AD hippocampus and cortex generally contain 1.4 to 4 times more Althan the same regions of controls.99,100 By comparison, brain Al levels insubjects with dialysis encephalopathy, a condition that develops in renal failurepatients over months or 1–2 years, are 10–15 times higher than in controls.46
The cytotoxic concentration for Al in human neurons is unknown, but in catcerebral neurons this concentration lies between 4 and 6 mgAl g�1 brain (dryweight).102
42 Chapter 2

Two studies have reported that AD brains show no more Al thancontrols.42,43 Ganrot60 has described methodological flaws in both studies.
2.4.3 Cognitive Deterioration in AD and Chronic Al
Neurotoxicity
2.4.3.1 Cognitive Deterioration in AD
AD is the most common dementia. Neuropathological change in the cerebralcortex and limbic system leads to deficits in learning, memory processing,visuospatial and language skills. The first sign of AD cognitive deterioration isoften recognized as short-term memory impairment involving, for example,forgetfulness of recent events. The patient may exhibit confusion, perseverativebehaviors and incontinence. At a later stage of the disease, a person with ADmay no longer recognize their own image in a mirror. The progression of ADsymptoms varies from person to person.
2.4.3.2 Rats that Mimic the Long-Term Total Dietary Al LevelsIngested by Americans can Develop CognitiveDeterioration in Old Age
By the time the rats in our longitudinal study were 12 months of age, they wereskillful in their T-maze task performance. At this age they were randomlyassigned to three Al treatment groups (low, intermediate and high).78 The onlytreatment difference between the animals concerned the quantities of Al theyingested in the form of drinking water. The quantities of water consumed werealso measured.
Rat middle age is, by convention, between their 12th and 24th months.Wistar rats age approximately 35 times faster than humans,106 so middle agefor rats is considered to extend from 35 years to 70 years in humanage-equivalence. The mean T-maze performance score for all rats was 78%during middle age, indicating that they made almost 8 out of 10 correct choiceson each weekly test. During old age, the low Al dose rats exceeded thisstandard, obtaining a mean score of 82%. None of the rats in the low Al dosegroup, two (20%) in the intermediate Al dose group and seven (70%) in thegroup that consumed Al at the high end of the human range for total dietary Alexhibited significantly lower mean scores on their T-maze task in old age thanin middle age, as well as showing dementia-like behaviors such as confusion,inability to focus attention on the task, perseverative activities and incontinencewhile in the T-maze.y These are the rats described as having cognitivedeterioration.54,77,78
T-maze performance scores of the rats that developed cognitive deteriorationin old age decreased to 45.5%, indicating that the choice accuracy of these aged
yVideos attached to the electronic version of reference 77 show a rat from the high Al group in theT-maze in middle age, then old age, with firstly normal, and subsequently abnormal behaviors.
Life-Long Exposure to Aluminium Compounds may Cause Alzheimer’s Disease 43

rats was no better than random. Results from the main study78 were consistentwith, and validated, those of the pilot study.77 The rats were euthanized whenthey showed indications of a terminal condition and their brains were examinedfor evidence of neuropathology.54,107,108
These studies concluded that most rats that consumed Al at the high end ofthe human total dietary Al range developed cognitive deterioration in old age,accompanied by AD-relevant neuropathology. Interestingly, the rats developedcognitive deterioration without developing fully-formed plaques and tangles.Nevertheless, stages that lead to plaque and tangle formation in humans wereobserved in their brains. The rats with Al-induced cognitive deteriorationexhibited additional neuropathological changes known to occur in AD thathave received less attention than amyloid. These additional neuropathologicalchanges explain cognitive deterioration more readily than the amyloidhypothesis.
2.4.4 Cognitive Deterioration in AD and Chronic Al
Neurotoxicity Occur from the Same Mechanism of
Damage
The entorhinal cortex (Brodmann’s area 28) occupies the anterior part of theparahippocampal gyrus in humans.109 Large stellate and pyramidal cells insuperficial layers of the entorhinal cortex receive projections from manyneocortical regions, including the olfactory, auditory, visual and somato-sensory cortices, as well as multimodal areas and the amygdala.110 The stellateand pyramidal cells are the cells of origin for the perforant path of theentorhinal cortex. Their axons collect in an angular bundle (Figure 2.4) andthen project massively to the hippocampal formation in the form of distinctfascicles that perforate grey matter of the subicular cortex on their way to thehippocampal formation.110
Most fascicles project to the dentate gyrus, where they terminate on distaldendrites of granule cells in the outer two thirds of the molecular layer. Othersterminate on distal dendrites of pyramidal cells in the CA1/subiculum zone.The perforant path thereby activates a sequence of intrinsic connections withinthe hippocampal formation, allowing the hippocampus to remain informed ofongoing cortical sensory activity.110,111
Stimulation of this circuitry culminates in hippocampal and subicularoutput, and reciprocates the perforant path, by projecting back to the deeperpart of the entorhinal cortex.112,113 The entorhinal cortex thus serves as apivotal two-way station with the dual roles of: (1) funneling input from theneocortex and amygdala via the perforant path into the hippocampalformation, and (2) funneling reciprocal output from the CA1 and subiculumof the hippocampal formation back to the neocortex via layer IV.110 Thisactivity of the entorhinal cortex is crucial for acquisition into long-termmemory.113
44 Chapter 2

2.4.4.1 Disruption of the Perforant Path in Humans with ADIsolates the Hippocampal Formation from the Neocortex
The entorhinal cortex is the most affected region of the AD brain. It has by farmore NFTs than any other of Brodmann’s areas.114 By the time AD is evident,many NFTs in the cells of origin for the perforant path have become extra-cellular ‘‘ghost’’ NFTs that have outlived their host cells.110 Such damagedestroys the perforant path. AD hippocampal sections also reveal discretelesions of NFT-containing cells in the hippocampal subiculum/CA1 zone.54
Intraneuronal Al is involved in the formation and growth of human NFTs thatcapture and sequester Al in the cell cytoplasm, thereby slowing its accumu-lation in the nucleus.56 Instrumental techniques have also shown high Alcontent in NFTs.115,116 For these reasons, NFTs can be regarded as a
Figure 2.4 Schematic representation of the perforant path. The perforant path issimilar for humans and rats, except for minor variations. (1) The cells oforigin (CO) for the perforant path (PP) reside in layer II (shown as cellislands) and in the superficial part of layer III of the entorhinal cortex(EC). The cells of origin receive information from many cortical regions.(2) Axons of the cells of origin converge in the angular bundle (AB) fromwhich the perforant path emerges. (3) Upon leaving the angular bundle,the axons (4) diverge into fascicles known as the perforant path (PP),perforating the subicular cortex (SC) on their way to the hippocampalformation. (5) A contingent of fascicles enters the stratum lacunosummoleculare (SLM) of the CA1/subicular zone (CA1). (6) More fasciclescross the hippocampal fissure (HF) (7) to enter the molecular layer (ML)of the dentate gyrus (DG).Reproduced from reference 117 with permission from the HindawiPublishing Corporation.
Life-Long Exposure to Aluminium Compounds may Cause Alzheimer’s Disease 45

marker for human pyramidal cells that contain considerable amounts ofaccumulated Al.
These pathological changes effectively disconnect the hippocampalformation from the limbic and association cortices.113 Cortical regions dependupon the hippocampal formation for memory consolidation. The structuralchanges that occur with AD in these brain regions preclude the normalacquisition of episodic or contextual knowledge.113
Severe damage to the perforant path thus provides a structural basis for thelearning and memory changes that occur in AD. Confusion and inability to recallnew episodes occurs relatively early in the course of AD and directly affectscognition.110 As perforant path terminals deteriorate, a layer of neuritic plaquesforms in the center of the dentate gyrus molecular layer, precisely where theglutamatergic terminals of the perforant path were previously located.113
2.4.4.2 Disruption of the Perforant Path in Rats withAl-Induced Cognitive Deterioration Isolates theHippocampal Formation from the Neocortex
Two conditions have been recognized as necessary for cognitive deteriorationin the Al-inducible rat model that mimicked consumption of human dietary Allevels over most of the life span. The first condition is that large numbers ofpyramidal cells in the rats’ entorhinal cortex showed high-stage (IV) Alaccumulation. Pyramidal cells with stage IV Al accumulation exhibit micro-tubule depletion, dendritic dieback and loss of synapse density.54
The cells of origin for the perforant path in the entorhinal cortex stain forAl to a greater extent than for cells in any other brain region. Computer-assisted cell counts showed that, on average, 60� 7% of the cells of origin forthe perforant path of the entorhinal cortex exhibited stage VI Al accumulationin the brains of rats with cognitive deterioration compared to 23� 7% in thelow Al controls (po0.001)54 (Figure 2.5, A&B).
Association area 3 of the temporal cortex is another AD-vulnerable brainregion. In the rats with cognitive deterioration, 40� 7% of pyramidal cellsexhibited stage IV Al accumulation compared to 13� 3% in the low Alcontrols (po0.01). The percentages of entorhinal cortical cells with stage IV Alaccumulation correlated with the extent of change in the animals’ T-mazeperformance scores between middle age and old age (r¼ 0.76; po0.0005).54
The second condition for cognitive deterioration in this rat model is thepresence of at least one substantial lesion consisting of cells with high stage (IV)Al accumulation in the subiculum/CA1 zone of the hippocampal formation(Figure 2.5, C). Equivalent damage in the hippocampal formation of humansresults in hippocampal failure to reciprocate output back to deeper layers of theentorhinal cortex, and from there to the neocortex.110
The presence of the two conditions in the brains of rats results in cognitivedeterioration. The two conditions are analogous to those that result indisconnection of the hippocampal formation from the neocortex in humans,
46 Chapter 2

thereby isolating the hippocampus, as occurs in AD.113 Thus the Al-induciblemodel is a translational animal model that replicates the process by whichcognitive deterioration develops in AD.117 Conversely, all low Al rats retainednormal cognition. Low Al rats (1) had smaller percentages of stage IV Alaccumulation in their cells of origin for the perforant path and (2) lacked anysign of a lesion in the CA1 field or subiculum.54
Previously, the selective vulnerability of entorhinal, hippocampal andcortical cells in AD was described as a mystery.110 This Al-inducible rat modelfor chronic Al neurotoxicity and AD demonstrates that Al derived from dietary
A B
C
D
Figure 2.5 Al staining of cells of origin for the perforant pathway in the entorhinalcortex and in a lesion consisting of hippocampal CA1 cells that coincideswith microtubule depletion in the brain of an aged rat with cognitivedeterioration. A – Al stains large pyramidal and stellate cells of theentorhinal cortex magenta to purple in a rat with cognitive deterioration;B – Al staining is primarily localized in glial cells in superficial layers of theentorhinal cortex of a low Al rat control. Cells with low Al stain blue; C –Stage IV pyramidal cells stain magenta for nuclear Al within a hippocampalCA1 lesion of an aged rat with cognitive deterioration. The lesion is situatedin the center of this micrograph. Pyramidal cells with a more normalappearance (e.g., arrow) occur along the edges of the lesion; and D – Anadjacent immunostained section shows that cells within the same lesion fail toimmunostain for microtubules, whereas microtubules can be clearly seen in themore normal cells along the edges of the lesion (e.g., arrow). Magnificationbar¼ 50 mM for A and B, and 10 mM for C and D.Reproduced from reference 54 with permission from Elsevier.
Life-Long Exposure to Aluminium Compounds may Cause Alzheimer’s Disease 47

exposure at human-relevant levels preferentially accumulates in these and otherAD-vulnerable brain regions and can accumulate to the point of interferencewith cognition.54,111
More widespread changes take place in the human brain as AD continues toprogress. This is consistent with Al levels increasing over time to neurotoxicthresholds in additional AD-vulnerable brain regions—as evidenced by thespread of NFT damage—as a result of continuing human exposure to Al infoods, water and other sources. Chronic Al neurotoxicity also involves changesin calcium and iron metabolism and in neurotransmission.
2.4.5 Calcium (Ca21) Metabolism is Disrupted in AD and
Chronic Al Neurotoxicity
2.4.5.1 Disruption of Ca21 Metabolism in AD
Many reports describe significantly higher Ca21 levels in fresh hippocampaland cortical brain cell samples obtained from aged rats, rabbits and monkeyscompared to those of younger animals.118 Actual intraneuronal Ca21 levels,and Ca21 movement into and out of neurons, of aged non-demented humansand humans with AD are resistant to analysis, owing to post-mortem change.119
However, it is known that Ca21 metabolism is disturbed on several levels inAD. The amount of 45Ca that is absorbed across the GIT of humans with AD issignificantly lower than that of age-matched controls in the presence of normalplasma concentrations of vitamin D metabolites, parathyroid hormone andserum Ca21.120 Also, Ca21 extrusion by plasma membrane Ca21-ATPase isimpaired in AD neurons relative to that of non-demented controls.121
Ca21/phosphoinositide signalling pathways are also impaired in ADpyramidal cells. These pathways depend on G-proteins. G-proteins and theiractivation by GDP/GTP exchange exhibit general dysfunction in AD braincells.122–124 Protein kinase C (PKC) is normally activated by Ca21/phosphoinositidesignaling pathways, the impairment of which may in part explain why PKC showsreduced activation in AD-affected cortical regions.125,126
Calmodulin (CaM) activity, essential for Ca21 signaling, is also impaired inAD.52 Immunostaining techniques show that monoclonal antibodies raisedagainst CaM have a poor ability to recognize CaM protein in AD brain tissue.Ca21 influx through activated NMDA receptors and heightened activities of CaMand PKC are all essential for long-term potentiation (LTP), a Ca21-dependentprocess involving sustained synaptic activity that underlies certain types ofmemory formation.127 Changes in the levels of any of these proteins and/ortheir activities could contribute to the LTP deficit observed in AD.127–130
2.4.5.2 Disruption of Ca21 Metabolism in Chronic AlNeurotoxicity is Comparable with that which Occurs in AD
Al inhibits calbindin and thereby impairs transcellular absorption of Ca21 inthe intestine.131,132 Al also competes with Ca21 for Ca21-binding sites on
48 Chapter 2

proteins, membranes and in Ca21 channels, disrupting Ca21 metabolism in thesame ways that are altered with aging and AD.118
Al blocks voltage-gated Ca21 channels, N-methyl-D-aspartate (NMDA),a-amino-3-hydroxy-5-methyl-4-isoxazolepropionic acid (AMPA) and glutamate-mediated currents in isolated hippocampal and dorsal ganglion neurons133,134
and irreversibly blocks Ca21 channels formed in bilayer membrane by highlevels of b-amyloid.135
Al elevates Ca21 levels in resting neurons.136–138 Al interference occurs atseveral stages of the Ca21/phosphoinositide signaling pathways, inhibiting: (1)G protein activation62,63; (2) hydrolysis of PIP2 by PI-PLC139; (3) phosphoi-nositide accumulation140; and, consequently, (4) PKC activation by diacyl-glycerol, a product of PIP2 hydrolysis. Exposure to nanomolar quantities of Alalso inhibits 90% of PKC activity in rat brain extracts.141
Al binds to CaM, forming an Al-CaM complex that has reduced ability tointeract with CaM-dependent proteins needed for translating Ca21 signals intocellular activities.142,143 Monoclonal antibodies raised against normal CaM havepoor recognition of the Al-CaM complex.143,144 Thus efficacy of CaM for acti-vating CaM kinase in the brains of Al-treated rats and phosphodiesterase in thebrains of Al-treated rabbits declines progressively to approximately 50% and30%, respectively, of their control values.136,145 In vitro exposure of synap-tosomes to 100mM Al reduces their CaM activity to 40% of control value.146
Al31 substitutes for Mg21 in the ATP co-factor of Mg21-ATPase.63 ChronicAl exposure also alters plasma membrane Ca21-ATPase activity in a way thatdepresses Ca21 extrusion from neurons.136 These results are completelyreversible by desferrioxamine, an Al (and iron) chelator. Al accumulation in ADneurons and its ability to inhibit Ca21-ATPase activity, which normally plays alarge role in extruding excess Ca21 from cells, may explain why Ca21 levels aregenerally elevated in neurons isolated from Al-exposed and older animal brains.
Al inhibits, in a dose-dependent manner, the activity of several enzymesimportant to Ca21 metabolism: PKC, G proteins, CaM, and plasma membraneCa21-ATPase.62–64,136,141,145,146 Interference with either Ca21 uptake throughNMDA receptors, PKC or CaM activities on their own would disrupt LTP. LTPand long-term depression (LTD), an activity-dependent reduction in the synapseefficacy, were strongly disrupted in the brains of rats subjected to daily intra-cerebral Al injection over a 5–day period, which elevated the brain Al content to alocal concentration estimated at 2.7 mgmL�1.147 Oral Al exposure since weaninghas also produced LTP and LTD deficits in the brains of young rats.148,149
2.4.6 Iron Metabolism is Disrupted in AD and in Chronic Al
Neurotoxicity
Iron is essential for energy production and cell health. Intracellular iron mustbe rigorously regulated to limit the amount of iron that would otherwise befreely available in cells. Free iron is a major source of oxidative damage.
The highest concentrations of (non-heme) iron in the adult human brain arenormally found in ferritin deposits of oligodendrocytes and microglial cells in
Life-Long Exposure to Aluminium Compounds may Cause Alzheimer’s Disease 49

the globus pallidus and substantia nigra, followed by the red nucleus, putamen,caudate nucleus, dentate nucleus and subthalamic body. The cerebral andcerebellar cortex, anterior nucleus of the thalamus, mammillary body, tectumof the midbrain and the central grey matter of the third ventricle haveconsiderably less iron. The medulla oblongata, spinal cord grey matter, spinaland sympathetic ganglia and white matter of the brain and spinal cord fail tostain for iron altogether.150 Neurons of most brain regions contain granulariron deposits that increase with age.
The main usage of iron in neurons is for the synthesis of heme-containingenzymes, namely cytochrome oxidase and succinate dehydrogenase in mito-chondrial respiratory chains, and iron-sulfur proteins such as iron regulatoryprotein 1 (IRP1).151 Brain regions that contain neurons with high energy needshave large demands for heme iron and they also have a high density of transferrinreceptors on their surface. High levels of transferrin receptors are found in thecortex, hippocampus, amygdala, dorsal raphe nucleus and cerebellar Purkinjecells.151 High transferrin receptor levels show an almost identical distribution tothat of cytochrome oxidase, which is an indicator of high energy needs.151
IRP1 and IRP2 are iron sensor proteins that normally govern intracellulariron homeostasis by controlling iron-transferrin uptake via transferrinreceptors and storage of free iron in cytoplasmic ferritin deposits.152 Whenintracellular iron is deficient, IRP2 avidly binds to iron responsive elements(IREs) in the 3’-untranslated region (UTR) of transferrin receptor mRNA,stimulating the formation of transferrin receptors. Transferrin receptorspromote cellular iron uptake and restore the deficient intracellular iron levels.When iron levels are adequate, IRP2 normally dissociates from IREs and israpidly degraded. IRP1 binds to IREs in the UTR of ferritin receptor mRNAand stimulates ferritin formation as IRP2 degrades.152
2.4.6.1 Disruption of Iron Metabolism in AD
In AD, iron levels increase in all AD-vulnerable brain regions, particularly inthe hippocampus and amygdale, and to a lesser extent in temporal and parietalcortical regions.153 IRP2 is stabilized in AD hippocampal neurons.154 ADpyramidal cells with IRP2 stabilization behave as if they are in a permanentstate of iron deficiency. These pyramidal cells continue to synthesize transferrinreceptors, leading to abnormally high levels of intracellular free iron ions andoxidative damage, while ferritin synthesis is inhibited. Intraneuronal ironcauses oxidative stress by its redox reactions, particularly those that involve thehighly reactive Fenton reaction.155 IRP1 is apparently unchanged in ADhippocampal pyramidal cells.154
2.4.6.2 Disruption of Iron Metabolism in Chronic AlNeurotoxicity is Comparable to that which Occurs in AD
Al-loading of laboratory rats concurrently induces significant increases in iron,proportional to Al increase, in pyramidal cells of the cortex, amygdala and
50 Chapter 2

hippocampus.71 Al stimulates the uptake of both transferrin-bound iron andnon-transferrin-bound iron in human cells.156 Intraneuronal Al disrupts ironmetabolism in neurons by interacting with IRP2.157
Al pre-treatment of cultured neural cells also increases their free ironuptake,158,159 disrupts their iron homeostasis by inducing IRE binding activityof IRP2, and stabilises IRP2 by interfering with iron-catalysed oxidation in away that prevents IRP2 breakdown.157 IRP1 shows no change in Al-exposedneural cells,157 just as IRP1 is unchanged in AD.154 Immunostaining shows thatIRP2 is abnormally localised in AD-affected hippocampal cells, with strongIRP2 immunoreactivity appearing on NFTs152 where Al is particularlyconcentrated.53,56,115,116
Al and iron both generate oxidative stress in the brain.65–67 Oxidative stress isone of the earliest changes observed in AD.160 Al enhances iron-initiated lipidperoxidation several-fold.67,161 Al also stabilises iron in its ferrous form(Fe21),162 thereby increasing lipid peroxidation. The ferrous iron ion drives theFenton reaction in cells. Individual contributions to oxidative stress from Aland iron in AD cells are probably indissociable, owing to the multiple syner-gistic interactions that occur between Al and iron ions.
2.4.7 Neurotransmitter Levels are Diminished in AD and Al
Neurotoxicity
2.4.7.1 Neurotransmitter Levels are Diminished in AD
In AD, acetylcholine, glutamate, dopamine, norepinephrine and serotoninlevels are diminished in cortical, hippocampal and striatal regions of thebrain.163–165 The main neurotransmitter-related change in AD brains is a40–90% decrease in choline acetyltransferase (ChAT) in the hippocampus andcerebral cortex.166 The ChAT decrease is already noticeable in the first year thatsymptoms appear167 and is accompanied by a large (e.g., 45%) loss of choli-nergic activation of phosphoinositide signaling.168
The ChAT enzyme catalyses the synthesis of acetylcholine from its cholineand acetyl coenzyme A precursors.169 Normally, ChAT is functionallyregulated by PKC phosphorylation on serine-440.170,171 However, PKC levelsare abnormally low in AD.125 The reduced ChAT levels can explain the loweredacetylcholine availability for attaching to acetylcholine receptors and stimu-lating Ca21/phosphoinositide signaling pathways in AD.123
Noradrenergic and serotonergic neurotransmitters also show reductions inAD but are less than those of the cholinergic system.166 Tetrahydrobiopterin(BH4) is a co-factor required for the hydroxylation of phenylalanine andtyrosine in the synthesis of the monoaminergic neurotransmitters dopamineand noradrenaline, and for the hydroxylation of tryptophan in the case ofserotonin.172 BH4 synthesis is significantly reduced in the temporal lobe of post-mortem AD brain samples173 and BH4 deficiency is regarded as a characteristicof late-stage AD.174
Life-Long Exposure to Aluminium Compounds may Cause Alzheimer’s Disease 51

2.4.7.2 Neurotransmitter Levels are Diminished in Chronic AlNeurotoxicity as in AD
Acetylcholine, glutamate, dopamine, noradrenaline and serotonin levels aresignificantly diminished in cortical, hippocampal and striatal brain regions ofAl-exposed animals as in AD.175–177 Al accumulates in cholinergic neurons78,94
and interferes with several aspects of acetylcholine metabolism.178 Brains of Al-exposed rabbits show significant reductions in ChAT activity in the entorhinalcortex (27%), hippocampus (36%-40%), and striatum (53%) after CNS Alinjection.175
A possible explanation for ChAT inhibition by Al and low acetylcholinelevels in AD is that nanomolar amounts of Al inhibit 90% of PKC activity141
and PKC activity is needed for ChAT phosphorylation.171 Al also inhibitsacetylcholine synthesis by interfering with choline uptake, lowering the contentof acetyl-coenzyme A178 and inhibiting acetylcholine release.179,180 Al producesa biphasic effect on acetylcholinesterase levels in experimental animals, initiallystimulating, and then depressing its rate of synthesis.181 Al inhibition of ChATactivity and acetylcholine synthesis has flow-on effects, reducing acetylcholinereceptor-stimulated Ca21/phosphoinositide signaling pathways in Al-affectedneurons.139,146
Al also reduces the levels of glutamatergic and monoaminergic neurotrans-mitters but to a lesser extent than ChAT.175,177 Rats that drank watercontaining Al acetate had reduced total brain biopterins and less BH4 synthesisthan controls,182 and low BH4 levels could help to explain the monoaminergicneurotransmitter deficit. It is currently unknown whether Al directly inhibitsBH4 synthesis or indirectly inhibits its synthesis by interfering with BH4
phosphorylation. The terminal enzyme in the biosynthetic pathway for BH4
is normally phosphorylated by PKC and/or CaM kinase II.183 Both enzymesare inhibited by Al at low concentrations.141,145
2.4.8 AD and Chronic Al Neurotoxicity are Inflammatory
Conditions
2.4.8.1 Inflammatory Effects are Observed in AD
AD is a mildly inflammatory condition.184 Gene microarray experiments185
analyzed for 12 633 gene, and expressed sequence, expression levels andindicated a generalized down-regulation of normal gene expression in the ADhippocampus. Specifically, AD hippocampal tissue exhibited statistically-significant decreases in reporter signal intensity mainly for genes that encodetranscription and neurotrophic factors, signal transduction elements and metalion-sensitive factors. AD hippocampal tissue showed increased expressionlevels of 24 genes. In both cases (increase and decrease), the differences werealtered by a factor equal to or greater than three-fold compared to controls(po0.04).13,185 Greater increases in gene expression were found for inflam-matory transcription factors and their subunits (NFkBp52/p100, HIF-1,
52 Chapter 2

hypoxia-inducible factor-1) and inflammatory proteins [b-amyloid precursorprotein (b-APP), NF-IL6, IL precursor, cytochrome oxidase-2 (COX-2),interleukin 1L-1b (IL-1b), tumor necrosis factor (TNFa) and death-associatedprotein 6 (DAXX), a regulatory protein that represses transcription andinduces apoptosis].185 Reactive astrocytes and activated microglial cells areabundant in AD brain tissue and T-cells marginate along post-capillary venulesof inflamed areas.184
2.4.8.2 Inflammatory Effects are Observed in Chronic AlNeurotoxicity
Al-generated ROS initiate an inflammatory cascade in brain tissue.186–188
Chronic Al exposure up-regulates the expression of the NFkB transductionfactor as well as IL-b and TNFa cytokines in brains of laboratory mice.177,188
High density gene microarrays have revealed that cultured human neural cellsexposed to 100 nM Al emulate many stress response gene expression changespreviously reported in late-stage AD brain tissue at, or more than three times,the gene expression of control cultures. Specifically, 7 out of 8 genes (87.5%)significantly up-regulated in AD are up-regulated by Al exposure. Similarly, 17out of the 24 (71%) genes that are significantly down-regulated in AD aredown-regulated by Al.13 Pro-inflammatory and pro-apoptotic genes are overexpressed in these Al-exposed human neural cells, including subunits fornuclear factor kappa B (NFkB) and HIF-1 transduction factors, IL-1bprecursor, b-APP, COX-2 and DAXX.13 Co-exposure of human neural cells toAl and iron produces a synergistic effect on the expression of the same up-regulated and down-regulated genes.189 Hence Al accumulation in the ADbrain could account for observations that AD involves inflammation.
Al activates astrocytes and microglial cells in studies performed in vivo andin vitro.190–194 Cultured rat astrocytes exposed to Al for up to 41 days haveinterrupted gap junctions that interfere with their intercellular communicationand ability to buffer ions and transmitters in the extracellular environment ofneurons.192
2.5 Al and Neuropathological Hallmarks of AD
Neuropathological features of AD include microtubule depletion, dendriticdieback, loss of synapse density, cortical atrophy, hyperphosphorylated tauand NFTs, hippocampal granulovacuolar degeneration, and changes in themetabolism of amyloid protein precursor and presenilins that lead to theformation of amyloid plaques.
2.5.1 Microtubules
Neurons require microtubules, to maintain the structure and shape of the cellbody and its dendritic/axonal processes. Microtubules provide the infrastructurefor fast axonal flow and transport of nutrients, neurotransmitters, and organellesbetween the cell body and its distant synaptic terminals.195
Life-Long Exposure to Aluminium Compounds may Cause Alzheimer’s Disease 53
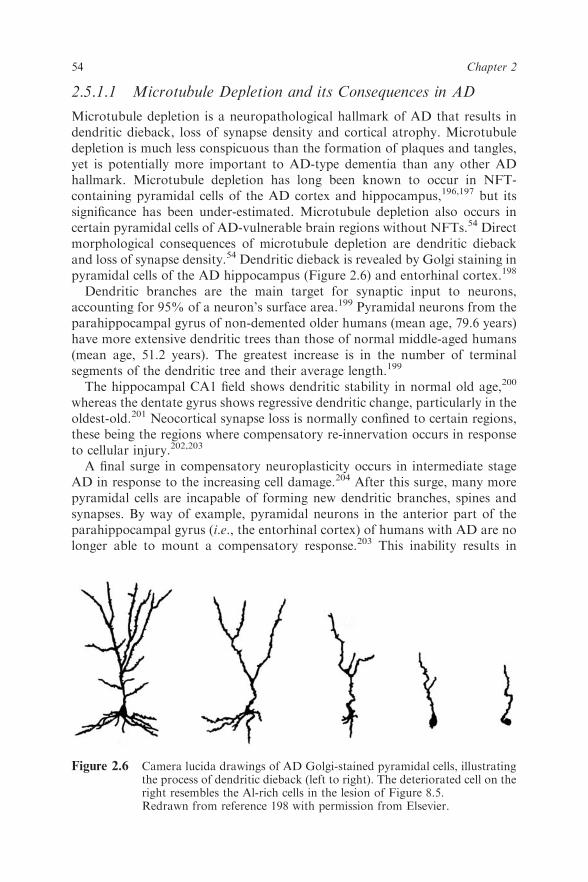
2.5.1.1 Microtubule Depletion and its Consequences in AD
Microtubule depletion is a neuropathological hallmark of AD that results indendritic dieback, loss of synapse density and cortical atrophy. Microtubuledepletion is much less conspicuous than the formation of plaques and tangles,yet is potentially more important to AD-type dementia than any other ADhallmark. Microtubule depletion has long been known to occur in NFT-containing pyramidal cells of the AD cortex and hippocampus,196,197 but itssignificance has been under-estimated. Microtubule depletion also occurs incertain pyramidal cells of AD-vulnerable brain regions without NFTs.54 Directmorphological consequences of microtubule depletion are dendritic diebackand loss of synapse density.54 Dendritic dieback is revealed by Golgi staining inpyramidal cells of the AD hippocampus (Figure 2.6) and entorhinal cortex.198
Dendritic branches are the main target for synaptic input to neurons,accounting for 95% of a neuron’s surface area.199 Pyramidal neurons from theparahippocampal gyrus of non-demented older humans (mean age, 79.6 years)have more extensive dendritic trees than those of normal middle-aged humans(mean age, 51.2 years). The greatest increase is in the number of terminalsegments of the dendritic tree and their average length.199
The hippocampal CA1 field shows dendritic stability in normal old age,200
whereas the dentate gyrus shows regressive dendritic change, particularly in theoldest-old.201 Neocortical synapse loss is normally confined to certain regions,these being the regions where compensatory re-innervation occurs in responseto cellular injury.202,203
A final surge in compensatory neuroplasticity occurs in intermediate stageAD in response to the increasing cell damage.204 After this surge, many morepyramidal cells are incapable of forming new dendritic branches, spines andsynapses. By way of example, pyramidal neurons in the anterior part of theparahippocampal gyrus (i.e., the entorhinal cortex) of humans with AD are nolonger able to mount a compensatory response.203 This inability results in
Figure 2.6 Camera lucida drawings of AD Golgi-stained pyramidal cells, illustratingthe process of dendritic dieback (left to right). The deteriorated cell on theright resembles the Al-rich cells in the lesion of Figure 8.5.Redrawn from reference 198 with permission from Elsevier.
54 Chapter 2

progressive, marked atrophy of dendrites with loss of spines and synapses. Theapical dendrites are shorter and less branched than in controls. All brains withdementia contain cells with shrunken dendritic trees.205 Progressive reductionin the dendritic tree involves sequential loss in distoproximal synapses.206 AD-altered pyramidal cells occur in groups, forming expanding lesions surroundedby other pyramidal cells with a more normal appearance.54 Loss of synapsedensity is regarded as a better diagnostic feature of AD than either plaques ortangles.207
2.5.1.2 Microtubule Depletion and its Consequences in ChronicAl Neurotoxicity
Al produces a biphasic toxic effect on microtubules. In vitro Al exposure atpicomolar concentrations results in Al binding to the site on tubulin-GTP(normally occupied by Mg21, the physiological mediator of microtubuleassembly) and stimulates tubulin polymerization. Al-induced microtubulesappear identical to normal microtubules, even at the ultrastructural level.64
However, Al-induced microtubules are physiologically abnormal. They fail todisassemble under normal conditions, being resistant to PP2B-induceddepolymerization.64
Al is a microtubule disruptor at the mM concentrations that typically occur inaged pyramidal cells. Microtubule density is reduced as NFTs form in pyramidalcells of the entorhinal cortex, hippocampus and neocortex of cats in response tointraventricular Al injection.208 Microtubule counts in TEM micrographs ofNFT-containing cat pyramidal cells showed they contained 0–3 microtubulespermm2 compared to pyramidal cells of sham-operated cats, which contained amean count of 71� 26 microtubules per mm2. Microtubule depletion in thehippocampus of the Al-exposed cats correlates with impairments in learning andretention.208 Other animal species given intracerebral, intracisternal or intra-peritoneal Al injections also experience performance difficulties on behavioraltests for memory and learning.206,208–210
Intracerebral Al injection into rabbit brains results in a sharp and progressivereduction in the length and number of apical and basal dendritic branches,beginning with those furthest from the cell body, and progressing towards thecell body.206 This dendritic change is indicative of the dieback process andresembles that which occurs in AD.198 Al-induced dendritic dieback alsoresembles dendritic dieback induced by colchicine, another microtubuledisruptor.211 Dendritic dieback is a slow process that continues for 200–300days after animals have experienced acute Al exposure.212 Dendritic changesare accompanied by significant loss of synapse density over the same timeframe.213 Dendritic change induced in brains of rabbits injected intracerebrallywith Al also coincides with impairment in memory and learning activities.206
Microtubule depletion and dendritic dieback also occur with high stage Alaccumulation in hippocampal pyramidal cells of rats that developed cognitivedeterioration after chronically consuming Al at human-relevant levels. Aged
Life-Long Exposure to Aluminium Compounds may Cause Alzheimer’s Disease 55

pyramidal cells that stain for stage IV Al accumulation (Figure 2.5, C) fail toimmunostain for microtubules (Figure 2.5, D).54 In contrast, microtubules areclearly demonstrable in aged pyramidal cells where Al staining is at lower stagesof Al accumulation.54
Examination of brain sections in the hippocampal stratum radiatum of ratswith Al-induced cognitive deterioration showed glial cells in the course ofpruning dendritic processes.54 High stage Al accumulation causes the cellstructure to collapse so the cell bodies appear shrunken with a serpentine-shaped apical dendrite, as described by Simchowicz214 for AD pyramidal cells.Neurites shrivel, synapses break down and neuronal connectivity is lost. Cellswith high stage Al accumulation are sufficiently structurally compromised thatthey hardly resemble neurons.54
Substantial lesions consisting of Al-rich microtubule-depleted cells areobserved in brains of humans with AD and in rats with cognitive deterioration.The lesion illustrated in Figure 2.5 was from a serially-sectioned rat cerebrumthat showed this lesion extended along the entire anteroposterior axis of the rathippocampus. Extensive Al damage to the cells of origin for the perforant pathand one substantial hippocampal lesion consisting of cells with high stage Alaccumulation are sufficient to distinguish the brains of rats with cognitivedeterioration from those of rats that remain cognitively-intact. Loss of synapsedensity is another consequence of the high stage Al accumulation and dendriticdieback that feature in the brains of rats with cognitive deterioration.54,215
2.5.2 Cortical Atrophy in AD
Localized cell loss occurs in AD, particularly affecting the hippocampal CA1field, where cell counts indicated an average loss of 68%.216 Several earlierreports217 indicated more widespread neuronal loss, relative to age-matchedcontrols, in cortical regions of AD-affected brains and was suggested as a causefor the cortical atrophy that accompanies AD. Other reports indicated thatneuronal densities in AD brains and brains of age-matched controls weresimilar.218 Stereological counting techniques that allow more preciseestimates of neuron numbers have since developed. These techniques provideevidence that any observed difference between cortical neuron density in ADand age-matched controls is insufficient to account for cortical atrophy.Instead, degenerative reduction occurs in the axon/dendritic/synapsecompartment of these neurons, resulting in dieback that diminishes the corticalvolume and increases ventricular size.219 Change in the axon/dendritic/synapsecompartment can significantly increase or decrease cortical thickness.220
2.5.3 Hyperphosphorylated Tau and NFTs
NFTs, originally described by Alzheimer,4 represent an AD hallmark thatparallels the duration and severity of AD.221 NFTs primarily develop in largepyramidal cells. They are resistant to degradation and can outlast the cells inwhich they form.222
56 Chapter 2

2.5.3.1 Hyperphosphorylated Tau and NFTs in AD
Protein phosphatase 2A (PP2A), the main phosphatase that dephosphorylatestau, is inhibited by approximately 30% in AD brain tissue.223,224 Thisinhibition of phosphatase activity upsets the normal balance between tauphosphorylation by kinases and tau dephosphorylation by protein phos-phatases. Such imbalance leads to the hyperphosphorylation of tau.224
Consequently, a massive increase occurs in the hyperphosphorylated tau:normal tau ratio of the brain as AD develops.225
Human hyperphosphorylated tau is truncated by caspase.226 The truncatedhyperphosphorylated tau aggregates and initially precipitates in the cytoplasmof pyramidal cells in the form of granules.227 Eventually, in some cells, thegranules give rise to polymerized filaments228 that are now recognized to havethe form of twisted ribbons229 rather than paired helical filaments as originallydescribed.230 Some NFT filaments are straight, and others are half-straight andhalf-twisted. Masses of these filaments constitute NFTs. Cortical NFTs appearas tangles, whereas hippocampal NFTs appear flame-shaped.
NFT-containing cells are recognized as having down-regulated oxidativephosphorylation and low respiration.231,232 They can survive in certain brainregions for decades without contributing to neural function.233 Extracellulartangles known as ‘‘ghost tangles’’ result when NFTs become sufficiently largeto enucleate the pyramidal cells that contain them.53 Cell death followsenucleation.
Alzheimer observed, ‘‘As these fibrils stain with dyes differently from normalneurofibrils, a chemical change to the fibril substance must have taken place.This may well be the reason why the fibrils outlive the destruction of the cell.’’4
2.5.3.2 Hyperphosphorylated Tau and NFTs in Brains ofAl-Exposed Experimental Animals and Humans with AD
Al inhibits the activity of protein phosphatases (PP1, PP2A and PP2B) thatnormally remove phosphate from tau in brain tissue.234,235 The massiveincrease in the hyperphosphorylated tau: normal tau ratio that occurs in ADalso occurs in the brains of dialysis patients that have had high Al exposure.236
Al exposure causes tau hyperphosphorylation in: (1) solutions of isolatedtau;237 (2) cultured human neuroblastoma cells;238 and (3) brains of ratschronically-exposed to dietary Al at human-relevant levels.108 Al aggregateshyperphosphorylated tau in vitro, while sparing normal tau.222 The fact thathyperphosphorylated tau can be aggregated by Al in vitro suggests thatintracytoplasmic Al can also aggregate hyperphosphorylated tau in human cellswhere NFTs form.
An observed sequence of events can provide a reasonable explanation for thedevelopment of NFTs in human brain.56 The Al/hyperphosphorylated taugranules fuse and grow (Figure 2.7, A&B) in human pyramidal cells of the CA1hippocampal field and cortex of AD brains. Granule fusion results in ahomogeneous-textured Al/hyperphosphorylated tau complex in the form of
Life-Long Exposure to Aluminium Compounds may Cause Alzheimer’s Disease 57

58 Chapter 2
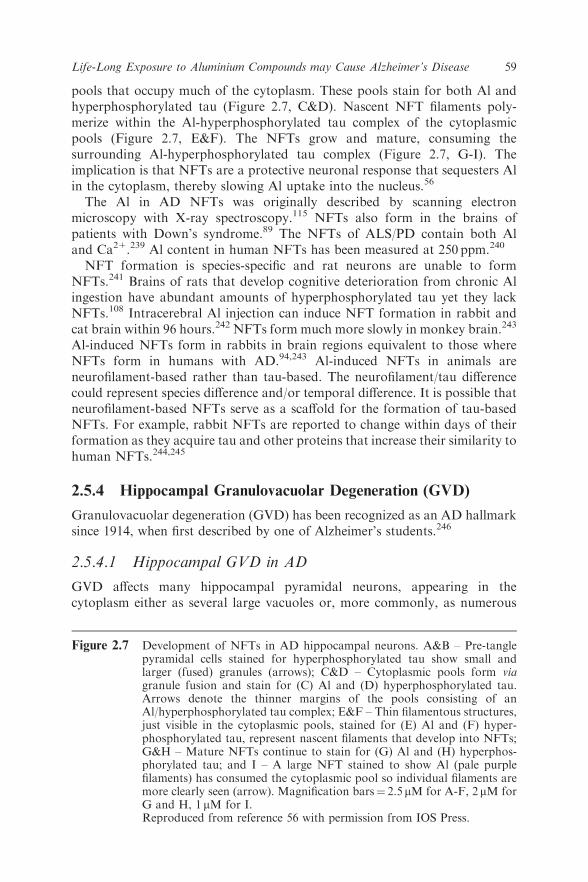
pools that occupy much of the cytoplasm. These pools stain for both Al andhyperphosphorylated tau (Figure 2.7, C&D). Nascent NFT filaments poly-merize within the Al-hyperphosphorylated tau complex of the cytoplasmicpools (Figure 2.7, E&F). The NFTs grow and mature, consuming thesurrounding Al-hyperphosphorylated tau complex (Figure 2.7, G-I). Theimplication is that NFTs are a protective neuronal response that sequesters Alin the cytoplasm, thereby slowing Al uptake into the nucleus.56
The Al in AD NFTs was originally described by scanning electronmicroscopy with X-ray spectroscopy.115 NFTs also form in the brains ofpatients with Down’s syndrome.89 The NFTs of ALS/PD contain both Aland Ca21.239 Al content in human NFTs has been measured at 250 ppm.240
NFT formation is species-specific and rat neurons are unable to formNFTs.241 Brains of rats that develop cognitive deterioration from chronic Alingestion have abundant amounts of hyperphosphorylated tau yet they lackNFTs.108 Intracerebral Al injection can induce NFT formation in rabbit andcat brain within 96 hours.242 NFTs form much more slowly in monkey brain.243
Al-induced NFTs form in rabbits in brain regions equivalent to those whereNFTs form in humans with AD.94,243 Al-induced NFTs in animals areneurofilament-based rather than tau-based. The neurofilament/tau differencecould represent species difference and/or temporal difference. It is possible thatneurofilament-based NFTs serve as a scaffold for the formation of tau-basedNFTs. For example, rabbit NFTs are reported to change within days of theirformation as they acquire tau and other proteins that increase their similarity tohuman NFTs.244,245
2.5.4 Hippocampal Granulovacuolar Degeneration (GVD)
Granulovacuolar degeneration (GVD) has been recognized as an AD hallmarksince 1914, when first described by one of Alzheimer’s students.246
2.5.4.1 Hippocampal GVD in AD
GVD affects many hippocampal pyramidal neurons, appearing in thecytoplasm either as several large vacuoles or, more commonly, as numerous
Figure 2.7 Development of NFTs in AD hippocampal neurons. A&B – Pre-tanglepyramidal cells stained for hyperphosphorylated tau show small andlarger (fused) granules (arrows); C&D – Cytoplasmic pools form viagranule fusion and stain for (C) Al and (D) hyperphosphorylated tau.Arrows denote the thinner margins of the pools consisting of anAl/hyperphosphorylated tau complex; E&F – Thin filamentous structures,just visible in the cytoplasmic pools, stained for (E) Al and (F) hyper-phosphorylated tau, represent nascent filaments that develop into NFTs;G&H – Mature NFTs continue to stain for (G) Al and (H) hyperphos-phorylated tau; and I – A large NFT stained to show Al (pale purplefilaments) has consumed the cytoplasmic pool so individual filaments aremore clearly seen (arrow). Magnification bars¼ 2.5mM for A-F, 2mM forG and H, 1 mM for I.Reproduced from reference 56 with permission from IOS Press.
Life-Long Exposure to Aluminium Compounds may Cause Alzheimer’s Disease 59

small vacuoles. Each of the vacuoles contains a single dense granule(Figure 2.8). The granules stain for Al and for abnormal forms of tau, caspase-cleaved APP, activated caspase-3 and amyloid.53,247,248 Figure 2.8 shows theappearance of large GVD vacuoles, stained for Al, in a hippocampal pyramidalcell from an AD brain.
2.5.4.2 Hippocampal GVD in Chronic Al Neurotoxicity
GVD develops in the brains of rats chronically exposed to dietary Al at human-relevant dietary levels.108 GVD formation can also be induced in the rathippocampus by repeated intraperitoneal injections.210,249 Al is the only agentthat has, to date, been reported to induce hippocampal GVD in experimentalanimals. Hippocampal GVD also occurs in the brains of humans affected byDown’s syndrome,89 and in those with ALS/PD250 which, as previously noted,is an Al-associated dementia.
2.5.5 b-Amyloid and Presenilins in AD and Al Neurotoxicity
Amyloid is a congo red-staining waxy material that occurs in blood vessels andin plaques located in the extracellular matrix of aged brains, particularly thosewith AD. The main sequence of events that lead to amyloid plaque formation isreasonably well-understood.
2.5.5.1 APP, b-Amyloid and Presenilins in Neurons
The inflammatory transduction factors NFkB and HIF-1 up-regulate thesynthesis of amyloid precursor protein (APP) in the human brain.251 APP isnormally cleaved by a-secretase to form secreted APP (sAPPa). sAPPa is anon-amyloidogenic product that regulates APP participation in neuritebudding and branching for neurodevelopment and repair.252 sAPPa formation
Figure 2.8 Granules stain for Al in vacuoles of a GVD-affected AD hippocampalneuron. Magnification Bar¼ 2.5mM.Reproduced from reference 53 with permission from Elsevier.
60 Chapter 2

from APP requires phosphorylation by PKC.253,254 Low PKC phosphorylationin AD125 results in APP cleavage at alternate sites, mediated by b- andg-secretases and giving rise to b-amyloid and cytoplasmic fragments.255
Monomeric b-amyloid peptide is soluble. However, amino acid oxidationand protein cross-linking reactions convert this soluble peptide into oligomersand fibrils that aggregate256 and give rise to amyloid plaques in the extracellularmatrix, particularly in the hippocampus and cortex. AD patients generally havesignificantly larger amounts of b-amyloid plaque in AD-vulnerable brainregions than non-demented controls, although some mentally-alert humanshave a considerable volume of b-amyloid in their brains.257
The wild-type rat/mouse sequence for b-amyloid differs from the humanb-amyloid sequence by three amino acid residues.258 This species-specificdifference is sufficient to block b-amyloid fibrillization and amyloid plaqueformation in aged wild-type rats and mice.256,258 Rodent brains can formhuman-like amyloid plaques only if they have been genetically altered to over-express human mutant APP genes. Some animal models have been engineeredto express human mutant genes for both APP and presenilin. Such gene changeenables mouse brains to produce large amounts of human b-amyloid, whichcan fibrillize and form amyloid plaques similar to those that occur in brains ofaged humans.259,260
Presenilins normally control APP maturation, and mutant forms ofpresenilin can block this maturational process. A variant form of the presenilin-2 gene is diagnostic for sporadic AD, being found in 100% (10/10) of brainstested from sporadic AD cases and only in 1/10 of those from elderly, non-demented controls.261 This aberrantly-spliced variant of the presenilin-2 genegives rise to mRNA lacking the exon 5 sequence which produces a presenilin-2variant-encoding protein (PS2V), truncated at its N-terminus. PS2V resemblesnormal presenilin proteins in that PS2V localizes in membranes of the endo-plasmic reticulum and Golgi complex of pyramidal neurons, particularly in thetemporal cortex and the CA1 hippocampal field.262 However, PS2V preventsthe correct folding and maturation of APP and causes significant increases inboth b-amyloid1–40 and b-amyloid1–42.
262 CA1 pyramidal neurons that arehighly immunoreactive for PS2V exhibit shrinkage and dendritic dieback.PS2V expression can be blocked by antioxidants, suggesting that PS2Vformation is induced by a metal that produces oxidative damage.261
2.5.5.2 Al Induces the Formation of the Presenilin-2 Variant ofSporadic AD and b-Amyloid in Laboratory Animals andOther Experimental Systems
Several ROS-producing metals were tested to determine whether they might beinvolved in PS2V formation.263 Neuroblastoma cells were exposed to CuCl2,CuSO4, ZnCl2, FeCl2, FeCl3, AlCl3 and Al-maltol. Al (both AlCl3 andAl-maltol) was the only metal that consistently induced the PS2V isoform anddid so at a low concentration (25 mM Al).263 The shrinkage of hippocampal
Life-Long Exposure to Aluminium Compounds may Cause Alzheimer’s Disease 61

CA1 neurons and dieback described in human neural cells highly immuno-reactive for PS2V are consistent with indications of chronic Al neurotoxicity.54
Al plays significant roles in amyloidogenesis, contributing to the formationof b-amyloid peptides, amyloid oligomers and amyloid plaques. In vitro andin vivo experiments have shown that Al affects every major stage of humanamyloidogenesis,107,264–267 giving rise to the likelihood that b-amyloid is a by-product of Al activity in the brain. Al is also associated with another type ofamyloid that deposits in the joints of long-term renal dialysis patients.268
Al accumulation in cells generates ROS that stimulate the activity of thetransduction factors, NFkB and HIF-1. Al-induced up-regulation of thesetransduction factors in turn up-regulates gene expression for APP and otherinflammatory response proteins in gene microarrays of Al-exposed culturedhuman neural cells.13,189 APP mRNA and protein are elevated in the brains ofrats that develop cognitive deterioration after chronic exposure to Al underconditions that mimic human Al exposure.107 Hippocampal and corticalsections immunostained for APP, from brains of these Al-exposed rats, exhibitneurites of irregular caliber that stain strongly for APP, indicating impairedaxoplasmic flow. The neurites appear tortuous, with constrictions in someplaces and varicosities in others. A similar neuritic phenomenon has beenobserved in APP-immunostained brain sections of rats four days after theyreceived an intrastriatal Al injection.269 Al also suppresses transport of newlysynthesized RNA in dendrites of cultured hippocampal neurons.270 Swollenneurites and suppression of RNA transport were not observed in controls forthese experiments.107,270
Al inhibits the phosphorylation by PKC141 necessary for normal APPcleavage by a-secretase.253,254 Consequently, APP metabolism is redirectedfrom its non-amyloidogenic soluble APP (s-APPa) form to its amyloidogenicform in the presence of Al, becoming cleaved by b and g secretases to produceb-amyloid. Al stabilises b-amyloid oligomers.271 Al or iron addition to humanb-amyloid1–42 both convert b-amyloid1–42 from a soluble peptide with randomstructure to a fibrillar beta-pleated precipitate that forms b-amyloidsheets.264–266 The fact that this reaction can be reversed by Al/iron chelatorsconfirms that amyloid fibrillization is Al- and iron-induced.265 Zinc inhibits theformation of b-amyloid1–42 sheets, whereas copper prevents their formation. Alalso aggregates human b-amyloid1–42 fibrils, causing them to form deposits thatstain for thioflavin S as do amyloid plaques in AD brain tissue.267
Exposure of APP-transgenic mice to a diet supplemented by Al for 12months significantly augments oxidative reactions and increases the volume ofb-amyloid that forms in their brains, compared to oxidative reactions andb-amyloid volume in brains from a transgenic control group without Alsupplementation.70 The plaques that form in response to Al exposure are bothmore numerous and larger in size. A third transgenic mouse cohort, supple-mented with both vitamin E and Al, showed less oxidative stress with smallerand fewer amyloid plaques comparable to the amyloid plaques that form inbrains of APP-transgenic mice without any Al supplementation.70 Thisindicates that Al-generated ROS, and the oxidative stress that up-regulates
62 Chapter 2

APP and increases amyloidogenesis were ameliorated by the vitamin Eanti-oxidant.
In experimental animals, Al exposure also induces an amyloid condition thatis homologous to congophilic b-amyloid angiopathy in humans,272 being aspecialized type of sporadic AD shown to coincide with very high brain Allevels.273 Al forms a complex with plasma b-amyloid1–42, increasing amyloidtransport across the blood-brain barrier and causing the formation ofb-amyloid deposits in brain tissue.274
2.5.6 APOE-Dependent Neuroplasticity
Neuroplasticity is the brain’s potential to reorganize itself by creating newneural pathways to compensate for cell dysfunction, cell death and dener-vation, such as that which occurs in the AD brain. Astrocytes enable neuro-plasticity by synthesizing and secreting APOE,275 the main lipid carrier in themammalian brain.276 Astrocyte-secreted APOE stimulates compensatoryneuroplasticity by recycling cholesterol and cholesterol esters from neuronswith deteriorating synapses and delivering them to other neurons that can usethis cholesterol to sprout buds, grow new axonal branches, undergo synapto-genesis and re-inervate deafferented neurons.276
Humans express three forms of this protein: APOE2, APOE3 and APOE4.277
APOE2 and APOE3 are capable of stimulating neuroplasticity in response toinjury-induced denervation. The molecular structure of APOE4 impairs itsability to transport cholesterol. This impairs APOE4’s ability to promotesprouting and re-innervation.278
AD progresses with severe loss of entorhinal cortical cells and cells in thesubiculum/CA1 zone. Perforant path fibers, emanating from damaged cells oforigin, shrivel and withdraw from the cells to which they were formerlyconnected. Consequently, other afferent fibers to the dentate gyrus vigourouslysprout to form new synapses with deafferented target cells in the dentate gyrus.Commissural and associational fibres from less affected perforant path neuronscan re-innervate and temporarily restore original connections between theneocortex and dentate gyrus.279
2.5.6.1 Failure of APOE-Dependent Neuroplasticity in AD
As AD continues to progress, damage to the entorhinal cortex and its cells oforigin for the perforant pathway becomes too extensive to be effectivelycountered by compensatory neuroplasticity. APOE-dependent neuroplasticitycontinues for some time, but with diminishing returns. For example, ADpatients with intact septal cholinergic input to the hippocampus show inten-sified acetylcholinesterase activity in an expanded region of the dentate gyrusmolecular layer previously occupied by perforant path glutamatericterminals.204 This inappropriate reinnervation is incapable of restoringconnections between the hippocampal formation and neocortex becauseneurons from the septum connect the hippocampus to brain structures other
Life-Long Exposure to Aluminium Compounds may Cause Alzheimer’s Disease 63

than the entorhinal cortex. The sprouting/re-innervation response to dendriticdieback and cell death eventually exhausts,199,203 resulting in re-innervationfailure.
The effectiveness of APOE-dependent neuroplasticity, when operatingcorrectly, is to postpone overt AD. This is indicated by the mean (� SEM) ageof AD onset in humans with APOE2 and/or APOE3 alleles; i.e., without anyAPOE4 allele (84.3� 1.3 years), in those with one APOE2 or APOE3 allele andone APOE4 allele (75.5� 1.0 years) and in those with two APOE4 alleles(68.4� 1.2 years).277 The earlier age at which AD occurs in individuals withAPOE4 alleles most likely results from APOE4’s inability to hold and transportthe cholesterol and cholesterol esters needed for neuroplasticity andre-innervation.
2.5.6.2 ApoE-dependent Neuroplasticity in Animal Models forAD with Perforant Path Lesions or Chronic AlNeurotoxicity
Rats with unilateral lesions of the entorhinal cortex temporarily lose theirability to perform continuous alternation in the T-maze immediately aftersurgery.79 Compensatory sprouting from the contralateral entorhinal cortexoffsets perforant path damage by re-innervating the deafferented hippocampalformation. If tested three days after lesioning the rat cannot perform, but ifallowed to recover for ten days, their T-maze performance is restored to thepre-lesion level.79 Acetylcholinesterase staining, indicative of re-innervation bycholinergic fibers, is also faintly detectable in the brains of rats with unilaterallesions of the perforant path at 15 days post-lesioning.280 At 30 days, themolecular layer of the dentate gyrus shows a strong acetylcholinesterasestaining pattern. Cholinergic re-innervation is completely inhibited if asecondary lesion is made in the medial septal nucleus 30 days after the originallesioning of the entorhinal cortex.280
However, rats that receive bilateral lesions of the entorhinal cortex, therebydestroying the perforant path on both sides of the brain, develop neuro-pathology and behaviors similar to those observed in humans with AD.281 Re-innervation is restricted to septal and other afferents that have no obviousrelationship with the glutamatergic perforant path innervation destroyed by thelesions. This attempt at compensatory neuroplasticity is unable to restore therat brains’ original connections and hence their T-maze performance. Instead,the rats are left with severe memory deficits as in AD.281
In our longitudinal study, the rats that developed cognitive deteriorationfrom chronic Al neurotoxicity showed remarkable similarities in neuro-pathology and T-maze performance to rats with bilateral lesions. They alsoshared striking similarities to humans with AD in relation to their neuro-pathology and some abnormal behaviours. Chronic Al exposure producesdamage to the entorhinal cortex over a much longer prodromal period than inlesioned animals that develop equivalent damage. Thus chronic Al
64 Chapter 2

neurotoxicity shows closer resemblance to the slowly developing process ofcognitive deterioration than occurs in AD.
Most rats that develop chronic Al neurotoxicity from Al supplementation intheir diet began to show evidence of cognitive deterioration around age 27months, equivalent to about 79 years in humans.78 ApoE mRNA wassignificantly higher in their cortical/hippocampal tissue than for the same brainregions of low-Al controls, suggesting that ApoE-dependent neuroplasticitywas stimulated in the brains of rats with cognitive deterioration (Figure 2.9).However, sprouting, re-innervation and synaptogenesis were eventually unableto compensate for the continuous Al insult that causes microtubule depletionand dieback in pyramidal cells of the entorhinal cortex, neocortex,hippocampal formation and other AD-vulnerable brain regions.54
2.6 Aging Increases Human Vulnerability to AD and
Chronic Al Neurotoxicity
During aging, certain physical changes occur that could contribute to the riskof developing AD in humans and chronic Al neurotoxicity in experimentalanimals. The passage of time allows more Al accumulation in the brain.However, additional changes also occur in aging that probably contribute tothe relentless process of high stage Al accumulation in increasing numbers ofneurons throughout the brain.
2.6.1 Kidney Aging and Functional Loss
Humans are estimated to lose approximately 50% of their kidney functionbetween the ages of 45 and 80 years as nephrons are progressively lost.282
In general, the rate of decline in kidney function increases as subjects age.282
1 32 4 5 6
ApoE
Beta-actin
Figure 2.9 RT-PCR analysis for ApoE mRNA in rat brain. Lane 1, pUC19; lane 2,negative control (macrophage cell line RAW 264); lanes 3 and 4, braintissue from cognitively-intact rats; lanes 5 and 6, brain tissue from ratsthat exhibited cognitive deterioration. Beta-actin bands are shown ascontrols.
Life-Long Exposure to Aluminium Compounds may Cause Alzheimer’s Disease 65

This was shown in 254 normal volunteers who prospectively participated inthe Baltimore Longitudinal Study of Aging with 23 years of follow-up(1958–1981).283 However, a significant proportion of the subjects showed noabsolute decrease in kidney function in old age.
Age-related decline in kidney function may impact on Al removal fromblood, elevating the plasma Al level, with more Al bioavailable for uptake intobrain. Al nephrotoxicity research should determine whether age-related declinein kidney function results in less efficient Al removal from plasma.The continuing need for kidney tubule cells to remove plasma Al fromthe blood may inflict damage on those same cells and contribute to the age-related decline in kidney function seen in most older humans and to kidneydysfunction in renal failure patients.284 At least one large prospective study hasshown that poor kidney function correlates with cognitive decline in elderlyhumans.285
2.6.2 Bone Aging and Osteoporosis
The periosteum consists primarily of osteogenic cells and osteoblasts, whichnormally cover the bone surface. This cellular layer controls Ca21 and PO4�fluxes into and out of bone.286 As age advances, the periosteum thins and theosteogenic layer has fewer cells, giving less coverage of the bone surface.Eventually, osteoblasts are almost absent and there is poor control of ion fluxboth into and out of bone.286
Bone serves as a repository for excess plasma Al in humans. Al that depositsin the skeleton has a long half-life in human bone, possibly lasting fordecades.287 Histological stains show that most bone Al deposits at the interfacebetween the osteoid (unmineralized matrix) and the mineralized zone. Al is therecognized cause of several types of bone disease in renal failure patients,including vitamin D-resistant osteomalacia and aplastic bone disease, wherelittle if any osteoblast activity is evident.
Idiopathic osteoporosis is an age-related disease of unknown origin thatoccurs when the rate of bone breakdown by osteoclasts outpaces the rate ofbone building by osteoblasts. This involves dissolution of the mineralized bonematrix with loss of bone density and increased risk for fracture.
Experimental Al exposure produces a biphasic effect on osteoblasts. Verylow Al concentrations (10�8M to 1.5�10�6M) are mitogenic. Al concen-trations above 1.5�10�6M inhibit the replication of osteoblasts and theirspecialized activities.288 Bone Al delays the formation of amorphous calciumphosphate by osteoblasts, its transformation into calcium hydroxyapatitecrystals and subsequent crystal growth.289
Al also affects osteoclast activity. Al adsorbs to the surface of hydroxyapatitecrystals in the osteoid/mineralized bone interface and slows their rate ofdissolution by osteoclast-generated acid.290 Some acid diffuses below the Al-protected crystals into calcified bone, leading to crystal dissolution relativelydeep in calcified bone and to a weakening of bone strength. In effect, Aldisrupts the balance between osteoblast and osteoclast activities, causing
66 Chapter 2

osteoporosis-like bone change. Only a small portion of bone crystals have to beprotected by Al before giving rise to a pathological state.290
Some reports have noted an association between osteoporosis andAlzheimer’s disease.291–293 AD often co-occurs with osteoporosis in clinicalpractices.293 Trabecular bone biopsies from AD patients with hip fracturegenerally reveal high bone Al content.294 However, not all humans who have highAl content in their bone biopsy samples have AD, suggesting that Al uptake rates,into different tissues that tend to store Al, vary from one individual to another.
The past 50 years has seen an epidemic of hip fractures in the older popu-lation.294 The association between Al and fractures has received little researchattention. Al content in trabecular bone biopsies from osteoporosis patients isintermediate between those with renal failure and healthy controls.295 Osteo-porosis can, in principle, accelerate the release of stores of Al, Ca21 andphosphate from bone into the blood of aged, osteoporotic humans. This wouldresult in higher levels of Al available for uptake into the brain.
2.6.3 Brain Aging and Loss of Neuroplasticity
As mentioned previously, Al measurements using spectroscopic techniqueshave shown a net Al increase in brain tissue as humans age.15,42–44 Cumulativedamage to CNS neurons is to some extent offset by (1) neuron redundancy; (2)compensatory neuroplasticity involving axonal and dendritic sprouting; and (3)synaptogenesis. Here, we examine some possible reasons that, in view of theseresources, older brains are more vulnerable to Al neurotoxicity and AD thanyounger brains.
Firstly, some age-related attrition of pyramidal cells occurs, reducingneuronal redundancy.296 On average, cortical neurons show a 9.5% decrease intheir numbers between ages 20 and 90 years.297 Around 85 000 neurons are losteach day of the life span, equivalent to approximately one per second.296 Also,40–50% of the length of the myelinated nerve fiber is lost in advanced old age.Some brain regions, such as the entorhinal cortex and the subiculum/CA1 zone,have precise requirements for their connections and relatively low redundancy.Modest cell losses in these brain regions may produce dramatic deficits.296
Exhaustion of compensatory neuroplasticity leads to continuing damage inthese brain regions and loss of cognition.198–200,202
Secondly, the vast majority of neurons are established during fetal growth298
and survive into old age. Neurons are very long-lived cells that show structuraland functional differences as they age. Older neurons have lower rates ofRNA and protein synthesis than younger neurons.299,300 Older cells have lesscapacity for RNA and DNA repair.301
Thirdly, neural plasticity has reduced efficacy with increasing age. Olderneurons have less ability than young neurons for sprouting and re-innervationof damaged brain areas. For example, sprouting in the rat olfactory bulbincreases during the growth phase and up to the onset of old age (i.e., between 3and 24 months). Sprouting decreases slightly between 24 and 27 months andthen decreases sharply after 27 months.302 This age-related decrease in neural
Life-Long Exposure to Aluminium Compounds may Cause Alzheimer’s Disease 67

sprouting and re-innervation may explain why most rats that developedcognitive deterioration after chronic Al exposure showed decline in theirT-maze performance scores from 27 months of age onwards, and why ADincidence increases exponentially after age 65.
2.6.4 Al-Containing Dietary Supplements Specifically Marketed
for Older Individuals
Most very old people who are still alive at time of writing (2012) were born andraised in an era before the currently available array of Al-containingsupplements gained popularity, and have had relatively low Al exposure for atleast part of their lives. However, certain of these supplements have high Alcontent and are currently being marketed specifically for the older consumer.
Digestive disorders are common in elderly people, and many routinelyconsume Al hydroxide- or Al phosphate-based antacids, even thoughmagnesium-based antacids are also effective and potentially less toxic. Somepeople consume between 840 and 5000mg Al per day from antacids.303 TheseAl salts are poorly soluble and are largely trapped by intestinal mucus, so theingested amount is disproportional to the amount absorbed. Nevertheless, astudy involving healthy human volunteers has shown some Al absorptionoccurs from antacid ingestion.27
Supplemental calcium is often recommended for older people, especially forpost-menopausal women. Calcium supplements are typically contaminatedwith Al; for example, supplements derived from oyster shells provide a sourceof Ca21, but they also provide about 12 mg Al per day.304 Influenza vaccines,recommended annually for older people, are Al-adjuvanted in the UK andsome other British Commonwealth countries. As mentioned, Al adjuvant invaccines delivers at least 100 times more Al than a comparable oral Al dosebecause injections bypass the gastrointestinal mucosal barrier.
2.7 Conclusions
Alzheimer’s disease is a relatively new form of dementia. The history of AD isassociated with increasing urbanization, changes in diet and other healthpractices such as immunization rates. The author has reviewed evidence thatroutine and chronic exposure to relatively low Al doses from the diet producesa slow but progressive increase in Al content throughout life in the brains oflaboratory rats and humans. Susceptible individuals that develop chronic Alneurotoxicity show neuropathological characteristics essentially the same asthose observed in AD, apart from species-specific differences, and share somebehavioral characteristics. Dietary Al doses, delivered to animals over aprolonged time period, faithfully replicate the progression of AD and reveal itspotential consequences in human brains.
Modern evidence reveals that the most salient pathological features in theAD brain are high stage Al accumulation in pyramidal cells, accompanied by
68 Chapter 2

microtubule depletion. A cascade of effects follows. Al-induced microtubuledepletion results in dieback of the axon and dendrites, and loss of synapsedensity, accounting for the loss of connectivity between affected neurons andthe cortical atrophy that eventually occurs. These characteristics affect sporadicpyramid cells as well as groups of adjacent cells with high-stage aluminumaccumulation that constitute expanding lesions in AD-vulnerable brain regions.
All brains of rats with cognitive deterioration were distinguished by extensivedamage to the cells of origin for the perforant path in the entorhinal cortex andthe presence of at least one substantial lesion in the subiculum/CA1 zone,consisting of pyramidal cells with high stage nuclear Al staining, microtubuledepletion and dendritic dieback. Taken together, these lesions cause cognitivedeterioration by effectively isolating the hippocampal formation from theneocortex.
NFTs in AD-affected human brains have been shown to involve Alaccumulation in their formation and growth. NFTs apparently form as aprotective mechanism, binding neurotoxic Al in the cytoplasm and slowing Alaccumulation in the nucleus. Granulovacuolar degeneration is another char-acteristic shared between Al neurotoxicity and AD.
Al-exposed animal brains reproduce all major stages of amyloid formation,from up-regulation of APP to the laying down of neuritic plaques in theneuropil. On a biochemical level, Al competes with essential metal ions,disrupting calcium and iron metabolism. Al also produces ROS that oxidize cellproteins and membranes and provoke an inflammatory response in the brain.These pathological features are all characteristic of AD.
Age-related changes in the kidneys, bone and brain increase the amount ofbioavailable Al in circulation and contribute to the development of AD. Theslow but relentless net accumulation of Al in neurons over decades produces acontinuous insult on large pyramidal neurons in certain AD-vulnerable brainregions. Eventually, APOE-dependent neuroplasticity is up-regulated,requiring other neurons to compensate for Al damage by re-innervation. Cellshave finite repair capacities which eventually exhaust, thereby leading to re-innervation failure. The number of decades required to reach this stage explainswhy old age has been recognized as the main risk factor for AD.
Chronic Al neurotoxicity is virtually the same as AD when species-specificdifferences are taken into account. Chronic Al neurotoxicity is the onlyproposed cause of AD that shows so many consistent characteristics. Apparentinconsistencies between chronic Al neurotoxicity and AD have now beenexplained.
Some people, including scientists, may challenge the link between Al andAD, despite the extensive data that support the link. Consensus on industry-sensitive subjects may be hard to reach, just as some continue to question theevidence for smoking as a cause of lung cancer.
However, regulatory agencies such as the US FDA should now considerwhether Al deserves to retain its GRAS rating, and whether to place strictlimitations on its inclusion in products that can contribute to the Al burden ofthe brain in AD-vulnerable regions.
Life-Long Exposure to Aluminium Compounds may Cause Alzheimer’s Disease 69

Declaration
The author has no conflict of interest to declare.
Acknowledgments
The author is most grateful to Don Bryson-Taylor for his generous offer toreview this chapter and for his helpful editorial suggestions. The author alsoappreciates the skillful help of Dirce Everett with the illustrations.
References
1. G. M. Humphry,Old Age: The Results of Information Received RespectingNearly Nine Hundred Persons who had Attained the Age of Eighty Years,Including Seventy-four Centenarians, MacMillan and Bowes, Cambridge,1889, p. 48.
2. B. A. Blansjaar, R. Thomassen and H. W. Van Schaick, Int. J.Geriatr. Psychiatry, 2000, 15, 219–225.
3. Centre for Epidemiology and Research, 2010 Report on Adult Health fromthe New South Wales Population Health Survey, NSW Department ofHealth, Sydney, 2011, pp. 87–89 and 102–104. http://www.health.nsw.gov.au/resources/publichealth/surveys/pdf/hsa_10pub.pdf (last accessedNovember 2011).
4. A. Alzheimer, Zentralbl. Nevenheilkunde Psychiatrie, 1907, 30, 177–179.5. A. Alzheimer, Z. Gesamte Neurol. Psychiatrie, 1911, 4, 356–385.6. B. O. Osuntokun, A. Ogunniyi, E. E. U. Akang, P. U. Aghadiuno,
A. Ilori, E. A. Bamgboye, K. Beyreuther and C. Masters, Lancet, 1994,343, 56.
7. V. Chandra, R. Pandav, H. H. Dodge, J. M. Johnston, S. H. Belle,S. T. DeKosky and M. Ganguli, Neurology, 2001, 57, 985–989.
8. World Health Organization and Alzheimer’s Disease International,Dementia: A Public Health Priority, WHO Press, Geneva, 2012.
9. J. C. Morris, Clin. Geriatr. Med., 1994, 10, 257–276.10. L. E. Nee, R. Eldridge, T. Sunderland, C. B. Thomas, D. Katz,
B. S. Thompson, H. Weingartner, H. Weiss, C. Julian and R. Cohen,Neurology, 1987, 37, 359–363.
11. H. Creasey, A. Jorm, W. Longley, G. A. Broe and A. S. Henderson,Neurology, 1989, 39, 1474–1476.
12. I. Raiha, J. Kaprio, M. Koskenvuo, T. Rajala and L. Sourander, Lancet,1996, 347, 573–578.
13. W. J. Lukiw, M. E. Percy and T. P. Kruck, J. Inorg. Biochem., 2005, 99,1895–1898.
14. L. Simonsen, H. Johnsen, S. P. Lund, E. Matikainen, U. Midtgard andA. Wennberg, Scand. J. Work Environ. Health, 1994, 20, 1–12.
15. D. R. Crapper, S. S. Krishnan and A. J. Dalton, Science, 1973, 180,511–513.
70 Chapter 2

16. US FDA. http://www.fda.gov/ForIndustry/ColorAdditives/RegulatoryProcess HistoricalPerspectives/default.htm (last accessed November,2011).
17. J. Snow, Lancet, 1857, (ii), 4-5; reprinted in Int. J. Epidemiol. 2003, 32,336–337.
18. F. P. Underhill, F. I. Peterman and S. L. Steel, J. Physiol. (London), 1929,90, 52–61.
19. W. J. Gies, JAMA, 1911, 57, 816–821.20. J. S. Greger, Annu. Rev. Nutr., 1993, 13, 42–63.21. J. S. Greger and J. E. Sutherland, Crit. Rev. Clin. Lab. Sci., 1997, 34,
439–474.22. Committee on the GRAS List Survey, Phase III, Estimates of daily intake
in The 1977 Survey of Industry on the Use of Food Additives, NationalAcademy of Science, Washington, DC, 1979, Vol. 3.
23. L. R. Kavoussi, L. D. Gelstein and G. L. Andriole, J. Urol., 1986, 136,665–667.
24. P. Hantson, P. Mahieu, M. Gersdorff, C. Sindic and R. Lauwerys, Clin.Toxicol., 1995, 33, 645–648.
25. M.W.Whitehead, G. Farrar, G. L. Christie, J. A. Blair, R. P. H. Thompsonand J. J. Powell, Am. J. Clin. Nutr., 1997, 65, 1446–1452.
26. J. J. Powell, C. C. Ainley, R. Evans and R. P. H. Thompson, Gut, 1994,35, 1053–1057.
27. R. R. Recker, A. J. Blotcky, J. A. Leffler and E. P. Rack, J. Lab. Clin.Med., 1977, 90, 810–815.
28. R. A. Yokel, S. S. Rhineheimer, P. Sharma, D. Elmore, D andP. J. McNamara, Toxicol. Sci., 2001, 64, 77–82.
29. T. B. Drueke, Nephrol., Dial., Transplant., 2002, 17, 13–16.30. G. J. Naylor, A. H. W. Smith, A. McHarg, P. Walker, B. Shepherd,
N. I. Ward and M. Harper, Trace Elem. Psychiatry, 1989, 6, 93–95.31. J. P. Day, J. Barker, L. J. A. Evans, J. Perks, P. J. Seabright,
P. Ackrill, J. S. Lilley, P. V. Drumm and G. W. A. Newton, Lancet, 1991,337, 1345.
32. G. A. Trapp, Life Sci., 1983, 33, 311–316.33. J. A. Edwardson, P. B. Moore, I. N. Ferrier, J. S. Lilley, G. W. A. Newton,
J. Barker, J. Templar and J. P. Day, Lancet, 1993, 342, 211–212.34. S. Yumoto, H. Nagai, M. Imamura, H. Matsuzaki, K. Hayashi,
A. Masuda, H. Kumazawa, H. Ohashi and K. Kobayashi, Nucl. Inst.Method. Physics. Res. B, 1997, 123, 279–282.
35. J. Walton, C. Tuniz, D. Fink, G. Jacobsen and D. Wilcox, Neurotox-icology, 1995, 16, 187–190.
36. T. B. Drueke, P. Jouhanneau, H. Banide and B. Lacour, Clin. Sci., 1997,92, 63–67.
37. T. A. Zafar, C. M. Weaver, B. R. Martin, R. Flarend and D. Elmore,Proc. Soc. Exp. Biol. Med., 1997, 216, 81–85.
38. S. Yumoto, H. Nagai, K. Kobayashi, A. Tamate, S. Kakimi andH. Matsuzaki, J. Inorg. Biochem., 2003, 97, 155–160.
Life-Long Exposure to Aluminium Compounds may Cause Alzheimer’s Disease 71

39. S. A. Burrell and C. Exley, BMC Pediatr., 2010, 10, 63.40. N. W. Baylor, W. Egan and P. Richman, Vaccine, 2002, 20(Suppl. 3),
S18–S23.41. K. Redhead, G. J. Quinlan, R. G. Das and J. M. C. Gutteridge,
Pharmacol. Toxicol., 1992, 70, 278–280.42. W. R. Markesbery, W. D. Ehmann, T. I. Hossain, M. Alauddin and
D. T. Goodin, Ann. Neurol., 1981, 10, 511–516.43. J. R. McDermott, A. I. Smith, K. Iqbal and H. M. Wisniewski,
Neurology, 1979, 29, 809–814.44. H. Shimizu, T. Mori, M. Koama, M. Sekiya and H. Ooami, Nihon Ronen
Igakkai Zasshi - Jpn. J. Geriatr. (Tokyo), 1994, 31, 950–960.45. W. R. Markesbery, W. D. Ehmann, M. Alauddin and T. I. M. Hossain,
Neurobiol., Aging, 1984, 5, 19–28.46. A. C. Alfrey, G. R. LeGendre and W. D. Kaehny, N. Engl. J. Med., 1976,
294, 184–188.47. M. Yasui, Y. Yase, K. Ota and R.M. Garruto, Neurotoxicology, 1991, 12,
603–614.48. M. Yasui, Y. Yase, K. Ota and R. M. Garruto,Neurotoxicology, 1991, 12,
615–620.49. R. M. Garruto, Curr. Alzheimer Res., 2006, 3, 397–401.50. S. Kobayashi, N. Hirota and K. Saito, Acta Neuropathol., 1987, 74, 47–52.51. J. R. Walton, Biotech. Histochem., 2004, 79, 169–176.52. B. Solomon, R. Koppel and J. Jossiphov, Brain Res. Bull., 2001, 55,
253–256.53. J. R. Walton, Neurotoxicology, 2006, 27, 385–394.54. J. R. Walton, Neurotoxicology, 2009, 30, 1059–1069.55. S. Yumoto, H. Nagai, M. Imamura, H. Matsuzaki, K. Hayashi,
A. Masuda, H. Kumazawa, H. Ohashi and K. Kobayashi, Nucl. Instr.Meth. Physics Res. B, 1997, 123, 279–282.
56. J. R. Walton, J. Alzheimer’s Dis., 2010, 22, 65–72.57. R. C. A. Pearson, M. M. Esiri, R. W. Hiorns, G. K. Wilcock and
T. P. Powell, Proc. Natl. Acad. Sci. U.S.A., 1985, 82, 4531–4534.58. R. A. Armstrong, Neurosci. Lett., 1993, 160, 57–60.59. M. M. Esiri and S. A. Chance, J. Alzheimer’s Dis., 2006, 9, 79–89.60. P. O. Ganrot, Environ. Health Persp., 1986, 65, 363–441.61. R. B. Martin, Clin. Chem., 1986, 32, 1797–1806.62. J. L. Miller, C. M. Hubbard, B. J. Litman and T. L. Macdonald, J. Biol.
Chem., 1989, 264, 243–250.63. G. A. Trapp, Kidney Int., 1986, 29, S12–S16.64. T. L. Macdonald, W. G. Humphreys and R. B. Martin, Science, 1987,
236, 183–186.65. S. C. Bondy, S. F. Ali and S. Guo-Ross,Mol. Chem. Neuropathol., 1998A,
34, 219–232.66. S. C. Bondy, S. X. Guo-Ross and J. Pien, Neurotoxicology, 1998B, 19,
65–71.67. C. Exley, Free Radic. Biol. Med., 2004, 36, 380–387.
72 Chapter 2

68. S. Kong, S. Liochev and I. Fridovich, Free Radic. Biol. Med., 1992, 13,79–81.
69. L. Meglio and P. I. Oteiza, Neurochem. Res., 1999, 24, 1001–1008.70. D. Pratico, K. Uryu, S. Sung, S. Tang, J. W. Trojanowski and
V.M.-Y. Lee, FASEB J., 2002, 16, 1138–1141.71. R. M. Ward, Y. Zhang and R. R. Crichton, J. Inorg. Biochem., 2001, 87,
9–14.72. S. J. Karlik, G. L. Eichhorn, P. N. Lewis and D. R. Crapper,
Biochemistry, 1980, 19, 5991–5998.73. S. V. Verstraeten, M. S. Golub, C. L. Keen and P. I. Oteiza, Arch.
Biochem. Biophys., 1997, 344, 289–294.74. T. P. Flaten, Brain Res. Bull., 2001, 55, 187–196.75. V. Rondeau, H. Jacmin-Gadda, D. Commenges, C. Helmer and
J.-F. Dartigues, Am. J. Epidemiol., 2009, 169, 489–496.76. M. A. Rogers and D. G. Simon, Age Ageing, 1999, 28, 205–209.77. J. R. Walton, Neurosci. Lett., 2007, 412, 29–33.78. J. R. Walton, Neurotoxicology, 2009, 30, 182–193.79. J. Loesche and O. Steward, Brain Res. Bull., 1977, 2, 31–39.80. P. B. Moore, J. P. Day, G. A. Taylor, I. N. Ferrier, L. K. Fifield and
J. A. Edwardson, Dement. Geriatr. Cogn. Disord., 2000, 11, 66–69.81. J. M. Kellet, A. Taylor and J. J. Oram, Lancet, 1986, i, 682.82. A. Van Rhijn, F. M. Corrigan and N. I. Ward, Trace Elem. Med, 1989, 6,
24–26.83. F. M. Corrigan, J. S. Crichton, A. G. Van Rhijn, E. R. Skinner and
N. I. Ward, Clin. Chim. Acta, 1992, 211, 121–123.84. N. B. Roberts, A. Clough, J. P. Bellia and J. Y. Kim, J. Inorg. Biochem.,
1998, 69, 171–176.85. C. Smorgon, E. Mari, A. R. Atti, E. Dalla Nora, P. F. Zamboni,
F. Calzoni, A. Passaro and R. Fellin, Arch. Gerontol. Geriatr., Suppl.,2004, 9, 393–402.
86. D. Shore, M. Millson, J. L. Holtz, S. W. King, T. P. Bridge andR. J. Wyatt, Biol. Psychiatry, 1980, 15, 971–977.
87. P. B. Moore, J. A. Edwardson, I. N. Ferrier, G. A. Taylor, D. Lett,S. P. Tyrer, J. P. Day, S. J. King and J. S. Lilley, Biol. Psychiatry, 1997,41, 488–492.
88. A. H. Ropper and K. R. S. Williams, Neurology, 1980, 30, 639–644.89. D. M. A. Mann in Down Syndrome and Alzheimer’s Disease, ed. V.P.
Prasher, Radcliffe Publishing Ltd, Milton Keynes, 2006, pp. 15–36.90. H. Braak and E. Braak, Acta Neuropathol., 1991, 82, 239–259.91. T. Kovacs, N. J. Cairns and P. L. Lantos, NeuroReport, 2001, 12, 285–288.92. D. Holland, J. B. Brewer, D. L. Hagler, C. Fennema-Notestine and
A. M. Dale, Proc. Natl. Acad. Sci. U.S.A., 2009, 106, 20954–20959.93. S. E. Arnold, B. T. Hyman, J. Flory, A. R. Damasio and G. W. Van
Hoesen, Cerebral Cortex, 1991, 1, 103–116.94. N. W. Kowall, W. W. Pendlebury, J. B. Kessler, D. P. Perl and
M. F. Beal, Neuroscience, 1989, 29, 329–337.
Life-Long Exposure to Aluminium Compounds may Cause Alzheimer’s Disease 73

95. J. A. Edwardson, I. N. Ferrier, F. K. McArthur, I. G. McKeith, I.McLaughlin, C. M. Morris, A. E. Oakley, S. A. Mountfort, A. E. Oakley,G. A. Taylor, M. K. Ward and J. M. Candy in Aluminum in ChemistryBiology and Medicine, A Series of Advances, eds. M. Nicolini, P.F. Zattaand B. Corain, Raven Press, New York, 1991, vol. 1, pp. 85–96.
96. C. M. Morris, J. M. Candy, A. E. Oakley, G. A. Taylor, S. Mountfort,H. Bishop, M. K. Ward, C. A. Bloxham and J. A. Edwardson, J Neurol.Sci., 1989, 94, 295–306.
97. W. A. Jefferies, M. R. Brandon, S. V. Hunt, A. F. Williams, K. C. Gatterand D. Y. Mason, Nature, 1984, 312, 162–163.
98. A. J. Roskams and J. R. Connor, Proc. Natl. Acad. Sci. U.S.A., 1990, 87,9024–9027.
99. E. Andrasi, N. Pali, Z. Molnar and S. Kosel, J. Alzheimer’s Dis., 2005, 7,273–284.
100. R. Rusina, R. Matej, L. Kasparova, J. Kukal and P. Urban, Neurotox.Res., 2011, 20, 329–330.
101. G. A. Trapp, Biol. Psychiatry, 1978, 13, 709–718.102. D. R. Crapper, S. S. Krishnan and S. Quittkat, Brain, 1976, 99,
67–80.103. R. D. Traub, T. C. Rains, R. M. Garruto, D. C. Gajdusek and
C. J. Gibbs, Neurology, 1981, 31, 986–990.104. N. Xu, V. Majidi, W. R. Markesbery and W. D. Ehmann, Neurotoxi-
cology, 1992, 13, 735–743.105. F. M. Corrigan, G. P. Reynolds and N. I. Ward, BioMetals, 1993, 6,
149–154.106. A. V. Everitt, Proc. Aust. Assoc. Gerontol., 1991, 26, 79–82.107. J. R. Walton and M. X. Wang, J. Inorg. Biochem., 2009, 103, 1548–
1554.108. J. R. Walton, J. Inorg. Biochem., 2007, 101, 1275–1284.109. G. W. Van Hoesen and D. N. Pandya, Brain Res., 1975, 95, 39–59.110. G. W. Van Hoesen, B. T. Hyman and A. R. Damasio, Hippocampus,
1991, 1, 1–8.111. S. A. Bayer in The Rat Central Nervous System: Forebrain and Midbrain,
ed. G. Paxinos, 1st edn, Academic Press, San Diego, 1985, pp. 335–352.112. R. M. Beckstead, Brain Res., 1978, 152, 249–264.113. B. T. Hyman, G. W. Van Hoesen, L. J. Kromer and A. R. Damasio, Ann.
Neurol., 1986, 20, 472–481.114. S. E. Arnold, B. T. Hyman, J. Florey, A. R. Damasio and D. W. Van
Hoesen, Cerebral Cortex, 1991, 1, 103–116.115. D. P. Perl and A. R. Brody, Science, 1980, 208, 297–299.116. P. F. Good, D. P. Perl, L. M. Bierer and J. Schmeidler, Ann. Neurol.,
1992, 31, 286–292.117. J. R. Walton, Int. J. Alzheimer’s Dis., 2012, p. 17, doi:10.1155/
2012/914947.118. J. R. Walton, J. Alzheimer’s Dis., 2012, 29, 255–273.119. K. N. Green and F. M. LaFerla, Neuron, 2008, 59, 190–194.
74 Chapter 2

120. I. N. Ferrier, A. Leake, G. A. Taylor, I. G. McKeith, A. F. Fairbairn,C. J. Robinson, R. M. Francis and J. A. Edwardson, Age Ageing, 1990,19, 368–375.
121. M. Berrocal, D. Marcos, M. R. Sepulveda, M. Perez, J. Avila andA. M. Mata, FASEB J., 2009, 23, 1826–1834.
122. R. S. Jope, L. Song, X. Li and R. Powers, Neurobiol. Aging, 1994, 15,221–226.
123. R. S. Jope, J. Alzheimer’s Dis., 1999, 1, 231–247.124. A. F. Greenwood, R. E. Powers and R. S. Jope, Neuroscience, 1995, 69,
125–138.125. G. Cole, K. R. Dobkins, L. A. Hansen, R. D. Terry and T. Saitoh, Brain
Res., 1988, 452, 165–174.126. H. Matsushima, S. Shimohama, M. Chachin, T. Taniguchi and
J. Kimura, J. Neurochem., 1996, 67, 317–323.127. M. F. Bear and A. Kirkwood, Curr. Opin. Neurobiol., 1993, 3, 197–202.128. W. R. Holmes, J. Comput. Neurosci., 2000, 8, 65–85.129. M. E. Gnegy, Crit. Rev. Neurobiol., 2000, 14, 91–129.130. F. Battaglia, H.-Y. Wang, M. F. Ghilardi, E. Gashi, A. Quartarone,
E. Friedman and R. A. Nixon, Biol. Psychiatry, 2007, 62, 1405–1412.131. D. Orihuela, V. Meichtry and M. Pizarro, J. Inorg. Biochem., 2005, 99,
1879–1886.132. K. A. Cox and M. A. Dunn, J. Nutr., 2001, 131, 2007–2013.133. B. Platt and D. Busselberg, Cell. Mol. Neurobiol., 1994, 14, 819–829.134. B. Platt, H. Haas and D. Busselberg, NeuroReport, 1994, 5, 2329–2332.135. N. Arispe, E. Rojas and H. B. Pollas, Proc. Natl. Acad. Sci. U.S.A., 1993,
90, 567–571.136. D. Julka and K. D. Gill, Biochim. Biophys. Acta, 1996, 1315, 47–54.137. S. Sarin, D. Julka D and K. D. Gill, Mol. Cell. Biochem., 1997, 168,
95–100.138. S. Kirischuk, N. Pronchur and A. Verkhratsky, Neuroscience, 1992, 50,
947–951.139. A. C. Nostrandt, T. J. Shafer, W. R. Mundy and S. Padilla, Toxicol. Appl.
Pharmacol., 1996, 136, 118–125.140. L. J. McDonald and M. D. Mamrack, Biochem. Biophys. Res. Commun.,
1988, 155, 203–208.141. M. Cochran, D. C. Elliott, P. Brennan and V. Chawtur, Clin. Chim. Acta,
1990, 194, 167–172.142. H. Kurita, A. Nakatomi, H. Shimahara, M. Yazawa and S.-Y. Ohki,
Biochem. Biophys. Res. Commun., 2005, 333, 1060–1065.143. T. Wolf, B. Solomon, D. Ivnitski, J. Rishpon and G. Fleminger,
J. Mol. Recogn., 1998, 11, 14–19.144. R. Levi, T. Wolf, G. Fleminger and B. Solomon, Mol. Cell. Biochem.,
1998, 189, 41–46.145. B. J. Farnell, D. R. Crapper McLachlan, K. Baimbridge, U. De Boni,
L. Wong and P. L. Wood, Exp. Neurol., 1985, 88, 68–83.146. B. Shi, K. Chou and A. Haug, Mol. Cell. Biochem., 1993, 121, 109–118.
Life-Long Exposure to Aluminium Compounds may Cause Alzheimer’s Disease 75

147. B. Platt, D. O. Carpenter, D. Busselberg, K. G. Reymann and G. Riedel,Exp. Neurol., 1995, 134, 73–86.
148. M. Wang, D.-Y. Ruan, J.-T. Chen and Y.-Z. Xu, Food Chem. Toxicol.,2002, 40, 471–478.
149. J. Chen, M. Wang, D. Ruan and J. She, Neuroscience, 2002, 112, 879–887.150. B. Hallgren and P. Sourander, J. Neurochem., 1958, 3, 41–51.151. C. M. Morris, J. M. Candy, C. A. Bloxham and J. A. Edwardson,
Biochem. Soc. Trans., 1989, 18, 647–648.152. K. Pantopoulos, Ann. N.Y. Acad. Sci., 2004, 1012, 1–13.153. M. A. Deibel, W. D. Ehmann and W. R. Markesbery, J. Neurol. Sci.,
1996, 143, 137–142.154. M. A. Smith, K. Wehr, P. L. Harris, S. L. Siedlak, J. R. Connor and
G. Perry G, Brain Res., 1998, 788, 232–236.155. C. C. Winterbourn, Toxicol. Lett., 1995, 82–83, 969–974.156. Y. Kim, L. Olivi, J. H. Cheong, A. Maertens and J. P. Bressler, Toxicol.
Appl. Pharmacol., 2007, 230, 349–356.157. K. Yamanaka, N. Minato and K. Iwai, FEBS Lett., 1999, 462, 216–
220.158. K. Abreo, F. Abreo, M. L. Sella and S. Jain, J. Neurochem., 1999, 72,
2059–2064.159. S. Oshiro, M. Kawahara, S. Mika, K. Muramoto, K. Kobayashi,
R. Ishige, K. Nozawa, M. Hori, C. Yung, S. Kitajima and Y. Kuroda,J. Biochem., 1998, 123, 42–46.
160. A. Nunomura, G. Perry, A. Gjumrakch, K. Hirai, A. Takeda,E. K. Balraj, P. K. Jones, H. Ghanbari, T. Wataya, S. Shimohama,S. Chiba, C. S. Atwood, R. B. Petersen and M. A. Smith, J. Neuropathol.Exp. Neurol., 2001, 60, 759–767.
161. O. I. Aruoma, B. Halliwell, M. J. Laughton, G. J. Quinlan andJ. M. C. Gutteridge, Biochem. J., 1989, 258, 617–620.
162. E. Y. Yang, S. X. Guo-Ross and S. C. Bondy, Brain Res., 1999, 839,221–226.
163. H. Arai, K. Kosaka and R. Iizuka, J. Neurochem., 1984, 43, 388–393.164. P. T. Francis, A. M. Palmer, N. R. Sims, D. M. Bowen, A. N. Davidson,
M. M. Esiri, D. Neary, J. S. Snowden and G. K. Wilcock, New Engl.J. Med., 1985, 313, 7–11.
165. C. M. Yates, J. Simpson and A. Gordon, Neurosci. Lett., 1986, 65,189–192.
166. R. Katzman, Alzheimer’s disease, New Engl. J. Med., 1986, 314, 964–973.167. D. M. Bowen, J. S. Benton, J. A. Spillane, C. C. T. Smith and S. J. Allen,
J. Neurol. Sci., 1982, 57, 191–202.168. R. S. Jope, L. Song and R. E. Powers,Neurobiol Aging, 1997, 18, 111–120.169. J. K. Blusztajn, M. Liscovitch and U. I. Richardson, Proc. Natl. Acad.
Sci. U.S.A., 1987, 84, 5474–5477.170. P.W. Schenk and B. E. Snaar-Jagalska, Biochim. Biophys. Acta, 1449, 1–24.171. T. Dobransky, W. L. Davis and R. J. Rylett, J. Biol. Chem., 2001, 276,
22244–22250.
76 Chapter 2

172. C. Sumi-Ichinose, F. Urano, R. Kuroda, T. Ohye, M. Kojima,M. Tazawa, H. Shiraishi, Y. Hagino, T. Nagatsu, T. Nomura andH. Ichinose, J. Biol. Chem., 2001, 276, 41150–41160.
173. J. M. Anderson, C. G. B. Hamon, R. A. Armstrong and J. A. Blair inChemistry and Biology of Pteridines, eds. B. A. Cooper and V. M.Whitehead, Walter de Gruyter & Co., Berlin, 1986, pp. 327–330.
174. A. D. Kay, S. Milstien, S. Kaufman, H. Creasey, J. V. Haxby,N. R. Cutler and S. I. Rapoport, Arch. Neurol., 1986, 43, 996–999.
175. J. R. Hofstetter, I. Vincent, O. Bugiani, B. Ghetti and J. A. Richter,Neurochem. Pathol., 1987, 6, 177–193.
176. M. F. Beal, M. F. Mazurek, D. W. Ellison, N. W. Kowall, P. R. Solomonand W. W. Pendlebury, Neuroscience, 1989, 29, 339–346.
177. M. Tsunoda and R. P. Sharma, J. Trace Elements Med. Biol., 1996, 13,224–231.
178. P. P. Goncalves and V. S. Silva, J. Inorg. Biochem., 2007, 101, 1291–1338.179. A. Szutowicz, M. Tomaszewicz, A. Jankowska, B. Madziar and
H. Bielarczyk, Metabol. Brain Dis., 2000, 15, 29–44.180. V. S. Silva, M. A. Nunes, J. M. Cordeiro, A. I. Calejo, S. Santos,
P. Neves, A. Sykes, F. Morgado, Y. Dunant and P. P. Goncalves,Toxicology, 2007, 236, 158–177.
181. S. Kumar, Med. Hypothesis, 1999, 52, 557–559.182. R. A. Armstrong, J. Anderson, J. D. Cowburn, J. Cox and J. A. Blair,
Biol. Chem. Hoppe-Seyler, 1992, 373, 1075–1078.183. S. Katoh, T. Sueoka, Y. Yamamoto and S. Y. Takahashi, FEBS Lett.,
1994, 341, 227–232.184. E. G. McGeer and P. I. McGeer,Neuropsychopharmacol. Biol. Psychiatry,
2003, 27, 741–749.185. V. Colangelo, J. Schurr, M. J. Ball, R. P. Pelaez, N. G. Bazan and
W. J. Lukiw, J. Neurosci. Res., 2002, 70, 462–473.186. A. Campbell and S. C. Bondy, Cell Mol. Biol., 2000, 46, 721–730.187. A. Campbell, E. Y. Yang, M. Tsai-Turton and S. C. Bondy, Brain Res.,
2002, 933, 60–65.188. A. Campbell, A. Becaria, D. K. Lahiri, K. Sharman and S. C. Bondy,
J. Neurosci. Res., 2004, 75, 565–572.189. P. N. Alexandrov, Y. Zhao, A. I. Pogue, M. A. Tarr, T. P. Kruck,
M. E. Percy, J. G. Cui and W. J. Lukiw, J. Alzheimer’s Dis., 2005, 8,117–127.
190. R. A. Yokel and J. P. O’Callaghan, Neurotoxicol. Teratol., 1998, 20,55–60.
191. B. Platt, G. Fiddler, G. Riedel and Z. Henderson, Brain Res. Bull., 2001,55, 257–267.
192. C. Theiss and K. Meller, Cell Tissue Res., 2002, 310, 143–154.193. D. A. Aremu and S. Meshitsuka, Brain Res. Rev., 2006, 52, 193–200.194. X. B. Li, H. Zheng, Z. R. Zhang, M. Li, Z. Y. Huang, H. J. Schluesener,
Y. Y. Li and S. Q. Xu, Nanomedicine, 2009, 5, 473–479.195. P. W. Baas, Int. Rev. Cytol., 2002, 212, 41–62.
Life-Long Exposure to Aluminium Compounds may Cause Alzheimer’s Disease 77

196. E. G. Gray, M. Paula-Barbosa and A. Roher, Neuropathol. Appl.Neurobiol., 1987, 13, 91–110.
197. B. Hempen and J.-P. Brion, J. Neuropathol. Exp. Neurol., 1996, 55,964–972.
198. M. E. Scheibel, R. D. Lindsay, U. Tomiyasu and A. B. Scheibel, Exp.Neurol., 1976, 53, 420–430.
199. S. J. Buell and P. D. Coleman, Brain Res, 1981, 214, 33–41.200. S. D. Hanks and D. G. Flood, Brain Res., 1991, 540, 63–82.201. D. G. Flood, S. J. Buell, C. H. Defiore, G. J. Horwitz and P. D. Coleman,
Brain Res., 1985, 345, 366–368.202. I. Adams, Brain Res., 1987, 424, 343–351.203. D. G. Flood and P. D. Coleman, Can. J. Neurol. Sci., 1986, 13, 475–479.204. J. W. Geddes, D. T. Monaghan, C. W. Cotman, I. T. Lott, R. C. Kim and
H.C., Science, 1985, 230, 1179–1181.205. S. J. Buell and P. D. Coleman, Brain Res., 1981, 214, 23–41.206. T. L. Petit, G. B. Biederman and P. A. McMullen, Exp. Neurol., 1980, 67,
152–162.207. R. D. Terry, E. Masliah, D. P. Salmon, N. Butters, R. DeTeresa, R. Hill,
L. A. Hansen and R. Katzman, Ann. Neurol., 1991, 30, 572–580.208. D. R. Crapper and A. J. Dalton, Physiol. Behav., 1973, 10, 935–945.209. D. R. Crapper and A. J. Dalton, Physiol. Behav., 1973, 10, 925–933.210. A. C. Miu, A. I. Olteanu and M. Miclea, J. Alzheimer’s Dis., 2004, 6,
315–328.211. T. L. Petit, Soc. Neurosci. Abstr., 1977, 3, 351.212. E. Uemura and W. P. Ireland, Exp. Neurol., 1985, 89, 530–542.213. E. Uemura and W. P. Ireland, Exp. Neurol., 1984, 85, 1–9.214. T. Simchowicz, in Histologische und histopathologische Arbeiten uber die
Grosshirnrinde mit besonderer Berucksichtigung der pathologischenAnatomie der Geisteskranken, ed. F. Nissl and A. Alzheimer, GustavFischer Verlag, Jena, 1911, pp. 267–443.
215. Y. Jing, Z. Wang and Y. Song, Synapse, 2004, 52, 292–298.216. M. J. West, P. D. Coleman, D. G. Flood and J. C. Troncosa, Lancet,
1994, 344, 769–772.217. R. D. Terry, A. Peck, R. DeTeresa, R. Schechter and D. S. Horoupian,
Ann. Neurol., 1981, 10, 184–192.218. C. Q. Mountjoy, M. Roth, N. J. R. Evans and H. M. Evans,
Neurobiol. Aging, 1983, 4, 1–11.219. L. Regeur, G. Badsberg Jensen, H. Pakkenberg, S. M. Evans and
B. Pakkenberg, Neurobiol. Aging, 1994, 15, 347–352.220. M. C. Diamond, An. Acad. Bras. Cienc., 2001, 73, 211–220.221. P. V. Arriagada, J. H. Growdon, E. T. Hedley-Whyte and B. T. Hyman,
Neurology, 1992, 42, 631–639.222. R. W. Shin, V. M. Lee and J. Q. Trojanowski, J. Neurosci., 1994, 14,
7221–7233.223. C. X. Gong, T. J. Singh, I. Grundke-Iqbal and K. Iqbal, J. Neurochem.,
1993, 61, 921–927.
78 Chapter 2

224. C. X. Gong, S. Shaikh, J. Z. Wang, T. Zaidi, I. Grundke-Iqbal andK. Iqbal, J. Neurochem., 1995, 65, 732–738.
225. R.-W. Shin, T. Iwaki, T. Kitamoto, Y. Sato and J. Tateishi, Am.J. Pathol., 1992, 140, 937–945.
226. A. de Calignon, L. M. Fox, R. Pitstick, G. A. Carlson, B. J. Bacskai,T. L. Spires and B. T. Hyman, Nature, 2010, 464, 1201–1203.
227. C. Bancher, C. Brunner, H. Lassmann, H. Budka, K. Jellinger, G. Wiche,F. Seitelberger, I. Grundke-Iqbal, K. Iqbal and H. M. Wisniewski, BrainRes., 1989, 477, 90–99.
228. C. M. Wischik, M. Novak, H. C. Thøgersen, P. C. Edwards, M. J.Runswick, R. Jakes, J. E. Walker, C. Milstein, M. Roth and A. Klug, Proc.Natl. Acad. Sci. U.S.A., 1988, 85, 4506–4510.
229. G. C. Ruben, J. Z. Wang, K. Iqbal and I. Grundke-Iqbal, Microsc. Res.Tech., 2005, 67, 175–195.
230. M. Kidd, Nature, 1963, 197, 192–193.231. K. Hatanpaa, D. R. Brady, J. Stoll, S. I. Rapoport and
K. Chandrasekaran, Ann. Neurol., 1996, 40, 411–420.232. S. I. Rapoport, K. Hatanpaa, D. R. Brady and K. Chandrasekaran,
Neurodegeneration, 1996, 5, 473–476.233. R. Morsch, W. Simon and P. D. Coleman, J. Neuropathol. Exp. Neurol.,
1999, 58, 188–197.234. F. C. Amador, A. G. Henriques, O. A. B. da Cruz e Silva and E. F. da
Cruz e Silva, Neurotox. Teratol., 2004, 26, 387–395.235. J. M. Cordeiro, V. S. Silva, C. R. Oliveira and P. P. Goncalves, J. Inorg.
Biochem., 2003, 97, 132–142.236. C. R. Harrington, C. M. Wischik, F. K. McArthur, G. A. Taylor, J. A.
Edwardson and J. M. Candy, Lancet, 1994, 343, 993–997.237. H. Yamamoto, Y. Saitoh, S. Yasugawa and E. Miyamoto, J. Neurochem,
1990, 55, 683–690.238. S. P. Guy, D. Jones, D. M. A. Mann and R. Itzaki, Neurosci. Lett., 1991,
121, 166–168.239. P. Piccardo, R. Yanagihara, R. M. Garruto, C. J. Gibbs, Jr and
D. C. Gajdusek, Acta Neuropathol., 1988, 77, 1–4.240. D. P. Perl, D. Munoz-Garcia, P. F. Good and W. W. Pendlebury,
J. Neuropath. Exp. Neurol., 1986, 45, 379.241. G. A. King, U. DeBoni and D. R. Crapper, Pharmacol. Biochem. Behav.,
1975, 3, 1003–1009.242. D. R. Crapper in Neurobiology of Aging, eds. R.D. Terry and S. Gershon,
Raven Press, New York, 1976, pp. 405–432.243. U. D. Boni, A. Otvos, J. W. Scott and D. R. Crapper, Acta Neuropathol.,
1976, 35, 285–294.244. J. Savory, Y. Huang, M. M. Herman, M. R. Reyes and M. R. Wills, Brain
Res., 1995, 669, 325–329.245. Y. Huang, M. M. Herman, J. Liu, C. D. Katsetos, M. R. Wills and
J. Savory, Brain Res., 1997, 771, 213–220.246. T. Simchowicz, L’Encephale, 1914, 218–231.
Life-Long Exposure to Aluminium Compounds may Cause Alzheimer’s Disease 79

247. D. W. Dickson, W.-K. Liu, Y. Kress, J. Ku, O. DeJesus and S.-H.C. Yen,Acta Neuropathol., 1993, 85, 463–470.
248. J. S. Su, J. P. Kesslak, E. Head and C. W. Cotman, Acta Neuropathol.,2002, 104, 1–6.
249. X. Sun, Z. Liu, X. Zhang and Z. Zhang, J. Hygiene Res. Wei Sheng YenChiu, 1999, 28, 164–166.
250. A. Hirano, L. T. Kurland, R. S. Krooth and S. Lessell, Brain, 1961, 84,642–661.
251. W. J. Lukiw, Neurochem. Res., 2004, 29, 1287–1297.252. T. L. Young-Pearse, A. C. Chen, R. Chang, C. Marquez and D. J. Selkoe,
Neural Develop., 2008, 3, 15–28.253. G. L. Caporaso, S. E. Gandy, J. D. Buxbaum, T. V. Ramabhadran and
P. Greengard, Proc. Natl. Acad. Sci. U.S.A., 1992, 89, 3055–3059.254. A. Y. Hung and D. J. Selkoe, EMBO J., 1994, 13, 534–542.255. Y.-H. Suh and F. Checler, Pharmacol. Rev., 2002, 54, 469–525.256. T. Dyrks, E. Dyrks and C. L. Masters, FEBS Lett., 1993, 324, 231–
236.257. H. Crystal, D. Dickson, P. Fuld, D. Masur, R. Scott, M. Mehler,
J. Masdeu, C. Kawas, M. Aronson and L. Wolfson, Neurology, 1988, 38,1682–1687.
258. B. D. Shivers, C. Hilbich, G Multhaup, M. Salbaum, K. Beyreuther andP. H. Seeburg, EMBO J., 1988, 7, 1365–1370.
259. D. Games, D. Adams, R. Alessandrini, R. Barbour, P. Berthelette,C. Blackwell, T. Carr, J. Clemens, T. Donaldson, F. Gillespie, S. GuidoHagoplan, K. Johnson-Wood, K. Khan, M. Lee, P. Leibowitz,I. Lieberburg, S. Little, E. Masliah, L. McConlogue, M. Montoya-Zavala,L. Mucke, L. Paganinin, E. Penniman, M. Power, D. Schenk, P. Seubert,B. Snyder, F. Soriano, H. Tan, J. Vitale, S. Wadsworth, B. Wolozin andJ. Zhao, Nature, 1995, 373, 523–527.
260. K. Hsiao, P. Chapman, S. Nilsen, C. Eckman, Y. Harigaya, S. Younkin,F. Yang and G. Cole, Science, 1996, 274, 99–102.
261. N. Sato, K. Imaizumi, T. Manabe, M. Taniguchi, J. Hitomi,T. Katayama, T. Yoneda, T. Morihara, Y. Yasuda, T. Takagi, T. Kudo,T. Tsuda, Y. Itoyama, T. Makifuchi, P. E. Fraser, P. George-Hyslop andM. Tohyama, J. Biol. Chem., 2001, 276, 2108–2114.
262. N. Sato, O. Hori, A. Yamaguchi, J.-C. Lambert, M.-C. Chartier-Harlin,P. A. Robinson, A. Delacourte, A. M. Schmidt, T. Furuyama,K. Imaizumi, M. Tohyama and T. Takagi, J. Neurochem., 1999, 72,2498–2505.
263. S. Matsuzaki, T. Manabe, T. Katayama, A. Nishikawa, T. Yanagita,H. Okuda, Y. S. Yasuda, S. Miyata, S. Meshitsuka and M. Tohyama,J. Neurochem., 2004, 88, 1345–1351.
264. C. Exley, N. C. Price, S. M. Kelly and J. D. Birchall, FEBS Lett., 1993,324, 293–295.
265. E. House, J. Collingwood, A. Khan, O. Korchazkina, G. Berthon andC. Exley, J. Alzheimer’s Dis., 2004, 6, 291–301.
80 Chapter 2

266. F. Ricchelli, D. Drago, B. Filippi, G. Tognon and P. Zatta P, Cell. Mol.Life Sci., 2005, 62, 1724–1733.
267. M. Kawahara, K. Muramoto, K. Kobayashi, H. Mori and Y. Kuroda,Biophys. Res. Commun., 1994, 198, 531–535.
268. P. Netter, M. Kessler, A. Gaucher and B. Bannworth, Ann. Rheum. Dis.,1990, 49, 573–575.
269. K. Shigematsu and P. L. McGeer, Brain Res., 1992, 593, 117–123.270. I. Wakayama, K. J. Song, V.R. Nerurkar, S. Yoshida and R. Garruto,
Brain Res., 1997, 748, 237–240.271. D. Drago, S. Bolognin and P. Zatta, Curr. Alzheimer Res., 2008, 5,
500–507.272. L. F. Rodella, F. Ricci, E. Borsani, A. Stacchiotti, E. Foglio, G. Favero,
R. Rezzani, C. Mariani and R. Bianchi, Histol. Histopathol., 2008, 23,433–439.
273. C. Exley and M. M. Esiri, J. Neurol. Neurosurg. Psychiatry, 2006, 77,877–879.
274. W. A. Banks, M. I. Niehoff, D. Drago and P. Zatta, Brain Res., 2006,1116, 215–221.
275. B. A. Barres and S. J. Smith, Science, 2001, 294, 1296–1297.276. J. Poirier, A. Baccichet, D. Dea and S. Gauthier, Neuroscience, 1993, 55,
81–90.277. E. H. Corder, A. M. Saunders, W. J. Strittmatter, D. E. Schmechel,
P. C. Gaskell, Jr., J. B. Rimmler, P. A. Locke, P. M. Conneally,K. E. Schmader, R. E. Tanzi, J. F. Gusella, G. W. Small, A. D. Roses,M. A. Pericak Vance and J. L. Haines, Neurology, 1995, 45, 1323–1328.
278. B. Teter, J. Mol. Neurosci., 2004, 23, 167–179.279. G. Raisman, Brain Res., 1969, 14, 25–48.280. G. Lynch, D. A. Matthews, S. Mosko, T. Parks and C. Cotman, Brain
Res., 1972, 42, 311–318.281. O. Steward, J. Loesche and W. C. Horton, Brain Res. Bull., 1977, 2,
41–48.282. P. S. Ebersole, P. A. Hess and A. S. Luggen in Toward Healthy Aging:
Human Needs and Nursing Response, ed. M.S. Ledbetter and L.K. Gower,Mosby Inc., St Louis, MO, 2004, pp. 79–108.
283. R. D. Lindeman, J. Tobin and N. W. Shock, J. Am. Geriatr. Soc., 1985,33, 278–285.
284. E. H. Jeffery, K. Abreo, E. Burgess, J. Cannata and J. L. Greger,J. Toxicol. Environ. Health, 1996, 48, 649–665.
285. A. S. Buchman, D. Tanne, P. A. Boyle, R. C. Shah, S. E. Leurgans andD. A. Bennett, Neurology, 2009, 73, 920–927.
286. E. A. Tonna, J. Gerontol., 1978, 33, 163–177.287. N.D. Priest, D. Newton and R.J. Talbot, UKAEA Report AEA-EE-0206,
1991, Harwell, UKAEA.288. M. Lieberherr, B. Gross, G. Cournot-Witmer, M. P. M. Hermann-Erlee
and S. Balsan, Kidney Int., 1987, 31, 736–743.289. N. C. Blumenthal and A. S. Posner, Calcif. Tissue Int., 1984, 36, 439–441.
Life-Long Exposure to Aluminium Compounds may Cause Alzheimer’s Disease 81

290. M. R. Christoffersen and J. Christoffersen, Calcif. Tiss. Int., 1983, 37,673–676.
291. T. Sato, J. Iwamoto, T. Kanoko and K. Satoh, J Bone Min. Res., 2005, 20,1327–1333.
292. C. Luckhaus, B. Mahabadi, B. Grass-Kapanke, M. Janner,H. Willenberg, M. Jager, T. Supprian and K. Fehsel, J. Neural Transm.,2009, 117, 905–911.
293. M. Tysiewicz-Dudek, F. Pietraszkiewicz and B. Drozdzowska, Ortop.Traumatol. Rehabil., 2008, 10, 315–323.
294. B. Mjoberg, Calcif. Tissue Int., 1990, 47, 2959–2960.295. J. R. Walton, T. H. Diamond, S. Kumar and G. A. C. Murrell, J. Inorg.
Biochem., 2007, 101, 1285–1290.296. D. A. Drachman, Neurology, 2005, 64, 2004–2005.297. B. Pakkenberg, D. Pelvig, L. Marner, M. J. Bundgaard, H. J. Gundersen,
J. R. Nyengaard and L. Regeur, Exp. Gerontol., 2003, 38, 95–99.298. J. Dobbing and J. Sands, Nature, 1970, 226, 639–640.299. A. Richardson and M. C. Birchenall-Sparks, Rev. Biol. Res. Aging, 1983,
1, 255–273.300. D. M. Lindholm, J. Neurochem., 1986, 47, 1503–1506.301. K. S. Rao, V. V. Annapurna and N. S. Raji, Ann. N.Y. Acad. Sci., 2001,
928, 113–120.302. J. W. Hinds and N. A. McNelly, J. Comp. Neurol., 1977, 72, 345–367.303. A. Lione, Pharmacol. Ther., 1985, 29, 255–285.304. B. P. Bourgoin, Bull. Environ. Contam. Toxicol., 1992, 48, 803–808.
82 Chapter 2

CHAPTER 3
Do Polychlorinated Biphenylsand Associated ChemicalsExacerbate Aging-RelatedDeclines in Brain Function?
R. F. SEEGALa,b
aWadsworth Center, New York State Department of Health,Empire State Plaza, P.O. Box 509, Albany, NY, 12201, USA; bDepartmentsof Environmental Health Sciences and Biomedical Sciences,School of Public Health, University at Albany, Albany, NY, 12222, USAE-mail: [email protected]
3.1 Introduction
Age-related declines in health, including increased incidence of neuro-degenerative disorders (e.g., Parkinson’s disease, Alzheimer’s disease), reductionsin cognitive function, cardiac disease, diabetes and an increased incidence ofcancer are inevitable.1,2 Exacerbation of these changes (i.e., observation ofdeleterious changes in younger populations or increased incidence and severity inaging populations) following exposure to environmental contaminants, includingpolychlorinated biphenyls (PCBs), however, should not be.
This review differs from previous ones I have written, because the primaryfocus will be on the neurological (neurocognitive and neurodegenerative)health consequences to aged individuals of adult human exposure to PCBs,
Issues in Toxicology No. 16
Aging and Vulnerability to Environmental Chemicals: Age-related Disorders and their Origins in
Environmental Exposures
Edited by Bernard Weiss
r The Royal Society of Chemistry 2013
Published by the Royal Society of Chemistry, www.rsc.org
83

rather than the much larger literature describing the developmental conse-quences of exposure of infants, children or experimental animals to PCBs orcontaminated foods containing PCBs. Reference will be made to laboratorystudies only when deemed necessary to clarify findings from studies of adultand aging human populations.
This review also differs in that I will discuss not only the ‘direct’ effectsof PCBs on the adult human nervous system, but also epidemiological and, toa lesser extent, laboratory studies that describe the consequences of adulthuman exposure to PCBs on non-nervous system disorders, particularly therelationship between PCBs, diabetes and obesity that can negatively impactthe quality of life and lead to disabilities or death occurring at an age earlierthan might otherwise occur. This approach is justified not only because theconcept of the brain as a ‘privileged’ organ, insensitive to contaminant-inducedor age-related changes in other organ systems, is no longer valid, but alsobecause of accumulating evidence that adult human exposure to PCBs isassociated with increased obesity,3 diabetes and insulin resistance,4–6 cancer7,8
and cardiac disease.9 These contaminant-associated diseases not only decreasequality of life in their own right, but also play important roles in reducingcognitive function and increasing the incidence of neurodegenerativedisorders.10–13
As I questioned in a previous review,14 ‘Have we not devoted sufficientresources and time to the study of the developmental consequences of thesetoxicants (i.e., PCBs)? Aging ‘baby-boomers’ constitute a large and rapidlygrowing portion of the adult population of the United States and manyEuropean countries. The consequences of either current or prior exposure toPCBs, and their putative interactions with aging processes, demand furtherinvestigation’. I also wish to emphasize that the ‘obesity epidemic’ andassociated increases in Type 2 diabetes is a risk factor for central nervoussystem (CNS) function/dysfunction that has only recently been recognized as arisk factor for CNS dysfunction, particularly in adults and in the aged(Figure 3.1).
3.2 What are PCBs?
PCBs are members of a large class of organic compounds known collectively ashalogenated aromatic hydrocarbons (HAHs).15This class includes not only PCBs,but also structurally related compounds, including 2,3,7,8-tetrachlorodibenzo-p-dioxin (TCDD) and 2,3,7,8-tetrachlorodibenzofuran (TCDF). PCBs were usedas non-flammable dielectric fluids in power capacitors and transformers, in die andmachine cutting oils, as heat exchange fluids in preparation of edible oils, in paintsand plastics, in fluorescent ballasts, in carbon-free copy paper and as weatherproof sealants in many buildings.16
The molecular structures of PCBs are illustrated in Figure 3.2. PCBs cantheoretically be chlorinated in any of ten positions on the biphenyl structure,resulting in isomers or congeners ranging from mono- to decachlorinatedbiphenyls. Thus there are a possible 209 congeners;17 commercial synthesis,
84 Chapter 3

however, yields approximately 135 congeners.18 In addition to the number ofchlorines, the location of the chlorines on the biphenyl moiety plays animportant role in influencing their potential toxicity. Based on the location ofchlorines on the biphenyl moiety, there are two major classes of PCB congeners.One class, known as coplanar, has only laterally substituted chlorines and sharesmany of its mechanisms of action (and toxicity)—including the ability to bind tothe aryl hydrocarbon (Ah) receptor—with TCDDs and TCDFs.19 In turn,binding to the Ah receptor is associated with alterations in endocrine function20
and an increased risk of developing cancer.7,8 Coplanar PCB congeners, alsobind to the Ah receptor, albeit at significantly lower affinities than either TCDDsor TCDFs.19,21 Because all coplanar halogenated aromatic hydrocarbons bind tothis receptor, it was possible to develop a means of summing the activities ofmixtures of coplanar contaminants known as toxic equivalent factors, or TEFs,as first described by Safe.19,22
In contrast, the second major class of PCB congeners, ortho-substituted ornon-coplanar, have chlorine substitutions adjacent to the biphenyl bond, thusinhibiting the planar confirmation required for binding to or activation of theAh receptor.15 Indeed, until the early 1990’s, it was thought that ortho-substituted PCB congeners were not a significant health concern. Initial studiesconducted by Seegal and colleagues at the Wadsworth Center of the New York
Figure 3.1 Age and diabetes.(Source: National Institutes of Health).
Do PCBs Exacerbate Aging? 85

State Department of Health, however, demonstrated that ortho-substitutedcongeners were particularly active in reducing neurotransmitter [dopamine(DA)] concentration in cells in culture23 and in experimental animals24,25 while,in contrast, coplanar congeners and TCDD were inactive. An abbreviated table(Table 3.1) describing this structure–activity relationship is presented below.Nevertheless, despite what, at the time, were considered ‘revolutionary’findings, I would, after presenting these findings at national and internationalmeetings, often listen to other speakers discussing the role(s) of the ‘toxic PCBs’i.e., coplanar PCBs. Indeed it took many years, and confirmation by otherinvestigators of the nervous system activity of ortho-substituted congeners, forthe PCB community to accept the notion that ortho-substituted PCBs may pose
Figure 3.2 Chemical structures of representative compounds from different classes ofhalogenated aromatic hydrocarbons.(Reproduced with permission from ref. 15).
86 Chapter 3

a health risk. Important additional studies were conducted at the United StatesEnvironmental Protection Agency by Kodavanti and colleagues, who demon-strated that non-dioxin-like PCB congeners increased phorbol ester binding toprotein kinase C (PKC)26 and elevated cytosolic calcium concentration in ratcerebellar granule cells.27 This SAR fully recapitulated the SAR for non-dioxin-like reductions in neuronal DA concentrations, as seen by Seegal andcolleagues. Additional important work by Pessah and colleagues provided anexplanation for the observed elevations in cytosolic calcium by determining themechanism by which ortho-substituted PCBs elevated intra-cellular calciumconcentrations, i.e., ryanodine receptor activation and a resulting increase inthe open probability of its channel.28,29 Given the disparity in the measuresexamined, it is surprising (and somewhat satisfying) that the SARs
Table 3.1 PCB Structure Activity Relationships: Three Approaches. EC50values for PCB congeners determined by PC12 cellular dopaminecontenta, cerebellar granule cell [3H]phorbol ester bindingb and brainor muscle sarcoplasmic/endoplasmic reticulum RyR/Ca21-ReleaseChannel [3H]ryanodine binding.c
EC50 (mM)
PCB Congener PC12 Cerebellar RyR/Ca21-Release Channel
BZ # Structure Cells Granule Cells Brain Skeletal
4 2,20 64 43 34.311 3,30 195 6014 3,5 4201 7415 4,4 NEOd NEOe
28 2,4,40 196 410047 2,4,20,40 115 8950 2,4,6,20 71 4152 2,5,20,50 86 28 52.154 2,6,20,60 NEOd NEOe
66 2,4,30,40 4201 Inactivef
70 2,5,30,40 16677 3,4,30,40 NEOd NEOe
82 2,3,4,20,30 1.288 2,3,4,6,20 89.395 2,3,6,20,50 17.1 0.33103 2,4,6,20,50 157 50.8104 2,4,6,20,60 93 38 157 0.57105 2,3,4,30,40 95 0.3126 3,4,5,30,40 NEOd NEOe Inactivef Inactiveg
153 2,4,5,20,40,50 4100 178
aAdapted from ref. 23.bAdapted from ref. 26.cAdapted from refs. 28 and 29.dNo effect observed up to 200 mM.eNo effect observed up to 100 mM.fInactive up to 200 mM.gInactive up to 10 mM.
Do PCBs Exacerbate Aging? 87

demonstrating the activity of ortho-substituted PCB congeners are soremarkably similar.
Although information on the toxicity of the two major classes of congenershas increased our understanding of the potential mechanisms by which PCBsalter brain, immune and endocrine function, the composition of PCB congenersin the environment—and consequently both the body burdens of congeners andtheir potential toxicity—are influenced by a number of factors that complicatethe ability, particularly in epidemiological studies, to determine whichcongeners, or mixture of congeners and/or their metabolites, contribute to theseuntoward changes.
Firstly, commercial mixtures of PCBs, known in the US as Aroclors, differ intheir congener composition,18 and differences in the physical properties of thesecongeners (e.g., their partition coefficients and rates of degradation, includingphotodegradation) make it unlikely that contaminated foodstuffs (the majorroute of exposure of humans to PCBs) contain the same congener patternsfound in the original Aroclor mixtures. Hence laboratory studies (includingthose of the author) using either Aroclor mixtures or individual PCB congenersonly partially recapitulate human non-occupational exposure due toconsumption of PCB-contaminated food products.
Secondly, PCB body burdens, most often measured in serum, contain a largenumber of congeners, making it difficult to statistically determine which indi-vidual congeners are causally associated with changes in nervous and endocrinefunction.
Thirdly, because of genetic differences in ability to metabolize PCBs, aswell as coexposure to other halogenated aromatic hydrocarbons that mayenhance metabolism, PCB body burdens vary dramatically between exposedindividuals. Finally, despite the fact that serum PCB levels are often measured,PCB-contaminated foods often contain additional contaminants, includ-ing methyl mercury and pesticides,10,30 that we and others have shown31–33
enhance the toxicity associated with exposure to complex mixtures ofcontaminants.
3.3 Why are PCBs Still of Concern in the 21stCentury?
PCBs have, on occasion, been described as a toxicant most relevant to the 20th
Century (Wolff, personal communication), since manufacture and use of PCBsceased in the mid to late 1970’s.16 Hence it is necessary to explain why a reviewof the health consequences of exposure of adults and aging individuals to PCBsis still important in 2012. There are, however, several reasons for continuedinterest in the roles of PCBs in altering CNS and endocrine changes in adultsand the elderly.
Firstly, there has been widespread use of PCBs. Indeed it has been estimatedthat, in the period between 1930 and 1970, approximately 30 000 tons werereleased into the air, 60 000 tons into fresh and coastal waters and more than300 000 tons into dumps and landfills.34 Given their persistence and widespreaddistribution, in both the environment and in foodstuffs including fish and dairy
88 Chapter 3

products, exposure to PCBs still remains a valid concern. Indeed levels of PCBsin fish from contaminated sites, including the Hudson River in New York State,still require fish consumption advisories.35
Secondly, since this review focuses on aging and vulnerability to environ-mental chemicals, levels of PCBs in the environment were dramatically higherin the past;36,37 hence the elderly were more likely than younger individuals oftoday to have been exposed to higher levels of PCBs. In support of thisstatement, it is widely recognized that body burdens of PCBs (as well as otherenvironmental contaminants) are positively associated with the age of theindividual.38 Furthermore, Seegal and colleagues recently described the half-lives of individual PCB congeners in a subset of former capacitor workers whohad been exposed more than 28 years ago to extraordinarily high levels ofPCBs.39 Despite the passage of almost three decades, serum PCB levels in theseformer workers were more than twice those seen in individuals of similar agewho were living in the same area but had not been occupationally-exposed toPCBs. Half-lives of PCB congeners were dependent on two factors: the degreeof chlorination of the congener (more highly chlorinated congeners had longerhalf-lives than did lightly chlorinated congeners) and the initial levels of PCBs(the greater the initial PCB body burden, the shorter the half-lives of thecongeners). Thus, persistent, relatively low body burdens of PCBs may eithercontinue to contribute to dysfunctions of the nervous and endocrine systems inelderly populations or provide a biomarker of prior exposure to much higherPCB levels that may have contributed to the observed reductions in the healthof elderly individuals.
This latter point is supported by results from a study in which adult non-human primates (NHPs) were exposed to either Aroclor 1016 (a mixtureconsisting primarily of lightly chlorinated ortho-substituted congeners) orAroclor 1260 (a mixture of more highly chlorinated congeners) (0.8, 1.6 or 3.2mg/kg/day) on a daily basis for 20 weeks. This exposure paradigm significantlyreduced basal ganglia (nigral and striatal) DA concentrations25 and resulted inserum PCB concentration near the upper level reported in capacitor workers.40
In order to determine whether these reductions in central DA concentrationswere permanent, an additional cohort of NHP was exposed to the sameconcentrations of Aroclors 1260 or 1016 for the same duration, but maintainedfor an additional 20 weeks following PCB exposure prior to sacrifice.41 Despitesignificant reductions in serum PCB concentrations during this ‘wash-out’period, basal ganglia DA concentrations failed to return to levels seen incontrol animals. Because the serum (and brain) concentrations of PCBsfollowing the wash-out were similar to those seen in animals exposed to lowerlevels of PCBs for 20 weeks and then immediately sacrificed, but failed to showsignificant reductions in basal ganglia DA concentrations, these findingsstrongly suggest that the high levels of PCBs seen during exposure, rather thanresidual levels following removal from PCBs, were responsible for thereductions in central DA. Thus, although current PCB body burdens mayprovide an estimate of prior exposure, it is most likely that any deleteriousconsequences are the result of prior, higher level exposure, further supporting
Do PCBs Exacerbate Aging? 89

the hypothesis that any PCB-induced deficits in aged or elderly humans werelikely due to prior exposure.
3.4 Neurological Sequelae of High Level Occupational
Exposure to PCBs in Adults
I have chosen to first discuss the neurological consequences of occupationalexposure to PCBs for two reasons. Firstly, levels of exposure (and resultingbody burdens of PCBs) were dramatically higher those than seen in non-occupationally exposed individuals. Secondly, exposures to other putativeneurotoxicants were either absent or at lower levels (on a percentage basis) thanenvironmental exposures.
Occupational exposure to PCBs, which occurred primarily in factories thatmanufactured power capacitors that used PCBs as dielectric fluids, resulted inextraordinarily high serum levels of PCBs measured shortly after the use ofPCBs was banned in the late 1970’s.16 Serum levels were approximately 100-fold higher in the serum of these workers (approximate geometric mean of 363ppb for lower PCBs and 30 ppb for higher PCBs)40 compared to those seen innon-occupationally-exposed individuals in the same geographical region (3.6ppb for total PCBs).13
Steenland et al.,42 in a retrospective mortality study of male and femaleformer capacitor workers whose average birth date was 1934, found an excessmortality associated with amyotrophic lateral sclerosis and, in the most highlyexposed women, an excess mortality associated with Parkinson’s disease.Although these findings were based on mortality, rather than incidence, theauthors suggest that, particularly for aging women, exposure to PCBs isassociated with increased mortality due to neurological disorders.
Seegal and colleagues, because of the previously mentioned studies inNHPs—which demonstrated that exposure to PCBs resulted in long-term if notpermanent reductions in basal ganglia DA concentrations—undertook a study,using a cohort nearly identical to that used by Steenland et al, to determine ifprior occupational exposure to PCBs would also result in a decrease inmeasures of central DA. To test that hypothesis, we used single positronemission computerized tomography (SPECT) imaging with the DA transporterligand, [123I] Beta CIT to determine changes in the density of DA terminals inthe striatum of male and female former capacitor workers whose median age atthe time these measures were collected was 63.5 years. Reductions in striatalDA terminals are seen in PD, and these decreases become greater duringdisease progression.43 Women, but not men, showed an inverse relationshipbetween lipid-adjusted total serum PCB concentrations and the density of DAterminals, even though serum PCB concentrations did not differ significantlybetween them. Most importantly, these findings were still significant aftercontrolling for a number of potential confounders that have been shownto influence the rate and severity of PD progression. These include the ageof the individual, their body mass index, their level of education, the number
90 Chapter 3

of caffeinated beverages consumed and the number of cigarettes smoked(Figure 3.3).
Although the Steenland et al. and the Seegal et al. studies were conducted atdifferent times—Steenland et al. published their findings in 2006 while Seegalet al. published their findings in 2010—both studies reached similarconclusions, i.e., only women who were highly exposed to PCBs demonstratedincreased PD associated mortality42 and a decrease in the number of striatalDA terminals indicative of PD.11 It is tempting to conclude that the sex-specificreductions in DA terminal densities serve as an early biomarker of PD.
3.5 Sequelae of High Level Non-Occupational Exposure
to PCBs on Cognitive Function
Unfortunately, high level exposure to PCBs and related HAHs, includingdibenzofurans, has not been limited to occupational settings. First in Japan,noted in 1968 (Yusho),44 and then, approximately ten years later, in Taiwan(YuCheng),45 adults, children, infants and fetuses were exposed to rice oil thathad been contaminated with PCBs and dibenzofurans. Existing literature46–48
describes the devastating neurological and morphological changes that resultedin children and infants that had been exposed due to maternal consumption ofthe contaminated rice oil. The effects of exposure to the contaminated rice oilwere, however, not limited to those individuals exposed during development.Lin et al.12,49 describe the neurocognitive changes seen in adults who were morethan 60 years of age at the time of assessment. These changes included reducedattention during performance of a digit span test, visual memory span andverbal memory recall. Most importantly, these changes were significant only inexposed women. In the later study, Lin et al. noted deficits in the Mini-MentalStatus examination that were negatively associated with the subjects’ bodyburden of PCBs.
Figure 3.3 Dopamine transporter density, as measured by b-CIT SPECT imaging, asa function of the log of current serum PCB concentrations (expressed on alipid-adjusted basis, ppm) by sex, prior to adjusting for potentialconfounders, in former capacitor factory workers.(Reproduced with permission from ref. 53).
Do PCBs Exacerbate Aging? 91

Thus in at least three epidemiological studies,11,12,42 associations were seenbetween body burdens of PCBs and related HAHs and deficits in neurologicaland neurocognitive performance in women but not in men, despite the fact thatthe age of the men and women did not differ significantly. Why are agingwomen more susceptible to the neurotoxic effects of PCBs than men?
We suggest that a highly relevant factor, common to these studies, is the ageof the subjects and their consequent reproductive status. For example, in theSeegal et al. study, the median age of the subjects was 65 years, hence both menand women had either segued into, or had begun the process of reproductivesenescence associated with, a decrease in gonadal hormones.50 We furthersuggest that age-related decline in central gonadal hormones, either of ovarianorigin or conversion of testosterone to estrogen in the brain,51 has differentconsequences in men and women following exposure to known DA neur-otoxicants. This suggestion is supported by data from Murray et al.52 andTamas et al.,53 who have shown that, following administration of 6-OHDA, apotent DA neurotoxicant, (1) ovariectomy increases the loss of basal gangliaDA, compared to that seen in the intact female; (2) castration reduces the lossof basal ganglia DA, compared to that seen in the intact male; (3) estrogensupplementation in the ovariectomized rat restores DA to levels seen in theintact female and (4) estrogen supplementation in the castrated male reducesthe protection following castration to levels seen in the intact male rat. Thesefindings strongly suggest that estrogen is neuroprotective in the female, whileestrogen (from aromatization of testosterone) may be a risk factor in the malebrain. Thus reductions in ovarian hormones following menopause (all womenin the above described epidemiological studies were postmenopausal) areposited to result in the loss of known neuroprotective factor(s), whilereductions in circulating testosterone and central aromatase activity in theaging male may result in the loss of a neuro-risk factor (i.e., central estrogendue to enzymatic conversion of testosterone to estrogen).
In order to test that hypothesis in a laboratory setting, we recently conductedstudies using intact, gonadectomized and sham-gonadectomized adult maleand female mice exposed to PCBs and determined changes in striatal DAconcentrations. Although experimental gonadectomy only partially recap-itulates the hormonal and neurological changes associated with naturalmenopause, this approach best models the changes seen in reproductivelysenescent women and men. As seen in Figure 3.4, PCBs significantly reducedstriatal DA concentrations in intact, reproductively competent male mice, butnot in intact reproductively competent female mice. These findings closelyapproximate the observations reported by DiPaolo and colleagues,54,55 Murrayet al.52 and Gillies et al.56 following exposure of in intact male and female miceor rats to either MPTP or 6-OHDA. Furthermore, in our study, ovariectomizedmice exposed to PCBs showed significant reductions in striatal DA followingexposure to PCBs compared to levels seen in intact PCB-exposed mice, findingssimilar to those seen by Morissette et al.54 These findings further support thehypothesis that ovarian hormones are neuroprotective and that the loss ofovarian hormones (due to ovariectomy) increases susceptibility to DA
92 Chapter 3

neurotoxicants. However, unlike other studies that have used ovariectomizedrodents to examine the role of estrogen as a neuroprotective factor, we chose tocompare the neurochemical consequences of exposure to PCBs in gonadec-tomized mice against those seen in sham-gonadectomized mice (i.e., mice thatwere exposed to the same anesthetics and analgesics and who had beensurgically manipulated but did not have their gonads removed). Surprisingly,PCB-exposed, sham-ovariectomized mice showed the same reductions instriatal DA as seen in ovariectomized mice, despite no significant changes incirculating ovarian hormones.
Why have I spent so much effort describing these results, particularly sincethe focus of this review is concerned with aging and increased vulnerability toenvironmental contaminants? Firstly, these unexpected findings suggest thatsurgical trauma, and by analogy, significant psychological trauma, may interactwith environmental contaminants to induce changes in the CNS, therebyincreasing the likelihood of developing PD or associated movement disorders.Thus trauma, including the death of a spouse or a loved one, in combinationwith prior exposure to environmental contaminants, may trigger Parkinson’sdisease or other neurological or neurocognitive disorders. Obviously, this novelhypothesis requires additional research. Furthermore, there is evidence, bothepidemiological57,58 and laboratory-based59,60 demonstrating that PCB exposureleads to menopause at an earlier age.
3.6 Effects of Environmental Exposure to PCBs on
Motor and Cognitive Function in Adults
A number of studies have examined the behavioral consequences of devel-opmental exposure to PCBs61–64 and have noted long-lasting deficits incognition and behavior in infants and children born to mothers who consumedcontaminated fish from the Great Lakes. A much smaller series of studies,
Dop
amin
e (n
g/m
g pr
otei
n) Control PCB
MALE
Control PCB
FEMALE
SHAM GDX SHAM OVX0
50
100
150
200
250
300
INTACTFEMALE
INTACTMALE
0
50
100
150
200
250
300
Dop
amin
e (n
g/m
g pr
otei
n)
Figure 3.4 Dopamine levels in the striatum of control and PCB exposed (70-daysubchronic exposure to food containing 500 ppm of Aroclor 1254) adultintact male and female mice or mice that had undergone gonadectomy orsham gonadectomy surgery.
Do PCBs Exacerbate Aging? 93

however, have examined the behavioral consequences of exposure of adults toenvironmental levels of PCBs.
An early study by Schantz et al.65 examined the effects of exposure to PCBsand DDE on motor function in 50–90 year old Michigan residents whoreported that they had eaten more than 24 pounds of contaminated fish peryear. Higher fish consumption, and by inference, elevations in PCB bodyburdens, was associated with significantly poorer performance on tests ofmotor function, including the Grooved Peg Board and the Static MotorSteadiness Test. However, when statistically correcting for relevantconfounders, including age and gender, the associations between exposure toPCBs and/or DDE became only marginally significant.
These largely negative results have been, in part, obviated by findings fromthe same cohort when measures of neurocognitive were obtained. Schantzet al.10 found significant associations between consumption of contaminatedfish and impairments of memory and learning. Furthermore, these authorsnoted that PCBs, but not DDE, were statistically and negatively associatedwith lower scores on several measures of memory and learning, including theWeschler Memory Scale and the California Verbal Learning test (CVLT).
A similar study was more recently conducted by Fitzgerald et al.,13 whodetermined the neuropsychological status among older residents of UpperHudson River communities. The subjects were of similar age to those examinedby Schantz et al. (55–74 years of age), although information on consumption ofcontaminated fish was not included. Furthermore, serum PCB levels (lipid-adjusted) were less than half the levels reported in the studies by Schantz et al.(3.2 ppb versus 7.9 ppb). Nevertheless, negative associations between serumPCB levels and decrements in the CVLT, as well as increased depression,measured by the Beck Depression Index, were seen in the Fitzgerald study.Thus even at lower PCB body burdens, residents of the upper Hudson Riverdemonstrated deficits in the CVLT, thereby partially recapitulating the earlierfindings of Schantz et al. The findings of both authors are of particularimportance because they suggest that either current or prior exposure tocontaminated fish (Schantz) or living adjacent to PCB contaminated sites(Fitzgerald) is associated with decrements in neurocognitive function in adults,even after controlling for age.
Somewhat similar findings were reported by Haase et al.,66 from a studysupported by the NIEHS Superfund. They examined the relationship betweenexposure to PCBs and neuropsychological function in a Native Americanpopulation of Mohawk people who were residing in upstate New York andwho had been environmentally exposed to PCBs and pesticides. Interestingly,the age of the subject significantly affected the relationships between PCBs, butnot pesticides, and cognitive function; only individuals who were more than 49years of age demonstrated deficits on the Trail Making Test, the Stroop test, theWisconsin Card Sorting Test and Visual memory performance.
Finally, Kilburn et al. published a series of manuscripts describing thebehavioral consequences of adult exposure to PCBs and related contaminants.In a 1989 publication,67 the author described neurobehavioral dysfunctions in
94 Chapter 3

firemen exposed to PCBs and their by-products in a transformer fire. Beha-vioral deficits included memory impairments for story recalls, visual images andnumber recall. Improvement in some of their behaviors following an experi-mental detoxification program consisting of a medically supervised diet,exercise and sauna, was also reported. There was, however, no relationshipbetween reported deficits in behavior and serum measures of PCBs raisingconcerns since exposure to combustion products of PCBs, including dioxins,may have contributed to the reported neurocognitive deficits. Furthermore,McCaffrey and Westervelt68 criticized the purported improvements followingdetoxification, since many of the tests were subject to practice effects, i.e.,performance on these tests would have shown an increase regardless of inter-vention simply because the tests were repeated. Kilburn69 also described visualand neurobehavioral impairment in residents living near a natural gas pipelinepumping station (the pumps were lubricated with a compound that consisted of50–80% PCBs) that resulted in dispersion of PCBs from compressed air used tostart the pumps. Exposed subjects were reported to have slower simple andchoice reaction times, increased body sway and deficits in performance of thegrooved peg board test and the Trail Making Test. Concerns have been raised,however, because many of the exposed subjects were involved in a lawsuitagainst the gas pipeline company. Hence these subjects would, perhaps, bemotivated to show deficits in neurocognitive function. However, in a laterpublication, Kilburn70 stated that being involved in a lawsuit against a companythat owned an electronic manufacturing plant that resulted in exposure ofresidents to tricholoroethylene did not affect performance. These issues wouldhave been either partially or fully negated if the author had administered theTest of Memory Malingering, which is designed to help psychologists andpsychiatrists distinguish between malingered and true memory deficits.71
Nevertheless, the concerns raised about the aforementioned studies illustratethe complexity, and the necessity for extreme care, in conducting epidemi-ological studies. These concerns include: controlling for potential confounders,determining, using power analyses, whether the cohort is sufficiently large toallow appropriate conclusions to be drawn, whether other known or putativeenvironmental agents may contribute to deficits in central function and if thesubjects have or have had a vested interest in the outcome of the neurocognitiveor neurological measures.
3.7 Are PCBs the only ‘Bad Actors’?
It is appropriate at this time to discuss concerns that I and others havethat environmental exposure to PCBs rarely, if ever, occurs in the absenceof coexposure to other neurotoxicants. This statement is particularly truein the case of consumption of contaminated fish and other foodstuffs(Figure 3.5).10,37,72 Indeed, in a 1999 publication entitled ‘Are PCBs the MajorNeurotoxicant in Great Lakes Salmon?’,30 I demonstrated that, in rats exposedto diets adulterated with lyophilized salmon (from either Lake Huron or LakeOntario) that resulted in daily exposure of as little as 13.9 mg/kg/day of PCBs,
Do PCBs Exacerbate Aging? 95

reductions in striatal DA were similar to those seen following exposure to 10mg/kg/day of an ortho-substituted congener (2,4,2 0,40-tetrachlorinated PCB).However, the concentration of this congener required to yield changes instriatal DA similar to those following consumption of diets containinglyophilized Great Lakes salmon were approximately 100-fold higher!
What other contaminants found in salmon from the Great Lakes maycontribute to this much greater activity? As shown in Figure 3.6, contaminatedsalmon from the Great Lakes contains many other known neurotoxicants,including methyl mercury and pesticides.10,73,74 To reinforce this point, we laterexamined, using an in vitro tissue model and measuring DA content, whetherPCBs would interact with methylmercury.31 This study clearly demonstratedthat coexposure to two recognized environmental neurotoxicants resultedin greater decreases in DA than did exposure to either contaminant alone.
Figure 3.5 Relative contribution of food groups to the intake of total PCBs,determined from a Swedish market basket in 2005.(Reproduced with permission from ref. 38).
Figure 3.6 Relative proportion of the major organic contaminants found in LakeOntario salmon fillets.(Reproduced with permission from ref. 78).
96 Chapter 3

These studies also serve as a caveat for epidemiological studies that examine therelationships between consumption of contaminated foods and neurocognitivedeficits, since many studies examine only the statistical relationships betweenserum PCB levels and behavioral deficits. This is because techniques for theirquantification are readily available and are used as a biomarker of exposure,leading perhaps to the fallacious conclusion that it is only the PCBs thatcontribute to the behavioral/cognitive deficits.
3.8 PCBs as Etiologic Factors in Diabetes/Insulin
Resistance
Major non-neurological health consequences of both occupational and envi-ronmental exposure to PCBs include evidence for increased risk of cancer,8 aswell as diabetes/insulin resistance.75 Although the mechanisms responsible forthe relationship between obesity and cancer are not fully understood, there iscompelling evidence that elevations in circulating levels of insulin, andassociated increases in cellular insulin-like growth factor, are associated withobesity and increase the availability of glucose to cells within the body.76 Inturn, because cancer cells require large amounts of glucose, the obesity/diabetes-induced elevations in insulin are thought to play an important role intumorigenesis.
Because the major focus of this review is on the neurological/neurocognitiveeffects of PCBs in adults and the elderly, I will focus, in this section, on the rolethat PCB-induced diabetes/insulin resistance plays in altering CNS function,including neurodegenerative disorders. Before that discussion, however, it isnecessary to review research that demonstrates that PCBs lead to an increase ineither diabetes or insulin resistance.
Persky et al.75 examined the associations between PCB exposure, determinedby measuring serum PCB levels, and diabetes in post-menopausal women whohad been previously employed at a capacitor manufacturing plant. All PCB-exposed women demonstrated an increase in self-reported diabetes, but not ininsulin resistance, after controlling for relevant confounders, e.g., body massindex, triglycerides and alcohol consumption. This relationship was seen onlyfor dioxin-like and not ortho-substituted PCB congeners. However, for thosewomen who did not report having diabetes, a measure of insulin resistance(homeostatic model of insulin resistance) was significantly associated with totalPCB body burden. Potential mechanisms for the association between dioxin-like PCB congeners and self-reports of diabetes may involve autoimmuneeffects associated with increased glutamic acid decarboxylase, which is oftenseen in individuals diagnosed with either Type I or Type II diabetes.77
Environmental exposure to PCBs has also been associated with an increase indiabetes. A 2009 study from Persky’s group78 determined that organochlorineexposure in Great Lakes sport fish consumers was associated with increasedrisk of diabetes. However, in a cohort of individuals originally studied becauseof widespread polybrominated biphenyl (PBB) exposure due to accidental
Do PCBs Exacerbate Aging? 97

contamination of feed for dairy cows, Vasiliu et al.3 demonstrated, for women,but not men, that PCBs, but not PBBs, were associated with a 2.3-fold increasedrisk for diabetes. In both the Persky and the Vasiliu et al. study, the concept of‘reverse causation’ i.e., either increased body mass index or serum lipid levels,that may have confounded the relationship between elevated halogenatedaromatic hydrocarbon levels and diabetes, was shown not to influence theobserved relationship between exposure and diabetes.
Finally, in a series of studies, Lee et al.4,5,79 demonstrated, using resultsobtained from the National Health and Nutrition Examination Survey(NHANES), an association between serum concentrations of persistent organicpollutants and diabetes in non-diabetic adults. In the first publication,4 theauthors reported a strong dose–response relationship between serum concen-trations of persistent organic pollutants, including an ortho-substituted PCBcongener (2,4,5,20,40,5-hexachlorobiphenyl), as well as hepta- and octa-chlorodibenzo-p-dioxin, oxychlordane, p,p 0-dichlorodiphenyltrichloroethane,trans-nonachlor) and incidence of diabetes. The authors caution, however,that, particularly for cross-sectional studies, it is not possible to determinewhether those individuals who had diabetes metabolized the halogenatedaromatic hydrocarbons at a lower rate than individuals who did not havediabetes, which could result in a confounding of the causal relationship betweenthese contaminants and diabetes. In a follow-up report, again using data fromNHANES, Lee et al.5 found that both ortho-substituted PCB congeners andorganochlorine pesticides were associated with increased incidence of diabetes.Finally, the same authors79 concluded that dioxin-like and not ortho-substituted PCB congeners were associated with increased risk of diabetes.
The lack of agreement between the aforementioned studies highlights thedifficulties in carrying out retrospective epidemiological studies, includingsample selection, measurement of body burdens of relevant contaminants anddetermining the relationships between various classes of halogenated aromatichydrocarbons, including whether the dose responses for these contaminants arelinear. Nevertheless, in total, the studies suggest that halogenated aromatichydrocarbons, including PCBs, are associated with an increased risk of diabetesand that this risk may initially be independent of the body mass index of thesubject.
Why have I spent so much of this chapter describing the relationshipsbetween occupational and environmental exposures to PCBs and relatedcontaminants and diabetes/insulin resistance if the goal of this review is tohighlight the role of PCBs in the etiology of disorders of the central nervoussystem in adults? The perhaps less than obvious reason is that diabetes is oftenassociated with elevated circulating levels of insulin resulting in a clinicalinsulin resistance.80 Furthermore, these elevations can influence the CNS byreducing the activity of growth factors essential for the maintenance ofneuronal viability and synaptic connectivity.81 These changes are associatedwith decreased cognitive function,82 as well as an increased risk for developingParkinson’s and Alzheimer’s disease.83,84 Potential mechanisms by whichalterations in circulating (and brain) levels of insulin and increased cognitive
98 Chapter 3

dysfunctions are associated with age, as well as Alzheimer’ disease, have beenreviewed by Bosco et al.84 These authors suggest that hyperglycemia, associatedwith diabetes, increases peripheral usage of insulin, resulting in decreasedinsulin transport into the brain. In turn, alterations in central insulin andinsulin-like growth factors influence neuronal survival, longevity and learningand memory. Hence reductions in brain insulin, combined with an age-relateddecrease in central insulin receptor densities, may interact to increase thelikelihood of both mild cognitive deficits and Alzheimer’s disease, most likelyby increasing inflammation, oxidative stress and levels of b-amyloid and tau.
Similar to Alzheimer’s disease, clinical studies85,86 have demonstrated anassociation between obesity, diabetes/insulin resistance and Parkinson’sdisease.83 Potential mechanisms include, as with Alzheimer’s disease, reducedcentral energy balance, increased oxidative stress and—in an animal model ofdiabetes, induced by placing rats on a high-fat diet—increased nigral ironlevels, which has been associated with a significant reduction in nigraldopaminergic neurons87 due to Fenton reaction-induced increases in oxidativestress.
I began this review by stating that declines in cognitive function, as wellas an increased risk for developing neurodegenerative disorders, includingParkinson’s disease and Alzheimer’s disease, are an inevitable consequence ofaging. I have hopefully presented sufficient data to indicate that exposure toortho-substituted PCBs and related coplanar halogenated aromatic hydro-carbons, including dioxin, may exacerbate these deficits in brain function,particularly in adults and the elderly. I do not, however, wish to leave the readerwith the impression that prior or current exposure to these and othercontaminants represents a ‘death sentence’, resulting in contaminant-accelerateddecline in cognitive function and an increase in aging-related neurodegenerativediseases. Because of the strong associations between obesity, diabetes/insulinresistance and neurocognitive and neurodegenerative disorders, it has beensuggested—and seconded by this author—that regulating obesity at both thenational and personal level must be made an extremely high priority, sincereductions in Type 2 diabetes is likely to decrease diabetes-associated deficits inCNS function in adults and the aged. Furthermore, as is well known, regularexercise reduces body weight and diabetes, as well as increasing a process of celldeath known as apoptosis.88 Although this may appear to be ominous andcounter-intuitive, recent studies have suggested that the positive associationbetween exercise and health is likely to include death/removal of cells that havebeen injured or damaged, for example by contaminants or the aging processitself. Thus, as our mothers were wont to say (or at least mine was!), ‘eathealthy and exercise (both your body and your brain)!’.
References
1. G. Wick, P. Jansen-Durr, P. Berger, I. Blasko and B. Grubeck-Loebenstein,Vaccine, 2000, 18, 1567.
2. E. R. Stadtman, Ann. N. Y. Acad. Sci., 2001, 928, 22.
Do PCBs Exacerbate Aging? 99

3. O. Vasiliu, L. Cameron, J. Gardiner, P. Deguire and W. Karmaus,Epidemiology, 2006, 17, 352.
4. D. H. Lee, I. K. Lee, K. Song, M. Steffes, W. Toscano, B. A. Baker andD. R. Jacobs, Jr., Diabetes Care, 2006, 29, 1638.
5. D. H. Lee, I. K. Lee, S. H. Jin, M. Steffes and D. R. Jacobs, Jr.,Diabetes Care, 2007, 30, 622.
6. J. Ruzzin, R. Petersen, E. Meugnier, L. Madsen, E. J. Lock, H. Lillefosse,T. Ma, S. Pesenti, S. B. Sonne, T. T. Marstrand, M. K. Malde, Z. Y. Du,C. Chavey, L. Fajas, A. K. Lundebye, C. L. Brand, H. Vidal,K. Kristiansen and L. Froyland, Environ. Health Perspect., 2010, 118, 465.
7. P. A. Bertazzi, L. Riboldi, A. Pesatori, L. Radice and C. Zocchetti, Am. J.Ind. Med., 1987, 11, 165.
8. K. Mallin, K. McCann, A. D’Aloisio, S. Freels, J. Piorkowski, J. Dimosand V. Persky, J. Occup. Environ. Med., 2004, 46, 565.
9. R. A. DeFronzo and E. Ferrannini, Diabetes Care, 1991, 14, 173.10. S. L. Schantz, D. M. Gasior, E. Polverejan, R. J. McCaffrey,
A. M. Sweeney, H. E. B. Humphrey and J. C. Gardiner, Environ. HealthPerspect., 2001, 109, 605.
11. R. F. Seegal, K. L. Marek, J. P. Seibyl, D. L. Jennings, E. S. Molho,D. S. Higgins, S. A. Factor, E. F. Fitzgerald, E. A. Hills, S. A. Korrick,M. S. Wolff, R. F. Haase, A. C. Todd, P. Parsons and R. J. McCaffrey,Neurobiol. Dis., 2010, 38, 219.
12. K. C. Lin, N.-W. Guo, P.-C. Tsai, C.-Y. Yang and Y. L. Guo, Environ.Health Perspect., 2008, 116, 184.
13. E. F. Fitzgerald, E. E. Belanger, M. I. Gomez, M. Cayo, R. McCaffrey,R. Seegal, R. L. Jansing, S.-A. Hwang and H. E. Hicks, Environ. HealthPerspect., 2008, 116, 209.
14. R. F. Seegal, Organohalogen Compd., 2004, 66, 3548.15. R. F. Seegal, Crit. Rev. Toxicol., 1996, 26, 709.16. National Research Council, in Polychlorinated Biphenyls, National
Academy of Sciences, Washington, DC, 1979, p. 1.17. M. D. Mullin, C. M. Pochini, S. McCrindle, M. Romkes, S. H. Safe and
L. M. Safe, Environ. Sci. Technol., 1984, 18, 468.18. M. D. Erickson, in Analytical Chemistry of PCBs, CRC Press, Boca Raton,
2 ed., 1997.19. S. Safe, CRC Crit. Rev. Toxicol., 1990, 21, 51.20. S. Safe, B. Astroff, M. Harris, T. Zacharewski, R. Dickerson, M. Romkes
and L. Biegel, Pharmacol. Toxicol., 1991, 69, 400.21. A. Parkinson and S. Safe, in Polychlorinated Biphenyls (PCBs):
Mammalian and Environmental Toxicology, eds. S. Safe and O. Hutzinger,Springer-Verlag, New York, 1987, pp. 49–75.
22. S. H. Safe, CRC Crit. Rev. Toxicol., 1994, 24, 87.23. W. Shain, B. Bush and R. F. Seegal, Toxicol. Appl. Pharmacol., 1991,
111, 33.24. R. F. Seegal, B. Bush and W. Shain, Toxicol. Appl.Pharmacol., 1990,
106, 136.
100 Chapter 3

25. R. F. Seegal, B. Bush and K. O. Brosch, Toxicology, 1991, 66, 145.26. P. R. S. Kodavanti, T. R. Ward, J. D. McKinney and H. A. Tilson,
Toxicol. Appl. Pharmacol., 1995, 130, 140.27. W. R. Mundy, T. J. Shafer, H. A. Tilson and P. R. S. Kodavanti, Toxi-
cology, 1999, 136, 27.28. P. W. Wong and I. N. Pessah, Molec. Pharmacol., 1996, 49, 740.29. P. W. Wong, W. R. Brackney and I. N. Pessah, J. Biol. Chem., 1997,
272, 15145.30. R. F. Seegal, Environ. Res., Sect. A, 1999, 80, S38.31. J. C. Bemis and R. F. Seegal, Environ. Health Perspect., 1999, 107, 879.32. J. C. Bemis and R. F. Seegal, Neurotoxicology, 2000, 21, 1123.33. C. S. Roegge, J. R. Morris, S. Villareal, V. C. Wang, B. E. Powers,
A. Y. Klintsova, W. T. Greenough, I. N. Pessah and S. L. Schantz,Neurotoxicol. Teratol., 2006, 28, 74.
34. M. A. Q. Khan, S. F. Khan, and F. Shattari, in Ecotoxicology ed. ErikJorgensen, Academic Press, Amsterdam, 2010, p. 251.
35. New York State Department of Health. Health Advice on Eating Sportfishand Game. NYSDOH website, 27 February, 2012.
36. S. Y. Huestis, M. R. Servos, D. M. Whittle and D. G. Dixon, J. GreatLakes Res., 1996, 22, 310.
37. A. Tornkvist, A. Glynn, M. Aune, P. O. Darnerud and E. H. Ankarberg,Chemosphere, 2011, 83, 193.
38. R. B. Jain and R. Y. Wang, Chemosphere, 2010, 79, 243.39. R. F. Seegal, E. F. Fitzgerald, E. A. Hills, M. S. Wolff, R. F. Haase,
A. C. Todd, P. Parsons, E. S. Molho, D. S. Higgins, S. A. Factor,K. L. Marek, J. P. Seibyl, D. L. Jennings and R. J. McCaffrey, J. Expo. Sci.Environ. Epidemiol., 2011, 21, 234.
40. R. W. Lawton, M. R. Ross, J. Feingold and J. F. Brown, Jr., Environ.Health Perspect., 1985, 60, 165.
41. R. F. Seegal, B. Bush and K. O. Brosch, Toxicology, 1994, 86, 71.42. K. Steenland, M. J. Hein, R. T. I. Cassinelli, M. M. Prince, N. B. Nilsen,
E. A. Whelan, M. A. Waters, A. M. Ruder and T. M. Schnorr,Epidemiology, 2006, 17, 8.
43. K. Marek, R. Innis, C. Van Dyke, B. Fussell, M. Early, S. Eberly,D. Oakes and J. Seibyl, Neurology, 2001, 57, 2089.
44. M. Kuratsune, T. Youshimara, J. Matsuzaka and A. Yamaguchi, Environ.Health Perspect., 1972, 1, 119.
45. S.-T. Hsu, C.-I. Ma, S. K. H. Hsu, S.-S. Wu, N. H. M. Hsu, C.-C. Yeh andS.-B. Wu, Environ. Health Perspect., 1985, 59, 5.
46. W. J. Rogan, B. C. Gladen, K. L. Hung, S. L. Koong, L. Y. Shih,J. S. Taylor, Y. C. Wu, D. Yang, N. B. Rogan and C.-C. Hsu, Science,1988, 241, 334.
47. Y.-C. J. Chen, Y.-L. Guo, C.-C. Hsu and W. J. Rogan, JAMA, 1992,268, 3213.
48. Y.-C. J. Chen, M.-L. M. Yu, W. J. Rogan, B. C. Gladen and C.-C. Hsu,Am. J. Public Health, 1994, 84, 415.
Do PCBs Exacerbate Aging? 101

49. K. C. Lin, P. C. Huang, P. S. Yeh, J. R. Kuo and D. S. Ke, Psycho-geriatrics, 2010, 10, 191.
50. T. R. Chakraborty and A. C. Gore, Exp. Biol. Med., 2004, 229, 977.51. S. Veiga, R. C. Melcangi, L. L. DonCarlos, L. M. Garcia-Segura and
I. Azcoitia, Exp. Gerontol., 2004, 39, 1623.52. H. E. Murray, A. V. Pillai, S. R. McArthur, N. Razvi, K. P. Datla,
D. T. Dexter and G. E. Gillies, Neuroscience, 2003, 116, 213.53. A. Tamas, A. Lubics, I. Lengvari and D. Reglodi, Endocrine, 2006, 29,
275.54. M. Morissette, S. Jourdain, S. A. Sweidi, F. S. Menniti, A. D. Ramirez and
T. Di Paolo, Neuropharmacology, 2007, 52, 1509.55. S. Jourdain, M. Morissette, N. Morin and T. Di Paolo, J. Neuroendo-
crinol., 2005, 17, 509.56. G. E. Gillies, H. E. Murray, D. Dexter and S. McArthur, Pharmacol.
Biochem. Behav., 2004, 78, 513.57. A. Axmon, L. Rylander, L. Stromberg and L. Hagmar, Chemosphere,
2004, 56, 813.58. H. M. Blanck, M. Marcus, P. E. Tolbert, C. Schuch, C. Rubin,
A. K. Henderson, R. H. Zhang and H. S. Vicki, Maturitas, 2004, 49, 97.59. D. B. Sager and D. M. Girard, Environ. Res., 1994, 66, 52.60. A. C. Gore, T. J. Wu, T. Oung, J. B. Lee and M. J. Woller, J. Neuro-
endocrinol., 2002, 14, 814.61. J. L. Jacobson, S. W. Jacobson and H. E. B. Humphrey, J. Pediatr., 1990,
116, 38.62. J. L. Jacobson, S. W. Jacobson, R. J. Padgett, G. A. Brumitt and
R. L. Billings, Dev. Psychol., 1992, 28, 297.63. P. Stewart, J. Reihman, E. Lonky, T. Darvill and J. Pagano, Neurotoxicol.
Teratol., 2000, 22, 21.64. P. Stewart, S. Fitzgerald, J. Reihman, B. Gump, E. Lonky, T. Darvill,
J. Pagano and P. Hauser, Environ. Health Perspect., 2003, 111, 1670.65. S. L. Schantz, J. Gardiner, D. Gasior, A. Sweeney, D. W. Humphrey and
R. McCaffrey, Environ. Res., 1999, 80, S46.66. R. F. Haase, R. J. McCaffrey, A. L. Santiago-Rivera, G. S. Morse and
A. Tarbell, Environ. Res., 2009, 109, 73.67. K. H. Kilburn, R. H. Warsaw and M. G. Shields, Arch. Environ. Health,
1989, 44(6), 345.68. R. J. McCaffrey and H. J. Westervelt, Neuropsychol. Rev., 1995, 5, 203.69. K. H. Kilburn, Neurotoxicology, 2000, 21, 489.70. K. H. Kilburn, Arch. Environ. Health, 2002, 57, 121.71. T. N. Tombaugh, in Test of Memory Malingering, Multi-Health Systems,
Inc., North Tonawanda, NY, 1996.72. R. Duarte-Davidson and K. C. Jones, Sci. Total Environ., 1994, 151, 131.73. R. F. Seegal, in PCBs: Recent Advances in Environmental Toxicology and
Health Effects, eds. L. W. Robertson and L. G. Hansen, The UniversityPress of Kentucky, Lexington, 2001, pp. 241–255.
74. R. Seegal and W. J. Bowers, Environ. Toxicol. Pharmacol., 2002, 12, 63.
102 Chapter 3

75. V. Persky, J. Piorkowski, M. Turyk, S. Freels, R. Chatterton, Jr., J. Dimos,H. L. Bradlow, L. K. Chary, V. Burse, T. Unterman, D. Sepkovic andK. McCann, Environ. Res., 2011, 111, 817.
76. G. Taubes, Science, 2012, 335, 28, 30.77. P. Langer, M. Tajtakova, H. J. Guretzki, A. Kocan, J. Petrik,
J. Chovancova, B. Drobna, S. Jursa, M. Pavuk, T. Trnovec, E. Sebokovaand I. Klimes, Arch. Environ. Health, 2002, 57, 412.
78. M. Turyk, H. Anderson, L. Knobeloch, P. Imm and V. Persky, Environ.Health Perspect., 2009, 117, 1076.
79. D. H. Lee, I. K. Lee, M. Steffes and D. R. Jacobs, Jr., Diabetes Care, 2007,30, 1596.
80. M. R. Meyer, C. F. Lichti, R. R. Townsend and A. G. Rao, Biochemistry,2011, 50, 2170.
81. A. M. Stranahan, E. D. Norman, K. Lee, R. G. Cutler, R. S. Telljohann,J. M. Egan and M. P. Mattson, Hippocampus, 2008, 18, 1085.
82. J. A. Luchsinger, J. Neurol. Sci., 2010, 299, 35.83. E. Schernhammer, J. Hansen, K. Rugbjerg, L. Wermuth and B. Ritz,
Diabetes Care, 2011, 34, 1102.84. D. Bosco, A. Fava, M. Plastino, T. Montalcini and A. Pujia, J. Cell Mol.
Med., 2011, 15, 1807.85. R. Sandyk, Int. J. Neurosci., 1993, 69, 125.86. K. R. Wilhelm, K. Yanamandra, M. A. Gruden, V. Zamotin,
M. Malisauskas, V. Casaite, A. Darinskas, L. Forsgren and L. A.Morozova-Roche, Eur. J. Neurol., 2007, 14, 327.
87. J. K. Morris, G. L. Bomhoff, B. K. Gorres, V. A. Davis, J. Kim, P. P. Lee,W. M. Brooks, G. A. Gerhardt, P. C. Geiger and J. A. Stanford, Exp.Neurol., 2011, 231, 171.
88. S. Phaneuf and C. Leeuwenburgh, Med. Sci. Sports Exerc., 2001, 33, 393.
Do PCBs Exacerbate Aging? 103

CHAPTER 4
Parkinson Disease
G. NELSON AND B. A. RACETTE*
University of the Witwatersrand, Division of Biostatistics andEpidemiology, School of Public Health, Faculty of Health Sciences,7 York Rd, Parktown, 2193 South Africa
4.1 Introduction
Parkinsonism is a clinical syndrome characterized by bradykinesia, posturalinstability, rest tremor, and rigidity. The most common degenerative parkin-sonism is Parkinson disease (PD), a progressive condition that affectsapproximately 2% of people over the age of 65.1 PD is associated withdegeneration of substantia nigra and intraneuronal deposition of alphasynuclein (either Lewy bodies or Lewy neurites), and clinical improvement ofsymptoms with the dopamine precursor, levodopa. Parkinsonism is alsocommonly seen with aging.2 Age-related parkinsonism is associated withfunctional disability3 and may serve as a marker for degenerative brainpathologies.4
Patients with PD display resting tremor, bradykinesia, a paucity of spon-taneous movement, rigidity, and postural instability. Disease progression isgradual but relentless, and eventually leads to substantial disability for most ofthose afflicted. Pathologically, there is selective neuronal loss in the substantianigra with the presence of cytoplasmic inclusions (Lewy bodies) in remainingcells, reduced nigrostriatal neuronal projection, and subsequent striataldopamine deficiency.5 Although symptomatic treatment with levodopa focuseson replacing striatal dopamine, the progression of the disease cannot be slowedor halted.6,7
Issues in Toxicology No. 16
Aging and Vulnerability to Environmental Chemicals: Age-related Disorders and their Origins in
Environmental Exposures
Edited by Bernard Weiss
r The Royal Society of Chemistry 2013
Published by the Royal Society of Chemistry, www.rsc.org
104

PD is primarily viewed as a disease of aging. The average age of onset isaround 60 years, with only 5–10% of cases occurring before the age of 50.8
However, it is widely believed that PD develops from multiple risk factors,including aging, genetic predisposition, and environmental exposure. Severalgene mutations have been identified as risk factors for PD, but these accountfor only 5–10% of cases of PD.9 This suggests that exogenous or environmentalfactors influence the risk of development of PD, either independently or inconjunction with genetic predisposition.8
PD has been linked to exposure to a number of toxins, including metals,such as manganese, lead, and copper; pesticides, often associated with farmingand gardening activities; and solvents, such as trichloroethylene. The sourceof these exposures can be occupational or community/residential, includingrural pesticide application or urban industrial emissions. Although thereare numerous studies implicating specific occupations in the aetiology of PD,the majority of PD cases do not have clear occupational exposure,suggesting that residential/community exposures may be critical in PDpathogenesis.
Many studies have compared PD incidence and/or prevalence amongst ruraland urban populations in attempts to compare the relative roles of residentialand industrial exposures in the aetiology of PD. Some have shown a higher riskof PD in individuals living in rural areas of Europe and North America,10–13
which would potentially link PD to exposure to pesticides and herbicides usedin farming, in addition to well water; however, the results are inconsistent.14
The largest population-based study of the relationship between residence andPD—which used Medicare ICD-9 diagnosed cases and the US Department ofAgriculture rural–urban continuum classification (United States Departmentof Agriculture Economic Research Service, 2008) to classify ‘rurality’—foundno dose-dependent relationship between PD and rural living but a higher PDprevalence and incidence in the most urban counties as compared to the mostrural counties.1 This study suggests that urban living may be an important riskfactor for PD. Most studies investigate only current residence, and not lifetimeresidence, and risk of PD.
Studies suggesting that industrialization may increase the risk of PD includea comparison between similar populations in the USA and Nigeria;15 apopulation-based study in Michigan, USA, which showed higher mortalityrates in counties with higher concentrations of industries with potential heavymetal emissions;16 and comparisons of urban and rural populations in Italy,17
Bulgaria,18 and Taiwan19 (Table 4.1). Although figures were not estimated, aSwedish study suggested that there was an increased prevalence of PD in acounty where the economy was predominated by steel and wood manu-facturing industries, in comparison to three other less-industrialized counties,based on levodopa prescription records, a common method for identifyingcases given the almost universal treatment of patients with levodopa during thecourse of their disease.20 A mortality study of World War II veterans foundhigher PD death rates in the more industrialized Northern states than in the lessindustrialized Southern states.21
Parkinson Disease 105

However, differences in rural–urban PD prevalence have not been foundconsistently worldwide. Similar PD prevalence and incidence rates were foundamongst residents in urban and rural areas in Estonia,22,23 and in England,24
and an Australian study reported lower prevalence rates of PD in urban areas25
(Table 4.1). A case-control study in Serbia did not find any difference in theodds ratio (OR) for PD between rural and urban areas,26 and a case-controlstudy in Quebec, Canada, reported a lower adjusted OR of 0.15 (95% CI0.04–0.55) for PD associated with living in industrial or mining areas.14
Different study designs, case-finding methods, and definitions of PD, as well asthe difficulty in classifying rural and urban living, prevent direct comparison of theabove studies. In many of the studies, small sample size also affects the validity ofthe findings. A recent study investigated rural–urban risk for PD using standard,population density-based definitions for rural living.1 More than 500 000 prevalentPD cases older than 65 years were identified from USA population-basedMedicare data. The authors found a significantly higher prevalence of PD in themost urban USA counties compared to the most rural (Table 4.1 and Figure 4.1).
Studies analyzing PD incidence trends potentially test the hypothesis thatindustrialization is a risk factor for PD. A study investigating the longitudinalrisk of PD in a small, relatively rural region in Minnesota, USA, from 1967 to1979,27 found no change in the annual incidence of PD during that time period.
Table 4.1 Studies comparing PD in different populations.
Authors Measurement Country(ies)
PD prevalence (�10�5)
Industrializedregion
Non/lessindustrializedregion
Schoenberget al., 198815
Age-adjustedprevalence ratio
USA andNigeria(439 years)
341 (rural USA) 67 (ruralNigeria)
Rybicki et al.,199316
Mortality rate USA 27 16
Taba andAsser, 200222
Age-adjustedprevalence rate
Estonia 159 (urban) 139 (rural)
Taba andAsser, 200323
Age-adjustedincidence rate
Estonia 19 (urban) 14 (rural)
Totaro et al.,200517
Age- andsex-adjustedprevalence rate
Italy 245 (urban) 215 (rural)
Peters et al.,200625
Prevalence rate(unadjusted)
Australia 130 (urban) 164 (rural)
Chen et al.,200919
Age-standardizedprevalence rate
Taiwan(450 years)
939 (urban) 544 (rural)
Hristova et al.,201018
Age-adjustedincidence rate
Bulgaria 13 (urban) 10 (rural)
Walker et al.,201024
Age-adjustedprevalence rate
England 139 (urban) 142 (rural)
Willis et al.,20101
Age-adjustedprevalence rate
USA 1 706 (pop. 41 m) 1 371 (pop.o2500)
106 Chapter 4

Figure 4.1 County level age- and race-standardized prevalence (per 100 000) of Parkinson disease among Medicare beneficiaries in theUSA (year¼ 2003).1
ParkinsonDisea
se107
It is also unlikely that there was a substantial change in industrialization in thatrural region of the USA over the 12-year period. Similarly, a more recentpopulation-based study of USAMedicare beneficiaries, reporting PD incidencerates for a 4-year period from 2002 to 2005, also showed no change.1 This samestudy also found a stable PD prevalence rate from 1995 to 2005. A populationprevalence study in the English Midlands did show an increase in PD from 1982to 1992,28 but this may have been due to increased medical and publicawareness, rather than industrialization.
4.2 Environmental Toxins
Risk factors for PD include modifiable and non-modifiable factors. Non-modifiable factors include increasing age, male gender, and White race.1,29,30
Modifiable risk factors, such as environment or occupation, have beenrelatively under-studied, especially in urban areas where the overwhelmingmajority of PD patients reside. Understanding community level exposures toenvironmental toxins is critical in determining the causes of most cases of PDand in developing strategies to reduce the burden of the disease in the future.
4.2.1 Metals
There are a number of studies that suggest that heavy metals are associatedwith PD,16,31–34 and that exposure may accelerate some of the pathologicfindings characteristic of PD. The metal for which the most evidence exists foran association with PD is manganese, but lead, copper, and mercury have alsobeen implicated.34–36 Most studies have been conducted on occupationallyexposed populations; very little research has been conducted on the effects ofcommunity exposure.
4.2.1.1 Manganese
Manganese is a known neurotoxin that has been associated with damage tosome of the same structures in the brain that are affected in PD.37–39 Exposureto acute, high levels of manganese is clearly associated with parkinsonism, andlower-level exposure is associated with parkinsonian motor abnormalities.Evidence implicating manganese in the aetiology of PD is contradictory.
There is strong evidence for an association of parkinsonism and occupationalexposure to manganese. In 1837, the first case series of parkinsonism inmanganese miners was published. The neurological effects of manganeseexposure in four ore crushers were described as lower extremity predominantmuscular weakness, festination, postural instability, facial masking, hypo-phonia, and sialorrhea.40 More than 100 years later, in 1955, Rodier describedsimilar neurological symptoms in a group of 150 Moroccan undergroundmanganese miners,41 with latency from exposure ranging from one month tomore than 10 years. He described a syndrome characterized by typical park-insonian findings (rigidity, bradykinesia, tremor, flexed posture, shuffling gait,
108 Chapter 4

postural instability) and atypical findings (psychosis, personality change,dystonic ‘cock’ gait, emotional lability). In most cases, the disease progressed tototal disability, despite discontinuing exposure.
There are a number of clinical reports of atypical parkinsonism in similar andother manganese-exposed workers. Two case series in the 1960s describedmanganese poisoning: one in 13 Chilean miners,42 and the other in sevenworkers from various industries in Pennsylvania, USA.43 Another report ofsix men who developed manganese poisoning in a manganese ore crushingplant where reported levels were as high as 21.9 mg m�3 was publishedin 1974.44
Manganese is the primary exposure in the steel industry and there is someevidence that workers with acute exposures to fumes present with an atypicalparkinsonian syndrome. In 1966, Whitlock et al. reported two cases ofmanganese poisoning in a manganese steel plant.45 Both men were exposed tomanganese levels of 2.3–4.7 mg m�3 during the process of cleaning manganesesteel castings. In 1989, Wang et al. described parkinsonism in six of eightworkers, exposed to even higher concentrations of manganese (428.8 mg m�3)in a Taiwanese ferromanganese smelter,46 one of whom later developed a ‘cock’gait.47
While it is clear that manganese causes an atypical parkinsonian disorder,evidence implicating manganese in the aetiology of PD is contradictory.Although one population-based case-control study showed an OR of 10.6 forPD with occupational exposure to manganese for more than 20 years, thefindings were based on three cases and one control.35,48 A Canadian studyfound an increased risk of PD in a small case-control study of 42 PD patientsexposed to a combination of metals, including manganese, but did not calculaterisks for exposure to individual metals.14 Conversely, two other case-controlstudies, in Germany and Canada, found no association between exposure toheavy metals, including manganese, and PD.34,49 Contradictory findings werelikely due to differences in study design and study population exposures, andsmall sample sizes.
There are many clinical reports on the effects of exposure to manganesefumes in welders.45,50–52 Manganese is commonly found in welding fumes, andmany welders are regularly overexposed to the American Conference ofGovernmental Industrial Hygienists threshold limit value of 0.2 mg m�3, whichwas primarily set in regard to neurological effects.53,54 Although thedose–response relationship between welding exposures and motor functionremain to be established, one small study suggested that performance on peg-board and timed motor tasks might be slower in 12 manganese-exposed welderswhen compared to a control group of 39 railway track welders who had weldedfor less than 25 hours in total.52 A large study of 1 423 Alabama welders founda substantially higher prevalence of parkinsonism compared with the generalpopulation of Copiah County, Mississippi, USA. The estimated prevalence ofparkinsonism among active male welders aged 40–69 years was 977–1 336 per100 000, and was higher among welders when compared to age-standardizeddata for the general population (prevalence ratio 10.19; 95% CI 4.43–23.43).55
Parkinson Disease 109

This study specifically addressed parkinsonism, not PD. Several cross-sectionalstudies have shown that occupational exposure to manganese at low levels, viz.below the Occupational Safety and Health Administration’s permissibleexposure limit of 5mgm�3, may be associated with parkinsonian motorabnormalities (Table 4.2), with the most consistent symptom being slowedfinger tapping. Such studies have been conducted primarily in workersemployed in the metal industry and in welders.
These findings are supported by a number of studies in manganese-exposedcommunities (Table 4.3). One such study on 273 people in Quebec, Canada,showed an association of raised blood manganese levels with slowing of motortasks and difficulty with pointing tasks consistent with tremor.56 Two morerecent Italian studies have also suggested that residential exposure tomanganese is associated with an increased prevalence of parkinsoniandisturbances.57,58
Although there is some evidence that welders may have a higher risk ofparkinsonism, findings of epidemiologic studies, including large welder cohorts,provide contradictory results regarding the relationship between welding andPD. A survey of three specialty-based practices found only three weldersamong 2 249 consecutive patients with PD.59 However, it is possible thatwelders were underrepresented in these relatively white collar communities. In adeath certificate study of neurodegenerative disease and PD, welding-relatedoccupations were not among the highest ranked occupations in PD-relateddeaths.60
Table 4.2 Parkinsonian motor abnormalities in workers exposed to low levelsof manganese.
Authors Country Study population
Mean ambientmanganese level(mgm�3) Clinical signs
Roels et al.,1987115
Belgium 141 manganeseoxide and saltproducing plantworkers
0.94 (0.07–8.61) Slowed simplereaction times,increased handtremor
Iregren, 1990116
Wennberg et al.,1991117
Wennberg et al.,1992118
Sweden 30 steel smeltingworkers; 60controls
0.18–1.41 Slower reactiontimes, reducedfinger tappingspeeds, reducedtapping endurance,diadochokinesis
Mergler et al.,1994119
Canada 115 ferro-manganese andsilicomanganesealloy workers;145 controls
0.89 Slower computerizedfinger tappingscores, less handsteadiness
Lucchini et al.,1999120
Italy 61 ferroalloyplant workers;87 controls
0.07 Tremor,coordination,bradykinesia
110 Chapter 4

Table 4.3 Studies of community manganese exposure and parkinsonism or PD.
Authors Country Study design Study population Findings
Mergler et al.,199956
Canada Cross-sectional 273 residents exposed tomanganese
Slowing of motor tasks; difficulty withpointing tasks consistent with tremor
Lucchini et al.,200757
Italy Cross-sectional 903 997 residents in 206municipalities
Prevalence in municipalities in vicinities offerromanganese plants 492/100 000 vs321/100 000 in others
Lucchini et al.,201258
Italy Cross-sectional 154 adolescents in vicinityof ferroalloy plants
157 controls
Historical manganese exposure fromferroalloy emission reflected by theconcentration in soil and biomarkers asassociated with sub-clinical deficits inolfactory and motor function
Dick et al., 200766 Scotland, Italy,Sweden,Romania,Malta
Case-control 767 PD patients1 989 controls
No association of manganese exposurewith PD
Finkelstein andJerrett, 200767
Canada Nested casecontrol
509 PD patients52 477 controls
OR 1.03 (95% CI 1.00–1.07)per 10 ngm�3 increase in particulatemanganese; exposure to ambientmanganese advances the age of diagnosisof PD
Willis et al., 201068 USA Cross-sectional 34 584 PD patients RR 1.78 (95% CI 1.54–2.07)Willis et al., 201263 USA Cohort 138 000 Medicare
beneficiaries with PDAdjusted HR 1.19 (95% CI 1.10–1.29)
ParkinsonDisea
se111

However, death certificates may underestimate the prevalence of parkin-sonism or PD, given the long clinical course and rarity of death due to PD-related morbidity. Two studies in Sweden and Denmark, using hospitalizationfor PD to identify cases, found no increased risk of PD in welders.61,62
However, a recent survival study in PD patients found that only 1% ofpatients with PD are ever hospitalized for PD, making this a very insensitivemethod of case identification.63 Finally, there is some evidence that weldingexposure may accelerate the age of onset of,64 and death due to, PD.65
There is also a growing body of evidence implicating community levelexposures to manganese as a risk factor for PD (Table 4.3). Although aEuropean study did not demonstrate an association with manganese exposure,based on occupation, hobbies, and water supply,66 three subsequent largestudies, using GIS (geographic information system) coding, did reportincreased risks. The first, using markers of exposure to ambient manganese,found no association with markers for traffic-generated air pollution, butreported an increased OR for markers for industrial emissions containingmanganese.67 Using Medicare data for PD case identification and exposurelagging, a second study reported a higher incidence of neurologist-diagnosed PDin urban USA counties with high manganese release compared to those withnone68 (Figure 4.2). This was specific to manganese as there was no increasedincidence in counties with high industrial lead or zinc emissions. While these twostudies suggest that community manganese exposures may be a risk factor forPD, the third, more recent GIS study suggests that manganese may modulatePD progression. This large retrospective cohort study of Medicare beneficiarieswith incident PD demonstrated higher risk of death in patients living in urbanareas with high industrial manganese emissions than in those in areas with lowemissions.63 This finding was specific to manganese as PD patients living inregions with high copper emissions had no elevated risk of PD.
The pathophysiology of manganese-associated neurotoxicity has been studiedusing molecular imaging in manganese-exposed welders. The same technologyprovides an opportunity to understand the relationship between manganeseexposure and PD. [18F]Fluorodopa ([18F]FDOPA) Positron EmissionTomography imaging in twowelderswith PDdemonstrated reduced [18F]FDOPAuptake to be more prominent in the posterior putamen contralateral to the mostaffected side.64A recent study of asymptomatic, activewelders found reductions in[18F]FDOPA uptake preferentially involving the caudate, with relative preser-vation of the posterior putamen.69 Workers imaged in this study had only mildabnormalities on a quantified motor exam for parkinsonism (Unified ParkinsonDisease Rating Scale motor scale). However, further work to investigate thespectrumof dopaminergic dysfunction inmanganese-exposedworkers is needed inorder to understand the toxic effects of manganese on the substantia nigra.
4.2.1.2 Lead
Long-term exposure to lead has been suggested as a possible risk factor for PD.Parkinsonism has been reported in workers exposed to lead-sulfate
112 Chapter 4

Figure 4.2 Map of USA showing heavy metal emitting facilities (manganese, copper, or lead).Produced by A. Wright Willis, using Environmental Protection Agency Toxic Release Inventory Facility data, 1988–2005, usingESRI ARC MAP, version 9 software.
ParkinsonDisea
se113

batteries.70–72 A USA case-control study, published in 2006, reported a two-fold increase in the risk of PD with occupational lead exposure, measured ascumulative lead in bone tissue.73 While lead in blood is a good biomarker forrecent exposure, cumulative exposure, which can be measured in bone wherethe half-life for lead is decades, is more relevant when studying PD. A second,much larger case-control study, carried out in the USA and published in 2010,confirmed a role for lead in the development of PD.74 However, Willis et al.found no relationship between industrial lead emissions and the incidence ofPD in the USA in a cross-sectional GIS study, using Medicare data.68 Resi-dential lead exposure differs from manganese in that it has many potentialsources. The role of environmental lead exposure in PD thus needs to beinvestigated more thoroughly.
4.2.1.3 Copper
As for lead, the evidence for an association between residential exposure tocopper and PD is tenuous. While occupational exposure to copper wasassociated with a two-fold increased risk for PD in a population-based case-control study in the USA,35 no association was found in a case-control studyconducted in Germany.34
An earlier population-based mortality study showed that USA counties witha higher concentration of paper-, chemical-, iron- or copper-related industrieshad statistically significantly higher PD death rates than counties without theseindustries,16 suggesting a geographic association between PD mortality and theindustrial use of heavy metals. Using GIS, Willis et al. analyzed Medicare datafor the risk of PD in counties with high emissions of copper and found norelationship between industrial copper emissions and the incidence of PD.68
4.2.1.4 Combinations of Metals
Studies suggest that exposures to combinations of metals present a higher riskfor PD than exposures to single metals. Gorell et al. calculated increased risksfor PD with occupational exposures to lead and copper (OR 5.24), lead andiron (OR 2.83), and iron and copper (OR 3.69) over more than 20 years.35
Another study demonstrated an increased risk for PD in those occupationallyexposed to a combination of manganese, iron, and aluminium (OR 2.28), whichincreased when exposure was longer than 30 years (OR 13.64).14 However, thenumber of subjects was small in both studies.
4.2.1.5 Other Metals
Other metals that have been studied include iron, zinc, cadmium, aluminium,and nickel. Although more central nervous system symptoms and decreasedmotor function were reported in 38 aluminium exposed welders compared to 39controls,52 a small case-control study of 130 patients with PD, compared to sex-and age-matched community controls selected by random-digit dialing, showed
114 Chapter 4

no difference in work-related contact with aluminium.49 One case-control studyof only 54 patients in the 1980s demonstrated an association between bloodmercury levels and PD.36 All subsequent studies on mercury have shown noassociation.34,35,75 There is no other evidence of an association of exposure toany of these metals with PD76 (when not combined with exposure to othermetals, as discussed in Section 4.2.1.4).
4.2.2 Pesticides
Numerous studies have investigated the association between exposure topesticides and the risk of PD. Products most consistently implicated as riskfactors for PD are the widely-used broad-spectrum herbicide, paraquat(1,10-dimethyl-4,40-bipyridylium dichloride), and the manganese-containingfungicide, maneb (manganese ethylene bisdithiocarbamate), although neur-ological effects of other pesticides have also been reported.
There are reports of the development of parkinsonism after acute exposure todiquat,77 paraquat,78 and glyphosate.79 In addition, a study comparing 50maneb-exposed, with 19 non-exposed, agricultural workers found that theexposed group was significantly more likely to have rigidity than the non-exposed group.80 A case-control study conducted in eight movement disorderscenters in North America compared lifelong occupational and job task historiesto determine associations with parkinsonism and certain clinical subtypes in519 cases and 511 controls.81 Risk of parkinsonism increased with pesticide use(OR 1.90; 95% CI 1.12–3.21), use of any of eight pesticides mechanisticallyassociated with experimental parkinsonism (OR 2.20; 95% CI 1.02–4.75), anduse of the herbicide 2,4-dichlorophenoxyacetic acid (OR 2.59; 95% CI1.03–6.48).
Studies investigating risk of PD associated with pesticides are conflicting.There are several case-control studies demonstrating increased risk of PDassociated with occupational exposure to pesticides, herbicides, fungicides,and/or insecticides.11,82–87 Many of these studies were based on small numbersof PD cases. On the other hand, a large cross-sectional study found adose–response relationship between self-reported incident, but not prevalent,PD and pesticide use in more than 52 000 pesticide applicators.88 However,there was no association with specific pesticides. In a cohort study, a relativerisk of 1.7 (95% CI 1.2–2.3) was calculated for PD and pesticide use.89
A recently published Finnish nested case-control study, using serumbiomarkers of organochlorine pesticides collected from 101 cases and 349matched controls from 1968 to 1972, demonstrated weak evidence for anassociation between PD and pesticide exposure.90 A dose-dependent increasedrisk of PD was found for only one of the five pesticides tested (dieldrin) andonly among non-smokers.
Fewer studies have looked at associations of PD with community exposureto pesticides. A case-control study in California, using death certificates toidentify PD cases, found that PD mortality was higher in counties using agri-cultural pesticides than in those where pesticides were not used (ORs ranged
Parkinson Disease 115

from 1.19 to 1.45).91 However, studies that use GIS methodologies to estimateexposure, rather than relying on subjective self-reported exposure data, providethe most convincing evidence of the link between pesticides and PD. GISmodeling was used in a second case-control study to calculate residentialexposure to maneb and paraquat in more than 300 cases and controls over 10years.92,93 High residential exposures to these pesticides significantly increasedthe risk of PD.
Other studies have attempted to estimate the risk of PD from communityexposure to pesticides by using well water consumption as a surrogate measureof pesticide or herbicide exposure. Only one study, however, has measuredpesticide contamination of well water and attempted to correlate these levelswith PD risk. Gatto et al. used a case-control GIS model to investigate whetherdrinking water from wells in areas with documented historical agriculturalpesticide use was associated with an increased risk of PD among residents in afarming-intensive area of California.94 A comparison of 368 PD cases,diagnosed by movement disorder specialists, with 341 non-PD controls, wasmade. The risk of PD increased for consumption of well water contaminatedwith methomyl (OR 1.67; 95% CI 1.00–2.78), chlorpyrifos (OR 1.87; 95% CI1.05–3.31), and propargite (OR 1.92; 95% CI 1.15–3.20) and also increased asthe number of pesticides in the water increased. The authors concluded thatconsuming well water, presumably contaminated with pesticides, may play arole in the aetiology of PD.
4.2.3 Solvents
Parkinsonism has been reported in patients following exposure to solvents,including lacquer thinner,95 n-hexane,96 carbon tetrachloride,97 and mixedsolvent exposures from petroleum waste.98 Parkinsonian features have alsobeen described in painters exposed to various solvents, including toluene,xylene, carbon disulfide, thinner, methanol, and methylethylketone.99,100
Parkinsonism has been described in a number of case reports as a conse-quence of a methanol poisoning,101–106 but no studies have shown anassociation with PD for this or any other solvent, other than trichloroethylene.
Although a case-control study in Italy identified occupational exposure toorganic solvents as the only significant risk factor for PD among severalindustrial chemicals investigated (OR 2.78; 95% CI 1.23–6.26),107 the numbersof cases and controls were small (86 of each) and no specific solvents wereidentified. Epidemiological studies have only been conducted to testassociations of parkinsonism and/or PD with trichloroethylene and carbondisulfide. However, all studies have been performed in occupationally exposedindividuals, and no data are available for residential exposures.
4.2.3.1 Trichloroethylene
Trichloroethylene (TCE) is a chlorinated hydrocarbon commonly used as asolvent in the industrial degreasing of metals. It is also used in adhesive paint
116 Chapter 4

and polyvinyl chloride production, in the textile industry, and in the manu-facturing of pesticides and other chemicals. TCE is also the most commonorganic contaminant of groundwater.108
There have been several case reports of PD associated with occupationalexposure to TCE. A 47-year old women developed PD after exposure to TCE,first as a house cleaner, and then in the plastics industry.109 Three cases werealso reported by Kochen et al. in 2003.110 In a report published in 2008, Gashet al. described three factory workers, using TCE as a degreasing agent, whodeveloped PD.111 An additional 24 workers demonstrated parkinsonian motorfeatures.
More recently, Goldman et al. tested the hypothesis that exposure to specificsolvents is associated with PD risk. They interviewed 99 twin pairs discordantfor PD and estimated exposures to six different solvents. Only exposure to TCEwas associated with a significantly increased risk of PD (OR 6.1; 95% CI1.2–33).108However, the number of subjects was small and exposure assessmentswere based on jobs that may have involved exposure to multiple agents.Studies withmore detailed dose reconstruction and larger numbers are necessaryto confirm these findings, as solvents are common environmental toxins.
Hydrocarbon exposure has also been investigated as a risk factor for PD inother epidemiological studies. A nested case-control study of 188 patients withPD found that those occupationally exposed to hydrocarbons were significantlyyounger at onset of disease (p¼ 0.014), suggesting that hydrocarbons may bean environmental accelerant for PD.112
4.2.3.2 Carbon Disulfide
Carbon disulfide is used primarily in the manufacture of regenerated celluloserayon but is also used in many other industries. Atypical parkinsonism in 21grain workers (grain inspectors, malt laboratory workers, and grain elevatorworkers) was attributed to exposure to carbon disulfide in the 1980s.113
Symptoms included bradykinesia, rest tremor, cerebellar signs, and sensoryneuropathy. In a more recent cross-sectional study of 85 viscose rayon plantworkers and 66 unexposed controls, exposed workers performed more poorlyon finger tapping tests, and displayed postural tremor and peripheral poly-neuropathy, even at exposure levels below the threshold limit value.114 Noassociations with typical PD have been demonstrated.
4.3 Conclusion
This chapter identifies several common environmental chemicals as risk factorsfor PD. The metals for which most evidence exists for an association withparkinsonism and/or PD are manganese, lead, and copper. The products in theagricultural industry that are most consistently implicated as risk factors forPD and/or parkinsonism are paraquat and maneb. There is some evidence foran association of parkinsonism with carbon disulfide, but TCE is the onlysolvent for which there is modest evidence for a risk of PD. Future studies,
Parkinson Disease 117

providing converging evidence for the aetiologic role of these environmentalchemicals are needed in order to demonstrate dose–response and to establishcritical thresholds of exposure to inform environmental regulation. Despitesome contradictory findings, reducing environmental exposures may well resultin a substantial reduction in the number of new cases of PD.
Acknowledgements
Dr Racette’s research is supported by the National Institute for EnvironmentalHealth Sciences (R01 ES013743, K24 ES017765, P42ES04696), the Michael J.Fox Foundation, National Institute of Neurological Disorders and Stroke(NINDS) Grant Number 5T32NS007205-27, National Center for ResearchResources (NCRR0) and National Institutes of Health (NIH) Roadmap forMedical Research Grant Number UL1 RR024992, the American ParkinsonDisease Association, and the Greater St. Louis Chapter of the AmericanParkinson Disease Association. Both Dr Racette’s and Dr Nelson’s research isfurther supported by Washington University: Grant Numbers ICTS NCRRUL1RR024992 and R21 ES017504.
Permission to reproduce Figure 4.1 was obtained from authors Dr AllisonWright Willis and Dr Brad Racette, and from S. Karger AG, Basel. Permissionto use Figure 4.2 was obtained from Dr Allison Wright Willis.
References
1. A. Wright Willis, B. A. Evanoff, M. Lian, S. R. Criswell andB. A. Racette, Neuroepidemiology, 2010, 34, 143–151.
2. E. D. Louis, J. A. Luchsinger, M. X. Tang and R. Mayeux, Neurology,2003, 61, 24–28.
3. E. D. Louis, M. X. Tang, N. Schupf and R. Mayeux, Arch. Neurol., 2005,62, 297–302.
4. E. D. Louis, K. Marder, M. H. Tabert and D. P. Devanand, Mov. Disord,2008, 23, 524–530.
5. W. R. Gibb and A. J. Lees, Neuropathol. Appl. Neurobiol., 1989, 15,27–44.
6. Parkinson Study Group PRECEPT Investigators, Neurology, 2007, 69,1480–1490.
7. I. Shoulson, Ann. Neurol., 1998, 44, S160–S166.8. H. M. Gao and J. S. Hong, Prog. Neurobiol. (N.Y.), 2011, 94, 1–19.9. W. M. Caudle, T. S. Guillot, C. R. Lazo and G. W. Miller, Neurotox-
icology, 2012, 33, 178–188.10. E. Granieri, M. Carreras, I. Casetta, V. Govoni, M. R. Tola, E. Paolino,
V. C. Monetti and P. De Bastiani, Arch. Neurol., 1991, 48, 854–857.11. J. P. Hubble, T. Cao, R. E. Hassanein, J. S. Neuberger and W. C. Koller,
Neurology, 1993, 43, 1693–1697.12. W. Koller, B. Vetere-Overfield, C. Gray, C. Alexander, T. Chin,
J. Dolezal, R. Hassanein and C. Tanner, Neurology, 1990, 40, 1218–1221.
118 Chapter 4

13. L. W. Svenson, G. H. Platt and S. E. Woodhead, Can. J. Neurol. Sci.,1993, 20, 307–311.
14. J. Zayed, S. Ducic, G. Campanella, J. C. Panisset, P. Andre, H. Massonand M. Roy, Can. J. Neurol. Sci., 1990, 17, 286–291.
15. B. S. Schoenberg, B. O. Osuntokun, A. O. Adeuja, O. Bademosi,V. Nottidge, D. W. Anderson and A. F. Haerer, Neurology, 1988, 38,645–646.
16. B. A. Rybicki, C. C. Johnson, J. Uman and J. M. Gorell, Mov. Disord,1993, 8, 87–92.
17. R. Totaro, C. Marini, F. Pistoia, S. Sacco, T. Russo and A. Carolei, Acta.Neurol. Scand., 2005, 112, 24–28.
18. D. Hristova, Z. Zachariev, N. Mateva and I. Grozdev, Neuroepi-demiology, 2010, 34, 76–82.
19. C. C. Chen, T. F. Chen, Y. C. Hwang, Y. R. Wen, Y. H. Chiu, C. Y. Wu,R. C. Chen, J. J. Tai, T. H. Chen and H. H. Liou, Neuroepidemiology,2009, 33, 350–357.
20. S. M. Aquilonius and P. Hartvig, Acta. Neurol. Scand., 1986, 74, 379–382.21. W. E. Lux and J. F. Kurtzke, Neurology, 1987, 37, 467–471.22. P. Taba and T. Asser, Acta. Neurol. Scand., 2002, 106, 276–281.23. P. Taba and T. Asser, Neuroepidemiology, 2003, 22, 41–45.24. R. W. Walker, A. Hand, C. Jones, B. H. Wood and W. K. Gray, Park-
insonism Relat. Disord., 2010, 16, 572–575.25. C. M. Peters, C. E. Gartner, P. A. Silburn and G. D. Mellick, J. Clin.
Neurosci., 2006, 13, 343–348.26. H. D. Vlajinac, S. B. Sipetic, J. M. Maksimovic, J. M. Marinkovic,
E. D. Dzoljic, I. S. Ratkov and V. S. Kostic, Int. J. Neurosci., 2010, 120,361–367.
27. A. H. Rajput, K. P. Offord, C. M. Beard and L. T. Kurland, Ann. Neurol.,1984, 16, 278–282.
28. R. L. Sutcliffe and J. R. Meara, Acta. Neurol. Scand., 1995, 92, 443–350.29. K. Marder, G. Logroscino, B. Alfaro, H. Mejia, A. Halim, E. Louis,
L. Cote and R. Mayeux, Neurology, 1998, 50, 279–281.30. S. K. Van Den Eeden, C. M. Tanner, A. L. Bernstein, R. D. Fross,
A. Leimpeter, D. A. Bloch and L. M. Nelson, Am. J. Epidemiol., 2003,157, 1015–1022.
31. T. Fukushima, X. Tan, Y. Luo and H. Kanda, Neuroepidemiology, 2010,34, 18–24.
32. R. Lucchini, E. Albini, L. Benedetti, S. Zoni, A. Caruso, E. Nan,P. Pasqualetti, P. M. Rossini, G. Binetti, L. Benussi, G. Parrinello,R. Gasparotti, A. Padovani, F. Draicchio and L. Alessio, G. Ital. Med.Lav. Ergon, 2007, 29, 280–281.
33. R. Lucchini, L. Benedetti, S. Borghesi, S. Garattini, G. Parrinello andL. Alessio, G. Ital. Med. Lav. Ergon, 2003, 25(Suppl), 88–89.
34. A. Seidler, W. Hellenbrand, B. P. Robra, P. Vieregge, P. Nischan,J. Joerg, W. H. Oertel, G. Ulm and E. Schneider, Neurology, 1996, 46,1275–1284.
Parkinson Disease 119

35. J. M. Gorell, C. C. Johnson, B. A. Rybicki, E. L. Peterson, G. X. Kortsha,G. G. Brown and R. J. Richardson, Neurology, 1997, 48, 650–658.
36. C. H. Ngim and G. Devathasan, Neuroepidemiology, 1989, 8, 128–141.37. L. Casamajor, J. Am. Med. Assoc, 1913, 60, 646–649.38. M. Yamada, S. Ohno, I. Okayasu, R. Okeda, S. Hatakeyama, H.Watanabe,
K. Ushio and H. Tsukagoshi, Acta. Neuropathol., 1986, 70, 273–278.39. M. M. Canavan, W. Cobb and B. Drnovsek, Arch. Neurol. Psychiatry,
1934, 32, 501–512.40. J. Couper, Brit. Ann. Med. Pharm., 1837, 1, 41–42.41. J. Rodier, Br. J. Ind. Med., 1955, 12, 21–35.42. I. Mena, O. Marin, S. Fuenzalida and G. C. Cotzias, Neurology, 1967, 17,
128–136.43. S. Tanaka and J. Lieben, Arch. Environ. Health, 1969, 19, 674–684.44. D. G. Cook, S. Fahn and K. A. Brait, Arch. Neurol., 1974, 30,
59–64.45. C. M. Whitlock, Jr., S. J. Amuso and J. B. Bittenbender, Am. Ind. Hyg.
Assoc. J., 1966, 27, 454–459.46. J. D. Wang, C. C. Huang, Y. H. Hwang, J. R. Chiang, J. M. Lin and
J. S. Chen, Br. J. Ind. Med., 1989, 46, 856–859.47. C. C. Huang, C. S. Lu, N. S. Chu, F. Hochberg, D. Lilienfeld,
W. Olanowa and D. B. Calne, Neurology, 1993, 43, 1479–1483.48. J. M. Gorell, C. C. Johnson, B. A. Rybicki, E. L. Peterson, G. X. Kortsha,
G. G. Brown and R. J. Richardson, Neurotoxicology, 1999, 20,239–247.
49. K. M. Semchuk, E. J. Love and R. G. Lee, Neurology, 1993, 43,1173–1180.
50. S. V. Chandra, G. S. Shukla, R. S. Srivastava, H. Singh and V. P. Gupta,Clin. Toxicol., 1981, 18, 407–416.
51. K. Nelson, J. Golnick, T. Korn and C. Angle, Br. J. Ind. Med., 1993, 50,510–513.
52. B. Sjogren, A. Iregren, W. Frech, M. Hagman, L. Johansson, M. Tesarzand A. Wennberg, Occup. Environ. Med., 1996, 53, 32–40.
53. R. E. Korczynski, Appl. Occup. Environ. Hyg, 2000, 15, 936–945.54. P. Susi, M. Goldberg, P. Barnes and E. Stafford, Appl. Occup.
Environ. Hyg, 2000, 15, 26–38.55. B. A. Racette, S. D. Tabbal, D. Jennings, L. Good, J. S. Perlmutter and
B. Evanoff, Neurology, 2005, 64, 230–235.56. D. Mergler, M. Baldwin, S. Belanger, F. Larribe, A. Beuter, R. Bowler,
M. Panisset, R. Edwards, A. de Geoffroy, M. P. Sassine and K. Hudnell,Neurotoxicology, 1999, 20, 327–342.
57. R. G. Lucchini, E. Albini, L. Benedetti, S. Borghesi, R. Coccaglio,E. C. Malara, G. Parrinello, S. Garattini, S. Resola and L. Alessio, Am. J.Ind. Med., 2007, 50, 788–800.
58. R. G. Lucchini, S. Guazzetti, S. Zoni, F. Donna, S. Peter, A. Zacco,M. Salmistraro, E. Bontempi, N. J. Zimmerman and D. R. Smith,Neurotoxicology, 2012, 33, 687–696.
120 Chapter 4

59. S. M. Goldman, C. M. Tanner, C. W. Olanow, R. L. Watts, R. D. Fieldand J. W. Langston, Neurology, 2005, 65, 1430–1435.
60. P. A. Schulte, C. A. Burnett, M. F. Boeniger and J. Johnson, Am. J.Public Health, 1996, 86, 1281–1288.
61. C. M. Fored, J. P. Fryzek, L. Brandt, G. Nise, B. Sjogren,J. K. McLaughlin, W. J. Blot and A. Ekbom, Occup. Environ. Med., 2006,63, 135–140.
62. J. P. Fryzek, J. Hansen, S. Cohen, J. P. Bonde, M. T. Llambias,H. A. Kolstad, A. Skytthe, L. Lipworth, W. J. Blot and J. H. Olsen,J. Occup. Environ. Med., 2005, 47, 466–472.
63. A. W. Willis, M. Schootman, N. Kung, B. A. Evanoff, J. S. Perlmutterand B. A. Racette, Arch. Neurol., 2012, 69, 601–607.
64. B. A. Racette, L. McGee-Minnich, S. M. Moerlein, J. W. Mink,T. O. Videen and J. S. Perlmutter, Neurology, 2001, 56, 8–13.
65. R. M. Park, R. M. Bowler, D. E. Eggerth, E. Diamond, K. J. Spencer,D. Smith and R. Gwiazda, Neurotoxicology, 2006, 27, 373–384.
66. F. D. Dick, G. De Palma, A. Ahmadi, N. W. Scott, G. J. Prescott,J. Bennett, S. Semple, S. Dick, C. Counsell, P. Mozzoni, N. Haites,S. B. Wettinger, A. Mutti, M. Otelea, A. Seaton, P. Soderkvist andA. Felice, Occup. Environ. Med., 2007, 64, 666–672.
67. M. M. Finkelstein and M. Jerrett, Environ. Res., 2007, 104, 420–432.68. A. W. Willis, B. A. Evanoff, M. Lian, A. Galarza, A. Wegrzyn,
M. Schootman and B. A. Racette,Am. J. Epidemiol., 2010, 172, 1357–1363.69. S. R. Criswell, J. S. Perlmutter, T. O. Videen, S. M. Moerlein,
H. P. Flores, A. M. Birke and B. A. Racette, Neurology, 2011, 76,1296–1301.
70. W. Kuhn, R. Winkel, D. Woitalla, S. Meves, H. Przuntek and T. Muller,Neurology, 1998, 50, 1885–1886.
71. P. Sanz, S. Nogue, D. Vilchez, J. Vilchez, A. Casal and G. Logroscino,J. Int. Med. Res., 2007, 35, 159–163.
72. R. Winkel, W. Kuhn and H. Przuntek, J. Neural. Transm. Suppl., 1995,46, 183–187.
73. S. Coon, A. Stark, E. Peterson, A. Gloi, G. Kortsha, J. Pounds,D. Chettle and J. Gorell, Environ. Health Perspect., 2006, 114,1872–1876.
74. M. G. Weisskopf, J. Weuve, H. Nie, M. H. Saint-Hilaire, L. Sudarsky,D. K. Simon, B. Hersh, J. Schwartz, R. O. Wright and H. Hu, Environ.Health Perspect., 2010, 118, 1609–1613.
75. C. G. Ohlson and C. Hogstedt, Scand. J. Work Environ. Health, 1981, 7,252–256.
76. J. M. Gorell, B. A. Rybicki, C. Cole Johnson and E. L. Peterson,Neuroepidemiology, 1999, 18, 303–308.
77. G. P. Sechi, V. Agnetti, M. Piredda, M. Canu, F. Deserra, H. A. Omarand G. Rosati, Neurology, 1992, 42, 261–263.
78. J. R. Sanchez-Ramos, F. Hefti and W. J. Weiner, Neurology, 1987,37, 728.
Parkinson Disease 121

79. E. R. Barbosa, M. D. Leiros da Costa, L. A. Bacheschi, M. Scaff andC. C. Leite, Mov. Disord, 2001, 16, 565–568.
80. H. B. Ferraz, P. H. Bertolucci, J. S. Pereira, J. G. Lima andL. A. Andrade, Neurology, 1988, 38, 550–553.
81. C. M. Tanner, G. W. Ross, S. A. Jewell, R. A. Hauser, J. Jankovic,S. A. Factor, S. Bressman, A. Deligtisch, C. Marras, K. E. Lyons,G. S. Bhudhikanok, D. F. Roucoux, C. Meng, R. D. Abbott andJ. W. Langston, Arch. Neurol., 2009, 66, 1106–1113.
82. F. Duzcan, M. Zencir, F. Ozdemir, G. O. Cetin, H. Bagci, P. Heutink,V. Bonifati and T. Sahiner, Mov. Disord, 2003, 18, 799–804.
83. R. Frigerio, K. R. Sanft, B. R. Grossardt, B. J. Peterson, A. Elbaz,J. H. Bower, J. E. Ahlskog, M. de Andrade, D. M. Maraganore andW. A. Rocca, Mov. Disord, 2006, 21, 1688–1692.
84. J. M. Gorell, C. C. Johnson, B. A. Rybicki, E. L. Peterson andR. J. Richardson, Neurology, 1998, 50, 1346–1350.
85. H. H. Liou, M. C. Tsai, C. J. Chen, J. S. Jeng, Y. C. Chang, S. Y. Chenand R. C. Chen, Neurology, 1997, 48, 1583–1588.
86. C. M. Tanner, F. Kamel, G. W. Ross, J. A. Hoppin, S. M. Goldman,M. Korell, C. Marras, G. S. Bhudhikanok, M. Kasten, A. R. Chade,K. Comyns, M. B. Richards, C. Meng, B. Priestley, H. H. Fernandez,F. Cambi, D. M. Umbach, A. Blair, D. P. Sandler and J. W. Langston,Environ. Health Perspect., 2011, 119, 866–872.
87. A. Menegon, P. G. Board, A. C. Blackburn, G. D. Mellick and D. G. LeCouteur, Lancet, 1998, 352, 1344–1346.
88. F. Kamel, C. Tanner, D. Umbach, J. Hoppin, M. Alavanja, A. Blair,K. Comyns, S. Goldman, M. Korell, J. Langston, G. Ross andD. Sandler, Am. J. Epidemiol., 2007, 165, 364–374.
89. A. Ascherio, H. Chen, M. G. Weisskopf, E. O’Reilly, M. L. McCullough,E. E. Calle, M. A. Schwarzschild and M. J. Thun, Ann. Neurol., 2006, 60,197–203.
90. M. G. Weisskopf, P. Knekt, E. J. O’Reilly, J. Lyytinen, A. Reunanen,F. Laden, L. Altshul and A. Ascherio, Neurology, 2010, 74, 1055–1061.
91. B. Ritz and F. Yu, Int. J. Epidemiol., 2000, 29, 323–329.92. S. Costello, M. Cockburn, J. Bronstein, X. Zhang and B. Ritz, Am. J.
Epidemiol., 2009, 169, 919–926.93. B. R. Ritz, A. D. Manthripragada, S. Costello, S. J. Lincoln, M. J. Farrer,
M. Cockburn and J. Bronstein, Environ. Health Perspect., 2009, 117,964–969.
94. N. M. Gatto, M. Cockburn, J. Bronstein, A. D. Manthripragada andB. Ritz, Environ. Health Perspect., 2009, 117, 1912–1918.
95. R. J. Uitti, B. J. Snow, H. Shinotoh, F. J. Vingerhoets, M. Hayward,S. Hashimoto, J. Richmond, S. P. Markey, C. J. Markey and D. B. Calne,Ann. Neurol., 1994, 35, 616–619.
96. G. Pezzoli, A. Antonini, S. Barbieri, M. Canesi, L. Perbellini,A. Zecchinelli, C. B. Mariani, A. Bonetti and K. L. Leenders,Mov. Disord, 1995, 10, 279–282.
122 Chapter 4

97. E. Melamed and S. Lavy, Lancet, 1977, 309(8019), 1015.98. J. W. Tetrud, J. W. Langston, I. Irwin and B. Snow, Neurology, 1994, 44,
1051–1054.99. G. Hageman, J. van der Hoek, M. van Hout, G. van der Laan, E. J. Steur,
W. de Bruin and K. Herholz, J. Neurol., 1999, 246, 198–206.100. R. Kuriwaka, T. Mitsui, S. Fujiwara, Y. Nishida and T. Matsumoto, Eur.
Neurol., 2002, 47, 85–87.101. M. A. Guggenheim, J. R. Couch and W. Weinberg, Arch. Neurol., 1971,
24, 550–554.102. D. R. McLean, H. Jacobs and B. W. Mielke, Ann. Neurol., 1980, 8,
161–167.103. M. J. Mozaz, M. A. Wyke and B. Indakoetxea, J. Neurol.
Neurosurg. Psychiatry, 1991, 54, 843–844.104. W. Verslegers, M. Van den Kerchove, R. Crols, W. De Potter, B. Appel
and A. Lowenthal, Acta. Neurol. Belg., 1988, 88, 163–171.105. Y. Finkelstein and J. Vardi, Neurotoxicology, 2002, 23, 521–525.106. N. J. Reddy, L. D. Lewis, T. B. Gardner, W. Osterling, C. J. Eskey and
D. W. Nierenberg, Clin. Pharmacol. Ther. (N. Y., NY, U. S.), 2007, 81,114–121.
107. A. Smargiassi, A. Mutti, A. De Rosa, G. De Palma, A. Negrotti andS. Calzetti, Neurotoxicology, 1998, 19, 709–712.
108. S. M. Goldman, P. J. Quinlan, G. W. Ross, C. Marras, C. Meng,G. S. Bhudhikanok, K. Comyns, M. Korell, A. R. Chade, M. Kasten,B. Priestley, K. L. Chou, H. H. Fernandez, F. Cambi, J. W. Langston andC. M. Tanner, Ann. Neurol., 2011, 71, 776–784.
109. D. Guehl, E. Bezard, S. Dovero, T. Boraud, B. Bioulac and C. Gross, Eur.J. Neurol., 1999, 6, 609–611.
110. W. Kochen, D. Kohlmuller, P. De Biasi and R. Ramsay, Adv. Exp. Med.Biol., 2003, 527, 253–263.
111. D. M. Gash, K. Rutland, N. L. Hudson, P. G. Sullivan, G. Bing,W. A. Cass, J. D. Pandya, M. Liu, D. Y. Choi, R. L. Hunter,G. A. Gerhardt, C. D. Smith, J. T. Slevin and T. S. Prince, Ann. Neurol.,2008, 63, 184–192.
112. G. Pezzoli, M. Canesi, A. Antonini, A. Righini, L. Perbellini,M. Barichella, C. B. Mariani, F. Tenconi, S. Tesei, A. Zecchinelli andK. L. Leenders, Neurology, 2000, 55, 667–673.
113. H. A. Peters, R. L. Levine, C. G. Matthews and L. J. Chapman, Arch.Neurol., 1988, 45, 537–540.
114. L. Godderis, L. Braeckman, M. Vanhoorne and M. Viaene, Int. J. Hyg.Environ. Health, 2006, 209, 139–150.
115. H. Roels, R. Lauwerys, J. P. Buchet, P. Genet, M. J. Sarhan, I. Hanotiau,M. de Fays, A. Bernard and D. Stanescu, Am. J. Ind. Med., 1987, 11,307–327.
116. A. Iregren, Neurotoxicol. Teratol., 1990, 12, 673–675.117. A. Wennberg, A. Iregren, G. Struwe, G. Cizinsky, M. Hagman and
L. Johansson, Scand. J. Work Environ. Health, 1991, 17, 255–262.
Parkinson Disease 123

118. A. Wennberg, M. Hagman and L. Johansson, Neurotoxicology, 1992, 13,271–274.
119. D. Mergler, G. Huel, R. Bowler, A. Iregren, S. Belanger, M. Baldwin,R. Tardif, A. Smargiassi and L. Martin, Environ. Res., 1994, 64,151–180.
120. R. Lucchini, P. Apostoli, C. Perrone, D. Placidi, E. Albini, P. Migliorati,D. Mergler, M. P. Sassine, S. Palmi and L. Alessio, Neurotoxicology,1999, 20, 287–297.
124 Chapter 4

CHAPTER 5
Mercury
HIROSHI SATOH
Professor Emeritus, Tohoku University, Food Safety Commission, AkasakaPark Bld. 22F 5-2-20 Akasaka, Minato-ku, Tokyo 107-6122E-mail: [email protected]
5.1 Mercury and its Compounds
5.1.1 Classification of Mercury Compounds
Mercury (Hg) is a metal that exists in liquid form at room temperature. Metallicmercury easily evaporates in air to become mercury vapor (elemental mercury).Mercury creates various compounds which are classified into two general groups:inorganic mercury compounds and organic mercury compounds. Inorganicmercury compounds include mercurous mercury (monovalent) and mercuricmercury (divalent) compounds. Mercurous mercury compounds are easilybroken down into mercuric mercury and elemental mercury. Organic mercurycompounds are chemicals in which mercury is covalently bound to carbon, forexample R–Hg1 or R–Hg–R0, where R or R0 represent organic moieties. Threemajor organic mercury compound groups are alkylmercury, arylmercury, andalkoxyalkylmercury.
It is noteworthy that different mercury compounds have different toxico-logical profiles, including routes of exposure, metabolism in the body, andhealth effects. For metallic mercury, inhalation of mercury vapor is a significantexposure route, while oral exposure via ingestion is not. A typical health effectof mercuric mercury compounds is nephrotoxicity, while that of alkylmercurycompounds is neurotoxicity. It is also recognized that exposure at different
Issues in Toxicology No. 16
Aging and Vulnerability to Environmental Chemicals: Age-related Disorders and their Origins in
Environmental Exposures
Edited by Bernard Weiss
r The Royal Society of Chemistry 2013
Published by the Royal Society of Chemistry, www.rsc.org
125

stages of life causes different health effects. In the disasters of MinamataDisease and Iraqi methyl mercury poisoning, infants born to mothers withminimal signs and symptoms of methylmercury exposure showed severeneurological damage and developmental delays. Therefore, fetuses areconsidered to be more susceptible than their mothers.
5.2 Mercury Vapor (Elemental Mercury)
5.2.1 Physical and Chemical Properties
The physical and chemical properties of metallic mercury are as follows:1
atomic weight, 200.6; atomic number, 80; density, 13.6; melting point,�38.90 1C; boiling point, 356.60 1C. Since the melting point of metallic mercuryis �38.90 1C, it exists in liquid form at room temperature. Metallic mercuryis highly volatile. A saturated atmosphere of mercury vapor containsapproximately 18mgHg/m3 at 24.0 1C.
5.2.2 Exposure and Metabolism
5.2.2.1 Route of Exposure and Absorption
Substantial exposure to mercury vapor occurs via inhalation. Mercury vapor isreadily absorbed through the alveolar membrane.2 Approximately 80% ofmercury will be absorbed through the alveolar membrane.
Metallic mercury (in liquid form) is poorly absorbed from the gastro-intestinal tract. Therefore, metallic mercury ingested is of no toxicologicalimportance. Dermal absorption is low; uptake of mercury vapor by the forearmskin of volunteers was calculated to be approximately 1% of the uptake frominhalation.3
5.2.2.2 Metabolism in the Body
Absorbed mercury vapor is dissolved in the blood stream where it is oxidizedmainly in red blood cells.4,5 While being circulated, remaining elementalmercury is able to penetrate into brain tissue through the blood–brain barrier6
and into fetal tissues through the placental barrier.7 The distribution ofmercury in neonatal guinea pigs after in utero exposure to mercury vapor wasfound to be highest in the liver,8 while in adult animals the kidney has thehighest distribution. The distribution in the kidney, and other organsaccumulating mercury, after exposure to mercury vapor is similar to that seenafter exposure to mercuric compounds (see section 5.3.2.).
Following exposure to mercury vapor, mercuric mercury is the mainchemical form of eliminated mercury, although exhalation of small quantities ofmercury vapor has been demonstrated.9,10 The biological half-life of mercury inthe human body is considered to be approximately 60 days,10 though the data islimited. The biological half-life of mercury accumulated in the brain is slow andmay exceed several years.11,12
126 Chapter 5

5.2.3 Health Effects of Mercury Vapor
5.2.3.1 Acute Poisoning
Acute accidental exposure to high concentrations of mercury vapor causeserosive bronchitis and bronchiolitis with interstitial pneumonitis. The patientmay develop severe respiratory insufficiency. Sometimes signs caused by effectson the central nervous system (CNS), such as tremor or increased excitability,are observed.13
5.2.3.2 Chronic Poisoning
Repeated and long-term exposure to toxic levels of mercury vapor causes signsand symptoms of the CNS. Relatively low dose exposure produces asthenic-vegetative syndrome, involving weakness, fatigue, anorexia, loss of weight, anddisturbance of gastrointestinal functions. This syndrome has been calledmicromercurialism.14
At higher dose exposure, the characteristic tremor appears as fine trembling ofthe muscles interrupted by coarse shaking movements. This tremor is observed infingers, eyelids and lips. Mercurial erethism also develops; this is characterized bybehavioral and personality changes and increased excitability. Loss of memoryand insomnia are also observed. In addition to the effects on the CNS, inflam-matory changes of the gums with ptyalism (excessive salivation) may develop.
The toxic effects of mercury vapor exposure on organs other than the CNS,such as the kidneys, the immune system15 and the endocrine glands, have beenreported. It is, however, difficult to differentiate these from the effects of inorganicmercury, because after inhalation, mercury vapor is oxidized in the body.
5.3 Inorganic Mercury Compounds
5.3.1 Mercuric and Mercurous Mercury Compounds
Inorganic mercury compounds consist of two classes; mercuric mercury (divalent)compounds and mercurous (monovalent) mercury compounds. Mercuriccompounds include mercury(II) chloride, mercury(II) nitrate, mercury(II) oxideand mercury(II) sulfide. Mercurous compounds include mercury(I) chloride,mercury(I) iodide and mercury(I) sulfate. Mercurous mercury compounds areunstable, especially in the presence of biological molecules; they decompose intoelemental mercury and the ion of mercuric mercury. Therefore, mercuric mercuryis of toxicological significance.
5.3.2 Exposure and Metabolism
5.3.2.1 Route of Exposure and Absorption
Since mercuric mercury compounds are generally stable, inhalation exposure is notimportant; ingestion (exposure via the gastrointestinal tract) is the most significant.
Mercury 127

Acute poisoning after accidental or intentional ingestion of mercuriccompounds has been observed, indicating absorption of such compounds byingestion. From experimental studies,16 approximately 2% of ingested mercuricchloride is absorbed. It is considered that the corrosive action of mercuricchloride may alter the permeability of the gastrointestinal tract, enhancingabsorption. In newborn rats, increased absorption of mercury has beenreported.17
As for the skin (dermal absorption), it has been demonstrated that ifmercuric mercury applied to the human skin, penetration of mercury occurs.In animal studies,18 up to 8% of the mercuric chloride applied to the skin wasabsorbed within 5 hours.
5.3.2.2 Metabolism in the Body
After exposure to mercuric mercury, the kidneys accumulate the largest amountof mercury, followed by the liver. Mercuric mercury does not readily cross theblood–brain barrier or the placental barrier. However, mercuric mercury doesaccumulate in the placenta.19 In placental tissue, mercury coexists withmetallothionein (MT), suggesting a defense mechanism by MT.20
Twenty-four hours after injection of mercuric chloride (1.5 or 15.0mmol kg�1
BW) to pregnant mice on day 16 of gestation, only 0.03% of the dose wasdetected in an individual fetus.19 Whereas when methylmercury chloride wasinjected, 1.3% of the dose was detected.21
Mercuric mercury is excreted by the kidney and the fecal route, with smallamounts being excreted from sweat glands, lacrimal glands, mammary glands,and salivary glands.1 Small amounts of mercuric mercury is exhaled afterreduction to mercury vapor.22 Alcohol enhances exhalation by changing redoxstatus, which involves the inhibition of catalase activity.23
5.3.3 Health Effects of Mercuric Mercury Compounds
5.3.3.1 Acute Poisoning
Accidental or suicidal ingestion of mercuric chloride or other mercuric saltsinduces dysfunction of the kidneys and the intestinal tract.1 A solution ofconcentrated mercuric salt produces corrosion on the mucous membranes ofthe gastrointestinal tract; gastric pain and vomiting may follow. Abdominalpain and bloody diarrhea with necrosis of the intestinal mucosa will occur whenthe solution of mercuric salts reaches the intestine. Circulatory collapse (shock)and even death are possible. Survivors develop renal failure caused by necrosisof proximal tubular epithelium, and accompanying anuria and uremia.
5.3.3.2 Chronic Poisoning
Chronic poisoning caused by mercuric mercury salts is not considered to exist.Chronic exposure to a mixture of mercury vapor and mercuric mercury actually
128 Chapter 5

occurs in an occupational setting. In this case, the kidneys and CNS are targetorgans. Intake of mercurous chloride (calomel) as a purgative was reported toproduce symptoms similar to those of poisoning by exposure to a mixture ofmercury vapor and mercuric mercury.24
5.4 Organic Mercury Compounds (Methylmercury)
5.4.1 Organic Mercury Described in this Section
Among the organic mercury compounds, including alkylmercury, arylmercury,and alkoxyalkylmercury, methylmercury compounds have toxicologicalsignificance. Arylmercury and alkoxyalkylmercury compounds are generallyunstable in the environment and in the body of organisms. They easily breakdown into mercuric mercury. Short-chain alkyl mercury compounds, such asmethyl- and ethylmercury compounds, are stable. Ethylmercury compoundshave toxicological properties similar to those of the methylmercury compoundsbut are more rapidly degraded in the body.
Since methylmercury occurs naturally in the environment and is biocon-centrated through the food web, the carnivore fish and sea mammals located atthe center of the food web contain methylmercury concentration, thereforethere may be health concerns associated with consuming these fish. Methyl-mercury compounds are the subject of section 5.4.
5.4.2 Exposure and Metabolism
5.4.2.1 Route of Exposure and Absorption
In the occupational setting, the vapor of methylmercury can be absorbed byinhalation. It is also possible that methylmercury salts in the form of fineparticles are inhalable. In olden times, methylmercury-related poisoning ofworkers was reported.25 Dimethylmercury is liquid at room temperature andeasily evaporates. Substantial amounts of vaporized dimethylmercury can beinhaled resulting in poisoning.26
Although exposure through inhalation has occurred as described, ingestionof methylmercury in food is an important route of exposure among the generalpopulation.
Ingested methylmercury is almost completely (more than 95%) absorbedthrough the intestinal tract. Absorption of alkylmercury compounds throughthe skin is also likely to occur, and cases of poisoning caused by local appli-cation of ointment containing methylmercury to the skin have been described.27
5.4.2.2 Metabolism
Methylmercury absorbed into the body is distributed to tissues and organs viathe blood stream. In the blood, a large proprotion (490%) of methylmercuryexists in red blood cells. Methylmercury crosses the blood–brain barrier and
Mercury 129

placental barrier. This was thought to be due to lipid solubility of methyl-mercury, but was later attributed to formation of a methylmercury–cystinecomplex that structurally resembles methionine, an essential amino acid.The methylmercury–cystine complex is transported through the barriers.28,29
After administration of tracer doses of radioactive methylmercury in man,10% of the body burden of radioactive mercury was found in the head.30
A substantial amount of methylmercury is found in the liver and the kidneys.Methylmercury is rather evenly distributed in the rest of the body.
Methylmercury transported through the placenta to the fetus accumulatesand concentrates, especially in the brain. Higher mercury concentrations infetal blood than in maternal blood are probably due to the different chemicalstructures of fetal and adult hemoglobin.
Methylmercury is decomposed to inorganic mercury by demethylationin the body. In the organs of sea mammals, extremely high concentrationsof mercury have been detected in the form of inorganic mercury.31 Thedemethylation process and formation of mercury selenide is considered a defensemechanism against methylmercury toxicity, though apparent accumulation isextremely large.
Methylmercury is excreted mainly (approximately 90%) through the liverinto the bile, and partly through the kidney into urine. Thus fecal excretion isthe main route, though methylmercury excreted in the bile is reabsorbed in theintestine (an enterohepatic circulation). Methylmercury can be decomposed toinorganic mercury by the microflora in the intestine.32 Since inorganic mercuryis far less absorbed than methylmercury, the decomposition contributes toincrease fecal excretion. Methylmercury is also excreted into breast milk, theconcentration being approximately 5% of the concentration in the maternalblood.33 A recent study analyzed, using Electron Capture Detector GasChromatography, methylmercury in the breast milk of Japanese mothers livingin the ordinary environment.34 An average of 54% (with the range of 17–83%)of total mercury in the milk was identified as methylmercury. Since withoutspecific exposure most mercury in the human blood exists as methylmercury, itis considered that methylmercury is excreted into breast milk less thaninorganic mercury is.
Hair has been known as a good indicator of methylmercury exposure,because the tissue of a hair strand takes in methylmercury during hairformation. Thus hair is a route of excretion of methylmercury. The amounttaken up is proportional to the blood concentration of mercury at the time ofincorporation. The ratio of mercury concentration between blood and hair inman is considered to be 1/250 under steady-state conditions, although thequotient may vary with age35 and pregnancy. In fact, 1/340 on average wasreported among Japanese adults.36
The biological half-life of methylmercury is approximately 70 days onaverage. However, analyses of consecutive hair segments from the populationsin Iraq who ingested wheat contaminated with methylmercury37 suggest that apart of the population has longer biological half-lives, 110–190 days. Anintervention study where subjects ingested fish with high methylmercury
130 Chapter 5

concentrations revealed biological half-lives of approximately 90 days, fromanalyses of both hair and blood mercury.36
5.4.3 Health Effects of Methyl Mercury Compounds
5.4.3.1 Acute and Chronic Poisoning
In the case of methylmercury poisoning, there is no sharp difference betweenacute and chronic poisoning. Once a toxic dose has been absorbed in the body,it is retained for a long time, causing functional disturbances and damage.A single toxic dose does not produce signs or symptoms until after a latencyperiod.
The CNS is the critical organ and there are two types of poisoningdepending upon timing of exposure: fetal (pre- or perinatal) exposure and adultexposure.
5.4.3.2 Poisoning by Fetal Exposure
As was shown in the Minamata Disease disaster and Iraqi methylmercurypoisoning cases, the newborns from the mothers who ingested methylmercurydeveloped signs or symptoms. Severe cases showed an unspecific infantilecerebral palsy accompanied by ataxic motor disturbances and mental retar-dation. In mild cases, psychomotor retardation has been observed; in Iraqicases, delayed walking and talking and an increased incidence of seizures38 werereported. In fish-consuming populations with increased mercury exposure,such as 10 ppm in hair-mercury levels during pregnancy, impairedpsychomotor test performance of the child at 7 years of age39 was reported.Poor performances associated with prenatal methylmercury exposure havebeen reported among infants whose mothers were living in ordinaryenvironment.40,41 These reports indicate vulnerability of the fetus to methyl-mercury. Since methylmercury is excreted through breast milk, postnatalinfants can be exposed to methylmercury. It is, however, difficult to differ-entiate the effects of postnatal exposure from the effects of prenatal exposure.Because mothers exposed to methylmercury during pregnancy had elevatedmercury concentrations in breast milk, fetal exposure occurred. A mouseexperiment employing a cross-fostering procedure revealed effects of prenatalexposure were larger than those of postnatal exposure.42
5.4.3.3 Poisoning by Adult Exposure
In severe and typical poisoning cases, ataxia, concentric constriction of thevisual field, impairment of hearing, and extrapyramidal tract symptoms appear.Clonic seizures may be observed and some patients develop encephalitis andcan die. Less severe cases show sensitivity disturbances with paresthesia in thedistal extremities, in the tongue, and around the lips. These are early signs ofMinamata Disease.
Mercury 131

5.5 Developmental Toxicity of Mercury
5.5.1 Fetal Minamata Disease Patients
5.5.1.1 Discovery of Fetal Minamata Disease
Fetal Minamata Disease is caused by intrauterine exposure to methylmercurythrough the ingestion of contaminated seafood by pregnant mothers. It wasfirst detected in 1958 in the Minamata Bay area.43 Nine infants manifested asevere disease resembling cerebral palsy during the epidemiologic investigationby Kumamoto university. The incidence of the cerebral palsy-like disease wasextremely high among infants who were born in or after 1955. By 1974, 40 caseswere confirmed as fetal Minamata Disease.
Examination of these children revealed a high incidence of signs andsymptoms such as mental retardation, cerebellar ataxia, primitive reflex,dysarthria, seizure, and pyramidal signs. Sensory disturbance, constriction ofthe visual fields, and hearing impairment could not be examined because of theserious conditions of the patients. It is noteworthy that the mothers of thesechildren manifested minimal signs and symptoms of Minamata Disease, such asparesthesia of the lip and extremities. Therefore, fetuses are much morevulnerable than mothers.
5.5.1.2 Activities of Daily Living (ADL) Scores of FetalMinamata Disease Patients at Middle Age
Doi44 suggested an urgent follow-up study for the victims of fetal MinamataDisease, because of his impression of rapid exacerbation of the several fetalMinamata Disease patients of his acquaintance. In 2001, the 6th InternationalConference on Mercury as a Global Pollutant was held in Minamata, Japan. Atthe conference, Doi saw a fetal Minamata Disease patient in a wheelchair. Fiveyears previously, at the occasion of the opening of the Minamata exhibition inTokyo, the patient gave remarks on the stage without any help, though motiondid not appear completely smooth. Since he was still 46 years old, Doi noted therapid exacerbation. People who had cared for the patients told Doi that rapidexacerbation of fetal Minamata Disease patients was observed among severalpatients, but not all.
In 2002, a survey of 31 fetal Minamata Disease patients was conducted; thesurvey concerned family structure, present status of care, their demand for care,communication status, and ADL scores.45 Changes in ADL scores during thepast 15 years were also studied among the 22 patients. Their mean ages were45.5� 3.5 (n¼ 20) for males, and 46.1� 1.9 (n¼ 11) for females.
Eighteen patients lived in their home and 13 patients lived in a welfareinstitute. Analysis of ADL showed that around 50% of the patients could notwalk or take a bath, and 30 to 40% of the patients could not eat, excrete,change their clothes, or wash their face unaided. Approximately 80% of thepatients could understand daily conversation to some degree. Their ability toexpress their demands and thoughts, put an idea into action, remember events,
132 Chapter 5

and live like ordinary people were significantly worse than their ability tounderstand daily conversation.
The changes in the ADL scores of the 22 patients over the 15 year periodwere not significant, although two patients showed a rapid decrease for ADL ofmovement and two other patients died after an interview, before they reached50 years of age.
This investigation did not involve neurological examination. But these resultsindicate that the disturbances among the fetal Minamata Disease patients arelong lasting, with rapidly deteriorating ADL in some cases. Increased risk ofearly death is also suggested, although the number of patients who experiencethis is small.
5.5.1.3 Cardiovascular Autonomic Nervous Functionsin Fetal Minamata Disease Patients and OtherPopulations
Cardiovascular autonomic nervous functions in nine fetal Minamata Diseasepatients (aged 44.3� 1.0 years) were compared with age matched healthysubjects.46 Electrocardiographic data were collected for 3 min. In the timedomain analyses, average R-R interval was significantly shorter for MinamataDisease patients than healthy subjects, while standard deviation of R-Rintervals or coefficient of variation were not. Frequency domain analysis byfast Fourier transformation revealed the high frequency component ofMinamata Disease patients was significantly lower than that of the healthysubjects.
In contrast, a birth cohort study on 1000 children from the Faroe Islandsrevealed that prenatal exposure to methylmercury decreased heart rate varia-bility only in boys at age 7 years. Both diastolic and systolic blood pressureelevated with increase of cord blood mercury level. At age 14 years, it wasfound that prenatal methylmercury exposure was associated with a decrease inlow frequency and high frequency powers and the coefficient of variation of theelectrocardiographic R-R interval.
Although the study subjects were healthy adults, an intervention study wasrecently conducted to examine effects of methylmercury on heart rate varia-bility;47 in the study, healthy adults ate meat of tuna and marline with a highconcentration of methylmercury at a dose of the tolerable weekly intakerecommended by the government of Japan. After 14 weeks of ingestion, heartrate variability was evaluated. Compared with the baseline data, increases in‘‘low frequency’’/‘‘high frequency’’ ratio and %‘‘low frequency’’ were observedafter fast Fourier transformation of collected electrocardiograms. This changewas not detected 15 weeks after stopping the ingestion.
Although details are varying among the reports above described, all theresults are involved with cardiovascular autonomic nervous functions. In thecase of fetal exposure, the changes in frequency have been long-lasting, whileadult exposure, the changes were temporary. Affected parameters were alsodifferent.
Mercury 133

5.6 Behavioral Teratology Studies of Methylmercury
5.6.1 Behavioral Teratology
Behavioral teratology is a field of science that examines postnatal effects ofprenatal exposure to any foreign agent, such as chemical substances andphysical stimulants. The concept of behavioral teratology was established byWerboff in the 1960s.48 Behavioral effects on the offspring of maternal ratsgiven tranquillizer during pregnancy were observed. ‘‘The behavior, functionaladaptation of offspring to its environment, is susceptible to teratogenic effectsof drugs’’ was described.
The concept of behavioral teratology was expanded so that effects ofprenatal exposure to environmental pollutants have been included. Spyker andher colleagues conducted the pioneering study on the postnatal effects ofprenatal methylmercury exposure. They revealed impaired swimming ability inoffspring mice exposed to methylmercury in utero.49 The offspring mice showedbehavioral changes in the open field test. It is important to note that theoffspring mice developed apparently normally until being examined under astressful environment, such as being immersed in a cold water or released in aopen space with bright light.
Spyker and colleagues defined ‘‘behavioral teratology’’ as the overlappingarea between behavioral toxicology and teratology. The cause of this abnor-mality occurs during pregnancy, and the effects become overt after birth andpersist over the lifetime of an individual.50
5.6.2 Postnatal Effects of Prenatal Exposure to Methylmercury
in Experimental Animals
A number of investigations on the postnatal effects of prenatal exposure tomethylmercury in experimental animals have been conducted (See reviews byShimai and Satoh, 1985,51 Watanabe and Satoh, 1996.52 and Satoh, 2003.)48 Asthe framework of behavioral teratology has been developing, postnatal effectshave been grouped into ‘‘eight Ds’’. Spyker originally showed that postnataleffects could be categorized into: ‘‘birth Defects, abnormal Development,behavioral Deviation, neurological Disorder, immunological Deficiency,generalized Debilitation, and premature Death.’’ These were known as the‘‘seven Ds’’ in behavioral teratology. Later, Tanimura added reproductiveDebility and emphasized birth Defects.48 Currently, eight Ds are accepted inbehavioral teratology.It was emphasized that each D appears in sequence as theindividual ages from neonate to senescence.
Findings reported from investigations include: reflexive behavior (such asrighting reflex and walking ability) in the neonatal period, ultrasonic vocal-ization during the lactational period, swimming ability, maze avoidance, andoperant learning at in adulthood.48 The doses administered are varying; insome experiments, the dose corresponded to LD50, but in the other experimentsmuch smaller doses were administered.51,52 The lowest dose to cause postnatal
134 Chapter 5

effects on operant learning was 0.008mgHg kg�1 body weight (of maternalrats), repeatedly administered during gestational days 6–9.
5.6.3 Effects of Fetal Methylmercury Exposure among Humans
Under General Environment
5.6.3.1 Risk Assessment by WHO
As mentioned previously, in the Iraqi outbreak, fetal cases were examinedclosely.53–55A group of mother and infant pairs were examined for the delay indevelopmental milestones such as walking and talking, and the mothers’ exposureto mercury. The mercury content of a hair strand of each mother was longi-tudinally analyzed to determine the peakmercury concentration during pregnancy.A dose–response relationship was established between the peak mercury concen-tration during pregnancy and whether first walking or talking was delayed.56
Based on this dose–response relationship, theWorld Health Organization (WHO)57
claimed that ‘‘A prudent interpretation of the Iraqi data implies that a 5% riskmay be associated with the peak mercury level of 10–20mgg�1 of maternal hair’’.
5.6.3.2 Fish (or Seafood) Eating Population
Since exposure levels among the fish eating population reach the abovementioned level, effects of fetal methylmercury exposure among this populationis of great concern. Thus epidemiological prospective studies with moresophisticated examination methods than simple observation of developmentalmilestones have been carried out since the mid 1980s.
5.6.3.3 New Zealand
In New Zealand, the development of children prenatally exposed to methyl-mercury via their mothers’ consumption of fish meals during pregnancy wasinvestigated.58,59 The children were tested at the age of four, using the DenverDevelopmental Screening Test (DDST), which encompasses four major functionsectors: gross motor, fine motor, language, and personal-social. The prevalenceof developmental delay was 52% in children whose mothers had been exposed tohigh levels of mercury, compared to 17% in the reference group.
In a follow-up study, at the age of 6, each child was tested using the Test ofLanguage Development, the Wechsler Intelligence Scale for Children, and theMcCarthy Scale of Children’s Abilities.59 Although high prenatal methylmercuryexposure decreased performance in these tests, it contributed little to the variationin test results, because ethnic background and social class showed greater influence.
5.6.3.4 The Seychelles
In the Seychelles Islands, the developmental effects of in utero methylmercuryexposure from consumption of marine fish by mothers have been studied (thepilot study).60 An association between in uteromethylmercury exposurewas found
Mercury 135

for when abnormal plus questionable scores were combined.61 Maternal hairmercury concentration during pregnancy was negatively associated with fourendpoints: The McCarthy General Cognitive Index, Perceptual Performancesubscale, Preschool Language Scale Total Language, and Auditory Compre-hension subscale. When statistically determined outliers and points considered tobe influential were removed from the analyses, statistical significance of theassociation remained only for Auditory Comprehension.
The main study, which was designed to be prospective and involved 779mother–child pairs, followed the above mentioned study.62 In this study,children were evaluated at 6.5, 19, 26, and 66 months of age. No associationbetween the maternal hair mercury level and the test results were found in thechildren tested at 6.5 months. No effects of mercury exposure were seen at 19months. Investigation at 66 months did not reveal the deviation typicallyassociated with prenatal methylmercury exposure for the following tests:McCarthy Scales of Children’s Abilities in General Cognitive Index, PreschoolLanguage Scale, Letter-Word Recognition of Woodcock- Johnson (W-J) Testsof Achievement, Applied Problems of W-J Tests of Achievement, BenderGestalt test, and Total T score from the Child Behavior Checklist. The analysiswas adjusted for possible confounding factors, including birth weight, the rankof birth, sex, medical records of the infants, age of the mother, alcoholconsumption and smoking habits during pregnancy, and socioeconomic status.
The overall conclusion of the studies in the Seychelles Islands is that it iscurrently unclear whether an association exists between low level prenatalmethylmercury exposure and neurologic deficits in the child.
The study in the Seychelles Islands was continued when the cohort subjectsreached 9 years old.63 Two of 21 endpoints were associated with prenatalmethylmercury exposure; one association involved diminished performance(grooved pegboard non-dominant hand in males only), and the other anenhancement (hyperactivity index of the Connors teacher rating scale). Theconclusion is, however, that both these outcomes are probably due to chance.
In a review of the studies in the Seychelles Islands,64 the authors concludedthat ‘‘Our primary analyses have so far identified only one adverse associationwith prenatal exposure’’. They also pointed out consideration of the potentialfor adverse effects of prenatal methylmercury exposure at maternal hair levelsabove 10–12 ppm, although the numbers of observations in that exposure rangeare limited. They planned continuing longitudinal data collection in theSeychelles Islands cohort to determine whether late effects of prenatal exposurewould appear. Evaluation at age 16 years has been conducted under thehypothesis that if prenatal exposure to low methylmercury concentrations (o12ppm in maternal hair) does incur adverse effects, they may be apparent only inhigher order cognitive functions that develop with maturity.
5.6.3.5 The Faroe Islands
Another large study has been conducted in the Faroe Islands since 1986.39
Increased methylmercury exposure was largely attributed to the eating of pilot
136 Chapter 5

whale.65 The subjects consisted of a group of approximately 1000 children.They were evaluated for their neurophysiological and neuropsychologicalperformances at 7 years of age. Mercury in maternal hair and cord blood wasanalyzed, and a subset of cords was analyzed for PCBs.39Although the neuro-physiological tests showed no indication of mercury-associated dysfunction,significant negative associations were observed in several neuropsychologicaltests. Even with inclusion of covariates with uncertain influence, multipleregression analysis indicated that 9 out of 20 measurements showed mercuryrelated decrements. The authors concluded that in utero exposure to methyl-mercury affects several domains of cerebral function.
At the age of 14 years, investigations were repeated. As described in Section5.5.1.3, a change in cardiovascular autonomic nervous functions was reported.
Brainstem auditory evoked potentials were measured. Latencies of brainstemresulted in an increase of around 0.012 ms in peaks II and V when the cordblood mercury concentration doubled.66 As seen at age 7 years, this effectappeared mainly within the I–III interpeak interval. Despite lower postnatalexposures, the child’s hair mercury level at age 14 years was associated withprolonged III–V interpeak latencies. The authors concluded that a change invulnerability to methylmercury toxicity is suggested by the apparent sensitivityof the peak III–V component to recent methylmercury exposure.
At age 14 years, indicators of prenatal methylmercury exposure weresignificantly associated with deficits in finger tapping speed, reaction time on acontinued performance task, and cued naming.67 Postnatal methylmercuryexposure had no discernible effect. An analysis of the test score differencebetween results at 7 and 14 years suggested that mercury-associated deficits hadnot changed between the two examinations. The authors concluded that theeffects of prenatal methylmercury exposure on brain function appear to bepermanent.
The results of these studies are controversial, especially when comparingthose of the Seychelles and Faroe Islands. In both studies, doses wereprincipally indicated by the mothers’ hair mercury concentration and thedifference between the dose in each case is small. The study designs and test-batteries were similar but not identical. The main difference between the twostudies was the source of methylmercury exposure, in the Seychelles byconsumption of ocean fish, and in the Faroe Islands, meat and blubber (fat) ofpilot whales. One possible explanation is that contamination by PCBs mayconfound the results of the Faroe island study.
5.6.3.6 Japan
A recent study simultaneously evaluated exposures to both methylmercury andPCBs and their early postnatal effects.41 In a total of 498 mother-neonate pairs,the total mercury level (median, 1.96 mg g�1) in maternal hair at parturitionand the PCB level (45.5 ng g�1 lipid) in cord blood were analyzed, and maternalseafood intake was estimated using a semi-quantitative food frequencyquestionnaire. The Neonatal Behavioral Assessment Scale examination
Mercury 137

was conducted 3 days after birth. A negative relationship between hair mercurylevel and motor cluster was observed, even after adjusting for PCBs, maternalseafood intake, and possible confounders. The PCB level was negativelycorrelated with the motor cluster, but this association was attenuated afteradjusting for mercury and the confounders. A positive association wasobserved between maternal seafood intake and the motor cluster whenconsidering the effects of mercury and PCBs. The authors concluded that thedata suggests prenatal exposure to methylmercury adversely affects neonatalneurobehavioral function; in contrast, maternal seafood intake appears to bebeneficial. The neurobehavioral effect of prenatal exposure to PCBs remainsunclear, perhaps because the concentration of PCBs is too low to producesubstantial effects.
It is considered that seafood intake appears to be beneficial, because fishconsumption during gestation can provide the fetus with long-chain poly-unsaturated fatty acids (LCPUFAs) and other nutrients essential for growthand development of the brain.68 However, fish consumption also brings aboutmethyl mercury exposure. In the Seychelles Child Development NutritionStudy, Psychomotor Developmental Index (PDI) of Bayley Scales of InfantDevelopment II at ages 9 months was positively associated with total omega-3LCPUFA and negatively associated with the ratio of omega-6/omega-3LCPUFA. These associations were stronger in models adjusted for prenatalmethylmercury exposure. There were significant adverse associations betweenprenatal methylmercury and the 30 month PDI when the LCPUFA measureswere included in the regression analysis. These data support the potentialimportance to child development of prenatal availability of omega-3 LCPUFApresent in fish. Furthermore, they indicate that the beneficial effects ofLCPUFA can obscure the determination of adverse effects of prenatalmethylmercury exposure in longitudinal observational studies.
5.7 Aging and Toxicity of Mercury
5.7.1 Minamata Disease Patients
Kinjo et al. (1993)69 surveyed 1144 Minamata Disease patients aged 40 or over,living in the Minamata area. Fetal Minamata Disease patients were notincluded. Together with the same number of neighbor(hood) controls matchedfor age and sex, they were investigated by questionnaire with regard tosubjective complaints and activities of daily living (ADL). It was found thatMinamata Disease patients had significantly higher response rates of all 18complaints than controls did. The odds ratio of weakness was highest at 29.0(19.4–43.9; 95% confidence interval). The odds ratios of difficulty of speaking,tremor, hypoesthesia, dysesthesia etc. were 10–20. These complaints wererelated to neurological signs and symptoms of Minamata Disease. The age-specific differences in prevalence of the complaints between Minamata Diseasepatients and the control group were large in younger (40–50 years) groups andrelatively small in older (70–80 years) groups. ADL analysis revealed that the
138 Chapter 5

difference in the ADL disability between Minamata Disease patients andcontrols significantly increased with age and that ADL disability in MinamataDisease patients was aggravated by aging.
The conclusion was different to that of Liu et al., mentioned previously(section 5.5.1.2). It is noteworthy that the subjects of the study by Liu et al. wasfetal Minamata Disease patients with the average age of approximately 45 yearsold and the range of the subject age was narrow. Their age might not be greatenough for aggravate ADL.
5.7.2 Residual or Remote Effects Among Workers Exposed to
Mercury Vapor
5.7.2.1 Mercury Miners
Residual effects due to previous exposure to mercury vapor have become aconcern. Among ex-mercury miners in Japan, neurobehavioral disordersrelated to previous exposure that ceased more than 17 years ago have beenreported.70
Neurobehavioral tests were carried out on ex-mercury miners around18 years after the end of mercury exposure. Seventy-six male ex-mercuryminers who had been exposed to high concentrations of mercury vapor (over1.0mgm�3) and with a history of mercury intoxication were compared withcontrols matched for age (within 3 years), sex, and education. The extent of thesymptoms, caused by mercury poisoning (erethismus merculialis) decreasedconsiderably after the end of exposure. But matched paired comparison showedsignificantly deteriorated performances of motor coordination, simple reactiontime, and short term memory in the exposed group. The duration of exposurecorrelated with poorer performance in hand-eye coordination, tapping, and acolor card reading test. Those in job categories classified as having exposure tomercury also exhibited deteriorated performances. The length of time (years)after the end of exposure had a significant correlation with better performanceof reaction time and digit span. On the other hand, the history of intoxicationitself had no significant association with any of the current neurobehavioralperformances. In multiple linear regression analysis, the interaction term ofage� history of mercury intoxication showed a significant correlation withdeteriorating performance of hand eye coordination (aiming), pegboard, andblock design test. The subjects 65 years of age and older showed a largerdifferences between those with histories of mercury poisoning and controlsubjects than younger age groups.
5.7.2.2 Mercury Workers
To identify potential exposure-related neurological abnormalities in workers,aged 20 to 35 years, previously exposed to mercury vapor, workers completedoccupational and medical questionnaires, with the assistance of a trainedinterviewer, and underwent neurological examination.71 They were exposed to
Mercury 139

mercury vapor in the production of the isotope lithium-6. Few significantdifferences existed between exposed (n¼ 247) and unexposed (n¼ 255) subjects.However, multiple linear regression analysis demonstrated several significantcorrelations between declining neurological function and increasing exposureas determined by urine mercury measurements. Subjects who showed urinemercury peak levels above 0.6mgL�1 during the work that involved exposuredemonstrated significantly decreased strength, decreased coordination, increasedtremor, decreased sensation, and increased prevalence of Babinski and snoutreflexes when compared with those with mercury levels below 0.6mgL�1.Although exposure was not age dependent, several neurological measuresshowed significant age–mercury level interaction. Subjects 70 years of age andolder demonstrated the most significant differences in several neurologicalimpairments between high- and low-exposure, compared to control subjects.
5.7.2.3 Aging and Mercury Vapor Exposure
These results suggest that there are slight but persistent effects on neuro-behavioral function, especially motor coordination, among mercury miners,even more than 20 years after the end of exposure. At the same time age xexposure interaction was also observed, although it is not known whether themercury exposure accelerated aging or the natural neuronal attrition unmaskedprior exposure-related subclinical abnormalities.
5.7.3 Age-Related Increase in Auditory Impairment
Age-related increase in auditory impairment in monkeys exposed in utero andpostnatally to methylmercury has been reported.72 Monkeys (Macacafascicularis) were exposed, throughout gestation and postnatally until 4 years ofage, to 0, 10, 25, or 50 mg kg�1 per day mercury as methylmercuric chloride.Pure-tone detection thresholds were determined when the subjects were 11 and19 years of age. At 19 years of age, all five methylmercury-exposed monkeysexhibited elevated pure-tone thresholds compared with controls. Impairmentwas generally observed across the full range of frequencies. Comparisons ofperformance at 11 and 19 years revealed relatively greater deterioration infunction in the treated monkeys compared with the control monkeys. Althoughthese results provide evidence for acceleration of impairment of auditoryfunction during aging as a consequence of developmental methylmercuryexposure, it is not clear from this experiment whether in utero or postnatalexposure has a greater effect on the acceleration of impairment.
5.8 Effects of Mercury Vapor Exposure During the
Perinatal Period
Compared with methylmercury, studies concerning effects of mercury vaporexposure during the prenatal period have been extremely scarce in both human
140 Chapter 5

cases and animal experiments.73 Since little mercury is transfered to the fetusvia the placenta after maternal exposure to mercury vapor, it is plausible thatfetuses should not been readily affected. But recently, postnatal behavioraleffects have been reported. Furthermore, effects of coexposure to mercuryvapor and methylmercury during gestation have been investigated.
5.8.1 Effects of Prenatal Mercury Vapor Exposure
Danielsson et al. (1993)74 reported the effects of inhalation of metallic mercuryvapor (Hg0)— approximately at 1.8mgm�3 for 1 or 3 hours during days 11–14and 17–20 of gestation—on pregnant rats. The developmental and behavioraleffects on the offspring were studied. Maturation milestones, such as surfacerighting, negative geotaxis, pinna unfolding, and tooth eruption, revealed nodifferences between Hg0-treated offspring and controls. Spontaneous motoractivity showed that the Hg0-treated offspring were hypoactive at 3 months ofage but hyperactive at 14 months. The exposed offspring showed retardedacquisition in the radial arm maze but no differences in the circular swim maze.A simple test of habituation to a novel environment (habituation ratios werecalculated as the quotient of the second 30-min period to the first 30-min periodfor locomotion, rearing, rearing time, and total activity parameters) indicated,for the exposed offspring, a reduced ability to adapt. Mercury concentration inthe brains of offspring exposed for 1 or 3 hours was 0.005 or 0.012mgHgkg�1
respectively at day 2–3 postpartum. Whereas in non-exposed offspring,0.001mgHgkg�1 was reported.
Since sample collection was carried out after the cessation of exposure,and the brain, in terms of weight, rapidly develops, it is expected thatmercury concentration might decrease drastically. But considerably lowconcentrations of mercury in the brain of fetuses could cause postnatalbehavioral changes.
Behavioral consequences of in utero exposure to mercury vapor were studiedin the offspring of pregnant squirrel monkeys exposed to 0.5 or 1.0mgm�3 ofmercury vapor during the last 2–3 month of gestation or later.75 The estimatedcumulative doses were 1304 to 4305 mg. The monkeys’ lever pressing wasmaintained under various Concurrent Random-Interval Random-Intervalschedules of reinforcement. No difference in sensitivity to reinforcer ratios wasidentified in the steady state, but there was much more variability in the steady-state performance of exposed monkeys, as indicated by the standard deviationof the regression, than in controls. Exposed monkeys were found to producesmaller or slower transitions than controls. One monkey’s exposure beganduring the third week of gestation (earlier than any of the others), and thebehavior of this monkey was so erratic that some of the analyses could not beaccomplished. No data on mercury concentration in the brain was available.
Evaluation of sensory evoked potentials in Long Evans rats gestationallyexposed to 4mgm�3 mercury vapor revealed no changes in responses evokedfrom peripheral nerves, or the somatosensory, auditory, or visual modalities(Herr et al., 2004).76 Dams were placed in cylindrical holding tubes during
Mercury 141

nose-only exposure to either conditioned air or 4mgm�3 mercury vapor for2 h/day for 10 consecutive days from gestational day (GD) 6 through to GD15.No data on mercury concentration in the offspring’s brains was available in thisreport. A previous report employing the same exposure protocol describedmercury concentration in the fetal brain.77 The mercury concentration in thefetal brain on GD15 was 49� 5 ng g�1, while in the maternal brain wasapproximately 7 mg g�1 (by visual inspection of the figure). The observedmaternal toxicity was decrease of body weight gain during late pregnancy atthis dose.
Yoshida et al. (2005)78 compared postnatal neurobehavioral toxicity ofprenatal mercury vapor exposure between metallothionein-null (MT-null) andwild-type mice. Pregnant mice of both strains were repeatedly exposed at0.50mgm�3 for 6 h/day until GD18. Locomotor activity in the open field,learning ability in the passive avoidance response, and spatial learning ability inthe Morris water maze were evaluated at 12 weeks of age. The exposed MT-nullmice showed a significant decrease in total locomotor activity in males, and alearning disability in the passive avoidance response and a retarded acquisitionin the Morris water maze in females, as compared with non-exposed controls.In contrast, the exposed wild-type mice did not differ from controls in the threebehavioral measurements. The results indicate that MT-null mice were moresusceptible than wild-type mice to the behavioral neurotoxicity of prenatalmercury exposure. Mercury concentrations in the brains of both strains wereslightly higher (8–11 ng g�1) in the exposed group than in the control group(5–7 ng g�1) 12 weeks after the cessation of the exposure. Lack of MT in thebrain may increase vulnerability to mercury vapor exposure.
5.8.2 Effects of Neonatal Mercury Vapor Exposure
Fredriksson et al. (1992)79 examined the effect of neonatal exposure of rats tomercury vapor, at the concentration of 0.05mgm�3 for 1 h (low dose) or 4 h(high dose), on their behavior in adulthood. Exposure occurred on days 11–17(the period of rapid brain growth). Tests for spontaneous motor activity wereperformed at the ages of 2 and 4 months. Rats exposed to the high dosemercury vapor showed a marked increase in locomotion and total activity but adecrease for rearing when tested at 2 months of age. At 4 months of age, theserats showed a marked hypoactivity with respect to all 3 variables. Rats exposedto the low dose showed no significant differences at 2 months compared tocontrols. However, at the age of 4 months, increase in locomotion and totalactivity, but a decrease for rearing, already observed at 2 months in the highdose group, was observed. In the radial arm maze and circular swim maze,neonatally exposed pups showed a retarded acquisition to the radial armmaze,while therewas nodifference compared to controls in the circular swimmaze.These data indicate that neonatal exposure to mercury vapor results in similarbehavior changes to those reported in offspring prenatally exposed to mercuryvapor or methylmercury. Brain mercury concentrations were reported as 0.017
142 Chapter 5

and 0.063mgkg�1 for the low and high dose group respectively, at 25 days of age.Whereas in the non-exposed control group, 0.002mg kg�1 was reported.
5.8.3 Effects of Coexposure to Mercury Vapor and
Methylmercury During Gestation
The predominant species of mercury exposure among the general population ismethylmercury from consumption of fish and seafood. In addition, mercuryvapor generated from dental amalgam is also considered to be a significantsource in the countries where the mercury amalgam is still in use. Therefore,animal studies to simulate coexposure to methylmercury and mercury vaporhave been conducted.
Fredriksson et al. (1996)80 conducted the following experiment: Pregnantrats were 1) administered methylmercury (MeHg) by gavage (2mg kg�1 per dayduring GDs 6–9; 2) exposed by inhalation to mercury vapor (Hg0, 1.8mgm�3
in air for 1.5 h per day) during GDs 14–19; and 3) exposed to both MeHg bygavage and mercury vapor by inhalation (MeHgþHg0); or 4) were givencombined vehicle administration for each of the two treatments (control).Clinical observations and developmental markers up to weaning showed nodifferences among any of the groups. Behavioral function was examinedbetween 4 and 5 months of age and included spontaneous motor activity,spatial learning in a circular bath, and instrumental maze learning for foodreward. Offspring of dams exposed to Hg0 showed hyperactivity in the motoractivity test chambers over all three parameters: locomotion, rearing, and totalactivity; this effect was potentiated in the animals of the MeHgþHg0 group. Inthe swim maze test, the MeHgþHg0 and Hg0 groups evidenced longer latenciesbefore reaching a submerged platform compared to either the control or MeHggroups. In the modified, enclosed radial arm maze, both the MeHgþHg0 andHg0 groups showed longer latencies and made more errors in acquiring all eightpellets. The results indicate that prenatal exposure to Hg0 causes alterations toboth spontaneous and learned behaviors, suggesting some deficit in adaptivefunctions. Coexposure to MeHg, which by itself did not alter these functionsat the dose given in this study, served to significantly aggravate the changes.The mercury concentration in the brain of offspring 2–3 days post parturitionwas 4, 5, and 12 ng g�1 for MeHg, Hg0 and MeHgþHg0 respectively.
More recently, mercury vapor of a much lower concentration was applied ina coexposure experiment. Yoshida et al. (2011)81 exposed pregnant mice to Hg0
at a mean concentration of 0.030mgm�3 for 6 h/day during gestation period.The methylmercury was supplied with food containing 5 ppm of MeHg fromGD1 to postnatal day 10. The coexposure group was exposed to both Hg0
vapor and MeHg, according to the procedure described. The offspring reachedthe age of 8 weeks and then underwent behavioral analyses. Open field testsshowed an increase and decrease in voluntary activity in male and female micerespectively in the MeHg exposure group. The results of open field test in theHg0þMeHg exposure group were similar to those in the MeHg exposure
Mercury 143

group in both males and females. The results in the Hg0 exposure group did notsignificantly differ from those in the control group. Passive avoidance testsrevealed no significant differences in avoidance latency in the retention trialbetween the Hg0, MeHg, or Hg0þMeHg exposure group and the controlgroup in males or females. Morris water maze tests showed a delay to reach theplatform in the MeHg and Hg0þMeHg exposure groups compared with thecontrol group in males but no significant differences between the Hg0, MeHg,or Hg0þMeHg exposure group and the control group in females.
Apparently, effects of mercury vapor exposure were not observed due to thelow concentration. The brain mercury concentration at 10 days postpartumwas 3.0� 0.3, 340� 91, and 652� 33 ng g�1 for the male Hg0, MeHg, andMeHgþHg0 group respectively, and 3.2� 0.6, 380� 89, and 341� 69 ng g�1
for the female Hg0, MeHg or MeHgþHg0 group respectively. The controlgroup showed 1.7� 0.4 or 2.1� 0.4 ng g�1 for males and females respectively.Although the exposure to mercury vapor ceased at parturition, and theexposure to methylmercury continued until 10 days after birth, the difference inconcentrations between the two species of mercury is two orders of magnitude.Mercury concentration in the brain of offspring with mercury vapor exposurewas similar to that of the control group.
Animal experiments to elucidate the toxicokinetics of mercury after prenatalmercury vapor exposure support the fact described previously (low concen-tration of mercury in the offspring’s brain).
Morgan et al. (2006)82 exposed pregnant rats to 1, 2, or 4mgHg0m�3 or air(controls) for 2 h/day from GD6 through to GD15. On the day of birth, thebrain mercury concentration, by visual inspection of the figure, wasapproximately 20, 10, 8, and 1 ng g�1 in the groups of 4, 2, and1mgHg0m�3,and air, respectively. The concentration decreased from postnatal day 1 topostnatal day14; thereafter the decrease was slow. The amount of mercury inthe whole brain however, was rather stable between birth and weaning, indi-cating no elimination of mercury. After weaning, the amount of mercury in thebrain of the control group abruptly increased to the levels of the mercury vaporexposure group. This elevation was attributed to consumption of a dietcontaining trace levels of mercury.
Female Long Evans hooded rats were exposed to methylmercury (0, 3, 6, or9 ppm as a drinking solution), mercury vapor (0, 300, or 1,000 mgm�3 for2 h/day), or a combination of these, from 30 days before breeding through toGD18.83 On postnatal day 4, organic and inorganic mercury concentrationsin the offspring brain were analyzed by cold vapor atomic absorptionspectrometry. Statistical analysis using linear mixed effects models showedthat dose was the primary determinant of both organic and inorganic brainmercury levels. Mercury concentration in the offspring brains was 20–30 ng g�1
for non-exposed controls and 30–50 ng g�1 for the 300 or 1000 mgm�3
exposed group.These data indicate that after prenatal mercury vapor exposure, the brain
mercury concentration increase by up to tens of ng g�1 at most. Oneexperiment76 described corresponding maternal brain mercury concentration
144 Chapter 5

of 7 mg g�1. Therefore, it is concluded that a small amount of mercury istransfered to the fetal brain after prenatal mercury vapor exposure. It issurprising that behavioral effects were observed in the animal with such a lowconcentration of mercury in the brain.
On the contrary, methylmercury exposure employed in animal experimentsto date has caused substantial elevation of offspring brain mercury concen-tration (of the order of mg g�1), with the exception of the study by Fredrikssonet al. (1996).80 In their experiment, methylmercury was given by gavage duringGDs 6–9, and the brain was sampled for chemical analysis at 2–3 days afterbirth. Therefore, elimination of methylmercury from the brain and dilution ofmethylmercury concentration due to rapid growth in brain volume during lategestational and early postnatal periods possibly lowered mercury concentrationin the offspring’s brain. It is surprising however, in the experiment byFredriksson et al. (1996),80 that the brain mercury concentration after prenatalmethylmercury exposure showed extremely low mercury concentration, such as4 or 12 ng g�1 for MeHg and MeHg þ Hg0, respectively. This needs to beconfirmed.
5.9 Conclusions
5.9.1 Prenatal Methylmercury Exposure in Humans
It is evident that prenatal mercury exposure causes postnatal neurobehavioraleffects in offspring. Human cases have been typically represented by fetalMinamata Disease patients. They developed neurological disorders after birthand the disorders have persisted until today, at their middle age. Observationsof their ADL over a 15 year period did not reveal exacerbation among fetalMinamata Disease patients. Minamata Disease patients with adult exposurehowever, showed that the difference in ADL disability between MinamataDisease patients and controls significantly increased with age and that ADLdisability in Minamata Disease patients was aggravated by aging. It should beconsidered that the ages of the two populations are different; fetal MinamataDisease patients were at middle age when studied, but the adult MinamataDisease patients were middle aged to elderly.
Cardiac autonomic nervous function was affected by methylmercuryexposure, during both fetal and adult periods. It seems that this consequencehas been permanent for fetal exposure, whereas the effect caused by exposure inadulthood was temporary. It is plausible that perturbation during fetal (and/orearly postnatal) development may result in permanent (or long lasting at least)changes, indicating vulnerability of fetuses.
5.9.2 Prenatal Methylmercury Exposure in Animal Experiments
In animal experiments studies, neurobehavioral effects of fetal methylmercuryexposure have been reported in mice, rats, and non-human primates. Maternal
Mercury 145

animals were not affected by methylmercury exposure; it is considered that fetalanimals are much more sensitive than maternal animals. It is also evident thatneurobehavioral effects are still observed after substantial time has passed,indicating long-lasting effects of prenatal exposure.
It is, however, not known whether prenatal exposure to methylmercuryresults in acceleration of aging. One experiment employing monkeys onlyshowed age-related increase in auditory impairment.
5.9.3 Mercury Vapor Exposure and Aging in Exposed Miners
and Workers
Mercury miners who experienced mercury poisoning 18 years previouslyexhibited deteriorated performances of motor coordination, simple reactiontime, and short term memory compared with age matched controls. Moreover,subjects 65 years of age and older showed larger differences between those withhistories of mercury poisoning and control subjects than did the younger agegroups. Among the workers who were exposed to mercury vapor in plants 20 to35 years previously, subjects 70 years of age and older demonstrated the mostsignificant differences in several neurological impairments between high- (peakurinary mercury concentration 40.6mgL�1) and low-exposure or controlsubjects. From these results, effects of mercury vapor exposure persists for along time, and previous exposure substantially exacerbates neurobehavioralperformance in the elderly, though such exacerbation was not obvious inyounger age. Therefore, it is possible that mercury vapor exposureaccelerates aging.
5.9.4 Prenatal Mercury Vapor Exposure in Animal Experiments
Not only methylmercury, but also mercury vapor exposures resulted inpostnatal effects without overt toxic signs and symptoms in either maternal oroffspring animals. The postnatal neurobehavioral changes last for a long time(months or years, depending on the life span of the animals).
Of interest is the concentration of mercury in the brain of fetuses or offspringthat causes such neurobehavioral changes. In the case of methylmercuryexposure, concentration of the order of mg g�1 in the brain was reported fromanimal experiments. In contrast, the concentration was tens of ng g�1 or ng g�1,smaller by 2 or 3 orders of the magnitude, of methylmercury. Since in theseexperiments the offspring brain was sampled after parturition on various days,depending on each experimental protocol, the peak concentration could not bedetected. Only one toxicokinetic study77 revealed mercury concentration infetal brain samples collected on the same day of the last exposure. Theconcentration was 49� 5 ng g�1 after 10 consecutive exposures from GD6 toGD15 at 4mgHgm�3 for 2 h/day. Maternal brain mercury concentration wasapproximately 7mg g�1 on GD15. Therefore, it is not likely that mercury
146 Chapter 5

concentration in fetal brain is elevated drastically by maternal mercuryexposure to mercury vapor.
It is surprising that such low concentrations of mercury from mercuryvapor exposures during gestation or neonatal period, presumably in themercuric form in the brain after oxidation in the tissue, cause neurobehavioralchanges. Is mercuric mercury derived from mercury vapor so toxic to fetal orneonatal brain tissue? Or does mercury vapor exposure have an unknownaction that causes a disturbance in brain development? It is also possible thatthe toxic species of mercury is not methylmercury but inorganic mercuryderived from decomposition of methylmercury. This hypothesis should beexamined.
References
1. M. Berlin, R. K. Zalups and B. A. Fowler in Handbook on the Toxicologyof Metals, 3rd edition, eds. G. Nordberg, B. A. Fowler, M. Nordberg andL. Friberg, Academic Press, Inc., 2007, pp. 675–729.
2. M. Berlin, J. Fazackerley and G. Nordberg, Arch. Environ. Health, 1969,18, 719.
3. J. B. Hursh, T. W. Clarkson, E. F. Miles and L. A. Goldsmith, Arch.Environ. Health, 1989, 44, 120.
4. T. W. Clarkson, J. Gatzy and C. Dalton in Atomic Energy CommissionResearch and Development Report UR-582, 1961.
5. S. Halbach and T. W. Clarkson, Biochimica et biophysica acta, 1978,523, 522.
6. M. Berlin, L. G. Jerksell and H. von Ubisch, Arch. Environ. Health, 1966,12, 33.
7. T. W. Clarkson, L. Magos and M. R. Greenwood, Biol. Neonate, 1972,21, 239.
8. M. Yoshida, Y. Yamamura and H. Satoh, Arch. Toxicol., 1986, 58, 225.9. T. Clarkson and A. Rothstein, Health Physics, 1964, 10, 1115.
10. J. B. Hursh, M. G. Cherian, T. W. Clarkson, J. J. Vostal and R. V. Mallie,Arch. Environ. Health, 1976, 31, 302.
11. L. Kosta, A. R. Byrne and V. Zelenko, Nature, 1975, 254, 238.12. L. C. Rossi, G. F. Clemente and G. Santaron, Arch. Environ. Health, 1976,
31, 160.13. R. Garnier, J. M. Fuster, F. Conso, B. Dautzenberg, C. Sors and
E. Fournier, Toxicol. Eur. Res., 1981, 3, 77.14. L. Friberg and G. F. Nordberg in Mercury in the Environment, eds.
L. Friberg and J. Vostal, CRC Press, Boca Raton, 1972, pp. 113–139.15. S. Langworth, C. G. Elinder, K. G. Sundquist and O. Vesterberg, Br. J.
Ind. Med., 1992, 49, 394.16. J. K. Miettinen in Mercury, Mercurials and Mercaptans, eds. M. W. Miller
and T. W. Clarkson, Charles C Thomas, Springfield, 1973, pp. 233–243.
Mercury 147

17. K. Kostial, D. Kello, S. Jugo, I. Rabar and T. Maljkovic, Environ. HealthPerspect., 1978, 25, 81.
18. L. Friberg, E. Skog and J. E. Wahlberg,Acta Derm.-Venereol., 1961, 41, 40.19. H. Satoh, T. Suzuki, T. Nobunaga, A. Naganuma and N. Imura,
J. Pharmacobio-Dyn., 1981, 4, 191.20. A. Shimada, E. Yamamoto, T. Morita, M. Yoshida, J. S. Suzuki, M. Satoh
and C. Tohyama, Toxicol. Pathol., 2004, 32, 519.21. H. Satoh and T. Suzuki, Arch. Toxicol., 1979, 42, 275.22. Y. Sugata and T. W. Clarkson, Biochem. Pharmacol., 1979, 28, 3474.23. J. D. Dunn, T. W. Clarkson and L. Magos, Science, 1981, 213, 1123.24. J. R. Wands, S. W. Weiss, J. H. Yardley and W. C. Maddrey, Am. J.Med.,
1974, 57, 92.25. D. Hunter, The Diseases of Occupations, The English Universities Press
Ltd., London, 1962.26. D. W. Nierenberg, R. E. Nordgren, M. B. Chang, R. W. Siegler,
M. B. Blayney, F. Hochberg, T. Y. Toribara, E. Cernichiari andT. Clarkson, New Engl. J. Med., 1998, 338, 1672.
27. T. Suzuki and K. Yoshino, Ind. Med. J., 1969, 11, 21.28. M. Aschner, Pharmacol. Toxicol., 1989, 65, 17.29. Y. Kajiwara, A. Yasutake, T. Adachi and K. Hirayama, Arch. Toxicol.,
1996, 70, 310.30. B. Aberg, L. Ekman, R. Falk, U. Greitz, G. Persson and J. O. Snihs, Arch.
Environ. Health, 1969, 19, 478.31. J. H. Koeman, W. H. Peeters, C. H. Koudstaal-Hol, P. S. Tjioe and J. J. de
Goei, Nature, 1973, 245, 385.32. I. R. Rowland, R. D. Robinson and R. A. Doherty, Arch. Environ. Health,
1984, 39, 401.33. F. Bakir, S. F. Damluji, L. Amin-Zaki, M. Murtadha, A. Khalidi,
N. Y. al-Rawi, S. Tikriti, H. I. Dahahir, T. W. Clarkson, J. C. Smith andR. A. Doherty, Science, 1973, 181, 230.
34. M. Shimada, K. Nakai, N. Tatsuta, K. Yaginuma, N. Kurokawa, H. Satohand H. Akagi, Nihon eiseigaku zasshi (Japanese journal of hygiene), 2011,60, 404.
35. T. Suzuki, T. Miyama and H. Katsunuma, Ind. Health, 1970, 8, 39.36. K. Yaginuma-Sakurai, K. Murata, M. Iwai-Shimada, K. Nakai,
N. Kurokawa, N. Tatsuta and H. Satoh, J.Toxicol. Sci., 2012, 37, 123.37. H. Al-Shahristani, K. Shihab and I. K. Al-Haddad, Bull. W.H.O., 1976,
53(Suppl, 105).38. D. Marsh, G. Myers, T. Clarkson, L. Amin-Zaki, S. Tikriti and
M. Majeed, Annal. Neurol., 1980, 7, 348.39. P. Grandjean, P. Weihe, R. F. White, F. Debes, S. Arak, K. Yokoyama,
K. Murata, N. Sorensen, I. R. Dah and P. J. Jorgensen, Neurotox. Teratol.,1997, 19, 417.
40. E.Oken,R.O.Wright,K.P.Kleinman,D.Bellinger,C. J.Amarasiriwardena,H. Hu, J. W. Rich-Edwards and M. W. Gillman, Environ. Health Perspect.,2005, 113, 1376.
148 Chapter 5

41. K. Suzuki, K. Nakai, T. Sugawara, T. Nakamura, T. Ohba, M. Shimada,T. Hosokawa, K. Okamura, T. Sakai, N. Kurokawa, K. Murata, C. Satohand H. Satoh, Environ. Res., 2010, 110, 699.
42. D. A. Spyker and J. M. Spyker, Toxicol. Appl. Pharmacol., 1977, 40, 511.43. M. Harada, Crit.Rev.Toxicol., 1995, 25, 1.44. R. Doi, Nihon Koshu Eisei Zasshi, 2002, 49, 73.45. X. J. Liu, M. Sakamoto, T. Kato, M. Okamoto and K. Arimura, Nihon
eiseigaku zasshi (Japanese journal of hygiene), 2007, 62, 905.46. T. Oka, M. Matsukura, M. Okamoto, N. Harada, T. Kitano, T. Miike and
M. Futatsuka, Tohoku J. Exp. Med., 2002, 8, 15.47. K. Yaginuma-Sakurai, K. Murata, M. Shimada, K. Nakai, N. Kurokawa,
S. Kameo and H. Satoh, Neurotoxicol.Teratol., 2010, 32, 240.48. H. Satoh, Tohoku J. Exp. Med., 2003, 201, 1.49. J. M. Spyker, S. B. Sparber and A. M. Goldberg, Science, 1972, 177, 621.50. B. Weiss and J. M. Spyker, Pediatrics, 1974, 53, 851.51. S. Shimai and H. Satoh, J. Toxicol. Sci., 1985, 10, 199.52. C. Watanabe and H. Satoh, Environ. Health Perspect., 1996, 104(Suppl.
2), 367.53. L. Amin-Zaki, M. A. Majeed, T. W. Clarkson and M. R. Greenwood, Br.
Med. J., 1978, 1, 613.54. L. Amin-Zaki, M. A. Majeed, M. R. Greenwood, S. B. Elhassani,
T. W. Clarkson and R. A. Doherty, J. Appl. Toxicol., 1981, 1, 210.55. C. Cox, D. Marsh, G. Myers and T. Clarkson, Neurotoxicology, 1995,
16, 727.56. C. Cox, T. W. Clarkson, D. O. Marsh, L. Amin-Zaki, S. Tikriti and
G. J. Myers, Environ. Res., 1989, 49, 318.57. WHO in Environmental health criteria 101, Methylmercury, World Health
Organization, Geneva, 1990, pp. 11–17.58. T. Kjellstrom, P. Kennedy, S. Wallis and C. Mantell, Report 3080,
National Swedish Environmental Protection Board Solna, Sweden, 1986.59. T. Kjellstrom, P. Kennedy, S. Wallis and C. Mantell, Report 3642,
National Swedish Environmental Protection Board Solna, Sweden, 1989.60. D. Marsh, T. Clarkson, G. Myers, P. Davidson, C. Cox, E. Cernichiari,
M. Tanner, W. Lednar, C. Shamlaye, O. Choisy, C. Hoareau andM. Berlin, Neurotoxicology, 1995, 16, 583.
61. G. Myers, P. Davidson, C. Cox, C. Shamlaye, M. Tanner, O. Choisy,J. Sloane-Reeves, D. Marsh, E. Cernichiari, A. Choi, M. Berlin andT. Clarkson, Neurotoxicology, 1995, 16, 639.
62. G. Myers, D. Marsh, P. Davidson, C. Cox, C. Shamlaye, M. Tanner,A. Choi, E. Cernichiari, O. Choisy and T. Clarkson, Neurotoxicology,1995, 16, 653.
63. G. J. Myers, P. W. Davidson, C. Cox, C. F. Shamlaye, D. Palumbo,E. Cernichiari, J. Sloane-Reeves, G. E. Wilding, J. Kost, L.-S. Huang andT. W. Clarkson, Lancet, 2003, 361, 1686.
64. P. W. Davidson, G. J. Myers, B. Weiss, C. F. Shamlaye and C. Cox,Neurotoxicology, 2006, 27, 1106.
Mercury 149

65. P. Grandjean, P. Weihe, P. Jorgensen, T. Clarkson, E. Cernichiari andT. Videro, Arch. Environ. Health, 1992, 47, 185.
66. K. Murata, P. Weihe, E. Budtz-Jorgensen, P. J. Jorgensen andP. Grandjean, J. Pediatr., 2004, 144, 177.
67. F. Debes, E. Budtz-Jorgensen, P. Weihe, R. F. White and P. Grandjean,Neurotoxicol, Teratol., 2006, 28, 363.
68. J. J. Strain, P. W. Davidson, M. P. Bonham, E. M. Duffy, A. Stokes-Riner,S. W. Thurston, J. M. W. Wallace, P. J. Robson, C. F. Shamlaye,L. A. Georger, J. Sloane-Reeves, E. Cernichiari, R. L. Canfield, C. Cox,L. S. Huang, J. Janciuras, G. J. Myers and T. W. Clarkson, Neuro-toxicology, 2008, 29, 776.
69. Y. Kinjo, H. Higashi, A. Nakano, M. Sakamoto and R. Sakai, Environ.Res., 1993, 63, 241.
70. R. Kishi, R. Doi, Y. Fukuchi, H. Satoh, T. Satoh, A. Ono, F. Moriwaka,K. Tashiro, N. Takahata, H. Sasatani, H. Shirakashi, T. Kamada andK. Nakagawa, Occup. Environ. Med., 1994, 51, 35.
71. J. Albers, L. Kallenbach, L. Fine, G. Langolf, R. Wolfe, P. Donofrio,A. Alessi, K. Stolp-Smith and M. Bromberg, Annal. Neurol., 1988, 24, 651.
72. D. C. Rice, Toxicol. Sci., 1998, 44, 191.73. M. Yoshida, Tohoku J. Exp. Med., 2002, 196, 79.74. B. R. Danielsson, A. Fredriksson, L. Dahlgren, A. T. Gardlund, L. Olsson,
L. Dencker and T. Archer, Neurotoxicol. Teratol., 1993, 15, 391.75. M. C. Newland, K. Warfvinge and M. Berlin, Toxicol. Appl. Pharmacol.,
1996, 139, 374.76. D. W. Herr, S. M. Chanda, J. E. Graff, S. S. Barone, R. P. Beliles and
D. L. Morgan, Toxicol. Sci., 2004, 82, 193.77. D. L. Morgan, S. M. Chanda, H. C. Price, R. Fernando, J. Liu,
E. Brambila, R. W. O’Connor, R. P. Beliles and S. Barone, Toxicol. Sci.,2002, 66, 261.
78. M. Yoshida, C. Watanabe, K. Horie, M. Satoh, M. Sawada andA. Shimada, Toxicol. Lett., 2005, 155, 361.
79. A. Fredriksson, L. Dahlgren, B. Danielsson, P. Eriksson, L. Dencker andT. Archer, Toxicology, 1992, 74, 151.
80. A. Fredriksson, L. Dencker, T. Archer and B. R. Danielsson, Neurotoxicol.Teratatol., 1996, 18, 129.
81. M. Yoshida, M. Suzuki, M. Satoh, A. Yasutake and C. Watanabe,J. Toxicol. Sci., 2011, 36, 73.
82. D. L. Morgan, H. C. Price, R. Fernando, S. M. Chanda, R. W. O’Connor,S. S. Barone, D. W. Herr and R. P. Beliles, Environ. Health Perspect., 2006,114, 735.
83. H. Ishitobi, S. Stern, S. W. Thurston, G. Zareba, M. Langdon, R. Geleinand B. Weiss, Environ. Health Perspect., 2010, 118, 242.
150 Chapter 5

CHAPTER 6
Manganese
ROBERTO G LUCCHINI,a DONALD R. SMITHb ANDRONALD B TJALKENSc
aDepartment of Preventive Medicine, Mount Sinai School of Medicine, NewYork, NY 10029 and Occupational Medicine, University of Brescia, Italy;bDepartment of Microbiology and Environmental Toxicology, University ofCalifornia, Santa Cruz, CA 95064, USA; cDepartment of Environmentaland Radiological Health Sciences, Colorado State University, Fort Collins,CO 80523, USA*E-mail: [email protected]
6.1 Introduction
It is clear that the aged are at greater risk of and more susceptible to thedeleterious effects from exposure to environmental agents compared to youngeradults.60,13 Moreover, there is emerging evidence that early life exposure toenvironmental agents increases risk of neurologic disease and toxicity late inlife.18,71 In particular, there is clear evidence of health impacts of occupationaland environmental manganese (Mn) exposure in adults, with implications inthe elderly,31,95,106 and evidence from animal studies that exposure tomanganese during early life stages may contribute to disease risk later inlife.87,123 These studies build upon evidence linking transition metaldyshomeostasis and the accumulation of transition metals, most notablyiron, in brain regions most commonly affected in neurodegenerativediseases.12,31,81,96 Notably, the well-described interactions between manganeseand cellular iron regulation and dyshomeostasis,35,92,139,168,169 suggest thatmanganese may contribute to neurological dysfunction in the aged via multiple
Issues in Toxicology No. 16
Aging and Vulnerability to Environmental Chemicals: Age-related Disorders and their Origins in
Environmental Exposures
Edited by Bernard Weiss
r The Royal Society of Chemistry 2013
Published by the Royal Society of Chemistry, www.rsc.org
151

direct and indirect mechanisms. Here, we briefly review the physiologicand toxicologic properties of manganese, exposure sources, and evidence—molecular, animal model, and clinical—supporting a likely role of manganesein neurologic disease in the aged.
6.2 Environmental Occurrence of Manganese and
Exposure Sources
Manganese is the 5th most abundant metal and 12th most abundant element,accounting for 0.1% of the earth’s crust. Natural weathering processes result inthe ubiquitous presence of manganese in soil, dust, and water, and in ambientair containing suspended particles. Overall enrichment of manganese in soil indeveloped regions is gradually increasing due to industrial emission.76 Currentestimates of world manganese reserves, including high grade ores (defined ashaving more than 44%manganese content), are in the range of 680million tonsof ore, situated in the southern hemisphere, with Australia, Brazil, Gabon, andSouth Africa, supplying over 90% of the international market. Ghana andIndia, both large suppliers in the past, are now exporting only limited quantitiesof low or medium grade ore. The ore mined in Mexico is mostly for use withinthat country. The CIS, which as the USSR was the largest supplier ofmanganese ore at the beginning of the century, is now left with low grade orereserves. Low or medium grade manganese ore deposits are widely distributedin China.
Anthropogenic uses of manganese are largely in metallurgical processes.About 90% of industrially processed manganese is used in steel manufacture asa deoxidizing and desulfurizing additive, and as an alloying constituent. Mostmanganese ore is smelted in electric furnaces to produce ferromanganese,widely used in the production of steel. Metallic manganese (ferromanganese) isused principally in steel production to improve hardness, stiffness, and strength.It is used in carbon steel, stainless steel, high-temperature steel, and tool steel,along with cast iron and super alloys.79 Manganese is also a minor but indis-pensable component of welding consumables. Most welding consumablescontain less than 6%manganese. The chemical forms in which it is used includeferromanganese, silico-manganese and manganese carbonate.
The most important non-metallurgical application of manganese is in theform of manganese dioxide, which is used as a depolarizer in dry-cell batteries.Manganese dioxide is also used in the manufacture of matches, fireworks,porcelain, glass-bonding materials, and amethyst glass, and as the startingmaterial for production of many other manganese compounds. Manganesesulfate is used primarily as a fertilizer and as a livestock supplement where soilsare deficient in manganese, as well as in some glazes, varnishes, ceramics, andfungicides. Potassium permanganate, due to its oxidizing power, is used as adisinfectant, an anti-algal agent, for metal cleaning, tanning and bleaching, andas a preservative for fresh flowers and fruits, as well as in water and waste-treatment plants for water purification purposes.79 Other uses of manganese
152 Chapter 6

compounds are in textile bleaching, for linseed oil driers, in dyeing, in tanningof leather, and as an oxidizing agent for electrode coating in welding roads.Another important material is manganese ferrite, a soft ferrite widely used inelectronics. Large amounts are consumed in the manufacture of televisioncircuit boards.
Manganese is also used as a constituent in a number of organometalliccompounds. Perhaps most notable is the organic manganese compoundMMT (methylcyclo-pentadienyl manganese tricarbonyl), which has receivedconsiderable attention as a potential airborne exposure source of manganese.162
MMT is an octane booster or anti-knock additive in gasoline. It was introducedin Canada in 1976 and had completely replaced tetraethyl lead in gasoline by1990. In 1977, MMT was banned by the Environmental Protection Agency(EPA) as an additive in unleaded gasoline in the US.42 In 1995, the ban waslifted, and a court decision ordered the EPA to register the product for use as afuel additive again, although testing for health effects continues. The Afton(former Ethyl) Corporation, the manufacturer of MMT, has been marketingMMT since late 1995. Nevertheless, MMT is currently used only sparsely in thedeveloped world.162 The major refiners in Canada have voluntarily stoppedusing MMT, out of concern for the impact of MMT on advanced vehicles, andas a result, as much as 95% of Canadian gasoline is now MMT-free.83 InEurope, MMT is used in Greece,59,160 in a couple of the Eastern countries, andperhaps by one small refiner in Belgium.11 The EU Fuel Quality legislation inApril 2012 set a limit of 6 mg L�1 manganese in gasoline, falling to 2 mg L�1
from 2014, based on a risk assessment that is due to the EU Commission by theend of 2012. China is following the same requirements as Europe (MichaelWalsh, personal communication).
Another potentially important class of organomanganese compounds is thefungicides, including maneb (ethylene-bisdithiocarbonate) and mancozeb(a polymeric mixture of maneb and a zinc salt); both containB20%manganeseby weight.79 There is limited evidence that use of these fungicides contributes toincreased environmental manganese loading, though a recent study in theagricultural Salinas Valley (California, USA), where maneb and mancozeb areregularly applied, reported an association between manganese floor dustloadings in the homes of agricultural workers and manganese levels in sheddeciduous teeth in resident children4 (see section 6.3).
6.3 Essential and Toxicological Roles of Manganese in
Humans
Manganese is an essential element for humans and animals and is needed fornormal prenatal and neonatal bone mineralization, protein and energy meta-bolism, metabolic regulation, cellular protection from damaging free radicalspecies, and the formation of glycosaminoglycans, among other things. Mito-chondrial superoxide-dismutase (Mn-SOD), pyruvate carboxylase, and liverarginase are some of the known manganese metalloenzymes. In astrocytes, a
Manganese 153

large portion of intracellular manganese occurs as a cofactor in the enzymeglutamine synthetase.8 Manganese has also been shown to stimulate thesynthesis of chondroitin sulfate, an important constituent of the cartilage andconnective tissue.100
As an essential element, manganese exhibits a classic inverted ‘U’ shapeddose–optimum heath response curve, with deleterious health impacts fromphysiologic deficiency as well as over exposure when the homeostatic range isexceeded. Oral intake via the normal diet is the physiological absorption routefor manganese, and inhalation is the typical route for occupational and envi-ronmental exposure. In healthy adults, tight homeostatic control regulatesgastrointestinal absorption and systemic uptake to about 3% of ingestedmanganese. The US Food and Nutrition Board of the National ResearchCouncil established Estimated Safe and Adequate Daily Dietary Intake(ESADDI) levels as follows: 0.3–0.6 mg per day for infants from birth to6 months; 0.6–1.0 mg per day for infants from 6 months to 1 year; 1.0–1.5 mg perday for children from 1 to 3 years; 1.0–2.0 mg per day for children from 4 to10 years; and 2.0–5.0 mg per day for adolescents (411 years) and adults.130
We are not aware of any comparable estimates specific to the elderly, though itis reasonable to consider that ESADDI values would differ from those ofyounger adults.
Emerging literature shows neurotoxic effects from airborne particles,especially of ultrafine dimension, carried through the olfactory tract. Thereforethe role of olfactory transport and brain deposition of manganese mandatesfurther research to assess the impacts on brain functions like olfaction.170 Onceabsorbed in the body, manganese is rapidly distributed to various organs andtissues, including the bone and the brain.151 In the circulation, manganesebinding to blood proteins, such as a2-macroglobulin and transferrin, isimportant in mediating the distribution within the body and target organs suchas the brain.34,38,84,119 In the brain, manganese accumulates in the caudate-putamen, globus pallidus, substantia nigra, and subthalamic nuclei,5 thoughrecent studies have suggested that following occupational exposures, manganesemay accumulate more broadly across the brain than previously believed.32
6.4 Manganese Toxicity in Adults and the Elderly
Studies have shown clear health impacts of elevated manganese in occupa-tionally exposed adults.33,145 Prolonged occupational exposure to manganese,such as may occur in welders, miners, smelters, and other industrial workersthat are exposed to high levels of manganese in fumes, may lead to irreversibleneurological damage resulting in the disorder of manganism. Initially,manganism presents with psychiatric disturbances that are later followed byataxia and an extrapyramidal syndrome. These symptoms resemble somewhatthe progression of Parkinson’s disease.8 However, recent studies have indicatedimportant differences in the signatures of brain dysfunction in occupationalmanganese neurotoxicity versus Parkinson’s disease. For example, in asymp-tomatic welders at risk for developing manganism, positron emission
154 Chapter 6

tomography (PET) imaging has shown reduced FDOPA uptake in thenigrostriatal pathway, with the pattern of affected brain areas as thecaudate4anterior putamen4posterior putamen, which is the exact oppositebrain regional pattern of dysfunction in symptomatic idiopathic Parkinson’sdisease.33
Neuromotor, neurosensory and cognitive effects have been observed inwelders with relatively low manganese exposures.15,41 These findings are similarto those observed in other manganese-exposed populations, such as workers inbattery production,145,146 ferroalloy production,106,117 and ore-processing.127,132
Early evidence of pre-clinical neuropsychological alteration includes reducedperformance on neuropsychological testing, poor eye-hand coordinationand hand steadiness, reduced reaction time, reduced cognitive flexibility,and poor postural stability.97 Other symptoms commonly reported include:headache, weakness, memory loss, sleep disturbance, irritability, anxietydisorders, and gait disturbance. These effects have been associated withmanganese deposition in the brain, as measured with magnetic resonanceimaging in otherwise normal (i.e., asymptomatic) occupational populations.90
Recent literature also indicates the impairment of cognitive abilities inadults with occupational and environmental exposure to manganese.147
Chronic manganese exposure in non-human primates has been shown toproduce neurodegenerative changes, diffuse A-beta plaques and alpha-synuclein aggregation in the frontal cortex. These changes support theobservation of cognitive and working memory deficits observed in theseanimals.62
While there is compelling justification for special consideration of theelderly as a population particularly susceptible to the deleterious effectsof environmental exposures,142 few studies have investigated manganesepathophysiology in the elderly as a specific sensitive population. Elevatedenvironmental manganese exposure may also affect non-occupationalpopulations living in the vicinities of elevated manganese emissions. Studieshave shown increased risk for Parkinson disease or parkinsonian disturbancesin older adults living in areas with elevated environmental manganese.106,107,164
Indeed, manganese exposure may play a role in the development ofidiopathic Parkinson’s disease by acting as an environmental trigger, able toaccelerate the onset of neurodegenerative damage.112 Welders have beenstudied for a possible increase of Parkinsonism due to manganese exposure.An increased frequency of parkinsonian disturbances has been shown in casecontrol studies on large groups of welders in the US. The parkinsonianfeatures in welders do not appear to be different from idiopathic Parkinson’sdisease (PD), except for a younger age of onset and a tendency to familiarity.Epidemiological studies conducted in Norway, Italy, and Canada haveshown increased prevalence of Parkinson’s disease and Parkinsonism in thevicinity of industrial sites causing emission of manganese dust.108 Thedifferences between manganism and manganese-induced parkinsonism maybe interpreted. Relatively short term exposure to high concentrations ofmanganese appear to target the globus pallidus, sparing the substantia nigra
Manganese 155

pars compacta and resulting in the typical features of classical manganism,as described by Couper in 1837,30 only 20 years after sir James Parkinson’sdescription of the ‘‘shaking palsy’’. Prolonged and lifetime exposure tomuch lower levels of manganese, that may still exceed the homeostaticrange, can target the entire area of the basal ganglia. This may explain theincreased frequency of parkinsonism among elderly people with prolongedenvironmental exposure to manganese.109,164 Welders may represent aparticular at-risk group, where a combination of both manganism andmanganese-induced parkinsonism takes place, according to thedifferent levels of interaction between intensity and duration of manganeseexposure.
6.5 Early Life Exposure to Manganese and Adult
Disease
There is a compelling need to understand the extent to which early life exposureto elevated manganese may contribute to increased risk of disease in the elderly.Emerging evidence from studies of other environmental agents, such as airpollution and lead, support the concept of health effects in adults who sufferedexposures as children.18,71 However, currently, there are no comparable humandata we are aware of linking early life manganese exposure with adult disease.Notably, the developing brain is more sensitive to manganese than the adultbrain, due to enhanced absorption of the metal, relatively lower biliaryexcretion, and the continued development of synapses throughout childhooduntil adolescence, particularly in the prefrontal cortex. All of these factorsincrease the potential for neurological injury from excessive exposures.6,136
During development, manganese readily crosses the placenta and canaccumulate in the brain, and neonates receiving total parental nutrition (TPN)can accumulate over 200% more manganese in the brain compared to childrennot receiving TPN.50 However, information addressing toxicity from oralexposure in children has only recently emerged. Except for recent reports ofimpairment in motor skills and odor identification,110 health effects associatedwith elevated manganese exposure in children have been impairment ofcognitive functions, with decrements in memory, verbal learning, andintelligence.14,115,141,157,163,165
These studies reported that neurotoxicity occurs in children drinking waterwith high (41000 mg L�1) concentrations of manganese,70,88 and a potentialassociation has been reported between ingestion of elevated levels ofmanganese and learning problems, based upon data indicating that manganeselevels in hair are higher in learning-disabled and hyperactive children than innormal functioning children.29,135 Several epidemiological studies haveexamined the relationship between elevated manganese levels in water and toxiceffects in children. A study conducted in the Chinese province of Shanxicompared 92 children aged 11 to 13 whose drinking water was contaminatedwith elevated levels of manganese (241–346 mg L�1) to children whose drinking
156 Chapter 6

water had low levels of manganese (30–40 mg L�1).73 The exposed childrenperformed more poorly in school and on neurobehavioral exams thancontrol students (po0.01), with deficits noted in manual dexterity and rapidity,short-term memory, and visual identification. A second study, conducted inBangladesh, showed that manganese may affect intellectual function, resultingin lower IQ.163 This study examined a cross-section of 142 10-year old childrenwhose well water supply was contaminated with a mean concentration of793 mg Mn L�1. The data indicated that manganese exposure was significantlyassociated with reduced Full-Scale, Performance and Verbal raw scores onthe Wechsler Intelligence Scale for Children in a dose-response fashion.Additionally, a study conducted in Quebec, Canada, examined the relationshipbetween exposure to chronic levels of manganese and hyperactive behavior inchildren.13 Hair manganese concentration was correlated with hyperactive andoppositional behaviors, with the high exposure group having significantlygreater levels of manganese in hair and a stronger association with hyperactivebehaviors. Likewise, inhaled manganese was negatively associated with intel-lectual function in school aged children living near a manganese mining andprocessing facility.141 Collectively, these data suggest that high levels ofmanganese in drinking water directly affect neurobehavioral function inchildren. Considered alongside recent findings that mice exposed to manganeseduring juvenile development experience greater neuroinflammatory injury andbehavioral dysfunction upon exposure to manganese as adults than micewithout juvenile exposure,122,123 a background of manganese exposure,particularly during critical developmental years, could render individuals moresusceptible, later in life, to neurotoxic insults which may predispose them toneurological disease.
6.6 Biological Markers of Manganese Exposure in
Humans
While elevated manganese exposures are clearly associated with neurologicaldeficits in humans, details of the exposure–effect relationships across occupa-tional and environmental exposures are still being .82,118,152 In part, this may bedue to the challenges of accurately characterizing exposure over the lifetime orlife stage of susceptibility, and to the fact that there are no well-recognized andvalidated biological markers of manganese exposure to better define dose–effectrelationships, as there are for some other well-studied metal toxicants such aslead.131 The identification and validation of exposure biomarkers is funda-mental to human toxicology and risk assessment, and the assessment of adose–response relationship is essential for the demonstration of cause and effectrelationships, according to Hill’s criteria of causation.77
Ideally, biological markers of exposure should reflect an integration of theinternalized dose over time. Studies in occupationally-exposed adults havereported that blood manganese was associated with exposure and neurotoxicoutcomes,2,15,104,105,116,117,127,128,144 while studies in environmentally-exposed
Manganese 157

children have reported that hair manganese,13,165 manganese in the exposuremedium (e.g., water163), or tooth manganese levels,4,43 but not blood manganese,were predictors of exposure and/or neurotoxic outcomes. The reasons for thesediscrepancies in the predictive value of various manganese exposure biomarkersacross pediatric environmental and adult occupational exposure studies are notknown. The toxicokinetics of manganese suggests that exposure biomarkers suchas blood and urine may best at best reflect recent exposure (i.e., days), while hairand teeth may integrate or reflect longer-term exposure (e.g., weeks –months orlonger).82,118,152
These studies evidence the challenges associated with the identification andvalidation of biomarkers for manganese exposure and effect. Contributing tothis challenge is the fact that manganese is an essential element; normally,concentrations in the body are controlled by homeostatic mechanisms regu-lating absorption, disposition, and excretion. These processes also play animportant role in manganese toxicokinetics, different from many other non-essential toxic metals like mercury and lead. In the latter case, the relationshipbetween lead exposures from environmental and occupational sources andbiological indicators of exposure and effect, such as the significant associationsbetween blood lead levels and toxic outcomes, have been well established overyears of study.93,131
Analytical challenges associated with the accurate and precise measurementof manganese concentrations in various biological media (e.g., blood, plasma,hair, urine) may confound assessment of suitable biomarkers of exposure.The existing literature suggests substantial variability in blood and hairmanganese levels in environmentally or occupationally exposedsubjects,14,15,104,115,117,128,144 but the role of analytical variability in thesedifferences has not been addressed. Unlike the significant efforts devoted toimproving blood lead measurements,53,131 there has been little recognition ofpotential sample contamination during collection, processing, and analyses ofbiological samples for manganese concentrations, even though manganese is arelatively common constituent of environmental media, such as soil anddust.143
To date, only a few studies have measured manganese in cross sections ofshed deciduous teeth as a means of assessing prenatal and early postnatalexposure.4,43 Ericson and colleagues reported a significant association betweentooth manganese and hyperactivity/behavioral outcomes.43 Arora andcolleagues found a significant association between manganese in prenatallyformed tooth dentine and floor dust manganese loadings in the homes ofagricultural workers in regions where the manganese-containing fungicidesmaneb and mancozeb are routinely applied.4 Measurement of manganese inteeth may offer several strengths as an exposure biomarker and predictor ofadverse health effects. As a biologic analog to calcium, manganese [as Mn(II)] isincorporated directly into developing dentine. And, modern analyticalmethods, such as laser ablation ICP-mass spectrometry, allow detailedmanganese measurements along histological transects contemporaneous withfetal and neonatal development.
158 Chapter 6

6.7 Animal Studies - Dosimetry
Animal model studies have been crucial for elucidating the relationshipbetween manganese dose, resultant target tissue manganese levels, and theresultant functional, cellular and sub-cellular effects of elevated exposure.6,8
As an essential element, manganese homeostasis is physiologically regulatedin adults, though regulatory processes may be overwhelmed with excessiveexposure, depending on the exposure magnitude and frequency. This is wellillustrated with data from a rodent study we conducted to determine whethermanganese exposure and resultant toxic outcomes are a function of themagnitude of the nominal dose, the duration of the treatment, or a combi-nation of both. Adult female Sprague-Dawley rats (age 9 months) weretreated with nominal manganese doses of 0, 1.6, 4.8 and 9.6 mg kg�1 viaintraperitoneal (IP) injection three times per week for either 5 weeks or15 weeks (the latter dose for only 5 weeks; n¼ 10–14 per treatment). Blood,plasma, and brain manganese concentrations were significantly associatedwith the nominal dose, but not the cumulative dose of exposure (Figure 6.1),indicating there was no substantial accumulation of manganese with time inthe circulation or the brain beyond the 5 week exposure duration, within anominal dose treatment. This is best illustrated by the essentially identicalblood manganese levels in animals who received the relatively modest nominaldose of 1.6 mg kg�1 for 5 weeks (blood Mn¼ 53.0 ng mL�1) or 15 weeks(blood Mn¼ 53.2 ng mL�1), even though the total cumulative manganesedoses for these two groups differed by three-fold (24 and 72 mg kg�1
respectively). In contrast, animals who received the same cumulative dose of72 mg kg�1 over a total exposure duration of either 5 weeks (4.8 mg kg�1
nominal dose) or 15 weeks (1.6 mg kg�1 nominal dose) exhibited bloodmanganese levels that differed by more than four-fold [i.e., 236 ng mL�1 versus53.2 ng mL�1, Figure 6.1(a)], consistent with the difference in nominal dosebetween these treatment groups.
More recently, a study by Schroeter et al.151 reported the use of a multi-route physiologically-based pharmacokinetic model for manganese toevaluate dose-dependent neurological effects, drawing exclusively on datafrom non-human primate studies. Applying the model across studies that useda variety of exposure routes (inhalation, oral, intravenous, intraperitoneal,and subcutaneous) and exposure durations (several weeks to over two years),their results support the hypothesis that the dose–response relationship forthe neurotoxic effects of manganese is independent of exposure route. Theirresults also support the use of target tissue manganese concentration orcumulative target tissue manganese levels as an internal exposure measurepredictive of neurological effects. This is consistent with the suggestion ofGwiazda et al. 68 that cumulative manganese dose is a predictor of significanthealth effects. This underscores the importance of understanding both thefrequency and magnitude of exposure relative to the rate of body manganeseelimination, a suggestion that has clear implications for human exposures aswell.6
Manganese 159

Blo
od M
n (n
g/m
L)
0
100
200
300
400
500
600
700
800
Pla
sma
Mn
(ng/
mL)
0
2
4
6
8
10
12
14
16
18
Bra
in M
n (u
g/g
wet
wt)
0.0
0.5
1.0
1.5
2.0
2.5
Nominal Dose (mg/kg) 0 1.6 4.8 9.6
0 0 24 72 72 216 144
(a)
(b)
(c)
a ab b
c c
d
a a aa
b
b
c
a a
b b
c c
d
Cumulative Dose (mg/kg)
Figure 6.1 (a) Blood, (b) plasma, and (c) brain manganese concentrations in adultSprague-Dawley rats (mean� SE, n¼ 8� 14/bar) exposed to manganesevia IP injection (3 injections/week) for 5 weeks (grey) or 15 weeks (black).The x-axis shows nominal dose for each IP injection in mg Kg�1 bodyweight, or the total cumulative dose of manganese administered over theentire 5 or 15 week exposure period. Within a tissue, bars with differentsuperscript letters were statistically different (po0.05), based on Tukeypost hoc analyses.
160 Chapter 6

6.8 Animal Studies - Early Life Manganese Exposure as
a Determinant of Late Onset Disease
Animal model studies have also proven invaluable in specifically evaluating theimpacts of exposure to agents suffered during discrete life stages, including theextent that insults suffered during early life may increase the risk of dysfunctionand disease late in life. While studies have shown that increased iron intake inneonatal mice resulted in a Parkinson-like neurodegeneration as aged adults,85
few studies have specifically evaluated the persistence of functional defects intoadulthood as a result of early life exposure to manganese.87,113,122,123,140 In onestudy, Kern and Smith87 showed that rats exposed to manganese in earlylife showed an increased spontaneous motor activity response as adults(postnatal day, PND B100) to a D-amphetamine challenge (D-amphetamine isa catacholamine agonist that produces increased levels of dopamine in thesynaptic cleft). Consistent with this, dopamine D2 receptor levels wereincreased to a significant B500–800% of controls in the prefrontal cortex,while D1 receptor levels were increased to B160% of control in the nucleusaccumbens of these adult rats exposed to manganese in early life. These dataprovide evidence of lasting alteration of the dopamine synaptic environment inadults following early life manganese exposure. Moreover, Moreno andcolleagues recently reported that mice exposed to manganese during juveniledevelopment experienced greater neuroinflammatory injury and behavioraldysfunction upon exposure to manganese as adults than mice without juvenileexposure.122,123 Collectively, these animal studies further support thehypothesis that early life manganese exposures in humans may increasesusceptibility to dysfunction in aged individuals.
6.9 Mechanisms of Manganese Toxicity
The dominant mechanisms of manganese toxicity are believed to include:mitochondrial dysfunction,56–58 free radical production and oxidative stress,39
disruption of cellular antioxidant defense mechanisms (such as glutathione,catalase, and glutathione peroxidase), manganese-mediated disruptions tointracellular calcium and Fe metabolism,35,91,92,167,169 and activation ofproinflammatory pathways.51,124,159
Manganese is a redox-active transition metal and a biologic analogue toiron(III), as Mn(III), and Ca(II), as Mn(II).37 Within eukaryotic cells,manganese is predominantly in the Mn(II) oxidation state.66,67,137 though isbelieved to undergo rapid redox activity in oxidizing environments or if notsuitably stabilized by coordination with molecular ligands.37,66 As such,manganese may exhibit both prooxidant and antioxidant properties, dependingupon the local environment. Manganese is taken up into cells via a number ofmechanisms, including the divalent metal transporter 1 (DMT1), transferrinreceptor, and Ca21 uniporter.5,8,55 In contrast, comparatively little is knownabout cellular manganese efflux mechanisms, though recent studies have
Manganese 161

suggested that the golgi transmembrane proteins SPCA-1 and golgi phospho-protein IV play important roles in cellular manganese homeostatsis andefflux.125 DMT1 is highly expressed in the basal ganglia, which is a target areafor both Parkinsonism and manganese toxicity,80 and certain DMT1 poly-morphisms have been related to Parkinson’s disease74 and neurodegenerationin animals models.150 Additionally, rats exposed to manganese welding fumesmimicking occupational exposure have shown increased DMT1 mRNAexpression related to neurodegeneration.155 A role for DMT-1 in enhancedmanganese olfactory transport, especially in anemic animals,158 has also beenobserved.
6.9.1 Manganese Induces Oxidative Stress and Mitochondrial
Dysfunction
Manganese is widely regarded as a prooxidant that contributes to heightenedoxidative stress within cells.1,5,91,138,139 Experimental evidence suggests thatprooxidant activity of Mn21 is dependent on trace amounts of Mn31.Superoxide produced in the mitochondrial electron transport chain maycatalyze this transition through a set of reactions similar to those mediated bysuperoxide dismutase and thus lead to the increased oxidant capacity of themetal. Manganese may enhance the auto oxidation or turnover of variousintracellular catecholamines, such as dopamine, leading to an increasedproduction of free radicals, reactive oxygen species, and other cytotoxicmetabolites.3,39,103 It has also been shown to impair cellular antioxidant defensemechanisms. Oxidative stress generated through mitochondrial dysfunctiondue to manganese may be a key event in the injury of targeted central nervoussystem cells.
The mitochondrion is an important intracellular target of elevatedmanganese, with numerous studies demonstrating impaired function of themitochondria or mitochondrial components with elevated exposures.Numerous studies have shown that elevated manganese exposure impairsmitochondrial function and energy production,56–58,171,172 and specificallytargets mitochondrial enzymes, including aconitase,34,167 and components ofthe electron transport chain.54 As manganese alters ATP production andglutamate uptake in astrocytes, basal ganglia neurons could be susceptible toexcitotoxic damage. Changes in glutamic acid decarboxylase (GAD) andGABA content can be found as a consequence of manganese exposure.52,69 Ithas been proposed that loss of GAD-positive cells in the striatum and globuspallidus of manganese-treated rats may be caused by the loss of chemical,electrical, or physical support because of neurite dysfunction encountered inmesencephalic cultures exposed to manganese (resulting in profound changes inthe cytoskeleton and neurite length), or may be an independent neurotoxicevent. Long-term manganese-intoxication effects are similar to those producedby other substances that also affect the mitochondria in the same brainstructures, for instance carbon monoxide (CO) and cyanide. Parkinsonism and
162 Chapter 6
dystonia are common sequelae of manganese, cyanide, and carbon monoxideintoxications. Why manganese is able to produce the same effects as thesesubstances is not known, but there may be common mechanisms of injury; forexample, all of them are able to produce alterations in oxidative phos-phorylation, and both manganese and CO induce mPT and ROS production.8
6.9.2 Manganese Causes Dysregulation of Cellular Iron
Homeostasis
There is compelling in vitro, in vivo, and epidemiological evidence supportingthe hypothesis that elevated manganese exposures lead to alteration of cellulariron metabolism.35,40,91,92,120,139,148,167,168,169 and that polymorphisms of ironmetabolism genes are associated with blood manganese levels in humans.75 Inmammalian cells, cellular iron metabolism is controlled primarily post-transcriptionally by the coordinated translation of proteins critical to ironuptake (transferrin receptor, TfR and divalent metal transporter-1, DMT-1),storage (ferritins), and utilization (m-aconitase and erythroid 5-aminolevulinatesynhetase).133 Translation of these proteins is controlled by iron regulatoryproteins (IRPs), which interact with stem-loop structures (iron responsiveelements, IREs) located in mRNAs coding for the above proteins. Two distinctIRPs have been identified: IRP-1 and IRP-2. IRP-1 is a bifunctional protein,exhibiting (cytosolic) aconitase activity in its holo form (containing a [4Fe-4S]cluster), and IRE binding activity in its apo-form (i.e., loss of the [4Fe-4S]cluster). Because of its aconitase activity, IRP-1 in its holo from is also knownas cytosolic aconitase (c-aconitase). In contrast, IRP-2, which does not containan Fe–S cluster and lacks aconitase activity, regulates IRE binding activitythrough changes in its intracellular abundance.
Recent evidence suggests that manganese exposure produces an ironresponse akin to iron deficiency, leading to increased iron uptake, reducedstorage of cellular iron, and increased labile cellular ironlevels.35,91,92,98,138,139,169 Since manganese can inhibit the enzymatic activity ofaconitase,26,35,161,167 it has been suggested that manganese may alter ironhomeostasis via a direct interaction with c-aconitase/IRP1. However, there iscompelling evidence that IRP-2 binding activity in cells is also strongly alteredby manganese and in fact may be the predominant IRP mediating themanganese effect on iron dysregulation.35,91,92 In light of (i) laboratory dataindicating that misregulation of iron leads to increased redox cycling ofiron complexes, increased oxidative stress, reduced antioxidant capabilities,and lipid and protein oxidation in the basal ganglia and other affectedbrain regions; (ii) suggestions that these effects are likely both cell type andbrain region-specific, and also likely exacerbated with ageing; and (iii) thegrowing body of evidence indicating that iron toxicity may play an importantrole in many neurodegenerative diseases, including Alzheimer’s, Parkinson’s,and Huntington’s disease,96 it is quite likely that manganese-induceddysregulation of cellular iron homeostasis is an important mechanism ofcellular toxicity.
Manganese 163

6.9.3 Manganese Targets Dopaminergic and Glutamatergic
Systems
There is clear evidence that manganese exposure in animal models, at levelsbelow those that produce overt toxicity or neurodegeneration, alters dopaminesystem function, including reduced striatal dopamine release, reduced striataldopamine transporter protein expression, and enhanced D2 receptor.86,87,113,140
Similarly, in one of the few studies to report D2 receptor activity/expression,Calabresi et al.19 showed that exposure of post-weanling rats to manganesesignificantly enhanced striatal D2 receptor activity compared to controls, basedon electrophysiological measurements in brain slices treated with the D2receptor agonist quinpirole. Comparable studies in adult non-human primateshave similarly shown that elevated manganese exposure alters DA function.Guilarte et al.64 used PET imaging in adult primates exposed to weekly IV.injections of manganese (3.3–4.9 mg kg�1 weekly injection for B40 weeks) toshow that manganese exposure resulted in reduced amphetamine-stimulateddopamine release in the striatum. Eriksson et al.44,45 used PET imaging andquantitative autoradiography in adult non-human primates to show thatchronic adult manganese exposure (200 mg SC injection every 2 months for16–26 months) produced a 60–75% reduction in dopamine transporter levels inthe striatum. Earlier studies in adult primates have shown that chronicmanganese exposure also decreased tissue dopamine levels in the striatum.10,46
Changes in olfactory perception may be caused by a dopaminergicdysregulation, possibly related to changes at the level of dopamine receptors.Being actively transported through the olfactory tract, manganese can causeimpairment of olfactory function and motor coordination. Odor and motorchanges are interrelated and may be caused by a manganese-induceddopaminergic dysregulation affecting both functions. The interconnectionbetween manganese and dopaminergic toxicity through changes in DMT1expression warrant further research on the possible role of manganese exposureas a pathogenetic factor for Parkinsonism. Manganese exposure has shown toboth increase and decrease serum prolactin levels in rats111,139 and humans,including children,121 as further support of changes in the dopaminergicsystem.
There is similar though less complete evidence from adult animal and cellularstudies showing that manganese exposure disrupts glutamate (Glu)function.24,36,47,65,126 For example, Erikson et al. showed that chronicrespiratory MnSO4 exposure in juvenile monkeys (Z0.3 mg m�3 for 65 days)decreased levels of GLT-1 and GLAST protein in the caudate, globus pallidus,olfactory cortex, and cerebellum, though total tissue Glu levels were unchangedcompared to controls.47 Centonze et al. found that manganese exposure inpost-weanling rats (20 mg mL�1 in drinking water for 10 weeks) increased thefrequency and amplitude of spontaneous striatal excitatory postsynapticpotentials, but did not change the sensitivity of striatal neurons to Glu AMPAand NMDA receptor stimulation, suggesting that the abnormal excitation ofstriatal neurons in this manganese dose range was due to hyperactivity of
164 Chapter 6

corticostriatal neurons.24 These findings in animal models are accompanied byfindings in cell model studies. Collectively, these support the theory thatmanganese exposure may disrupt Glu function through altered Glu releaseand/or activity, or decreased astrocytic Glu uptake, possibly potentiating theeffects of increased cortical excitatory input.17,27,36,48,49,52,72,153
6.9.4 Glial Activation and Nitrosative Stress in Manganese
Neurotoxicity
Inducible expression of multiple inflammatory genes in glia is regulated by thetranscription factor NF-kB, which is under intense study as a therapeutic targetfor blocking neuroinflammation in neurodegenerative disease.21 Multiple stressand inflammatory signals activate NF-kB through the IkB Kinase (IKK)complex.129 Mitogen activated protein (MAP) kinase cascades are one of thepathways central to activation of IKK, and recent studies reported thatmanganese directly stimulates cGMP-dependent activation of NF-kB inastrocytes via MAPK signaling that potentiates the effects of inflammatorycytokines on expression of nitric oxide synthase (NOS2).124 These data help toexplain how low levels of manganese can potentiate inflammatory signaling inglial cells and suggest a mechanism by which manganese may act on NF-kB inconcert with factors such as TNFa and IL-1b to promote a neuroinflammatoryphenotype in glia.
The broader functional significance of NF-kB-dependent regulation ofinflammatory genes in the basal ganglia was highlighted in recent studiesdemonstrating that the orphan nuclear receptor, Nurr1 normally inhibitsNF-kB-regulated neuroinflammatory genes in astrocytes, and its deficiencycauses loss of dopaminergic neurons.149 Active Nurr1, as well as selected othernuclear receptors, stabilizes constitutively bound nuclear corepressor proteinsand prevents NF-kB-induced NOS2 expression in astrocytes and microglia.Interestingly, deficiency in expression of Nurr1 is also associated with a late-onsetform of Parkinson’s disease,61,94 suggesting that nuclear regulators of NF-kB arelinked to glial inflammatory activation and neuronal injury within the basalganglia. Supporting the importance of these nuclear regulatory mechanisms toneuroinflammatory injury, transgenic animals containing microglial- andastroglial-specific gene deletion of NF-kB are protected in diverse models ofinflammatory neurodegeneration.16,28 Thus, the capacity of manganese tostimulate a damaging inflammatory phenotype in glia may not only promoteneuronal injury during exposure, but may also render selected populations ofneurons more vulnerable to secondary neurotoxic insult later in life.
6.9.5 Neuroinflammation may Link Between Early Life
Exposure to Manganese and Susceptibility to Late Onset
Neurological Disease
The most prominent neuropathologic findings in human manganism areneuronal loss and reactive gliosis in the globus pallidus and substantia nigra
Manganese 165

pars reticulata (SNpr).166 Gliosis in the striatum (caudate nucleus andputamen) and subthalamic nucleus has also been reported and, less frequently,the substantia nigra pars compacta (SNpc).20 A key feature of the reactivegliosis observed in human and experimental manganism is the presence of
Figure 6.2 Manganese potentiates NF-kB signaling in astrocytes, leading to increasedexpression of neuroinflammatory genes. Until recently, it was unclear howmanganese could potentiate inflammatory signaling in astrocytes throughmultiple pro-inflammatory pathways. The studies of Tjalkens andcolleagues revealed that manganese uptake into astrocytes (1) results inrapid increases in cGMP through soluble guanylate cyclase (2), whichactivates MEKK/ERK signaling (likely through Rho/Rac family kinases)and the IKK/NF-kB signaling complex. (3) Diverse inflammatory signalssuch as TNFa and LPS activate IKK/NF-kB signaling through intra-cellular receptor-associated protein (MEK) complexes and theNF-kB-interacting kinase (NIK), resulting in a convergence of stimuli thatmagnifies otherwise low-level inflammatory activation (4). ActivatedNF-kB translocates to the nucleus, where chromatin remodeling occurs byremoval of transcriptional co-repressors such as NCoR2 and (likely) otherfactors such as histone deacetylase (HDAC) proteins, permitting bindingof p65 to NF-kB enhancer elements (5). Increased expression of NOS2elevates levels of NO, which may further increase intracellular cGMPlevels, as well as magnify neuronal protein nitration and injury.
166 Chapter 6

Alzheimer type II astrocytosis, although ultrastructural studies also reportreactive microglia surrounding degenerating neurons that contain increasednumbers of large secondary lysosomes, indicative of an active phagocyticprocess.9,63,134 Additionally, it has been reported that manganese inducesastrogliosis in the pre-frontal cortex of exposed Cynomolgus macaques, withactivated astrocytes in this model occurring proximal to degenerating neuronsthat express Amyloid-b precursor-like protein 1.63 Previous studies in juvenileand adult mice indicate that adult mice pre-exposed to manganese as juvenileshave a more severe neuroinflammatory phenotype and greater neurologicaldysfunction when re-exposed to manganese as adults, compared to micewithout prior exposure.122,123 This suggests that glial activation may representa type of ‘memory’ within the CNS that sensitizes affected brain regions to
Figure 6.3 Microglial-astrocyte interactions promote a neuroinflammatoryphenotype following exposure to manganese during development.Developmental exposure to manganese stimulates intercellular signalingbetween microglia and astrocytes, which results in a persistent inflam-matory phenotype that can enhance neurological dysfunction duringaging. (1) Manganese directly affects both microglia and astrocytes,stimulating NF-kB-dependent gene expression in microglia (2), whichenhances production of pro-inflammatory factors such as TNFa andIL-1b, leading to inflammatory priming of astrocytes. Manganeseaccumulation in astrocytesstimulates cGMP/MAPK/IKK-mediated acti-vation of NF-kB, potentiating expression of neuroinflammatory genes (3),which further stimulate microglial cells and cause neuronal proteinnitration and injury through release of inflammatory mediators includingNO and TNFa (4).
Manganese 167

neurological dysfunction from manganese and that might also promote a moresevere neuroinflammatory phenotype later in life upon exposure to manganeseor other environmental or endogenous neurotoxicants.
Less is known regarding the role of microglial activation in manganeseneurotoxicity, or about interactions between microglia and astrocytes that maypromote persistent astrogliosis. Microglia are not uniformly distributed in thebrain and are enriched in several regions, including the basal ganglia.89
Activated microglia and astrocytes produce pro-inflammatory mediators suchas nitric oxide (NO), prostaglandins, TNFa, and IL-1b, that are associated withneuronal injury in multiple neurodegenerative disorders.22,78,114 Increasedexpression of inducible NOS2 and overproduction of NO is also associatedwith neuroinflammatory injury in manganism,7,154 but the relativecontributions of microglia and astrocytes to NOS2 expression in glia andsubsequent induction of nitrosative stress in neurons following exposure tomanganese in vivo are not well understood. Manganese enhances the release ofthe inflammatory cytokines interleukin-6 and TNFa from microglial cells,23,51
which can promote activation of astrocytes and subsequent release of pros-taglandin E2 and NO.25,99 Manganese increases neuronal protein nitration indeveloping123 and adult101 mice, and inhibition of NOS2 in astrocytes protectsco-cultured neurons from manganese toxicity.102,159 This supports a causativerole for NO in manganese-induced neuronal injury, as do recent studies indi-cating that NOS2 knockout mice are protected against manganese neur-otoxicity during juvenile development.156 Thus a complex interplay betweenmicroglia and astrocytes mediates the neuroinflammatory phenotype observedin manganese toxicity, and a better understanding of the underlying signalingpathways is necessary to identify critical interactions between glial cells thatdetermine neuronal injury.
6.10 Conclusion
Manganese is an essential element and also a potentially hazardous element, infull accordance with Paracelsus’ motto ‘‘dosis facit venenum’’ (the dose makesthe poison). For manganese, the dose per se is not the only important factor;the integration between dose and exposure frequency and duration candetermine different types of toxicity. ‘‘Dosis et tempus faciunt venerum’’ wouldhave been Paracelsus’ definition for manganese. The time variable entails‘‘when’’ and ‘‘how long’’ exposure takes place, pointing out the most vulnerablewindows of pre and post-natal life. Time is also important in terms of exposureduration. Short time exposure to high doses can cause the classical features ofmanganism, whereas lifetime exposure to very low doses can result in neur-odegenerative changes identifiable as parkinsonism.
Long term neurotoxicity of manganese has been extensively studied for theimpact on motor coordination, but cognitive functions are also impacted andfurther studies are required to elucidate the mechanisms of toxicity. The elderlymay be particularly susceptible to manganese as a product of long termexposure, impacting both motor and cognitive functionality. This suggestion
168 Chapter 6

builds upon evidence linking transitional metal dyshomeostasis and theaccumulation of transition metals like iron in brain regions most commonlyaffected in neurodegenerative diseases. Manganese-induced dysregulation ofcellular iron homeostasis appears to be a key factor of neuronal damage.
Glial activation induced by pre-exposure to manganese in juvenile animalsmay represent a ‘‘memory’’ able to promote neuroinflammation and neur-ological dysfunction in older age, especially upon further exposure tomanganese or other neurotoxic agents. Neuroinflammation is also based on theinteraction between microglia and astrocytes, which needs further study tobetter elucidate the role of glial cells in neuronal injury. Persistent neuroin-flammation may be one of the reasons neurological symptoms worsen over timein individuals with high level exposure to manganese, and why damage tomultiple brain regions and cell types is triggered by long term exposure to lowerdoses. Future research that integrates these diverse mechanisms of injury will beimportant both for development of better therapeutic interventions and foridentifying populations that are most at risk from exposure to manganese.
References
1. S. F. Ali, H. M. Duhart, G. D. Newport, G. W. Lipe and W. Slikker, Jr.,Neurodegeneration, 1995, 4(3), 329–324.
2. P. Apostoli, R. Lucchini and L. Alessio, Am J. Ind. Med., 2000, 37,283–290.
3. F. S. Archibald and C. Tyree, Arch. Biochem. Biophys., 1987, 256,638–650.
4. M. Arora, A. Bradman, C. Austin, M. Vedar, N. Holland, B. Eskenaziand D. R. Smith., Environ. Sci. Technol., 2012, 46(9), 5118–5125.
5. J. L. Aschner and M. Aschner, Nutritional aspects of manganese home-ostasis, Mol. Aspects Med., 2005, 26(4-5), 353–362.
6. M. Aschner, K. M. Erikson and D. C. Dorman, Manganese dosimetry:species differences and implications for neurotoxicity, Crit. Rev. Toxicol.,2005, 35, 1–32.
7. M. Aschner, K. M. Erikson, E. Herrero Hernandez, E. H. Hernandez andR. Tjalkens, Manganese and its role in Parkinson’s disease: fromtransport to neuropathology, Neuromolecular Med., 2009, 11, 252–266.
8. ATSDR. Toxicological profile for Manganese (Draft for PublicComment). 2008; Atlanta, GA (U.S. Department of Health and HumanServices, Public Service).
9. T. Z. Bikashvili, A. A. Shukakidze and G. I. Kiknadze, Changes in theultrastructure of the rat cerebral cortex after oral doses of manganesechloride, Neurosci. Behav. Physiol., 2001, 31, 385–389.
10. E. D. Bird, A. H. Anton and B. Bullock, The effect of manganese inha-lation on basal ganglia dopamine concentrations in rhesus monkey,Neurotoxicology, 1984, 5(1), 59–65.
Manganese 169

11. Blumberg, K. and Walsh, M. P. (2004) Status report concerning the use ofMMT in gasoline International Council on Clean Transportation (ICCT).Available on line, http://www.healthandcleanair.org/mmt/icct.pdf.
12. D. J. Bonda, H. G. Lee, J. A. Blair, X. Zhu, G. Perry and M. A. Smith,Role of metal dyshomeostasis in Alzheimer’s disease, Metallomics, 2011Mar, 3(3), 267–270.
13. M. Bouchard, F. Laforest, L. Vandelac, D. Bellinger and D. Mergler,Hair manganese and hyperactive behaviours: pilot study of school-agechildren exposed through tap water, Environ Health Perspect, 2007,115(1), 122–127.
14. M. F. Bouchard, S. Sauve, B. Barbeau, M. Legrand, M. E. Brodeur,T. Bouffard, E. Limoges, D. C. Bellinger and D. Mergler, Intellectualimpairment in school-age children exposed to manganese from drinkingwater, Environ Health Perspect, 2011, 119(1), 138–143.
15. R. Bowler, H. Roels, S. Nakagawa, M. Drezgic, E. Diamond, R. Park,W. Koller, R. Bowler, D. Mergler, D. Smith, R. Gwiazda and R. Doty,Dose-effect relations between manganese exposure and neurological,neuropsychological, and pulmonary function in confined space bridgewelders, J. Occup. Environ. Med., 2007, 64(3), 167–177.
16. R. Brambilla, et al., Transgenic inhibition of astroglial NF-kappa Bimproves functional outcome in experimental autoimmune encephalo-myelitis by suppressing chronic central nervous system inflammation,J Immunol, 2009, 182, 2628–2640.
17. E. P. Brouillet, et al., Manganese injection into the rat striatum producesexcitotoxic lesions by impairing energy metabolism, Exp Neurol, 1993,120(1), 89–94.
18. C. J. Brubaker, V. J. Schmithorst, E. N. Haynes, K. N. Dietrich,J. C. Egelhoff, D. M. Lindquist, B. P. Lanphear and K. M. Cecil, Alteredmyelination and axonal integrity in adults with childhood lead exposure: adiffusion tensor imaging study,Neurotoxicology, 2009 Nov, 30(6), 867–875.
19. P. Calabresi, et al., A synaptic mechanism underlying the behavioralabnormalities induced by manganese intoxication, Neurobiol Dis, 2001,8(3), 419–432.
20. D. B. Calne, N. S. Chu, C. C. Huang, C. S. Lu and W. Olanow,Manganism and idiopathic parkinsonism: similarities and differences,Neurology, 1994, 44, 1583–1586.
21. S. Camandola and M. P. Mattson, NF-kappa B as a therapeutic target inneurodegenerative diseases, Expert Opin Ther Targets, 2007, 11, 123–132.
22. E. Carreno-Muller, et al., Thrombin induces in vivo degeneration ofnigral dopaminergic neurones along with the activation of microglia,J Neurochem, 2003, 84, 1201–1214.
23. J. Y. Chang and L. Z. Liu, Manganese potentiates nitric oxide productionby microglia, Brain Res Mol Brain Res, 1999, 68, 22–28.
24. D. Centonze, et al., Impaired excitatory transmission in the striatum ofrats chronically intoxicated with manganese, Exp Neurol, 2001, 172(2),469–476.
170 Chapter 6
25. C.-J. Chen, et al., Manganese modulates pro-inflammatory geneexpression in activated glia, Neurochem. Int, 2006, 49, 62–71.
26. J. Y. Chen, G. C. Tsao, Q. Zhao and W. Zheng, ‘‘Differential cytotoxicityof Mn(II) and Mn(III): special reference to mitochondrial [Fe-S]containing enzymes.’’, Toxicol Appl Pharmacol, 2001, 175(2), 160–168.
27. C. J. Chen and S. L. Liao, Oxidative stress involves in astrocyticalterations induced by manganese, Exp Neurol, 2002, 175(1), 216–225.
28. I.-H. Cho, et al., Role of microglial IKKbeta in kainic acid-inducedhippocampal neuronal cell death, Brain, 2008, 131, 3019–3033.
29. P. J. Collipp, S. Y. Chen and S. Maitinsky, Manganese in infant formulasand learning disability, Ann. Nutr. Metab., 1983, 27, 488–494.
30. J. Couper, On the effects of black oxide of manganese when inhaled intothe lungs, Br Ann Med Pharmacol, 1837, 1, 41–42.
31. J. P. Covy, B. I. Giasson. a-Synuclein, leucine-rich repeat kinase-2, andmanganese in the pathogenesis of Parkinson disease. Neurotoxicology.2011 Oct, 32(5), 622–629.
32. S. R. Criswell, J. S. Perlmutter, J. L. Huang, N. Golchin, H. P. Flores,A. Hobson, M. Aschner, K. M. Erikson, H. Checkoway and B. A. Racette,Basal ganglia intensity indices and diffusion weighted imaging inmanganese-exposed welders, Occup Environ Med, 2012 Jun, 69(6),437–443.
33. S. R. Criswell, J. S. Perlmutter, T. O. Videen, S. M. Moerlein, H. P. Flores,A. M. Birke and B. A. Racette, Reduced uptake of [18F]FDOPA PET inasymptomatic welders with occupational manganese exposure, Neurology,2011 Apr 12, 76(15), 1296–1301.
34. J. W. Critchfield and C. L. Keen, Manganese þ2 exhibits dynamicbinding to multiple ligands in human plasma, Metabolism, 1992, 41,1087–1092.
35. D. Crooks, M. Ghosh, M. Braun-Sommargren, T. Rouault andD. R. Smith, Manganese targets m-aconitase and activates iron regulatoryprotein 2 in AF5 GABAergic cells, J. Neurosci. Res., 2007, 85, 1797–1809.
36. D. Crooks, N. Welch and D. Smith, Low-level manganese exposure altersglutamate metabolism in GABAergic AF5 cells, Neurotoxicology, 2007,28(3), 548–554.
37. J. J. R. F. da Silva and R. J. P. Williams. The biological chemistry of theelements: the inorganic chemistry of life. Second Edition. OxfordUniversity Press, Oxford England, New York. 2001, 575 pp.
38. L. Davidsson, B. Lonnerdal, B. Sandstrom, C. Kunz and C. L. Keen,Identification of transferrin as the major plasma carrier protein formanganese introduced orally or intravenously or after in vitro addition inthe rat, J Nutr, 1989, 119, 1461–1464.
39. J. Donaldson, Involvement of manganese in physiological and biochemicalprocesses: an overview, Neurotoxicology, 1984 Spring, 5(1), 1–3.
40. D. G. Ellingsen, E. Haug, R. J. Ulvik and Y. Thomassen, ‘‘Iron statusin manganese alloy production workers.’’ J Appl Toxicol, 2003, 23(4),239–247.
Manganese 171

41. D. G. Ellingsen, R. Konstantinov, R. Bast-Pettersen, L. Merkurjeva,M. Chashchin, Y. Thomassen and V. Chashchin, A neurobehavioralstudy of current and former welders exposed to manganese, Neurotoxicol,2008, 29, 48–59.
42. EPA. U.S. (1978) Environmental Protection Agency. Federal Register 43:41424–41429.
43. J. E. Ericson, F. M. Crinella, K. A. Clarke-Stewart, V. D. Allhusen,T. Chan and R. T. Robertson, Prenatal manganese levels linked tochildhood behavioral disinhibition, Neurotoxicol Teratol, 2007, 29(2),181–187.
44. H. Eriksson, et al., Receptor alterations in manganese intoxicatedmonkeys, Arch Toxicol, 1992, 66(5), 359–364.
45. H. Eriksson, et al., Manganese induced brain lesions in Macacafascicularis as revealed by positron emission tomography and magneticresonance imaging, Arch Toxicol, 1992, 66(6), 403–407.
46. H. Eriksson, et al., Effects of manganese oxide on monkeys as revealed bya combined neurochemical, histological and neurophysiologicalevaluation, Arch Toxicol, 1987, 61(1), 46–52.
47. K. M. Erikson, et al., Manganese inhalation by rhesus monkeys isassociated with brain regional changes in biomarkers of neurotoxicity,Toxicol Sci, 2007, 97(2), 459–466.
48. K. Erikson and M. Aschner, Manganese causes differential regulation ofglutamate transporter (GLAST) taurine transporter and metallothioneinin cultured rat astrocytes, Neurotoxicology, 2002, 23(4-5), 595–602.
49. K. M. Erikson, R. L. Suber and M. Aschner, Glutamate/aspartatetransporter (GLAST), taurine transporter and metallothionein mRNAlevels are differentially altered in astrocytes exposed to manganesechloride, manganese phosphate or manganese sulfate, Neurotoxicology,2002, 23(3), 281–288.
50. J. M. Fell, et al., Manganese toxicity in children receiving long-termparenteral nutrition, Lancet, 1996, 347, 1218–1221.
51. N. M. Filipov, R. F. Seegal and D. A. Lawrence, Manganese potentiatesin vitro production of proinflammatory cytokines and nitric oxide bymicroglia through a nuclear factor kappa B-dependent mechanism,Toxicol Sci, 2005, 84, 139–148.
52. V. A. Fitsanakis, et al., The effects of manganese on glutamate, dopamineand gamma-aminobutyric acid regulation, Neurochem Int, 2006, 48(6-7),426–433.
53. A. R. Flegal and D. R. Smith, Current needs for increased accuracy andprecision in measurements of low levels of lead in blood, Environ Res,1992, 58, 125–133.
54. P. Galvani, P. Fumagalli and A. Santagostino, Vulnerability of mito-chondrial complex I in PC12 cells exposed to manganese, EurJ Pharmacol, 1995, 293, 377–383.
55. M. D. Garrick, K. G. Dolan, C. Horbinski, A. J. Ghio, D. Higgins,M. Porubcin, E. G. Moore, L. N. Hainsworth, J. N. Umbreit,
172 Chapter 6

M. E. Conrad, L. Feng, A. Lis, J. A. Roth, S. Singleton andL. M. Garrick, DMT1: a mammalian transporter for multiple metals,Biometals, 2003, 16, 41–54.
56. C. E. Gavin, K. K. Gunter and T. E. Gunter, ‘‘Manganese and calciumefflux kinetics in brain mitochondria. Relevance to manganese toxicity.’’,Biochem J, 1990, 266(2), 329–334.
57. C. E. Gavin, K. K. Gunter and T. E. Gunter, ‘‘Mn2þ sequestration bymitochondria and inhibition of oxidative phosphorylation.’’, ToxicolAppl Pharmacol, 1992, 115(1), 1–5.
58. C. E. Gavin, K. K. Gunter and T. E. Gunter, ‘‘Manganese and calciumtransport in mitochondria: implications for manganese toxicity.’’, Neur-otoxicology, 1999, 20(2-3), 445–453.
59. S. Geivanidis, P. Pistikopoulos and Z. Samaras, Effect on exhaustemissions by the use of methylcyclopentadienyl manganese tricarbonyl(MMT) fuel additive and other lead replacement gasolines, Sci.Total Environ, 2003, 305, 129–141.
60. A. M. Geller and H. Zenick, Aging and the environment: a researchframework, Environ Health Perspect, 2005 Sep, 113(9), 1257–1262.
61. D. A. Grimes, et al., Translated mutation in the Nurr1 gene as a cause forParkinson’s disease, Mov Disord, 2006, 21, 906–909.
62. T. R. Guilarte, APLP1, Alzheimer’s-like pathology and neurode-generation in the frontal cortex of manganese-exposed non-humanprimates, Neurotoxicology, 2010 Sep, 31(5), 572–574.
63. T. R. Guilarte, et al., Increased APLP1 expression and neurodegenerationin the frontal cortex of manganese-exposed non-human primates,J Neurochem, 2008, 105, 1948–1959.
64. T. R. Guilarte, et al., Nigrostriatal dopamine system dysfunction andsubtle motor deficits in manganese-exposed non-human primates,Exp Neurol, 2006, 202(2), 381–390.
65. T. R. Guilarte, et al., Impairment of nigrostriatal dopamine neurotrans-mission by manganese is mediated by pre-synaptic mechanism(s): impli-cations to manganese-induced parkinsonism, J Neurochem, 2008, 107(5),1236–1247.
66. K. K. Gunter, M. Aschner, L. M. Miller, R. Eliseev, J. Salter, K.Anderson and T. E. Gunter. ‘‘Determining the oxidation states ofmanganese in NT2 cells and cultured astrocytes.’’ Neurobiol Aging, 2005.
67. K. K. Gunter, M. Aschner, L. M. Miller, R. Eliseev, J. Salter,K. Anderson, S. Hammond and T. E. Gunter, ‘‘Determining theoxidation states of manganese in PC12 and nerve growth factor-inducedPC12 cells.’’, Free Radic Biol Med, 2005, 39(2), 164–181.
68. R. Gwiazda, R. Lucchini and D. R. Smith, Adequacy and consistencyof animal studies to evaluate the neurotoxicity of chronic low levelmanganese exposure in humans, J Toxicol Env Health, 2007, 70, 594–605.
69. R. G. Gwiazda, D. Lee, J. Sheridan and D. R. Smith, Low cumulativemanganese exposure affects striatal GABA but not dopamine, Neur-otoxicology, 2002, 95, 1–8.
Manganese 173
70. D. Hafeman, P. Factor-Litvak, Z. Cheng, A. van Geen and H. Ahsan,Association between manganese exposure through drinking water andinfant mortality in Bangladesh, Environ Health Perspect, 2007, 115,1107–1112.
71. R. Harding and G. Maritz, Maternal and fetal origins of lung disease inadulthood, Semin Fetal Neonatal Med, 2012 Apr, 17(2), 67–72.
72. A. S. Hazell and M. D. Norenberg, Manganese decreases glutamateuptake in cultured astrocytes, Neurochem Res, 1997, 22(12),1443–1447.
73. P. He, D. H. Liu and G. Q. Zhang, [Effects of high-level-manganesesewage irrigation on children’s neurobehavior], Zhonghua Yu Fang Yi XueZa Zhi, 1994, 28, 216–218.
74. Q. He, T. Du, X. Yu, A. Xie, N. Song, Q. Kang, J. Yu, L. Tan, J. Xie andH. Jiang, DMT1 polymorphism and risk of Parkinson’s disease,Neurosci Lett, 2011, 501(3), 128–131.
75. B. C. Henn, J. Kim, M. Wessling-Resnick, M. M. Tellez-Rojo,I. Jayawardene, A. S. Ettinger, M. Hernandez-Avila, J. Schwartz, D.C. Christiani, H. Hu and R. O. Wright, Associations of iron metabolismgenes with blood manganese levels: a population-based study with vali-dation data from animal models, Environ Health, 2011, 10, 97.
76. E. M. Herndon, L. Jin and S. L. Brantley, Soils reveal widespreadmanganese enrichment from industrial inputs, Environ Sci Technol, 2011,45(1), 241–247.
77. A. B. Hill, The environment and disease: Association or causation?,Proceed Roy Soc Medicine – London, 1965, 58, 295–300.
78. E. C. Hirsch and S. Hunot, Neuroinflammation in Parkinson’s disease: atarget for neuroprotection?, Lancet Neurol, 2009, 8, 382–397.
79. HSDB, Hazardous Substances Data Bank. (1998) National Institutes ofHealth, National Library of Medicine, Bethesda, MD.
80. E. Huang, W. Y. Ong and J. R. Connor, Distribution of divalent metaltransporter-1 in the monkey basal ganglia, Neuroscience, 2004, 128(3),487–496.
81. X. Huang, R. D. Moir, R. E. Tanzi, A. I. Bush and J. T. Rogers,Redox-active metals, oxidative stress, and Alzheimer’s disease pathology,Ann N Y Acad Sci, 2004 Mar, 1012, 153–163.
82. H. K. Hudnell, Effects from environmental Mn exposures: a review of theevidence from non-occupational exposure studies, Neurotoxicology, 1999,20(2-3), 379–397.
83. Inside fuels. (2004) ‘‘As MMT gasoline additive use in Canada plummets,use in U.S. may be spreading’’. Inside fuels & Vehicles. Vol. 3, no. 13.Inside Washington Publishers, Washington, DC.
84. T. Jursa and D. R. Smith, Ceruloplasmin alters the tissue disposition andneurotoxicity of manganese, but not its loading onto transferrin,Toxicol Sci, 2009 Jan, 107(1), 182–193.
85. D. Kaur, J. Peng, S. J. Chinta, S. Rajagopalan, D. A. Di Monte,R. A. Cherny and J. K. Andersen, Increased murine neonatal iron intake
174 Chapter 6

results in Parkinson-like neurodegeneration with age, Neurobiol Aging,2007 Jun, 28(6), 907–913.
86. C. Kern, G. Stanwood and D. R. Smith, Pre-weaning manganeseexposure causes hyperactivity, disinhibition, and spatial learning andmemory deficits associated with altered dopamine receptor and trans-porter levels, Synapse, 2010, 64, 363–378.
87. C. Kern and D. R. Smith, Pre-weaning Mn exposure leads to prolongedastrocyte activation and lasting effects on the dopaminergic system inadult male rats, Synapse, 2011, 65(6), 532–544.
88. Khan, K. et al. Manganese Exposure from Drinking Water andChildren’s Classroom Behavior in Bangladesh. Environ Health Perspect(2011). doi:10.1289/ehp.1003397.
89. W. G. Kim, et al., Regional difference in susceptibility tolipopolysaccharide-induced neurotoxicity in the rat brain: role ofmicroglia, J Neurosci, 2000, 20, 6309–6316.
90. Y. Kim, K. S. Jeong, H. J. Song, J. J. Lee, J. H. Seo, G. C. Kim, H. J. Lee,H. J. Kim, J. H. Ahn, S. J. Park, S. H. Kim, Y. J. Kwon and Y. Chang,Altered white matter microstructural integrity revealed by voxel-wiseanalysis of diffusion tensor imaging in welders with manganese exposure,Neurotoxicol, 2011, 32(1), 100–109.
91. C. L. Kwik-Uribe, S. Reaney, Z. Zhu and D. Smith, ‘‘Alterations incellular IRP-dependent iron regulation by in vitro manganese exposure inundifferentiated PC12 cells.’’, Brain Res, 2003, 973(1), 1–15.
92. C. Kwik-Uribe and D. R. Smith, Temporal responses in the disruptionof iron regulation by manganese, J. Neurosci. Res., 2006, 83, 1601–1610.
93. B. P. Lanphear, R. Hornung, J. Khoury, K. Yolton, P. Baghurst,D. C. Bellinger, R. L. Canfield, K. N. Dietrich, R. Bornschein, T. Greene,S. J. Rothenberg, H. L. Needleman, L. Schnaas, G. Wasserman,J. Graziano and R. Roberts, Low-level environmental lead exposure andchildren’s intellectual function: an international pooled analysis, EnvironHealth Perspect, 2005, 13(7), 894–899.
94. W. Le, et al., Decreased NURR1 gene expression in patients with Park-inson’s disease, J. Neurol. Sci, 2008, 273, 29–33.
95. B. K. Lee and Y. Kim. Relationship between blood manganese and bloodpressure in the Korean general population according to KNHANES2008. Environ Res. 2011 Aug, 111(6), 797–803. Epub 2011 May 23.
96. D. W. Lee and J. K. Andersen, Iron elevations in the aging Parkinsonianbrain: a consequence of impaired iron homeostasis?, J Neurochem, 2010Jan, 112(2), 332–339.
97. B. S. Levy and W. J. Nassetta, Neurologic effects of manganese inhumans: a review, Int J Occup Environ Health, 2003, 9, 153–163.
98. G. J. Li, Q. Zhao and W. Zheng, ‘‘Alteration at translational but nottranscriptional level of transferrin receptor expression followingmanganese exposure at the blood-CSF barrier in vitro.’’, ToxicolAppl Pharmacol, 2005, 205(2), 188–200.
Manganese 175

99. G. T. Liberatore, et al., Inducible nitric oxide synthase stimulatesdopaminergic neurodegeneration in the MPTP model of Parkinsondisease, Nat Med, 1999, 5, 1403–1409.
100. A. C. Liu, B. S. Heinrichs and R. M. Leach, Jr. Influence of manganesedeficieny on the characteristics of proteoglycans of avian epiphysealgrowth plate cartilage, Poult-Sci, 1994, 73(5), 663–669.
101. X. Liu, K. A. Sullivan, J. E. Madl, M. Legare and R. B. Tjalkens,Manganese-induced neurotoxicity: the role of astroglial-derived nitric oxidein striatal interneuron degeneration, Toxicol Sci, 2006, 91, 521–531.
102. X. Liu, et al., NF-kappaB-dependent production of nitric oxide byastrocytes mediates apoptosis in differentiated PC12 neurons followingexposure to manganese and cytokines, Brain Res Mol Brain Res, 2005,141, 39–47.
103. R. V. Lloyd, Mechanism of the manganese-catalyzed autoxidation ofdopamine, Chem Res Toxicol, 1995, 8, 111–116.
104. R. Lucchini, L. Selis, D. Folli, P. Apostoli, A. Mutti, O. Vanoni,A. Iregren and L. Alessio, Neurobehavioral effects of manganese inworkers from a ferroalloy plant after temporary cessation of exposure,Scand J Work Environ Health, 1995, 21(2), 143–149.
105. R. Lucchini, E. Bergamaschi, A. Smargiassi, D. Festa and P. Apostoli,Motor function, olfactory threshold, and hematological indices inmanganese-exposed ferroalloy workers, Environ Res, 1997, 73(1-2),175–180.
106. R. Lucchini, P. Apostoli, C. Perrone, D. Placidi, E. Albini, P. Migliorati,D. Mergler, M. P. Sassine, S. Palmi and L. Alessio, Long-term exposureto ‘‘low levels’’ of manganese oxides and neurofunctional changes inferroalloy workers, Neurotoxicology, 1999, 20(2-3), 287–297.
107. R. Lucchini, L. Benedetti, S. Borghesi, S. Garattini, G. Parrinello andL. Alessio, Exposure to neurotoxic metals and prevalence of parkin-sonian syndrome in the area of Brescia, G Ital Med Lav Ergon, 2003,25(Suppl(3)), 88–89.
108. R. G. Lucchini, and Y. Kim (2009) Health effects of manganese. In:M. Vojtisek, R. Prakash (eds) Metals and Neurotoxicity. JALGAON:Society for science and environment, ISBN/ISSN: 81-85543-09-7,pp. 119–147.
109. R. G. Lucchini, C. J. Martin and B. C. Doney, From manganism tomanganese-induced parkinsonism: a conceptual model based on theevolution of exposure, Neuromolecular Med, 2009, 11(4), 311–321.
110. R. G. Lucchini, S. Guazzetti, S. Zoni, F. Donna, S. Peter, A. Zacco,M. Salmistraro, E. Bontempi, N. J. Zimmerman, and D. R. Smith.Tremor, olfactory and motor changes in Italian adolescents exposed tohistorical ferro-manganese emission. Neurotoxicology. 2012 Jan 31. [Epubahead of print].
111. A. P. Marreilha Dos Santos, M. Lopes Santos, M. C. Batoreu andM. Aschner, Prolactin is a peripheral marker of manganese neurotoxicity,Brain Res, 2011 Mar, 25(1382), 282–290.
176 Chapter 6

112. C. Martin, Manganese neurotoxicity: Connecting the dots along thecontinuum of dysfunction, Neurotoxicol, 2006, 27, 347–349.
113. S. A. McDougall, et al., Postnatal manganese exposure alters dopaminetransporter function in adult rats: Potential impact on nonassociative andassociative processes, Neuroscience, 2008, 154(2), 848–860.
114. P. McLaughlin, et al., Proteomic analysis of microglial contribution tomouse strain-dependent dopaminergic neurotoxicity,Glia, 2006, 53, 567–582.
115. J. A. Menezes-Filho, O. Novaes Cde, J. C. Moreira, P. N. Sarcinelli andD. Mergler, Elevated manganese and cognitive performance in school-aged children and their mothers, Environ Res, 2011, 111(1), 156–163.
116. D. Mergler, et al., Manganese neurotoxicity, a continuum of dysfunction:results from a community based study, Neurotoxicology, 1999, 20(2-3),327–342.
117. D. Mergler, G. Huel, R. Bowler, A. Iregren, S. Belanger, M. Baldwin,R. Tardif, A. Smargiassi and L. Martin, Nervous system dysfunctionamong workers with long-term exposure to manganese, Environ Res,1994, 64(2), 151–180.
118. D. Mergler and M. Baldwin, Early manifestations of manganese neur-otoxicity in humans: An update, Env Res, 1997, 73, 92–100.
119. D. B. Milne, R. L. Sims and N. V. Ralston, Manganese content of thecellular components of blood, Clin Chem, 1990, 36, 450–452.
120. R. M. Molina, S. Phattanarudee, J. Kim, K. Thompson,M. Wessling-Resnick, T. J. Maher and J. D. Brain, Maternal Ingestion ofMn and Pbby rats during and after pregnancy alters iron metabolism andbehavior in offspring, Neurotoxicology, 2011, 32, 413–422.
121. S. Montes, A. Schilmann, H. Riojas-Rodriguez, Y. Rodriguez-Agudelo,R. Solis-Vivanco, S. L. Rodriguez-Dozal, L. A. Tristan-Lopez andC. Rios, Serum prolactin rises in Mexican school children exposed toairborne manganese, Environ Res, 2011, 111(8), 1302–1308.
122. J. A. Moreno, et al., Age-dependent susceptibility to manganese-inducedneurological dysfunction, Toxicological Sciences, 2009, 112, 394–404.
123. J. A. Moreno, K. M. Streifel, K. A. Sullivan, M. E. Legare andR. B. Tjalkens, Developmental exposure to manganese increases adultsusceptibility to inflammatory activation of glia and neuronal proteinnitration, Toxicological Sciences, 2009, 112, 405–415.
124. J. A. Moreno, K. A. Sullivan, D. L. Carbone, W. H. Hanneman andR. B. Tjalkens, Manganese potentiates nuclear factor-kappaB-dependentexpression of nitric oxide synthase 2 in astrocytes by activating solubleguanylate cyclase and extracellular responsive kinase signaling pathways,J Neurosci Res, 2008, 86, 2028–2038.
125. Mukhopadhyay S, Bachert C, Smith DR, Linstedt AD. Manganese-induced trafficking and turnover of the cis-Golgi glycoprotein GPP130.Mol Biol Cell 21: 1282–1292, 2010 (E-pub: Feb 3, 2010).
126. L. Mutkus, et al., The in vitro uptake of glutamate in GLAST and GLT-1transfected mutant CHO-K1 cells is inhibited by manganese, Biol TraceElem Res, 2005, 107(3), 221–230.
Manganese 177

127. J. E. Myers, J. teWaterNaude, M. Fourie, H. B. Zogoe, I. Naik,P. Theodorou, H. Tassel, A. Daya and M. L. Thompson, Nervous systemeffects of occupational manganese exposure on South African manganesemineworkers, Neurotoxicology, 2003 Aug, 24(4-5), 649–656.
128. J. E. Myers, M. L. Thompson, I. Naik, P. Theodorou, E. Esswein,H. Tassell, A. Daya, K. Renton, A. Spies, J. Paicker, T. Young,M. Jeebhay, S. Ramushu, L. London and D. J. Rees, The utility ofbiological monitoring for manganese in ferroalloy smelter workers inSouth Africa, Neurotoxicology, 2003, 24(6), 875–883.
129. H. Nakano, et al., Differential regulation of IkappaB kinase alpha andbeta by two upstream kinases, NF-kappaB-inducing kinase and mitogen-activated protein kinase/ERK kinase kinase-1, Proc Natl Acad Sci USA,1998, 95, 3537–3542.
130. National Research Council (1989) Recommended dietary allowances.National Research Council. Washington DC. pp. 231–235.
131. National Research Council. Measuring Lead Exposure in Infants,Children, and Other Sensitive Populations; National Academy Press:Washington D.C., 1993.
132. G. Nelson, S. R. Criswell, J. Zhang, J. Murray, and B. A. Racette.Research capacity development in South African manganese mines tobridge exposure and neuropathologic outcomes. Neurotoxicology. 2012Jan 31. [Epub ahead of print].
133. K. Pantopoulos, ‘‘Iron metabolism and the IRE/IRP regulatory system:an update.’’, Ann N Y Acad Sci, 2004, 1012, 1–13.
134. A. Pentschew, F. F. Ebner and R. M. Kovatch, Experimental manganeseencephalopathy in monkeys. A preliminary report, J NeuropatholExp Neurol, 1963, 22, 488–499.
135. R. O. Pihl and M. Parkes, Hair element content in learning disabledchildren, Science, 1977, 198, 204–206.
136. J. L. Rapoport and N. Gogtay, Brain neuroplasticity in healthy, hyper-active and psychotic children: insights from neuroimaging, Neur-opsychopharmacology, 2008, 33, 181–197.
137. S. Reaney, C. Kwik-Uribe and D. Smith, Manganese Oxidation Stateand Its Implications for Toxicity, Chem. Res. Toxicol., 2002, 15,1119–1126.
138. S. H. Reaney and D. R. Smith, Manganese oxidation state mediatestoxicity in PC12 cells, Toxicol. Appl. Pharmacol., 2005, 205(3), 271–281.
139. S. Reaney, G. Bench and D. Smith, Brain accumulation and toxicity ofMn(II) and Mn(III) exposures, Tox. Sci, 2006, 93(1), 114–124.
140. C. M. Reichel, et al., Postnatal manganese exposure attenuates cocaine-induced locomotor activity and reduces dopamine transporters in adultmale rats, Neurotoxicology and Teratology, 2006, 28(3), 323–332.
141. H. Riojas-Rodriguez, R. Solis-Vivanco, A. Schilmann, S. Montes,S. Rodriguez, C. Rios and Y. Rodrıguez-Agudelo, Intellectual function inMexican children living in a mining area and environmentally exposed tomanganese, Environ Health Perspect, 2010, 118(10), 1465–1470.
178 Chapter 6

142. J. F. Risher, G. D. Todd, D. Meyer and C. L. Zunker, The elderly as asensitive population in environmental exposures: making the case, RevEnviron Contam Toxicol, 2010, 207, 95–157.
143. H. Rollin, A. Mathee, J. Levin, P. Theodorou and F. Wewers, Bloodmanganese concentrations among first-grade schoolchildren in two SouthAfrican cities, Env Res, 2005, 97(1), 93–99.
144. H. Roels, R. Lauwerys, J. P. Buchet, P. Genet, M. J. Sarhan, I. Hanotiau,M. de Fays, A. Bernard and D. Stanescu, Epidemiological survey amongworkers exposed to manganese: effects on lung, central nervous system,and some biological indices, Am J Ind Med, 1987, 11(3), 307–327.
145. H. A. Roels, P. Ghyselen, J. P. Buchet, E. Ceulemans andR. R. Lauwerys, Assessment of the permissible exposure level tomanganese in workers exposed to manganese dioxide dust, Br J Ind Med,1992, 49(1), 25–34.
146. H. A. Roels, M. I. Ortega Eslava, E. Ceulemans, A. Robert and D. Lison,Prospective study on the reversibility of neurobehavioral effects inworkers exposed to manganese dioxide, Neurotoxicology, 1999 Apr-Jun,20(2-3), 255–71.
147. H. A. Roels, R. M. Bowler, Y. Kim, B. Claus Henn, D. Mergler, P. Hoet,V. V. Gocheva, D. C. Bellinger, R. O. Wright, M. G. Harris, Y. Chang,M. F. Bouchard, H. Riojas-Rodriguez, J. A. Menezes-Filho and M.M. Tellez-Rojo, Manganese exposure and cognitive deficits: A growingconcern for manganese neurotoxicity, Neurotoxicology, 2012 Apr, 3.[Epub ahead of print].
148. J. A. Roth and M. D. Garrick, Iron interactions and other biologicalreactions mediating the physiological and toxic actions of manganese,Biochem Pharmacol, 2003, 66, 1–13.
149. K. Saijo, et al., A Nurr1/CoREST pathway in microglia and astrocytesprotects dopaminergic neurons from inflammation-induced death, Cell,2009, 137, 47–59.
150. J. Salazar, N. Mena, S. Hunot, A. Prigent, D. Alvarez-Fischer,M. Arredondo, C. Duyckaerts, V. Sazdovitch, L. Zhao, L. M. Garrick,M. T. Nunez, M. D. Garrick, R. Raisman-Vozari and E. C. Hirsch,Divalent metal transporter 1 (DMT1) contributes to neurodegeneration inanimal models of Parkinson’s disease, Proc Natl Acad Sci U S A, 2008,105(47), 18578–18583.
151. J. Schroeter, D. Dorman, M. Yoon, A. Nong, M. Taylor, M. E. Andersenand H. Clewell, Application of a Multi-Route Physiologically-BasedPharmacokinetic Model for Manganese to Evaluate Dose-DependentNeurological Effects in Monkeys, Toxicol Sci, 2012 Jun, 21. [Epub aheadof print].
152. D. R. Smith, R. Gwiazda, H. Roels, R. Park, R. Bowler, P. Apostoli andR. Lucchini, Biomarkers of Mn exposure in humans, Am. J. Ind. Med.,2007, 50(11), 801–811.
153. F. Spadoni, et al., Selective vulnerability of pallidal neurons in the earlyphases of manganese intoxication, Exp Brain Res, 2000, 135(4), 544–51.
Manganese 179

154. M. Spranger, et al., Manganese augments nitric oxide synthesis in murineastrocytes: a new pathogenetic mechanism in manganism?, Exp Neurol,1998, 149, 277–283.
155. K. Sriram, G. X. Lin, A. M. Jefferson, J. R. Roberts, R. S. Chapman, B.T. Chen, J. M. Soukup, A. J. Ghio and J. M. Antonini, Dopaminergicneurotoxicity following pulmonary exposure to manganese-containingwelding fumes, Arch Toxicol, 2010, 84(7), 521–540.
156. K. M. Streifel, J. A. Moreno, W. H. Hanneman, M. E. Legare andR. B. Tjalkens, Gene Deletion of nos2 Protects Against Manganese-Induced Neurological Dysfunction in Juvenile Mice,Toxicological Sciences, 2012, 126, 183–192.
157. L. Takser, D. Mergler, G. Hellier, J. Sahuquillo and G. Huel, Manganese,monoamine metabolite levels at birth, and child psychomotor devel-opment, Neurotoxicol, 2003, 24(4-5), 667–674.
158. K. Thompson, R. M. Molina, T. Donaghey, J. E. Schwob, J. D. Brain andM. Wessling-Resnick, Olfactory uptake of manganese requires DMT1and is enhanced by anemia, FASEB J, 2007, 21, 223–230.
159. R. B. Tjalkens, et al., The peroxisome proliferator-activated receptor-gamma agonist 1,1-bis(3’-indolyl)-1-(p-trifluoromethylphenyl)methanesuppresses manganese-induced production of nitric oxide in astrocytesand inhibits apoptosis in cocultured PC12 cells, J Neurosci Res, 2008, 86,618–629.
160. G. Tsivgoulis, I. Heliopoulos, K. Vadikolias, P. Argyropoulou andC. Piperidou, Ingestion of gasoline in a suicide attempt: an uncommoncause of bilateral basal ganglia T1 hyperintensities, Neurol Sci, 2011,32(4), 739–740.
161. J. J. Villafranca and A. S. Mildvan, ‘‘The mechanism of aconitase action.II. Magnetic resonance studies of the complexes of enzyme,manganese(II), iron(II), and substrates.’’, J Biol Chem, 1971, 246(18),5791–5798.
162. M. P. Walsh, The global experience with lead in gasoline and the lessons weshould apply to the use of MMT, Am J Ind Med, 2007, 50(11), 853–860.
163. G. A. Wasserman, X. Liu, F. Parvez, H. Ahsan, D. Levy,P. Factor-Litvak, J. Kline, A. van Geen, V. Slavkovich, N. J. LoIacono,Z. Cheng, Y. Zheng and J. H. Graziano, Water manganese exposure andchildren’s intellectual function in Araihazar, Bangladesh, EnvironHealth Perspect, 2006, 114(1), 124–129.
164. A. W. Willis, B. A. Evanoff, M. Lian, A. Galarza, A. Wegrzyn,M. Schootman and B. A. Racette, Metal emissions and urban incidentParkinson disease: a community health study of Medicare beneficiaries byusing geographic information systems, Am J Epidemiol, 2010 Dec 15,172(12), 1357–1363.
165. R. O. Wright, C. Amarasiriwardena, A. D. Woolf, R. Jim and D.C. Bellinger, Neuropsychological correlates of hair arsenic, manganese,and cadmium levels in school-age children residing near a hazardouswaste site, Neurotoxicology, 2006, 27(2), 210–216.
180 Chapter 6

166. M. Yamada, et al., Chronic manganese poisoning: a neuropathologicalstudy with determination of manganese distribution in the brain,Acta Neuropathol, 1986, 70, 273–278.
167. W. Zheng, S. Ren and J. H. Graziano, ‘‘Manganese inhibits mito-chondrial aconitase: a mechanism of manganese neurotoxicity.’’Brain Res, 1998, 799(2), 334–342.
168. W. Zheng, Q. Zhao, V. Slavkovich, M. Aschner and J. H. Graziano,Alteration of iron homeostasis following chronic exposure to manganesein rats, Brain Res, 1999, 833(1), 125–132.
169. W. Zheng and Q. Zhao, Iron overload following manganese exposure incultured neuronal, but not neuroglial cells, Brain Res, 2001, 897(1–2),175–179.
170. S. Zoni, G. Bonetti and R. G. Lucchini, Olfactory functions at theintersection between environmental exposure to manganese and parkin-sonism, J Trace Elem Med Biol, 2012, 26(2-3), 179–182.
171. C. Zwingmann, D. Leibfritz and A. S. Hazell, ‘‘Energy metabolism inastrocytes and neurons treated with manganese: relation among cell-specific energy failure, glucose metabolism, and intercellular traffickingusing multinuclear NMR-spectroscopic analysis.’’ J Cereb Blood FlowMetab, 2003, 23(6), 756–771.
172. C. Zwingmann, D. Leibfritz and A. S. Hazell, ‘‘Brain energy metabolismin a sub-acute rat model of manganese neurotoxicity: an ex vivo nuclearmagnetic resonance study using [1-13C]glucose.’’ Neurotoxicology, 2004,25(4), 573–587.
Manganese 181
CHAPTER 7
The Role of Persistent OrganicPollutants and Plastic-AssociatedChemicals in CardiovascularDisease and Metabolic Syndrome
LARS LINDa AND P. MONICA LIND*b
aDept of Medical Sciences, Uppsala University, University Hospital Uppsala751 85, Sweden; bOccupational and Environmental Medicine, UppsalaUniversity, Ullerakersvagen 40 Uppsala 751 85, Sweden*E-mail: [email protected]
7.1 Introduction
Cardiovascular (CV) diseases are the main cause of death in high-incomecountries. As previously low-income countries like China and India becomeindustrialized, the incidence rates of CV diseases are rising. Among CVdiseases, the major killers are myocardial infarction, stroke, and heart failure.All of these diseases are mainly encountered in the elderly.
The incidence rate for myocardial infarction peaked in the 1970s, andthereafter a decline has been noted in high-income countries.1,2 This has beenattributed to a reduction in LDL-cholesterol levels and a drop in smokingprevalence in the last few decades. A reduction in stroke incidence has also beenseen in the high-income countries,3,4 although this is less than the decline seen
Issues in Toxicology No. 16
Aging and Vulnerability to Environmental Chemicals: Age-related Disorders and their Origins in
Environmental Exposures
Edited by Bernard Weiss
r The Royal Society of Chemistry 2013
Published by the Royal Society of Chemistry, www.rsc.org
182

for myocardial infarction. The major risk factor for stroke is hypertension,which is more recognized today than some decades ago.
Regarding heart failure, community-based cohorts have presentedconflicting results. Data from the Framingham study suggests that theincidence of heart failure may be declining among women, but not men.5 Incontrast, an analysis of data from Olmsted County, Minnesota, implied thatthe incidence of heart failure has remained stable during the past 20 years inboth men and women and that men and patients aged 70 years or younger haveexperienced disproportionate gains in survival.6 More recently, even anincrease in incidence was observed in an elderly, community-based, managed-care population followed from the early 1970s to the early 1990s.7 Previousmyocardial infarction and hypertension are the major risk factors for heartfailure.
Clustering of several CV risk factors in the same individual is nowadaysgenerally denoted metabolic syndrome (MetS). Although described in generalterms as early as the 1930s, the MetS was described in its present form byseparate groups, including us, in 1988.8,9 Several definitions of the MetS exist,but in epidemiology, the NCEP/ATP III-criteria are the most commonlyused.10 By this definition, a subject with the MetS should show at least threedeviations out of five in visceral obesity, blood pressure, high triglyceride levels,low HDL, and impaired glucose tolerance. This is generally seen in 15–30% ofpopulations in Europe and the US.11 Although the role of insulin resistance asthe underlying pathophysiological driver of metabolic syndrome wasemphasized in the past,9 it is today generally believed that visceral accumu-lation of adipose tissue is the main driver of metabolic syndrome. Theusefulness of metabolic syndrome as a separate entity has been questioned. Thisis because it has been shown that the magnitude of risk of future cardiovascularevents associated with having metabolic syndrome is not greater than the sumof the risks associated with the individual components of the syndrome.12,13
Thus, although metabolic syndrome does not include any unique informationin terms of risk prediction, it is useful as a descriptive term for patients withmultiple risk factors.
As the prevalence of the MetS is increasing in both high and low-incomecountries, it is anticipated that the incidence rates of myocardial infarction andheart failure will start to increase again due to the higher burden of risk factorsthat will accompany the obesity epidemic seen worldwide.
The number of man-made chemicals used in our environment has increaseddramatically during recent decades. More than 100 000 chemical substances areregistered in the EU (http://www.echa.europa.eu/). Although the toxicity ofcertain pollutants, like lead and arsenic, has been known for years, potentialdeleterious health effects of most other substances are largely unknown.
One area of major concern is that several of the high-volume producedchemicals could interfere with the basal hormonal systems governing funda-mental homeostatic systems in our bodies. Therefore, the term, ‘‘endocrinedisruption’’ has been coined to describe this general action of some environmentalcontaminants. Actions of environmental contaminants on the reproductive
The Role of Persistent Organic Pollutants and Plastic-Associated Chemicals 183

system, the glucocorticoid hormones and thyroid hormones have been described,and have resulted in the ban of dichlorodiphenyltrichloroethane (DDT) andpolychlorinated biphenyls (PCBs) in many parts of the world during the 1970sand 1980s.
Many of the compounds regarded as endocrine disruptors are highly lipo-philic chemicals that accumulate in adipose tissues, resulting in a long half-life.They are collectively named persistent organic pollutants (POPs), and anumber of these chemicals have been identified as deleterious to health andhave been listed at the Stockholm convention. Amongst those listed areorganochlorine pesticides, such as hexachlorobenzene (HCB) and DDT,various chlordanes, PCBs, dioxins, brominated flame retardants, and fluor-inated compounds.
A group of less persistent organic chemicals that has received attention inrecent years is plastic associated compounds (PACs). Amongst these, the healtheffects of bisphenol A (BPA) have been highlighted, as well as that of differentphthalates. These chemicals have a considerably shorter half-life than thePOPs, but could nevertheless act as endocrine disrupters. Since humans areexposed to these chemicals on a daily basis, measurable circulating levelsof BPA, as well as phthalate metabolites, are seen in most individuals.14
However, since analytic capacity for large-scale measurements of PACs hasonly been available for a few years, data on PACs are limited compared to dataon POPs.
The present review will focus on evidences in humans of a relationshipbetween POP and PAC exposure and metabolic syndrome and cardiovasculardisease. We will mainly consider data from cross-sectional and longitudinalstudies and population-based studies, but will also consider evidences fromoccupational studies, geographical studies, and accidents, if appropriate.A more extensive review on this topic has recently been published.15
7.2 Metabolic Syndrome
The term, ‘metabolic syndrome’ is a descriptive term regarding subjects with aclustering of cardio-metabolic risk factors. Although described by a couple ofgroups in 1988,8,9 the first uniform definition of the syndrome came in a WHOreport in 1998.16 This definition of the syndrome was much governed by thethought that insulin resistance is the driver of the syndrome. Consequently,insulin resistance was amongst the major criteria of that definition. Sinceinsulin resistance is very seldom evaluated in clinical practice, this definition ofthe syndrome has never been frequently used.
In 2001, the NCEP/ATPIII panel suggested a different definition of thesyndrome, based on the idea that visceral obesity is the main driver of thesyndrome10 (See Table 7.1).
This definition uses five criteria commonly used in clinical practice: bloodpressure, fasting blood glucose, serum triglycerides, HDL-cholesterol, andwaist circumference; metabolic syndrome is considered to be present if a subject
184 Chapter 7

shows deviations in three or more of these five criteria (see Table 7.1 for detailsregarding cut-off limits). This definition of metabolic syndrome has been usedextensively in clinical research. Although other definitions have been proposed,the so-called NCEP-definition was widely accepted following some minormodifications.
Only a couple of studies have evaluated whetehr POPs or PACs are related tometabolic syndrome. Both of these studies used the US-based National Healthand Nutrition Examination Survey (NHANES) study as the evaluated sample.The NHANES is a program of studies designed to assess the health andnutritional status of adults and children in the US. For more than a decade, thesurvey has examined a nationally representative sample of about 5000 personseach year. These persons are located in counties across the country, 15 of whichare visited each year. NHANES is a cross-sectional survey and does not includefollow-up data on future diseases.
Lee and co-workers studied the relationships between POPs and theprevalence of metabolic syndrome in the NHANES 1999–2002 examinationcycles.17 They used data on 19 different POPs in 721 subjects who were freefrom diabetes in a cross-sectional fashion. The POPs were divided into 5classes: polychlorinated dibenzo-p-dioxins (PCDDs), polychlorinated diben-zofurans (PCDFs), dioxin-like PCBs, non-dioxin-like PCBs, and OC pesticides.Almost a quarter (24%) of the population showed metabolic syndrome. Themost striking association between POPs and metabolic syndrome was seen forthe OC pesticides. In this case, subjects in the fourth quartile of OC pesticidelevels showed more than a five-fold increased risk of having metabolicsyndrome compared to subjects with the lowest levels [OR 5.3 (95% CI2.5–11.3), po0.01] following adjustment for multiple confounding variables(age, sex, race, poverty index, cigarette smoking, serum cotinine, alcoholconsumption, and exercise). Additional adjustment for BMI only marginallyaffected the risk. Associations between metabolic syndrome and dioxin-likePCBs and non-dioxin-like PCBs were also observed, although the increasedrisk was lower for these POPs (OR 2.0–2.2). One striking finding for the PCBswas that the maximal risk was generally not found in the highest quartile butrather in the 3rd quartile. Especially for the non-dioxin PCBs, the risk was notincreased in those with the highest levels, suggesting non-monotonicrelationships.
Table 7.1 Definition of the metabolic syndrome using the NECP/ATP IIIcriteria (NECP 2001). The metabolic syndrome is considered to bepresent if 3 or more of the 5 criteria presented in the table arepresent.
Blood pressure 4130/85 mm Hg or antihypertensive treatmentFasting blood glucose 45.6 mmol L�1
Serum triglycerides 41.7 mmol L�1
Waist circumference 4102 cm in men and 488 cm in womenHDL-cholesterol o1.0 mmol L�1 in men and o1.3 L�1 in women
The Role of Persistent Organic Pollutants and Plastic-Associated Chemicals 185

The authors also investigated how the five different components of thesyndrome were related to the POP levels. An increased waist circumference wasmainly related to non-dioxin PCBs and OC pesticides. Increased serum trig-lyceride levels were mainly related to dioxin-like PCBs and OC pesticides, whileonly OC pesticide levels were related to low HDL-cholesterol. Elevated bloodpressure was only related to PCDFs, while increased fasting glucose was mainlyrelated to non-dioxin PCBs and OC pesticides.
Thus this important study disclosed that POPs are related to metabolicsyndrome, that different components of metabolic syndrome might beassociated with different types of POPs, and that the relationships might notalways be linear, suggesting that low-dose effects of POPs might be present.
The same research team also conducted a case-control study of 50 subjectswith metabolic syndrome and 50 age and sex-matched healthy controlsrandomly selected from a health survey conducted in South Korea.18 EightOC pesticides were evaluated. Significantly higher levels of beta-hexachlorocyclohexane and heptachlor epoxide were found in the subjects withmetabolic syndrome compared to the controls (po0.01). Also, trans-nonachlortended to be elevated amongst the subjects with metabolic syndrome, while nomajor differences were seen for DDT, DDE or hexachlorobenzene. Beta-hexachlorocyclohexane was mainly related to elevated blood pressure, whileheptachlor epoxide levels were related to all of the five components ofmetabolic syndrome. In this case, the associations were no longer significantwhen adjusted for BMI.
Originating from the same research group, a report regarding theassociations between brominated flame retardants and metabolic syndromeusing data from the NHANES 2003–2004 examination cycle has also beenpublished.19 They used 637 subjects in this cross-sectional analysis, and studiedsix different brominated flame retardants: polybrominated biphenyl 153 (PBB153) and the polybrominated diphenyl ethers 28 (PBDE 28), 47, 99, 100, and153. In the sample, 37% showed metabolic syndrome and mean age was 50years. PBB 153 levels were associated with an increased risk of havingmetabolic syndrome (OR 3.1 (95% CI 1.4–6.5), po0.01) following adjustmentfor age, sex, race, poverty index, cigarette smoking, serum cotinine, alcoholconsumption, and exercise. Also, PBDE 153 levels showed a similar rela-tionship, although not as powerful (OR 2.5). Just as observed for some of thePOPs, non-monotonic relationships were seen for both of these brominatedcompounds, with increased risk already at very modest increased levels,suggesting low-dose effects.
When PBB 153 and PBDE 153 levels were related to the different componentsof metabolic syndrome, relationships were found mainly in relation to elevatedserum triglyceride levels. However, when related to prevalent diabetes, bothincreased PBB 153 and PBDE 153 levels were associated with an increased riskof prevalent diabetes with ORs in the range of 1.9–2.7.
The only other research group that has paid attention to the relationshipbetween metabolic syndrome and environmental contaminants is a Japaneseteam.20 In a health survey conducted in different parts of Japan, 1374 subjects
186 Chapter 7

not occupationally exposed to dioxins and related compounds were inves-tigated. It was found that 12% of the population showed metabolic syndromeusing a modified version of the NCEP criteria. The investigators calculated thetoxic equivalents (TEQs) for a total of 29 PCDDs, PCDFs, and dioxin-likePCBs. Belonging to the upper quartile of total TEQ was associated with a 5.3increased risk of having metabolic syndrome (95% CI 2.3–13, po0.01),following adjustment for age, sex, smoking, alcohol habits, regional area, andsurvey year. Also, when TEQ was calculated separately for the three differentgroups of compounds (PCDDs, PCDFs, and dioxin-like PCBs), the TEQs foreach of these groups were all related to the risk of metabolic syndrome (OR3.2–4.8). Similar results were obtained if diabetics were excluded from theanalysis.
When the five components of metabolic syndrome were related to TEQvalues, all components of metabolic syndrome, except the modified obesitycriteria using BMI instead of waist circumference (p¼ 0.07), were significantlyrelated to total TEQ. Only for dioxin-like PCBs was TEQ related to the obesitycriteria. In general, for all three groups of compounds (PCDDs, PCDFs, anddioxin-like PCBs), TEQ was related to the four other components of metabolicsyndrome ( with the exception of TEQ for PCDFs and low HDL-cholesterol).In most cases, monotonic relationships between TEQ values and prevalentmetabolic syndrome were observed.
While most of the PCDDs and PCDFs investigated were related to the risk ofhaving metabolic syndrome, a striking difference was seen between differentPCB congeners. PCB 126, 105, 114, 118, 123, and 167 were all significantlyrelated to prevalent metabolic syndrome, with ORs in the 4.1 to 9.1 range forthe highest versus lowest quartile. The PCBs 156, 157, 169, and 189 were farfrom being related to metabolic syndrome. Thus, although the TEQs for thedioxin-like PCBs were related to the risk of metabolic syndrome, it is evidentthat not all PCBs are similar in this respect.
As previously discussed, metabolic syndrome is a combination of thecommon cardiovascular risk factors, dyslipidemia, diabetes, hypertension, andabdominal obesity. Of those risk factors, diabetes is the condition mostfrequently studied. Five prospective studies have uniformly shown that highlevels of the OC pesticide, p,p0-DDE are related to future diabetes.21–25 Most,but not all, of these studies also show that high levels of PCBs increase the riskof incident diabetes.21,24,25 The five studies are very different with respect to theage at inclusion of the samples, the duration of the follow-up, and the calendartime when the measurements were performed. These discrepancies make themhard to compare. In our own cohort study, the Prospective Investigation of theVasculature in Uppsala Seniors (PIVUS) study, we measured 19 POPs inalmost 1000 subjects, all aged 70 years, and followed the development ofdiabetes in 5 years.25 During this period, 36 incident diabetes cases emerged.Subjects in the highest quintile of a summary measure of the 16 evaluated PCBsshowed a 7.5-fold increase in the risk of future diabetes (95% CI 1.4–38.8,po0.01), following adjustment for sex, BMI, cigarette smoking, exercise,alcohol consumption, triglycerides, and total cholesterol. The corresponding
The Role of Persistent Organic Pollutants and Plastic-Associated Chemicals 187

OR for those with the highest levels of a summary measure of threeOC pesticides were 3.4 (1.0–11.7, p¼ 0.03). A point of note is that PCB levelswere a more powerful predictor of future diabetes than BMI (or waistcircumference), even following adjustment for BMI. This is quite remarkablesince obesity is regarded to be the major predictor of diabetes development inthe elderly.
Several cross-sectional or case-control studies support the view that PCBsand OC pesticides are related to diabetes.26–36 Furthermore, other types ofstudies—such as investigations of US Vietnam veterans who had been sprayingthe dioxin-containing compound, ‘‘Agent Orange’’,37–42 victims from a PCBaccident in Taiwan,43 and a geographical study of individuals living close toPOP-contaminated waste sites in New York44—also support the view thatPOPs could be involved in the development of diabetes.
Regarding hypertension, data are scarce compared to diabetes. There ishowever, an investigation using NHANES-data,45 and a study from a POPcontaminated in Aniston in the US, showing relationships between POPs andhypertension.46 Furthermore, the Vietnam veterans studies41 and thegeographical study from New York47 also support the view that POP exposureis related to hypertension.
Lipid disturbances and obesity are harder to study in terms of POP exposurethan hypertension and diabetes, since POPs are highly lipid soluble, beingtransported by lipoproteins, and accumulate in the adipose tissue. Thus, if lipidparameters or obesity measures are used as outcomes, it is not evident whetheror not the circulating levels used to determine exposure are affected by theoutcome in a major way, and how this will affect the analysis of the relationshipbetween the POP levels and lipids or obesity. A large fat mass will ‘‘protect’’ thecirculation from POPs by binding the compounds to the adipose tissue for acertain period in relation to the metabolism of the individual compounds. Thus,if a population is exposed to a certain amount of a POP at a certain time-point,a lean subject will initially have higher circulating levels of that POP than anobese subject, due to the lipid soluble character of the POP. During this initialphase, a negative relationship between the POP levels and BMI would be seen.However, due to the more rapid metabolism of the POP in the lean subjects, thecirculating levels (and also the adipose tissue levels) will decline faster in thelean subjects and at some time point, estimated to be 2–3 times half-lives ofthe POP, the former negative relationship between BMI and the POP will turninto a positive relationship, as nicely illustrated by Wolff and co-workers.48
This change in the sign of the relationship between POP levels and obesity willtake place earlier for compounds with a shorter half-life compared withsubstances with a long half-life. This toxicokinetic pattern does, however,presume no further exposure of the POP and a constant fat mass, twoprerequisites that are hard to achieve in real life.
Despite these problems with the evaluation of relationships between POPlevels and lipid disturbances and obesity, several papers have been published onthese topics. Using occupational exposure to high levels of dioxins and otherPOPs, some studies have been able to show increased levels of lipids, like
188 Chapter 7

cholesterol and triglycerides, in exposed subjects.6,49–51 Furthermore, ageographical study comparing subjects living in contaminated areas withmatched non-contaminated areas have pointed in the same direction.52
Also, a number of studies have investigated relationships between POP levelsand obesity in adults. Some of these studies have found positive relationshipsbetween POP levels and various obesity measurements,24,53 but in the PIVUSstudy, we found that PCBs with a short half-life showed positive relations inrelation to waist circumference or fat mass, while PCBs with a long half-lifeshowed negative relationships.54 The same pattern was seen regardless ofwhether we used a cross-sectional approach to analyze the data,54 or weevaluated incident cases of abdominal obesity during a five year follow-upperiod.55 It is likely that the toxicokinetic problems discussed contributed tothese discrepancies between different PCBs. It is therefore likely that study ofenvironmental ‘‘obesogens’’ is better carried out in mother–child cohorts than inadult and elderly cohorts if the compounds to be studied are highly lipid-soluble.
Amongst the POPs, the perfluorinated compounds are not highly lipid-soluble and are therefore not subject to the same problems as the majority ofPOPs. In a large US cross-sectional population-based study, an association wasfound between PFOS/PFOA levels and serum cholesterol.56 Also, in a cross-sectional study of 1025 active workers with potential exposure to PFOA,circulating levels of this compound were associated with LDL-cholesterol.57
No studies on the relationships between plastic associated chemicals (PACs)and metabolic syndrome exist. However, some studies exist on the associationsin relation to different components of the syndrome. Using data on 1455subjects included in the 2003–2004 examination cycle of the NHANES study,Lang and co-workers showed that urinary levels of BPA were increased inrelation both to diabetes prevalence and to BMI.58 One increase in standarddeviation of measured BPA levels was associated with a 1.39 times increasedrisk of prevalent diabetes, following adjustment for age, sex , race, education,income, smoking, BMI, and waist circumference (95% CI 1.21–1.60, po0.001).They also showed that obese subjects excreted almost double the amount ofBPA compared to lean subjects. BPA has a half-life of only a few hours andalmost all BPA is excreted within 24h following a single dose. However, in asimilar analysis of the NHANES 2005–2006 cycle, the associations betweenurinary BPA and diabetes was less evident.59
We have also recently shown that circulating levels of BPA is related to LDL-cholesterol in the PIVUS study.60
Due to the very high abundance of phthalates in the environment, includingthe laboratory, it is hardly possible to measure the parent phthalatecompounds. Instead, the mono- metabolites not present in the environment aremeasured.
Urinary levels of several phthalate metabolites were determined in theNHANES 2003–2004 examination cycle. Several of these metabolites weresignificantly related to measures of obesity, such as BMI and waist circum-ference.61,62 A similar pattern was seen in the PIVUS study, where especiallythe serum levels of the phthalate metabolite mono-isobutyl phthalate (MiBP)
The Role of Persistent Organic Pollutants and Plastic-Associated Chemicals 189

was positively related to fat accumulation, measured by both dual-energy X-rayabsorptiometry (DXA)-scan and abdominal magnetic resonance imaging(MRI), but in women only.63
In a small study carried out in Mexican women, high levels of some phthalatemetabolites in the urine were related to prevalent diabetes.64 In the PIVUSstudy, we have recently shown that circulating levels of especially the phthalatemetabolites monomethyl phthalate (MMP), MiBP, and monoethyl phthalatewere related to prevalent diabetes.65 Moreover, we found that some of thephthalate metabolites were related to measures of insulin resistance and insulinsecretion, the two cornerstones in glucose control. We have also recently shownthat the phthalate MMP is related to LDL-cholesterol levels.60
Thus a picture is starting to emerge; plastic-associated compounds arerelated to different cardiovascular risk factors, although the number of studiesare small compared to the literature on POPs and prospective studies arelacking.
7.3 Cardiovascular Disease
Some of the first evidences that POPs could be involved in cardiovasculardisease came from occupational studies. When those studies pooled their datainto the IARC international cohort, consisting of 36 cohorts from 13 countries,including 21 863 workers followed for 420 years, it was a very consistentfinding that exposure to dioxin was related to future coronary heart disease(RR 1.67, 95% CI 1.23–2.26).66 Also, studies in Vietnam veterans spraying thedioxin-contaminated Agent Orange showed the same pattern with a 52%increased risk of future cardiovascular risk during 30 years follow-up.41
Also, a couple of accidents might also support the idea that exposure toPOPs could induce cardiovascular disease. In 1979, an industrial plant inSeveso in northern Italy exploded and contaminated the surrounding area withdioxins. In a follow-up some 25 years later, an increased mortality rate incardiovascular diseases was found in the population living in the contaminatedarea compared to a non-contaminated neighborhood. It is of interest to notethat it was only during the first 10 years of follow-up that an increasedmortality rate due to cardiovascular diseases could be noted. The peak in riskwas seen in the 5–10 year follow-up interval (RR 1.84, 95% CI 1.09–3.12).67
In an accident with PCB-contaminated rice in Yucheng, a non-significanttendency for a higher incidence rate of cardiovascular diseases was observedduring a 24 year follow-up period (OR 1.50, 95% CI 0.8–2.7).43
Also, geographical studies support the idea of a role of environmentalcontaminants in cardiovascular diseases. Individuals living close to a POPcontaminated waste site in New York showed an increased risk for bothmyocardial infarction (RR 1.20, 95% CI 1.03–1.39)47 and stroke (RR 1.15,95% CI, 1.05–1.26)68 compared to those not living close to a contaminatedwaste site.
The first report using measured concentrations of POPs in a population-based study and investigated the relationship between POP levels and
190 Chapter 7
cardiovascular diseases used the NHANES 1999–2002 examination cycle.69
The sample consisted of 889 individuals, 108 of which reported a history ofcardiovascular disease (coronary heart disease or stroke). A total of 21 POPswere evaluated, divided into 5 classes: PCDDs, PCDFs, dioxin-like PCBs, non-dioxin-like PCBs and OC pesticides. When the POPs were divided intoquartiles, high levels of dioxin-like PCBs were associated with an increased riskof cardiovascular diseases (OR 5.0, 95% CI 1.2–20.4, po0.01 for highest versuslowest quartile). Also, the non dioxin-like PCBs and the OC pesticides showedsimilar associations, although not as strong (OR 3.8, 95%CI 1. 1–12.8, p¼ 0.02for non dioxin-like PCBs and OR 4.0, 95% CI 1.0–17.1, p¼ 0.03 for the OCpesticides). One point to note is that these significant associations between POPexposure and prevalent cardiovascular diseases were seen in women only. Inmen, the corresponding ORs were in the 1.7–2.2 range and far from significant.
When the individual contaminants were analyzed, PCB 74, PCB 118, PCB138, PCB 153, PCB 156, PCB 170, oxychlordane, and trans-Nonachlor were allsignificantly related to prevalent cardiovascular diseases in women. For PCB138, PCB 153, and PCB 156, subjects in the highest quartile showed a morethan 10-fold increased risk for prevalent cardiovascular diseases in womenfollowing adjustment for age, race, poverty index, BMI, cigarette smoking,serum cotinine, alcohol consumption, exercise, HDL-cholesterol, totalcholesterol, triglycerides, hypertension, and C-reactive protein.
In an analysis of NHANES data from 1999–2004, Min and co-workersanalyzed associations between OC pesticide exposure and peripheral arterydisease, defined as an ankle-brachial index o0.9.70 Amongst the 2032participants, 143 were considered to have peripheral artery disease. Five OCpesticides were investigated: p,p0-DDE, trans-nonachlor, oxychlordane,dieldrin and beta-HCH. When the sum of these five OC pesticides wasevaluated, an interaction in relation to obesity was found in that the sum ofthese five OC pesticides was only related to peripheral artery disease in theobese subjects (OR 1.28, 95% CI 1.04–1.57 in the obese group and 0.95, 95%CI 0.70–1.28 in the non-obese group) following adjustment for age, sex, race,education, income, cigarette smoking, serum cotinine, alcohol consumption,total cholesterol, triglycerides, and diabetes. When the five OC pesticides wereanalyzed individually, p,p0-DDE, trans-nonachlor, and oxychlordane weresignificantly related to prevalent peripheral artery disease in the obese only.
Thus, despite the fact that some evidence from these cross-sectionalevaluations of NHANES data points towards an association between somePOPs and cardiovascular disease prospective data on POP exposure andcardiovascular disease are still lacking in the population-based setting.
Using data on 1455 subjects included in the 2003–2004 examination cycle ofthe NHANES study, Lang and co-workers showed that urinary levels of BPAwere increased in relation to prevalent cardiovascular disease (n¼ 79).58 OneSD increase in BPA levels was associated with a 1.39 times increased risk ofprevalent cardiovascular disease following adjustment for age, sex, race,education, income, smoking, BMI, and waist circumference (95% CI 118–1.63,po0.001). A similar risk was seen when only cases with heart attack were
The Role of Persistent Organic Pollutants and Plastic-Associated Chemicals 191

considered. On the other hand, no association between BPA and stroke (n¼ 40)was found (OR 0.97, 95% CI 0.74–1.27, po0.001).
When the same research group performed a similar analysis using data fromthe 2005–2006 NHANES cycle, the relationships between urinary BPA levelsand cardiovascular disease were generally weaker and no longer significant forthe combined end-point cardiovascular disease (OR 1.21, 95% CI 0.92–1.59,p¼ 0.16).59 However, heart attack was still significantly associated with urinaryBPA levels in 2005–2006 (OR 1.31, 95% CI 1.03–1.68, p¼ 0.036), and whenpooling data from the two examination cycles, the combined end-pointcardiovascular disease was related to BPA levels in a highly significant fashion(OR 1.26, 95% CI 1.11–1.43, p¼ 0.001).
The same research group has recently published the first prospective study onenvironmental contaminants and future coronary heart disease.71 They used anested case-control design to study 758 incident cases of coronary heart diseaseand 861 controls from a 410 year long follow-up of the European ProspectiveInvestigation of Cancer, Norfolk, UK. It was found that one standarddeviation increase in urinary bisphenol levels was associated with an 11%increased risk of coronary heart disease (95% CI 1.02–1.24, p¼ 0.017).Following adjustment for age, sex, education, social class, BMI, bloodpressure, lipids and exercise, the OR was not affected.
7.4 Atherosclerosis
The major underlying cause of cardiovascular diseases like coronary heartdisease, stroke, and peripheral artery disease is atherosclerosis. Regardingcoronary heart disease and stroke, the most likely mechanism is rupture of alipid-rich atherosclerotic plaque, which will trigger a thrombus formation thatwill occlude the vessel and thereby create an ischemic damage. Only a couple ofstudies originated from the PIVUS cohort have investigated whether POPs orPACs are linked to atherosclerosis. We used ultrasound to quantify whetherplaques were present in the carotid arteries and examined the grey scaleintensity of the vascular wall and plaques to determine the degree of lipidinfiltration. We have previously shown that subjects with an echolucent (dark)vascular wall have an increased risk of future cardiovascular death.72
We found that subjects with elevated levels of PCBs had an increased risk ofhaving carotid artery atherosclerotic plaques,73 even following adjustment forsex, blood pressure, lipids, diabetes, smoking, and BMI (OR 1.03, 95% CI1.01–1.05, p¼ 0.002). Several of the PCBs evaluated were significantly relatedto plaque occurrence in the carotid arteries. Some of the highly chlorinatedPCBs and PCB126 were also related to an echolucent vascular wall, suggestingnot only an effect on plaque formation, but also on the lipid infiltration in thevascular wall, an early step in the atherosclerotic process.
In another report from the PIVUS study, we investigated the role of plasticassociated chemicals.74 We found MMP to be related to carotid plaques inan inverted U-shaped manner. This pattern was significant after adjustmentfor gender, body mass index, blood glucose, blood pressure, HDL and
192 Chapter 7

LDL-cholesterol, serum triglycerides, smoking, antihypertensive treatment,and statin use (p¼ 0.004). High levels of BPA, MiBP and MMP wereassociated with an echogenic (white) vascular wall, while high levels of mono-2-ethylhexylphthalat were associated with an echolucent (dark) vascular wall(po0.0001after adjustment).
Thus both PCBs and plastic associated chemicals are related to plaqueoccurrence in the carotid artery, as well as to lipid infiltration in the vascularwall, independently of traditional cardiovascular risk factors, suggesting thethese compounds might have a direct vascular effect.
7.5 Mechanisms of Action
For the POPs, the basic mechanism discovered for some of the compounds,such as dioxin and dioxin-like PCBs, is an activation of the aryl hydrocarbon(Ah)-receptor (AHR). This activation leads to up-regulation of some enzymesknown to be involved in the detoxification process (CYP1A1, CYP 1A2, andCYP 1B1). Activation of these P450-enzymes has also been associated withformation of reactive oxygen spices and inflammation as two of the majorresults.75,76 Also, alterations in apoptosis rate and cell cycling following acti-vation of the AHR has been described.77–80
Some of the OC pesticides are known to activate the androgen receptor(AR). The endogenous ligand testosterone is known to have an influence oncardiovascular disease.
BPA was originally synthesized as an estrogenic compound\z and activatesthe estrogen receptors. Before menopause, women are known to be protectedagainst atherosclerotic complications and have a more favorable risk factorprofile compared with women post-menopause. However, the value of estrogensupplementation following menopause in terms of cardiovascular disease isdebated. How the relatively weak estrogen BPA fits into the balance betweenendogenous estrogen and its receptors is largely unknown.
The phthalates are known to be PPAR-agonists.81 Activation of PPAR-gamma promotes differentiation of adipocytes and storage of fat in adiposetissue. Thus, phthalates are important candidates for actions on obesity andrelated traits, such as metabolic syndrome and diabetes.
7.6 Conclusions
Today there is mounting evidences that both POPs and PACs could be involvedin both metabolic syndrome and its different components, such as obesity,diabetes, dyslipidemia, and hypertension, as well as in the development ofatherosclerosis and cardiovascular disease. However, since epidemiology nevercan prove causality, a combination of concordant prospective large-scalecohort studies, together with concordant experimental data, is needed todefinitively confirm that both POPs and PACs could be involved in cardiov-ascular disease. The data accumulated today definitely suggests that this as anarea to further explore.
The Role of Persistent Organic Pollutants and Plastic-Associated Chemicals 193
References
1. E. S. Ford, U. A. Ajani, J. B. Croft, J. A. Critchley, D. R. Labarthe,T. E. Kottke, W. H. Giles and S. Capewell, ‘‘Explaining the decrease inU.S. deaths from coronary disease, 1980–2000’’, N Engl J Med, 2007,356(23), 2388–2398.
2. H. C. Wijeysundera, M. Machado, F. Farahati, X. Wang, W. Witteman,G. van der Velde, J. V. Tu, D. S Lee, S. G. Goodman, R. Petrella,M. O’Flaherty, M. Krahn and S. Capewell, ‘‘Association of temporaltrends in risk factors and treatment uptake with coronary heart diseasemortality, 1994–2005.’’ JAMA, 2010, 303(18): 1841–1847.
3. S. C. Johnston, S. Mendis and C. D. Mathers, ‘‘Global variation in strokeburden and mortality: estimates from monitoring, surveillance, andmodelling’’, Lancet Neurol, 2009, 8(4), 345–354.
4. S. Kinlay, ‘‘Changes in stroke epidemiology, prevention, and treatment’’,Circulation, 2011, 124(19), e494–496.
5. D. Levy, S.Kenchaiah,M.G. Larson, E. J. Benjamin,M. J.Kupka,K.K.Ho,J. M. Murabito and R. S. Vasan, ‘‘Long-term trends in the incidence of andsurvival with heart failure’’, N Engl J Med, 2002, 347(18), 1397–1402.
6. V. L. Roger, S. A. Weston, M. M. Redfield, J. P. Hellermann-Homan,J. Killian, B. P. Yawn and S. J. Jacobsen, ‘‘Trends in heart failure incidenceand survival in a community-based population’’, JAMA, 2004, 292(3),344–350.
7. W. H. Barker, J. P. Mullooly and W. Getchel, ‘‘Changing incidence andsurvival for heart failure in a well-defined older population, 1970–1974 and1990–1994’’, Circulation, 2006, 113(6), 799–805.
8. L. Lind, S. Jakobsson, H. Lithell, B. Wengle and S. Ljunghall, ‘‘Relation ofserum calcium concentration to metabolic risk factors for cardiovasculardisease’’, BMJ, 1988, 297(6654), 960–963.
9. G. M. Reaven, ‘‘Banting lecture 1988. Role of insulin resistance in humandisease’’, Diabetes, 1988, 37(12), 1595–1607.
10. NECP, ‘‘Executive summary of the third report of the internationalcholesterol education program (NECP) expert panel on detection,education and treatment of high blood cholesterol in adults (ATP III)’’,Journal of the American Medical Association, 2001, 285, 2486–2497.
11. L. Lind, B. Vessby and J. Sundstrom, ‘‘The apolipoprotein B/AI ratio and themetabolic syndrome independently predict risk for myocardial infarction inmiddle-aged men’’, Arterioscler Thromb Vasc Biol, 2006, 26(2), 406–410.
12. J. Sundstrom, U. Riserus, L. Byberg, B. Zethelius, H. Lithell and L. Lind,‘‘Clinical value of the metabolic syndrome for long term prediction of totaland cardiovascular mortality: prospective, population based cohortstudy’’, BMJ, 2006, 332(7546), 878–882.
13. J. Sundstrom, E. Vallhagen, U. Riserus, L. Byberg, B. Zethelius, C. Berne,L. Lind and E. Ingelsson, ‘‘Risk associated with the metabolic syndromeversus the sum of its individual components’’, Diabetes Care, 2006, 29(7),1673–1674.
194 Chapter 7
14. L. Olsen, E. Lampa, D. A. Birkholz, L. Lind and P. M. Lind, ‘‘Circulatinglevels of bisphenol A (BPA) and phthalates in an elderly population inSweden, based on the Prospective Investigation of the Vasculature inUppsala Seniors (PIVUS)’’, Ecotoxicol Environ Saf, 2012, 75(1), 242–248.
15. L. Lind and P. M. Lind, ‘‘Can persistent organic pollutants and plastic-associated chemicals cause cardiovascular disease?’’, J Intern Med, 2012.
16. K. G. Alberti and P. Z. Zimmet, ‘‘Definition, diagnosis and classification ofdiabetes mellitus and its complications. Part 1: diagnosis and classificationof diabetes mellitus provisional report of a WHO consultation’’, DiabetMed, 1998, 15(7), 539–553.
17. D. H. Lee, I. K. Lee, M. Porta, M. Steffes and D. R. Jacobs, Jr.,‘‘Relationship between serum concentrations of persistent organicpollutants and the prevalence of metabolic syndrome among non-diabeticadults: results from the National Health and Nutrition ExaminationSurvey 1999–2002’’, Diabetologia, 2007, 50(9), 1841–1851.
18. S. K. Park, H. K. Son, S. K. Lee, J. H. Kang, Y. S. Chang, D. R. Jacobsand D. H. Lee, ‘‘Relationship between serum concentrations oforganochlorine pesticides and metabolic syndrome among non-diabeticadults’’, J Prev Med Public Health, 2010, 43(1), 1–8.
19. J. S. Lim, D. H. Lee and D. R. Jacobs, Jr., ‘‘Association of brominatedflame retardants with diabetes and metabolic syndrome in the U.S.population 2003–2004’’, Diabetes Care, 2008, 31(9), 1802–1807.
20. H. Uemura, K. Arisawa, M. Hiyoshi, A. Kitayama, H. Takami,F. Sawachika, S. Dakeshita, K. Nii, H. Satoh, Y. Sumiyoshi, K. Morinaga,K. Kodama, T. Suzuki and M. Nagai, ‘‘Prevalence of metabolic syndromeassociated with body burden levels of dioxin and related compounds amongJapan’s general population’’, Environ Health Perspect, 2009, 117(4), 568–573.
21. O. Vasiliu, L. Cameron, J. Gardiner, P. Deguire and W. Karmaus,‘‘Polybrominated biphenyls, polychlorinated biphenyls, body weight, andincidence of adult-onset diabetes mellitus’’, Epidemiology, 2006, 17(4),352–359.
22. A. Rignell-Hydbom, J. Lidfeldt, H. Kiviranta, P. Rantakokko, G. Samsioe,C. D. Agardh and R. Rylander, ‘‘Exposure to p,p 0-DDE: a risk factor fortype 2 diabetes’’, PLoS One, 2009, 4(10), e7503.
23. M. Turyk, H. Anderson, L. Knobeloch, P. Imm and V. Persky, ‘‘Organo-chlorine exposure and incidence of diabetes in a cohort of Great Lakessport fish consumers’’, Environ Health Perspect, 2009, 117(7), 1076–1082.
24. D. H. Lee, M. W. Steffes, A. Sjodin, R. S. Jones, L. L. Needham andD. R. Jacobs, Jr., ‘‘Low dose of some persistent organic pollutants predictstype 2 diabetes: a nested case-control study’’, Environ Health Perspect,2010, 118(9), 1235–1242.
25. D. H. Lee, P. M. Lind, D. R. Jacobs, Jr., S. Salihovic, B. van Bavel andL. Lind, ‘‘Polychlorinated biphenyls and organochlorine pesticides inplasma predict development of type 2 diabetes in the elderly: the pros-pective investigation of the vasculature in Uppsala Seniors (PIVUS)study’’, Diabetes Care, 2011, 34(8), 1778–1784.
The Role of Persistent Organic Pollutants and Plastic-Associated Chemicals 195

26. L. Rylander, A. Rignell-Hydbom and L. Hagmar, ‘‘A cross-sectional studyof the association between persistent organochlorine pollutants anddiabetes’’, Environ Health, 2005, 4, 28.
27. D. H. Lee, I. K. Lee, K. Song, M. Steffes, W. Toscano, B. A. Baker andD. R. Jacobs, Jr., ‘‘A strong dose-response relation between serumconcentrations of persistent organic pollutants and diabetes: results fromthe National Health and Examination Survey 1999–2002’’, Diabetes Care,2006, 29(7), 1638–1644.
28. N. Codru, M. J. Schymura, S. Negoita, R. Rej and D. O. Carpenter,‘‘Diabetes in relation to serum levels of polychlorinated biphenyls andchlorinated pesticides in adult Native Americans’’, Environ HealthPerspect, 2007, 115(10), 1442–1447.
29. S. Cox, A. S. Niskar, K. M. Narayan and M. M. Marcus, ‘‘Prevalence ofself-reported diabetes and exposure to organochlorine pesticides amongMexican Americans: Hispanic health and nutrition examination survey,1982–1984’’, Environ Health Perspect, 2007, 115(12), 1747–1752.
30. A. Rignell-Hydbom, L. Rylander and L. Hagmar, ‘‘Exposure to persistentorganochlorine pollutants and type 2 diabetes mellitus’’,Hum Exp Toxicol,2007, 26(5), 447–452.
31. M. E. Jorgensen, K. Borch-Johnsen and P. Bjerregaard, ‘‘A cross-sectionalstudy of the association between persistent organic pollutants andglucose intolerance among Greenland Inuit’’, Diabetologia, 2008, 51(8),1416–1422.
32. H. Uemura, K. Arisawa, M. Hiyoshi, H. Satoh, Y. Sumiyoshi,K. Morinaga, K. Kodama, T. Suzuki and M. Nagai, ‘‘Associations ofenvironmental exposure to dioxins with prevalent diabetes among generalinhabitants in Japan’’, Environ Res, 2008, 108(1), 63–68.
33. M. Turyk, H. A. Anderson, L. Knobeloch, P. Imm and V. W. Persky,‘‘Prevalence of diabetes and body burdens of polychlorinated biphenyls,polybrominated diphenyl ethers, and p,p0-diphenyldichloroethene in GreatLakes sport fish consumers’’, Chemosphere, 2009, 75(5), 674–679.
34. C. J. Everett and E. M. Matheson, ‘‘Biomarkers of pesticide exposure anddiabetes in the 1999–2004 national health and nutrition examinationsurvey’’, Environ Int, 2010, 36(4), 398–401.
35. H. K. Son, S. A. Kim, J. H. Kang, Y. S. Chang, S. K. Park, S. K. Lee,D. R. Jacobs, Jr. and D. H. Lee, ‘‘Strong associations between low-doseorganochlorine pesticides and type 2 diabetes in Korea’’, Environ Int, 2010,36(5), 410–414.
36. J. Ukropec, Z. Radikova, M. Huckova, J. Koska, A. Kocan, E. Sebokova,B. Drobna, T. Trnovec, K. Susienkova, V. Labudova, D. Gasperikova,P. Langer and I. Klimes, ‘‘High prevalence of prediabetes and diabetes ina population exposed to high levels of an organochlorine cocktail’’,Diabetologia, 2010, 53(5), 899–906.
37. G. L. Henriksen, N. S. Ketchum, J. E. Michalek and J. A. Swaby, ‘‘Serumdioxin and diabetes mellitus in veterans of Operation Ranch Hand’’,Epidemiology, 1997, 8(3), 252–258.
196 Chapter 7

38. M. P. Longnecker and J. E. Michalek, ‘‘Serum dioxin level in relation todiabetes mellitus among Air Force veterans with background levels ofexposure’’, Epidemiology, 2000, 11(1), 44–48.
39. K. Steenland, G. Calvert, N. Ketchum and J. Michalek, ‘‘Dioxin anddiabetes mellitus: an analysis of the combined NIOSH and Ranch Handdata’’, Occup Environ Med, 2001, 58(10), 641–648.
40. J. Michalek, J. Robinson, K. Fox et al., ‘‘Air Force Health Study – AnEpidemiologic Investigation of Health Effects in Air Force PersonnelFollowing Exposure to Herbicides: 2002 Follow-up Examination ResultsMay 2002 to March 2005’’, SCIENCE APPLICATIONS INTER-NATIONAL CORP RESTON VA, 1994.
41. H. K. Kang, N. A. Dalager, L. L. Needham, D. G. Patterson, Jr.,P. S. Lees, K. Yates and G. M. Matanoski, ‘‘Health status of ArmyChemical Corps Vietnam veterans who sprayed defoliant in Vietnam’’, AmJ Ind Med, 2006, 49(11), 875–884.
42. J. E. Michalek and M. Pavuk, ‘‘Diabetes and cancer in veterans ofOperation Ranch Hand after adjustment for calendar period, days ofspraying, and time spent in Southeast Asia’’, J Occup Environ Med, 2008,50(3), 330–340.
43. S. L. Wang, P. C. Tsai, C. Y. Yang and Y. Leon Guo, ‘‘Increased risk ofdiabetes and polychlorinated biphenyls and dioxins: a 24-year follow-upstudy of the Yucheng cohort’’, Diabetes Care, 2008, 31(8), 1574–1579.
44. M. Kouznetsova, X. Huang, J. Ma, L. Lessner and D. O. Carpenter,‘‘Increased rate of hospitalization for diabetes and residential proximity ofhazardous waste sites’’, Environ Health Perspect, 2007, 115(1), 75–79.
45. M. H. Ha, D. H. Lee, H. K. Son, S. K. Park and D. R. Jacobs, Jr.,‘‘Association between serum concentrations of persistent organicpollutants and prevalence of newly diagnosed hypertension: results fromthe National Health and Nutrition Examination Survey 1999–2002’’,J Hum Hypertens, 2009, 23(4), 274–286.
46. A. Goncharov, M. Bloom, M. Pavuk, I. Birman and D. O. Carpenter,‘‘Blood pressure and hypertension in relation to levels of serum poly-chlorinated biphenyls in residents of Anniston, Alabama’’, J Hypertens,2010, 28(10), 2053–2060.
47. A. V. Sergeev and D. O. Carpenter, ‘‘Hospitalization rates for coronaryheart disease in relation to residence near areas contaminated withpersistent organic pollutants and other pollutants’’, Environ HealthPerspect, 2005, 113(6), 756–761.
48. M. S. Wolff, H. A. Anderson, J. A. Britton and N. Rothman, ‘‘Pharma-cokinetic variability and modern epidemiology – the example of dich-lorodiphenyltrichloroethane, body mass index, and birth cohort’’, CancerEpidemiol Biomarkers Prev, 2007, 16(10), 1925–1930.
49. G. M. Calvert, K. K. Willie, M. H. Sweeney, M. A. Fingerhut andW. E. Halperin, ‘‘Evaluation of serum lipid concentrations among U.S.workers exposed to 2,3,7,8-tetrachlorodibenzo-p-dioxin’’, Arch EnvironHealth, 1996, 51(2), 100–107.
The Role of Persistent Organic Pollutants and Plastic-Associated Chemicals 197

50. S. W. Hu, T. J. Cheng, G. P. ChangChien and C. C. Chan, ‘‘Associationbetween dioxins/furans exposures and incinerator workers’ hepaticfunction and blood lipids’’, J Occup Environ Med, 2003, 45(6),601–608.
51. D. Pelclova, Z. Fenclova, P. Urban, P. Ridzon, J. Preiss, K. Kupka,J. Malik, Z. Dubska and T. Navratil, ‘‘Chronic health impairment due to2,3,7,8-tetrachloro-dibenzo-p-dioxin exposure’’, Neuro Endocrinol Lett,2009, 30(Suppl 1), 219–224.
52. P. Langer, ‘‘The impacts of organochlorines and other persistent pollutantson thyroid and metabolic health’’, Front Neuroendocrinol, 2010, 31(4),497–518.
53. M. A. Elobeid, M. A. Padilla, D. W. Brock, D. M. Ruden andD. B. Allison, ‘‘Endocrine disruptors and obesity: an examination ofselected persistent organic pollutants in the NHANES 1999–2002 data’’,Int J Environ Res Public Health, 2010, 7(7), 2988–3005.
54. M. Ronn, L. Lind, B. van Bavel, S. Salihovic, K. Michaelsson andP. M. Lind, ‘‘Circulating levels of persistent organic pollutants associate indivergent ways to fat mass measured by DXA in humans’’, Chemosphere,2011, 85(3), 335–343.
55. D. H. Lee, L. Lind, D. R. Jacobs, Jr., S. Salihovic, B. van Bavel andP. M. Lind, ‘‘Associations of persistent organic pollutants with abdominalobesity in the elderly: The Prospective Investigation of the Vasculature inUppsala Seniors (PIVUS) study’’, Environ Int, 2012, 40, 170–178.
56. B. D. Kerger, T. L. Copeland and A. P. DeCaprio, ‘‘Tenuous dose-response correlations for common disease states: case study of cholesteroland perfluorooctanoate/sulfonate (PFOA/PFOS) in the C8 HealthProject’’, Drug Chem Toxicol, 2011, 34(4), 396–404.
57. C. J. Sakr, K. H. Kreckmann, J. W. Green, P. J. Gillies, J. L. Reynolds andR. C. Leonard, ‘‘Cross-sectional study of lipids and liver enzymes related toa serum biomarker of exposure (ammonium perfluorooctanoate or APFO)as part of a general health survey in a cohort of occupationally exposedworkers’’, J Occup Environ Med, 2007, 49(10), 1086–1096.
58. I. A. Lang, T. S. Galloway, A. Scarlett, W. E. Henley, M. Depledge,R. B. Wallace and D. Melzer, ‘‘Association of urinary bisphenol Aconcentration with medical disorders and laboratory abnormalities inadults’’, JAMA, 2008, 300(11), 1303–1310.
59. D. Melzer, N. E. Rice, C. Lewis, W. E. Henley and T. S. Galloway,‘‘Association of urinary bisphenol a concentration with heart disease:evidence from NHANES 2003/06’’, PLoS One, 2010, 5(1), e8673.
60. L. Olsen, L. Lind and P. M. Lind, ‘‘Associations between circulatinglevels of bisphenol A and phthalate metabolites and coronary risk in theelderly’’, Ecotoxicol Environ Saf, 2012.
61. R. W. Stahlhut, E. van Wijngaarden, T. D. Dye, S. Cook and S. H. Swan,‘‘Concentrations of urinary phthalate metabolites are associated withincreased waist circumference and insulin resistance in adult U.S. males’’,Environ Health Perspect, 2007, 115(6), 876–882.
198 Chapter 7

62. E. E. Hatch, J. W. Nelson, M. M. Qureshi, J. Weinberg, L. L. Moore,M. Singer and T. F. Webster, ‘‘Association of urinary phthalate metaboliteconcentrations with body mass index and waist circumference: a cross-sectional study of NHANES data 1999–2002’’, Environ Health, 2008,7, 27.
63. P. M. Lind, V. Roos, M. Ronn, L. Johansson, H. Ahlstrom, J. Kullbergand L. Lind, ‘‘Serum concentrations of phthalate metabolites related toabdominal fat distribution two years later in elderly women’’, EnvironHealth, 2012, 11(1), 21.
64. K. Svensson, R.U.Hernandez-Ramirez, A. Burguete-Garcia,M. E. Cebrian,A.M. Calafat, L. L. Needham, L. Claudio and L. Lopez-Carrillo, ‘‘Phthalateexposure associated with self-reported diabetes among Mexican women’’,Environ Res, 2011, 111(6), 792–796.
65. P. M. Lind, and B. Zethelius. ‘‘Circulating Levels of Phthalate MetabolitesAre Associated With Prevalent Diabetes in the Elderly’’, Diabetes Care,2012.
66. J. Vena, P. Boffetta, H. Becher, T. Benn, H. B. Bueno-de-Mesquita,D. Coggon, D. Colin, D. Flesch-Janys, L. Green, T. Kauppinen,M. Littorin, E. Lynge, J. D. Mathews, M. Neuberger, N. Pearce,A. C. Pesatori, R. Saracci, K. Steenland and M. Kogevinas, ‘‘Exposure todioxin and nonneoplastic mortality in the expanded IARC internationalcohort study of phenoxy herbicide and chlorophenol production workersand sprayers’’, Environ Health Perspect, 1998, 106(Suppl 2), 645–653.
67. D. Consonni, A. C. Pesatori, C. Zocchetti, R. Sindaco, L. C. D’Oro,M. Rubagotti and P. A. Bertazzi, ‘‘Mortality in a population exposed todioxin after the Seveso, Italy, accident in 1976: 25 years of follow-up’’, AmJ Epidemiol, 2008, 167(7), 847–858.
68. I. Shcherbatykh, X. Huang, L. Lessner and D. O. Carpenter, ‘‘Hazardouswaste sites and stroke in New York State’’, Environ Health, 2005, 4, 18.
69. M. H. Ha, D. H. Lee and D. R. Jacobs, ‘‘Association between serumconcentrations of persistent organic pollutants and self-reported cardio-vascular disease prevalence: results from the National Health andNutrition Examination Survey 1999–2002’’, Environ Health Perspect, 2007,115(8), 1204–1209.
70. J. Y. Min, J. S. Cho, K. J. Lee, J. B. Park, S. G. Park, J. Y. Kim andK. B. Min, ‘‘Potential role for organochlorine pesticides in the prevalenceof peripheral arterial diseases in obese persons: results from the NationalHealth and Nutrition Examination Survey 1999–2004’’, Atherosclerosis,2011, 218(1), 200–206.
71. D. Melzer, N. J. Osborne, W. E. Henley, R. Cipelli, A. Young, C. Money,P. McCormack, R. Luben, K. T. Khaw, N. J. Wareham and T.S. Galloway, ‘‘Urinary bisphenol A concentration and risk of futurecoronary artery disease in apparently healthy men and women’’, Circu-lation, 2012, 125(12), 1482–1490.
72. M. Wohlin, J. Sundstrom, B. Andren, A. Larsson and L. Lind, ‘‘Anecholucent carotid artery intima-media complex is a new and independent
The Role of Persistent Organic Pollutants and Plastic-Associated Chemicals 199

predictor of mortality in an elderly male cohort’’, Atherosclerosis, 2009,205(2), 486–491.
73. P. M. Lind, B. van Bavel, S. Salihovic and L. Lind, ‘‘Circulating levels ofpersistent organic pollutants (POPs) and carotid atherosclerosis in theelderly’’, Environ Health Perspect, 2012, 120(1), 38–43.
74. P. M. Lind and L. Lind, ‘‘Circulating levels of bisphenol A and phthalatesare related to carotid atherosclerosis in the elderly’’, Atherosclerosis, 2011,218(1), 207–213.
75. A. Puga, A. Hoffer, S. Zhou, J. M. Bohm, G. D. Leikauf andH. G. Shertzer, ‘‘Sustained increase in intracellular free calcium andactivation of cyclooxygenase-2 expression in mouse hepatoma cells treatedwith dioxin’’, Biochem Pharmacol, 1997, 54(12), 1287–1296.
76. H. G. Shertzer, D. W. Nebert, A. Puga, M. Ary, D. Sonntag, K. Dixon,L. J. Robinson, E. Cianciolo and T. P. Dalton, ‘‘Dioxin causes a sustainedoxidative stress response in the mouse’’, Biochem Biophys Res Commun,1998, 253(1), 44–48.
77. D. N. Sadhu, M. Merchant, S. H. Safe and K. S. Ramos, ‘‘Modulation ofprotooncogene expression in rat aortic smooth muscle cells bybenzo[a]pyrene’’, Arch Biochem Biophys, 1993, 300(1), 124–131.
78. D. W. Nebert, A. L. Roe, M. Z. Dieter, W. A. Solis, Y. Yang andT. P. Dalton, ‘‘Role of the aromatic hydrocarbon receptor and [Ah] genebattery in the oxidative stress response, cell cycle control, and apoptosis’’,Biochem Pharmacol, 2000, 59(1), 65–85.
79. E. A. Thackaberry, Z. Jiang, C. D. Johnson, K. S. Ramos andM.K.Walker, ‘‘Toxicogenomic profile of 2,3,7,8-tetrachlorodibenzo-p-dioxinin the murine fetal heart: modulation of cell cycle and extracellular matrixgenes’’, Toxicol Sci, 2005, 88(1), 231–241.
80. K. Y. Kim, D. S. Kim, S. K. Lee, I. K. Lee, J. H. Kang, Y. S. Chang,D. R. Jacobs, M. Steffes and D. H. Lee, ‘‘Association of low-dose exposureto persistent organic pollutants with global DNA hypomethylation inhealthy Koreans’’, Environ Health Perspect, 2010, 118(3), 370–374.
81. B. Desvergne, J. N. Feige and C. Casals-Casas, ‘‘PPAR-mediated activityof phthalates: A link to the obesity epidemic?’’, Mol Cell Endocrinol, 2009,304(1–2), 43–48.
200 Chapter 7

CHAPTER 8
Obesity and Diabetes: Role ofEnvironmental Chemical Exposures
THADDEUS T. SCHUG,a SARAH G. HOWARD,b
KYLA W. TAYLORc AND JERROLD J. HEINDEL*a
aNational Institute of Environmental Health Sciences, Division ofExtramural Research and Training, Research Triangle Park, USA;bCollaborative on Health and the Environment, PO Box 316, Bolinas,CA 94924, USA; cNational Institute of Environmental Health Sciences,Office of Health Assessment and Translation, Division of NationalToxicology Program, Research Triangle Park, NC, USA*E-mail: [email protected]
8.1 Background
The world is experiencing an alarming increase in the rate of obesity, diabetesand metabolic syndrome. In 2008, the World Health Organization estimatedthat 1.5 billion adults aged 20 and over were overweight, and nearly 500millionshared body mass index readings are above 30 kg m�2, which is considered thethreshold of obesity. Currently, in the United States, approximately 27% ofadults and 17% of children and adolescents are obese. Moreover, one in fouradults in the United States and estimated 2.1 billion people worldwide sufferfrom diseases associated with metabolic syndrome, such as glucose intolerance,insulin resistance, and raised blood pressure, which increases the risk ofcardiovascular disease and diabetes.
Issues in Toxicology No. 16
Aging and Vulnerability to Environmental Chemicals: Age-related Disorders and their Origins in
Environmental Exposures
Edited by Bernard Weiss
r The Royal Society of Chemistry 2013
Published by the Royal Society of Chemistry, www.rsc.org
201

Worldwide, the number of people with diabetes increased from 153million to347million between 1980 and 2008. Approximately 70% of this growth isattributable to population growth and aging, while the remaining 30% isattributable to a rise in age-specific prevalence.1 The global health expenditureon diabetes was expected to total $376 billion USD in 2010, and rise to490 billion USD in 2030, representing 12% of all per capita health careexpenditures.2
Among US adults, diabetes incidence increased by 41% between 1997 and2003 in all age groups. This increase was highest (65%) in people 65–79 years ofage, and only includes those diagnosed with diabetes.3 Almost 6% of US adultsover age 65 have undiagnosed diabetes. When both diagnosed and undiagnoseddiabetes cases are included, almost 1 in 4 Americans over age 65 have diabetes,a number expected to increase rapidly in the coming decades.4 Alarmingly,children are beginning to develop type 2 diabetes, even before age 10.5 Theeconomic and social burdens that diabetes places on societies are alreadysignificant, and are growing rapidly.
The incidence of type 1 diabetes is increasing in children worldwide,especially in the youngest children, under age 5.6,7 Type 1 diabetes incidencetrends among adults, especially older adults, are not well documented, althoughsome surveys show an increasing incidence in younger adults.8 In industrializedcountries, childhood type 1 diabetes incidence began to increase around the1950s.9
8.2 Comorbidities and Complications
Why do we care if someone is overweight or obese? There are several classifi-cations of obesity, and indeed some obese individuals appear quite healthy.However, the overwhelming majority of obese individuals have multiplecomorbidity factors that result in poor health. These include significant risk ofdiabetes, gall bladder disease, sleep apnea, high blood pressure, insulinresistance, inflammation, breathlessness and, when pregnant, gestationaldiabetes, metabolic syndrome and nonalcoholic fatty liver disease (NAFLD).Obese individuals also have increased risk of coronary heart disease and stroke,osteoarthritis and gout, impaired fertility, increased risk of cancers, cataractsand back problems.10
The long term consequences of diabetes can also be severe. Type 2 diabetescarries with it increased morbidity and mortality, largely due to complications.Long-term microvascular complications include neuropathy, retinopathy, andnephropathy. Long-term macrovascular complications include cardiovasculardisease, cerebrovascular disease, and hypertension.11 In addition to thesecomplications, older adults with diabetes have a higher risk for a variety ofother geriatric conditions, including falls, fractures, cognitive impairment,physical disability, and depression.4 Type 2 diabetes is also associated withother conditions, such as NAFLD12 and cancer.13
Chronic hyperglycemia is associated with the microvascular long-termcomplications of diabetes.11 Numerous studies have also found associations
202 Chapter 8

between hemoglobin A1c (HbA1c, a long term marker of average bloodglucose levels) and cardiovascular disease incidence.14 Longer disease durationand severity of disease (higher HbA1c or insulin-dependence) are associatedwith a higher risk of most of the geriatric age-related complications.4 And yetmost clinical trials have not found that intensive glucose control improvescardiovascular outcomes14 or geriatric outcomes4 in people with type 2diabetes. Intensive glucose control in elderly patients may in fact cause moreharm than good.15
When type 2 diabetes is diagnosed during childhood/adolescence, thedevelopment and progression of micro and macrovascular diabetes compli-cations may be especially rapid. Microvascular complications, includingnephropathy and retinopathy, are usually diagnosed at an early age and areoften already present by the time of diagnosis. Onset of type 2 diabetes duringadolescence is associated with an overall risk for complications similar to thatof adults with type 2, and a rate of progression higher than that of adolescentswith type 1 diabetes.16
The microvascular complications associated with type 1 diabetes are similar tothose of type 2 diabetes and include retinopathy, nephropathy, and neuropathy.Macrovascular complications are also similar and include cardiovascular diseaseand stroke.17,18 Intensive glucose control reduces the development andprogression of these microvascular complications.19 Increased insulin resistance,on the other hand, increases the subsequent risk of both micro and macro-vascular complications in people with type 1 diabetes.20
Additional autoimmune diseases—especially celiac disease, thyroid disease,and Addison’s disease (hypoadrenalism)—are common in people with type 1diabetes, and at diagnosis, one third of children with type 1 diabetes testpositive for the antibodies associated with these diseases.21 Bone mineraldensity is lower in adults with type 1 diabetes, although higher in adults withtype 2. Both type 1 and type 2 patients however, have a higher risk of bonefracture.22
In addition to the health problems associated with obesity and diabetes, thereis a tremendous burden, in term of both time and money, placed on our healthcare systems and governmental agencies. Obesity is now more costly than anyother preventive cause of death, with costs estimated to be 17% of all USmedical costs each year.23 It is clear that individuals that were obese or over-weight as adolescents are highly likely to be obese adults, and to developcardiovascular disease, colon cancer, and arthritis, even if they loseweight laterin life.24 Furthermore, obese children at age 12, and who remain overweight,will have direct medical expenses of an estimated $6.24B associated with theirexcess weight throughout their lives.24 Thus there are enormous health andhealth care costs associated with obesity and diabetes.
8.3 Genetics and Obesity and Diabetes
Evidence for a genetic basis for obesity comes mainly from studies of resem-blance and differences among family members, twins, and adoptees.25 A few
Obesity and Diabetes: Role of Environmental Chemical Exposures 203

studies have reported that specific genes or genetic polymorphisms account forhigher rates of obesity in certain populations. For instance, linkage studies inhumans and animal models have uncovered some rare obesity causing genes,such as leptin and its receptor, as well as mutations in the melanocortin 4receptor gene.26 The genome-wide association studies utilizing massive popu-lations have uncovered some 40 novel single-nucleotide polymorphisms thatwhile robustly associating with BMI, even together only explain less than 5% ofthe observed variation.27 Numerous genetic alleles—more than 40—have beenassociated with type 2 diabetes, but their overall effect remains small; theheritability of type 2 diabetes is usually estimated to be around 25%.28 As withobesity, the rapidly increasing diabetes incidence cannot be attributed togenetic susceptibility. However, the relative paucity of direct genetic evidencesuggests that other factors play a major role in obesity.
The genes associated with type 2 diabetes act in conjunction with variousrecognized environmental factors, including aging, pregnancy, physical inac-tivity, nutrition, puberty, and weight to contribute to disease.29 More than 50genetic susceptibility loci have been identified for type 1 diabetes to date.Compared to childhood-onset type 1, a lower frequency of high-risk alleles arefound in people with adult-onset type 1.30 In fact, both type 1 and type 2associated genes have been associated in adult-onset type 1.31,32 A number ofanalyses have confirmed that the highest risk genotype has been decreasing innew onset type 1 diabetes cases over recent decades; those with a lower ormoderate risk of disease are now more likely to develop type 1 diabetes. Thisfinding suggests that some environmental change that increases diseasepenetrance in those with lower risk geneotypes plays a role in the increasingincidence of disease.33 High genetic risk is neither necessary nor sufficient forthe development of type 1 diabetes.
In summary, there is no doubt that genetics plays an important role in bothobesity and type 1 and 2 diabetes. It is clear however, that genetics is not theonly factor and that environmental factors also play an important role. Obesityand diabetes, like all complex diseases, are the result of gene-environmentinteractions. To really understand the etiology of these diseases, one must focusnot just on genetics but on the interaction of genetic background with envi-ronmental effects. The myopic focus on genetics as the only or primary cause ofthese diseases is not likely to be a fruitful endeavor, especially in light of thesignificant increases in disease incidence and prevalence over the last 40 years,during which there has been little change in genetics but drastic changes in theenvironment.
8.4 Endocrine Mechanisms Controlling Weight Gain
Feeding behavior, satiety, energy metabolism, and blood glucose levels are allcontrolled by a complex, interactive endocrine system that consists of the brain,adipose tissue, GI tract, muscle, liver, pancreas, and hormones and adipokinesthat circulate between these endocrine organs (Figure 8.1). There are two mainpathways controlling food intake, the homeostatic system and the brain reward
204 Chapter 8

(hedonic) system, both of which are centered in the brain. One of the primaryfunctions of the brain during periods of food scarcity or surplus is to prioritizebehavioral output to procure and consume food, thereby maintaining ahomeostatic energy balance. The hypothalamus is the brain region responsiblefor controlling food intake and satiety via a series of homeostatic pathways andmechanisms. It acts by sensing glucose, fatty acids and proteins as well asintegrating signals from leptin, cholecystokinin, ghrelin, insulin, and neur-opeptide Y, to control food intake34–37 (Table 8.1).
In addition to homeostatic energy systems, reward systems also have keyroles in regulating feeding behavior.38 The brain reward systems controllearning about the palatable (hedonic) properties of food and thus regulate theincentive value of food or environmental stimuli that predict the availability offood rewards. These areas are regulated by dopamine, cannabinoids, opiods,and serotonin, along with input from homeostatic mechanisms.39,40 Hormonalregulators of energy homeostasis can also act on brain reward circuits, most
Figure 8.1 The two main pathways controlling food intake, the homeostatic systemand brain reward (hedonic) system, both of which are centered in thebrain. Feeding behavior, satiety, energy metabolism, and blood glucoselevels are all controlled by a complex interacting endocrine system thatconsists of the brain, adipose tissue, GI tract, muscle, liver, pancreas, andalso hormones and adipokines that circulate between these endocrineorgans.
Obesity and Diabetes: Role of Environmental Chemical Exposures 205

notably on the dopamine system,41 to increase or decrease the incentive value offood depending on energy requirements. However, stimulation of brain areasthat regulate food reward can trigger binge-like overeating, even in recently fedanimals in which homeostatic satiety signals have been engaged.42,43 Thissuggests that obtaining the pleasurable effects of food is a powerful motivatingforce that can override homeostatic satiety signals, leading individuals toconsume food with greater frequency and in greater portions.44 And since asingle meal of increased portion size can trigger increased food intake overseveral days, hedonic stimulated overeating is likely to be an importantcontributor to weight gain and the development of obesity.38 In addition,certain foods, for example those high in sugars and fat, stimulate the rewardpathways, leading to increased consumption even when not hungry. Thus, inmany respects, these reward pathways are similar to addiction pathways.
In summary, there is neither an independent hunger center nor pleasurecenter; complex interactions among multiple tissues and organs are involved inall aspects of food intake and metabolism. The homeostatic regulatory system(control of hunger) is easily overturned by the reward (hedonic) system (controlof food craving), resulting in weight gain. Similarly, the homeostatic systemdefends against weight loss such that weight gained is not easily lost.45
8.5 Causes of Obesity
The prevailing hypothesis for the obesity epidemic is that people simply overeatand under-exercise. We live in a world surrounded by highly processed foodscontaining a high fat and sugar content. Indeed it is clear that technologicaladvances in agriculture and food processing have enhanced the nature andvariety of food available to people, thus increasing the likelihood of overeating.The ease of access to highly palatable food increases a person’s desire to eat andthus it requires a strong physiologic system to overcome these food urges.Interestingly, only a subset of individuals overeat and gain weight, and have
Table 8.1 Hormonal control of appetite and metabolism.
Hormone Site of Production Effect
Leptin Adipose tissue Reduces food intakeGhrelin Stomach Stimulates food intakeCholycystekinin/GLP-1 Intestine Inhibits food intakeInsulin Pancreas Inhibits food intakeCortisol Adrenal gland Stimulates food intakeNPY/AGRP Brain Stimulates food intakeOrexin Brain Stimulates food intakeSeratonin/5HT Brain Inhibits food intakeAlpha MSH/POMCEnergy expenditure
Brain Inhibits food intake/increase
Dopamine System Brain Controls food reward
aSelected examples, not a complete list.
206 Chapter 8

what some researchers refer to as a ‘‘food addiction’’. This specificity raises thequestion of why, when individuals are exposed to the same basic environment,do only some overeat and become obese? In other words, does the simpleavailability of highly palatable foods cause us to eat more and become obese?Or are there other underlying differences between individuals who remain leanand those that overeat that predisposes some to overeating and obesity? Asdescribed, genetics clearly plays a role, but it is also clear that genetics can onlyaccount for a small portion of obesity and diabetes and not for the increaseover past decades. Thus the environment, more specifically environmentalchemicals, must play an important role in susceptibility to obesity and diabetes.
We postulate that early life environmental events are likely to be acontributing cause of the obesity epidemic due to disruption of perinatal andprenatal metabolic programming events, which leads to increased risks ofobesity later in life. It is plausible that individuals at risk for weight gain mayhave been subject to altered programming events early in life, which makesthem more susceptible to ‘‘food addiction’’ and overeating. Since obesity iscontrolled by homeostatic mechanisms that regulate both hunger and satiety,as well as reward pathways that control desire for food and conditioning tofood cues, changes at any point in this circuitry could predispose individuals toweight gain. Perhaps we can learn more about obesity by asking the question:What are the fundamental differences between lean and obese individuals asidefrom genetics? And, why do some people become obese whilst others do notwhen exposed to the same foods?
Table 8.2 illustrates that there are many different behavioral patternsbetween lean individuals and obese individuals. Overweight individuals viewfood differently; they have a higher preference for high fat and sugar foods,crave foods, are emotional eaters, will work harder for food, and overeatdespite the negative consequences. Obese individuals have increased desire forcertain foods when they attempt to abstain from eating, and have withdrawalsymptoms, such as agitation or anxiety, when they stop eating certain foods.46
These differences are not just psychological, but in fact can be traced to actual
Table 8.2 Differences between obese and lean individuals.
Characteristics and behaviors Obese compared to lean
Food preferences andbehaviors
Preference for high fat and high sugar foods
Food satiety Higher desire and anticipation for foodDelayed state of satiation (delayed satiety signals)
Emotional links to food Increased eating in response to anxiety, depression,mood swings
Food satisfaction Greater reward from food intakeBrain activity Increased dopamine receptors in brain and pleasure
sensationHormones Higher insulin levels, impaired leptin signalingReceptors Decreased striatal dopamine (DR2) receptorsAcquisition of food Work harder to obtain food
Obesity and Diabetes: Role of Environmental Chemical Exposures 207

differences in brain chemistry. On the other hand, lean individuals eat primarilyto sustain life and can stop eating mid-meal, when they perceive they are ‘‘full’’.
8.6 Metabolic Programming, Epigenetics and Obesity
Metabolic programming during prenatal and perinatal development hasbecome an active area of research in the study of obesity. The developmentalorigins of health and disease (DOHaD) hypothesis, first proposed by DavidBarker in 1997, showed that poor in utero nutrition resulted in high rates ofdisease—including obesity—later in life.47 More recent studies have linkedhigher maternal pre-pregnancy BMI and higher gestational weight gain withincreased birth weight and fat mass at birth. Maternal diabetes is alsoassociated with increased birth weight as well as childhood overweight andobesity. Interestingly, paternal nutrition has also been traced to ill-fated healthoutcomes in offspring. For instance, reports have shown that paternal obesity isassociated with a disruption in insulin secretion and glucose tolerance inoffspring. Paradoxically, children and adults born small for their gestationalage also have an increased risk of obesity, which may be mediated by rapidcompensatory postnatal growth. Thus there are significant data linkingdevelopmental nutritional status to obesity later in life.
The concept of disruptions in developmental programming has now beenextended to include non-nutritional early life exposures that have been shownto alter the body’s physiology. Focus on the fetus and/or neonate is of primaryconcern since developing organisms are extremely sensitive to perturbation bychemicals with hormone-like activity, e.g. endocrine disruptors. Adverse effectsmay occur at concentrations of the chemical that are far below levels thatwould be considered harmful in the adult.48 Some reasons for this increasedsensitivity are that the protective mechanisms available to the adult—such asDNA repair mechanisms, a competent immune system, detoxifying enzymes,liver metabolism, and the blood/brain barrier—are not fully functional in thefetus or newborn. In addition, the developing organism has an increasedmetabolic rate as compared to an adult which, in some cases, may result inincreased toxicity.48 Finally, prenatal exposure to environmental factors canmodify normal cellular and tissue development and function through devel-opmental programming, such that individuals may have a higher risk ofreproductive pathologies and metabolic and hormonal disorders later in life.Thus exposures during critical windows of perinatal development may notmanifest until much later in life. While fetal development is commonly knownto be a period of increased sensitivity to chemical insult, childhood andadolescence are also marked by continued maturation of key endocrinesystems, and are therefore susceptible to chemical exposure.49
Of special concern are man-made hormone mimicking chemicals capable ofevading defense mechanisms and misdirecting developmental decisions. Recentstudies document detectable quantities of a variety of endocrine disruptingchemicals (EDCs)—such as persistent organic pesticides (POPs), phthalates,polybrominated diphenyl ethers, polycyclic aromatic hydrocarbons, and
208 Chapter 8

bisphenol A (BPA)—in pregnant women, fetuses, newborns, young children,and adolescents.50–55 Since each organ system has a different developmentaltrajectory, and the sensitive window for exposures to cause toxicity changesduring tissue development, the effects of exposures are dependent not only onthe type and dose of the chemical, but also on when the exposure occurs.56
These studies illustrate that the in utero developmental period is a criticallysensitive window of vulnerability. Disruptions during this time-frame can leadto subtle functional changes that may not emerge until later in life.56 Evidencenow suggests that early life exposures to toxic chemicals can be directlyassociated with subsequent increases in the prevalence of the most commondiseases in the last 20 years (Figure 8.2). Table 8.3 shows diseases that havebeen demonstrated, in animal studies, to result from exposure to environmentalchemicals during development, e.g. due to altered programming. Note thatobesity and diabetes are among the diseases/dysfunctions that result fromaltered developmental programming by environmental chemicals.
There are several important principles that demonstrate how early lifeenvironmental exposures contribute to increased risks of adult disease. Firstly,chemical exposures can have both tissue-specific and time-specific consequenceson growth and development. As long as tissue is developing, it is susceptible todisruptions from environmental exposures. These disruptions can result from
Figure 8.2 Model illustrating early life exposures may cause functional changes atcellular levels that lead to changes in physiological status, and ultimatelyincreased susceptibility to obesity later in life.
Table 8.3 Diseases/dysfunctions in animals that can be traced to alterations indevelopmental programming caused by exposure to environmentalchemicals.
Disease/dysfunction References
Learning and behavioral problems [58–61]Early puberty [62–64]Infertility [65, 66]Breast and prostate cancer [67, 68]Parkinson’s disease [69, 70]Obesity and diabetes [71–73]Asthma [74, 75]Heart disease/hypertension [76, 77]Neurodegenerative diseases [78]
Obesity and Diabetes: Role of Environmental Chemical Exposures 209

changes in gene expression, protein activity, cell communication, or othermechanisms. Secondly, the initiating in utero exposure may act alone or inconcert with other environmental stressors. That is, the risk of developingdisease in adulthood can be due to the combined insults over a lifetime. Thirdly,the pathophysiology may be manifested in a disease that otherwise might nothave occurred, and disease progression may have variable latent periods.Fourthly, there is a latent period between exposure and disease which couldrange from months to decades. Finally, the effects of environmental chemicalexposures can be transgenerational, thus affecting future generations(Figure 8.3).57
It seems likely that at least of part of the developmental programming ofdisease/dysfunction is the result of alterations in the epigenetic control of geneexpression during development. Epigenetic mechanisms of gene regulation,such as DNA methylation and histone modifications (e.g. methylation, acety-lation, ubiquitination) regulate gene expression during development and arethus responsible for normal tissue and organ development.79,80 During thiscritical time period, the epigenome cycles through a series of precisely timedmethylation changes, designed to ensure proper development. The appropriatetiming and extraordinary accuracy of methylation in the gametes and followingfertilization makes this system particularly vulnerable to interference fromenvironmental exposures.81 The highly orchestrated processes that occur
Figure 8.3 Illustration of the complex interactions between environmental factors,epigenetic regulatory events, and genomic variations that can lead toincreased risk of obesity.
210 Chapter 8

during these critical developmental periods give rise to concerns aboutvulnerability during the early stages of life. Indeed it is now clear that theepigenetic system is responsive to environmental stimuli, such as drugs ofabuse, diet, or chemical exposures. Recent reports have identified epigeneticmodifications in the central nervous system in response to altered diet,particularly in the prenatal or early postnatal time period, when brain devel-opment is particularly vulnerable to perturbations.80 For example,consumption of a palatable high-fat diet increases DNA and histonemethylation and decreases histone acetylation status in the promoter region ofthe opioid receptor mu 1 (MOR1) gene, which correlates with decreased MORexpression.80 Thus changes in DNA methylation patterns and chromatinremodeling in response to nutritional status in utero or during early postnataldevelopment can affect dietary preference and metabolism.5
8.7 The Obesogen Hypothesis
Chemicals that give rise to obesity have been referred to as ‘‘obesogens’’.82
These chemicals are found in a wide variety of products, and most arecategorized as endocrine disruptors due to their hormone mimicking abilities.Like hormones, these chemicals exert their effects at very low concentrationsand often operate in a non-linear dose response manner. Moreover, if thesehormonal disruptions occur during critical developmental periods, life-longfunctional changes can occur. These properties—low concentrations, tissuespecificity, non-linear dose responses, and disruptions at precise time periods—make it difficult to assess the role of environmental chemicals in causing obesityand diabetes. Nonetheless, there are now close to 20 chemicals, includingorganophosphate pesticides, carbamates, and antithyroid drugs, that have beenlinked to obesity or diabetes in animals. In addition, there are chemicals , suchas anabolic steroids and the estrogenic drug diethylstilbestrol (DES), that havebeen used for decades to promote fattening and growth of farm animals.83,84
Here, we review selected examples associating chemical exposure to thedevelopment of obesity.
8.8 Animal Studies
8.8.1 Bisphenol A
Recently, there has been a great deal of interest in BPA because of its highproduction volume and its potential for widespread commercial use. Numerousstudies have shown a link between BPA exposure and increased body weightand adiposity in animal models.85–90 BPA exposure during gestation andlactation accelerated adipogenesis or increased fat pad weights at the time of, orsoon after, weaning.90–92 A recent study in rats confirmed an increase in theexpression of adipogenic genes in adipose tissue at the time of weaning in BPAexposed animals.91 Some evidence suggests that the increases in body weightare sex specific, but timing and dose may contribute to the complexity of these
Obesity and Diabetes: Role of Environmental Chemical Exposures 211

findings.89,91,92 Thus far changes in body weight have been reported in animalsexposed to BPA during gestation, during the gestation and throughoutlactation, and in one study, BPA exposure continued through PND 30 whenanimals were sacrificed.93 To date, no studies have continued BPA exposurethroughout life, and few have followed measurements of body weight andadiposity through adulthood and to later ages. Far more investigation is neededin order to understand the effects of BPA exposure on body weight andadiposity prepubertally later in life, and the mechanisms through which BPAmay be acting.94
8.8.2 Organotins
Organotins are used in plasticizers, slimicides, fungicides, antifoulants,catalysts, and stabilizers. Tributyl tin (TBT) and triphenyl tinare retinoid Xreceptor and PPARg agonists.95,96 Peripubertal exposure to TBT increasesboth body and fat mass. Neonatal male and female mice exposed to TBTin utero had greater Oil Red O staining (indicative of lipid droplets) in theirlivers, testis, and adipose tissues at birth and 20% increased adipose mass overcontrols in adulthood.96 In utero exposure of mice to TBT caused multipotentstem cells to differentiate into adipocytes when collected from adult mice,compared with similarly collected ex vivo cells from vehicle-treated mice.97 Thisresulted in a greater lipid accumulation within stem cells-turned-adipocytesfrom mice prenatally exposed to TBT, compared with vehicle-treated mice.97
Further, the stem cells from mice exposed to TBT in utero had a greaterpropensity to become lipid-filled adipocytes when exposed to more TBT or thediabetes drug rosiglitizone, another PPARg agonist. This increased adipogeniccapacity may have resulted in a TBT-induced shift in cell population.97,98 Malemice exposed to TBT during puberty had increased body mass, associated withincreased relative fat mass.98,99 In rats exposed to TBT beginning in utero andcontinuing throughout adulthood, the trend of body mass and fat is lessconsistent than that observed for other TBT developmental exposure studies;male rats had a small decrease in body mass, whereas 2 other studies foundopposite effects of TBT exposure on the body weights of female rats.98,100 Thusthe animal data are conclusive for the role of TBT and other tin analogs asobesogens. Unfortunately there are no human data on developmentalexposures to TBT and weight gain and few data on human exposures.
8.8.3 Cigarette Smoke/Nicotine
When mice were exposed to cigarette smoke while pregnant, the influence of thecigarette smoke on the body weights of their offspring was gender-dependentand diet-dependent.101 Adult female offspring fed a normal diet hadsignificantly increased body weights if exposed to cigarette smoke in utero,compared with unexposed females, but cigarette smoke did not impact bodyweights of females fed a high fat diet for 2 weeks.102 Adult male offspring exposedto cigarette smoke in utero had a higher body weight than control-treated
212 Chapter 8

males if fed a high fat diet, but there was no cigarette smoking effect on malebody weight if males ate a normal diet.102 Male rats exposed to nicotine in uterohad significantly increased body mass and white adipose tissue mass at weaningand throughout adulthood.101 There was also evidence of adipocyte hyper-trophy in the white adipose tissue mass at weaning. In utero nicotine exposuredid not change food intake or energy expenditure. However, nicotine exposurewas associated with higher food efficiency (food intake relative to body weightincrease), decreased physical activity, decreased brown adipose tissue mass, anddecreased thermogenesis.101 None of these in utero nicotine effects were evidentin female offspring.101 Adult male mice (females were not tested) exposed to thecigarette smoke and diesel exhaust constituent, benzo[a]pyrene had increasedbody weights and weight gain compared with unexposed mice.101 In anotherstudy, the longer that adult male rats were exposed to diesel exhaust, the greaterthe increase in their body weights.103 These effects have not been reproduced incell culture, where differentiation of 3T3-L1 preadipocytes, as well as their lipidaccumulation, was decreased dose-dependently up to exposure equivalent to1 pack of cigarettes.98,104
8.8.4 Polyfluoroalkynes (PFOAs)
Perfluorooctanoic acid (PFOA), also known as C8 or perfluorooctanoate, is asynthetic, stable, perfluorinated carboxylic acid and fluorosurfactant. PFOAsare used as surfactants in the emulsion polymerization of fluoropolymers, suchas in the manufacture of prominent consumer goods like Teflon and Gore-Tex.PFOA has been manufactured in industrial quantities since the 1940s. It is alsoformed by the degradation of precursors such as some fluorotelomers. PFOAsare persist indefinitely in the environment. It is a toxicant and carcinogen inanimals. PFOAs have been detected in the blood of more than 98% of thegeneral US population in the low and sub-parts per billion range, and levels arehigher in chemical plant employees and surrounding subpopulations.105
Mice exposed to low levels of PFOAs in utero had significantly increasedbody mass by 10 weeks old, which persisted through to midlife.106 Interestingly,when these mice reached 18 months of age, there was an inverse and directdose–response relationship between in utero PFOA doses and abdominal whiteand brown adipose tissue masses respectively.106 However, mice exposed tohigh doses of PFOAs during gestation had decreased body mass.106–108 In linewith observations of adult human exposure to PFOAs, mice exposed to PFOAsas adults experienced no change in body mass or fat mass across PFOA dosesand ages.106
8.9 Human Studies
8.9.1 Maternal Smoking
The epidemiological data strongly support a positive and likely causalassociation between maternal smoking and increased risk of obesity or
Obesity and Diabetes: Role of Environmental Chemical Exposures 213

Figure 8.4 (Continued)
214
Chapter
8

overweight in offspring. This conclusion was based on the very consistentpattern of overweight/obesity observed in the children of mothers’ who smokedduring pregnancy, along with findings from laboratory animals exposed tonicotine during development.71 Approximately 20 epidemiological studies haveexamined the impact of maternal smoking during pregnancy and body weighton offspring during childhood or adulthood. These studies show a consistentassociation between maternal smoking during pregnancy and increased risk ofoverweight/obesity in the offspring (Figure 8.4). This literature was evaluated intwo recent meta-analyses.109,110 The pooled OR estimate in Oken et al.109 forelevated risk of overweight was 1.50 (95% CI: 1.35–1.65) based on 14 studies.The pooled OR in Ino110 for obesity (BMI495th percentile) was 1.64(1.42–1.90) based on 16 studies.
Both meta-analyses used funnel plot methods to ascertain publication biasand concluded that there was some evidence for publication bias, but notenough to negate the overall conclusion of increased risk. Adjusted pooled ORsthat considered publication bias were still significant: OR (95% CI)¼ 1.40(1.26–1.55)109 and 1.52 (1.36–1.70).110
8.9.2 Persistent Organic Pollutants
As mentioned earlier, the prevalence of obesity is reaching epidemicproportions worldwide and the increasing prevalence of obesity in youngchildren is alarming. Early environmental influences may be a large contributorto this problem as children may be especially sensitive to the effects ofendocrine-disrupting chemicals, such as POPs, when exposed prenatally and/orpostnatally. Unfortunately, the human literature on POPs and childhoodobesity is very limited and results are not consistent. Some studies havereported that exposure to pesticides (e.g. DDE) and organochlorines (e.g.PCBs) are associated with increased BMI during childhood111,112 and inadulthood.113 One study found that children with higher levels of hexachloro-benzene (HCB) have an elevated risk of 1.69 (95% CI: 1.05, 2.72) and 2.02(95% CI: 1.06, 3.85) of being overweight and obese.114 However, there is also
Figure 8.4 Human studies on maternal smoking during pregnancy and risk forchildhood overweight and obesity. Abbreviations: Amer. Ind – AmericanIndian; ALSPAC – Avon Longitudinal Study of Parents and Children;adjOR – adjusted odds ratio; BBC – British Birth Cohort; BMI – body massindex; CESAR – Central European Study on Air Pollution and RespiratoryHealth; CLASS – Children’s Lifestyle and School Performance study; CPP– Collaborative Perinatal Project; GDM – gestational diabetes mellitus;Gen R – Generation R study; NCDS – National Child Development Study;NLSY – National Longitudinal Survey of Youth; PedNSS – PediatricNutrition Surveillance System; WIC – Women, Infants, and Childrenprogram; RR– relative risk; wt. – weight; ref. – referent group. Riskestimates for bracketed statistics, i.e., [crudeRR] calculated based on datapresented in the paper using an open source epidemiology statisticsprograms, OpenEpi (http://www.openepi.com/menu/openEpiMenu.htm)
Obesity and Diabetes: Role of Environmental Chemical Exposures 215

Figure 8.5 (Continued)
216
Chapter
8

evidence of inverse associations between some POPs and childhood growth,115
meaning there is still much research needed before any causal inferences can bemade (Figures 8.5 and 8.6).
8.10 Type 2 diabetes
8.10.1 Background
Type 1 diabetes (formerly known as juvenile, or insulin-dependent diabetes) iscaused by autoimmune destruction of the pancreatic beta cells, resulting indeficient or absent insulin production, and can occur at any age. Type 2diabetes (formerly known as adult-onset, or non-insulin-dependent diabetes),accounts for 90–95% of diabetes cases, and is characterized by increased insulinresistance, as well as pancreatic beta cell dysfunction. The third most commontype of diabetes, gestational diabetes, appears during pregnancy and resolvesafterwards. Gestational diabetes complicates about 7% of all pregnancies, andincreases the mother’s later risk of type 2 diabetes. Pre-diabetes is an inter-mediate step (in all types of diabetes), defined by impaired glucose tolerance(post-meal) or impaired fasting blood glucose levels that are above normal butnot high enough to qualify as diabetes.11
Increased insulin resistance (equivalent to decreased insulin sensitivity)occurs when the body’s cells fail to respond effectively to circulating insulin. Inan insulin resistant state, the ability of insulin to promote glucose uptake in thefat, muscle, and liver cells is reduced, and/or the ability of insulin to inhibit theliver’s production of glucose is reduced.109 In type 2 diabetes, insulin resistancemay occur many years before diabetes develops, in conjunction with hyper-insulinemia (excess circulating insulin).29 It is not known whether hyper-insulinemia preceeds insulin resistance in the progression of type 2 diabetes, orvice versa.109 It is thought however, that during pre-diabetes, the beta cellshypersecrete insulin in an attempt to maintain normal blood glucose levelsduring a state of high insulin resistance. This hyperinsulinemia produces excessinsulin signaling and can lead to hypertension and high triglyceride levels.110
Eventually, when the pancreatic beta cells are no longer able to secreteadequate insulin to compensate for the increased demands of insulin resistance,impaired glucose tolerance results, finally progressing to type 2 diabetes.29 Inaddition to its association with insulin resistance, type 2 diabetes is also char-acterized by beta cell failure, which involves both a deterioration in beta cellfunction and a loss of beta cell mass.111
Figure 8.5 Human studies on POPs exposure and risk for childhood overweight andobesity. Abbreviations: NHANES – National Health and NutritionExamination Survey; HCB – Hexachlorobenzene; PFOS – perfluorooctanesulfonate; PFOA – perfluorooctanoic acid; PFNA – perfluorononanoicacid; PFHxS – perfluorohexane sulfonate; adjOR – adjusted odds ratio;avg – average; mat. cord – maternal cord.
Obesity and Diabetes: Role of Environmental Chemical Exposures 217

Figure 8.6 (Continued)
218
Chapter
8

Whether this reduction in beta cell mass is a cause or consequence of diseaseis debated. Pancreatic beta cells originate from ductal cell precursors in uteroand expand during early infancy. Around 97% of human beta cells areestablished by age 20.112 In rodents, beta cells can adapt to an increased insulinrequirement (due to pregnancy, obesity, etc.) by increasing beta cell mass. Inhumans, beta cell mass is somewhat increased during pregnancy and obesity,although not to the extent seen in rodents. Human beta cells can alsosignificantly increase their secretory capacity to compensate for insulinresistance. During their first year of life, rodents can respond to beta celldamage with beta cell proliferation. In humans, beta cell replication is alsohighest in early life, and may not occur at all over age 30.112
Type 2 diabetes incidence and prevalence increases with age.4,113 Whether ornot insulin resistance increases and/or beta cell function declines simply due toage is not clear. Beta cell proliferation does decline with age, as apoptosisincreases.12 Glucose tolerance also declines with age, although the mechanismsvary by sex. In elderly men, defects in insulin secretion and insulin action, withincreased glucose uptake by the liver, leads to this impaired glucose tolerance.In elderly women however, insulin secretion and insulin action do not differfrom that of younger women.114
Obesity alone is not necessary or even sufficient to cause type 2 diabetes. In aUS-wide survey, while obesity was clearly associated with type 2 diabetes, 20% ofadults with diabetes were neither overweight nor obese, and 57% of obese indi-viduals did not have type 2 diabetes.115 Overweight and obesity can, however,contribute to insulin resistance via several pathways, including an imbalance inhormones (leptin, adiponectin, glucagon) and inflammatory signals [29].
8.10.2 Control of Blood Glucose Levels
Diabetes is a disease of high blood glucose (hyperglycemia). Like control ofweight and metabolism, the control of blood glucose is controlled by a complexendocrine system. The body control of blood glucose is simpler than control offood intake and metabolism. The main regulators are insulin and glucagon,with involvement of sex hormones, thyroid hormones, glucocorticoids, andnumerous other hormonal systems. Blood glucose levels are controlledprimarily with two hormones, insulin and glucagon. Insulin signals fat, muscle,
Figure 8.6 Human studies on POPs exposure and risk for childhood overweight andobesity (beta estimates). Beta estimates are adjusted b’s except forstudies by Verhulst et al. Abbreviations: PCB – polychlorinated biphenyls;DDT– dichlorodiphenyltrichloroethane; DDE – dichlorodiphenyldichloro-ethylene; HCB – Hexachlorobenzene; PFCs- perfluorinated compounds;PFOS – perfluorooctane sulfonate; PFOA – perfluorooctanoic acid;PCDD – polychlorinated dibenzodioxins; PCDF – polychlorinateddibenzofurans; adjb – adjusted Beta Coefficient; nat’l – national; BMI –body mass index; SDS– standard deviation score; mat. – maternal; TEQ –toxic equivalent; avg. – average; MI – Michigan; Q1 – 1st quartile; Q2 – 2th
quartile.
Obesity and Diabetes: Role of Environmental Chemical Exposures 219

and liver cells to take up and store glucose from the blood, reducing bloodglucose levels. Glucagon raises blood glucose levels by signaling to the liver tosynthesize and release glucose into the blood. Insulin is produced and secretedby the beta cells of the pancreas, stimulated directly by high glucose levels in theblood. Glucagon is produced and secreted by the alpha cells of the pancreas, inresponse to low glucose levels in the blood. Insulin secretion by beta cellsdepends primarily on glucose levels, but is complemented by various otherhormonal signals, as well as fatty acids and amino acids.111
Estrogens are involved in blood glucose regulation. At normal, physiologicallevels, estrogens help maintain proper glucose control, and protect beta cellfunction. At high or low levels however, estrogens may promote type 2 diabetesand insulin resistance. Low estrogen levels, due to menopause or ovariectomy,are associated with impaired glucose tolerance and insulin resistance, which arecounteracted by hormone replacement therapy. High estrogen levels, due topregnancy, are also associated with impaired glucose tolerance and increasedinsulin resistance. During pregnancy, beta cells increase insulin secretionto adapt to this insulin resistance, and estrogen probably plays a role in thisadaptation, by promoting insulin secretion. (If the beta cells fail to adequatelyadapt, gestational diabetes results). When adult male mice are given estradiol,their beta cells increase insulin production and secretion, and they developinsulin resistance, as if they are pregnant. This artificially-induced high insulinsecretion overstimulates beta cells and, over time, may contribute to theirfailure. Excessive insulin signaling can lead to glucose intolerance in fat cellsand promote insulin resistance in the liver and muscle. In combination, theeffects of estradiol in male mice could contribute to the development of type 2diabetes.110
8.10.3 Developmental Programming, Environmental Exposures
and Type 2 Diabetes
Many of the chemicals discussed affect the beta cells, disrupting beta cellfunction and mechanisms of insulin production and secretion (Table 8.4).116,118
Many of the chemicals discussed can also cause insulin resistance in animals, orare associated with insulin resistance in humans. Many are also linked tohyperglycemia, impaired glucose intolerance, or gestational diabetes. Thesechemicals are not all estrogenic, but most are EDCs. Aside from estrogen, otherhormones also play a role in glucose metabolism. Androgens can affect insulinsensitivity and glucose tolerance; various chemicals can act as androgenagonists or antagonists, and may thus disrupt glucose homeostasis. Chemicalsthat disrupt the thyroid, glucocorticoid, or AhR hormone receptors may alsohave diabetogenic effects.117
In addition to endocrine disruption, other mechanisms may play a role in thediabetogenic effect of chemicals. For example, metals, including mercury,cadmium, and nickel, may affect beta cells or glucose regulation via oxidativestress. Beta cells are susceptible to oxidative stress, and reactive oxygen specieshave been shown to promote the progression of beta cell dysfunction.118
220 Chapter 8
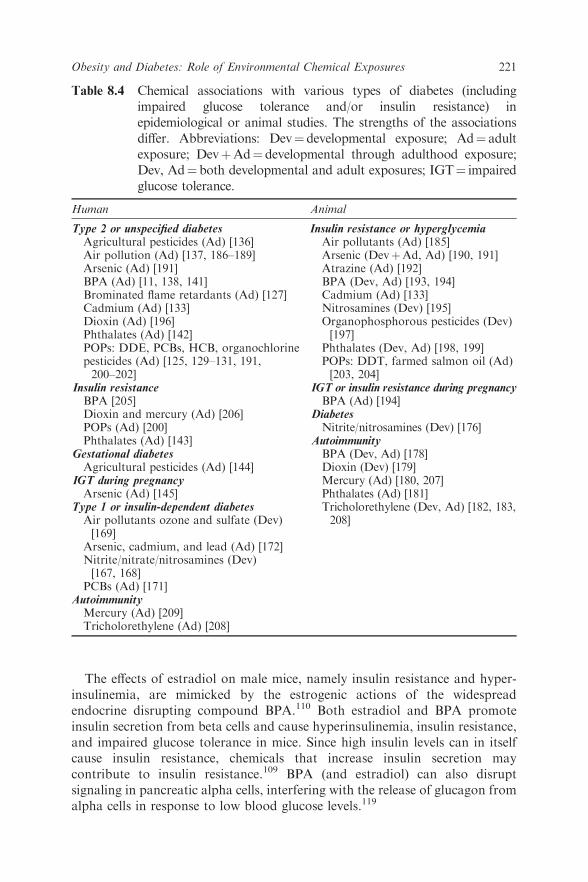
The effects of estradiol on male mice, namely insulin resistance and hyper-insulinemia, are mimicked by the estrogenic actions of the widespreadendocrine disrupting compound BPA.110 Both estradiol and BPA promoteinsulin secretion from beta cells and cause hyperinsulinemia, insulin resistance,and impaired glucose tolerance in mice. Since high insulin levels can in itselfcause insulin resistance, chemicals that increase insulin secretion maycontribute to insulin resistance.109 BPA (and estradiol) can also disruptsignaling in pancreatic alpha cells, interfering with the release of glucagon fromalpha cells in response to low blood glucose levels.119
Table 8.4 Chemical associations with various types of diabetes (includingimpaired glucose tolerance and/or insulin resistance) inepidemiological or animal studies. The strengths of the associationsdiffer. Abbreviations: Dev¼ developmental exposure; Ad¼ adultexposure; DevþAd¼ developmental through adulthood exposure;Dev, Ad¼ both developmental and adult exposures; IGT¼ impairedglucose tolerance.
Human Animal
Type 2 or unspecified diabetes Insulin resistance or hyperglycemiaAgricultural pesticides (Ad) [136] Air pollutants (Ad) [185]Air pollution (Ad) [137, 186–189] Arsenic (DevþAd, Ad) [190, 191]Arsenic (Ad) [191] Atrazine (Ad) [192]BPA (Ad) [11, 138, 141] BPA (Dev, Ad) [193, 194]Brominated flame retardants (Ad) [127] Cadmium (Ad) [133]Cadmium (Ad) [133] Nitrosamines (Dev) [195]Dioxin (Ad) [196]Phthalates (Ad) [142]POPs: DDE, PCBs, HCB, organochlorinepesticides (Ad) [125, 129–131, 191,200–202]
Insulin resistanceBPA [205]Dioxin and mercury (Ad) [206]POPs (Ad) [200]Phthalates (Ad) [143]
Gestational diabetesAgricultural pesticides (Ad) [144]
IGT during pregnancyArsenic (Ad) [145]
Type 1 or insulin-dependent diabetesAir pollutants ozone and sulfate (Dev)[169]
Arsenic, cadmium, and lead (Ad) [172]Nitrite/nitrate/nitrosamines (Dev)[167, 168]
Organophosphorous pesticides (Dev)[197]
Phthalates (Dev, Ad) [198, 199]POPs: DDT, farmed salmon oil (Ad)[203, 204]
IGT or insulin resistance during pregnancyBPA (Ad) [194]
DiabetesNitrite/nitrosamines (Dev) [176]
AutoimmunityBPA (Dev, Ad) [178]Dioxin (Dev) [179]Mercury (Ad) [180, 207]Phthalates (Ad) [181]Tricholorethylene (Dev, Ad) [182, 183,208]
PCBs (Ad) [171]AutoimmunityMercury (Ad) [209]Tricholorethylene (Ad) [208]
Obesity and Diabetes: Role of Environmental Chemical Exposures 221

Gestational diabetes alone increases the risk of glucose abnormalitiesin the offspring. In animal experiments, developmental exposure tohyperglycemia/maternal diabetes is clearly linked to later metabolicdysfunction in the offspring, including disruption of beta cell function andinsulin secretion, and abnormal insulin signaling.120
The bottom line is that it is likely that type 2 diabetes, like obesity, startsduring development, both in utero and in early childhood. Thus the devel-opmental origins of disease paradigm also holds true for type 2 diabetes.
In contrast to obesity where the majority of the supporting data comes fromanimal studies, in type 2 diabetes, the majority of the data comes from humanstudies, which we review here.
8.10.4 Developmental Exposures in Humans
To date, there have been no epidemiological studies on developmentalexposures to environmental chemicals and the later development of type 2diabetes. However, other non-chemical developmental exposures have longbeen linked to later type 2 diabetes. Individuals whose mothers sufferedthrough the Dutch winter famine during pregnancy had impaired glucosetolerance in their 50s. The effect does not appear to progress more rapidly withincreasing age.121 Low birth weight is also associated with the development oftype 2 diabetes in adulthood.122 Fetal exposure to maternal diabetes isassociated with a higher risk of impaired glucose tolerance and insulinresistance, an effect that can even be transmitted to subsequent generations,implying an epigenetic mechanism.123 Based on this evidence, it is reasonable topropose that developmental exposures to environmental chemicals may alsoaffect the later development of type 2 diabetes.
8.10.5 Human Adult Exposures
In humans, there is growing evidence that adult exposures toEDCs can contributeto the development of type 2 diabetes. Numerous cross-sectional studies of adultshave found associations between diabetes and exposure to various POPs,especially dioxin.116 While some of these studies were conducted in populationswith high exposure levels, cross-sectional studies using the US National Healthand Nutrition Examination Survey (NHANES) have found associations betweendiabetes and various POPs, including dioxin-like PCBs, organochlorinepesticides, and brominated flame retardants at background exposure levels.124–127
POPs are also associated with insulin resistance in NHANES.128
Longitudinal studies have also found associations between POPs anddiabetes. The specific POPs and the shapes of the dose–response curves vary,with some dose–response curves showing non-monotonic associations.129–131
One longitudinal study of Swedish 70 year olds found that exposure POPs,especially PCBs and organochlorine pesticides, was strongly linked to thedevelopment of type 2 diabetes 5 years later.132 In a cohort of 50–59 year oldSwedish women, baseline DDE levels were associated with an increased risk of
222 Chapter 8

diabetes in the women who developed diabetes more than 6 years afterbaseline.130 In a cohort of adult Great Lakes sport fish consumers, DDE wasassociated with type 2 diabetes development 10 years after baseline.131 A studyof young US adults without diabetes found that baseline levels of DDE andPCBs was linked to higher insulin resistance 18 years later.132
Additionally, epidemiological studies have linked cadmium exposure todiabetes.133
Agricultural pesticide exposure has been associated with diabetes ormortality rates from diabetes in agricultural workers.134–136 Cross-sectionalstudies have found associations between air pollution and type 2 diabetes. Onelongitudinal study of elderly German women found that traffic-related airpollution was associated with type 2 diabetes.137
A number of cross-sectional studies have evaluated BPA levels and diabetes,and most have found associations, although the findings areinconsistent.11,138–141 Overall, NHANES data from 2003–2004, but notnecessarily data from other years or other surveys, show an association betweendiabetes and BPA. Exposure to phthalates are associated with self-reporteddiabetes in Mexican women in one cross-sectional study.142 Increased insulinresistance is also associated with phthalate levels in US adult men.143 The lackof longitudinal data, or developmental exposure data, on these less persistentchemicals makes it difficult to form conclusions from the existing data.
8.10.6 Exposure During Pregnancy
Exposure to environmental chemicals during pregnancy may increase the riskof gestational diabetes. Pregnant women exposed to agricultural pesticidesduring their first trimester were more likely to develop gestational diabetes.144
Arsenic exposure has been associated with impaired glucose tolerance duringpregnancy in women with relatively low levels of arsenic exposure.145 Sincegestational diabetes increases the risk of later diabetes in the mother and laterglucose abnormalities in the child, the role of environmental chemicals ingestational diabetes should be further investigated.
Environmental chemical exposures may also play a role in diabetescomplications. Exposure to organochlorine pesticides is associated with neuro-pathy in people with diabetes or impaired fasting glucose. The associationremained strong even in people with a low HbA1c (below 7%). Exposure tothese POPs was also strongly associated with a higher HbA1c. POPs are knownto be neurotoxicants, which may be a factor in their association with neuro-apathy.128 Similarly, cadmium is toxic to the kidney and may act together withhyperglycemia to contribute to nephropathy.133
8.11 Type 1 Diabetes
8.11.1 Background
While the autoimmune disease type 1 diabetes is often thought to be a diseaseof childhood, type 1 diabetes can develop at any age. Surveys from Sweden,
Obesity and Diabetes: Role of Environmental Chemical Exposures 223

Minnesota, Finland, and Denmark have found that incidence peaks in bothchildren and older adults: in children around the time of puberty, and in adultsaged 50–80 years.113 About 10% of adults with presumed type 2 diabetes testpositive for type 1-associated GAD or islet cell autoantibodies and actuallyhave a slowly progressive form of autoimmune or type 1 diabetes.146
8.11.2 Incidence
A number of environmental factors—including early infant diet, viruses, vitaminD deficiency, excess weight gain, and gut microbiota—are being investigated aspotential contributors to an increase in the incidence of type 1 diabetes, althoughnone have been clearly identified.147 The role of environmental chemicals in thisincrease remains a largely unexplored area of research.148
8.11.3 Endocrine Role and Endocrine Disruption
The immune system interacts extensively with the endocrine system; numerousimmune cells have estrogen receptors and androgen receptors for example.Sex hormones are involved in both in the development and progression ofautoimmune diseases. In women, hormonal fluctuations (e.g. pregnancy,menstrual cycle, oral contraceptives) influence the course of autoimmunedisease. Most autoimmune diseases are more common in women than in men,perhaps due to the stimulation of an immune response by estrogen. Yet whileestrogens appear to promote many autoimmune diseases, androgens appear topromote others.149 The role of estrogens in autoimmunity however, depends onthe concentration studied, the differing effects of different peripheral estrogenmetabolites, and the differing effects on target cells and different receptors.150
The overall pattern is not clear-cut, since some autoimmune diseases tendto ameliorate during pregnancy, and flare postpartum, while others exhibitthe opposite pattern, worsening during pregnancy but improvingpostpartum.151,152
Unlike most other autoimmune diseases, the male/female sex ratio in type 1diabetes is approximately equal, although this ratio varies by age and bypopulation. Natural hormonal fluctuations may influence the development oftype 1 diabetes, since type 1 diabetes incidence is high during puberty and ismore likely to appear during pregnancy than in a non-pregnant state (whetherthese patterns are due to hormonal changes, increased insulin resistance, orboth is not known).153 Pregnancy can influence the appearance and levels oftype 1 related autoantibodies; in a group of women without diabetes, mostexhibited a decline in type 1 autoantibody levels during the course ofpregnancy, while others experienced an increase, and a few converted fromantibody negative to positive during pregnancy.151 Around 10% of gestationaldiabetes cases are autoimmune and associated with later progression to type 1diabetes. Women with this ‘‘autoimmune gestational diabetes’’ generallyrequire insulin during pregnancy, experience remission of insulin dependencepostpartum, and later progress to type 1 diabetes and insulin dependence.154
224 Chapter 8

In women with type 1 diabetes, hormonal fluctuations during the menstrualcycle affect insulin dose, as do fluctuations during puberty and pregnancy.During pregnancy, insulin requirement peaks at week 9, falls until week 16,rises again until week 37, and falls by 50% immediately following delivery.Some pregnant women with long-standing type 1 diabetes even appear toregain some beta cell function during pregnancy, a finding that, in addition tohormone-induced insulin resistance, may also affect insulin dose.155
The peak incidence of type 1 diabetes in childhood is during puberty, perhapsdue to insulin resistance during that time. In adolescents without diabetes,insulin resistance and insulin secretion increase during puberty, peaking in mid-puberty and returning to prepubertal levels by the end of puberty. The changesin insulin resistance correlate with growth hormone levels and adrenalandrogens, but not sex steroid hormones.156
Metabolic factors appear to play a role in the development of type 1 diabetes.Higher body weight is associated with type 1 diabetes development, and insulinresistance is a risk factor for progression to type 1 diabetes in people with isletautoimmunity.157 Beta cells that are stressed by metabolic factors such asobesity and insulin resistance may offer more of a target to the autoimmuneattack of type 1 diabetes, accelerating the progression of disease.158
Endocrine disrupting chemicals are known to affect the immune system, andpromote autoimmunity. These chemicals can also affect beta cells, andcontribute to obesity and insulin resistance. These effects may play a role in theinitiation or progression of type 1 diabetes. Whether individual chemicals withmultiple effects or multiple chemicals acting in concert influence type 1 is notknown. Since the antibodies associated with type 1 diabetes may appear veryearly in life (even in utero), followed by diabetes years later, developmentalexposures are likely to be important in disease development.159
8.11.4 Evidence from Human and Animal Studies
EDCs have not been adequately evaluated in the development or progression oftype 1 diabetes. We will briefly review the evidence from human studies first,followed by animal studies. Where evidence on EDCs is lacking, we will includesome evidence of other chemicals and other environmental factors.
8.11.4.1 Human Evidence
Early life exposure to a number of environmental factors—including vitamin Ddeficiency, cow’s milk infant formula, and viruses—has been associated withlater type 1 diabetes development in humans. For example, in Norway, the riskof type 1 diabetes is more than two-fold higher for the children of mothers whohad low levels of vitamin D during pregnancy, as compared to mothers withhigher levels.160 Finnish children given regular vitamin D supplements duringinfancy had a reduced risk of type 1 diabetes into adulthood.160 The highincidence of type 1 diabetes in these Scandinavian countries has promptedresearch into vitamin D deficiency and type 1 diabetes.
Obesity and Diabetes: Role of Environmental Chemical Exposures 225

Preliminary results from an ongoing double-blind, randomized controlledtrial shows that dietary supplementation with hydrolyzed infant formula whenbreast milk is not available reduces the risk of type 1 associated antibodies inchildren until age 10, as compared to regular infant formula.161 Virus exposurein the first year of life, in conjunction with early exposure to cow’s milk, isassociated with type 1 diabetes-associated autoimmunity, suggesting an inter-action between these two factors.162
Other developmental factors associated with an increased risk of later type 1diabetes includes birth by Cesarean section,163 high birth weight,164 andadvanced maternal age.165 The congenital rubella syndrome predisposes peopleto diabetes later in life, although whether this is autoimmune diabetes is notentirely clear since the studies on congenital rubella were carried out before therubella vaccine, before testing for autoimmunity was well established.166
Dietary consumption of nitrates and nitrites may play a role in type 1diabetes development, although studies are somewhat inconsistent.167 An earlyepidemiological study from Iceland found that parents’ consumption ofIcelandic smoked mutton, a meat cured with nitrites, around the time ofconception increased their sons’ risk for type 1 diabetes.168
Measurements of environmental chemical exposures are largely absent fromongoing studies of type 1 diabetes development. One study however, found thatexposure to the air pollutants sulfate and ozone during infancy and childhoodincreased the risk of type 1 diabetes in children.169 Another study of in uteroexposure to POPs however, did not find an association between POP exposureand a later risk of type 1 diabetes.170
In adults however, POPs have been associated with type 1 diabetes. In agroup of pregnant women, PCB levels in those with type 1 diabetes were 30%higher than in those without diabetes.171 Similarly, levels of arsenic, cadmium,and lead were higher in insulin-dependent diabetic mothers than in controlswithout diabetes.172 Until it was removed from the market, the rodenticideVacor caused, via beta cell toxicity, insulin-dependent diabetes in children andadults who ingested it. Autoantibodies characteristic of type 1 diabetes werefound in some of these people.173
8.11.4.2 Animal Exposures
A large number of environmental factors—including viruses, vitamin D levels,weight gain, a hydrolyzed diet, a gluten-free diet, probiotics, antibiotics, beta cellrest (including insulin treatment), pharmaceutical drugs (e.g. cyclosporin) andbeta cell toxins—modulate the development of diabetes in animal models.174
Some chemicals promote diabetes in laboratory animals. The beta cell toxinstreptozotocin (STZ), given to rodents to induce insulin-dependent diabetes inthe lab, also induces insulin-dependent diabetes, accompanied by signs ofautoimmunity in young primates.175 Developmental exposure to nitrites insmoked meat causes diabetes in mice; glucose levels were affected even whenparents consumed this meat only up until the time of conception, implying aneffect on germ cells.176
226 Chapter 8

Laboratory animals prenatally exposed to immunotoxic chemicals showexacerbated autoimmunity. The effects of perinatal exposure may be greater ormore persistent than the effects following adult exposure.177 Numerouschemicals—including BPA,178 dioxin,179 mercury,180 phthalates,181 and trichloro-ethylene182—have been found to promote autoimmunity in animals followingeither developmental or adult exposures (see Table 8.4). None of these chemicalshave yet been evaluated in type 1 diabetes in humans. Yet some (mercury andtrichloroethylene) have different results in non-obese diabetic (NOD) mice (ananimal model of type 1 diabetes), showing almost protective effects. Theconflicting animal experiments appear to indicate that timing, duration ofexposure, and predisposing factors like genetic background are probablyimportant in the development of autoimmunity.183 These conflicting resultsmay also be due to the peculiarities of NOD mice, in that most interventionsprevent diabetes in these mice. NOD mice develop diabetes spontaneously, viamechanisms that are not always relevant to humans.184
While direct evidence is lacking, preliminary evidence indicates that exposureto environmental chemicals with immunotoxic and/or beta cell toxic effectsmay exacerbate the development and/or progression of type 1 diabetes.Incorporating measurements of environmental chemical exposures intoongoing developmental studies of type 1 diabetes would likely help fill the gapin knowledge about the role of chemicals in this disease, and their possibleinteraction with other environmental factors.
8.12 Conclusion
There is growing concern in the scientific community that EDCs may becontributing to the rapidly increasing rates of diabetes and obesity. It is ofparticular concern that the incidence of both obesity and diabetes are risingrapidly in the young. While it is clear that eating calorie-dense, nutrient-poorfood in large portions, combined with lack of exercise, plays an important role,the rapid rise in obesity and diabetes in the young suggests the influence of earlylife exposures to chemicals may be playing an important role. Indeed themounting evidence reviewed in this chapter clearly links exposure to EDCs withthe incidence of obesity and diabetes. While the precise metabolic pathwaystargeted by most of these chemicals remain to be discovered, the data linkingEDCs with obesity, metabolic syndrome, and diabetes are strong, and thenumber of studies finding positive association is growing. Understanding themolecular mechanisms involved in the role of epigenetics and early lifeexposures will provide important insights into the etiology of these chronicdisorders and should play an important role in designing effective preventionstrategies.
References
1. G. Danaei et al., National, regional, and global trends in fasting plasmaglucose and diabetes prevalence since 1980: systematic analysis of health
Obesity and Diabetes: Role of Environmental Chemical Exposures 227

examination surveys and epidemiological studies with 370 country-yearsand 2.7million participants, Lancet, 2011, 378(9785), 31–40.
2. P. Zhang et al., Global healthcare expenditure on diabetes for 2010 and2030, Diabetes Res. Clin. Pract., 2010, 87(3), 293–301.
3. L. S. Geiss et al., Changes in incidence of diabetes in U.S. adults,1997–2003, Am. J. Prev. Med, 2006, 30(5), 371–377.
4. S. Volpato, C. Maraldi and R. Fellin, Type 2 diabetes and risk forfunctional decline and disability in older persons, Curr. Diabetes Rev.,2010, 6(3), 134–143.
5. D. Dabelea et al., Incidence of diabetes in youth in the United States,JAMA, 2007, 297(24), 2716–2724.
6. D. P. Group, Incidence and trends of childhood Type 1 diabetesworldwide 1990–1999, Diabet. Med., 2006, 23(8), 857–866.
7. C. C. Patterson et al., Incidence trends for childhood type 1 diabetes inEurope during 1989–2003 and predicted new cases 2005–20: a multicentreprospective registration study, Lancet, 2009, 373(9680), 2027–2033.
8. G. Bruno et al., The incidence of type 1 diabetes is increasing in bothchildren and young adults in Northern Italy: 1984–2004 temporal trends,Diabetologia, 2009, 52(12), 2531–2535.
9. E. A. Gale, The rise of childhood type 1 diabetes in the 20th century,Diabetes, 2002, 51(12), 3353–3361.
10. K. Calkins and S. U. Devaskar, Fetal origins of adult disease, Curr ProblPediatr Adolesc Health Care, 2011, 41(6), 158–176.
11. A. Shankar and S. Teppala, Relationship between Urinary Bisphenol ALevels and Diabetes Mellitus, J. Clin. Endocrinol. Metab., 2011.
12. U. Gunasekaran and M. Gannon, Type 2 diabetes and the agingpancreatic beta cell, Aging (Albany.NY), 2011, 3(6), 565–575.
13. B. Carstensen, D. R. Witte and S. Friis, Cancer occurrence in Danishdiabetic patients: duration and insulin effects, Diabetologia, 2011.
14. C. S. Fox, Cardiovascular disease risk factors, type 2 diabetes mellitus,and the Framingham Heart Study, Trends Cardiovasc. Med., 2010, 20(3),90–95.
15. L. J. Dominguez, G. Paolisso and M. Barbagallo, Glucose control in theolder patient: from intensive, to effective and safe, Aging Clin. Exp. Res.,2010, 22(4), 274–280.
16. O. Pinhas-Hamiel and P. Zeitler, Acute and chronic complications of type2 diabetes mellitus in children and adolescents, Lancet, 2007, 369(9575),1823–1831.
17. S. P. Laing et al., Mortality from cerebrovascular disease in a cohort of 23000 patients with insulin-treated diabetes, Stroke, 2003, 34(2), 418–421.
18. S. P. Laing et al., Mortality from heart disease in a cohort of 23,000patients with insulin-treated diabetes, Diabetologia, 2003, 46(6), 760–765.
19. The effect of intensive treatment of diabetes on the development andprogression of long-term complications in insulin-dependent diabetesmellitus. The Diabetes Control and Complications Trial Research Group.N. Engl. J. Med., 1993, 329(14), 977–986.
228 Chapter 8

20. E. S. Kilpatrick, A. S. Rigby and S. L. Atkin, Insulin resistance, themetabolic syndrome, and complication risk in type 1 diabetes: ‘‘doublediabetes’’ in the Diabetes Control and Complications Trial,Diabetes Care, 2007, 30(3), 707–712.
21. T. M. Triolo et al., One-Third of Patients Have Evidence for an Addi-tional Autoimmune Disease at Type 1 Diabetes Diagnosis, Diabetes Care,2011.
22. V. Carnevale, E. Romagnoli and E. D’Erasmo, Skeletal involvement inpatients with diabetes mellitus, Diabetes Metab. Res. Rev., 2004, 20(3),196–204.
23. J. Cawley and C. Meyerhoefer, The medical care costs of obesity: Aninstrumental variables approach, J Health Econ, 2011.
24. L. Trasande and Y. Liu, Reducing the staggering costs of environmentaldisease in children, estimated at $76.6 billion in 2008, Health Aff(Millwood), 2011, 30(5), 863–870.
25. J. Naukkarinen et al., Causes and consequences of obesity: thecontribution of recent twin studies, Int J Obes (Lond), 2011.
26. L. H. Larsen et al., Prevalence of mutations and functional analyses ofmelanocortin 4 receptor variants identified among 750 men with juvenile-onset obesity, J Clin Endocrinol Metab, 2005, 90(1), 219–224.
27. E. K. Speliotes et al., Association analyses of 249,796 individuals reveal 18new loci associated with body mass index,Nat Genet, 2010, 42(11), 937–948.
28. M. E. Travers and M. I. McCarthy, Type 2 diabetes and obesity:genomics and the clinic, Hum. Genet., 2011, 130(1), 41–58.
29. A. A. Tahrani et al., Management of type 2 diabetes: new and futuredevelopments in treatment, Lancet, 2011.
30. J. M. Howson et al., Genetic Analysis of Adult-Onset AutoimmuneDiabetes, Diabetes, 2011.
31. S. F. Grant, H. Hakonarson and S. Schwartz, Can the Genetics of Type 1and Type 2 Diabetes Shed Light on the Genetics of Latent AutoimmuneDiabetes in Adults?, Endocr. Rev., 2009.
32. J. Lin et al., From Type 1, through LADA, to type 2 diabetes: acontinuous spectrum?, Ann. N. Y. Acad. Sci., 2008, 1150, 99–102.
33. A. K. Steck et al., Stepwise or linear decrease in penetrance of type 1diabetes with lower-risk HLA genotypes over the past 40 years, Diabetes,2011, 60(3), 1045–1049.
34. K. A. Simpson and S. R. Bloom, Appetite and hedonism: gut hormonesand the brain, Endocrinol Metab Clin North Am, 2010, 39(4), 729–743.
35. T. H. Moran, Gut peptides in the control of food intake, Int J Obes(Lond), 2009, 33(Suppl 1), S7–S10.
36. H. C. Greenwood, S. R. Bloom and K. G. Murphy, Peptides and theirpotential role in the treatment of diabetes and obesity, Rev Diabet Stud,2011, 8(3), 355–368.
37. A. Gonzalez-Bulnes and C. Ovilo, Genetic Basis, Nutritional Challengesand Adaptive Responses in the Prenatal Origin of Obesity and Type-2Diabetes, Curr Diabetes Rev, 2012.
Obesity and Diabetes: Role of Environmental Chemical Exposures 229

38. P. J. Kenny, Common cellular and molecular mechanisms in obesity anddrug addiction, Nat Rev Neurosci, 2011, 12(11), 638–651.
39. N. D. Volkow and P. Skolnick, New medications for substance usedisorders: challenges and opportunities, Neuropsychopharmacology, 2012,37(1), 290–292.
40. N. D. Volkow et al., Food and Drug Reward: Overlapping Circuits inHuman Obesity and Addiction, Curr Top Behav Neurosci, 2011.
41. P. J. Kenny, Reward mechanisms in obesity: new insights and futuredirections, Neuron, 2011, 69(4), 664–679.
42. W. Wyrwicka, C. Dobrzecka and R. Tarnecki, On the instrumentalconditioned reaction evoked by electrical stimulation of the hypo-thalamus, Science, 1959, 130(3371), 336–337.
43. M. J. Will, W. E. Pratt and A. E. Kelley, Pharmacological char-acterization of high-fat feeding induced by opioid stimulation of theventral striatum, Physiol Behav, 2006, 89(2), 226–234.
44. M. A. McCrory, V. M. Suen and S. B. Roberts, Biobehavioral influenceson energy intake and adult weight gain, J Nutr, 2002, 132(12),3830S–3834S.
45. H. R. Berthoud, N. R. Lenard and A. C. Shin, Food reward, hyper-phagia, and obesity, Am J Physiol Regul Integr Comp Physiol, 2011,300(6), R1266–R1277.
46. A. Meule, How Prevalent is ‘‘Food Addiction’’?, Front Psychiatry, 2011,2, 61.
47. D. J. Barker and P. M. Clark, Fetal undernutrition and disease in laterlife, Rev Reprod., 1997, 2(2), 105–112.
48. R. R. Newbold et al., Developmental exposure to endocrine disruptorsand the obesity epidemic, Reprod Toxicol, 2007, 23(3), 290–296.
49. L. S. Birnbaum and S. E. Fenton, Cancer and developmental exposure toendocrine disruptors, Environ Health Perspect, 2003, 111(4), 389–394.
50. M. K. Skinner, M. Manikkam and C. Guerrero-Bosagna, Epigenetictransgenerational actions of environmental factors in disease etiology,Trends Endocrinol Metab, 2010, 21(4), 214–222. Epub 2010 Jan 14.
51. N. C. Whitelaw and E. Whitelaw, Transgenerational epigenetic inhe-ritance in health and disease, Curr Opin Genet Dev, 2008, 18(3), 273–279.Epub 2008 Aug 12.
52. J. A. McLachlan et al., Reduced fertility in female mice exposed trans-placentally to diethylstilbestrol (DES), Fertil Steril, 1982, 38(3),364–371.
53. R. R. Newbold et al., Proliferative lesions and reproductive tract tumorsin male descendants of mice exposed developmentally to diethylstilbestrol,Carcinogenesis, 2000, 21(7), 1355–1363.
54. L. Titus-Ernstoff et al., Offspring of women exposed in utero to diethyl-stilbestrol (DES): a preliminary report of benign and malignant pathologyin the third generation, Epidemiology, 2008, 19(2), 251–257.
55. M. D. Anway, S. S. Rekow and M. K. Skinner, Comparative anti-androgenic actions of vinclozolin and flutamide on transgenerational
230 Chapter 8

adult onset disease and spermatogenesis, Reprod Toxicol, 2008, 26(2),100–106. Epub 2008 Aug 13.
56. D. C. Dolinoy, D. Huang and R. L. Jirtle, Maternal nutrient supple-mentation counteracts bisphenol A-induced DNA hypomethylation inearly development, Proceedings of the National Academy of Sciences of theUnited States of America, 2007, 104(32), 13056–13061.
57. T. T. Schug et al., Endocrine disrupting chemicals and disease suscepti-bility, J Steroid Biochem Mol Biol, 2011, 127(3-5), 204–215.
58. E. Jasarevic et al., Disruption of adult expression of sexually selectedtraits by developmental exposure to bisphenol A. Proc Natl Acad SciU S A, 2011, 108(28), 11715–11720.
59. J. Cao et al., Neonatal Bisphenol A exposure alters sexually dimorphicgene expression in the postnatal rat hypothalamus, Neurotoxicology,2012, 33(1), 23–36.
60. S. M. Dickerson et al., Endocrine disruption of brain sexual differentiationby developmental PCB exposure, Endocrinology, 2011, 152(2), 581–594.
61. W. N. Jefferson, H. B. Patisaul and C. Williams, Reproductive conse-quences of developmental phytoestrogen exposure, Reproduction, 2012.
62. I. Ceccarelli et al., Estrogenic chemicals at puberty change ERalpha in thehypothalamus of male and female rats, Neurotoxicol Teratol, 2007, 29(1),108–115.
63. S. E. Fenton, C. Reed and R. R. Newbold, Perinatal environmentalexposures affect mammary development, function, and cancer risk inadulthood (*), Annu Rev Pharmacol Toxicol, 2012, 52, 455–479.
64. G. Rasier et al., Female sexual maturation and reproduction afterprepubertal exposure to estrogens and endocrine disrupting chemicals: areview of rodent and human data, Mol Cell Endocrinol,, 2006, 254–255,187–201.
65. D. C. Luccio-Camelo and G. S. Prins, Disruption of androgen receptorsignaling in males by environmental chemicals, J Steroid BiochemMol Biol, 2011, 127(1-2), 74–82.
66. R. R. Newbold, W. N. Jefferson and E. Padilla-Banks, Prenatal exposureto bisphenol a at environmentally relevant doses adversely affects themurine female reproductive tract later in life, Environ Health Perspect,2009, 117(6), 879–885.
67. N. J. Cabaton et al., Perinatal exposure to environmentally relevant levelsof bisphenol A decreases fertility and fecundity in CD-1 mice, EnvironHealth Perspect, 2011, 119(4), 547–552.
68. G. S. Prins et al., Serum bisphenol A pharmacokinetics and prostateneoplastic responses following oral and subcutaneous exposures inneonatal Sprague-Dawley rats, Reprod Toxicol, 2011, 31(1), 1–9.
69. Y. Masuo and M. Ishido, Neurotoxicity of endocrine disruptors: possibleinvolvement in brain development and neurodegeneration, J ToxicolEnviron Health B Crit Rev, 2011, 14(5-7), 346–369.
70. M. C. Keifer and J. Firestone, Neurotoxicity of pesticides,J Agromedicine, 2007, 12(1), 17–25.
Obesity and Diabetes: Role of Environmental Chemical Exposures 231

71. K. A. Thayer et al., Role of Environmental Chemicals in Diabetes andObesity: A National Toxicology Program Workshop Report, EnvironHealth Perspect, 2012.
72. F. S. Vom Saal et al., The estrogenic endocrine disrupting chemicalbisphenol A (BPA) and obesity, Mol Cell Endocrinol, 2012.
73. A. Janesick and B. Blumberg, Endocrine disrupting chemicals and thedevelopmental programming of adipogenesis and obesity, Birth DefectsRes C Embryo Today, 2011, 93(1), 34–50.
74. R. J. Dearman et al., Butyl benzyl phthalate: effects on immune responsesto ovalbumin in mice, J Appl Toxicol, 2009, 29(2), 118–25.
75. T. Kato et al., Endocrine disruptors that deplete glutathione levels in APCpromote Th2 polarization in mice leading to the exacerbation of airwayinflammation, Eur J Immunol, 2006, 36(5), 1199–209.
76. S. M. Belcher et al., Rapid estrogen receptor-mediated mechanismsdetermine the sexually dimorphic sensitivity of ventricular myocytes to17beta-estradiol and the environmental endocrine disruptor bisphenol a,Endocrinology, 2012, 153(2), 712–720.
77. S. Yan et al., Bisphenol A and 17beta-estradiol promote arrhythmia in thefemale heart via alterationof calciumhandling,PLoS.One, 2011, 6(9), e25455.
78. D. A. Drechsel and M. Patel, Role of reactive oxygen species in theneurotoxicity of environmental agents implicated in Parkinson’s disease,Free Radic Biol Med, 2008, 44(11), 1873–1886.
79. Z. Vucetic et al., Maternal high-fat diet alters methylation and geneexpression of dopamine and opioid-related genes, Endocrinology, 2010,151(10), 4756–4764.
80. Z. Vucetic et al., Early life protein restriction alters dopamine circuitry,Neuroscience, 2010, 168(2), 359–370.
81. S. K. Murphy and R. L. Jirtle, Imprinting evolution and the price ofsilence, BioEssays, 2003, 25(6), 577–588.
82. B. Grun F Fau - Blumberg, and B. Blumberg, Perturbed nuclear receptorsignaling by environmental obesogens as emerging factors in the obesitycrisis. (1389-9155 (Print)).
83. C. V. Bishop and F. Stormshak, Non-genomic actions of progesteroneand estrogens in regulating reproductive events in domestic animals,Vet J, 2008, 176(3), 270–280.
84. J. M. Carter et al., Steer responses to feeding soybean hulls and steroidhormone implantation on toxic tall fescue pasture, J Anim Sci, 2010,88(11), 3759–3766.
85. H. Ashby J Fau - Tinwell, J. Tinwell H Fau - Haseman and J. Haseman,Lack of effects for low dose levels of bisphenol A and diethylstilbestrol onthe prostate gland of CF1 mice exposed in utero. (0273-2300 (Print)).
86. O. Takai Y Fau - Tsutsumi et al., Preimplantation exposure to bisphenolA advances postnatal development. (0890-6238 (Print)).
87. A. Honma S Fau - Suzuki et al., Low dose effect of in utero exposure tobisphenol A and diethylstilbestrol on female mouse reproduction.(0890-6238 (Print)).
232 Chapter 8

88. K. Nikaido Y Fau - Yoshizawa et al., Effects of maternal xenoestrogenexposure on development of the reproductive tract and mammary glandin female CD-1 mouse offspring. (0890-6238 (Print)).
89. M. K. Rubin Bs Fau - Murray et al., Perinatal exposure to low doses ofbisphenol A affects body weight, patterns of estrous cyclicity, and plasmaLH levels. (0091-6765 (Print)).
90. A. M. Ryan Kk Fau - Haller et al., Perinatal exposure to bisphenol-a andthe development of metabolic syndrome in CD-1 mice. (1945-7170(Electronic)).
91. V. M. Somm E Fau - Schwitzgebel et al., Perinatal exposure to bisphenola alters early adipogenesis in the rat. (1552-9924 (Electronic)).
92. K. Miyawaki J Fau - Sakayama et al., Perinatal and postnatal exposure tobisphenol a increases adipose tissue mass and serum cholesterol level inmice. (1340-3478 (Print)).
93. S. Tian Yh Fau - Hwan Kim et al., Lactational and postnatal exposure topolychlorinated biphenyls induces sex-specific anxiolytic behavior andcognitive deficit in mice offspring. (1098-2396 (Electronic)).
94. B. S. Rubin, Bisphenol A: an endocrine disruptor with widespreadexposure and multiple effects. (1879-1220 (Electronic)).
95. A. Makita Y Fau - Tanaka et al., Effects of simultaneous administrationof tributyltin (TBT) and p,p(’)-DDE on female offspring of Wistar rats.(1528-7394 (Print)).
96. H. Grun F Fau - Watanabe et al., Endocrine-disrupting organotincompounds are potent inducers of adipogenesis in vertebrates. (0888-8809(Print)).
97. T. Kirchner S Fau - Kieu et al., Prenatal exposure to the environmentalobesogen tributyltin predisposes multipotent stem cells to becomeadipocytes. (1944-9917 (Electronic)).
98. L. S. La Merrill M Fau - Birnbaum, and L. S. Birnbaum, Childhoodobesity and environmental chemicals. (1931–7581 (Electronic)).
99. S. Zuo Z Fau - Chen et al., Tributyltin causes obesity and hepatic steatosisin male mice. (1522-7278 (Electronic)).
100. H. Cooke Gm Fau - Tryphonas et al., Oral (gavage), in utero andpostnatal exposure of Sprague-Dawley rats to low doses of tributyltinchloride. Part 1: Toxicology, histopathology and clinical chemistry.(0278-6915 (Print)).
101. V. M. Somm E Fau - Schwitzgebel et al., Prenatal nicotine exposure altersearly pancreatic islet and adipose tissue development with consequenceson the control of body weight and glucose metabolism later in life.(0013-7227 (Print)).
102. D. J. Ng Sp Fau - Conklin et al., Prenatal exposure to cigarette smokeinduces diet- and sex-dependent dyslipidemia and weight gain in adultmurine offspring. (1552-9924 (Electronic)).
103. A. Tsukue N Fau - Kato et al., Acute effects of diesel emission from theurea selective catalytic reduction engine system on male rats. (1091-7691(Electronic)).
Obesity and Diabetes: Role of Environmental Chemical Exposures 233

104. N. Shimada T Fau - Hiramatsu et al., Dual suppression of adipogenesisby cigarette smoke through activation of the aryl hydrocarbonreceptor and induction of endoplasmic reticulum stress. (0193-1849(Print)).
105. A. B. Lindstrom, M. J. Strynar and E. L. Libelo, Polyfluorinatedcompounds: past, present, and future, Environ Sci Technol, 2011, 45(19),7954–7961.
106. S. S. Hines Ep Fau - White et al., Phenotypic dichotomy followingdevelopmental exposure to perfluorooctanoic acid (PFOA) in female CD-1 mice: Low doses induce elevated serum leptin and insulin, and over-weight in mid-life. (1872-8057 (Electronic)).
107. Y. S. Yang C Fau - Tan et al., Differential effects of peripubertal exposureto perfluorooctanoic acid on mammary gland development in C57Bl/6and Balb/c mouse strains. (1873-1708 (Electronic)).
108. S. E. Wolf Cj Fau - Fenton et al., Developmental toxicity of perfluoro-octanoic acid in the CD-1 mouse after cross-foster and restrictedgestational exposures. (1096-6080 (Print)).
109. P. Alonso-Magdalena et al., Bisphenol-A: a new diabetogenic factor?Hormones.(Athens.), 2010, 9(2), 118–126.
110. A. Nadal et al., The pancreatic beta-cell as a target of estrogens andxenoestrogens: Implications for blood glucose homeostasis and diabetes,Mol. Cell Endocrinol., 2009, 304(1-2), 63–68.
111. D. M. Muoio and C. B. Newgard, Mechanisms of disease: molecular andmetabolic mechanisms of insulin resistance and beta-cell failure in type 2diabetes, Nat. Rev. Mol. Cell Biol., 2008, 9(3), 193–205.
112. M. Cnop et al., Longevity of human islet alpha- and beta-cells, DiabetesObes. Metab., 2011, 13(Suppl 1), 39–46.
113. M. Thunander et al., Incidence of type 1 and type 2 diabetes in adults andchildren in Kronoberg, Sweden, Diabetes Res. Clin. Pract., 2008, 82(2),247–255.
114. R. Basu et al., Effects of age and sex on postprandial glucose metabolism:differences in glucose turnover, insulin secretion, insulin action, andhepatic insulin extraction, Diabetes, 2006, 55(7), 2001–2014.
115. N. T., Nguyen et al., Relationship Between Obesity and Diabetes in a USAdult Population: Findings from the National Health and NutritionExamination Survey, 1999–2006. Obes. Surg., 2010.
116. T. L. Hectors et al., Environmental pollutants and type 2 diabetes: areview of mechanisms that can disrupt beta cell function, Diabetologia,2011, 54(6), 1273–1290.
117. B. A. Neel and R. M. Sargis, The paradox of progress: environmentaldisruption of metabolism and the diabetes epidemic, Diabetes, 2011,60(7), 1838–1848.
118. Y. W. Chen et al., Heavy metals, islet function and diabetes development,Islets, 2009, 1(3), 169–176.
119. P. Alonso-Magdalena et al., Low doses of bisphenol A and diethyl-stilbestrol impair Ca2þ signals in pancreatic alpha-cells through a
234 Chapter 8

nonclassical membrane estrogen receptor within intact islets ofLangerhans, Environ. Health Perspect., 2005, 113(8), 969–977.
120. L. Poston, Developmental programming and diabetes - The humanexperience and insight from animal models, Best. Pract. Res. Clin.Endocrinol. Metab., 2010, 24(4), 541–552.
121. R. de et al., Glucose tolerance at age 58 and the decline of glucosetolerance in comparison with age 50 in people prenatally exposed to theDutch famine, Diabetologia, 2006, 49(4), 637–643.
122. P. H. Whincup et al., Birth weight and risk of type 2 diabetes: a systematicreview, JAM, 2008, 300(24), 2886–2897.
123. L. S. Fetita et al., Consequences of fetal exposure to maternaldiabetes in offspring, J. Clin. Endocrinol. Metab., 2006, 91(10), 3718–3724.
124. C. J. Everett and E. M. Matheson, Biomarkers of pesticide exposure anddiabetes in the 1999-2004 National Health and Nutrition ExaminationSurvey, Environ. Int., 2010.
125. D. H. Lee et al., A strong dose–response relation between serumconcentrations of persistent organic pollutants and diabetes: results fromthe National Health and Examination Survey 1999–2002, Diabetes Care,2006, 29(7), 1638–1644.
126. D. H. Lee et al., Extended analyses of the association between serumconcentrations of persistent organic pollutants and diabetes,Diabetes Care, 2007, 30(6), 1596–1598.
127. J. S. Lim, D. H. Lee and D. R. Jacobs, Jr., Association of brominatedflame retardants with diabetes and metabolic syndrome in the U.S.population, 2003-2004, Diabetes Care, 2008, 31(9), 1802–1807.
128. D. H. Lee, D. R. Jacobs, Jr. and M. Steffes, Association of organo-chlorine pesticides with peripheral neuropathy in patients with diabetesor impaired fasting glucose, Diabetes, 2008, 57(11), 3108–3111.
129. D. H. Lee et al., Low dose of some persistent organic pollutants predictstype 2 diabetes: a nested case-control study, Environ. Health Perspect.,2010, 118(9), 1235–1242.
130. A. Rignell-Hydbom et al., Exposure to p,p’-DDE: a risk factor for type 2diabetes, PLoS. One, 2009, 4(10), e7503.
131. M. Turyk et al., Organochlorine exposure and incidence of diabetes in acohort of Great Lakes sport fish consumers, Environ. Health Perspect.,2009, 117(7), 1076–1082.
132. D. H. Lee et al., Polychlorinated Biphenyls and Organochlorine Pesticidesin Plasma Predict Development of Type 2 Diabetes in the Elderly: TheProspective Investigation of the Vasculature in Uppsala Seniors (PIVUS)Study, Diabetes Care, 2011.
133. J. R. Edwards and W. C. Prozialeck, Cadmium, diabetes and chronickidney disease, Toxicol. Appl. Pharmacol., 2009, 238(3), 289–293.
134. D. M. Schreinemachers, Perturbation of lipids and glucose metabolismassociated with previous 2,4-D exposure: a cross-sectional study ofNHANES III data, 1988–1994., Environ. Health, 2010, 9, 11.
Obesity and Diabetes: Role of Environmental Chemical Exposures 235

135. J. Beard et al., Health impacts of pesticide exposure in a cohort ofoutdoor workers, Environ. Health Perspect., 2003, 111(5), 724–730.
136. M. P. Montgomery et al., Incident diabetes and pesticide exposureamong licensed pesticide applicators: Agricultural Health Study,1993–2003, Am. J. Epidemiol., 2008, 167(10), 1235–1246.
137. U. Kramer et al., Traffic-related air pollution and incident type 2 diabetes:results from the SALIA cohort study, Environ. Health Perspect., 2010,118(9), 1273–1279.
138. I. A. Lang et al., Association of urinary bisphenol A concentration withmedical disorders and laboratory abnormalities in adults, JAMA, 2008,300(11), 1303–1310.
139. D. Melzer et al., Association of urinary bisphenol a concentration withheart disease: evidence from NHANES 2003/06, PLoS. One, 2010,5(1), e8673.
140. G. Ning et al., Relationship of Urinary Bisphenol A Concentration toRisk for Prevalent Type 2 Diabetes in Chinese Adults: A Cross-sectionalAnalysis, Ann. Intern. Med., 2011, 155(6), 368–374.
141. M. K. Silver et al., Urinary Bisphenol A and Type-2 Diabetes in U.S.Adults: Data from NHANES 2003-2008, PLoS. One, 2011, 6(10), e26868.
142. K. Svensson et al., Phthalate exposure associated with self-reporteddiabetes among Mexican women, Environ. Res., 2011.
143. R. W. Stahlhut et al., Concentrations of urinary phthalate metabolites areassociated with increased waist circumference and insulin resistance inadult U.S. males, Environ. Health Perspect., 2007, 115(6), 876–882.
144. T. M. Saldana et al., Pesticide exposure and self-reported gestationaldiabetes mellitus in the Agricultural Health Study, Diabetes Care, 2007,30(3), 529–534.
145. A. S. Ettinger et al., Maternal arsenic exposure and impaired glucosetolerance during pregnancy, Environ. Health Perspect., 2009, 117(7),1059–1064.
146. S. Fourlanos et al., Latent autoimmune diabetes in adults (LADA) shouldbe less latent, Diabetologia, 2005, 48(11), 2206–2212.
147. K. Vehik and D. Dabelea, The changing epidemiology of type 1 diabetes:why is it going through the roof?, Diabetes Metab Res. Rev., 2011, 27(1),3–13.
148. S. G. Howard and D. H. Lee, What is the role of human contaminationby environmental chemicals in the development of type 1 diabetes?,J. Epidemiol. Community Health, 2011.
149. D. A. Gonzalez et al., Sex hormones and autoimmunity, Immunol. Lett.,2010, 133(1), 6–13.
150. M. Cutolo et al., The immunomodulatory effects of estrogens: clinicalrelevance in immune-mediated rheumatic diseases, Ann. N. Y. Acad. Sci.,2010, 1193, 36–42.
151. S. R. Lindehammer et al., Seroconversion to islet autoantibodies betweenearly pregnancy and delivery in non-diabetic mothers, J. Reprod.Immunol., 2011, 88(1), 72–79.
236 Chapter 8

152. M. Ostensen et al., Pregnancy and reproduction in autoimmunerheumatic diseases, Rheumatology.(Oxford), 2011, 50(4), 657–664.
153. E. A. Gale and K. M. Gillespie, Diabetes and gender, Diabetologia, 2001,44(1), 3–15.
154. H. Wucher, J. Lepercq and J. Timsit, Onset of autoimmune type 1diabetes during pregnancy: Prevalence and outcomes, Best. Pract. Res.Clin. Endocrinol. Metab., 2010, 24(4), 617–624.
155. R. Vargas, J. T. Repke and S. H. Ural, Type 1 diabetes mellitus andpregnancy, Rev. Obstet. Gynecol., 2010, 3(3), 92–100.
156. E. B. Tsai et al., The rise and fall of insulin secretion in type 1 diabetesmellitus, Diabetologia, 2006, 49(2), 261–270.
157. S. Fourlanos, L. C. Harrison and P. G. Colman, The acceleratorhypothesis and increasing incidence of type 1 diabetes, Curr. Opin.Endocrinol. Diabetes Obes., 2008, 15(4), 321–325.
158. G. Dahlquist, Can we slow the rising incidence of childhood-onsetautoimmune diabetes? The overload hypothesis, Diabetologia, 2006,49(1), 20–24.
159. P. Narendran, E. Estella and S. Fourlanos, Immunology of type 1diabetes, QJM., 2005, 98(8), 547–556.
160. I. M. Sorensen et al., Maternal Serum Levels of 25-Hydroxy-Vitamin DDuring Pregnancy and Risk of Type 1 Diabetes in the Offspring,Diabetes,2011.
161. M. Knip et al., Dietary Intervention in Infancy and Later Signs ofBeta-Cell Autoimmunity, N. Engl. J. Med., 2010, 363(20), 1900–1908.
162. J. Lempainen et al., Interaction of enterovirus infection and Cow’s milk-based formula nutrition in type 1 diabetes-associated autoimmunity,Diabetes Metab Res. Rev., 2011.
163. C. R. Cardwell et al., Caesarean section is associated with an increasedrisk of childhood-onset type 1 diabetes mellitus: a meta-analysis ofobservational studies, Diabetologia, 2008, 51(5), 726–735.
164. C. R. Cardwell et al., Birthweight and the risk of childhood-onset type 1diabetes: a meta-analysis of observational studies using individual patientdata, Diabetologia, 2010, 53(4), 641–651.
165. C. R. Cardwell et al., Maternal age at birth and childhood type 1 diabetes:a pooled analysis of 30 observational studies, Diabetes, 2010, 59(2),486–494.
166. E. A. Gale, Congenital rubella: citation virus or viral cause of type 1diabetes?, Diabetologia, 2008, 51(9), 1559–1566.
167. S. M. Virtanen and M. Knip, Nutritional risk predictors of beta cellautoimmunity and type 1 diabetes at a young age, Am. J. Clin. Nutr.,2003, 78(6), 1053–1067.
168. T. Helgason and M. R. Jonasson, Evidence for a food additive as a causeof ketosis-prone diabetes, Lancet, 1981, 2(8249), 716–720.
169. E. H. Hathout et al., Air pollution and type 1 diabetes in children, Pediatr.Diabetes, 2006, 7(2), 81–87.
Obesity and Diabetes: Role of Environmental Chemical Exposures 237
170. A. Rignell-Hydbom et al., A nested case-control study of intrauterineexposure to persistent organochlorine pollutants in relation to risk of type1 diabetes, PLoS. One, 2010, 5(6), e11281.
171. M. P. Longnecker et al., Polychlorinated biphenyl serum levels inpregnant subjects with diabetes, Diabetes Care, 2001, 24(6), 1099–1101.
172. N. F. Kolachi et al., Status of Toxic Metals in Biological Samples ofDiabetic Mothers and Their Neonates, Biol. Trace Elem. Res., 2010.
173. J. H. Karam et al., Insulinopenic diabetes after rodenticide (Vacor)ingestion: a unique model of acquired diabetes in man, Diabetes, 1980,29(12), 971–978.
174. K. Buschard, What causes type 1 diabetes? Lessons from animal models,APMIS Suppl, 2011, 119(132), 1–19.
175. L. Wei et al., Induction of diabetes with signs of autoimmunity inprimates by the injection of multiple-low-dose streptozotocin, Biochem.Biophys. Res. Commun., 2011, 412(2), 373–378.
176. T. Helgason et al., Diabetes produced in mice by smoked/cured mutton,Lancet, 1982, 2(8306), 1017–1022.
177. S. D. Holladay, Prenatal immunotoxicant exposure and postnatal auto-immune disease, Environ. Health Perspect., 1999, 107(Suppl 5), 687–691.
178. H. Yurino et al., Endocrine disruptors (environmental estrogens)enhance autoantibody production by B1 cells, Toxicol. Sci., 2004, 81(1),139–147.
179. A. Mustafa et al., An enhanced postnatal autoimmune profile in 24 week-old C57BL/6 mice developmentally exposed to TCDD, Toxicol.Appl. Pharmacol., 2008, 232(1), 51–59.
180. M. Abedi-Valugerdi, Mercury and silver induce B cell activation and anti-nucleolar autoantibody production in outbred mouse stocks: are envi-ronmental factors more important than the susceptibility genes inconnection with autoimmunity? Clin. Exp. Immunol., 2009, 155(1),117–124.
181. S. Y. Lim and S. K. Ghosh, Autoreactive responses to an environmentalfactor: 1. phthalate induces antibodies exhibiting anti-DNA specificity,Immunology, 2003, 110(4), 482–492.
182. Blossom, S.J. and J.C. Doss, Trichloroethylene alters central andperipheral immune function in autoimmune-prone MRL(þ/þ ) micefollowing continuous developmental and early life exposure. J. Immu-notoxicol., 2007. 4(2): 129–141.
183. G. Ravel et al., Trichloroethylene Does Not Accelerate AutoimmuneDiabetes in NOD Mice, J. Immunotoxicol., 2004, 1(3), 141–148.
184. B. O. Roep and M. Atkinson, Animal models have little to teach us abouttype 1 diabetes: 1. In support of this proposal, Diabetologia, 2004, 47(10),1650–1656.
185. Y. H. Yan et al., Enhanced insulin resistance in diet-induced obese ratsexposed to fine particles by instillation, Inhal. Toxicol., 2011.
186. Z. J. Andersen et al., Diabetes Incidence and Long-Term Exposure to AirPollution: A cohort study, Diabetes Care, 2011.
238 Chapter 8

187. M. B. Dijkema et al., Long-term Exposure to Traffic-related Air Pollutionand Type 2 Diabetes Prevalence in a Cross-sectional Screening-study inthe Netherlands, Environ. Health, 2011, 10(1), 76.
188. R. C. Puett et al., Are Particulate Matter Exposures Associated with Riskof Type 2 Diabetes?, Environ. Health Perspect., 2010.
189. R. D. Brook et al., The relationship between diabetes mellitus and traffic-related air pollution, J. Occup. Environ. Med., 2008, 50(1), 32–38.
190. M. E. Davila-Esqueda et al., Low-level subchronic arsenic exposure fromprenatal developmental stages to adult life results in an impaired glucosehomeostasis, Exp. Clin. Endocrinol. Diabetes, 2011, 119(10), 613–617.
191. C. F. Huang et al., Arsenic and diabetes: Current perspectives, Kaohsiung.J. Med. Sci., 2011, 27(9), 402–410.
192. S. Lim et al., Chronic exposure to the herbicide, atrazine, causes mito-chondrial dysfunction and insulin resistance, PLoS. One, 2009,4(4), e5186.
193. P. Alonso-Magdalena et al., The estrogenic effect of bisphenol A disruptspancreatic beta-cell function in vivo and induces insulin resistance,Environ. Health Perspect., 2006, 114(1), 106–112.
194. P. Alonso-Magdalena et al., Bisphenol A exposure during pregnancydisrupts glucose homeostasis in mothers and adult male offspring,Environ. Health Perspect., 2010, 118(9), 1243–1250.
195. S. M. de la Monte et al., Nitrosamine exposure exacerbates high fat diet-mediated type 2 diabetes mellitus, non-alcoholic steatohepatitis, andneurodegeneration with cognitive impairment, Mol. Neurodegener, 2009,4, 54.
196. J. E. Michalek and M. Pavuk, Diabetes and cancer in veterans ofOperation Ranch Hand after adjustment for calendar period, days ofspraying, and time spent in Southeast Asia, J. Occup. Environ. Med., 2008,50(3), 330–340.
197. A. A. Adigun et al., Neonatal organophosphorus pesticide exposure altersthe developmental trajectory of cell-signaling cascades controlling meta-bolism: differential effects of diazinon and parathion, Environ.Health Perspect., 2010, 118(2), 210–215.
198. N. S. Gayathri et al., Changes in some hormones by low doses of di(2-ethyl hexyl) phthalate (DEHP), a commonly used plasticizer in PVCblood storage bags & medical tubing, Indian J. Med. Res., 2004, 119(4),139–144.
199. Y. Lin et al., Developmental Exposure to Di(2-ethylhexyl) PhthalateImpairs Endocrine Pancreas and Leads to Long-term Adverse Effects onGlucose Homeostasis in the Rat, Am. J. Physiol. Endocrinol. Metab., 2011.
200. D. H. Lee et al., Association between serum concentrations of persistentorganic pollutants and insulin resistance among nondiabetic adults:results from the National Health and Nutrition Examination Survey1999–2002, Diabetes Care, 2007, 30(3), 622–628.
201. D. H. Lee et al., Low Dose Organochlorine Pesticides and Poly-chlorinated Biphenyls Predict Obesity, Dyslipidemia, and Insulin
Obesity and Diabetes: Role of Environmental Chemical Exposures 239

Resistance among People Free of Diabetes, PLoS. One, 2011,6(1), e15977.
202. S. L. Wang et al., Increased risk of diabetes and polychlorinated biphenylsand dioxins: a 24-year follow-up study of the Yucheng cohort,Diabetes Care, 2008, 31(8), 1574–1579.
203. S. Takayama et al., Effects of long-term oral administration of DDT onnonhuman primates, J. Cancer Res. Clin. Oncol., 1999, 125(3-4), 219–225.
204. J. Ruzzin et al., Persistent organic pollutant exposure leads to insulinresistance syndrome, Environ. Health Perspect., 2010, 118(4), 465–471.
205. T. Wang et al., Urinary Bisphenol A (BPA) Concentration Associateswith Obesity and Insulin Resistance, J. Clin. Endocrinol. Metab., 2011.
206. J. W. Chang et al., Simultaneous exposure of non-diabetics to highlevels of dioxins and mercury increases their risk of insulin resistance,J. Hazard. Mater, 2011, 185(2-3), 749–755.
207. N. Brenden, H. Rabbani and M. bedi-Valugerdi, Analysis of mercury-induced immune activation in nonobese diabetic (NOD) mice, Clin. Exp.Immunol., 2001, 125(2), 202–210.
208. G. S. Cooper et al., Evidence of autoimmune-related effects of tri-chloroethylene exposure from studies in mice and humans, Environ.Health Perspect., 2009, 117(5), 696–702.
209. J. F. Nyland et al., Biomarkers of Methyl Mercury Exposure Immunot-oxicity among Fish Consumers in Amazonian Brazil, Environ.Health Perspect., 2011.
240 Chapter 8

CHAPTER 9
Bisphenol A and Aging
LAURA N. VANDENBERG
Tufts University, Center for Regenerative & Developmental Biology,200 Boston Ave, Suite 4600, Medford, MA 02155, USAE-mail: [email protected]
9.1 Introduction
The plastic monomer bisphenol A (BPA) is one of the highest volume chemicalsproduced worldwide, with over 6 billion pounds produced each year and over100 tons released into the atmosphere per year.1 BPA was first synthesized byA.P. Dianin in 1891 by combining two equivalents of phenol with oneequivalent of acetone to produce a product with two phenol groups. It was laterinvestigated in the 1930s as a synthetic estrogen but was never developed forpharmaceutical purposes. In the 1950’s, BPA began to be used in theproduction of polycarbonate plastics and epoxy resins, and production hasincreased steadily since that time.
9.2 Mechanisms of BPA Action
BPA contains two benzene rings and two (4,4’)-OH substituents (Figure 9.1).This simple structure allows the molecule to fit in the estrogen receptor (ER)binding pocket. The majority of natural estrogens are produced by the ovariesor testes and are able to diffuse in and out of all cells in the body.2 Estrogens areretained by some cells, considered target cells, due to high affinity binding toERs located in the nucleus. When an estrogen binds to an ER, the receptor then
Issues in Toxicology No. 16
Aging and Vulnerability to Environmental Chemicals: Age-related Disorders and their Origins in
Environmental Exposures
Edited by Bernard Weiss
r The Royal Society of Chemistry 2013
Published by the Royal Society of Chemistry, www.rsc.org
241

binds to specific sites of DNA with high affinity (known as estrogen responseelements), modulating transcription of target genes.
BPA binding to the ER is sufficient to trigger many biological responses thatare similar to the effects of endogenous estrogens. Biochemical assays indicatethat BPA binds both ERa and ERb, with approximately 10-fold higher affinityfor ERb.3–5 In vivo assays—including the uterotrophic assay, which testsestrogenic responses such as uterine wet weight, luminal epithelial height, andincreased expression of lactoferrin, an estrogen-inducible protein—alsoindicate that BPA has estrogenic activity.6,7
Because of its relatively low affinity for the ERs compared to that of naturalestrogens, BPA is often referred to as a weak estrogen. However, many studiesindicate that BPA can stimulate cellular responses at very low concentrations,below the levels where BPA is expected to bind to the nuclear ERs.8,9 Instead,these studies indicate that the actions of low doses of BPA can occur via bindingto membrane receptors, including a membrane-bound form of ERa (mERa),which is similar but not identical to nuclear ERa ,10,11 and a transmembrane ERcalled G protein-coupled receptor 30 (GPR30), which is structurally dissimilarto the nuclear ERs.12,13 Collectively, studies examining the actions of BPA viamembrane receptors indicate that not only does it have the efficacy of estradiol,but it is also equally potent.14,15 Additionally, there is evidence that BPAmimicsestrogen by binding to estrogen-related receptor g (ERR-g),16 an orphanreceptor that behaves as a constitutive activator of transcription.
The majority of mechanistic studies have focused on BPA’s actions as anestrogen. However, there is also evidence that BPA binds to thyroid hormonereceptors17 and alters thyroid hormone signaling in vivo.18 Further studies
Figure 9.1 Structure of BPA and 17b-estradiol. BPA contains two benzene rings andtwo (4, 4’)-OH substituents. Although BPA only slightly resembles thestructures of natural ligands such as 17b-estradiol, its structure allows it tofit in the ER binding pocket. These structures illustrate that chemicals withvariable conformations can bind to the estrogen receptors.
242 Chapter 9

indicate that BPA binds to androgen receptors and may have anti-androgenicactivities in vivo.19 Studies have also shown that BPA binds to the ubiquitousaryl hydrocarbon receptor,20 an orphan receptor that is thought to mediatetoxicity following exposure to environmental chemicals. Finally, there may bemore targets of BPA action; recent studies indicate that this chemical can bindto the peroxisome proliferator-activated receptor gamma (PPARg) and canstimulate adipogenesis in pre-adipocyte cell cultures.21,22
9.3 BPA Sources
In 1993, a study examining estrogenic substances leaching from laboratoryproducts showed that autoclaving cell culture media in polycarbonate flasks ledto the release of an estrogenically active substance which was identified asBPA.23 Since that time, studies have shown that BPA leaches from poly-carbonate baby bottles and other polycarbonate containers intended to be usedas reusable food containers.24 Other items such as polyvinyl chloride stretchfilms, food-contact papers, and cardboards used as food containers have alsobeen shown to contain BPA, and its transfer to foods from these products hasalso been demonstrated. In a non-randomized intervention study, collegestudents that consumed all of their cold beverages from a polycarbonate bottlehad urinary concentrations of BPA metabolites that were 69% higher thanurine samples collected following a wash-out, where all cold beverages wereconsumed from a BPA-free container.25 Thus polycarbonate plastics are aplausible source of human exposures.
To protect metallic food cans from rusting and corrosion, an epoxy resin istypically applied to the inner surface; many of these resins are synthesized bythe condensation of BPA and epichlorhydrin to create bisphenol A diglycidylether (BADGE). BPA leaches from these resins due to incomplete poly-merization of the applied BADGE. Several studies have shown that variousconditions, including temperature and storage time, can support or enhanceBPA migration from the coating of cans,24 and many studies have shown thatdetectable levels of BPA are found in specific canned foods, including cannedinfant formula.26–29 In another dietary intervention study, urine was collectedfrom individuals consuming their normal diet (containing canned foods),followed by a diet without any canned goods.30 Urinary metabolites of BPAwere significantly reduced when canned goods were removed from the diet andrebounded to pre-intervention levels when typical consumption of cannedgoods resumed. This study and others indicate that canned goods are asignificant source of human exposures to BPA.31
Finally, in the last few years, it has been shown that additional consumerproducts may contribute significantly to human BPA exposures. Manycigarette filters contain BPA, and individuals that smoke have higher levels ofBPA metabolites in their urine compared to non-smokers,32 indicating that thismay significantly contribute to total BPA exposures in these individuals.Additionally, thermal papers contain large quantities of BPA,33 and absorptionvia the skin is strongly suspected.34,35 Further, these sources and others are
Bisphenol A and Aging 243

thought to contribute to the measurable levels of BPA that have been detectedin indoor and outdoor air, dust, water, and landfill leachates.24
9.4 Human Exposures
At this time, there is only a limited amount of information available to understandthe kinetics of BPAmetabolism following exposures. In humans, once BPA entersthe body, it is conjugated to form two major metabolites, BPA-glucuronide andBPA-sulfate; this process occurs in the liver. If BPA enters the body via the oralroute, this is thought to occur soon after exposure in a process referred to as ‘‘firstpass metabolism’’.36 However, toxicokinetic studies clearly indicate that thismetabolism is not complete, i.e. some BPA is not metabolized, even whenexposures are strictly via the oral route.37 Further, when BPA enters the body vianon-oral routes (i.e. via dermal exposures to thermal papers), it can circulate morefreely in the body before it is inactivated. Once BPA is conjugated, BPA meta-bolites are readily removed from the body via urine because they are more water-soluble than unconjugated (free) BPA. Importantly, there are factors that caninfluence the metabolism of BPA; these include age, sex, and physiologicalstatus.37–40 Additionally, there is evidence that BPA metabolites can be decon-jugated, and thus returned to the active form of BPA, in certain body tissues.41–43
A few studies have examined the disposition and metabolic kinetics oflabeled BPA following oral administration. These studies have been used byregulatory agencies to conclude that BPA metabolism is so efficient in humansthat unconjugated levels are rarely, if ever, detected in blood samples, and BPAmetabolites are cleared from the body within 24–36 hours of exposure.44,45
Unfortunately, these toxicokinetic studies are extremely limited in their designand interpretation, thus their conclusions have been strongly challenged.24,46,47
In addition to using inappropriate and insensitive methodologies, these studiesdid not consider whether BPA metabolism would be affected by constant versusacute exposures, or whether non-oral exposures would be metabolized in thesame way as oral exposures. Human studies suggest that non-oral exposuressignificantly contribute to overall exposure profiles.48
Biomonitoring studies have been an important source of information abouttypical human exposures to BPA. In these types of studies, human tissues andfluid samples are collected without any other interventions; BPA concentrations(and concentrations of metabolites) are determined with analytical detectionmethods and, where sampling numbers permit, relationships between demo-graphic factors and BPA concentrations can be determined. These types ofdemographic–exposure relationships have been examined in detail using severallarge studies of reference populations, i.e. sampling of groups that are represen-tative of larger populations. These large-scale biomonitoring studies indicate thatBPA exposures are widespread in North America, Europe and parts of Asia.49–51
They also indicate that lifestyle factors and other demographics, includingcountry of residence, significantly influence BPA concentrations in urine.52
In addition to these large studies of reference populations, more than thirtyadditional studies have examined BPA and/or its metabolites in urine samples
244 Chapter 9

(for a review, see reference 46). Even though these studies have examinedincredibly variable populations, have used a wide variety of analytical methodsand have a lot of variability in study size, by and large they report that themajority of individuals sampled have detectable levels of BPA (and BPAmetabolites) in their urine. Further, there is remarkable consistency in theconcentrations reported from human populations around the world; moststudies report levels of 1–3 ng mL�1 BPA metabolites in urine.
In addition to these urine studies, approximately two dozen studies haveexamined BPA concentrations in blood and serum samples collected frompregnant women, non-pregnant adults, and fetal umbilical cords (reviewed inreference 46).These studies specifically focused on determining the concen-trations of unconjugated (free) BPA in healthy individuals, and all but two wereable to detect this compound in at least some samples. Similar to what has beenreported for urine, these studies typically reported blood concentrations in therange of 0.5–2 ng mL�1 unconjugated BPA in blood. Additional human tissuesand fluids, including amniotic fluid, placenta, breast milk, adipose tissue, andsaliva, have been examined for BPA content (reviewed in reference 46). Similarconcentrations to those reported for blood have been detected in these samples.Together, it can be concluded that the majority of individuals are exposed toBPA, and that internal exposures are typically in the 1 ng mL�1 range.
There are several reasons to be concerned about the levels of BPA and BPAmetabolites typically reported in human tissues and fluids. First, reportedconcentrations of 1ng mL�1 are higher than those required to stimulate responsesin cultured cells.53 Second, the reported concentrations in human samples are inthe range of concentrations that affect development of rodents and otheranimals,54 suggesting that these low levels could influence biological endpointsand development in humans.55 And finally, several studies have examined BPAmetabolism in rodents and non-human primates,54,56,57 which have remarkablysimilar metabolic profiles to humans.58 These studies suggest that relatively largeexposures—in the range of hundreds of micrograms per kilogram bodyweight—are required to produce the levels measured in human samples.24,54,56
9.5 Overview of Animal Studies
As discussed earlier in this chapter, many studies of BPA have focused on itsestrogenic properties. Much is known about the actions of endogenous estrogensvia nuclear ERs, including downstream gene expression changes in target cells.Target cells include those in the female reproductive tract (uterus, ovary, vagina,cervix, oviduct), the male reproductive tract (testis, prostate, epididymis, seminalvesicles), the nervous system and brain (including the hypothalamus andpituitary), the mammary gland, the immune system, the cardiovascular system,the metabolic system (including adipose tissue, muscle, the digestive tract,pancreas), and the skeletal system, among others.59 Hundreds of animal studies,mostly using rodentmodels, have examined the effects of BPAon these endpoints.The following sections discuss some of these studies, with an emphasis on thosefindings that are relevant to understanding the influence of BPA on aging.
Bisphenol A and Aging 245

9.5.1 Determining what is a Low Dose Exposure to BPA
Rodent and other animal studies of BPA have examined a wide range of doseson a considerable number of endpoints. Yet there is significant debate over whichdoses are truly relevant to inform risk assessments and the human condition ingeneral.60 In 2001, the National Toxicology Program established guidelines todefine ‘‘low doses’’ in studies of environmental chemicals.61 Two different defi-nitions of ‘‘low dose’’ were proposed: 1) doses in the range of human exposures,and 2) doses below those typically used in traditional toxicology assessments.62
At a 2006 scientific meeting on BPA organized by the National Institutes ofHealth (US), an expert panel also defined ‘‘low dose’’ as an administered dosethat produces blood concentrations in the range of what has been measured inhumans via biomonitoring studies.24 Using these different definitions for ‘‘lowdoses’’ has important consequences for the analysis of the BPA literature,because each definition produces a widely different cut-off limit, and thereforeinfluences the number of relevant studies (Table 1).
9.5.2 Dealing with Controversy & Conflicting Data in the
BPA Literature
Before discussing the literature, it is important to acknowledge the considerableamount of controversy surrounding the study of BPA, and in particular the
Table 9.1 Influence of low dose definition on cut-off level of exposure,number of total studies, and number of studies finding significanteffects of BPA.
‘‘Low dose’’definition
Cut-off level ofexposure(BPA)
Number ofstudies examiningdoses at or belowlow dose cut-off
Number ofstudies findingsignificanteffects at orbelow low dosecut-off
% positivestudies
Doses in the rangeof (suspected)human exposures
50 mg/kg/day(the US EPA‘‘safe’’ dose)
124 108 87%
Doses that producebloodconcentrations inrodents similar toconcentrationsmeasured inenvironmentally-exposed humans
500 mg kg�1
per day150 134 89%
Doses below thoseused in traditionaltoxicology studies
50 mg kg�1 perday
B220 B200 91%
246 Chapter 9

study of low doses of BPA. Substantial attention has been given to those studiesthat were unable to find effects of BPA on any endpoint.63–66 Some scientists,including those involved in risk assessments, have argued that these ‘negative’studies indicate that BPA is safe for humans.67–70 They have also argued thatthese ‘negative’ studies are better designed and implemented than studies thatfound significant effects of BPA. In response, many scientists have pointed outsignificant limitations and flaws in these ‘negative’ studies; these include:inappropriate choice of endpoints, contamination of negative controls, inap-propriate choice of positive control substances and doses, and use of insensitiveanimal strains, among others.60,71–75 The remainder of this chapter focuses onthose studies that have found significant relationships between BPA exposureand age-related diseases.
9.6 BPA & Mammary Cancer
In the rodent, the mammary gland begins to develop about half-way throughthe period of gestation, and this tissue expresses ERs a few days before birth,76
making it an important target for BPA and other environmental estrogens.77
Cells in the gland continue to express ER throughout life, and mammarygland development is significantly enhanced by ovarian production of naturalhormones at puberty. In particular, estrogen is responsible for elongation of themammary ducts and overall development of the gland, allowing the epitheliumto fill the stromal compartment in preparation for pregnancy and lactation.77,78
Several studies have examined the effects of BPA exposure during perinataldevelopment, stages considered ‘critical periods’ in the development of themammary gland.79 Low levels of BPA during early development can alterdevelopmental parameters of the gland and produce phenotypes that aresimilar to human risk factors for mammary cancer. One study examining theeffects of BPA during the period of exposure reported that it altered devel-opment of both the stromal and epithelial compartments at embryonic day 18,accelerating the differentiation of the fat pad and delaying the development ofan epithelial lumen, suggesting that BPA exposures affect the organization ofthe developing gland.80 Perinatal exposures also affected development of thepubertal gland, with BPA exposed animals displaying altered tissue organ-ization81–83 and enhanced responses to estradiol84 and progesterone.85
Perhaps even more intriguing are reports showing that perinatal exposure toBPA alters the appearance of the mammary gland in adulthood. In mid andlate adulthood, mammary glands from BPA-exposed females had anappearance that resembled glands collected from pregnant females, eventhough these animals remained sexually naıve.86 Other studies reported effectsof early life BPA exposures on adult mammary gland tissue organization, geneexpression, and even the appearance of pre-cancerous lesions.87,90
BPA exposures limited to the pre-pubertal period of development can alsoinfluence architecture of the mammary gland. Animals exposed at this laterperiod of development had increased numbers of epithelial structures, whichmay indicate that BPA exposures advance development of the mammary gland,
Bisphenol A and Aging 247

compared to unexposed controls.91 Finally, adult BPA exposures can also alterorganization of the tissue compartments in the adult mammary gland.Following several weeks of low dose exposure, both wildtype females andfemales with mutations in the BRCA1 gene had abnormalities resembling theeffects of perinatal BPA exposure in their mammary gland architectures.92 Bothwildtype and BRCA1 mutant females exposed to BPA had significantly moreductal hyperplasias and increased epithelial proliferation compared tounexposed females. Collectively, these studies link BPA exposure with severalhuman risk factors for breast cancer, including an increase in the number ofepithelial structures where cancers are thought to arise,81,93 increased epithelialdensity (which may be similar to the human risk factor of increased mammo-graphic density),94 increased sensitivity to estrogens,84 and increased numbersof pre-neoplastic lesions.88,92
Of course, results showing that BPA increases the appearance of risk factorsfor mammary cancer are not the same as showing a direct connection betweenthis chemical and cancer itself. Because the rat model of carcinogenesis mimicshuman breast cancer better than most mouse models,95,96 experiments toaddress the link between BPA and mammary cancer have largely used the rat.These studies have shown that BPA can produce neoplastic (cancerous) lesionsin the mammary gland, even when no additional hormonal or carcinogentreatments were applied.89 An additional study using a tumor-prone mousestrain showed that even adult exposures to BPA could promote mammarytumors.97 Although unexposed females of this mouse strain developed tumors,BPA exposures accelerated their appearance.
BPA exposures during perinatal development changed the response of themammary gland to chemical carcinogens.90,98–100 Typically, these carcinogenswere administered at doses that produced few, if any, tumors in unexposedanimals, yet BPA-exposed females developed significantly more tumors, had adecreased tumor latency, and an increased severity of the tumors’ histologicalgrades. Even BPA exposures that were limited to the pubertal period increasedthe susceptibility of the mammary gland to chemical carcinogens.101 Thesefindings are supported by subsequent studies which demonstrated that BPAalters gene and protein expression in the mammary gland. Gene expressionarrays and proteomic studies indicate that BPA upregulates the expression ofgenes related to immune function, cell proliferation, cytoskeletal function, andestrogen signaling, and downregulates apoptotic genes.87,98,99,102 BPA alsoincreased cell proliferation and decreased apoptosis in the gland.101
Collectively, these studies may shed light on the cellular and molecularmechanisms behind increased susceptibility to mammary cancer.
9.7 BPA & Prostate Cancer
The effects of BPA on the prostate are some of the most contested for thischemical, and for endocrine disruptors as a whole.103–105 Several regulatoryagencies and many scientists have addressed whether low doses of BPA duringfetal and perinatal development affect the rodent prostate.104,106–109 In 1997,
248 Chapter 9

the first study to examine the effects of fetal BPA exposure on prostatedevelopment showed that exposure during early development significantlyincreased the weight of the prostate in adulthood compared to prostatescollected from age-matched controls.110 Several subsequent studies have shownsimilar effects on adult prostate weight following fetal exposures to low doses ofBPA.111–114 BPA has been shown to disrupt tissue organization, proteinexpression, and cell proliferation in prostate epithelial ducts.115–118 Low dosesof BPA also affect androgen receptor binding activity in the prostate112 and canalter the volume and size of individual prostatic ducts.116
Again, these findings of altered prostate size and expression of proteins inthe adult prostate following perinatal BPA exposure are intriguing, but theydo not address whether BPA could influence diseases of aging, namely theincidence of prostate cancer. In humans, prostate cancer normally developswhen endogenous hormone production is increased.119 For this reason, manystudies examining the influence of environmental chemical exposuresexamine the incidence of prostate lesions with and without supplementalhormone therapy.120 Several recent studies have examined whether low dosesof BPA influence the incidence of adult-onset prostatic intraepithelialneoplasias (PIN lesions) in male rats. Regardless of how BPA was admin-istered to pups, early life exposures to BPA increased the incidence of PINlesions in response to a mixture of testosterone and estradiol inadulthood.121–123 Without this hormone cocktail, no increase in PIN lesionswas observed in BPA-exposed males. Studies aimed at understanding themolecular mechanisms behind the response of the prostate to early life BPAexposures have shown that low dose exposures produce permanent epigeneticalterations; prostates isolated from exposed males contained unmethylatedsequences in genes are that normally hypermethylated—and thereforesilenced—in untreated males.121,124
As mentioned, several studies have reported that they were unable to detectany effects of perinatal BPA exposures on the prostate.63–65,125–130 Importantly,these studies have flaws, including the failure to include a positive control, theuse of an inappropriate positive control, an inability to find effects with thepositive control, and lack of sensitivity demonstrated by effects of only highdoses of the positive control. Even when considering these ‘negative’ studies,several expert panels have concluded that perinatal BPA exposures canpermanently alter the adult prostate.54,55,131
9.8 BPA & Metabolic syndrome, Liver Disease &
Cardiovascular Disease
In humans, metabolic syndrome comprises a combination of disorders—including a high BMI (including obesity), a concentration of body fat at thecenter of the body (i.e. around the waist), high triglyceride levels, reducedHDL-cholesterol levels, high fasting glucose levels, impaired glucose tolerance,insulin resistance, and/or high blood pressure—that increases the risk of
Bisphenol A and Aging 249

developing cardiovascular disease and diabetes.132 Genetics and environmentalfactors, including aging, lifestyle, and endocrine disorders, can contribute tometabolic syndrome. Additionally, recent studies in the field of endocrinedisruption have identified a class of chemicals termed ‘obesogens’, i.e. chemicalsthat can promote the development of adipocytes, alter lipid metabolism, andcontribute to obesity.133,134
Several of the endpoints observed in human metabolic syndrome have beenobserved in animal models following exposure to BPA. Low doses of BPA caninfluence the body weight of offspring exposed during the perinatalperiod.135–138 Additionally, the type of food provided to BPA-exposed animalsin adolescence and adulthood can significantly impact on whether alterations inbody weight are observed.139,140 In fact, varying composition and estrogenicactivity of feed could account for many of the studies that were unable to detecteffects of BPA on body weight.141,142 BPA can also influence the percentage ofbody weight attributed to adipose tissue and the localization of fat to theviscera.143
In one of the more interesting examinations of BPA as an obesogen,Alonso-Magdalena and colleagues administered low doses of BPA topregnant mice for eight days during pregnancy. Several endpoints wereexamined in these pregnant females, and the mice were then re-examined4 months after parturition; the male offspring were also examined 6 monthsafter birth.144 During pregnancy, the dams were found to have altered glucosetolerance and fasting insulin levels, as well as high circulating levels of leptinand triglycerides after fasting. Four months after delivery, these same femaleshad higher body weights and altered sensitivity to glucose and insulin.Additionally, the male offspring had abnormal blood glucose and fastinginsulin levels, glucose intolerance, and abnormal proliferation of pancreaticb-cells.
Other important factors that have been identified in human metabolicsyndrome have also been examined in rodents exposed to BPA. Several studieshave investigated the influence of early life BPA exposures on liver health laterin life. BPA affects the expression of metabolic genes140 and measures of lipidperoxidation and reduced glutathione in the liver.145 Finally, only one studyhas examined heart-related parameters relative to BPA administration, and thisstudy showed that male rats exposed to BPA during early life developedhypertension in adulthood.143
Two more studies with plausible relevance to human populations concernBPA exposures prior to in vitro fertilization (IVF). In human IVF treatments,embryos are often matured outside of the body prior to implantation. Pre-implantation mouse embryos were exposed to BPA and their rate of devel-opment to blastocyst stages was altered, with low doses increasing the numberof embryos reaching blastocyst stages and high doses decreasing thisnumber.146 Additionally, pre-implantation mouse embryos were cultured in1 nM BPA and then transplanted into unexposed females and allowed todevelop; these animals were significantly heavier at weaning compared to micefrom embryos that were not cultured with BPA.147
250 Chapter 9

9.9 BPA & Infertility
A number of studies have shown that developmental exposures to low doses ofBPA alter development of the male and female reproductive tracts148–153
Several studies clearly indicate that the timing of female reproductive aging isinfluenced by BPA exposure, starting as early as puberty, with advanced timingof vaginal opening and earlier timing of first estrous.100,154,155 Alterations werealso observed in adult estrous cycles following perinatal exposure.86,154,156
Another important measure of reproductive aging is the presence of blood-filled ovarian bursae and cystic ovaries; these were observed significantly moreoften in BPA-exposed females after several months of age compared to age-matched controls.86,157–159 Finally, females that were developmentally exposedto BPA had significantly more oocytes with meiotic abnormalities, includinganeuploidy;160 when these females were mated, there was a significant increasein the number of aneuploid eggs and embryos.161 Follow-up studies alsosuggest that diet plays an important role in this oocyte phenotype.162,163
Only a few studies have examined whether BPA influences female fertilityand fecundity,164,165 and only one study has examined the relationshipsbetween BPA exposure, fertility/fecundity endpoints and age.166 Perinatallyexposed females were force-bred throughout life to determine the maximumnumber of litters (a measure of fertility) and the maximum number of pups (ameasure of fecundity) they could bear. Interestingly, animals exposed to BPAdemonstrated an age-related decline in both fertility and fecundity.
Male fertility has also been investigated with regards to the plausible effectsof BPA on this endpoint. As mentioned, developmental exposures to BPAcause malformations of the male reproductive organs. Additionally, relativelyhigh doses of BPA induce measures of oxidative stress and lipid peroxidation inthe testes of exposed males.167–169 But perhaps most important for consideringthe effects of BPA on fertility are those studies showing that BPA alters spermcharacteristics, including sperm number,114,170–172 sperm morphology,173,174
and sperm motility.114,172,173,175 Several of these studies have also showndirect effects on male fertility.170,172
9.10 Summary of Animal Studies
This review is focused on an examination of the effects of BPA on aging-relatedendpoints, including metabolic syndrome, mammary and prostate cancers, andmale and female infertility. However, it is important to note that a largenumber of studies have examined the effects of BPA on other endpoints. Highlysignificant effects indicating that BPA alters the development of sexuallydimorphic regions of the brain and behaviors that are likely controlled by thesenuclei have been reported;176–184 many studies specifically show that BPA alterssex-specific behaviors. Low dose effects of BPA have also been reported withregard to immune responses following antigen exposure185–187 and serumconcentrations of various hormones.7,164,188,189
Bisphenol A and Aging 251

Several researchers have produced models to explain the actions of BPAduring early development and how the effects of early hormone exposures canlead to various endocrine-related pathologies (reviewed in references 54, 190,191, and 192). Typically, these models propose that BPA acts via ERs (ERa,ERb, mER, etc.) present in estrogen-target organs. When BPA binds to theseERs, particularly during developmental periods where concentrations ofendogenous estrogens are low or absent altogether, this activation of estrogen-signaling pathways permanently alters organ histogenesis and cellular differ-entiation. Many phenotypes associated with these hormone-related pathologiesare observed at puberty and in adulthood, and some syndromes that areassociated with aging (cancer incidence, weight gain, infertility) manifest earlieras a consequence of BPA-induced changes. Of course, because different ERs arepresent in different cell types and at various developmental stages, BPA canhave different actions (complementary and opposing) depending on the applieddose, the period of exposure, and various other environmental factors. Becauseof all of these variables, BPA exposures can produce complex phenotypes, someof which have serious detrimental consequences for the health of the individual.
9.10.1 Overview of Epidemiology Studies
As discussed earlier in this chapter, human exposures to BPA are widespreadand there is a general consensus that BPA can be detected in the majority ofindividuals in many countries.24,46 Epidemiologists have now begun to collectinformation about human exposure levels and ask whether there are rela-tionships between circulating levels of BPA, or excreted BPA metabolites, andvarious health outcomes. These studies are particularly challenging for severalreasons: 1) BPA exposures are so widespread that there is no ‘‘negative controlpopulation’’ available for study;193 2) because BPA itself is ubiquitous,especially in medical and laboratory environments, there are concerns overcontamination during the collection and analysis of human samples;194 3) moststudies examine only single urine samples, but there is wide inter-person varia-bility as well as temporal variability in BPA concentrations;195–197 4) mostexposure assessments occur in adults, whereas damage inflicted by BPA mayoccur much earlier in life; and 5) animal studies typically examine single chemicalexposures to determine their effects on developing individuals, but humans areexposed to mixtures containing dozens or even hundreds of chemicals.
For these reasons, as well as cost-related issues, only a few epidemiologystudies have addressed the role BPA may have in human diseases. Recently, afew of these studies have examined gestational exposures to BPA (via samplingof urine from pregnant women) and related these exposures to behavioraloutcomes in offspring in the first few years of life.198,199 These studies areunique in their prospective design, and future studies will likely use a similarstrategy to determine any relationships between BPA exposure levels and otherhealth outcomes, including infertility, cancer incidence, metabolic syndrome,and others. Obviously establishing relationships between developmental(perinatal) BPA exposures and adult diseases will take decades to complete.
252 Chapter 9

This review will finish with a brief overview of the few epidemiology studiesconducted to date that have examined age-related health outcomes. Althoughthese studies are limited, based on their designs (typically cross-sectional orcase-control studies), their results do point to intriguing relationships betweenBPA and age-related diseases.
9.10.2 BPA & Cancer
Only one study to date has examined whether individuals with higher BPAexposures are at greater risk for developing cancer. In this study, serum BPAconcentrations were compared between Korean women with breast cancer andage-matched controls.200 Although the median exposure levels were higher inthe breast cancer patients compared to controls (0.61 ngmL�1 versus0.03 ng mL�1), these differences were not significant. Of course, this study waslimited by the collection of blood at the time of breast cancer diagnosis/treatment, because these BPA exposures likely do not reflect exposure levelsfrom early life during periods that may be more sensitive to disruption by BPA.Further, these results may be more indicative of the number of medicalinterventions experienced by the breast cancer patients compared to the healthycontrols. Because a large number of medical devices and medical tubing containand release BPA, these patients may have experienced higher exposures duringthe treatment period.9,201
Studies examining the link between BPA exposures and cancer endpoints aregreatly needed in human populations. In studies of diethylstilbestrol (DES), apotent pharmaceutical estrogen, rodents were highly predictive of the effects ofthis chemical on humans exposed in the womb. Studies showing that DESexposure increased mammary cancer in laboratory animals led to morecomprehensive testing of human DES daughters, who were found to haveincreased risk of breast cancer 25 years after the rodent data was published.202,203
9.10.3 BPA, Metabolic Syndrome & Cardiovascular Disease
In contrast to the weak evidence connecting BPA exposures to cancers, perhapssome of the best evidence suggests correlations between BPA and metabolicdisorders. Two large studies examining almost 3000 adults in the US foundcorrelations between urinary BPA concentrations and prevalence of self-reported cardiovascular disease.204,205 Analysis of these same adults alsoshowed correlations between urinary BPA and self-reported incidence ofdiabetes. Positive correlations between urinary BPA concentrations and serumliver enzymes were also reported. Importantly, these two studies used repre-sentative samples from two different populations examined via the CDC’sNational Health and Nutrition Examination Survey (NHANES). Interestingly,associations between these diseases and BPA exposure levels were stronger inthe 2003/2004 NHANES compared to the 2005/2006 NHANES. This may bedue to the higher BPA concentrations reported in the earlier survey (geometricmeans: 2.5 versus 1.8 ng mL�1).
Bisphenol A and Aging 253

A subsequent study examined data from both the 2003/2004 and 2005/2006NHANES studies in order to explore relationships between BPA exposure andobesity. Again using a cross-sectional design, researchers compared urinaryBPA concentrations with BMI and waist circumference in almost 3000adults.206 Positive correlations were found for both health outcomes; indi-viduals in the upper quartile of BPA exposures were 1.60–1.85 times more likelyto be obese and 1.43–1.67 times more likely to have a high waist circumferencecompared to individuals with the lowest exposures. A second cross-sectionalstudy using only older adults (age 40 and over) from China reported similarrelationships between BPA exposures and obesity. Using exposure and healthdata collected from more than 3000 individuals, the authors indicated thatindividuals in the top quartile for urinary BPA concentrations were 1.50 timesmore likely to be obese and 1.37 times more likely to have insulin resistancethan individuals with the lowest exposures.207
Similar to the limitations discussed for human cancer studies, there are somelimitations that must be considered when interpreting these results. Becausemetabolic syndrome appears to develop over a long period of time, it is unlikelythat exposure determinations made after the disease has developed will beinformative about exposures preceding the development of the symptoms,especially during critical periods of development. Further, it has been suggestedthat individuals with these disease characteristics (i.e. obesity, high waistcircumference, insulin resistance, diabetes, etc.) have higher BPA exposuresbecause of lifestyle factors associated with disease prevalence, i.e. it is plausiblethat obese individuals are more likely to eat packaged foods contaminated withBPA. Although this concern cannot be addressed in these cross-sectionalstudies, it is clear that the human studies conducted to date support findingsfrom rodent studies, which suggest connections between developmental BPAexposures and later life development of metabolic syndrome.
9.10.4 BPA & Male Reproduction
Studies examining the effects of BPA exposure on fertility endpoints in menhave generated interesting findings that should be followed-up with largersample sizes and different demographics. In one of the first epidemiologystudies to examine the effects of BPA, workers spraying BPA-containing epoxyresins were compared with unexposed workers.208 In this cross-sectional study,high BPA exposures were associated with lower levels of FSH. Yet anotherstudy, examining men that were not occupationally exposed to BPA, found norelationships between urinary BPA concentrations or FSH,209 and a third studyfound a positive relationship between urinary BPA concentrations and FSHlevels.210 Positive relationships between urinary BPA concentrations and serumtestosterone levels in men have been reported,211 which contrasts somewhatwith a study showing an inverse relationship between BPA concentrations andfree androgen index (the ratio of testosterone to sex hormone binding globulinlevels).210 Clearly these inconsistencies make it difficult to make anyconclusions about the relationships between BPA and hormone levels.
254 Chapter 9
BPA has been shown to affect a number of male fertility endpoints inrodents, including aspects of sperm health and receptivity to mating. Humanstudies have recently examined similar endpoints, focusing on relationshipsbetween BPA, sexual function, and semen quality. Several have reportedassociations between urinary BPA concentrations and one or more measures ofreduced semen quality. The first study found that increasing concentrations ofurinary BPA were significantly associated with decreased sperm concentration,decreased sperm count, decreased sperm vitality, and decreased spermmobility,212 similar to rodents exposed to BPA. A second study, examining menthat were recruited via an infertility clinic, found associations between BPAconcentrations and sperm concentrations, sperm motility, and spermmorphology, although these relationships were not statistically significant.213
Finally, two studies examining the effects of occupational BPA exposure foundassociations between urinary BPA concentrations and decreased sexualfunction in Chinese men.214,215 One study also found similar negative corre-lations between urinary BPA concentrations and sexual function in non-occupationally exposed (environmentally exposed) men. Thus these findingsmay be relevant to the wider population, and not just BPA workers.
9.10.5 BPA & Female Reproduction
In spite of the large animal literature suggesting that BPA can affect devel-opment and functionality of the female reproductive tract, only a fewepidemiology studies have focused on the effects of BPA exposures on women.Further, those studies that exist are quite small and need to be repeated withlarger representative populations. Two studies have examined relationshipsbetween BPA exposures and polycystic ovarian syndrome (PCOS). In both,serum BPA concentrations were higher in women with PCOS compared tounaffected women.216,217 However, both studies used an ELISA method tomeasure BPA concentrations in serum; this method has some flaws, andalthough it is unlikely to provide data with a bias related to a disease outcome,replication of these studies using analytical detection methods is needed.
Other studies examining the effects of BPA exposures on women have alsofocused on fertility-based outcomes. Pregnant women carrying fetuses with anabnormal karyotype had higher serum concentrations of BPA compared towomen carrying fetuses with a normal karyotype.218Additionally, there wereassociations between serum BPA concentrations and recurrent miscarriage;women with a history of three or more consecutive miscarriages had serumBPA concentrations that were more than three times higher than those ofwomen without fertility problems.219 When women with a history ofmiscarriage then became pregnant and successfully carried to term, theytypically had lower BPA concentrations compared to women that becamepregnant during the study and miscarried again.
Finally, a recent study of women undergoing IVF treatments found thaturinary BPA concentrations were negatively associated with the number of
Bisphenol A and Aging 255

oocytes retrieved during the IVF procedure.220 Women with high levels ofurinary BPA also had decreased concentrations of peak serum estradiol.
9.11 Summary & Conclusions
The epidemiology literature has limitations that have prevented scientists andrisk assessors from declaring that BPA is unsafe for human populations. Yetthese studies strongly support relationships between levels of BPA exposureand several disease outcomes. In fact, of the approximately two dozenepidemiology studies conducted to date, most of them have found relationshipsbetween BPA and an age-related health endpoint. Further, the results obtainedfrom human studies are often supported by mechanistic data from the animalliterature; BPA is associated with altered sperm endpoints in both rodents andhumans; BPA is associated with altered metabolism and obesity in both rodentsand humans; and BPA is associated with female infertility issues in bothrodents and humans. Rodents have been exceptionally helpful in dissecting themolecular and cellular mechanisms of BPA action and have been highlypredictive for the types of effects that would be observed in human populations.
It has been speculated that increased BPA exposures over the last severaldecades have contributed to human diseases, including male and femaleinfertility, breast and prostate cancers, and the obesity epidemic. Untanglingthe relationships between this chemical and human disease is not an easy task,but continued research is dedicated to this undertaking.
References
1. E. Burridge, ICIS Chemical Business, 2008, 274, 48.2. G. G. Kuiper, B. Carlsson, K. Grandien, E. Enmark, J. Haggblad,
S. Nilsson and J. A. Gustafsson, Endocrinology, 1997, 138, 863–870.3. J. C. Gould, L. S. Leonard, S. C. Maness, B. L. Wagner, K. Conner,
T. Zacharewski, S. Safe, D. P. McDonnell and K. W. Gaido, Mol. Cell.Endocrinol., 1998, 142, 203–214.
4. G. G. Kuiper, J. G. Lemmen, B. Carlsson, J. C. Corton, S. H. Safe,P. T. Van Der Saag, B. van der Burg and J. A. Gustafsson, Endocrinology,1998, 139, 4252–4263.
5. W. D. Pennie, T. C. Aldridge and A. N. Brooks, J. Endocrinol., 1998, 158,R11–R14.
6. C. M. Markey, C. L. Michaelson, E. C. Veson, C. Sonnenschein andA. M. Soto, Environ. Health Perspect., 2001, 109, 55–60.
7. R. Steinmetz, N. A. Mitchner, A. Grant, D. L. Allen, R. M. Bigsby andN. Ben-Jonathan, Endocrinology, 1998, 139, 2741–2747.
8. A. L. Wozniak, N. N. Bulayeva and C. S. Watson, Environ. HealthPerspect., 2005, 113, 431–439.
9. W. V. Welshons, S. C. Nagel and F. S. vom Saal, Endocrinology, 2006,147, S56–S69.
256 Chapter 9

10. C. S. Watson, N. N. Bulayeva, A. L. Wozniak and R. A. Alyea, Steroids,2007, 72, 124–134.
11. C. E. Powell, A. M. Soto and C. Sonnenschein, J. Steroid Biochem. Molec.Biol., 2001, 77, 97–108.
12. P. Thomas and J. Dong, J. Steroid Biochem. Molec. Biol., 2006, 102,175–179.
13. P. Thomas, Y. Pang, E. J. Filardo and J. Dong, Endocrinology, 2005, 146,624–632.
14. C. S. Watson and B. Gametchu, Proc. Soc. Exp. Biol. Med., 1999, 220, 9–19.15. C. S. Watson, Y. J. Jeng and M. Y. Kochukov, Toxicol. Sci., 2010, 115,
1–11.16. A. Matsushima, Y. Kakuta, T. Teramoto, T. Koshiba, X. Liu, H. Okada,
T. Tokunaga, S. Kawabata, M. Kimura and Y. Shimohigashi,J. Biochem., 2007, 142, 517–524.
17. K. Moriyama, T. Tagami, T. Akamizu, T. Usui, M. Saijo, N. Kanamoto,Y. Hataya, A. Shimatsu, H. Kuzuya and K. Nakao, J. Clin. Endocrinol.Metab., 2002, 87, 5185–5190.
18. R. T. Zoeller, R. Bansal and C. Parris, Endocrinology, 2005, 146, 607–612.19. P. Sohoni and J. P. Sumpter, J. Endocrinol., 1998, 158, 327–339.20. P. Pocar, B. Fischer, T. Klonisch and S. Hombach-Klonisch, Repro-
duction, 2005, 129, 379–389.21. Y. F. Wang, H. R. Chao, C. H. Wu, C. H. Tseng, Y. T. Kuo and
T. C. Tsou, Biotechnol. Lett., 2010, 32, 1789–1796.22. F. Grun and B. Blumberg, Rev. Endocr. Metab. Disord., 2007, 8, 161–171.23. A. V. Krishnan, P. Starhis, S. F. Permuth, L. Tokes and D. Feldman,
Endocrinology, 1993, 132, 2279–2285.24. L. N. Vandenberg, R. Hauser, M. Marcus, N. Olea and W. V. Welshons,
Reprod. Toxicol., 2007, 24, 139–177.25. J. L. Carwile, H. T. Luu, L. S. Bassett, D. A. Driscoll, C. Yuan,
J. Y. Chang, X. Ye, A. M. Calafat and K. B. Michels, Environ. HealthPerspect., 2009, 117, 1368–1372.
26. A. Schecter, N. Malik, D. Haffner, S. Smith, T. R. Harris, O. Paepke andL. Birnbaum, Environ. Sci. Technol., 2010, 44, 9425–9430.
27. X. L. Cao, J. Corriveau and S. Popovic, J. Food. Prot., 2010, 73,1085–1089.
28. J. E. Biles, T. P. McNeal and T. H. Begley, J. Agric. Food. Chem., 1997,45, 4697–4700.
29. H.-W. Kuo and W.-H. Ding, J. Chromatogr. A, 2004, 1027, 67–74.30. R. A. Rudel, J. M. Gray, C. L. Engel, T. W. Rawsthorne, R. E. Dodson,
J. M. Ackerman, J. Rizzo, J. L. Nudelman and J. G. Brody, Environ.Health Perspect., 2011, 119, 914–920.
31. J. L. Carwile, X. Ye, X. Zhou, A. M. Calafat and K. B. Michels, JAMA,2011, 306, 2218–2220.
32. J. M. Braun, A. E. Kalkbrenner, A. M. Calafat, J. T. Bernert, X. Ye,M. J. Silva, D. B. Barr, S. Sathyanarayana and B. P. Lanphear, Environ.Health Perspect., 2011, 119, 131–137.
Bisphenol A and Aging 257

33. T. Mendum, E. Stoler, H. VanBenschoten and J. C. Warner, GreenChemistry Letters and Reviews, 2011, 4, 81–86.
34. D. Zalko, C. Jacques, H. Duplan, S. Bruel and E. Perdu, Chemosphere,2011, 82, 424–430.
35. S. Biedermann, P. Tschudin and K. Grob, Anal. Bioanal. Chem., 2010,398, 571–576.
36. T. Tominaga, T. Negishi, H. Hirooka, A. Miyachi, A. Inoue, I. Hayasakaand Y. Yoshikawa, Toxicology, 2006, 226, 208–217.
37. D. Zalko, A. M. Soto, L. Dolo, C. Dorio, E. Ratahao, L. Debrauwer,R. Faure and J.-P. Cravedi, Environ. Health Perspect., 2003, 111,309–319.
38. Y.-H. Kim, C.-S. Kim, S. Park, S. Y. Han, M.-Y. Pyo and M. Yang,Biochem. Biophys. Res. Commun., 2003, 312, 441–448.
39. H. Mykkanen, J. Tikka, T. Pitkanen and O. Hanninen, J. Ped.Gastroenterol. Nutr., 1997, 25, 312–316.
40. J. A. Taylor, W. V. Welshons and F. S. vom Saal, Reprod. Toxicol., 2008,25, 169–176.
41. M. Nishikawa, H. Iwano, R. Yanagisawa, N. Koike, H. Inoue andH. Yokota, Environ. Health Perspect., 2010, 118, 1196–1203.
42. C. L. Stowell, K. K. Barvian, P. C. M. Young, R. M. Bigsby, D.E. Verdugo, C. R. Bertozzi and T. S. Widlanski, Chemistry & Biology,2006, 13, 891–897.
43. H. Sakamoto, H. Yokota, R. Kibe, Y. Sayama and A. Yuasa, Biochemicaet Biophysica Acta, 2002, 1573, 171–176.
44. W. Volkel, T. Colnot, G. A. Csanady, J. G. Filsner and W. Dekant,Chem. Res. Toxicol., 2002, 15, 1281–1287.
45. W. Volkel, N. Bittner and W. Dekant, Drug Metab. Dispos., 2005, 33,1748–1757.
46. L. N. Vandenberg, I. Chahoud, J. J. Heindel, V. Padmanabhan, F. J.Paumgartten and G. Schoenfelder, Environ. Health Perspect., 2010, 118,1055–1070.
47. L. N. Vandenberg, I. Chahoud, V. Padmanabhan, F. J. R. Paumgarttenand G. Schoenfelder, Environ. Health Perspect., 2010, 118, 1051–1054.
48. R. W. Stahlhut, W. V. Welshons and S. H. Swan, Environ. HealthPerspect., 2009, 117, 784–789.
49. T. Bushnik, D. Haines, P. Levallois, J. Levesque, J. Van Oostdam andC. Viau, Statistics Canada, Health Reports, 2010, 21, Catalogue no.82-0030-XPE.
50. A. M. Calafat and L. L. Needham, Int. J. Androl., 2008, 31, 139–143.51. K. Becker, T. Guen, M. Seiwert, A. Conrad, H. Pick-Fuss, J. Muller,
M. Wittassek, C. Schulz and M. Kolossa-Gehring, Int. J. Hyg. Environ.Health, 2009, 212, 685–692.
52. L. N. Vandenberg, CMAJ, 2011, online Feb 22, doi:10.1503/cmaj.101408.53. Y. B. Wetherill, B. T. Akingbemi, J. Kanno, J. A. McLachlan, A. Nadal,
C. Sonnenschein, C. S. Watson, R. T. Zoeller and S. M. Belcher, Reprod.Toxicol., 2007, 24, 178–198.
258 Chapter 9

54. C. Richter, L. S. Birnbaum, F. Farabollini, R. R. Newbold, B. S. Rubin,C. E. Talsness, J. G. Vandenbergh, D. R. Walser-Kuntz and F. S. vomSaal, Reprod. Toxicol., 2007, 24, 199–224.
55. F. S. vom Saal, B. T. Akingbemi, S. M. Belcher, L. S. Birnbaum,D. A. Crain, M. Eriksen, F. Farabollini, L. J. Guillette, Jr., R. Hauser,J. J. Heindel, S. M. Ho, P. A. Hunt, T. Iguchi, S. Jobling, J. Kanno,R. A. Keri, K. E. Knudsen, H. Laufer, G. A. LeBlanc, M. Marcus,J. A. McLachlan, J. P. Myers, A. Nadal, R. R. Newbold, N. Olea,G. S. Prins, C. A. Richter, B. S. Rubin, C. Sonnenschein, A. M. Soto,C. E. Talsness, J. G. Vandenbergh, L. N. Vandenberg,D. R. Walser-Kuntz, C. S. Watson, W. V. Welshons, Y. Wetherill andR. T. Zoeller, Reprod. Toxicol., 2007, 24, 131–138.
56. J. A. Taylor, F. S. Vom Saal, W. V. Welshons, B. Drury, G. Rottinghaus,P. A. Hunt, P. L. Toutain, C. M. Laffont and C. A. Vandevoort, Environ.Health Perspect., 2011, 119, 422–430.
57. G. S. Prins, S. H. Ye, L. Birch, S.-M. Ho and K. Kannan, Reprod.Toxicol., 2011, 31, 1–9.
58. J. A. Taylor, F. S. vom Saal, W. V. Welshons, B. Drury, G. Rottinghaus,P. A. Hunt and C. A. Vandevoort, Environ. Health Perspect., 2011, 119,422–430.
59. J. F. Couse and K. S. Korach, Endocrine Reviews, 1999, 20,358–417.
60. F. S. vom Saal and C. Hughes, Environ. Health Perspect., 2005, 113,926–933.
61. NTP, National Toxicology Program’s Report of the Endocrine DisruptorsLow Dose Peer Review, http://ntp.niehs.nih.gov/ntp/htdocs/liason/LowDosePeerFinalRpt.pdf.
62. R. Melnick, G. Lucier, M. Wolfe, R. Hall, G. Stancel, G. Prins, M. Gallo,K. Reuhl, S. M. Ho, T. Brown, J. Moore, J. Leakey, J. Haseman andM. Kohn, Environ. Health Perspect., 2002, 110, 427–431.
63. R. W. Tyl, C. B. Myers, M. C. Marr, C. S. Sloan, N. P. Castillo,M. M. Veselica, J. C. Seely, S. S. Dimond, J. P. Van Miller,R. N. Shiotsuka, D. Beyer, S. G. Hentges and J. M. Waechter, Jr.,Toxicol. Sci., 2008, 104, 362–384.
64. R. W. Tyl, C. B. Myers, M. C. Marr, B. F. Thomas, A. R. Keimowitz,D. R. Brine, M. M. Veselica, P. A. Fail, T. Y. Chang, J. C. Seely,R. L. Joiner, J. H. Butula, S. S. Dimond, S. Z. Cagen, R. N. Shitsuka,G. D. Stropp and J. M. Waechter, Toxicol. Sci., 2002, 68, 121–146.
65. K. L. Howdeshell, J. Furr, C. R. Lambright, V. S. Wilson, B. C. Ryan andL. E. Gray, Jr., Toxicol. Sci., 2008, 102, 371–382.
66. D. G. Stump, M. J. Beck, A. Radovsky, R. H. Garman, L. L. Freshwater,L. P. Sheets, M. S. Marty, J. M. Waechter, Jr., S. S. Dimond, J. P. VanMiller, R. N. Shiotsuka, D. Beyer, A. H. Chappelle and S. G. Hentges,Toxicol. Sci., 2010, 115, 167–182.
67. EFSA, The EFSA Journal, 2006, 428, 1–75.68. EFSA, The EFSA Journal, 2008, 759, 1–10.
Bisphenol A and Aging 259

69. J. E. Goodman, E. E. McConnell, I. G. Sipes, R. J. Witorsch,T. M. Slayton, C. J. Yu, A. S. Lewis and L. R. Rhomberg, Crit. Rev.Toxicol., 2006, 36, 387–457.
70. J. E. Goodman, R. J. Witorsch, E. E. McConnell, I. G. Sipes,T. M. Slayton, C. J. Yu, A. M. Franz and L. R. Rhomberg, Crit. Rev.Toxicol., 2009, 39, 1–75.
71. J. P. Myers, F. S. vom Saal, B. T. Akingbemi, K. Arizono, S. Belcher,T. Colborn, I. Chahoud, D. A. Crain, F. Farabollini, L. J. Guillette,T. Hassold, S.-M. Ho, P. A. Hunt, T. Iguchi, S. Jobling, J. Kanno,H. Laufer, M. Marcus, J. A. McLachlan, A. Nadal, J. Oehlmann, N. Olea,P. Palanza, S. Parmigiani, B. S. Rubin, G. Schonfelder, C. Sonnenschein,A. M. Soto, C. E. Talsness, J. A. Taylor, L. N. Vandenberg, J. G.Vandenbergh, S. Vogel, C. S. Watson, W. V. Welshons and R. T. Zoeller,Environ. Health Perspect., 2009, 117, 309–315.
72. J. P. Myers, R. T. Zoeller and F. S. vom Saal, Environ. Health Perspect.,2009, 117, 1652–1655.
73. F. S. vom Saal, B. T. Akingbemi, S. M. Belcher, D. A. Crain, D. Crews,L. C. Guidice, P. A. Hunt, C. Leranth, J. P. Myers, A. Nadal, N. Olea,V. Padmanabhan, C. S. Rosenfeld, A. Schneyer, G. Schoenfelder,C. Sonnenschein, A. M. Soto, R. W. Stahlhut, S. H. Swan,L. N. Vandenberg, H. S. Wang, C. S. Watson, W. V. Welshons andR. T. Zoeller, Toxicol. Sci., 2010, 115, 612–613.
74. F. S. vom Saal and J. P. Myers, Environ. Health Perspect., 2010, 118, A60.75. F. S. vom Saal and W. V. Welshons, Environmental Research, 2006, 100,
50–76.76. J. G. Lemmen, J. L. M. Broekhof, G. G. J. M. Kuiper, J. A. Gustafsson,
P. T. Van Der Saag and B. van der Burg, Mech. Dev., 1999, 81, 163–167.77. L. Hennighausen and G. W. Robinson, Genes Dev., 1998, 12, 449–455.78. M. M. Richert, K. L. Schwertfeger, J. W. Ryder and S. M. Anderson,
J. Mammary Gland Biol. Neoplasia, 2000, 5, 227–241.79. H. A. Bern, K. T. Mills and L. A. Jones, Proc. Soc. Exp. Biol. Med., 1983,
172, 239–242.80. L. N. Vandenberg, M. V. Maffini, P. R. Wadia, C. Sonnenschein, B. S.
Rubin and A. M. Soto, Endocrinology, 2007, 148, 116–127.81. C. M. Markey, E. H. Luque, M. Munoz-de-Toro, C. Sonnenschein and
A. M. Soto, Biol. Reprod., 2001, 65, 1215–1223.82. M.Munoz-de-Toro, C. M.Markey, P. R. Wadia, E. H. Luque, B. S. Rubin,
C. Sonnenschein and A. M. Soto, Endocrinology, 2005, 146, 4138–4147.83. Y. Nikaido, K. Yoshizawa, N. Danbara, M. Tsujita-Kyutoku, T. Yuri,
N. Uehara and A. Tsubura, Reprod. Toxicol., 2004, 18, 803–811.84. P. R. Wadia, L. N. Vandenberg, C. M. Schaeberle, B. S. Rubin,
C. Sonnenschein and A. M. Soto, Environ. Health Perspect., 2007, 115,592–598.
85. A. Ayyanan, O. Laribi, S. Schuepbach-Mallepell, C. Schrick,M. Gutierrez, T. Tanos, G. Lefebvre, J. Rougemont, O. Yalcin-Ozuysaland C. Brisken, Mol. Endocrinol., 2011, Epub 2011 Sep 8.
260 Chapter 9

86. C. M. Markey, M. A. Coombs, C. Sonnenschein and A. M. Soto,Evolution and Development, 2003, 5, 67–75.
87. R. Moral, R. Wang, I. H. Russo, C. A. Lamartiniere, J. Pereira andJ. Russo, J. Endocrinol., 2008, 196, 101–112.
88. L. N. Vandenberg, M. V. Maffini, C. M. Schaeberle, A. A. Ucci,C. Sonnenschein, B. S. Rubin and A. M. Soto, Reprod. Toxicol., 2008, 26,210–219.
89. T. J. Murray, M. V. Maffini, A. A. Ucci, C. Sonnenschein and A. M.Soto, Reprod. Toxicol., 2007, 23, 383–390.
90. M. Durando, L. Kass, J. Piva, C. Sonnenschein, A. M. Soto, E. H.Luque and M. Munoz-de-Toro, Environ. Health Perspect., 2007, 115,80–86.
91. J. B. Colerangle and D. Roy, J.Steroid Biochem. Molec. Biol., 1997, 60,153–160.
92. L. P. Jones, A. Sampson, H. J. Kang, H. J. Kim, Y. W. Yi, S. Y. Kwon,J. K. Babus, A. Wang and I. Bae, Toxicol. Lett., 2010, 199, 261–268.
93. J. Russo and I. H. Russo, J. Nat. Cancer Inst., 1978, 61, 1451–1459.94. V. A. McCormack and I. Dos Santos Silva, Cancer Epidem. Biomar.,
2006, 15, 1159–1169.95. M. Singh, J. N. McGinley and H. J. Thompson, Lab Invest., 2000, 80,
221–231.96. S. Nandi, R. Guzman and J. Yang, Proc. Natl. Acad. Sci. U S A, 1995, 92,
3650–3657.97. S. Jenkins, J. Wang, I. Eltoum, R. Desmond and C. A. Lamartiniere,
Environ. Health Perspect., 2011, 119, 1604–1609.98. S. Jenkins, N. Raghuraman, I. Eltoum, M. Carpenter, J. Russo and
C. A. Lamartiniere, Environ. Health Perspect., 2009, 117, 910–915.99. A. M. Betancourt, I. A. Eltoum, R. A. Desmond, J. Russo and
C. A. Lamartiniere, Environ. Health Perspect., 2010, 118, 1614–1619.100. K. Weber Lozada and R. A. Keri, Biol. Reprod., 2011.101. C. A. Lamartiniere, S. Jenkins, A. M. Betancourt, J. Wang and J. Russo,
Horm. Mol. Biol. Clin. Investig., 2011, 5, 45–52.102. A. M. Betancourt, J. A. Mobley, J. Russo and C. A. Lamartiniere,
J. Proteomics, 2010, 73, 1241–1253.103. J. A. Taylor, C. A. Richter, R. L. Ruhlen and F. S. Vom Saal, J. Steroid
Biochem. Mol. Biol., 2011.104. J. W. Owens and J. G. Chaney, Regul. Toxicol. Pharmacol., 2005, 43,
194–202.105. H. A. Milman, M. C. Bosland, P. D. Walden and J. E. Heinze, Regul.
Toxicol. Pharmacol., 2002, 35, 338–346.106. J. Ashby, H. Tinwell, J. Odum and P. Lefevre, Environ. Health Perspect.,
2004, 112, 847–853.107. F. S. vom Saal, C. A. Richter, R. R. Ruhlen, S. C. Nagel, B. G. Timms
and W. V. Welshons, Birth Defects Res. (Part A), 2005, 73, 140–145.108. D. M. Sheehan, Proc. Soc. Exp. Biol. Med., 2000, 224, 57–60.109. S. A. Vogel, Am. J. Public Health, 2009, 99(Suppl 3), S559–566.
Bisphenol A and Aging 261

110. S. C. Nagel, F. S. vom Saal, K. A. Thayer, M. G. Dhar, M. Boechler andW. V. Welshons, Environ. Health Perspect., 1997, 105, 70–76.
111. W. V. Welshons, S. C. Nagel, K. A. Thayer, B. M. Judy and F. S. vomSaal, Toxicol. Ind. Health, 1999, 15, 12–25.
112. C. Gupta, Proc. Soc. Exp. Biol. Med., 2000, 224, 61–68.113. B. A. Elswick, F. Welsch and D. B. Janszen, Reprod. Toxicol., 2000, 14,
359–367.114. K. C. Chitra, C. Latchoumycandane and P. P. Mathur, Toxicology, 2003,
185, 119–127.115. J. G. Ramos, J. Varayoud, C. Sonnenschein, A. M. Soto, M.
Munoz-de-Toro and E. H. Luque, Biol. Reprod., 2001, 65, 1271–1277.116. B. G. Timms, K. L. Howdeshell, L. Barton, S. Bradley, C. A. Richter and
F. S. vom Saal, Proc. Natl. Acad. Sci. U S A, 2005, 102, 7014–7019.117. J. G. Ramos, J. Varayoud, L. Kass, H. Rodrigues, L. Costabel,
M.Munoz-de-Toro and E. H. Luque, Endocrinology, 2003, 144, 3206–3215.118. Y. Ogura, K. Ishii, H. Kanda, M. Kanai, K. Arima, Y. Wang and
Y. Sugimura, Differentiation, 2007, 75, 745–756.119. J. L. Nelles, W. Y. Hu and G. S. Prins, Expert Rev. Endocrinol. Metab.,
2011, 6, 437–451.120. G. S. Prins, Endocr. Relat. Cancer, 2008, 15, 649–656.121. S. M. Ho, W. Y. Tang, J. Belmonte de Frausto and G. S. Prins, Cancer
Res., 2006, 66, 5624–5632.122. G. S. Prins, L. Birch, W. Y. Tang and S. M. Ho, Reprod. Toxicol., 2007,
23, 374–382.123. G. S. Prins, S. H. Ye, L. Birch, S.-M. Ho and K. Kannan, Reprod.
Toxicol., 2011, 31, 1–9.124. G. S. Prins, W. Y. Tang, J. Belmonte and S. M. Ho, Basic Clin.
Pharmacol. Toxicol., 2008, 102, 134–138.125. T. Ichihara, H. Yoshino, N. Imai, T. Tsutsumi, M. Kawabe, S. Tamano,
S. Inaguma, S. Suzuki and T. Shirai, J. Toxicol. Sci., 2003, 28, 165–171.126. J. Ashby, H. Tinwell and J. Haseman, Regul. Toxicol. Pharmacol., 1999,
30, 156–166.127. S. Z. Cagen, J. M. Waechter, Jr., S. S. Dimond, W. J. Breslin, J. H.
Butala, F. W. Jekat, R. L. Joiner, R. N. Shiotsuka, G. E. Veenstra andL. R. Harris, Toxicol. Sci., 1999, 50, 36–44.
128. S. Z. Cagen, J. M. Waechter, Jr., S. S. Dimond, W. J. Breslin, J. H.Butala, F. W. Jekat, R. L. Joiner, R. N. Shiotsuka, G. E. Veenstra andL. R. Harris, Regul. Toxicol. Pharmacol., 1999, 30, 130–139.
129. M. Ema, S. Fujii, M. Furukawa, M. Kiguchi, T. Ikka and A. Harazono,Reprod. Toxicol., 2001, 15, 505–523.
130. H. Tinwell, J. Haseman, P. A. Lefevre, N. Wallis and J. Ashby, Toxicol.Sci., 2002, 68, 339–348.
131. R. E. Chapin, J. Adams, K. Boekelheide, L. E. J. Gray, S. W. Hayward,P. S. Lees, B. S. McIntyre, K. M. Portier, T. M. Schnorr, S. G. Selevan,J. G. Vandenbergh and S. R. Woskie, Birth Defects Res. B Dev. Reprod.Toxicol., 2008, 83, 157–395.
262 Chapter 9

132. S. M. Grundy, H. B. Brewer, Jr., J. I. Cleeman, S. C. Smith, Jr. andC. Lenfant, Circulation, 2004, 109, 433–438.
133. F. Grun and B. Blumberg, Mol. Cell. Endocrinol., 2009, 304, 19–29.134. F. Grun and B. Blumberg, Mol. Endocrinol., 2009, 23, 1127–1134.135. B. S. Rubin, M. K. Murray, D. A. Damassa, J. C. King and A. M. Soto,
Environ. Health Perspect., 2001, 109, 675–680.136. S. Honma, A. Suzuki, D. L. Buchanan, Y. Katsu, H. Watanabe and
T. Iguchi, Reprod. Toxicol., 2002, 16, 117–122.137. K. L. Howdeshell, A. K. Hotchkiss, K. A. Thayer, J. G. Vandenbergh and
F. S. vom Saal, Nature, 1999, 401, 763–764.138. J. Miyawaki, K. Sakayama, H. Kato, H. Yamamoto and H. Masuno,
J. Atheroscler. Thromb., 2007, 14, 245–252.139. J. Wei, Y. Lin, Y. Li, C. Ying, J. Chen, L. Song, Z. Zhou, Z. Lv, W. Xia,
X. Chen and S. Xu, Endocrinology, 2011.140. E. Somm, V. M. Schwitzgebel, A. Toulotte, C. R. Cederroth,
C. Combescure, S. Nef, M. L. Aubert and P. S. Huppi, Environ. HealthPerspect., 2009, 117, 1549–1555.
141. F. S. vom Saal, C. A. Richter, J. Mao and W. V. Welshons, Birth DefectsRes. (Part A), 2005, 73, 474–475.
142. J. J. Heindel and F. S. vom Saal, Environ. Health Perspect., 2008, 116,389–393.
143. X. Xu, L. Tan, T. Himi, M. Sadamatsu, S. Tsutsumi, M. Akaike andN. Kato, Neurotoxicol. Teratol., 2011.
144. P. Alonso-Magdalena, E. Vieira, S. Soriano, L. Menes, D. Burks,I. Quesada and A. Nadal, Environ. Health Perspect., 2010, 118, 1243–1250.
145. A. Korkmaz, M. A. Ahbab, D. Kolankaya and N. Barlas, Food Chem.Toxicol., 2010, 48, 2865–2871.
146. Y. Takai, O. Tsutsumi, Y. Ikezuki, H. Hiroi, Y. Osuga, M. Momoeda,T. Yano and Y. Taketani, Biochem. Biophys. Res. Commun., 2000, 270,918–921.
147. Y. Takai, O. Tsutsumi, Y. Ikezuki, Y. Kamei, Y. Osuga, T. Yano andY. Taketan, Reprod. Toxicol., 2001, 15, 71–74.
148. J. S. Fisher, K. J. Turner, D. Brown and R. M. Sharpe, Environ. HealthPerspect., 1999, 107, 397–405.
149. J. Wistuba, M. H. Brinkworth, S. Schlatt, I. Chahoud and E. Nieschlag,Environ. Res., 2003, 91, 95–103.
150. C. M. Markey, P. R. Wadia, B. S. Rubin, C. Sonnenschein andA. M. Soto, Biol. Reprod., 2005, 72, 1344–1351.
151. S. C. Nagel, J. L. Hagelbarger and D. P. McDonnell, Endocrinology,2001, 142, 4721–4728.
152. G. Schonfelder, B. Flick, E. Mayr, C. Talsness, M. Paul and I. Chahoud,Neoplasia, 2002, 4, 98–102.
153. G. Schonfelder, K. Friedrich, M. Paul and I. Chahoud, Neoplasia, 2004,6, 584–594.
154. S. Honma, A. Suzuki, D. L. Buchanan, Y. Katsu, H. Watanabe andT. Igushi, Reprod. Toxicol., 2002, 16, 117–122.
Bisphenol A and Aging 263

155. H. B. Adewale, W. N. Jefferson, R. R. Newbold and H. B. Patisaul, Biol.Reprod., 2009, 81, 690–699.
156. L. Monje, J. Varayoud, M. Munoz-de-Toro, E. H. Luque and J. G.Ramos, Reprod. Toxicol., 2010, 30, 625–634.
157. R. R. Newbold, W. N. Jefferson and E. Padilla-Banks, Reprod. Toxicol.,2007, 24, 253–258.
158. P. G. Signorile, E. P. Spugnini, L. Mita, P. Mellone, A. D’Avino,M. Bianco, N. Diano, L. Caputo, F. Rea, R. Viceconte, M. Portaccio,E. Viggiano, G. Citro, R. Pierantoni, V. Sica, B. Vincenzi, D. G. Mita,F. Baldi and A. Baldi, Gen. Comp. Endocrinol., 2010, 168, 318–325.
159. R. R. Newbold, W. N. Jefferson and E. Padilla-Banks, Environ. HealthPerspect., 2009, 117, 879–885.
160. P. A. Hunt, K. E. Koehler, M. Susiarjo, C. A. Hodges, A. Ilagan, R. C.Voigt, S. Thomas, B. F. Thomas and T. J. Hassold, Curr. Biol., 2003, 13,546–553.
161. M. Susiarjo, T. J. Hassold, E. Freeman and P. A. Hunt, PLoS Genetics,2007, 3, e5.
162. A. Muhlhauser, M. Susiarjo, C. Rubio, J. Griswold, G. Gorence,T. Hassold and P. A. Hunt, Biol. Reprod., 2009, 80, 1066–1071.
163. P. A. Hunt, M. Susiarjo, C. Rubio and T. J. Hassold, Biol. Reprod., 2009,81, 807–813.
164. M. Fernandez, N. Bourguignon, V. Lux-Lantos and C. Libertun, Environ.Health Perspect., 2010, 118, 1217–1222.
165. J. Varayoud, J. G. Ramos, V. L. Bosquiazzo, M. Lower, M.Munoz-de-Toro and E. H. Luque, Endocrinology, 2011, 152, 1101–1111.
166. N. J. Cabaton, P. R. Wadia, B. S. Rubin, D. Zalko, C. M. Schaeberle,M. H. Askenase, J. L. Gadbois, A. P. Tharp, G. S. Whitt,C. Sonnenschein and A. M. Soto, Environ. Health Perspect., 2011, 119,547–552.
167. M. Aydogan, A. Korkmaz, N. Barlas and D. Kolankaya, Drug Chem.Toxicol., 2010, 33, 193–203.
168. Y. Minamiyama, H. Ichikawa, S. Takemura, H. Kusunoki, Y. Naito andT. Yoshikawa, Free Radic. Res., 2010, 44, 1398–1406.
169. S. Anjum, S. Rahman, M. Kaur, F. Ahmad, H. Rashid, R. A. Ansari andS. Raisuddin, Food Chem. Toxicol., 2011, 49, 2849–2854.
170. A. S. Al-Hiyasat, H. Darmani and A. M. Elbetieha, Eur. J. Oral Sci.,2002, 110, 163–167.
171. F. S. vom Saal, P. S. Cooke, D. L. Buchanan, P. Palanza, K. A. Thayer,S. C. Nagel, S. Parmigiani and W. V. Welshons, Toxicol. Ind. Health,1998, 14, 239–260.
172. S. Salian, T. Doshi and G. Vanage, Toxicology, 2009, 265, 56–67.173. H. Aikawa, S. Koyama, M. Matsuda, K. Nakahashi, Y. Akazome and
T. Mori, Cell Tissue Res., 2004, 315, 119–124.174. Y. Toyama, F. Suzuki-Toyota, M. Maekawa, C. Ito and K. Toshimori,
Arch. Histol. Cytol., 2004, 185, 119–127.
264 Chapter 9

175. K. Kobayashi, K. Ohtani, H. Kubota and M. Miyagawa, Congenit Anom(Kyoto), 2010, 50, 159–170.
176. R. Carr, F. Bertasi, A. Bentacourt, S. Bowers, B. S. Gandy, P. Ryan andS. Willard, J. Toxicol. Environ. Health A, 2003, 66, 2077–2088.
177. F. Farabollini, S. Porrini and F. Dessi-Fulgheri, Pharmacol. Biochem.Behav., 1999, 64, 687–694.
178. T. Fujimoto, K. Kubo and S. Aou, Brain Res., 2006, 1068, 49–55.179. T. Funabashi, M. Kawaguchi, M. Furuta, A. Fukushima and F. Kimura,
Psychoneuroendocrinology, 2004, 29, 475–485.180. K. Kubo, O. Arai, M. Omura, R. Watanabe, R. Ogata and S. Aou,
Neurosci. Res., 2003, 45, 345–356.181. K. Kubo, O. Arai, R. Ogata, M. Omura, T. Hori and S. Aou, Neurosci.
Lett., 2001, 304, 73–76.182. B. S. Rubin, J. R. Lenkowski, C. M. Schaeberle, L. N. Vandenberg,
P. M. Ronsheim and A. M. Soto, Endocrinology, 2006, 147, 3681–3691.183. H. B. Patisaul, A. E. Fortino and E. K. Polston, Neurotoxicol. Teratol.,
2006, 28, 111–118.184. H. B. Adewale, K. L. Todd, J. A. Mickens and H. B. Patisaul, Neuro
Toxicology, 2011, 32, 38–49.185. M. Goto, Y. Takano-Ishikawa, H. Ono, M. Yoshida, K. Yamaki and
H. Shinmoto, Biosci. Biotechnol. Biochem., 2007, 71, 2136–2143.186. S. D. Holladay, S. Xiao, H. Diao, J. Barber, T. Nagy, X. Ye and
R. M. Gogal, Jr., Int. J. Environ. Res. Public Health, 2010, 7, 2845–2852.187. T. Midoro-Horiuti, R. Tiwari, C. S. Watson and R. M. Goldblum,
Environ. Health Perspect., 2010, 118, 273–277.188. A. Okada and O. Kai, Asian J. Androl., 2008, 10, 271–276.189. B. T. Akingbemi, C. M. Sottas, A. I. Koulova, G. R. Klinefelter and
M. P. Hardy, Endocrinology, 2004, 145, 592–603.190. A. M. Soto, B. S. Rubin and C. Sonnenschein, in Endocrine-Disrupting
Chemicals, ed. A. Gore, Humana Press, Totowa, N.J., Editon edn., 2007.191. L. N. Vandenberg, M. V. Maffini, C. Sonnenschein, B. S. Rubin and
A. M. Soto, Endocrine Reviews, 2009, 30, 75–95.192. B. S. Rubin, J. Steroid Biochem. Mol. Biol., 2011, 127, 27–34.193. A. M. Calafat, X. Ye, L. Y. Wong, J. A. Reidy and L. L. Needham,
Environ. Health Perspect., 2008, 116, 39–44.194. W. Dekant and W. Volkel, Toxicol. Appl. Pharmacol., 2008, 228,
114–134.195. S. Mahalingaiah, J. D. Meeker, K. R. Pearson, A. M. Calafat, X. Ye,
J. Petrozza and R. Hauser, Environ. Health Perspect., 2008, 116, 173–178.196. P. A. Nepomnaschy, D. D. Baird, C. R. Weinberg, J. A. Hoppin,
M. P. Longnecker and A. J. Wilcox, Environ. Res., 2009, 109, 734–737.197. X. Ye, L. Y. Wong, A. M. Bishop and A. M. Calafat, Environ. Health
Perspect., 2011, 119, 983–988.198. J. M. Braun, K. Yolton, K. N. Dietrich, R. Hornung, X. Ye,
A. M. Calafat and B. P. Lanphear, Environ. Health Perspect., 2009, 117,1945–1952.
Bisphenol A and Aging 265

199. J. M. Braun, A. E. Kalkbrenner, A. M. Calafat, K. Yolton, X. Ye,K. N. Dietrich and B. P. Lanphear, Pediatrics, 2011, 128, 873–882.
200. M. Yang, J. H. Ryu, R. Jeon, D. Kang and K. Y. Yoo, Arch. Toxicol.,2009, 83, 281–285.
201. A. M. Calafat, J. Weuve, X. Ye, L. T. Jia, H. Hu, S. Ringer, K. Huttnerand R. Hauser, Environ. Health Perspect., 2009, 117, 639–644.
202. A. M. Soto, L. N. Vandenberg, M. V. Maffini and C. Sonnenschein, BasicClin. Pharmacol. Toxicol., 2008, 102, 125–133.
203. D. Trichopoulos, Epidemiology, 1990, 1, 95–96.204. I. A. Lang, T. S. Galloway, A. Scarlett, W. E. Henley, M. Depledge,
R. B. Wallace and D. Melzer, JAMA, 2008, 300, 1303–1310.205. D. Melzer, N. E. Rice, C. Lewis, W. E. Henley and T. S. Galloway, PLoS
ONE, 2010, 5, e8673.206. J. L. Carwile and K. B. Michels, Environ. Res., 2011, 111, 825–830.207. T. Wang, M. Li, B. Chen, M. Xu, Y. Xu, Y. Huang, J. Lu, Y. Chen,
W. Wang, X. Li, Y. Liu, Y. Bi, S. Lai and G. Ning, J. Clin. Endocrinol.Metab., 2011.
208. T. Hanaoka, N. Kawamura, K. Hara and S. Tsugane, Occup. Environ.Med., 2002, 59, 625–628.
209. J. Mendiola, N. Jorgensen, A. M. Andersson, A. M. Calafat, X. Ye,J. B. Redmon, E. Z. Drobnis, C. Wang, A. Sparks, S. W. Thurston, F. Liuand S. H. Swan, Environ. Health Perspect., 2010, 118, 1286–1291.
210. J. D. Meeker, A. M. Calafat and R. Hauser, Environ. Sci. Technol., 2010,44, 1458–1463.
211. T. Galloway, R. Cipelli, J. Guralnik, L. Ferrucci, S. Bandinelli, A. M.Corsi, C. Money, P. McCormack and D. Melzer, Environ. HealthPerspect., 2010, 118, 1603–1608.
212. D. K. Li, Z. Zhou, M. Miao, Y. He, J. Wang, J. Ferber, L. J. Herrinton,E. Gao and W. Yuan, Fertil. Steril., 2010.
213. J. D. Meeker, S. Ehrlich, T. L. Toth, D. L. Wright, A. M. Calafat,A. T. Trisini, X. Ye and R. Hauser, Reprod. Toxicol., 2010, 30, 532–539.
214. D. Li, Z. Zhou, D. Qing, Y. He, T. Wu, M. Miao, J. Wang, X. Weng,J. R. Ferber, L. J. Herrinton, Q. Zhu, E. Gao, H. Checkoway andW. Yuan, Hum. Reprod., 2010, 25, 519–527.
215. D. K. Li, Z. Zhou, M. Miao, Y. He, D. Qing, T. Wu, J. Wang, X. Weng,J. Ferber, L. Herrinton, Q. Zhu, E. Gao and W. Yuan, J. Androl., 2010.
216. T. Takeuchi and O. Tsutsumi, Biochem. Biophys. Res. Commun., 2002,291, 76–78.
217. T. Takeuchi, O. Tsutsumi, Y. Ikezuki, Y. Takai and Y. Taketani,Endocrine J., 2004, 51, 165–169.
218. H. Yamada, I. Furuta, E. H. Kato, S. Kataoka, Y. Usuki, G. Kobashi,F. Sata, R. Kishi and S. Fujimoto, Reprod. Toxicol., 2002, 16, 735–739.
219. M. Sugiura-Ogaswara, Y. Ozaki, S.-I. Sonta, T. Makino andK. Suzumori, Hum. Reprod., 2005, 20, 2325–2329.
220. E. Mok-Lin, S. Ehrlich, P. L. Williams, J. Petrozza, D. L. Wright,A. M. Calafat, X. Ye and R. Hauser, Int. J. Androl., 2009.
266 Chapter 9

CHAPTER 10
Male Reproductive TractDisorders
JOHN D. MEEKER* AND KELLY K. FERGUSON
Department of Environmental Health Sciences, University of MichiganSchool of Public Health, Ann Arbor, MI, USA*E-mail: [email protected]
10.1 Introduction
The potential for exposure to environmental chemicals to adversely impact themale reproductive tract has received growing attention over the past severaldecades. In the late 1970s and early 1980s, the highly publicized case ofincreased risk of sterility among pesticide production workers exposed todibromochloropropane led to many new studies investigating whether otheroccupational exposures adversely affect male fertility. Since the turn of thecentury, much of the focus has shifted to male reproductive health impactsresulting from lower exposure levels experienced by the general population, aswell as the potential for endocrine disrupting chemicals to impair male repro-ductive tract development in utero. The advent of life course epidemiology andconcerns for widespread endocrine disruption, combined with trends fordelayed family planning and increased life expectancy, have led to increasedinterest in a new area of inquiry investigating how exposure to chemicalsadversely affects health at later life stages. While studies of environmentalexposure and men’s health among advanced age groups are limited, the overallresearch conducted thus far on chemicals and male reproductive health willserve to inform those focused on this new line of research.
Issues in Toxicology No. 16
Aging and Vulnerability to Environmental Chemicals: Age-related Disorders and their Origins in
Environmental Exposures
Edited by Bernard Weiss
r The Royal Society of Chemistry 2013
Published by the Royal Society of Chemistry, www.rsc.org
267

This review describes the state of the human science on the relationshipbetween exposure to environmental chemicals and male reproductive tractdisorders. The information has been categorized based on the endpoints thathave been most studied to date, including: 1) semen quality and sperm DNAdamage, 2) reproductive hormones, 3) thyroid hormones, and 4) cancers of themale reproductive tract. Due to space limitations, the reader is directed towardthe individual studies referenced throughout for additional details regardingstudy design, study populations, covariates considered, and so on.
10.2 Semen Quality and Sperm DNA Damage
The evaluation of semen quality is useful both for assessing male fertility andfor indicating effects of exposure to environmental toxicants on the malereproductive tract. Toxicants can effect changes in sperm concentration,motility, and morphology via action on the neuroendocrine system (i.e. thehypothalamic-pituitary-testis axis), testis (including Sertoli, Leydig, and sper-matogenic cells), and post-testicular sites such as the epididymis.1 They can alsoinduce oxidative stress resulting in sperm DNA damage. Study of the effects ofenvironmental exposures on these measures of male reproductive tract functionare particularly important because of recently observed, and unexplained,declines in semen quality in the general population2,3 as well as among healthyyoung males.4 Changes in these parameters are also relevant to older males, asaging is associated with decrease in semen volume and sperm concentration andmotility, and increasingly males over 50 are fathering children.5 Decreasedsemen quality and increased sperm DNA damage can lead to difficulty inconception, implantation and, potentially, abnormalities in offspring.5 Addi-tional insults from environmental exposures could consequently compoundthese declines in semen quality parameters among aging males.
10.3 Persistent Organochlorines
Persistent organochlorines have been widely studied and are associated with arange of adverse health effects, particularly those related to endocrinefunction.6 This category of chemicals includes polychlorinated biphenyls(PCBs), used until 1977 in the US as coolants and lubricants in electricalequipment, and organochlorine pesticides (OCs), such as dichlorodiphenyl-trichloroethane (DDT), which is no longer used in the US but still employed indeveloping countries where malaria is prevalent.7,8 Despite the discontinued useof these materials in the US, exposure continues through contaminated foodsand measurable levels are found in the majority of the general population.9
A number of studies have investigated associations between OCs and semenquality parameters, both at exposure levels consistent with those observed inthe general male population and in instances of accidental high-dose exposure.Beginning in 1986, Bush and colleagues observed an inverse relationshipbetween concentrations of PCB congeners 118, 138 and 153 in semen and spermmotility among oligospermic men.10 In a study comparing 21 infertile men with
268 Chapter 10

poor semen quality with 32 controls with normal semen quality, PCBs weredetected in the seminal plasma of infertile men but not control men, and,similarly to the previously mentioned study, total PCB concentrations wereinversely correlated with sperm motility (r¼� 0.5), but not with sperm countor normal morphology.11 This study also showed a positive associationbetween seminal plasma PCB levels and single-stranded DNA in sperm, amarker used frequently in subsequent studies as an indicator of downstreamresponse to oxidative stress.11 In contrast with these studies, another studycomparing men with normal semen quality versus poor semen quality foundhigher summed PCB metabolites in seminal plasma of men with good spermquality (0.071 ng mL�1 compared to 0.022 ng mL�1, p¼ 0.06).12 However,these authors did observe an inverse association between summed PCBs andsperm count and progressive motile sperm concentration within men from thegood semen quality group. Studies performed on men uncategorized by semenquality have also shown slightly conflicting results. A study of young men(n¼ 305) under conscription for military service found inverse associationsbetween serum PCB 153 and percent motile sperm, but not sperm concen-tration or total count.13 In a study examining Swedish fisherman from twodifferent regions, Rignell-Hydborn and colleagues observed that subjects in thehighest quintile of PCB 153 exposure had decreased sperm motility comparedto men from the lowest quintile of exposure, but there were no differences insperm concentration.14 The authors later examined sperm DNA fragmentationin the same population and found that it was positively associated with PCB153.15 Both of these findings were confirmed when this study was expanded(n¼ 2269) to four European centers.16 Lastly, Hauser and colleagues inves-tigated relationships of PCB exposure with semen quality in 212 men whopresented with their partners to an infertility clinic at Massachusetts GeneralHospital in Boston. They observed dose–response relationships between serumPCB 138 and below-reference sperm motility and morphology, but foundinconsistent results with PCB 153.17 They also did not find consistentsignificant associations between PCBs and DNA integrity in sperm using theneutral comet assay in the same population.18
Two groups also investigated the effect of high-dose PCB exposure followinga poisoning episode in Taiwan in 1979, where rice oil contaminated with PCBswas ingested. In a study comparing 12 men exposed prenatally with 23unexposed men, a higher proportion of sperm with abnormal morphology,reduced sperm motility, and reduced rapidly motile sperm in exposed subjectscompared to those unexposed was reported.19 A second study examined 40 menwho were directly exposed and compared them to 28 unexposed men, andobserved a higher percentage of sperm with abnormal morphology and higherrate of oligospermia in the exposed group.20
Although no longer used as a pesticide in the US, DDT is still used formalaria control in several countries. Studies from multiple continents havesuggested that exposure to DDT is associated with a decline in semenquality.16,21,22 There is also evidence for a relationship between DDT exposureand an increase in sperm DNA damage, but the results are inconsistent.16,18,23
Male Reproductive Tract Disorders 269

10.4 Non-Persistent Pesticides
Non-persistent pesticides (also called ‘‘contemporary-use pesticides’’),including insecticides, herbicides, fungicides and rodenticides, are usedcommonly in agricultural, commercial, and residential settings. Insecticides,including organophosphates, carbamates, and pyrethroids, have been the moststudied. Early research focused on male reproductive effects from occupationalexposure. Whorton and colleagues found a greater proportion of oligospermicmen among carbaryl-exposed workers in a pesticide production facilitycompared to other chemical workers.24 The carbaryl workers also had elevatedpercentages of abnormal sperm and higher percentages of them were defined asteratopsermics (greater than 60% abnormal sperm) compared to otherworkers.25 More recently, another study of exposed carbaryl workers foundthat subjects with high occupational exposure had elevated percentages ofsperm with fragmented DNA compared to internal and external controls,though adjustments were not made for potentially important confounders.26
Studies of occupational organophosphate exposure have reported similarfindings. Padungtod et al. observed a reduction in adjusted mean spermconcentration and percentage of motile sperm in 20 Chinese pesticide factoryworkers exposed to organophosphates, compared to unexposed controls.27
Also, in a Japanese study, pesticide sprayers exposed primarily to organo-phosphates and pyrethroids showed season-dependent reductions in motilesperm velocity measures compared to unexposed controls.28
There have been several additional studies linking occupational exposure todeclines in semen quality, though they have lacked specific information on thetypes of non-persistent pesticides used. In one analysis of 122 greenhouseworkers categorized by low, medium, or high exposure, a higher proportion ofabnormal sperm was observed in the high compared to low exposed groups.29
In another study, men occupationally exposed to pesticides had increased oddsfor having sperm concentrationo1million mL�1 and for having sperm motilityo50%, compared to unexposed controls.30 However, another study observedonly marginal differences in the semen quality parameters of 248 Danishfarmers who sprayed or did not spray pesticides, although the participation ratein this study was relatively low.31
Several studies of environmental (non-occupational) exposure have also beenconducted. An early study observed that men with a lower intake of organicfood had lower proportions of normally shaped sperm, but no variation inother sperm parameters.32 In 2003 Swan et al. examined male partners ofpregnant women in the US Study for Future Families and dichotomized theparticipants into cases and controls based on semen quality.33 Urinarymeasures of the herbicides alachlor and atrazine, and of the insecticide diazinon(2-isoproproxy-4-methyl-pyrimidinol), were associated with increased odds ofpoorer semen quality, although confidence intervals were wide due to smallsample size.33 In the previously described study of men presenting to aninfertility clinic in Boston, an inverse association was observed between spermconcentration and motility and a urinary metabolite of carbaryl, as well as
270 Chapter 10

between sperm motility and urinary concentrations of a metabolite of theorganophosphate chlorpyrifos.34 In addition, positive associations wereobserved between these pesticide biomarkers and sperm DNA damage in thesame population.35 A follow-up to that study also found an inverse relationshipbetween urinary pyrethroid metabolites and sperm concentration, motility, andmorphology, as well as a positive relationship between pyrethroid metabolitesand sperm DNA damage.36 The results from this latter study were confirmed byseveral later analyses in China. Xia et al. found an inverse association betweennon-occupational pyrethroid exposure and sperm concentration.37 In twoadditional studies of male partners from infertility clinics, conducted inChina and Japan, levels of the pyrethroid metabolite 3-phenoxybenzoic acid inurine were inversely associated with sperm concentration and positivelyassociated with sperm DNA fragmentation.38,39
10.5 Heavy Metals
Exposure to heavy metals, such as lead and cadmium, can occur occupa-tionally, but also through environmental pathways, such as the ingestion ofcontaminated food or water or the inhalation of contaminated air.Importantly, metals can accumulate in the body over time (for example, lead inbone and cadmium in the kidneys). Consequently, aging individuals withincreased bone resorption experience an increase in mobilization of lead andare subject to higher circulating blood levels.40 Studies of lead and cadmiumhave shown conflicting results with regards to effects on male reproductiveparameters; however, calcium and potassium ion channels are susceptible tocadmium and lead respectively which may represent a mechanism for the effectof metals on the testis and spermatozoa.41
Several recent non-occupational studies have demonstrated an associationbetween heavy metal exposure and altered semen quality. Hernandez-Ochoaand colleagues found an association between lead measured in spermatozoa orseminal fluid, but not blood, and decreased semen quality parameters in across-sectional study in Mexico.42 Another group observed similar results inmen presenting to infertility centers in Spain.43 In a US population of menpresenting to Michigan infertility clinics, a subtle but suggestive associationbetween lead exposure, measured in blood, and decreased semen quality wasalso found.44 Some relationships have also been observed in relation tocadmium exposure. Mendiola and colleagues found a positive associationbetween percent immotile sperm and cadmium concentrations measured inseminal plasma, but not in whole blood or blood plasma.43 These studies seemto indicate that there may be a relationship between exposure to lead andcadmium, especially when levels are measured in seminal fluid, and decreasedsemen quality; however, several studies have also reported null results.44–46
The investigation of associations with other metals have been sparse, but thereis some evidence for a relationship between decreased semen quality andexposure to manganese, mercury, and molybdenum.44,47,48
Male Reproductive Tract Disorders 271

10.6 Phthalates
Increasing attention has been paid recently to phthalate diesters, chemicals usedas plasticizers and solvents in a large number of consumer products. Exposureis widespread, with detectable levels of urinary metabolites observable in themajority of the population.9 In addition to various other modes of action,certain phthalates have been shown to be anti-androgenic, causing outcomessuch as decreased anogenital distance in rats and male infants exposedin utero.49
Several studies in environmentally exposed adults have indicated anassociation between phthalate exposure and declines in semen quality, althoughthere has been some variability in results between studies and by phthalatemetabolite. In 1987 Murature and colleagues observed an inverse associationbetween di-butyl phthalate (DBP) in cellular fractions of semen and spermconcentration among a small group of university students.50 Later, anothergroup found an inverse correlation with sperm morphology, but not ejaculatevolume, sperm concentration or motility, in a group of infertile men with poorsemen quality from India.11 These two analyses however, may have beensubject to contamination as parent phthalate compounds, such as DBP, arefound in many products in the laboratory environment. Subsequent studieshave primarily used metabolites for assessing individual exposure levels as thesemeasures are less susceptible to contamination.
Duty and colleagues observed significant inverse associations betweenurinary measures of several phthalate metabolites and semen quality in thepreviously described cross-sectional study of male partners of subfertile couplesrecruited through an infertility clinic in Boston.51 Notably, they also observed adose-dependent relationship between mono-butyl phthalate (MBP, a meta-bolite of DBP) and sperm motility and concentration.51 These results wereconfirmed several years later in the same study but with a larger sample size.52
In the same population, the metabolites mono-ethylhexyl phthalate (MEHP, ametabolite of di-ethylhexyl phthalate [DEHP]), mono-benzylbutyl phthalate(MBzP, a metabolite of butylbenzyl phthalate [BBzP]), monoethyl phthalate(MEP, a metabolite of diethyl phthalate [DEP]), monomethyl phthalate (MMP,a metabolite of dimethyl phthalate [DMP]), and MBP showed some suggestiverelationships with sperm motion parameters using computer-aided spermanalysis.53 There were also positive associations between sperm DNAdamage measured with the neutral comet assay and MEP and MEHPconcentrations in urine, after adjusting for smoking status.54,55 A subsequentstudy by Herr and colleagues, in 349 male partners of subfertile couples,reported no associations between urinary DEHP metabolites and spermconcentration, motility, or morphology,56 which was consistent with resultsfrom the US study.
Several additional groups have observed significant relationships betweenphthalate exposure and decreased semen quality. In a Swedish population ofhealthy young men at a medical conscript examination (n¼ 234), Jonsson andcolleagues found no associations with semen quality and MBP, but observed
272 Chapter 10

that subjects in the highest quartile of exposure for MEP had fewer motilesperm and more immotile sperm compared to the those in the lowest quartile.57
In another study of 150 men recruited through a reproductive institute inChina, there was a suggestive positive dose-response relatinoship between MBPexposure tertile and sperm concentration.58 Relationships with MMP andMEPwere not statistically significant, but a positive association was observedbetween MEP and sperm straight-line velocity.58 Lastly, a recent analysis thatcombined an epidemiologic study with an in vitro experiment found an inverseassociation between DEHP and DBP measured in semen and sperm motility inboth oligoasthenospermic and asthenospermic men. Additionally, it wasfoundthat in vitro culture of sperm with DEHP and DBP at the maximumconcentrations observed in human semen samples, as well as at levels 5- or 10-fold higher, also led to decreased sperm motility.59 Although the results of thesestudies are not fully consistent, there is evidence to suggest that phthalateexposure is associated with declines in various semen quality measures.
10.7 Other Environmental Chemicals
Since semen quality represents a useful and, in some instances (e.g., infertilityclinics), a relatively convenient marker for studying the effect of exposures onmale reproductive health, there are limited studies that have examined semenquality in relation to a wide range of other chemicals to which humans in theworkplace or in the general population are environmentally exposed. Theseinclude, among others, bisphenol A (BPA), brominated flame retardants suchas polybrominated dipheny ethers (PBDEs), organophosphate flame retardantssuch as triphenyl phosphate (TPP), fluorinated organic compounds such asperfluorooctane octanoate (PFOA) and perfluorooctane sulfonate (PFOS),parabens, and organic solvents such as ethylene glycol. These substances areused in a variety of applications and exposures can occur through multipleroutes.
In a recent study of 218 men from four regions of China where high occu-pational exposures to BPA exist, Li and colleagues found that men withdetectable urinary BPA had decreased sperm concentration, total sperm count,sperm vitality, and sperm motility after adjusting for potential confounders.60
Additionally, in the non-occupational setting, BPA levels in the urine of malepartners of infertile couples in the Boston study (n for analysis¼ 190) weresuggestively associated with increased sperm DNA damage.61 Also suggestivewere the relationships observed between BPA and the odds for being belowreference for sperm concentration, motility, and morphology, but the resultswere not statistically significant. Likewise, among 375 male partners ofpregnant women in the Study for Future Families, BPA levels in urine were notsignificantly associated with any semen parameters.62 More research isnecessary to further investigate the effect of BPA on semen quality.
The Boston infertility clinic study also examined urinary parabens, includingmethyl paraben (MP), propyl paraben (PP), and butyl paraben (BP), in relationto semen quality measures and sperm DNA damage.63 No relationships were
Male Reproductive Tract Disorders 273

observed for MP or PP, but BP quartiles were significantly and positivelyassociated with sperm DNA damage, and the association remained afteradjusting for BPA quartiles.63 Lack of other findings may be due to therelatively small sample size (n¼ 190 for semen quality measures, and n¼ 132for sperm DNA analysis) and/or substantial temporal variability in parabenconcentrations in urine samples, indicating that this area deserves furtherattention in exposure assessment and epidemiological studies.
Exposure to PBDEs has been suggestively associated with semen quality, butstudies have been quite limited in number and sample size. Akutsu andcolleagues observed an inverse relationship between serum PBDE concen-trations and semen quality and testis size in 10 Japanese males.64 A study of 52men visiting an infertility clinic in Quebec reported a negative associationbetween PBDE congeners BDE-47 and BDE-100 and semen motility, but notother semen parameters.65
Organic solvents are found primarily in industrial settings and are used inpaints, degreasing agents, and other applications. However, environmentalcontamination can occur, with subsequent human exposure through inhalationof contaminated air or ingestion of contaminated water. Several studies ofgeneral organic solvent exposure have shown an association with altered spermquality. In an infertility clinic in Argentina, researchers found solvent exposureto be associated with increased risk of abnormal sperm motility andmorphology in 177 men.30 Cherry and colleagues also observed a dose-dependent increased risk in abnormal sperm motility in association with highexposure to organic solvents in a study set in a Canadian infertility clinic.66 Instudies of individual solvents, there is evidence for effects of ethylene glycolethers, trichloroethylene, styrene, benzene, toluene, and xylene on semenquality.67,68
There is a range of other exposures that have been explored in relation tosemen quality in limited studies. Raymer and colleagues investigated theassociation between PFOA and PFOS measured in the semen and plasma of256 men, but no significant relationships were observed with semen volume,sperm concentration, percent motility, swim-up motility, or directional motilityin adjusted models.69 Another study measuring PFOA and PFOS in serumhowever, observed a significant decline in normal sperm count in Danish maleswith high exposure levels, as well as suggestive declines in total sperm count andsperm concentration.70 Meeker and colleagues examined levels of organo-phosphate flame retardants—including tris(1,2,-dichloro-2-propyl) phosphate(TDCPP) and TPP—in the dust of the houses of 50 men and found levels ofTPP to be associated with decreases in sperm concentration.71 Two groups haveinvestigated associations between exposure to disinfection by-products, such astrihalomethanes (THMs) or haloacetic acids (HAAs), and sperm quality butdid not report any significant associations.72,73 Other exposures associated withchanges in semen quality include air pollutants and electromagnetic frequenciesemitted from mobile phones.74 However, because these are not strictly chemicalexposures, and exposure assessment methods have generally been less precisefor these studies, their potential effects on semen quality are not reviewed here.
274 Chapter 10

10.8 Reproductive Hormones
In addition to a temporal downward trend in semen quality, researchers haveobserved an age-independent decline in testosterone levels over the last severaldecades, in men from both the US and Danish populations.75,76 Decreasedtestosterone levels in males has been associated with adverse health effects laterin life, including increased loss of bone mass and osteoporosis, sexualdysfunction, increased body mass index (BMI) and type 2 diabetes, andincreased risk of cardiovascular-related morbidities and mortalities.77–80 Sinceaging males are already subject to a steady decline in androgen levels, whichmay be exaggerated by age-related health problems, older individuals may bemore sensitive to changes resulting from environmental insults.81
10.8.1 Persistent Organochlorines
Several studies have investigated the effect of OC exposure on male repro-ductive hormone levels. However, there have been several inconsistencies.Particularly, selection of PCB congeners measured and range of exposure levelsin the studied populations have varied greatly. For example, many studiesutilized groups of freshwater fisherman who have significantly elevatedexposures to PCBs, hexachlorobenzene (HCB), and DDT. In US male sport-caught fish consumers, an inverse relationship between PCB concentrationsand steroid hormone-binding globulin (SHGB)-bound testosterone wasreported.82,83 Goncharov and colleagues also observed an inverse relationshipbetween PCB concentrations and total testosterone in a population of 257Mohawk Native Americans residing along the St. Lawrence River; however,SHBG was not measured in this study.84
On the other hand, several groups have observed inverse associationsbetween PCB exposure and free testosterone, as opposed to total testosteroneor the bound fraction. In a study of Swedish military conscripts, an inverserelationship was observed between serum PCB-153 and free testosterone, butnot bound testosterone.13 This was also observed in a large 4-center study ofEuropean and Inuit men, where a positive association with PCB-153 and LHwas also observed.16 In a population of Latvian and Swedish men, Hagmar andcolleagues observed an inverse correlation between summed PCBs and freetestosterone, but the relationship was not significant after adjustment for age.85
They did not find significant associations between individual PCB congenersand other hormones, including follicle-stimulating hormone (FSH), luteinizinghormone (LH), prolactin, SHBG, or total testosterone.85 However, this couldhave been due to a limited sample size. Finally, a recent study of men inNorway reported a strong positive association between PCB-153 (a congenerthat is thought to be representative of cumulative PCB exposure) and SHBGafter adjustments for age and BMI.86 Overall, these findings suggest that PCBsmay interact with steroid binding capacity in humans.
In addition to the relationships with testosterone, several groups haveobserved a link between PCB exposure and other reproductive hormones in
Male Reproductive Tract Disorders 275

males. In an Inuit population in Greenland, Giwercman and colleaguesreported a positive association between PCB-153 and LH, although theseresults were inconsistent with those from other European cohorts examined inthe same study.87 When all cohorts were combined, they observed positiveassociations between PCB-153 and SHBG, and between dichlorodiphe-nyldichloroethylene (DDE), a stable metabolite of DDT, and FSH.87 Inanother study of a much younger cohort, including 887 15-year-old Flemishmales, relationships were observed between total and free testosterone,estradiol and aromatase index, and summed PCBs (including PCB-138, PCB-153 and PCB-180) and hexachlorobenzene (HCB), another OC of interest.88
They also reported a positive association between estradiol and serum DDE.88
10.8.2 Non-Persistent Pesticides
In studies of both agricultural workers and the general population, there is asuggestive relationship between non-persistent pesticide exposure and alteredsex hormone levels in men. In a group of agricultural workers, Recio andcolleagues reported significant inverse associations between urinary markers oforganophosphate pesticides and FSH and LH, and a statistically suggestiveinverse association with estradiol.89 No relationship was observed withtestosterone however.89 The inverse relationship with FSH was consistent witha study of 104 floriculturists in Mexico. Non-specific organophosphate meta-bolites in urine [dimethylphosphate (DMP) , diethylphosphate (DEP),diethylthiophosphate (DETP) and total dialkyl phosphates (DAPs)] werenegatively associated with serum FSH, and marginally and positivelyassociated with testosterone.90 DETP was marginally and negatively associatedwith LH.90 A study of Danish greenhouse workers found a suggestiveassociation between exposure to various insecticides and decreased testo-sterone; however, biomarkers for exposure assessment were not used.91
In the population of adult males presenting to a Boston infertility clinic,urinary metabolites of carbaryl and chlorpyrifos were associated withdecreased serum testosterone, and the chlorpyrifos metabolite was alsoinversely associated with estradiol.92,93 Furthermore, in US and Chinesestudies, pyrethroid metabolites have been positively associated with LH andnegatively associated with estradiol and inhibin B.94,95
10.8.3 Heavy Metals
Heavy metal exposure has been linked to changes in male sex hormone levels inseveral studies, primarily in instances of occupational exposure. Bloodcadmium levels were associated with increased testosterone and LH levels, anddecreased prolactin levels, in 149 Croatian industrial workers.96 In anotherstudy of 166 occupationally exposed Chinese men, urinary cadmium levels weresimilarly associated with an increase in testosterone and LH.97
In studies of men exposed environmentally to cadmium, similar results havebeen reported, although exposure has been measured using several different
276 Chapter 10

methods (e.g., using biomarkers in blood, urine and seminal plasma). Usingblood cadmium levels, non-occupational exposure in a Croatian population of123 men was associated with increased serum testosterone, as seen previously,and also with increased FSH and estradiol, after adjustment for confounders.45
Using urine cadmium as a biomarker of exposure, Zeng and colleagues foundthat exposure was associated with abnormally high testosterone levels,although they did not observe any relationships with total testosterone, FSH,or LH in multiple regression models.98 In a large of study of males in the US,utilizing the National Health and Nutrition Examination Survey (NHANES), apositive association was reported between urinary cadmium concentrations andtestosterone, estradiol, and SHBG.99 Using seminal plasma to estimateexposure, one study observed a positive correlation between cadmium and FSHlevels, but not with LH or testosterone.100 Several inverse and null associationshave also been reported between cadmium exposure and reproductivehormones. Also utilizing urinary cadmium, Dhooge and colleagues observed aninverse association between cadmium exposure and testosterone, free testo-sterone, estradiol, and aromatase index after adjustments for confounders in887 Flemish adolescent males.88 A smaller study of 64 men from 3 infertilitycenters in Spain also reported no association between cadmium or other metalsin seminal plasma, blood plasma, or whole blood and the hormones testo-sterone, FSH or LH.43
There has also been a range of studies exploring the effects of other metals,particularly with regard to occupational exposures. Blood lead levels in occu-pationally explosed males have been positively associated with inhibin B, FSH,LH, estradiol, and testosterone.46,101–103 However, there have also been severalstudies reporting no evidence of these relationships.96,104,105 In male welders withinhalational exposure to a variety of compounds, such as hexavalent chromiumand stainless steel fumes, some studies have shown exposure to be associated withdecreased testosterone levels, increased FSH, and LH, while others have foundno association with sex hormones.106–109 Finally, in magnesium alloy productionworkers, Elingsen and colleagues reported that manganese exposure wasassociated with significant increases in prolactin levels.110
In non-occupational studies of metals, several relationships with sexhormones in males have been observed as well. Mercury exposure in a smallresidential population in Cambodia was significantly and positively associatedwith estradiol levels, although previous studies of occupational mercuryexposure did not report similar results.102,105,111,112 A study of men recruitedthrough Michigan infertility clinics reported inverse relationships betweenblood molybdenum levels and testosterone.44 Lastly, there is some evidence foran association between arsenic exposure and decreased circulating testosteronelevels, as well as increased risk of erectile dysfunction.113
10.8.4 Phthalates
Phthalate exposure has been linked to altered levels of circulating reproductivehormones in several studies. One study of workers in a polyvinyl chloride
Male Reproductive Tract Disorders 277

flooring production facility, where individuals were highly exposed to DEHPand DBP, reported inverse associations between exposure and circulating freetestosterone levels.114 Most other findings have been in relation to environ-mental phthalate exposure. In the Boston study of 425 men presenting to aninfertility clinic, authors reported inverse associations between urinary levels ofMEHP and testosterone, estradiol, and free androgen index (FAI, a measure ofthe ratio of total testosterone to SHBG), as well as a suggestive positiveassociation between MEHP and the ratio of testosterone to estradiol (ameasure of aromatase activity).115 Another analysis among men with provenfertility in the Study for Future Families confirmed the findings for MEHP,observing all DEHP metabolites, including MEHP, mono-2-ethyl-5-hydroxyhexyl phthalate (MEHHP), mono-2-ethyl-5-oxohexyl phthalate(MEOHP), and mono-2-ethyl-5-carboxypentyl phthalate (MECPP), to beinversely correlated with total testosterone, free testosterone, and FAI in crudemodels.116 After adjustments for potential covariates, no relationships with totaltestosterone remained, but several DEHP metabolites were still significantlyassociated with decreased FAI. In addition,MEHPwas correlated with SHBG inthis analysis, but there were no significant findings for other combinations ofphthalate metabolites and sex hormone levels. In a population of young Swedishmen, no relationships were found forMEHP, or other metabolites measured, andFSH, testosterone, estradiol or inhibin B, but a significant negative associationwas observed between MEP exposure and LH.57 Lastly, a study of 118 suspectedinfertile men from a reproductive center in China measured levels of DEHP andDBP in semen and blood serum, and found significant positive associationsbetween prolactin and serum DBP, serum DEHP, and semen DEHP.117 Positiverelationships were also observed between semen DEHP concentrations andestradiol, and between semen DBP and testosterone levels. However, asmentioned previously, exposure measures of parent phthalate compounds aremore susceptible to laboratory contamination, and thus results may be unreliable.
10.8.5 Other Environmental Chemicals
Several other compounds have also been studied in relation to reproductivehormone levels in males. BPA in particular has been a focus of recent studies ofmale endocrine function, as it has been shown to affect the reproductive tract inanimals.118 An initial study of occupational exposure to BPA showed asignificant inverse association with serum FSH levels.119 BPA has also beenlinked to testosterone levels in several non-occupational studies. One groupobserved a positive association between urinary BPA levels and serum FSH inthe Boston infertility clinic study.120 They also observed inverse relationshipsbetween BPA and inhibin B and the ratio of estradiol to testosterone.120 In asmall group of healthy men and women in Japan, BPA measured in serum waspositively associated with circulating total and free testosterone levels.121 In aprospective population-based study of 715 Italian adults, there was a positiverelationship between urinary BPA levels and total serum testosterone afteradjustment for covariates.122 No significant associations were observed,
278 Chapter 10

however, with free testosterone, SHBG, or estradiol. Finally, in a study of 375men from the Study for Future Families, Mendiola and colleagues reportedthat urinary BPA was significantly and negatively related to serum FAI andFAI/LH ratio, and positively associated with SHBG.62
In addition to BPA, several other environmental chemicals of recent interesthave demonstrated associations with changes in reproductive hormone levels.Turyk and colleagues found PBDE conger 47 measured in serum to be positivelyassociated with testosterone in a study of 405 adult males.123 Using concen-trations of PBDE in house dust, another US study found that congeners 47, 99,and 100 were inversely related to FAI, LH, and FAI.124 PFOS and PFOA wereexamined in two studies. One study reported that PFOA and PFOS in plasmawere positively correlated with serum LH levels, but not with other reproductivehormones.69 The second study, although slightly smaller, did not observe anysignificant associations with either compound.125 Finally, the organophosphatecompound TDCPP, but not TPP, measured in house dust, was associated withan increase in prolactin levels in 50 men recruited from an infertility clinic.71 Thestudy also observed a suggestive inverse relationship between TDCPP and FAI,but the association became less clear in adjusted models.
10.9 Thyroid Hormones
Healthy adults have thyroid hormone receptors in almost every tissue, andthyroid hormones and signaling are crucial for maintaining many bodilyfunctions, including energy metabolism, heart rhythm, and bone resorption.Thyroid hormones are also vital to the reproductive system, althoughconnections are less well-established.126 Thyroid hormones appear to beimportant for reproductive tract development in males, as Sertoli cells expressthyroid hormone receptors, and thyroid hormones themselves may be involvedin Leydig cell differentiation and steroidogenesis in the testis of neonates.127,128
In adults, thyroid hormones may interact with the pituitary to alter the releaseof LH in response to gonadotropin-releasing hormone (GnRH), leading to adownstream effect on testosterone and estradiol production, and may also beinvolved in the Leydig cell steroidogenic response to LH.129,130 Finally, there issome evidence suggesting that thyroid hormone changes could be associatedwith sperm production and quality, further indicating the importance ofstudying the influences of environmental exposures on the thyroid system whenconsidering impacts on the male reproductive tract.131,132 Environmentalchemicals have been shown to have adverse effects on thyroid signaling. Henceassessing relationships between these toxicants and markers of altered thyroidsignaling in humans is an important aspect of the study of environmental effectson male reproductive function.
10.9.1 Persistent Organochlorines
Perhaps the exposures most studied in relation to thyroid hormones in menhave been those of PCBs, DDE, and HCB, which may interact with thyroid
Male Reproductive Tract Disorders 279

hormones by interfering with receptor binding or uptake, or by disruptinghormone transport and metabolism.133 Although there have been numerousfindings in an array of populations exposed at different levels, results have notbeen fully consistent.134 In the previously discussed population of Great Lakesfisherman, Persky and colleagues observed an inverse association between PCBsmeasured in serum and total T4 (thyroxine), but not T3 (triiodothyronine).82 Ina larger follow-up study, additional associations were observed between PCBexposure and T3 and thyroid-stimulating hormone (TSH), and the relationshipwith T4 was confirmed.83 Furthermore, there was a suggestive inverse correlationbetween DDE and T4 in adjusted models, whereas no significant relationshipswith DDE were detected by Persky and colleagues in the original study.
Two studies of men from North American infertility clinics, with exposurelevels more consistent with those observed in the general population, have alsoinvestigated these relationships. In 341 men from the Boston study, serumPCBs were inversely associated with total T3 after models were adjusted forcovariates.135 DDE was also significantly related to increased circulating freeT4 and total T3 levels, as well as decreased TSH. Furthermore, HCB wasinversely associated with total T3 in models adjusting for DDE exposure. In asmaller (n¼ 52) study of men from a clinic in Quebec, summed PCBs and DDEwere related to decreased total T4, but not to other thyroid hormones.65
10.9.2 Non-Persistent Pesticides
In studies of both occupational and environmental exposure, there is evidencefor a link between non-persistent pesticides and circulating thyroid hormonelevels in men. In 1997, one group observed an increase in TSH in associationwith exposure to ethylene-bi(dithiocarbamate) fungicides in Mexican pesticideapplicators, but found no change in T4.136 In another study, among pesticideformulators in India, subjects exposed to a variety of compounds hadsignificantly increased TSH and decreased total T3, as well as suggestivelydecreased T4, compared to controls.137 In a longitudinal study of urinary DAPconcentrations in Mexican floricultural workers, DMP was related to anincrease in serum TSH and T4, and a decrease in total T3.138 Finally, one studyof environmentally exposed males reported an inverse association betweenbiomarkers of carbaryl and chlorpyrifos exposure and free T4 levels.139
10.9.3 Heavy Metals and Other Environmental Chemicals
Associations between heavy metals and thyroid hormone levels have primarilybeen reported in populations of exposed workers, and these reports areinconsistent.140 However, lead exposure may have an effect on the ability ofGnRH to stimulate TSH release in the hypothalamic-pituitary axis, and mayalso affect the transport and metabolism of thyroid hormones.141 In support ofthis hypothesis, a study of adult male automobile mechanics reported thatincreased exposure to lead was associated with an increase in TSH, but was notassociated with alterations in T3 or T4.142 Another group presented conflicting
280 Chapter 10

evidence of decreased levels of T4, but not T3 or TSH, in association with leadexposure among adolescent male auto mechanics.140 Further analysis, andexploration of other metals, is necessary in order to make a conclusion aboutthe relationship between metals and altered thyroid function.
PBDE exposure appears to have a more decisive relationship with thyroidhormones in humans. Hagmar and colleagues found an inverse relationshipbetween plasma measures of PBDE-47 and TSH after adjustment for age,although no associations were observed with T3 or T4.85 Another groupinvestigating effects in a population of adult male sports-fishermen confirmedthe association with PBDE exposure and decrease in TSH and additionallyobserved an inverse relationship with total T3 and a positive relationship withfree T4.123 Several other studies also found a link between PBDE exposure andincreased free T4 levels.64,124,143 These results seem to provide substantialevidence for a relationship with PBDE exposure; however, one small longi-tudinal study was unable to demonstrate statistically significant effects, andmore research is necessary to establish causation.144
Phthalates may also be associated with altered thyroid hormones in men. In408 men from the Boston infertility clinic study, urinary MEHP was inverselyassociated with serum free T4 and total T3, but not TSH, in adjusted models.145
In a larger population of adults from NHANES (n¼ 1346 adults, male andfemale), the inverse relationship between MEHP and free T4 was confirmed,and inverse relationships with total T4, total T3, and thyroglobulin were alsoobserved, as was a positive relationship with TSH.61 More work is necessary tofully understand the mechanism behind the relationship between phthalateexposure and thyroid function.
Lastly, new studies have hypothesized that BPA exposure may also belinked to altered thyroid hormone levels in men. In the Boston infertility clinicstudy, authors observed a suggestive inverse association between urinary levelsof BPA and TSH.120 In the larger study of adults from the NHANES dataset,this relationship was also observed, as was an inverse association with totalT4.61 More studies on the potential for BPA to alter thyroid signaling areneeded.
10.10 Cancers of the Male Reproductive Tract
Of particular concern to the aging population are cancers of the male repro-ductive tract. Prostate cancer is one of the most common malignancies in menand is expected to increase as the population ages, which represents asignificant economic burden.146 Additionally, although testicular cancer ismore common in younger males, approximately 25% of incident cases occur inmen over the age of 40.147 In the last two decades, there has been an increasingtrend in the incidence of testicular cancers in the US and Europe, as well as avery rapid increase in Croatia.148–151 Investigation and prevention of envi-ronmental causes of these cancers is therefore particularly important.
Most studies of cancer-inducing effects of chemicals in adult males to datehave been performed in agricultural workers occupationally exposed to
Male Reproductive Tract Disorders 281

pesticides. In a cohort of pesticide applicators in Florida, incidence of testicularand prostate cancers between 1975 and 1993 were significantly elevated.152 Thisrelationship was also observed more recently in British agricultural pesticideusers who developed cancers between 1987 and 2004.153 A larger study ofnational pesticide users in the US however, did not observe a significantassociation between exposure and testicular or prostate cancer risk, althoughthere was a relationship with hematopoietic and nervous system cancers.154
Effects of non-persistent pesticides have been examined thoroughly in theAgricultural Health Study, an ongoing project that has examined canceroutcomes in commercial pesticide applicators and their families in NorthCarolina and Iowa since 1994.155 A recent study has indicated that maleparticipants have a significant excess risk of prostate cancer, despite somelimitations in exposure assessment methods.156–158 Additionally, studies ofrelationships with prostate cancer and specific pesticide exposures have foundlinks with the organophosphate pesticides terbufos, coumaphos, andothers.159,160 Several of these analyses have not observed significant rela-tionships however, with other common pesticides such as chlorpyrifos.161 Asthe study progresses and allows for increased latency times, the effects of someof these compounds will likely become clearer.
Although use has been discontinued, DDE serum levels, representing DDTexposure, have been associated with increased risk of testicular germ celltumors (TGCT) in several studies among populations in the US, Norway, andItaly.162–164 However, other studies have reported null relationships betweenexposure and such cancers.165,166 These studies have primarily estimatedexposure using circulating DDE levels in adults, which may not be fullyrepresentative of long-term exposures or exposures during sensitive periods ofdevelopment. More sophisticated analyses and longitudinal studies may benecessary in order to fully understand this relationship.
Similarly, PCBs have been associated, in some studies, with increased risk ofmale reproductive tract cancers, but again results were inconsistent. Several smallstudies observed significant relationships between circulating PCB levels and riskof prostate cancer.167–169 However, in a large nested case-control study in Japan,there were no significant relationships with plasma organochlorine levels.170
Similarly, no associations were reported in a case-control study in Ontario.171
With regards to risk of TGCT, results have also been conflicting.164,166
Relationships between male reproductive tract cancers and other exposureshave been limited, both in number and in methodology. For metals,associations observed in humans have been inconsistent, but results in animalstudies suggest cadmium could lead to testicular and prostate cancers.172
Effects of other chemicals have yet to be explored.
10.11 Summary and Conclusion
In summary, there is a fairly large body of evidence suggesting that a widerange of chemicals adversely impact the male reproductive tract followingoccupational or environmental exposure. However, the level of evidence and
282 Chapter 10

the consistency of findings within and between studies and between chemicalagents has varied, and further research would be beneficial. Most of the studiesdescribed here have been cross-sectional in nature. Well-designed longitudinalstudies are needed in order to explore the temporal relationships betweenexposure and outcome, and to account for the common occurrence of widevariability in individual exposure levels over time. In addition, researchers needto begin addressing not just single chemicals or classes of chemicals, but alsoexposure to mixtures of chemicals that may act additively, synergistically, orantagonistically with one another in relation to men’s health endpoints. Moreresearch is also needed on genetic, metabolic, demographic, or other char-acteristics that impart increased individual susceptibility to environmentalexposure in relation to these adverse health outcomes, as well as the time pointsalong the life course that are most vulnerable to exposure. Finally, while theoverall literature on male reproductive health is useful when consideringexposure and aging, there is a clear need for studies focused on older popu-lations, and which examine exposures, endpoints, and important covariatesthat are most relevant to health concerns later in life.
Abbreviations
DBCP dibromochloropropanePCBs polychlorinated biphenylsOCs organochlorine pesticidesDDT dichlorodiphenyltrichloroethaneMGH Massachusetts General HospitalSFF Study for Future FamiliesIMPY 2-isoproproxy-4-methyl-pyrimidinolTCPY 3,5,6-trichloro-2-pyridinol1N 1-naphthol3-PBA 3-phenoxybenzoic acidDBCP dibromochloropropaneDBP dibutyl phthalateMBP monobutyl phthalateMEHP monoethylhexyl phthalateDEHP diethylhexyl phthalateMBzP monobenzylbutyl phthalateBBzP benzylbutyl phthalateMEP monoethyl phthalateDEP diethyl phthalateMMP monomethyl phthalateDMP dimethyl phthalateCASA computer-aided sperm analysisMEHHP mono-2-ethyl-5-hydroxyhexyl phthalateMEOHP mono-2-5-oxohexyl phthalateMECCP mono-2-ethyl-5-carboxypropyl phthalateMCPP mono-3-carboxypropyl phthalate
Male Reproductive Tract Disorders 283

PBDEs polybrominated diphenyl ethersTPP triphenyl phosphatePFOA perfluorooctane octanoatePFOS perfluorooctane sulfonateMP methy parabenPP propyl parabenBP butyl parabenTDCPP [tris(1,2,-dichloro-2-propyl) phosphate]DBPs disinfection by-productsTHMs trihalomethanesHAAs haloacetic acidsBMI body mass indexSHBG steroid hormone binding globulinFSH follicle-stimulating hormoneLH Luteinizing hormoneDDE dichlorodiphenyldichloroethyleneHCB hexachlorobenzeneDAPs diakyl phosphatesDMP dimethylphosphateDEP diethylphosphateDETP diethylthiophosphateFAI free androgen indexPVC polyvinyl chlorineGnRH gonadotropin-releasing hormoneT4 thyroixineT3 triiodothyronineTSH thyroid-stimulating hormoneTGCT testicular germ cell tumors
References
1. J. D. Meeker and R. Hauser, in Environmental Impacts on ReproductiveHealth and Fertility, eds. T. J. Woodruff, S. Janssen, L. Guillette and L.Giudice, Cambridge University Press, Cambridge, 2010, pp. 154–160.
2. S. H. Swan, E. P. Elkin and L. Fenster, Environ Health Perspect, 2000,108, 961–966.
3. E. Carlsen, A. Giwercman, N. Keiding and N. E. Skakkebaek, BMJ,1992, 305, 609–613.
4. A. G. Andersen, T. K. Jensen, E. Carlsen, N. Jorgensen, A.M. Andersson, T. Krarup, N. Keiding and N. E. Skakkebaek, HumReprod, 2000, 15, 366–372.
5. A. F. Stewart and E. D. Kim, Urology, 2011, 78, 496–499.6. G. Toft, L. Hagmar, A. Giwercman and J. P. Bonde, Reprod Toxicol,
2004, 19, 5–26.7. ATSDR (Agency for Toxic Substances and Disease Registry), Atlanta,
GA, 2000.
284 Chapter 10

8. ATSDR (Agency for Toxic Substances and Disease Registry), Atlanta,GA, 2002.
9. W. J. Crinnion, Altern Med Rev, 2010, 15, 101–109.10. B. Bush, A. H. Bennett and J. T. Snow, Arch Environ Contam Toxicol,
1986, 15, 333–341.11. R. Rozati, P. P. Reddy, P. Reddanna and R. Mujtaba, Fertil Steril, 2002,
78, 1187–1194.12. J. W. Dallinga, E. J. Moonen, J. C. Dumoulin, J. L. Evers, J. P. Geraedts
and J. C. Kleinjans, Hum Reprod, 2002, 17, 1973–1979.13. J. Richthoff, L. Rylander, B. A. Jonsson, H. Akesson, L. Hagmar,
P. Nilsson-Ehle, M. Stridsberg and A. Giwercman, Environ HealthPerspect, 2003, 111, 409–413.
14. A. Rignell-Hydbom, L. Rylander, A. Giwercman, B. A. Jonsson,P. Nilsson-Ehle and L. Hagmar, Hum Reprod, 2004, 19, 2066–2075.
15. A. Rignell-Hydbom, L. Rylander, A. Giwercman, B. A. Jonsson,C. Lindh, P. Eleuteri, M. Rescia, G. Leter, E. Cordelli, M. Spano andL. Hagmar, Environ Health Perspect, 2005, 113, 175–179.
16. J. P. Bonde, G. Toft, L. Rylander, A. Rignell-Hydbom, A. Giwercman,M. Spano, G. C. Manicardi, D. Bizzaro, J. K. Ludwicki, V. Zvyezday, E.C. Bonefeld-Jorgensen, H. S. Pedersen, B. A. Jonsson and A.M. Thulstrup, Environ Health Perspect, 2008, 116, 269–277.
17. R. Hauser, Z. Chen, L. Pothier, L. Ryan and L. Altshul, Environ HealthPerspect, 2003, 111, 1505–1511.
18. R. Hauser, N. P. Singh, Z. Chen, L. Pothier and L. Altshul, Hum Reprod,2003, 18, 2525–2533.
19. Y. L. Guo, P. C. Hsu, C. C. Hsu and G. H. Lambert, Lancet, 2000, 356,1240–1241.
20. P. C. Hsu, W. Huang, W. J. Yao, M. H. Wu, Y. L. Guo and G.H. Lambert, JAMA, 2003, 289, 2943–2944.
21. N. H. Aneck-Hahn, G. W. Schulenburg, M. S. Bornman, P. Farias andC. de Jager, J Androl, 2007, 28, 423–434.
22. K. P. Phillips and N. Tanphaichitr, J Toxicol Environ Health B Crit Rev,2008, 11, 188–220.
23. M. J. Perry, Hum Reprod Update, 2008, 14, 233–242.24. M. D. Whorton, T. H. Milby, H. A. Stubbs, B. H. Avashia and E.
Q. Hull, J Toxicol Environ Health, 1979, 5, 929–941.25. A. J. Wyrobek, G. Watchmaker, L. Gordon, K. Wong, D. Moore, 2nd
and D. Whorton, Environ Health Perspect, 1981, 40, 255–265.26. Y. Xia, S. Cheng, Q. Bian, L. Xu, M. D. Collins, H. C. Chang,
L. Song, J. Liu, S. Wang and X. Wang, Toxicol Sci, 2005, 85,615–623.
27. C. Padungtod, D. A. Savitz, J. W. Overstreet, D. C. Christiani, L.M. Ryan and X. Xu, J Occup Environ Med, 2000, 42, 982–992.
28. M. Kamijima, H. Hibi, M. Gotoh, K. Taki, I. Saito, H. Wang, S. Itohara,T. Yamada, G. Ichihara, E. Shibata, T. Nakajima and Y. Takeuchi,J Occup Health, 2004, 46, 109–118.
Male Reproductive Tract Disorders 285

29. A. Abell, E. Ernst and J. P. Bonde, Scand J Work Environ Health, 2000,26, 492–500.
30. A. Oliva, A. Spira and L. Multigner, Hum Reprod, 2001, 16, 1768–1776.31. S. B. Larsen, A. Giwercman, M. Spano and J. P. Bonde, Reprod Toxicol,
1998, 12, 581–589.32. R. K. Juhler, S. B. Larsen, O. Meyer, N. D. Jensen, M. Spano,
A. Giwercman and J. P. Bonde, Arch Environ Contam Toxicol, 1999, 37,415–423.
33. S. H. Swan, R. L. Kruse, F. Liu, D. B. Barr, E. Z. Drobnis, J. B. Redmon,C. Wang, C. Brazil and J. W. Overstreet, Environ Health Perspect, 2003,111, 1478–1484.
34. J. D. Meeker, L. Ryan, D. B. Barr, R. F. Herrick, D. H. Bennett,R. Bravo and R. Hauser, Environ Health Perspect, 2004, 112, 1665–1670.
35. J. D. Meeker, N. P. Singh, L. Ryan, S. M. Duty, D. B. Barr, R.F. Herrick, D. H. Bennett and R. Hauser, Hum Reprod, 2004, 19,2573–2580.
36. J. D. Meeker, D. B. Barr and R. Hauser, Hum Reprod, 2008, 23,1932–1940.
37. Y. Xia, Y. Han, B. Wu, S. Wang, A. Gu, N. Lu, J. Bo, L. Song, N. Jin andX. Wang, Fertil Steril, 2008, 89, 1743–1750.
38. G. Ji, Y. Xia, A. Gu, X. Shi, Y. Long, L. Song, S. Wang and X. Wang,Reprod Toxicol, 2011, 31, 171–176.
39. H. Toshima, Y. Suzuki, K. Imai, J. Yoshinaga, H. Shiraishi,Y. Mizumoto, S. Hatakeyama, C. Onohara and S. Tokuoka, Int J HygEnviron Health, 2011.
40. S. W. Tsaih, S. Korrick, J. Schwartz, M. L. Lee, C. Amarasiriwardena,A. Aro, D. Sparrow and H. Hu, Environ Health Perspect, 2001, 109,995–999.
41. S. Benoff, A. Jacob and I. R. Hurley, Hum Reprod Update, 2000, 6,107–121.
42. I. Hernandez-Ochoa, G. Garcia-Vargas, L. Lopez-Carrillo, M. Rubio-Andrade, J. Moran-Martinez, M. E. Cebrian and B. Quintanilla-Vega,Reprod Toxicol, 2005, 20, 221–228.
43. J. Mendiola, J. M. Moreno, M. Roca, N. Vergara-Juarez, M. J. Martinez-Garcia, A. Garcia-Sanchez, B. Elvira-Rendueles, S. Moreno-Grau,J. J. Lopez-Espin, J. Ten, R. Bernabeu and A. M. Torres-Cantero,Environ Health, 2011, 10, 6.
44. J. D. Meeker, M. G. Rossano, B. Protas, M. P. Diamond, E. Puscheck,D. Daly, N. Paneth and J. J. Wirth, Environ Health Perspect, 2008, 116,1473–1479.
45. J. Jurasovic, P. Cvitkovic, A. Pizent, B. Colak and S. Telisman, Biometals,2004, 17, 735–743.
46. S. Telisman, B. Colak, A. Pizent, J. Jurasovic and P. Cvitkovic, EnvironRes, 2007, 105, 256–266.
47. C. M. Choy, Q. S. Yeung, C. M. Briton-Jones, C. K. Cheung, C. W. Lamand C. J. Haines, Fertil Steril, 2002, 78, 426–428.
286 Chapter 10

48. J. J. Wirth, M. G. Rossano, D. C. Daly, N. Paneth, E. Puscheck, R.C. Potter and M. P. Diamond, Epidemiology, 2007, 18, 270–273.
49. J. D. Meeker, S. Sathyanarayana and S. H. Swan, Philos Trans R SocLond B Biol Sci, 2009, 364, 2097–2113.
50. D. A. Murature, S. Y. Tang, G. Steinhardt and R. C. Dougherty, BiomedEnviron Mass Spectrom, 1987, 14, 473–477.
51. S. M. Duty, M. J. Silva, D. B. Barr, J. W. Brock, L. Ryan, Z. Chen, R.F. Herrick, D. C. Christiani and R. Hauser, Epidemiology, 2003, 14,269–277.
52. R. Hauser, J. D. Meeker, S. Duty, M. J. Silva and A. M. Calafat,Epidemiology, 2006, 17, 682–691.
53. S. M. Duty, A. M. Calafat, M. J. Silva, J. W. Brock, L. Ryan, Z. Chen,J. Overstreet and R. Hauser, J Androl, 2004, 25, 293–302.
54. S. M. Duty, N. P. Singh, M. J. Silva, D. B. Barr, J. W. Brock, L. Ryan, R.F. Herrick, D. C. Christiani and R. Hauser, Environ Health Perspect,2003, 111, 1164–1169.
55. R. Hauser, J. D. Meeker, N. P. Singh, M. J. Silva, L. Ryan, S. Duty andA. M. Calafat, Hum Reprod, 2007, 22, 688–695.
56. C. Herr, A. zur Nieden, H. M. Koch, H. C. Schuppe, C. Fieber,J. Angerer, T. Eikmann and N. I. Stilianakis, Int J Hyg Environ Health,2009, 212, 648–653.
57. B. A. Jonsson, J. Richthoff, L. Rylander, A. Giwercman and L. Hagmar,Epidemiology, 2005, 16, 487–493.
58. L. Liu, H. Bao, F. Liu, J. Zhang and H. Shen, Environ Int, 2011.59. N. Pant, A. Pant, M. Shukla, N. Mathur, Y. Gupta and D. Saxena, Hum
Exp Toxicol, 2011, 30, 507–514.60. D. K. Li, Z. Zhou, M. Miao, Y. He, J. Wang, J. Ferber, L. J. Herrinton,
E. Gao and W. Yuan, Fertil Steril, 2011, 95, 625–630 e621–624.61. J. D. Meeker and K. K. Ferguson, Environ Health Perspect, 2011, 119,
1396–1402.62. J. Mendiola, N. Jorgensen, A. M. Andersson, A. M. Calafat, X. Ye,
J. B. Redmon, E. Z. Drobnis, C. Wang, A. Sparks, S. W. Thurston, F. Liuand S. H. Swan, Environ Health Perspect, 2010, 118, 1286–1291.
63. J. D. Meeker, T. Yang, X. Ye, A. M. Calafat and R. Hauser, EnvironHealth Perspect, 2011, 119, 252–257.
64. K. Akutsu, S. Takatori, S. Nozawa, M. Yoshiike, H. Nakazawa,K. Hayakawa, T. Makino and T. Iwamoto, Bull Environ Contam Toxicol,2008, 80, 345–350.
65. N. Abdelouahab, Y. Ainmelk and L. Takser, Reprod Toxicol, 2011, 31,546–550.
66. N. Cherry, F. Labreche, J. Collins and T. Tulandi, Occup Environ Med,2001, 58, 635–640.
67. I. Figa-Talamanca, M. E. Traina and E. Urbani, Occup Med (Lond),2001, 51, 174–188.
68. E. K. Sheiner, E. Sheiner, R. D. Hammel, G. Potashnik and R. Carel, IndHealth, 2003, 41, 55–62.
Male Reproductive Tract Disorders 287

69. J. H. Raymer, L. C. Michael, W. B. Studabaker, G. W. Olsen, C. S. Sloan,T. Wilcosky and D. K. Walmer, Reprod Toxicol, 2011.
70. U. N. Joensen, R. Bossi, H. Leffers, A. A. Jensen, N. E. Skakkebaek andN. Jorgensen, Environ Health Perspect, 2009, 117, 923–927.
71. J. D. Meeker and H. M. Stapleton, Environ Health Perspect, 2010, 118,318–323.
72. L. Fenster, K. Waller, G. Windham, T. Henneman, M. Anderson,P. Mendola, J. W. Overstreet and S. H. Swan, Epidemiology, 2003, 14,650–658.
73. T. J. Luben, A. F. Olshan, A. H. Herring, S. Jeffay, L. Strader, R.M. Buus, R. L. Chan, D. A. Savitz, P. C. Singer, H. S. Weinberg and S.D. Perreault, Environ Health Perspect, 2007, 115, 1169–1176.
74. J. Jurewicz, W. Hanke, M. Radwan and J. P. Bonde, Int J Occup MedEnviron Health, 2009, 22, 305–329.
75. A. M. Andersson, T. K. Jensen, A. Juul, J. H. Petersen, T. Jorgensen andN. E. Skakkebaek, J Clin Endocrinol Metab, 2007, 92, 4696–4705.
76. T. G. Travison, A. B. Araujo, A. B. O’Donnell, V. Kupelian and J.B. McKinlay, J Clin Endocrinol Metab, 2007, 92, 196–202.
77. J. A. Cauley, S. K. Ewing, B. C. Taylor, H. A. Fink, K. E. Ensrud, D.C. Bauer, E. Barrett-Connor, L. Marshall and E. S. Orwoll, J ClinEndocrinol Metab, 95, 4314–4323.
78. M. Grossmann, J Clin Endocrinol Metab, 96, 2341–2353.79. D. B. O’Connor, D. M. Lee, G. Corona, G. Forti, A. Tajar,
T. W. O’Neill, N. Pendleton, G. Bartfai, S. Boonen, F. F. Casanueva,J. D. Finn, A. Giwercman, T. S. Han, I. T. Huhtaniemi, K. Kula,F. Labrie, M. E. Lean, M. Punab, A. J. Silman, D. Vanderschueren andF. C. Wu, J Clin Endocrinol Metab, 96, E1577–1587.
80. A. M. Traish, M. M. Miner, A. Morgentaler and M. Zitzmann, Am JMed, 2011, 124, 578–587.
81. H. A. Feldman, C. Longcope, C. A. Derby, C. B. Johannes, A. B. Araujo,A. D. Coviello, W. J. Bremner and J. B. McKinlay, J Clin EndocrinolMetab, 2002, 87, 589–598.
82. V. Persky, M. Turyk, H. A. Anderson, L. P. Hanrahan, C. Falk, D.N. Steenport, R. Chatterton, Jr. and S. Freels, Environ Health Perspect,2001, 109, 1275–1283.
83. M. E. Turyk, H. A. Anderson, S. Freels, R. Chatterton, Jr., L.L. Needham, D. G. Patterson, Jr., D. N. Steenport, L. Knobeloch,P. Imm and V. W. Persky, Environ Res, 2006, 102, 299–307.
84. A. Goncharov, R. Rej, S. Negoita, M. Schymura, A. Santiago-Rivera,G. Morse and D. O. Carpenter, Environ Health Perspect, 2009, 117,1454–1460.
85. L. Hagmar, J. Bjork, A. Sjodin, A. Bergman and E. M. Erfurth, ArchEnviron Health, 2001, 56, 138–143.
86. T. B. Haugen, T. Tefre, G. Malm, B. A. Jonsson, L. Rylander,L. Hagmar, C. Bjorsvik, T. Henrichsen, T. Saether, Y. Figenschau andA. Giwercman, Reprod Toxicol, 32, 261–267.
288 Chapter 10

87. A. H. Giwercman, A. Rignell-Hydbom, G. Toft, L. Rylander, L. Hagmar,C. Lindh, H. S. Pedersen, J. K. Ludwicki, V. Lesovoy, M. Shvets,M. Spano, G. C. Manicardi, D. Bizzaro, E. C. Bonefeld-Jorgensen andJ. P. Bonde, Environ Health Perspect, 2006, 114, 1348–1353.
88. W. Dhooge, E. den Hond, G. Koppen, L. Bruckers, V. Nelen, E. van deMieroop, M. Bilau, K. Croes, W. Baeyens, G. Schoeters and N. vanLarebeke, J Expo Sci Environ Epidemiol, 2011, 21, 106–113.
89. R. Recio, G. Ocampo-Gomez, J. Moran-Martinez, V. Borja-Aburto,M. Lopez-Cervante, M. Uribe, L. Torres-Sanchez and M. E. Cebrian,Environ Health Perspect, 2005, 113, 1160–1163.
90. J. Blanco-Munoz, M. M. Morales, M. Lacasana, C. Aguilar-Garduno,S. Bassol and M. E. Cebrian, Hum Reprod, 2010, 25, 1787–1795.
91. G. Toft, A. Flyvbjerg and J. P. Bonde, Environ Health, 2006, 5, 32.92. J. D. Meeker, S. R. Ravi, D. B. Barr and R. Hauser, Reprod Toxicol,
2008, 25, 184–191.93. J. D. Meeker, L. Ryan, D. B. Barr and R. Hauser, Epidemiology, 2006, 17,
61–68.94. Y. Han, Y. Xia, J. Han, J. Zhou, S. Wang, P. Zhu, R. Zhao, N. Jin,
L. Song and X. Wang, Chemosphere, 2008, 72, 785–790.95. J. D. Meeker, D. B. Barr and R. Hauser, Reprod Toxicol, 2009, 27,
155–160.96. S. Telisman, P. Cvitkovic, J. Jurasovic, A. Pizent, M. Gavella and
B. Rocic, Environ Health Perspect, 2000, 108, 45–53.97. X. Zeng, T. Lin, Y. Zhou and Q. Kong, J Toxicol Environ Health A, 2002,
65, 513–521.98. X. Zeng, T. Jin, J. P. Buchet, X. Jiang, Q. Kong, T. Ye, A. Bernard and G.
F. Nordberg, Environ Res, 2004, 96, 338–344.99. A. Menke, E. Guallar, M. S. Shiels, S. Rohrmann, S. Basaria, N. Rifai,
W. G. Nelson and E. A. Platz, BMC Public Health, 2008, 8, 72.100. O. Akinloye, A. O. Arowojolu, O. B. Shittu and J. I. Anetor, Reprod Biol,
2006, 6, 17–30.101. A. Mahmoud, P. Kiss, M. Vanhoorne, D. De Bacquer and F. Comhaire,
Int J Androl, 2005, 28, 150–155.102. A. J. McGregor and H. J. Mason, Hum Exp Toxicol, 1991, 10, 199–203.103. T. P. Ng, H. H. Goh, Y. L. Ng, H. Y. Ong, C. N. Ong, K. S. Chia, S.
E. Chia and J. Jeyaratnam, Br J Ind Med, 1991, 48, 485–491.104. B. H. Alexander, H. Checkoway, C. van Netten, C. H. Muller,
T. G. Ewers, J. D. Kaufman, B. A. Mueller, T. L. Vaughan andE. M. Faustman, Occup Environ Med, 1996, 53, 411–416.
105. E. M. Erfurth, A. Schutz, A. Nilsson, L. Barregard and S. Skerfving, Br JInd Med, 1990, 47, 639–644.
106. J. P. Bonde, Br J Ind Med, 1990, 47, 508–514.107. J. P. Bonde and E. Ernst, Hum Exp Toxicol, 1992, 11, 259–263.108. N. H. Hjollund, J. P. Bonde, T. K. Jensen, E. Ernst, T. B. Henriksen,
H. A. Kolstad, A. Giwercman, N. E. Skakkebaek and J. Olsen, ReprodToxicol, 1998, 12, 91–95.
Male Reproductive Tract Disorders 289

109. E. A. Kim, H. K. Cheong, K. D. Joo, J. H. Shin, J. S. Lee, S. B. Choi,M. O. Kim, J. Lee and Iu and D. M. Kang, Neurotoxicology, 2007, 28,263–269.
110. D. G. Ellingsen, E. Haug, P. I. Gaarder, R. Bast-Pettersen andY. Thomassen, Scand J Work Environ Health, 2003, 29, 230–238.
111. T. Agusa, T. Kunito, H. Iwata, I. Monirith, C. Chamnan, T. S. Tana,A. Subramanian and S. Tanabe, Chemosphere, 2007, 68, 590–596.
112. L. Barregard, G. Lindstedt, A. Schutz and G. Sallsten, Occup EnvironMed, 1994, 51, 536–540.
113. F. I. Hsieh, T. S. Hwang, Y. C. Hsieh, H. C. Lo, C. T. Su, H. S. Hsu,H. Y. Chiou and C. J. Chen, Environ Health Perspect, 2008, 116, 532–536.
114. G. Pan, T. Hanaoka, M. Yoshimura, S. Zhang, P. Wang, H. Tsukino,K. Inoue, H. Nakazawa, S. Tsugane and K. Takahashi, Environ HealthPerspect, 2006, 114, 1643–1648.
115. J. D. Meeker, A. M. Calafat and R. Hauser, J Androl, 2009, 30, 287–297.116. J. Mendiola, N. Jorgensen, A. M. Andersson, A. M. Calafat, M. J. Silva,
J. B. Redmon, A. Sparks, E. Z. Drobnis, C. Wang, F. Liu and S. H. Swan,Int J Androl, 2011, 34, 369–378.
117. S. Li, J. Dai, L. Zhang, J. Zhang, Z. Zhang and B. Chen, Biomed EnvironSci, 2011, 24, 31–39.
118. C. A. Richter, L. S. Birnbaum, F. Farabollini, R. R. Newbold,B. S. Rubin, C. E. Talsness, J. G. Vandenbergh, D. R. Walser-Kuntz andF. S. vom Saal, Reprod Toxicol, 2007, 24, 199–224.
119. T. Hanaoka, N. Kawamura, K. Hara and S. Tsugane, Occup EnvironMed, 2002, 59, 625–628.
120. J. D. Meeker, A. M. Calafat and R. Hauser, Environ Sci Technol, 2010,44, 1458–1463.
121. T. Takeuchi and O. Tsutsumi, Biochem Biophys Res Commun, 2002, 291,76–78.
122. T. Galloway, R. Cipelli, J. Guralnik, L. Ferrucci, S. Bandinelli,A. M. Corsi, C. Money, P. McCormack and D. Melzer, Environ HealthPerspect, 2010, 118, 1603–1608.
123. M. E. Turyk, V. W. Persky, P. Imm, L. Knobeloch, R. Chatterton andH. A. Anderson, Environ Health Perspect, 2008, 116, 1635–1641.
124. J. D. Meeker, P. I. Johnson, D. Camann and R. Hauser, Sci TotalEnviron, 2009, 407, 3425–3429.
125. U. N. Joensen, R. Bossi, H. Leffers, A. A. Jensen, N. E. Skakkebaek andN. Jorgensen, Environ Health Perspect, 2009, 117, 923–927.
126. R. T. Zoeller and J. D. Meeker, in Environmental Impacts on ReproductiveHealth and Fertility, eds. T. J. Woodruff, S. Janssen, L. Guillette andL. Giudice, Cambridge University Press, Cambridge, UK, 2010.
127. E. A. Jannini, A. Crescenzi, N. Rucci, E. Screponi, E. Carosa, A. deMatteis, E. Macchia, G. d’Amati and M. D’Armiento, J Clin EndocrinolMetab, 2000, 85, 3453–3457.
128. C. Mendis-Handagama and S. Ariyaratne, Arch Androl, 2004, 50,347–357.
290 Chapter 10

129. R. R. Maran, Arch Androl, 2003, 49, 375–388.130. E. M. Velazquez and G. Bellabarba Arata, Arch Androl, 1997, 38, 85–92.131. J. D. Meeker, N. P. Singh and R. Hauser, J Androl, 2008, 29, 379–388.132. J. D. Meeker, L. Godfrey-Bailey and R. Hauser, J Androl, 2007, 28,
397–406.133. J. D. Meeker and M. Boas, in Encyclopedia of Environmental Health, ed.
J. Nriagu, Elsevier Ltd, Oxford, UK, 2011.134. E. Salay and D. Garabrant, Chemosphere, 2009, 74, 1413–1419.135. J. D. Meeker, L. Altshul and R. Hauser, Environ Res, 2007, 104, 296–304.136. K. Steenland, L. Cedillo, J. Tucker, C. Hines, K. Sorensen, J. Deddens
and V. Cruz, Environ Health Perspect, 1997, 105, 1126–1130.137. S. S. Zaidi, V. K. Bhatnagar, S. J. Gandhi, M. P. Shah, P. K. Kulkarni
and H. N. Saiyed, Hum Exp Toxicol, 2000, 19, 497–501.138. M. Lacasana, I. Lopez-Flores, M. Rodriguez-Barranco, C. Aguilar-
Garduno, J. Blanco-Munoz, O. Perez-Mendez, R. Gamboa, S. Bassol andM. E. Cebrian, Toxicol Appl Pharmacol, 2010, 243, 19–26.
139. J. D. Meeker, D. B. Barr and R. Hauser, Reprod Toxicol, 2006, 22,437–442.
140. B. Dundar, F. Oktem, M. K. Arslan, N. Delibas, B. Baykal, C. Arslan,M. Gultepe and I. E. Ilhan, Environ Res, 2006, 101, 140–145.
141. K. K. Doumouchtsis, S. K. Doumouchtsis, E. K. Doumouchtsis andD. N. Perrea, J Endocrinol Invest, 2009, 32, 175–183.
142. B. Singh, V. Chandran, H. K. Bandhu, B. R. Mittal, A. Bhattacharya,S. K. Jindal and S. Varma, Biometals, 2000, 13, 187–192.
143. M. Bloom, H. Spliethoff, J. Vena, S. Shaver, R. Addink and G. Eadon,Environ Toxicol Pharmacol, 2008, 25, 386–392.
144. A. Julander, M. Karlsson, K. Hagstrom, C. G. Ohlson, M. Engwall,I. L. Bryngelsson, H. Westberg and B. van Bavel, Int Arch Occup EnvironHealth, 2005, 78, 584–592.
145. J. D. Meeker, A. M. Calafat and R. Hauser, Environ Health Perspect,2007, 115, 1029–1034.
146. C. G. Roehrborn and L. K. Black, BJU Int, 2011, 108, 806–813.147. J. S. Townsend, L. C. Richardson and R. R. German, Am J Mens Health,
2010, 4, 353–360.148. H. O. Adami, R. Bergstrom, M. Mohner, W. Zatonski, H. Storm,
A. Ekbom, S. Tretli, L. Teppo, H. Ziegler and M. Rahu, et al., Int JCancer, 1994, 59, 33–38.
149. R. Bergstrom, H. O. Adami, M. Mohner, W. Zatonski, H. Storm,A. Ekbom, S. Tretli, L. Teppo, O. Akre and T. Hakulinen, J Natl CancerInst, 1996, 88, 727–733.
150. E. Huyghe, T. Matsuda and P. Thonneau, J Urol, 2003, 170, 5–11.151. N. Sincic, T. Kulis, A. Znaor and F. Bray, Cancer Epidemiol, 2011.152. L. E. Fleming, J. A. Bean, M. Rudolph and K. Hamilton, J Occup Environ
Med, 1999, 41, 279–288.153. G. Frost, T. Brown and A. H. Harding, Occup Med (Lond), 2011, 61,
303–310.
Male Reproductive Tract Disorders 291

154. L. E. Fleming, O. Gomez-Marin, D. Zheng, F. Ma and D. Lee, Am J IndMed, 2003, 43, 227–233.
155. E. Kasahara, E. F. Sato, M. Miyoshi, R. Konaka, K. Hiramoto, J. Sasaki,M. Tokuda, Y. Nakano and M. Inoue, Biochem J, 2002, 365, 849–856.
156. M. C. Alavanja, C. Samanic, M. Dosemeci, J. Lubin, R. Tarone,C. F. Lynch, C. Knott, K. Thomas, J. A. Hoppin, J. Barker, J. Coble,D. P. Sandler and A. Blair, Am J Epidemiol, 2003, 157, 800–814.
157. M. C. Alavanja, D. P. Sandler, C. F. Lynch, C. Knott, J. H. Lubin,R. Tarone, K. Thomas,M.Dosemeci, J. Barker, J. A.Hoppin andA. Blair,Scand J Work Environ Health, 2005, 31 Suppl 1, 39–45; discussion 35–37.
158. S. Koutros, M. C. Alavanja, J. H. Lubin, D. P. Sandler, J. A. Hoppin,C. F. Lynch, C. Knott, A. Blair and L. E. Freeman, J Occup Environ Med,2010, 52, 1098–1105.
159. M. R. Bonner, B. A. Williams, J. A. Rusiecki, A. Blair, L. E. BeaneFreeman, J. A. Hoppin, M. Dosemeci, J. Lubin, D. P. Sandler andM. C. Alavanja, Cancer Causes Control, 2010, 21, 871–877.
160. C. H. Christensen, E. A. Platz, G. Andreotti, A. Blair, J. A. Hoppin,S. Koutros, C. F. Lynch, D. P. Sandler and M. C. Alavanja, EnvironHealth Perspect, 2010, 118, 92–96.
161. W. J. Lee, A. Blair, J. A. Hoppin, J. H. Lubin, J. A. Rusiecki,D. P. Sandler, M. Dosemeci andM. C. Alavanja, J Natl Cancer Inst, 2004,96, 1781–1789.
162. F. Giannandrea, L. Gandini, D. Paoli, R. Turci and I. Figa-Talamanca,J Environ Sci Health B, 2011, 46, 780–787.
163. K. A. McGlynn, S. M. Quraishi, B. I. Graubard, J. P. Weber,M.V.Rubertone andR.L. Erickson, JNatl Cancer Inst, 2008, 100, 663–671.
164. M. P. Purdue, L. S. Engel, H. Langseth, L. L. Needham, A. Andersen,D. B. Barr, A. Blair, N. Rothman and K. A. McGlynn, Environ HealthPerspect, 2009, 117, 1514–1519.
165. M. L. Biggs, M. D. Davis, D. L. Eaton, N. S. Weiss, D. B. Barr,D. R. Doody, S. Fish, L. L. Needham, C. Chen and S. M. Schwartz,Cancer Epidemiol Biomarkers Prev, 2008, 17, 2012–2018.
166. K. A. McGlynn, S. M. Quraishi, B. I. Graubard, J. P. Weber,M. V. Rubertone and R. L. Erickson, Cancer Res, 2009, 69, 1901–1909.
167. L. Hardell, S. O. Andersson, M. Carlberg, L. Bohr, B. van Bavel,G. Lindstrom, H. Bjornfoth and C. Ginman, J Occup Environ Med, 2006,48, 700–707.
168. J. M. Ritchie, S. L. Vial, L. J. Fuortes, H. Guo, V. E. Reedy andE. M. Smith, J Occup Environ Med, 2003, 45, 692–702.
169. J. M. Ritchie, S. L. Vial, L. J. Fuortes, L. W. Robertson, H. Guo,V. E. Reedy and E. M. Smith, Environ Res, 2005, 98, 104–113.
170. N. Sawada, M. Iwasaki, M. Inoue, H. Itoh, S. Sasazuki, T. Yamaji,T. Shimazu and S. Tsugane, Environ Health Perspect, 2010, 118, 659–665.
171. K. J. Aronson, J. W. Wilson, M. Hamel, W. Diarsvitri, W. Fan,C. Woolcott, J. P. Heaton, J. C. Nickel, A. Macneily and A. Morales,J Expo Sci Environ Epidemiol, 2010, 20, 434–445.
172. R. A. Goyer, J. Liu and M. P. Waalkes, Biometals, 2004, 17, 555–558.
292 Chapter 10

CHAPTER 11
Breast Cancer – Importance ofLife Stage with Respect toEnvironmental Influences
SALLY S. WHITEa AND SUZANNE E. FENTON*b
aResearch Fellow, NTP Labs Branch, Division of the National ToxicologyProgram, NIEHS/NIH, 111 TW Alexander Dr, Bldg 101, MD E1-08,Research Triangle Park, NC 27709, USA; bGroup Leader, ReproductiveEndocrinology, NTP Labs Branch, Division of the National ToxicologyProgram, NIEHS/NIH, 111 TW Alexander Dr, Bldg 101, MD E1-08,Research Triangle Park, NC 27709, USA*E-mail: [email protected]
11.1 Introduction
11.1.1 Breast Cancer & Aging Overview
Globally, the incidence of breast cancer increases with age. This is true not justfor women, but is also the case for men (see Figure 11.1), as well as for rodentsused in research and larger mammals, such as non-human primates, dogs, andcats. In the 2012 American Cancer Society ‘‘Breast Cancer Facts and Figures2011–2012’’ report,6 it is documented that between 2004 and 2008, 95% of newbreast cancer cases occurred in women aged 40 or older, the median age atdiagnosis was 61, and women aged 75–79 exhibited the highest incidence, with arate of 421.3 cases per 100 000. The 2012 statistics from Susan G. Komen
Issues in Toxicology No. 16
Aging and Vulnerability to Environmental Chemicals: Age-related Disorders and their Origins in
Environmental Exposures
Edited by Bernard Weiss
r The Royal Society of Chemistry 2013
Published by the Royal Society of Chemistry, www.rsc.org
293
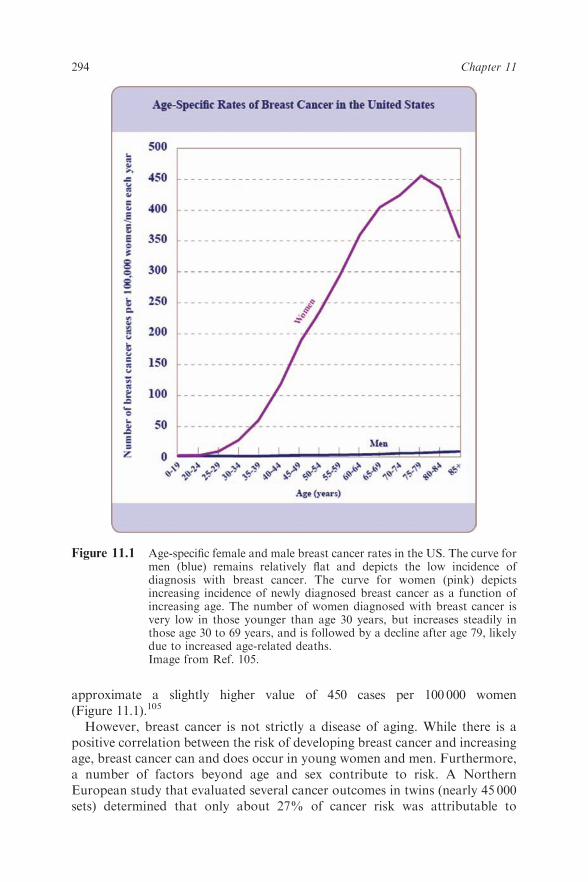
approximate a slightly higher value of 450 cases per 100 000 women(Figure 11.1).105
However, breast cancer is not strictly a disease of aging. While there is apositive correlation between the risk of developing breast cancer and increasingage, breast cancer can and does occur in young women and men. Furthermore,a number of factors beyond age and sex contribute to risk. A NorthernEuropean study that evaluated several cancer outcomes in twins (nearly 45 000sets) determined that only about 27% of cancer risk was attributable to
Figure 11.1 Age-specific female and male breast cancer rates in the US. The curve formen (blue) remains relatively flat and depicts the low incidence ofdiagnosis with breast cancer. The curve for women (pink) depictsincreasing incidence of newly diagnosed breast cancer as a function ofincreasing age. The number of women diagnosed with breast cancer isvery low in those younger than age 30 years, but increases steadily inthose age 30 to 69 years, and is followed by a decline after age 79, likelydue to increased age-related deaths.Image from Ref. 105.
294 Chapter 11

heritable factors (genetic predisposition being only a weak indicator), leavinganother 73% of risk modifiable by lifestyle and environmental factors.1 It hasbecome increasingly clear that biological, social, and environmental factors,and the life stage at which exposures to environmental factors occur, play asubstantial role in modifying the risk for developing and dying from breastcancer. Breast cancer is not a single disease process, but rather it is described asa number of different cancer subtypes with varying etiologies,2,3 their tissue oforigin being the common element. Given this complexity, certain forms ofbreast cancer are thought of more readily as diseases of aging. In fact, differ-ential subtype distribution is exhibited by age,4 making it less likely that theremay be a single cure.
Irrespective of the often late age at diagnosis, breast cancer cannot bethought of simply as a disease of aging, because it may be that critical precursorincidents originate in early life. Normal programming events in the tissue beginin the fetus, continue into adolescence and adulthood, and may be adverselymodified at multiple life stages.5 As such, the timing of these life stage-specificevents represent windows of sensitivity during which perturbations ofnormal processes–via chemical, pharmaceutical, or radiological assaults, forexample–may alter normal development in a way that increases the vulner-ability of the tissue to form tumors, particularly if the tissue receives multiplecumulative assaults. The goals of this chapter are to 1) inform on the critical lifestages of the breast shown to exhibit susceptibility to environmental factors,2) explain the importance of considering breast cancer as a complex, multiple-subtype set of cancers, influenced by environmental factors, and 3) discussresearch gaps and promising new approaches to research that will moveforward the fields of primary prevention and successful treatment of breastcancer.
11.1.2 Contemporary Breast Issues of Public Concern
The fact that 1 in 8 US women develop breast cancer over a lifetime,6 and thatthis trend has not diminished in recent years, has prompted both a 2011Institute of Medicine report, ‘‘Breast Cancer and the Environment: A LifeCourse Approach’’,7 and a 2012 Federal Advisory Committee report, issued bythe Interagency Breast Cancer and Environmental Research CoordinatingCommittee (IBCERCC),8 calling for primary prevention of this costly disease.The large-scale efforts that have been made by federal agencies, reputableacademicians, and nonprofit organizations to communicate the currentunderstanding of and remaining questions surrounding breast cancer haveresulted in increased public awareness of breast cancer’s prevalence and thepotential role of the environment in the disease. Along with breast cancerprevention, a number of other health concerns have gained attention in the fieldof breast biology, with a focus on adverse changes in the organ, particularly inchildren and adolescents.
Precocious or early puberty in girls has been an increasing public concern inrecent years. While the designation of precocious puberty refers to the
Breast Cancer – Importance of Life Stage with Respect to Environmental Influences 295

appearance of multiple secondary sexual characteristics before age 8, it is theearliest sign of puberty in girls—the appearance of breast buds—that will beaddressed here.9 Thelarche, the onset of breast development, in prepubertalgirls is occurring at a younger age than it did two decades ago. An expert panel,convened to address the validity of this trend at the ‘‘Role of EnvironmentalFactors on the Timing and Progression of Puberty’’ workshop, agreed thatboth thelarche and menarche are trending toward earlier occurrence inAmerican girls from 1940 to 1994 but that the data on boys are insufficient tosuggest a trend during this same time period.10 The panel agreed that the weightof evidence deriving from both human and animal studies supported anassociation between exposures to endocrine-disrupting chemicals (EDCs) andthe amount of body fat, with earlier pubertal end points.11 Early pubertallandmarks were considered to be ‘‘adverse’’ from a public health perspective bythis panel of experts.
In a study published in 1997,12 premature thelarche was observed in 8% ofwhite girls and 25% of black girls in a study of 17 000 American girls. However,in a study only 10 years later, breast bud development was observed at age7 and 8, respectively, in 10% and 18% of white girls, and 23% and 43% ofblack girls (as well as 15% and 31% of Hispanic girls, not assessed in the priorstudy), suggesting that the incidence of precocious breast development amonggirls in the US is still increasing with time.13 A similar decrease in the age ofbreast development has been noted in school age girls in Copenhagen,Denmark, without a correlated change in the hormones of puberty, suggestinga gonadatropin-independent shift in pubertal timing.4,15 In fact, they demon-strated that after a 15 year follow-up, breast development was occurring up to 1year earlier without a significant change in first menses timing. These studiessuggest that the rapidly changing environment in which these children aredeveloping may play an important role in this epidemic. There are a number offactors that may contribute to premature thelarche, and we will address these inconcert with a discussion on the regulation and dysregulation of breast devel-opment. It should also be noted that although timing of breast development hasshifted earlier over the last decades, time to first menses has changed very little,if statistically at all, confirming separate regulatory pathways for these pubertallandmarks.10,14,16 With this large change in breast developmental timing, comesan increase in the time span from initiation of breast development to menarche17
(see Table 11.1). Whether earlier breast developmental timing or longer time tofull breast development is linked to breast cancer risk has not been determinedin women.
Another contemporary issue in human breast health is gynecomastia, or theappearance of breast tissue in males. While gynecomastia can be a symptom ofmultiple disease processes involving hypogonadal or related conditions thatinterfere with normal testosterone synthesis in adult men, its etiology in boys isinfrequently and incompletely understood. While the condition is not unusualin newborn boys, due to the high concentrations of maternal hormones inbreast milk, it subsides over the 2–3 week period following birth. Older men,normally affected by decreasing circulating testosterone levels, may develop
296 Chapter 11

Table 11.1 Approximate probability of Tanner Stage B2 (breast bud onset) or menarche in Copenhagen school girls in1991–1993 and 2006–2008, relative to their chronological age.
Probability of B2 Probability of B2* Probability of Menarche Probability of MenarcheAge 1991–1993 (n¼ 1100) 2006–2008 (n¼ 995) 1991–1993 (n¼ 1100) 2006–2008 (n¼ 995)
6 0 0 0 08 0 8% 0 010 20% 50% 5% 5%12 75% 92% 10% 10%14 100% 100% 60% 70%16 100% 100% 95% 98%
Median: 9.74 (95% CI: 9.59–10.01) years 13.05 (95% CI: 12.82–13.23) years
Data estimated from Aksglaede et al. 2009, Figure 1. Median ages for puberty endpoints in 2006–2008 were Turnbull estimates.*Significant acceleration in B2 from the prior measurements.
Brea
stCancer
–Im
porta
nce
ofLife
Stagewith
Resp
ectto
Enviro
nmentalInfluences
297

gynecomastia; it is estimated that 1 in 4 men between the ages of 50 and 80 areaffected.18 Puberty is another time in life when gynecomastia may be common.There exists a clear correlation between obesity and gynecomastia, although tobe precise, gynecomastia is not simply an increase in adiposity in the chest, butentails specific growth of the glandular tissue.19 Furthermore, it is well docu-mented that fat cells produce the enzyme that converts steroid precursors toestrogens, which in turn can drive breast tissue growth in boys/men.20 As is thecase with females, the breast tissue of males is responsive to environmentalexposures. One case study describes three prepubertal boys who developedsignificant breast enlargement following the use of a shampoo containinglavender and tea tree oils, compounds that are known to be without effect inadults, but are suspected to be estrogenic.21
In adult males, there is some concern that breast cancer may be misdiagnosedas gynecomastia, as both of these health disorders occur more often with age.Unlike gynecomastia, however, breast cancers are almost always unilateral,making confusion between these diagnoses less probable. Furthermore, breastcancer in men is relatively rare and accounts for only about 1% of all cases.22 Infact, it is more than 100-fold more common in women. Whether gynecomastiapredisposes a man to increased risk of breast cancer is a research area thatmerits further attention, because it is thought that altered circulating or localbreast estrogen production may play a role in the development of both diseaseendpoints. Controlled estrogenic effects are important in early formation ofboth male and female breast tissue, a subject that we will turn our attentionto here.
11.2 Breast Development
11.2.1 Overview of Unique Developmental Features
A complex and unique tissue, the breast exhibits important characteristics thatresult in substantial differences in the etiology, as well as our understanding ofbreast cancer, when compared to cancers of other tissues. Importantly, maleand female breast tissue differs in both development and adult morphology, yetbreast cancer can arise in both sexes. Also, unlike most organs, the femalebreast is affected by multiple events of development and differentiation acrosstime, at multiple life stages, not limited to early life and puberty. The breastundergoes continuous change during the menstrual cycle, progressing from asimple gland to a well-budded array of ducts as the ovaries transition throughthe cycle. Also, in adult life during pregnancy and lactation, the breast exhibitsprofound tissue remodeling.23 Around the age of 50, when the brain andovaries begin to show signs of reproductive senescence, the breast transitionsthrough a peri-menopausal series of structural changes, ending in a simpleductal frame. Furthermore, as a consequence, each event represents a uniqueopportunity for perturbation of the precise developmental processes thatnormally occur. That is, each time that the structure and composition of thegland changes during these tightly-regulated physiological events, there exists
298 Chapter 11

the potential for environmental factors to interfere with the processes,potentially altering the vulnerability of the glandular cells to develop intocancer.
11.2.2 Human Breast Development Timing and Regulation
Development of the human mammary gland begins during early fetal life. Thisprocess first involves the thickening of the milk streak—a band of cells in theectoderm that will eventually develop into breast tissue—at 4–6 weeks ofgestational age, followed by development of discrete mammary buds underthe skin around 10–13 weeks of pregnancy. The supporting stroma is formedafter this time, during approximately gestational weeks 20–32. Followingdevelopment of the supporting stroma, and likely due to signals from thosesurrounding cells, the epithelium begins to branch through the mesenchymeduring the second half of gestation, which allows the formation of a lumenwithin these epithelial structures. Important growth commences and functionalreceptors (e.g., estrogen receptors) begin to be expressed as branching of theseearly ducts occurs prior to and up to the time of birth.23–25
At birth, the infant breast possesses secretory function and may exhibitfullness, which quickly dissipates along with the maternal source of hormones.The majority of breast development occurs after birth. The early neonatalbreast tissue is a simple set of ducts with a few branches embedded in thesurrounding stroma, all emptying into the nipple. Prior to puberty, the breastepithelium and supporting tissue grow isometrically, at the same rate as thebody. At puberty, breast growth accelerates rapidly, growing allometrically.The breast typically does not reach full size until after menarche and whenmenstrual cycles become regular. Once this occurs, then the breast epitheliumundergoes slight lobular structural changes each month, with the hormonaloscillations of the menstrual cycle. Additional rapid developmental eventsoccur in the tissue during pregnancy. The gland transitions from a relativelyrestful state to one that very quickly fills the breast fat with differentiatedlobulo-alveoli, ready to provide nourishment for the impending child. Thisprocess of lactational differentiation is a known protective factor against breastcancer.26 The younger in life a woman gives birth, and potentially the more timesthis process of differentiation occurs in a woman’s life, affects the amount ofprotection from breast cancer that is conferred. Although the exact mechanismfor this protection is not known, many hypothesize that it is due to involution ofthe gland at weaning, which is a rapid regression of lobular structures due toextensive apoptosis. Involution-like structural changes occur in the breast again,peri-menopausally, with the accompanying systemic hormonal changes.23–25
Rodent mammary glands develop through similar processes as thosedescribed in humans, though the absolute amount of time for the various stepsvaries (see Figure 11.2 for a comparison). However, the relative amount of timespent in the different phases of development, the hormones and growth factorscontrolling the growth, the types of structures present, and the numerousperiods of structural change over a lifetime are consistent across species.8
Breast Cancer – Importance of Life Stage with Respect to Environmental Influences 299

Rodent model studies are the primary means by which an understanding ofthe developmental and hormone/growth factor-mediated events in humans,and their temporality, has been garnered. Figure 11.3 demonstrates thecomplex and dramatic changes the rodent mammary gland transitions throughover the life course, from prepubertal development until old age. While rodentsin general provide important animal models for breast studies, differences in1) the specific timing of certain events (Figure 11.2), 2) the precise structurespresent in the gland, and 3) the predominance of specific tumor subtypes andlocation of metastases exist between species. This topic has been given a carefuloverview in the recent IBCERCC document.8
During the most rapid mammary growth phase—namely puberty—bothrodents and humans develop rapidly dividing duct ends that lead the way inepithelial filling of the fat pad. Rodents exhibit end structures that are uniquelyreferred to as terminal end buds (TEBs). These terminal duct ends, found inboth rats and mice, are tear-drop shaped, several cells thick, and aremorphologically and functionally analogous to terminal ductal lobular units(TDLUs) in humans (see Figure 11.2 for a visual comparison). In both cases,these terminal sites for the growing ducts comprise clusters of rapidly prolife-rating cells, which give rise to the eventual adult parenchyma of the tissue. Itshould be noted that because of the highly proliferative nature of thesestructures, they are particularly vulnerable to carcinogens.27 Put simply, in
Developmental Event Human Rodent
milk streak evident EW4-6 GD10-11 (mice)
mammary epithelial budforms
EW10-13 GD12-14 (mice), GD 14-16 (rat)
female nipple and areola form
EW12-16 GD18 (mice)/GD20 (rat)
branching and canalizationof epithelium
EW20-32 GD16 to birth (mice), GD 18 to birth (rat)
secretion is possible EW32-40 (ability lost postnatally)
at birth, with hormonal stimuli
isometric development of ducts
birth to puberty birth to puberty
TEBs present (peri-pubertal) 8-13 year old girls 23 to 60 days old (rodents)
formation of lobular units EW32-40, or within 1-2 yr. of first menstrual cycle
puberty and into adulthood
Terminal ductallobular unit (TDLU)
HUMAN
RODENTTerminal end bud (TEB)
Figure 11.2 Similarity of developmental events in human and rodent mammary tissueover time. Photos depict the terminal end bud (TEB) in the rodent andthe morphologically similar structure, terminal ductal lobular unit(TDLU), in the human. They are the most sensitive structures to envi-ronmental carcinogens. EW¼ embryonic week, GD¼ gestational day.(Table from Ref. 5 photos courtesy of J Russo and MB Macon).
300 Chapter 11

Figure 11.3 Mouse mammary gland morphogenesis. Carmine-stained whole mounts (top row) and hematoxylin- and eosin-stained sections(H&E, bottom row) provide images of fourth inguinal mammary glands. On the far left, 12-week old adult mice have developeda ductal tree that fills the fat pad. Lactating mice show extensive glandular growth and cellular differentiation, and thisphenotype is rapidly lost during postlactational involution. Aging mice show gradual degeneration of the mammary gland sothat by 18 months, only a spindly ductal structure remains. Scale bar for whole mount, 1 cm; for H&E, 50 mm.Image adapted from Ref. 28.
Brea
stCancer
–Im
porta
nce
ofLife
Stagewith
Resp
ectto
Enviro
nmentalInfluences
301

rapidly dividing cells, mutations, and other exposure-induced ‘‘errors’’ maymore likely evade detection by the cellular repair machinery, and be incor-porated into new cells and transmitted to future generations. The TDLU andTEBs are present only during the peripubertal period, making the time spent inthis phase of development a sensitive window for environmental insults. Thisrepresents one example of how the breast may exhibit critical windows ofsusceptibility, and supports the argument that attempting to identify the assaultor causative factors in breast carcinogenesis at the time of diagnosis has been acostly mistake. Is it theorized that girls who start breast development at an earlyage may be at a heightened susceptibility for breast cancer because they do notcomplete breast development until several years later, once they attain mensesand normal menstrual cycles. Thus they may have TDLU in their breast tissuefor longer periods of time than girls who seem to ‘‘develop overnight’’ and maybe inadvertently exposing themselves to a variety of environmental insults.
11.3 Altered Breast Development
11.3.1 Altered Development in Humans
While studies of non-cancer endpoints in the human breast are most oftenlogistically limited, certain developmental measures can be addressed in a non-invasive manner. These include the timing of breast appearance, as discussedpreviously, and lactational ability. Both of these measures can provideinformation concerning effects of the environment on the developing breast.
The trend for earlier breast development is clear, both in the US and inEuropean cohorts.15 While epidemiologic data have suggested associationsbetween altered human breast development and exogenous chemical exposures—from both intentionally ingested materials such as packaged foods andpersonal care products, as well as contact with contaminated environmentalmaterials—the specific causative agents have not been identified in moststudies. The role of EDCs in altering breast timing has become apparent byaccident, for example: an incident of increased breast enlargement in hundredsof young children in Milan, Italy, likely induced by estrogen-like contaminationof their meat supply,29 and an outbreak of early breast development in fouryoung African-American girls who used shampoos that contained estrogen andplacental extract exhibited reversible effects once the shampoo use ceased.30
There are very few examples of well-powered epidemiological studies thathave demonstrated effects of lifestyle or the environment on breast devel-opmental timing. One reason is the prohibitive costs associated with longi-tudinal studies of children, another is the complexity of the studies—mixtureexposures, invasiveness of blood collection, rapid growth stage—and finally,long-term follow-up is required in order to relate early life exposures to later lifehealth anomalies. One excellent example of an EDC that seems to affect breastdevelopmental timing is dioxin, a pollutant readily formed upon combustion ofplastics. The effects were initially identified following an accidental environ-mental release in Seveso, Italy. Significant delays in breast development have
302 Chapter 11

been documented in Seveso adolescents with the highest circulating blood levelsof dioxin-like contaminants,31 and similar delays in breast development havealso been observed in Dutch children with the highest prenatal/lactationaldioxin levels.32 Although later life effects associated with higher dioxinexposure are not yet identifiable in the Netherlands cohort, an epidemiologicalstudy addressing cancer risk in Seveso, Italy, correlated TCDD exposure withan increased risk of breast cancer.33 Specifically, the investigators found abreast cancer hazard ratio (HR) of 2.1 [95% confidence interval (CI), 1.0–4.6)]associated with 10-fold increases in serum TCDD levels. At the time that studywas undertaken, the female participants with the greatest TCDD exposure werenot yet between the ages of 40 and 60. A recent follow-up (conducted in 2008),determined that individual serum TCDD measurements were positivelyassociated with overall cancer incidence among women, but there was a non-significant increase in the breast cancer hazard ratio (HR¼ 1.44; 95% CI,0.89–2.33) associated with a 10-fold increase in serum TCDD over theapproximately 30-year follow-up period.34 Because this cohort of womenwere young when exposed to TCDD (between 0 and 40 years), some of themhave still not reached menopause, thus future re-evaluation will help understandthe age-related extent of risk of breast cancer associated with early life dioxinexposure.
There are even fewer examples of environmental effects on lactationalimpairment in women, even though it is clear that environmental chemicals canenter breast tissue, affect the gland, and be excreted into milk.35,36 Again, thereare many reasons that these types of studies have not been conducted. Onereason is that the studies must involve large numbers of pregnant women thatintend to breastfeed, so that women who want to breastfeed, but cannot, can beidentified and studied. However, environmental exposures that prevent effectivelactation may have their effects early in life, as already discussed, or duringdevelopment of the lactating tissue of the breast, during pregnancy. Thoseeffects would need to be teased out, and samples obtained prior to and duringpregnancy would be most beneficial for analyses. One example of an EDC thatmay interfere with lactation time is the metabolite dichlorodiphenyl dichloro-ethene (DDE). DDE is formed from its parent compound, dichloro-diphenyltrichloroethane or DDT (highly used organochlorine insecticide),and is a highly persistent environmental chemical that is known to haveestrogenic effects. Use of this compound has been eliminated in the US andmany other countries, but it is still detected worldwide in milk and fat bio-specimens. Infants of nearly 860 US mothers with higher levels of milk-borneDDE were breast-fed for shorter times; in fact there was a significant negativeassociation between DDE levels and duration of lactation in all women and infirst time lactations.37
Chemical tests in government and industry-run 2-year rodent bioassays, aswell as specific studies addressing altered mammary gland development inrodent models, have allowed more precise identification of specific agents ofconcern. These studies have also illuminated the biochemical and histologicaldetails of altered development, shedding light on potential mechanisms by
Breast Cancer – Importance of Life Stage with Respect to Environmental Influences 303

which altered development could predispose the tissue to cancer orcompromised lactational function.
11.3.2 Altered Development in Rodent Studies
Extensive rodent studies have been performed to date to determine the healtheffects of only about 1–2% of the chemicals on the US market.38 However, notall of these tests have included evaluation of the mammary gland. The numberof test chemicals assessed for mammary-specific effects is dwarfed by thenumber assessed for more traditional endpoints of interest, such as hepato-toxicity or mutagenicity. Often, the mammary gland is overlooked duringtesting if a gross tumor is not visually observed at necropsy.39 This is unfor-tunate, as rodents exhibit mammary development that parallels that of humans,and as such offer a unique opportunity to examine the histological origins andmechanisms of environmentally-induced alterations in mammary glanddevelopment.
The entire rodent mammary gland can be slide-mounted and stained in orderto visualize the parenchymal epithelium within the stroma of the fat pad. Thispreparation of the sample allows assessments of such developmental measuresas the length of ductal outgrowth, number of duct branch points, and thepresence and number of structures associated with the developmental stage ofthe gland, such as TEBs in younger animals, lobules and terminal ducts inmature animals, and lobulo-alveoli in lactating dams. Changes in theseendpoints, along with stromal and immune cell changes, among treated animalsas compared to concurrent controls, suggest the potential for the agent to alternormal mammary gland development and function.
The agents observed to impact the rodent gland are frequently grouped intoclasses, including (1) carcinogens, and (2) EDCs, which are further brokendown into (a) steroid hormones, both exogenous (pharmaceuticals) andendogenous, (b) phytoestrogens, from dietary exposure to certain plants,(c) environmental metals, and (d) chemicals, used in a variety of productsranging from food packaging and upholstery to pesticides and personal careproducts. For EDCs, the potential mode of action is almost certainly deemed tobe hormonal in nature—as it is with steroid hormones and phytoestrogens—though the specific mechanisms of action may vary substantially betweenagents. A short list of compounds is now known to alter rodent mammarygland development after early life exposures, including (but not limited to)atrazine, bisphenol A (BPA), dibutylphthalate, diethylstilbestrol (DES), dioxin,methoxychlor, nonylphenol, phytoestrogens, polybrominated diphenyl ethers,and perfluorooctanoic acid (PFOA).38 While this is a structurally disparategroup of chemicals, there is the suggestion that because of their mammarygland-specific outcomes, there may be some common mode(s) of action amongthem, resulting in a similar phenotypic effect.
Given this, it is important to add to the discussion of environmental factorsthat their potential contribution to breast cancer risk may not simply be bydirect action. Rather, those environmental factors which are known or
304 Chapter 11

suspected to alter development may contribute to risk of cancer by predis-posing the tissue to secondary assaults from other environmental agents. This isreferred to as the two-hit model,40 wherein the agent affects development insuch a way as to increase its basal vulnerability to a secondary event. Examples ofthese types of effects might include an increase in certain receptor types makingthe tissue more sensitive to a ligand, an increase in stromal density, alteredinflammatory cell populations, or an increase in the number of ductal cells.Secondary events might come in the form of another environmental exposure at alater point in life, or a genetically-driven event such as a mutated tumorsuppressor gene that allows precancerous cells to evade detection and elimination.Examples of the numerous effects of EDCs and carcinogens on mammarydevelopment, lactation, and breast cancer are shown in Tables 11.2 and 11.3respectively. These tables and corresponding references were previouslypresented in the IBCERCC document. This is not an all-inclusive list, butdemonstrates some similarity of effects across species.
11.4 Breast Cancer
11.4.1 It’s not all about Genetics
As discussed previously, breast cancer is a prevalent cancer in women worldwide,increasing in probability with age. It was once believed that the basis for diseasessuch as breast cancer was genetics or a single mutagenic event.41 However,epidemiologic evidence suggests that only a small proportion of breast cancercases (approximately 5–10%)6 are determined by gene-based inheritance, such asa single gene mutation like BRCA 1 or 2, and only 10–30% of the breast cancercases can be attributed to heritable factors of any kind.1,42 Over the last severalyears, novel genes that contribute to breast cancer risk in some families have beendiscovered. One example is the ATM gene, which causes severe disease whenboth alleles are mutated, but can increase risk of breast cancer in some womenwhen only one allele is mutated.43 Nonetheless, somewhere between 70–90% ofall breast cancer cases are influenced by lifestyle or environment. Currently, anumber of environmental factors have been identified as known/accepted riskfactors,6,8,44 and many more remain possible contributors to breast cancer risk.
11.4.2 Known/Accepted, Non-Genetic Risk Factors
As discussed throughout, two risk factors of primary importance in breastcancer are sex—being female—and age. These are clearly risk factors that arenot within an individual’s control. But, within these overlying risk factors areother modifiable risk factors, or risk factors that can be altered by an individualor a population. Some modifiable risk factors include being overweight, a lackof exercise, and eating a diet low in vegetables, fruits, and whole grains andfiber. Specifically, a body mass index (BMI) of 25 or higher increases the riskfor breast cancer after menopause.45 However, some studies have suggestedthat a high BMI, a BMI of 31 or higher, may reduce the risk of breast cancer
Breast Cancer – Importance of Life Stage with Respect to Environmental Influences 305

Table 11.2 Examples of endocrine disrupting chemicals affecting the breast. (Taken from Ref. 8.)
Endocrine Disruptor Description Animal, in vivo, in vitro Human epidemiology
Bisphenol A (BPA) � A component of polycarbonateplastics and epoxy resins
� Large production volume� Widespread human exposure� Leaches into food through
food container linings� Found in dental sealants and
composites� ‘‘Weak’’ estrogen
� Binds to nuclear ER-a and -b� Activates membrane-bound form of
the ER (ncmER), estrogen-relatedreceptor gamma (ERR-g), GPR30,and aryl hydrocarbon receptor(AhR); possible thyroid hormone andandrogen receptor interaction
� Induces hyperplastic lesions inmammary tissue of prenatallyexposed mice and rats, at doses thatapproach human exposures
� Alters growth of non-human primatemammary gland
� Increases susceptibility to carcinogen-induced mammary tumors in rodents
None
Nonylphenol � Found in the lining of foodcontainers and wraps, cleaningcompounds, and spermicides
� Known to have estrogenicproperties
� Induces dose-dependent increase inmammary cell proliferation,mammary epithelial branching andbudding, and hastened differentiationin prenatally exposed female rats
� Produces DNA mutations andchromosomal abnormalities, withincreased tumor risk
None
Phthalates � Used to soften plastics formedical tubing and children’stoys
� Disperses or retains scent inhealth/beauty products
� Abnormal mammary alveolarbranching and hypoplasia in femaleperinatally-exposed rats
� Retained nipples in perinatally-exposed adolescent male rats
� One study showing increasedbreast cancer risk in NorthernMexico cohort of women athighest phthalate burden
306
Chapter
11

� Widespread environmentalcontamination; has beenmeasured in human infantsfollowing critical careprocedures
� Dilation of mammary alveolar budsand ducts in adult male rats
� BBP increased proliferative index ofTEBs and altered genomic profile inweanling rats
Metals � Naturally occurring, theymimic or perturb normalhormonal milieu
� Exposure through water, air,and cigarette smoking
� Cadmium can alter mammarydevelopment in mice and rats withlow levels of prenatal exposuremimicking estrogen
� Urinary cadmium levels inwomen associated with aBreast Imaging-Reporting andData Systems (BI-RADSs)density category of ‘‘extremelydense’’
Dichlorodiphenyl-trichloroethane(DDT)(MIXTURE)
� Insecticide that controlsinsect-borne disease
� Use peaked in US in 1959� Banned by US EPA in 1972� Degrades to p,p0-DDE, the
most prevalent and persistentmetabolite in the environment
� DDT and congeners known to exhibitanti-androgenic and estrogenicactivity
� Limited evidence for acting as apromoter of mammary tumors in rats
� No associations in pooled andmeta-analysis; one studyshowing early life exposureassociated with increasedbreast cancer risk in women
Dieldrin � Persistent agricultural pesticide� Used in US from 1950s to
1970s; US ban in 1987
� Causes increased tumor burden inHer2/neu transgenic mice exposedduring pregnancy and lactation
� One prospective study showedpositive association
Polychlorinatedbiphenyls (PCBs)(MIXTURE)
� Mixed set of organochlorineisomers
� Bioaccumulate in the body� Known exposures from fish,
milk� Varying modes of action –
some estrogenic, androgenic, ordioxin-like
� Affect pubertal endpoints in girls androdents
� Possible mutant p53 interaction
� Majority of studies null;suggestions from severalstudies that high PCB levelsand CYP1A1 genotypes mayinteract to increase breastcancer risk
� Declared ‘possiblycarcinogenic’ to humans byIARC/EPA
Brea
stCancer
–Im
porta
nce
ofLife
Stagewith
Resp
ectto
Enviro
nmentalInfluences
307

Table 11.2 (Continued)
Endocrine Disruptor Description Animal, in vivo, in vitro Human epidemiology
Atrazine � One of the most heavily usedherbicides on food and graincrops in the U.S.
� Its use is banned in theEuropean Union.
� Unknown mode of action inmammary tissue
� Causes early onset of mammarytumors and an increased incidence oftumors in specific rat strains.
� Alters pubertal timing in rodents� Promotes mammary tumor
proliferation in rodent models� Deters development of mammary
tissue and impacts lactational abilityin rats
� Ecologic data for well waterand breast cancer risk
� One proposed mode of actionfor atrazine-induced ratmammary tumors, acceleratedreproductive senescence, wasdeclared not relevant for breasttumorigenesis in humans by theFIFRA SAP in 2000.
2,3,7,8-tetrachlorodibenzo-p-dioxin (TCDD)
� Industrial incineration andchemical reaction-dependentpollutant
� Bioaccumulative, lipophiliccontaminant
� Binds the aryl hydrocarbonreceptor (AhR)
� Known carcinogen
� Increased susceptibility of mammarytumor incidence and shorter latencyin developmentally exposed femalerats exposed to carcinogen
� Alters pubertal endpoints in rodents
� Slowed breast development inhighest-exposed girls in 2countries
� Suggestive data for breastcancer from industrial accidentin Seveso, Italy – not conclusive
PolybrominatedDiphenyl Ether(PBDE)(MIXTURE)
� Widely used to retard fireignition time in textiles,construction materials, andpolymers used in electronics
� Bioaccumulative and lipophiliccompound
� Altered reproductive endpoints inrodents; delayed mammary glanddevelopment, and thyroid hormoneand behavioral alterations
� Effects on breast cancer risk not yetassessed
None
PerfluorooctanoicAcid (PFOA)
� Possesses long half-life inhumans (2–4 years) and mice
� Used in fire-fighting foams,electronics, and to makeproducts that are grease- andwater-proof
� Final degradation product ofother48-carbon perfluorinatedmaterials
� Effects on mammary gland of miceinclude delayed development, alteredlactation, decreased weight gain inoffspring, and changes in geneexpression
� Mammary delays at body burdensthat overlap with human exposureburden in contaminated parts of theUS
� Delayed pubertal timing in girls� Low-powered case-control
study of Greenlandic Inuitwomen demonstratedsignificant correlation of serumperfluorinated chemicals andbreast cancer risk
A large amount of information on pesticides is included in this section because much work has occurred in this area. US EPA has helped to accelerate knowledgeof potential health effects of pesticides by requiring testing before they are marketed.
308
Chapter
11

prior to menopause.46 Obesity—defined as a BMIZ30–further modifies notonly incidence, but also survival, and is associated with lower survival, whetherdiagnosis is pre- or postmenopausal.47 In addition to measured BMI, weightgain (specifically during adult life) may contribute to postmenopausal cancerrisk, but be protective against premenopausal cancer risk. Interestingly, heightalone (one component of BMI) has been positively associated with increasedrisk for both pre- and postmenopausal breast cancer.45,48
Alcohol consumption is another known contributor to breast cancer risk,and increasing consumption is correlated with increasing risk. A meta-analysisconducted on data from 53 epidemiological studies, on 58 515 women withinvasive breast cancer and 95 067 controls, specifically found that for eachadditional 10 grams of alcohol consumed per day, relative risk of breast cancerwas significantly increased by 7.1% (95% CI, 5.5–8.7%).49 Furthermore, otherstudies have replicated this finding, and a recent study from the Nurses’Health Study has shown that even low alcohol intake can be a contributor tobreast cancer risk. The risk from low alcohol intake was independent of age,but was associated with ERþ /PRþ tumor subtypes.50 Furthermore, it has alsobeen demonstrated that risk imparted by alcohol consumption is entirelyindependent of smoking status, and is the same in both smokers andnon-smokers.51
Increased breast density is considered one of the strongest risk factors forbreast cancer, regardless of how it has been measured.52 Women with thehighest measures of breast density have a 4- to 6-fold increased risk of breastcancer versus women with non-dense breasts.53 Breast density is thought to be a‘‘stronger risk factor for breast cancer than any others except age and geneticmutations’’.52 Breast density, while not strictly genetic, is not an environmentalfactor in the same respect as most of those described here. The density of thebreast reflects the epithelial and stromal contributions to the breast, and can bemeasured subjectively or quantitatively. The most common measure of breastdensity in the clinical setting is the Breast Imaging Reporting and Data Systems(BI-RADS) density method. This is a subjective measure used by radiologists toclassify a mammogram as follows: D1: Fatty; D2: Scattered density; D3:Heterogeneously dense; or D4: Extremely dense. Computer-assisted methodsare also available to provide quantitative measures of breast density.54,55 Thedensity of the tissue can be altered by hormonal status, BMI, prior pregnancies,and lactational events, as well as life-stage, such as menopausal status.56 Thosefactors which are known to affect density are also independent contributors tobreast cancer risk. While the precise mechanism by which density increases riskis unknown, some environmental chemicals, such as PFOA and BPA, havebeen shown to increase mammary gland density in animal studies followingprenatal exposures.57,58 Similarly, increased risk is imparted by having apersonal history of benign breast disease, such as atypical ductal hyperplasia,atypical lobular hyperplasia, and a history of prior biopsies.
A number of known environmental risk factors are linked to hormone status,and the function of the tissue. Specifically, these risk factors are linked to awoman’s lifetime exposure to estrogen and progesterone. Having children late
Breast Cancer – Importance of Life Stage with Respect to Environmental Influences 309

in life or not having children at all increases one’s risk of developing breastcancer.59–62 Independent of pregnancy, never breast feeding also contributes tocancer risk.63 Early age at menarche (first period, not including breast devel-opmental timing) and late age at menopause also contribute to total lifetimeexposure to the normal steroid hormones and increase breast cancer risk inboth the US and other countries.64–66 While the precise mechanisms behindthese risk factors are not known, it is believed that the increased number ofmenstrual cycles over the life time causes an elevation in overall breast cellproliferation events, which may increase the risk for mutations to be incor-porated into cell populations and give rise to cancer. Direct evidence thathormonal status during specific life stages contributes to risk is now availabledue to the large number of women that took estrogen and progesterone(combined) hormone therapy, only to have a significantly increased risk ofbreast cancer.67 Another example is that women who have recent steroidhormone contraceptive use are at an increased risk for breast cancer versusthose women that used contraceptives over 10 years prior to diagnosis.68
Timing of exposure does seem to be a critical element, that keeps recurringas this field rapidly progresses.
Diethylstilbestrol (DES) is a synthetic estrogen that was given to pregnantwomen between the 1940s and 1970s, ostensibly to reduce the risk of miscarriage.It is now known that DES is a potent reproductive carcinogen to the developingfetus. In a cohort of exposed (B4800) and unexposed (B2100) women followedsince the 1970s, breast cancer risk among women exposed to DES in utero wassignificantly elevated, and that population exhibited an overall hazard ratio(HR) of 1.82 (95% confidence interval (CI), 1.04–3.18), with the highest risksbeing exhibited among those with the highest cumulative gestational doses.69,70
When broken down more carefully by age, women Z 40 years of age had ahazard ratio of 1.91 (95%CI, 1.09–3.33), and womenZ50 years of age exhibitedan even higher risk of 3.00 (95% CI, 1.01–.98).70 In the most recent analysis ofdata from these women,69 there was nearly a 2-fold higher chance of breastcancer in DES-exposed daughters than those not exposed (3.9% vs. 2.2%; HR,1.82; 95% CI, 1.04–3.18). Furthermore, the mothers who were prescribed thedrug also exhibited an increased risk of breast cancer, with a relative risk of 1.4(95% CI, 1.1–1.9).71
As DES and early menarche illustrate, exposure to certain chemicals orendogenous hormones during early life, respectively, is known to contribute tobreast cancer risk. Additionally, early exposure to ionizing radiation is also aknown contributor to risk. Unfortunately, most of these data derive frompopulations exposed to nuclear weapon detonations at Hiroshima andNagasaki, where exposure increased the risk of developing breast cancer,especially among those that received the exposure during adolescence.72–74
Similarly, exposure of the breast area to radiation for diagnostic or treatmentpurposes increases the risk of developing cancer by more than four-fold,especially if the exposure occurs before age 30 or if the subpopulation exhibitsgenetic susceptibilities that predispose them to breast cancer.75 These data areprimarily from women who were treated for scoliosis, recurrent infections of
310 Chapter 11

the lung, cancer unrelated to the breast, or upper gastrointestinal tractproblems in their adolescent or teenage years.
11.4.3 Possible Environmental Risk Factors
In addition to known contributors to risk, there are a number of environmentalfactors that may not have yet been accepted as risk factors, given limitedepidemiologic data. Animal studies however, have provided some opportunityto test the potential for factors to alter breast cancer risk in validated modelsfor human breast cancer, when these factors have not yet been studied inhumans. Conversely, some factors have been suspected in human risk, but havenot yet been validated in animal studies.
Childhood BMI has been suggested to be positively correlated with breastcancer risk. Obesity in childhood is implicated in early puberty,76 and bothobesity and early puberty may cause increased endogenous estrogen exposureover the lifetime. Both the higher levels of circulating estrogens and thepotentially greater duration of time from menarche to menopause couldcontribute to higher lifetime exposures to estrogens and thus higher risk ofdeveloping breast cancer. Studies in mice however, have not found a clearassociation between high dietary fat intake and mammary gland development,as Balb/c and C57BL/6 exhibit opposing responses—absence of weight gainand stimulation of gland development in the former, as compared to weightgain and inhibition of gland development in the latter.77 Environmentalchemicals can induce both obesity78 and altered puberty timing (discussedpreviously). Therefore, it is possible that environmental factors are affectingnot only the breast, but also a modifiable component, body fat.
There is some evidence that healthy dietary patterns may protect againstbreast cancer. It was documented many years ago that when Asian womenimmigrate to the US, their incidence of breast cancer increases and thisincreased risk is transferred to subsequent generations, such that they reach theincidence rates of white American women.79 It is broadly accepted thatmodifiable exposures related to lifestyle or environment (i.e., dietarycomponents, industrial chemical exposure, health and beauty aids), and notgenetics, explain the international differences in breast cancer risk. One meta-analysis found an 11% decrease in breast cancer risk within the group with thehealthiest eating habits as compared to those in the least healthy.80 Studies inboth Chinese and the Korean populations found that eating Western diets asopposed to traditional diets contributed to breast cancer risk.81,82
Dietary exposures of concern also includes phytoestrogen intake. Phyto-estrogens are plant-derived compounds, structurally and pharmacologicallysimilar to mammalian estrogens. The phytoestrogen content of soy isparticularly high and thought to impart the proposed health benefits of soyfoods. Often, a contemporary ‘‘healthy’’ diet includes reduced intake of animalproducts, replaced instead with soy products, such as tofu and soy milk.Genistein is the most studied of the phytoestrogens present in soy foods. Itsactions on the developing mammary gland have been studied because soy
Breast Cancer – Importance of Life Stage with Respect to Environmental Influences 311

formula use for infants became increasingly popular in the US in the late 1980sand 1990s.83 Effects of soy on the developing mammary tissue in both rats andmice vary substantially, based on the route and timing of exposure, as well asthe dose and rodent strain.84 For example, postnatal exposures in the ratappeared to accelerate the structural maturation of the gland, and in one study,even increase the multiplicity of mammary tumors,85 whereas prenatalexposures in the mouse slowed structural maturation of the gland.86 Whilethese data may appear conflicting, they highlight the significance of timing indetermining the outcome in the mammary gland of an event such as a dietary orchemical exposure. Most studies of genistein however, have examinedexposures during development and tell little about potential protective effects ofadult dietary exposure and breast cancer risk. Decreased soy intake may also bea major component of increased breast cancer risk in immigrant Asian women,as discussed above.
Working at night, also referred to as shift work, is considered a probable riskfactor for breast cancer, and the mechanism by which it induces carcinogenesisis likely through the suppression of melatonin that results from alteredlight–dark timing and subsequently an altered circadian rhythm. Studies inrodent models have confirmed these hypotheses. The contribution of shift workto breast cancer risk specifically has not been definitively identified, though onereview found that six of nine epidemiologic studies suggested a moderateincrease in breast cancer risk with shift work.87
As discussed, in the case of DES, chemical exposures have the capacity togreatly alter breast cancer risk. A number of synthetic chemicals in personalcare products or present in the environment as pollutants, have beenpinpointed as estrogenic agents that women and girls are likely to come intocontact with, which may disrupt normal hormone signaling and ultimate riskfactors in breast carcinogenesis. Animal studies have demonstrated theendocrine-disrupting capacity for agents such as BPA and polybrominateddiphenyl ethers, and they have been supported with human data for agents suchas phthalates, dichlorodiphenyl trichloroethane (DDT), dioxin, poly-chlorinated biphenyls, and certain heavy metals. These all represent agents thatmay thus have the capacity to contribute to breast cancer risk, if exposureoccurs at the appropriate life-stage. More information of the effects of thesechemicals on risk for breast cancer can be found in Table 11.2, and in theappendix of the IBCERCC document.8
11.4.4 Effect-Modifying Factors
11.4.4.1 Ethnicity–Subtype Interaction
The genetic makeup, race, and/or ethnicity of populations (not just individuals)are known to be risk factor(s) for breast cancer. Importantly, these underlyingfactors that cannot be changed by an individual, can impart specific risks whencombined with the many risk factors already discussed. It is now clear thatwomen of African–American descent are more apt to be diagnosed with more
312 Chapter 11

aggressive, harder to treat tumor subtypes (i.e., ER negative) than are womenof European ancestry.88 African–American girls also appear to be the mostaffected by changes in puberty timing13 and childhood obesity,89 and displaymore severe Vitamin D deficiency, as well as exhibiting increased gene poly-morphisms in the Vitamin D receptor pathway, which may make them moreprone to ER negative tumor development.90 The Carolina Breast Cancer Studyhas also determined that basal-like tumors (triple-negative) were seen at thehighest incidence among premenopausal African–American women.91 Thistype of tumor is among the most likely to cause poor prognosis.
11.4.4.2 Smoking
Even though smoking is known as a risk factor for overall cancer, its effect-modifying actions on tissue-specific cancers is not definitive. Cigarettes containmany chemicals identified as carcinogens.92 Tobacco smoke can induce enzymereactions known to induce estrogenic and anti-estrogenic effects in specific cellsof the body. For many years, the link between smoking and breast cancer riskwas seen as weak; some studies detected an association, while others did not.However, that changed when the risk for breast cancer took into considerationgene-by-environment interactions. Specifically, when numerous studies werepooled to form a cohort of more than 5000 cases and 5000 controls, and thedata was reanalyzed (a meta-analysis), the results showed that womenexpressing genetic variants of NAT2 had slowed detoxification of the carci-nogenic compounds in tobacco smoke. These women were at increased risk ofbreast cancer due to smoking.93 However, another well-powered re-analysis ofseveral cohorts did not find associations between NAT2 gene variants andbreast cancer risk.94 More recently, 8772 women with breast cancer, in a cohortof 111 140 participants (Nurses’ Health Study), were studied for effects ofsmoking. The investigators determined that active smoking was associated witha modest increase in breast cancer risk, especially if that smoking occurredprior to the first birth.95 Furthermore, the Canadian Expert Panel on TobaccoSmoke and Breast Cancer Risk96 concluded that ‘‘1) . . . the association betweenactive smoking and both pre- and postmenopausal breast cancer are consistentwith causality’’, and ‘‘2) The association between second-hand smoke andbreast cancer in younger, primarily premenopausal women who have neversmoked is consistent with causality’’.
Although the specific environmental factors discussed could be thought of aseither effect-modifying factors, or in some cases true risk factors, the notion of a‘‘first-hit’’ in a ‘‘two-hit’’ model is an important line of discussion. That is, anagent that contributes a first hit would initiate or predispose the tissue to anincreased susceptibility to a secondary agent, which would then promote thecarcinogenesis event. Tables 11.2 and 11.3 give several examples of environ-mental factors, both potentially one hit (carcinogens) and two-hit (EDC)compounds, that have been shown to have an association with breast cancer inwomen. Volatile organic chemicals, such as benzene and the dry cleaning agent,trichloroethylene have been hypothesized to have caused an outbreak of breast
Breast Cancer – Importance of Life Stage with Respect to Environmental Influences 313

Table 11.3 Examples of chemical carcinogens affecting the breast. (Taken from Ref. 8.)
Chemical Description Animal, in vivo, in vitro Human epidemiology
Tobacco Smoke(MIXTURE)
� Cigarettes contain about 3600chemicals
� Affects the metabolism and/ormutagenicity of hormonesand/or other carcinogens inbreast tissue
� Human studies demonstratethat tobacco constituents canreach breast tissue
� Of over 60 known carcinogensin tobacco smoke, several areknown to induce mammarytumors in lab animals
� The Canadian Expert Panel onTobacco Smoke and BreastCancer Risk declares that bothactive and passive smokeexposure increase breast cancerrisk
� The Nurses’ Health Studyconfirms that active smoking,especially prior to first child,increases breast cancer risk
Polycyclic AromaticHydrocarbons(PAHs)(MIXTURE)
� Formed from incompletecombustion of hydrocarbons
� Pervasive in the environment
� Induce mammary tumors inlaboratory rats
� Presence of PAH-DNAadducts is associated withbreast cancer risk in LongIsland Breast Cancer Project
� Associations between PAHsand breast cancer risk could berestricted to subgroups ofwomen with high-riskgenotypes
Aryl Aromatic Amines � Exposure from mainstreamand passive tobacco smoke,synthetic fuels, and frommetabolic reduction ofpolycyclic nitroaromatichydrocarbons (ubiquitous indiesel exhaust and in airborneparticulates)
� Some aryl aromatic amines arepotentially mutagenic andcarcinogenic to human breastcells
� Induces mammary tumorformation in rodents
� Pooled and meta-analysisshowing increased risk withsmoking for women with slowN-acetyltransferase genotypes(detoxifies aromatic amines)
314
Chapter
11

Heterocyclic Amines(HCAs)
� Formed when meat is cooked� Present in tobacco smoke
� Some are powerful mammarycarcinogens in rodents
� 2010 Meta-analysisdemonstrated a 17% increasein odds of breast cancer,determined by meat intake(31 epidemiological studiesrepresented)
N-Nitrosamines � Exposure through diet,endogenous formation in thestomach, tobacco smoke,occupation, rubber products,and medical therapies
� Have been detected in pacifiersand baby bottle nipples
� Mutagenic compounds
� Induce rodent mammarytumors that are histologicallysimilar to human cancers andcan metastasize
� Transform cultured mousemammary cells
� Cause cultured humanmammary epithelial cells toundergo unscheduled DNAsynthesis
� None
Brea
stCancer
–Im
porta
nce
ofLife
Stagewith
Resp
ectto
Enviro
nmentalInfluences
315

cancer in men and women in a Marine base in NC and other parts of theUS.97,98
Many examples of these compounds being successful first and second ‘‘hits’’ inrodent models for breast cancer also exist. For example, the high use herbicide,atrazine has been shown to exacerbate tumor development in both mice andrats,99–101 acting as a second hit to alter the hormonal milieu, creating apermissive environment for tumor development. Secondly, Table 11.2 listsnumerous EDCs that demonstrate a first hit, where an increased number ofrapidly proliferating target cells (TEBS) are present for an extended period of timefollowing an early life exposure to the EDC. The increased population of TEBsare then at the mercy of another chemical or carcinogen exposure that comesalong. Without the ‘‘first hit’’ of the endocrine disrupting chemical duringdevelopment, the ‘‘second-hit’’ or the carcinogenic agent, might have had toofew targets, probabilistically, to plant the seeds of future carcinogenesis.
11.5 Conclusions
11.5.1 Life-Stage Consideration is Crucial
An important modifier, and possibly the most significant outside of sex, is thestage of life at which an individual diagnosed with breast cancer experiencesan exposure—radiological, chemical, pharmaceutical—potentially determininglifetime breast cancer risk. The timing or life-stage—neonatal, peripubertal,lactational, pre-menopausal, postmenopausal, etc.—at which one of theknown or suspected risk factors previously listed is encountered is a criticalelement in breast cancer risk5,8,44 (See Figure 11.4). The timing of early lifeenvironmental exposures or lifestyle modifications can cause acceleratedweight gain as a child, altered pubertal timing, and even delayed conceptionof the first child, all of which are known to substantially modify breastcancer risk.
A few recent human studies, as well as numerous animal studies, havesupported the hypothesis that the life-stage during which specific environ-mental factors are present plays a key role in the contribution of those envi-ronmental factors to breast cancer risk. For at least three decades, the majorityof studies examining environmental factors that were associated with breastcancer diagnoses measured factors present around the time of diagnosis. Asdiscussed, epidemiologic evidence from exposure to DES and ionizing radiationoffered the first solid proof of the sensitivity of life-stage with respect to theoutcome of the exposure, as well as the high latency between exposure and thechanges in the gland, which may culminate in breast cancer.
Since the mid-1990s, several nested case-control and case-control studieshave been conducted, and most have not observed a significant associationbetween breast cancer risk and serum, or adipose tissue levels of DDT or itsdegradate, p,p0-DDE, the most prevalent and persistent metabolite in theenvironment. However, a fairly recent study took a novel approach andevaluated the risk of breast cancer in women based not only on how much
316 Chapter 11

Puberty Gestation
Altered growth and development; altered carcinogen susceptibility
Adulthood Pregnancy/
lactation
Breast cancer
Early life • Fat pad and bud form • Epithelium forms ductal tree
Altered hormone/growth factor levels and responsiveness; effects may be systemic or localized to MG
Exposure during MG development
• Isometric epithelial growth • Branching ducts and budding • TEBs develop
• Exponential epithelial growth • TEBs differentiate
• Epithelium is predominant • Lobulo-alveolar development
• Static resting state, changing with cyclicity • Responsive to hormonal changes
MG
afte
r ear
ly E
DC
exp
osur
e N
orm
al M
G (r
at)
Lactationalimpairment
Figure 11.4 Stages of normal rat MG development and effects of environment on subsequent events. Effects of early life EDC exposures canlead to altered developmental programming in the breast and have been reported neonatally, at puberty, and well intoadulthood, when effects on lactation or mammary tumorigenesis become evident. The normal morphology and pace of pubertaldevelopment are often altered, and these effects can be observed using MG whole-mount preparations. Transient or permanenteffects may be due to gene imprinting, altered gene expression, modified endogenous MG signaling, or changes in hormonalmilieu. Arrows indicate plausible (black) or more certain (gray) mechanistic pathways. Photomicrographs for early life andpuberty were all taken at 16� magnification on a macroscope (adapted from Ref. 104); photomicrographs for pregnancy/lactation and adulthood were taken at 10� magnification on a standard microscope (from SE Fenton). Bars¼ 2 mm.Adapted from Ref. 38.
Brea
stCancer
–Im
porta
nce
ofLife
Stagewith
Resp
ectto
Enviro
nmentalInfluences
317

measurable compound was present in maternal blood prior to birth, but also onhow old the individual was when DDT was first put on the market in 1945.102
This study reported a significant five-fold rise in risk of breast cancer amongwomen exposed to p,p0-DDT prior to age 14, and when broken down into ageincrements demonstrated that there was a significant effect of potential age ofexposure on breast cancer risk (see Figure 11.5 for specifics). In an evaluationof the existing epidemiologic literature on DDT exposure and breast cancerrisk, Cohn reports that the studies to date have been limited in their ability toassess exposure during early life, when windows of sensitivity exist for thebreast, thus may be failing to link DDT causally to breast cancer.103 Cohn usesDDT as a case study, and specifically points out that epidemiologic studies areoften designed in a manner that focuses on immediate observations, and thuslimits their potential to identify causality, particularly with disease processesthat entail extended periods of progression, such as breast cancer. These reportsfurther support the theory that early life exposures may be the most relevant forbreast cancer etiology.
Epidemiological efforts are unlikely to clearly identify risk factors linked tolife-stage without performing longitudinal studies. With such potential riskfactors as elevated BMI in childhood, advanced puberty timing, and exposureto mixtures of environmental compounds, longitudinal studies will need to beconducted, ideally with existing cohorts, in order to follow participants withknown childhood medical histories through menopause and beyond. Thiswould allow us to gain a realistic picture of the roles of such factors in breastcancer risk, as well as further understanding of the time(s) in an individual’s lifewhen they are most sensitive to these factors.
Figure 11.5 Associations of serum p,p0-DDT with early breast cancer in mothers inthe Child Health and Development Studies, according to their age in1945, a proxy for age at first exposure to DDT. Tertiles are based on thedistribution of the p,p0-DDT in the controls. Tertile 1 is the referencecategory for odds ratios shown. Breast cancer is defined as diagnosisbefore age 50. See 102 for details.Adapted from Ref. 103.
318 Chapter 11

11.5.2 Prevention – a Primary Purpose or an Afterthought?
Transdisciplinary research—that which brings together multiple facets ofresearch, such as animal biologists and clinicians working hand–in-hand on asingle question—may be the fastest and most efficient way to determine whatenvironmental factors we must avoid and if and when we are to begin to preventbreast cancer. Prevention, in this context, is meant as simply that—we decreasethe incidence of breast cancer because we stopped the exposures that caused it.This is the same idea that is conveyed in the ‘‘no texting while driving’’ laws. Ifyou stop texting while driving, the number of drivers killed in accidents will godown to the level prior to the texting explosion. Because this disease takesmany, many years from exposures to disease, animal models will be criticaltools in gaining further understanding of life-stage sensitivities and the classesof chemicals that contribute to breast cancer risk. Mechanisms to ‘‘shelter’’sensitive tissues from events that contribute to breast cancer risk, regulations tomonitor or eliminate exposures such as early life clinical radiation and inad-vertent chemical exposures in our water supply, laws to enable risk assessors tocrack down on environmental polluters, federal testing that requires evaluationof mammary gland effects for every new pharmaceutical and chemical thatcomes onto the market, and training of the next generation of clinicians inenvironmental health sciences are imperative. That is, we must prevent exposuresas much as possible, by reducing exposures cumulatively and especially duringthese sensitive windows of susceptibility. We must also inform the public, and itwill be especially important to include outreach specialists and breast canceradvocates in the transdisciplinary studies outlined previously. There might beintentional efforts to reduce levels of chemicals of concern in products—such asbaby bottles or formula for infants, makeup or jewelry targeted toward peri-pubertal girls, and our health and beauty-aid products intended for daily use,like toothpaste and anti-perspirant—which might be used by pregnant andlactating women and their children during these windows of sensitivity.
Further preventative measures might include moving toward green chemistry,as a means of reducing exposure to estrogenic and carcinogenic agents, andpromoting healthy living through better diets, greater physical activity, andreduced contact with agents known to contribute to risk. Education will alsocontinue to be a primary element in prevention, with an end goal of minimizingexposure.
11.5.3 Future Research – Age or Stage?
To begin the long road toward prevention of this disease that affects bothyoung and old women and men, we need far greater knowledge of the specificenvironmental factors that are found in cord blood, infant, child, andadolescent blood or urine, and breast milk so that we can mitigate theexposures in the body during influential developmental stages of the breast.Specifically in the case of men, we have no idea what the risk factors might befor breast cancer. Continued research will be needed in order to further
Breast Cancer – Importance of Life Stage with Respect to Environmental Influences 319

elucidate which breast life-stages are most susceptible to which combination ofassaults. Complementary epidemiologic and animal studies will be needed inorder to identify human-specific risk to these exposures, and determine themechanistic underpinnings. The influence of environmental factors on indi-viduals of different ethnicities/race, socio-economic status, and tumor subtypeis expected to vary. It is a very complicated matter to resolve, but our futureunderstanding of these matters must include evaluation of tumor subtype, andwe should no longer consider breast cancer a single disease.
Study designs should no longer consider adult-only environmental exposuresor measurement of exposures around the time of cancer diagnosis asacceptable. Future studies will need to be longitudinal, to understand thehistory of the gland and potential early risk and modifying factors. One way toenhance the ability to perform these types of studies is through development ofnationwide biospecimen banks and databases containing details of collectedspecimens that other investigators can utilize to develop collaborations acrosscenters and disciplines of research.
Furthermore, our means of testing chemicals, pharmaceuticals, and foodadditives for health effects in rodents and cells needs to change radically.Beyond the study design issues discussed, current methods are simply toocumbersome, being extremely time- and resource-prohibitive. Additionally,there is little to no regulatory impetus to test for breast-specific effects, andbreast tissue is often not evaluated in these tests. Higher-throughput methodsof testing chemicals/pharmaceuticals/food additives currently in productionand on the market for their potential to affect breast health need to bedeveloped. To do this, the tests must include either relevant cells cultured withthe normal cells found in the breast, or include mammary evaluation in rodentmodels. Breast cancer affects too many women to allow this important tissue tokeep being disregarded. Identifying new analytical strategies to clear thesemany chemicals of any potential for harm to the breast, and establishingregulations that enforce this testing, will be the charge of the future researchersand risk assessors, as our world continues to be polluted with chemicals.
We have now come full circle to the very reason for writing this chapter –breast cancer has long since been regarded a disease of aging, but we know thatit is the mixture of risk factor exposures at critical stages of breast developmentthat leads some individuals and populations to be more vulnerable to thedisease than others. It may also be the life-stage sensitivity interaction withgenes and environment that leads to the development of one subtype of tumorversus another. Future studies should focus on the specifics of this complexdisease, such as when there was an interaction of genes and environment bysubtype, race/ethnicity, known risk factors, etc., and then we may begin todecrease the incidence of this disease.
References
1. P. Lichtenstein, N. V. Holm, P. K. Verkasalo, A. Iliadou, J. Kaprio,M. Koskenvuo, E. Pukkala, A. Skytthe and K. Hemminki, Environmental
320 Chapter 11

and heritable factors in the causation of cancer--analyses of cohorts of twinsfrom Sweden, Denmark, and Finland, N Engl J Med, 2000, 343(2), 78–85.
2. C. Curtis, S. P. Shah, S. F. Chin, G. Turashvili, O. M. Rueda, M. J.Dunning, D. Speed, A. G. Lynch, S. Samarajiwa, Y. Yuan, S. Graf, G. Ha,G. Haffari, A. Bashashati, R. Russell and S. McKinney; METABRICGroup: A. Langerød, A. Green, E. Provenzano, G. Wishart, S. Pinder,P. Watson, F. Markowetz, L. Murphy, I. Ellis, A. Purushotham, A.L. Børresen-Dale, J. D. Brenton, S. Tavare, C. Caldas and S. Aparicio,The genomic and transcriptomic architecture of 2,000 breast tumoursreveals novel subgroups, Nature, 2012, 486(7403), 346–352.
3. S. P. Shah, A. Roth, R. Goya, A. Oloumi, G. Ha, Y. Zhao, G. Turashvili,J. Ding, K. Tse, G. Haffari, A. Bashashati, L. M. Prentice, J. Khattra,A. Burleigh, D. Yap, V. Bernard, A. McPherson, K. Shumansky,A. Crisan, R. Giuliany, A. Heravi-Moussavi, J. Rosner, D. Lai, I. Birol,R. Varhol, A. Tam, N. Dhalla, T. Zeng, K. Ma, S. K. Chan, M. Griffith,A. Moradian, S. W. Cheng, G. B. Morin, P. Watson, K. Gelmon, S. Chia,S. F. Chin, C. Curtis, O. M. Rueda, P. D. Pharoah, S. Damaraju,J. Mackey, K. Hoon, T. Harkins, V. Tadigotla, M. Sigaroudinia,P. Gascard, T. Tlsty, J. F. Costello, I. M. Meyer, C. J. Eaves, W. W.Wasserman, S. Jones, D. Huntsman, M. Hirst, C. Caldas, M. A. Marraand S. Aparicio, The clonal and mutational evolution spectrum ofprimary triple-negative breast cancers, Nature, 2012, 486(7403), 395–399.
4. C. K. Anders, C. Fan, J. S. Parker, L. A. Carey, K. L. Blackwell,N. Klauber-DeMore and C. M. Perou, Breast carcinomas arising at ayoung age: unique biology or a surrogate for aggressive intrinsicsubtypes?, J Clin Oncol, 2011, 29(1), e18–20.
5. S. E. Fenton, Endocrine-disrupting compounds and mammary glanddevelopment: early exposure and later life consequences, Endocrinology,2006, 147(Suppl 6), S18–24.
6. American Cancer Society. ‘‘Breast Cancer Facts and Figures 2011–2012,’’Atlanta: American Cancer Society, Inc., 2011. Web. 1 May 2012.ohttp://www.cancer.org/acs/groups/content/@epidemiologysurveilance/documents/document/acspc-030975.pdf4.
7. Institute of Medicine. ‘‘Breast Cancer and the Environment: A LifeCourse Approach.’’ Institute of Medicine, December 7, 2011. Web.1 May 2012. ohttp://www.iom.edu/Reports/2011/Breast-Cancer-and-the-Environment-A-Life-Course-Approach.aspx4.
8. Inter-Agency Breast Cancer and the Environment Research Coordina-ting Committee (IBCERCC). ‘‘Breast Cancer and the Environment:Prioritizing Prevention’’. 2012. http://www.niehs.nih.gov/about/boards/ibcercc/.
9. W. A. Marshall and J. M. Tanner, Variations in pattern of pubertalchanges in girls, Arch Dis Child, 1969, 44(235), 291–303.
10. S. Y. Euling, S. G. Selevan, O. H. Pescovitz and N. E. Skakkebaek, Roleof environmental factors in the timing of puberty, Pediatrics, 2008,121(Suppl 3), S167–171.
Breast Cancer – Importance of Life Stage with Respect to Environmental Influences 321

11. S. Y. Euling, M. E. Herman-Giddens, P. A. Lee, S. G. Selevan, A. Juul,T. I. Sorensen, L. Dunkel, J. H. Himes, G. Teilmann and S. H.Swan, Examination of US puberty-timing data from 1940 to 1994for secular trends: panel findings, Pediatrics, 2008, 121(Suppl 3),S172–191.
12. M. E. Herman-Giddens, E. J. Slora, R. C. Wasserman, C. J. Bourdony,M. V. Bhapkar, G. G. Koch and C. M. Hasemeier, Secondary sexualcharacteristics and menses in young girls seen in office practice: a studyfrom the Pediatric Research in Office Settings network, Pediatrics, 1997,99(4), 505–512.
13. F. M. Biro, M. P. Galvez, L. C. Greenspan, P. A. Succop, N. Vangeepuram,S. M. Pinney, S. Teitelbaum, G. C. Windham, L. H. Kushi andM. S. Wolff,Pubertal assessment method and baseline characteristics in a mixed longi-tudinal study of girls, Pediatrics, 2010, 126(3), e583–590.
14. L. Aksglaede, K. Sorensen, J. H. Petersen, N. E. Skakkebaek and A. Juul,Recent decline in age at breast development: the Copenhagen PubertyStudy, Pediatrics, 2009, 123(5), e932–939.
15. K. Sørensen, A. Mouritsen, L. Aksglaede, C. P. Hagen, S. S. Mogensenand A. Juul, Recent secular trends in pubertal timing: implications forevaluation and diagnosis of precocious puberty, Horm Res Paediatr.,2012, 77(3), 137–145.
16. F. M. Biro, B. Huang, S. R. Daniels and A. W. Lucky, Pubarche as well asthelarche may be a marker for the onset of puberty, J Pediatr AdolescGynecol, 2008, 21(6), 323–328.
17. A. Mouritsen, L. Aksglaede, K. Sorensen, S. S. Mogensen, H. Leffers,K. M. Main, H. Frederiksen, A. M. Andersson, N. E. Skakkebaek andA. Juul, Hypothesis: exposure to endocrine-disrupting chemicalsmay interfere with timing of puberty, Int J Androl, 2010, 33(2),346–359.
18. Mayo Clinic. Gynecomastia. http://www.mayoclinic.com/health/gynecomastia/DS00850 1998–2012 Mayo Foundation for MedicalEducation and Research.
19. E. Iuanow, M. Kettler and P. J. Slanetz, Spectrum of disease in the malebreast, AJR Am J Roentgenol, 2011, 196(3), W247–259.
20. H. Sasano, M. Kimura, S. Shizawa, N. Kimura and H. Nagura,Aromatase and steroid receptors in gynecomastia and male breastcarcinoma: an immunohistochemical study, J Clin Endocrinol Metab,1996, 81(8), 3063–3067.
21. D. V. Henley, N. Lipson, K. S. Korach and C. A. Bloch, Prepubertalgynecomastia linked to lavender and tea tree oils, N Engl J Med, 2007,356(5), 479–485.
22. J. R. Weiss, K. B. Moysich and H. Swede, Epidemiology of male breastcancer, Cancer Epidemiol Biomarkers Prev, 2005, 14(1), 20–26.
23. J. Russo and I. Russo, Development of the human mammary gland. In:D. C. Neville MC (ed.), The Mammary Gland: Development, Regulation,and Function, New York: Plenum Press, 1987, pp. 67–93.
322 Chapter 11

24. C. W. Elston and I. O. Ellis (1998). Normal structure and developmentalabnormalities. In: C. W. Elston and I. O. Ellis (ed.), The breast,Edinburgh: Churchill Livingstone, 1998, pp. 1–19.
25. B. A. Gusterson and T. Stein, Human breast development., Semin CellDev Biol., 2012.
26. H. Ma, L. Bernstein, M. C. Pike and G. Ursin, Reproductive factors andbreast cancer risk according to joint estrogen and progesterone receptorstatus: a meta-analysis of epidemiological studies, Breast Cancer Res,2006, 8(4), R43.
27. J. Russo, L. K. Tay, D. R. Ciocca and I. H. Russo, Molecular and cellularbasis of the mammary gland susceptibility to carcinogenesis, EnvironHealth Perspect, 1983, 49, 185–199.
28. D. C. Radisky and L. C. Hartmann, Mammary involution and breastcancer risk: transgenic models and clinical studies, J Mammary Gland BiolNeoplasia, 2009, 14(2), 181–191.
29. G. M. Fara, G. Del Corvo, S. Bernuzzi, A. Bigatello, C. Di Pietro,S. Scaglioni and G. Chiumello, Epidemic of breast enlargement in anItalian school, Lancet, 1979, 2(8137), 295–297.
30. C. M. Tiwary, Premature sexual development in children following theuse of estrogen- or placenta-containing hair products, Clin Pediatr(Phila), 1998, 37(12), 733–739.
31. E. Den Hond, H. A. Roels, K. Hoppenbrouwers, T. Nawrot, L. Thijs,C. Vandermeulen, G. Winneke, D. Vanderschueren and J. A. Staessen,Sexual maturation in relation to polychlorinated aromatic hydrocarbons:Sharpe and Skakkebaek’s hypothesis revisited, Environ Health Perspect,2002, 110(8), 771–776.
32. M. M. Leijs, J. G. Koppe, K. Olie, W. M. van Aalderen, P. Voogt,T. Vulsma, M. Westra and G. W. ten Tusscher, Delayed initiation ofbreast development in girls with higher prenatal dioxin exposure; alongitudinal cohort study, Chemosphere, 2008, 73(6), 999–1004.
33. M. Warner, B. Eskenazi, P. Mocarelli, P. M. Gerthoux, S. Samuels,L. Needham, M. Westra and G. W. ten Tusscher, Serum dioxin concen-trations and breast cancer risk in the Seveso Women’s Health Study,Environ Health Perspect, 2002, 110(7), 625–628.
34. M. Warner, P. Mocarelli, S. Samuels, L. Needham, P. Brambilla andB. Eskenazi, Dioxin exposure and cancer risk in the Seveso Women’sHealth Study, Environ Health Perspect, 2011, 119(12), 1700–1705.
35. W. J. Rogan, A. Bagniewska and T. Damstra, Pollutants in breast milk,N Engl J Med, 1980, 302(26), 1450–1453.
36. L. L. Needham, P. Grandjean, B. Heinzow, P. J. Jorgensen, F. Nielsenand D. G. Patterson, et al., Partition of environmental chemicals betweenmaternal and fetal blood and tissues., Environ Sci Technol., 2011, 45,1121–1126.
37. W. J. Rogan, B. C. Gladen, J. D. McKinney, N. Carreras, P. Hardy,J. Thullen, J. Tingelstad and M. R. Tully, Polychlorinated biphenyls(PCBs) and dichlorodiphenyl dichloroethene (DDE) in human milk: effects
Breast Cancer – Importance of Life Stage with Respect to Environmental Influences 323

on growth, morbidity, and duration of lactation, Am J Public Health,1987, 77(10), 1294–1297.
38. R. A. Rudel, S. E. Fenton, J. M. Ackerman, S. Y. Euling and S. L.Makris, Environmental exposures and mammary gland development:state of the science, public health implications, and research recom-mendations, Environ Health Perspect, 2011, 119(8), 1053–1061.
39. S. L. Makris, Current assessment of the effects of environmentalchemicals on the mammary gland in guideline rodent studies by the USEnvironmental Protection Agency (US EPA), Organisation for EconomicCo-operation and Development (OECD), and National ToxicologyProgram (NTP)., Environ Health Perspect, 2011, 119(8), 1047–1052.
40. A. G. Knudson, Hereditary cancer: two hits revisited, J Cancer Res ClinOncol, 1996, 122(3), 135–140.
41. D. Hanahan and R. A. Weinberg, The hallmarks of cancer, Cell, 2000,100(1), 57–70.
42. National Cancer Institute, National Cancer Institute: Genetics of Breastand Ovarian Cancer (PDQU) Retrieved June 1, 2012, from http://www.cancer.gov/cancertopics/pdq/genetics/breast-and-ovarian/HealthProfessional/page2, 2012.
43. L. Shen, Z. H. Yin, Y. Wan, Y. Zhang, K. Li and B. S. Zhou, Associationbetween ATM polymorphisms and cancer risk: a meta-analysis, Mol BiolRep, 2012, 39(5), 5719–5725.
44. Institute of Medicine. ‘‘Breast Cancer and the Environment: A LifeCourse Approach.’’ Instistute of Medicine, December 7, 2011. Web.1 May 2012. ohttp://www.iom.edu/Reports/2011/Breast-Cancer-and-the-Environment-A-Life-Course-Approach.aspx4.
45. P. A. van den Brandt, D. Spiegelman, S. S. Yaun, H. O. Adami,L. Beeson, A. R. Folsom, G. Fraser, R. A. Goldbohm, S. Graham,L. Kushi, J. R. Marshall, A. B. Miller, T. Rohan, S. A. Smith-Warner,F. E. Speizer, W. C. Willett, A. Wolk and D. J. Hunter, Pooled analysis ofprospective cohort studies on height, weight, and breast cancer risk., Am JEpidemiol, 2000, 152(6), 514–527.
46. A. Vrieling, K. Buck, R. Kaaks and J. Chang-Claude, Adult weight gainin relation to breast cancer risk by estrogen and progesterone receptorstatus: a meta-analysis, Breast Cancer Res Treat, 2010, 123(3), 641–649.
47. M. Protani, M. Coory and J. H. Martin, Effect of obesity on survival ofwomen with breast cancer: systematic review and meta-analysis, BreastCancer Res Treat, 2010, 123(3), 627–635.
48. J. Green, B. J. Cairns, D. Casabonne, F. L. Wright, G. Reeves andV. Beral, Height and cancer incidence in the Million Women Study:prospective cohort, and meta-analysis of prospective studies of height andtotal cancer risk, Lancet Oncol, 2011, 12(8), 785–794.
49. N. Hamajima, K. Hirose, K. Tajima, T. Rohan, E. E. Calle, C. W. Heath,R. J. Coates, J. M. Liff, R. Talamini, N. Chantarakul, S. Koetsawang,D. Rachawat, A. Morabia, L. Schuman, W. Stewart, M. Szklo, C. Bain,F. Schofield, V. Siskind, P. Band, A. J. Coldman, R. P. Gallagher,
324 Chapter 11

T. G. Hislop, P. Yang, L. M. Kolonel, A. M. Nomura, J. Hu, K. C.Johnson, Y. Mao, S. De Sanjose, N. Lee, P. Marchbanks, H. W. Ory,H. B. Peterson, H. G. Wilson, P. A. Wingo, K. Ebeling, D. Kunde,P. Nishan, J. L. Hopper, G. Colditz, V. Gajalanski, N. Martin,T. Pardthaisong, S. Silpisornkosol, C. Theetranont, B. Boosiri,S. Chutivongse, P. Jimakorn, P. Virutamasen, C. Wongsrichanalai,M. Ewertz, H. O. Adami, L. Bergkvist, C. Magnusson, I. Persson,J. Chang-Claude, C. Paul, D. C. Skegg, G. F. Spears, P. Boyle,T. Evstifeeva, J. R. Daling, W. B. Hutchinson, K. Malone, E. A. Noonan,J. L. Stanford, D. B. Thomas, N. S. Weiss, E. White, N. Andrieu,A. Bremond, F. Clavel, B. Gairard, J. Lansac, L. Piana, R. Renaud,A. Izquierdo, P. Viladiu, H. R. Cuevas, P. Ontiveros, A. Palet, S. B.Salazar, N. Aristizabel, A. Cuadros, L. Tryggvadottir, H. Tulinius,A. Bachelot, M. G. Le, J. Peto, S. Franceschi, F. Lubin, B. Modan,E. Ron, Y. Wax, G. D. Friedman, R. A. Hiatt, F. Levi, T. Bishop,K. Kosmelj, M. Primic-Zakelj, B. Ravnihar, J. Stare, W. L. Beeson,G. Fraser, R. D. Bullbrook, J. Cuzick, S. W. Duffy, I. S. Fentiman,J. L. Hayward, D. Y. Wang, A. J. McMichael, K. McPherson, R. L.Hanson, M. C. Leske, M. C. Mahoney, P. C. Nasca, A. O. Varma,A. L. Weinstein, T. R. Moller, H. Olsson, J. Ranstam, R. A. Goldbohm,P. A. van den Brandt, R. A. Apelo, J. Baens, J. R. de la Cruz, B. Javier,L. B. Lacaya, C. A. Ngelangel, C. La Vecchia, E. Negri, E. Marubini,M. Ferraroni, M. Gerber, S. Richardson, C. Segala, D. Gatei, P. Kenya,A. Kungu, J. G. Mati, L. A. Brinton, R. Hoover, C. Schairer, R. Spirtas,H. P. Lee, M. A. Rookus, F. E. van Leeuwen, J. A. Schoenberg,M. McCredie, M. D. Gammon, E. A. Clarke, L. Jones, A. Neil,M. Vessey, D. Yeates, P. Appleby, E. Banks, V. Beral, D. Bull,B. Crossley, A. Goodill, J. Green, C. Hermon, T. Key, N. Langston,C. Lewis, G. Reeves, R. Collins, R. Doll, R. Peto, K. Mabuchi,D. Preston, P. Hannaford, C. Kay, L. Rosero-Bixby, Y. T. Gao, F. Jin,J. M. Yuan, H. Y. Wei, T. Yun, C. Zhiheng, G. Berry, J. Cooper Booth,T. Jelihovsky, R. MacLennan, R. Shearman, Q. S. Wang, C. J. Baines,A. B. Miller, C. Wall, E. Lund, H. Stalsberg, X. O. Shu, W. Zheng,K. Katsouyanni, A. Trichopoulou, D. Trichopoulos, A. Dabancens,L. Martinez, R. Molina, O. Salas, F. E. Alexander, K. Anderson,A. R. Folsom, B. S. Hulka, L. Bernstein, S. Enger, R. W. Haile,A. Paganini-Hill, M. C. Pike, R. K. Ross, G. Ursin, M. C. Yu, M. P.Longnecker, P. Newcomb, L. Bergkvist, A. Kalache, Farleyt andS. Holck, O. Meirik, Collaborative Group on Hormonal Factors in BreastCancer, Alcohol, tobacco and breast cancer--collaborative reanalysis ofindividual data from 53 epidemiological studies, including 58,515 womenwith breast cancer and 95,067 women without the disease, Br J Cancer,2002, 87(11), 1234–1245.
50. W. Y. Chen, B. Rosner, S. E. Hankinson, G. A. Colditz and W. C.Willett, Moderate alcohol consumption during adult life, drinkingpatterns, and breast cancer risk, JAMA, 2011, 306(17), 1884–1890.
Breast Cancer – Importance of Life Stage with Respect to Environmental Influences 325

51. C. Pelucchi, I. Tramacere, P. Boffetta, E. Negri and C. La Vecchia,Alcohol consumption and cancer risk, Nutr Cancer, 2011, 63(7), 983–990.
52. V. A. McCormack and I. dos Santos Silva, Breast density and paren-chymal patterns as markers of breast cancer risk: a meta-analysis, CancerEpidemiol Biomarkers Prev, 2006, 15(6), 1159–1169.
53. N. F. Boyd, G. S. Dite, J. Stone, A. Gunasekara, D. R. English, M. R.McCredie, G. G. Giles, D. Tritchler, A. Chiarelli, M. J. Yaffe andJ. L. Hopper, Heritability of mammographic density, a risk factor forbreast cancer, N Engl J Med, 2002, 347(12), 886–894.
54. G. Ursin, H. Ma, A. H. Wu, L. Bernstein, M. Salane, Y. R. Parisky,M. Astrahan, C. C. Siozon and M. C. Pike, Mammographic density andbreast cancer in three ethnic groups, Cancer Epidemiol Biomarkers Prev,2003, 12(4), 332–338.
55. J. W. Byng, N. F. Boyd, E. Fishell, R. A. Jong and M. J. Yaffe, Thequantitative analysis of mammographic densities, Phys Med Biol, 1994,39(10), 1629–1638.
56. G. Masala, D. Ambrogetti, M. Assedi, D. Giorgi, M. R. Del Turco andD. Palli, Dietary and lifestyle determinants of mammographic breastdensity. A longitudinal study in a Mediterranean population, Int JCancer, 2006, 118(7), 1782–1789.
57. S. S. White, K. Kato, L. T. Jia, B. J. Basden, A. M. Calafat, E. P. Hines,J. P. Stanko, C. J. Wolf, B. D. Abbott and S. E. Fenton, Effects ofperfluorooctanoic acid on mouse mammary gland development anddifferentiation resulting from cross-foster and restricted gestationalexposures, Reprod Toxicol, 2009, 27(3–4), 289–298.
58. M. Durando, L. Kass, J. Piva, C. Sonnenschein, A. M. Soto, E. H. Luqueand M. Munoz-de-Toro, Prenatal bisphenol A exposure inducespreneoplastic lesions in the mammary gland in Wistar rats, EnvironHealth Perspect, 2007, 115(1), 80–86.
59. B. MacMahon, P. Cole, T. M. Lin, C. R. Lowe, A. P. Mirra, B. Ravnihar,E. J. Salber, V. G. Valaoras and S. Yuasa, Age at first birth and breastcancer risk, Bull World Health Organ, 1970, 43(2), 209–221.
60. T. J. Key, P. K. Verkasalo and E. Banks, Epidemiology of breast cancer,Lancet Oncol, 2001, 2(3), 133–140.
61. J. Russo, R. Moral, G. A. Balogh, D. Mailo and I. H. Russo, Theprotective role of pregnancy in breast cancer, Breast Cancer Res, 2005,7(3), 131–142.
62. S. J. Lord, L. Bernstein, K. A. Johnson, K. E. Malone, J. A. McDonald,P. A. Marchbanks, M. S. Simon, B. L. Strom, M. F. Press, S. G. Folger,R. T. Burkman, D. Deapen, R. Spirtas and G. Ursin, Breast cancer riskand hormone receptor status in older women by parity, age of first birth,and breastfeeding: a case-control study, Cancer Epidemiol BiomarkersPrev, 2008, 17(7), 1723–1730.
63. Collaborative Group on Hormonal Factors in Breast Cancer, Breastcancer and breastfeeding: collaborative reanalysis of individual data from47 epidemiological studies in 30 countries, including 50302 women with
326 Chapter 11

breast cancer and 96973 women without the disease., Lancet, 2002,360(9328), 187–195.
64. A. Shin, Y. M. Song, K. Y. Yoo and J. Sung, Menstrual factors andcancer risk among Korean women, Int J Epidemiol, 2011, 40(5),1261–1268.
65. J. M. Yuan, M. C. Yu, R. K. Ross, Y. T. Gao and B. E. Henderson, Riskfactors for breast cancer in Chinese women in Shanghai, Cancer Res,1988, 48(7), 1949–1953.
66. J. B. Kampert, A. S. Whittemore and R. S. Paffenbarger, Combined effectof childbearing, menstrual events, and body size on age-specific breastcancer risk, Am J Epidemiol, 1988, 128(5), 962–979.
67. G. A. Colditz, S. E. Hankinson, D. J. Hunter, W. C. Willett, J. E.Manson, M. J. Stampfer, C. Hennekens, B. Rosner and F. E. Speizer, Theuse of estrogens and progestins and the risk of breast cancer in post-menopausal women, N Engl J Med, 1995, 332(24), 1589–1593.
68. P. A. Marchbanks, J. A. McDonald, H. G. Wilson, S. G. Folger, M. G.Mandel, J. R. Daling, L. Bernstein, K. E. Malone, G. Ursin, B. L. Strom,S. A. Norman, P. A. Wingo, R. T. Burkman, J. A. Berlin, M. S. Simon,R. Spirtas and L. K. Weiss, Oral contraceptives and the risk of breastcancer, N Engl J Med, 2002, 346(26), 2025–2032.
69. R. N. Hoover, M. Hyer, R. M. Pfeiffer, E. Adam, B. Bond, A. L. Cheville,T. Colton, P. Hartge, E. E. Hatch, A. L. Herbst, B. Y. Karlan,R. Kaufman, K. L. Noller, J. R. Palmer, S. J. Robboy, R. C. Saal,W. Strohsnitter, L. Titus-Ernstoff and R. Troisi, Adverse health outcomesin women exposed in utero to diethylstilbestrol, N Engl J Med, 2011,365(14), 1304–1314.
70. J. R. Palmer, L. A. Wise, E. E. Hatch, R. Troisi, L. Titus-Ernstoff,W. Strohsnitter, R. Kaufman, A. L. Herbst, K. L. Noller, M. Hyer andR. N. Hoover, Prenatal diethylstilbestrol exposure and risk of breastcancer, Cancer Epidemiol Biomarkers Prev, 2006, 15(8), 1509–1514.
71. E. R. Greenberg, A. B. Barnes, L. Resseguie, J. A. Barrett, S. Burnside,L. L. Lanza, R. K. Neff, M. Stevens, R. H. Young and T. Colton, Breastcancer in mothers given diethylstilbestrol in pregnancy, N Engl J Med,1984, 311(22), 1393–1398.
72. C. E. Land, J. D. Boice, R. E. Shore, J. E. Norman and M. Tokunaga,Breast cancer risk from low-dose exposures to ionizing radiation: resultsof parallel analysis of three exposed populations of women, J Natl CancerInst, 1980, 65(2), 353–376.
73. K. Ozasa, Y. Shimizu, A. Suyama, F. Kasagi, M. Soda, E. J. Grant,R. Sakata, H. Sugiyama and K. Kodama, Studies of the mortality ofatomic bomb survivors, Report 14, 1950–2003: an overview of cancer andnoncancer diseases, Radiat Res, 2012, 177(3), 229–243.
74. M. Tokunaga, J. E. Norman, M. Asano, S. Tokuoka, H. Ezaki,I. Nishimori and Y. Tsuji, Malignant breast tumors among atomic bombsurvivors, Hiroshima and Nagasaki, 1950–74, J Natl Cancer Inst, 1979,62(6), 1347–1359.
Breast Cancer – Importance of Life Stage with Respect to Environmental Influences 327

75. M. S. Linet, T. L. Slovis, D. L. Miller, R. Kleinerman, C. Lee,P. Rajaraman and A. Berrington de Gonzalez, Cancer risks associatedwith external radiation from diagnostic imaging procedures., CA Cancer JClin., 2012, 62(2), 75–100.
76. P. B. Kaplowitz, Link between body fat and the timing of puberty,Pediatrics, 2008, 121(Suppl 3), S208–217.
77. L. K. Olson, Y. Tan, Y. Zhao, M. D. Aupperlee and S. Z. Haslam,Pubertal exposure to high fat diet causes mouse strain-dependentalterations in mammary gland development and estrogen responsiveness,Int J Obes (Lond), 2010, 34(9), 1415–1426.
78. A. Janesick and B. Blumberg, Minireview: PPARgamma as the target ofobesogens, J Steroid Biochem Mol Biol, 2011, 127(1–2), 4–8.
79. R. G. Ziegler, R. N. Hoover, M. C. Pike, A. Hildesheim, A. M. Nomura,D. W. West, A. H. Wu-Williams, L. N. Kolonel, P. L. Horn-Ross,J. F. Rosenthal and M. B. Hyer, Migration patterns and breast cancerrisk in Asian-American women, J Natl Cancer Inst, 1993, 85(22),1819–1827.
80. S. F. Brennan, M. M. Cantwell, C. R. Cardwell, L. S. Velentzis andJ. V. Woodside, Dietary patterns and breast cancer risk: a systematicreview and meta-analysis, Am J Clin Nutr, 2010, 91(5), 1294–1302.
81. C. X. Zhang, S. C. Ho, J. H. Fu, S. Z. Cheng, Y. M. Chen and F. Y. Lin,Dietary patterns and breast cancer risk among Chinese women, CancerCauses Control, 2011, 22(1), 115–124.
82. Y. A. Cho, J. Kim, A. Shin, K. S. Park and J. Ro, Dietary patterns andbreast cancer risk in Korean women, Nutr Cancer, 2010, 62(8),1161–1169.
83. National Toxicology Program, Multigenerational reproductive study ofgenistein (Cas No. 446-72-0) in Sprague-Dawley rats (feed study), NatlToxicol Program Tech Rep Ser, 2008, 539, 1–266.
84. A. Warri, N. M. Saarinen, S. Makela and L. Hilakivi-Clarke, The role ofearly life genistein exposures in modifying breast cancer risk, Br J Cancer,2008, 98(9), 1485–1493.
85. L. Hilakivi-Clarke, E. Cho, I. Onojafe, M. Raygada and R. Clarke,Maternal exposure to genistein during pregnancy increases carcinogen-induced mammary tumorigenesis in female rat offspring, Oncol Rep, 1999,6(5), 1089–1095.
86. E. Padilla-Banks, W. N. Jefferson and R. R. Newbold, Neonatal exposureto the phytoestrogen genistein alters mammary gland growth and devel-opmental programming of hormone receptor levels, Endocrinology, 2006,147(10), 4871–4882.
87. G. Costa, E. Haus and R. Stevens, Shift work and cancer - considerationson rationale, mechanisms, and epidemiology, Scand J Work EnvironHealth, 2010, 36(2), 163–179.
88. K. Amend, D. Hicks and C. B. Ambrosone, Breast cancer in African-American women: differences in tumor biology from European-Americanwomen, Cancer Res, 2006, 66(17), 8327–8330.
328 Chapter 11

89. Centers for Disease Control and Prevention. Overweight and Obesity.http://www.cdc.gov/obesity/data/childhood.html Accessed Sept 24, 2012.last updated Aug 28, 2012.
90. S. Yao, G. Zirpoli, D. H. Bovbjerg, L. Jandorf, C. C. Hong, H. Zhao,L. E. Sucheston, L. Tang, M. Roberts, G. Ciupak, W. Davis, H. Hwang,C. S. Johnson, D. L. Trump, S. E. McCann, F. Ademuyiwa, K. S.Pawlish, E. V. Bandera and C. B. Ambrosone, Variants in the vitamin Dpathway, serum levels of vitamin D, and estrogen receptor negative breastcancer among African-American women: a case-control study, BreastCancer Res, 2012, 14(2), R58.
91. L. A. Carey, C. M. Perou, C. A. Livasy, L. G. Dressler, D. Cowan,K. Conway, G. Karaca, M. A. Troester, C. K. Tse, S. Edmiston,S. L. Deming, J. Geradts, M. C. Cheang, T. O. Nielsen, P. G. Moorman,H. S. Earp and R. C. Millikan, Race, breast cancer subtypes, and survivalin the Carolina Breast Cancer Study, JAMA, 2006, 295(21), 2492–2502.
92. National Toxicology Program, Report on Carcinogens, 12th edition,2011. Retrieved June 1, 2012, from http://ntp.niehs.nih.gov/ntp/roc/twelfth/roc12.pdf.
93. C. B. Ambrosone, S. Kropp, J. Yang, S. Yao, P. G. Shields andJ. Chang-Claude, Cigarette smoking, N-acetyltransferase 2 genotypes,and breast cancer risk: pooled analysis and meta-analysis, CancerEpidemiol Biomarkers Prev, 2008, 17(1), 15–26.
94. D. G. Cox, L. Dostal, D. J. Hunter, L. Le Marchand, R. Hoover,R. G. Ziegler, M. J. Thun and Breast and Prostate Cancer CohortConsortium, N-acetyltransferase 2 polymorphisms, tobacco smoking, andbreast cancer risk in the breast and prostate cancer cohort consortium,Am J Epidemiol, 2011, 174(11), 1316–1322.
95. F. Xue, W. C. Willett, B. A. Rosner, S. E. Hankinson and K. B. Michels,Cigarette smoking and the incidence of breast cancer, Arch Intern Med,2011, 171(2), 125–133.
96. K. C. Johnson, A. B. Miller, N. E. Collishaw, J. R. Palmer, S. K.Hammond, A. G. Salmon, K. P. Cantor, M. D. Miller, N. F. Boyd,J. Millar and F. Turcotte, Active smoking and secondhand smokeincrease breast cancer risk: the report of the Canadian Expert Panel onTobacco Smoke and Breast Cancer Risk (2009), Tob Control, 2011,20(1), e2.
97. D. Zucchino, Camp Lejeune residents blame rare cancer cluster on thewater. Los Angeles Times, August 26, 2009.
98. A. Boudreau and S. Bronstein, CNN Special Investigations Unit(September 24, 2009). Male breast cancer patients blame water at Marinebase. Retrieved May 1, 2012, from http://articles.cnn.com/2009-09-24/health/marines.breast.cancer_1_breast-cancer-cancer-spread-drinking-water?_s¼PM:HEALTH.
99. K. Fukamachi, B. S. Han, C. K. Kim, N. Takasuka, Y. Matsuoka,E. Matsuda, T. Yamasaki and H. Tsuda, Possible enhancing effects ofatrazine and nonylphenol on 7,12-dimethylbenz[a]anthracene-induced
Breast Cancer – Importance of Life Stage with Respect to Environmental Influences 329

mammary tumor development in human c-Ha-ras proto-oncogenetransgenic rats, Cancer Sci, 2004, 95(5), 404–410.
100. M. Ueda, T. Imai, T. Takizawa, H. Onodera, K. Mitsumori, T. Matsuiand M. Hirose, Possible enhancing effects of atrazine on growth of7,12-dimethylbenz(a) anthracene-induced mammary tumors in ovari-ectomized Sprague-Dawley rats, Cancer Sci, 2005, 96(1), 19–25.
101. L. T. Wetzel, L. G. Luempert, C. B. Breckenridge, M. O. Tisdel, J. T.Stevens, A. K. Thakur, P. J. Extrom and J. C. Eldridge, Chronic effects ofatrazine on estrus and mammary tumor formation in female Sprague-Dawley and Fischer 344 rats, J Toxicol Environ Health, 1994, 43(2),169–182.
102. B. A. Cohn, M. S. Wolff, P. M. Cirillo and R. I. Sholtz, DDT and breastcancer in young women: new data on the significance of age at exposure,Environ Health Perspect, 2007, 115(10), 1406–1414.
103. B. A. Cohn, Developmental and environmental origins of breast cancer:DDT as a case study, Reprod Toxicol, 2011, 31(3), 302–311.
104. R. R. Enoch, J. S. Stanko, S. N. Greiner, G. L. Youngblood, J. L. Raynerand S. E. Fenton, Mammary gland development as a sensitive end-pointfollowing acute prenatal exposure to a low dose atrazine metabolitemixture in female Long Evans rats, Environ Health Perspect, 2007, 115(4),541–547.
105. Susan G. Komen for the Cure. ‘‘Understanding Breast Cancer: RiskFactors and Prevention.’’ Susan G. Komen for the Cure. Web. 1 May2012. ohttp://ww5.komen.org/BreastCancer/GettingOlder.html4.
330 Chapter 11

CHAPTER 12
Environmental Chemicals andProstate Cancer Risk
JASPREET S. JONEJA, WEN-YANG HU,RICARDO R. RIOS AND GAIL S. PRINS*
Department of Urology, University of Illinois at Chicago, Chicago, IL,USA 60612*E-mail: [email protected]
12.1 Introduction
Male reproductive health is defined by both the proper development of thereproductive system and maintenance of function throughout adult life, includingthe capacity to reproduce. While female sexual differentiation, considered thedefault developmental pathway, is largely independent of estrogens andandrogens, male sexual differentiation is driven by androgens produced by thefetal testes and is entirely androgen-dependent.1,2 Many environmental chemicals(ECs) have been shown to directly or indirectly interfere with androgen action ormimic estrogenic action, thus impacting male developmental programming andreproductive tract maturation, as well as initiating direct effect in adults. Severalcompounds—including endocrine-disrupting chemicals (EDCs), industrialcompounds, cigarette smoke, air pollution, radiation, electromagnetic fields,processed foods, alcohol, and pharmaceuticals—have been implicated in variousabnormalities of the reproductive tract organs.
The present discussion is organized around the potential involvement of ECsin direct and indirect effects on the prostate gland in adults, as well as early lifeexposures to these compounds, which may predispose this sensitive developing
Issues in Toxicology No. 16
Aging and Vulnerability to Environmental Chemicals: Age-related Disorders and their Origins in
Environmental Exposures
Edited by Bernard Weiss
r The Royal Society of Chemistry 2013
Published by the Royal Society of Chemistry, www.rsc.org
331

tissue to prostate cancer upon aging. As a cross-reference, Table 12.1summarizes the evidence and provides references for individual ECs withregards to prostate cancer (PC).
PC is the most common non-cutaneous cancer and the second leading causeof cancer deaths in North American men.3 It is known that steroids play a rolein the initiation and progression of PC, which is the basis for hormonaltreatment strategies that include androgen ablation and androgen receptor(AR) blockade.4,5 Increasing evidence indicates that in addition to androgens,estrogens play key roles in prostate carcinogenesis and progression, althoughthe mechanisms are not fully understood.6–9 In men, chronically elevatedestrogens have been associated with increased risk of PC,10 while in rodents,estrogens in combination with androgens induce PC.11 In addition to the directeffects of steroids, it is currently recognized that age, race, genetics (familyhistory), diet, and environmental factors can impact prostate cancer risk.12
Recent advances in stem cell research indicate that stem cells and early stageprogenitor cells may be direct carcinogenic targets and, potentially, the cells oforigin in cancer initiation and progression. Novel in vitro and in vivo modelsusing stem and early stage progenitor cells isolated from normal humanprostates have been developed and used to initiate hormonal carcinogenesis.7
These in vitro prostasphere and in vivo chimeric prostate models with carci-nogenic induction serve as suitable models for examining stem cell pertur-bations and carcinogenic actions of ECs on human prostate cells. Using thesemodels, our laboratory has recently found evidence that human prostateepithelial stem cell exposures to natural and environmental estrogens and otherECs such as dioxin and inorganic arsenic can alter stem cell self-renewal anddifferentiation and gene expression programs.13 Thus it is likely that variousECs influence carcinogenic risk in the human prostate gland, in part bypermanently reprogramming the stem cell population.
12.2 Evidence and Mechanisms
12.2.1 Farming and Pesticides
Regarding links between prostate cancer and environmental factors in humans(outside of diet), the most compelling data come from the established occu-pational hazard of farming and increased prostate cancer rates.14–16 Whileseveral variables may contribute to higher PC rates in farmers, chronic orintermittent exposures to pesticides are the most likely explanation.15,17,18 Thisis supported by a large epidemiology study (Agricultural Health Study)—acollaborative effort between the National Cancer Institute, the NationalInstitute of Environmental Health Sciences, and the Environmental ProtectionAgency in the United States—that has examined agricultural lifestyles andhealth in B90 000 participants in North Carolina and Iowa since 1993(www.aghealth.org). Evaluation of 455 000 pesticide applicators revealed adirect link between exposure to methyl bromide, a fungicide with an unknownmode of action, and increased PC rates. Furthermore, 6 out of 45 common
332 Chapter 12

Table 12.1 Summary of evidence for prostate cancer risks in humans andanimal model systems as a result of exposure to environmentalchemicals.
EnvironmentalChemicals
Evidence forcancer risk inhumans References
Evidence for cancerrisk in experimentalmodels References
Environmental
Estrogen
DES Elevated prostatecancer risk
[31,32,33]
BPA Elevated prostatecancer risk
[40,41] Elevated prostatecancer risk
[41,42]
PCBs Elevated prostatecancer risk
[44,45,46] Elevated prostatecancer risk
[47]
Atrazine Elevated prostatecancer risk
[52,53] Elevated prostatecancer risk
[51]
Decreased prostatecancer risk
[54,55]
Anti-androgens
Vinclozalin Decreased prostatecancer risk
[69]
Elevated prostatecancer risk
[50,71]
DDT/DDE Elevated prostatecancer risk
[18]
Heavy metals
Arsenic Elevated prostatecancer risk
[59,66] Elevated prostatecancer risk
[62,65]
Cadmium Elevated anddecreased prostatecancer risk
[56] Elevated prostatecancer risk
[57,58]
Pesticides
Methyl bromide Elevated prostatecancer risk
[15]
Chlorpyrifos Elevated prostatecancer risk
[15,19]
Fonofos Elevated prostatecancer risk
[15,19]
Coumaphos Elevated prostatecancer risk
[15,19]
Phorate Elevated prostatecancer risk
[15,19]
Permethrin Elevated prostatecancer risk
[15,19]
Butylate Elevated prostatecancer risk
[15,19]
UV filters
4-methyl-benzylidenecamphor (4-MBC)
Elevated prostatecancer risk
[48,49]
3-benzylidenecamphor (3-BC)
Elevated prostatecancer risk
[48,49]
Dioxin
TCDD Decreasedprostate cancerrisk
[79]
Environmental Chemicals and Prostate Cancer Risk 333

agricultural pesticides showed correlation with exposure and increased PC inmen with a familial history, suggesting gene–environment interactions. Thesesix agents were chlorpyrifos, fonofos, coumaphos, phorate, permethrin, andbutylate.15,19 The first four of these compounds are thiophosphates and share acommon chemical structure. While these agents are regarded as acetylcholineesterase inhibitors and have not been shown to have direct estrogenic or anti-androgenic activities, a literature search revealed that these compounds havesignificant capacity as p450 enzyme inhibitors. In particular, chlorpyrifos,fonofos, and phorate strongly inhibit CYP1A2 and CYP3A4, which are themajor p450s that metabolize estradiol, estrone, and testosterone in the liver.20,21
Furthermore, the human prostate constitutively expresses CYP1A2 andCYP3A4 enzymes that are involved in intraprostatic metabolism of steroids,drugs, and dietary compounds.22–24
This raises the possibility that exposure to these compounds may interferewith steroid hormone metabolism by the liver as well as the prostate, and indoing so, alter steroid balance and availability, which in turn may contribute toincreased PC risk. A similar mechanism of endocrine disruption in vivo hasbeen identified for polychlorinated biphenols (PCBs) and polyhalogenatedaromatic hydrocarbons [including dioxins, bisphenol A (BPA), and diben-zofurans] through potent inhibition of estrogen sulfotransferase, whicheffectively elevates bioavailable estrogens in various target organs.25,26
12.2.2 Environmental Estrogens
In men, chronically elevated estrogens have been associated with increased riskof PC.10 In rodents, estrogens, in combination with androgens, induce PC.27
For the sake of simplicity, we here refer to environmental estrogens asmolecules with identified estrogenic activity (estrogen mimics), mostly throughactivation of estrogen receptors (ERs).
12.2.2.1 Diethylstilbesterol (DES)
DES exposure is considered an important model of endocrine disruption andprovides proof of principle for exogenous estrogenic agents as disruptors ofmultiple endorgans. Maternal exposure to DES during pregnancy was found toresult in more extensive prostatic squamous metaplasia in human maleoffspring than observed with maternal estradiol alone.28 While prostaticmetaplasia eventually resolved following DES withdrawal, ectasia andpersistent distortion of ductal architecture remained.29 This has led to thepostulation that men prenatally exposed to DES may be at increased risk forprostatic disease later in life, although this has not been borne out in the limitedpopulation studies conducted to date.30 However, extensive studies with DESin rodent models predict marked abnormalities in the adult prostate, includingincreased susceptibility to adult-onset carcinogenesis following early DESexposures.31–33
334 Chapter 12

12.2.2.2 BPA
BPA is a synthetic polymer used in the production of polycarbonate plasticsand expoxy resins and significant levels have been found in the urine of 93% ofUS population in a recent screen by the Centers for Disease Control andPrevention.34 The relative binding affinity of BPA for either nuclear ERa andERb or capacity for BPA to activate ER-dependent transcription is B10 000lower than estradiol or DES.35,36 While these data might suggest that BPA hasminimal estrogenic activity, 1 mM BPA is 50% as efficacious as 1 mM17b-estradiol in activating an estrogen-responsive luciferase reporter.37 Thisindicates that, although BPA may have a significantly lower potency thanendogenous estrogens in vitro, it is a full agonist for both ERa and ERb.Furthermore, BPA induces ER through non-genomic pathways with an EC50equivalent to 17b-estradiol, suggesting that in vivo estrogenic activity of BPAmay be due to non-genomic activation of ER.38,39 The effects of BPA withregard to carcinogenic potential, including the prostate gland, have recentlybeen reviewed by an expert panel.40 In short, there is evidence from rodentmodels and human prostate cell lines that BPA can influence carcinogenesis,modulate PC cell proliferation, and for some tumors, stimulate progression.The recent reports have provided evidence that early life exposure to BPA mayincrease susceptibility to hormonal carcinogenesis in the prostate gland,possibly by developmentally reprogramming carcinogenic risk.41 Studies usinga rat model showed that brief neonatal exposure to a low dose of BPA(10 mg kg�1 BW per day) significantly increased the incidence and grade ofprostatic intraepithelial neoplasia following adult estrogen exposure. Thismodel of sensitivity to hormonal carcinogenesis is relevant to humans in thatrelative estradiol levels increase in the aging male and may contribute toprostate disease risk.42 Global analysis of the DNA methylome in prostatesneonatally exposed to BPA revealed that multiple genes involved in signalingpathways have permanent DNA methylation alterations that directly lead tocomplex changes in gene transcription programs throughout life.41,43 Alteredexpression of DNA methyl transferases (Dmnt 3a and b) and methyl bindingproteins (MBDs) by early-life exposures may underpin the DNA methylationmodifications.43 Together, these findings indicate that early-life exposures toECs may increase susceptibility to prostate carcinogenesis through epigeneticreprogramming.
12.2.2.3 PCBs
Persistent organic pollutants, such as PCBs, are fat soluble chemicals thatbioaccumulate in the human body. Many have estrogenic or anti-androgenicactivity and as such, may perturb male reproductive activity. A recent analysisof adipose tissue concentrations of PCBs in Swedish men with and without PCrevealed a significant association between PCB levels in the higher quandrantsand PC odds ratio, with the most marked associations for PCB153 andtrans-chlordane.44 A more extensive epidemiologic study of capacitor
Environmental Chemicals and Prostate Cancer Risk 335

manufacturing plant workers highly exposed to PCBs revealed a strongexposure–response relationship for PC mortality.44 This supports previousfindings of correlations between PCB 153 and 180 and PC risk in electric utilityworkers.45,46 While estrogenic activity of these compounds is a suspected modeof action, there is also evidence that PCBs inhibit estrogen sulfotransferaseactivity in the liver and effectively increase bioavailable estrogen in the body.25
Recently, Aroclor-1254, a mixture of 60 PCB pollutants, was tested on ratprostate cells in vitro and shown to disrupt gap junctions and expression ofconnexin 32 and 43, and increase double-stranded DNA breaks, suggesting thatPCBs may be able to transform prostate cells leading to carcinogenesis.47
Further investigation using animal models is warranted for PCBs and PC risk.
12.2.2.4 Ultraviolet (UV) Filters
There are a few recent reports that UV light filters used to protect against thesun have estrogenic activity.48 Specifically, 4-methylbenzylidene camphor and3-benzylidene camphor are ERb ligands.49 While little, if any, work has beendone with regard to these UV filters and human PC, a few recent reportsindicate that developmental exposure to the compounds can alter prostategland development and estrogen target gene expression in the rat.48,50 Thisraises the possibility that the fetal prostate may be affected following maternaluse of these compounds.
12.2.2.5 Atrazine
Atrazine at environmentally relevant levels has been shown to result in chronicprostatitis in rats, which is believed to be a predisposing factor to PC.51
Atrazine exposure was associated with a 4–6 fold increase in PC in menworking in an atrazine production facility;52,53 however, this was refuted in asubsequent case-controlled analysis of these workers.54 Furthermore, a largeepidemiologic study of California agriculture workers exposed to atrazinefound no increased risk for PC.55 Atrazine stimulates aromatase activity, thusresulting in elevated circulating estradiol and reduced testosterone levels, andthis shift in the estradiol : testosterone ratio is known to contribute to prostatediseases in several animal model systems. Furthermore, atrazine exposure andits resultant elevation in estradiol have been shown to elevate circulatingprolactin levels, which have also been correlated with increased PC risk. Thusindirect effects of atrazine on prostate disease risk are likely attributable to thehormonal perturbations elicited by this chemical.
12.2.2.6 Cadmium
Cadmium is known to bind to ERs and function as an estrogenic mimic. Whilesome large epidemiologic reports have indicated a relationship betweencadmium exposure and PC rates, others have refuted these findings.56
Nonetheless, there are intriguing reports in the literature which show that
336 Chapter 12

cadmium has proliferative action with human prostate cells in vitro, through anER-dependent mechanism, and that this exposure is associated with acquisitionof androgen independence.57 Furthermore, prostatic tumors have been shownto be experimentally induced by oral exposure to cadmium.58 Since cadmiumbioaccumulates in the body, further epidemiologic analysis of cadmium and PCrisk is warranted, particularly in men with occupational exposures.
12.2.2.7 Arsenic
Arsenic is a semi-metallic element found naturally in soils, ground water andsurface water, and is a notable carcinogen at environmentally relevantdoses.59–61
Exposure to inorganic arsenic (iAs) is widespread for humans with millionsexposed to potentially harmful levels worldwide, primarily through drinkingwater and food, as well as occupational inhalation exposure (http://www.epa.gov/teach/).
The US-EPA standard for arsenic in drinking water is 10 ppb; however,geographic hotspots exist in the southwest US, Bangladesh, Taiwan andelsewhere with excessive drinking water levels, reaching 200 to 4500 ppb. In2009, the International Agency for Research on Cancer classified arsenics as‘‘carcinogenic to humans’’ based on sufficient evidence in humans for lung,skin, and urinary bladder cancers. Additionally, epidemiology and animalstudies show heightened risk for PC with chronic iAs exposure.62–64
Epidemiologic studies have shown an association between arsenic exposureand PC mortality in Taiwan, a finding that was substantiated by a later study inthe United States.59,65 In this context, there is a recent report that arsenic caninduce malignant transformation of prostate epithelial cells in vitro and drivethem toward an androgen-independent state.66 Importantly, it has beendocumented that arsenic may mediate some of these effects through endocrinedisruption, specifically through interaction and interference with multiplesteroid receptor family members, including ERs, ARs, and retinoid acidreceptors/retinoid X receptors, perhaps through common zinc-finger inter-actions.66,67 Thus it is possible that endocrine disruption by arsenic cancontribute to PC risk.
12.2.3 Anti-Androgens
While there are no known environmental androgens, environmental chemicalscan also function through anti-androgenic pathways. Since prostate cancer isan androgen-dependent disease, we will briefly examine the known effects ofsome of these agents on the prostate gland.
12.2.3.1 Vinclozolin
Vinclozolin is a fungicide that is used as a pesticide on crops. It has known anti-androgenic properties, interfering with AR activity.68 Since vinclozolin effects
Environmental Chemicals and Prostate Cancer Risk 337

are driven through AR antagonism, it is not surprising that there are noreported associations between this compound and PC, an androgen-dependentdisease. Exposure of rats to vinclozolin during development results in reducedprostate gland growth and size, which would be expected for an anti-androgen.69 Of interest, however, are recent studies with maternal (i.e. in utero)exposure to vinclozolin in rats which produce transgenerational effects onoffspring through epigenetic alterations.69 These permanent perturbationsinclude adverse consequences on the prostate gland, such as premature acinaratrophy and aging-associated prostatitis for four generations.70 This may beparticularly significant in light of recent evidence that chronic inflammationmay play a role in prostate cancer initiation.71
12.2.3.2 Dichlorodiphenyltrichloroethane/dichlorodiphenyl-dichloroethylene (DDT/DDE)
DDT and its metabolic derivative p,p0-DDE were widely used as pesticides in theUnited States, and they are still used in other countries worldwide. In addition toAR antagonistic effects,72 p,p0-DDE at high concentrations has been shown tofunction as an inhibitor of 5a-reductase, the intraprostatic enzyme responsiblefor converting testosterone to the more potent androgen, dihydrotestosterone.73
While many reproductive abnormalities, including reduced prostate growth,have been attributed to DDT/DDE exposure, there is limited data for anexposure to DDT/p,p0-DDE and PC risk. A recent assessment of pesticideexposures in British Columbia farmers noted a significant association betweenDDT exposure and PC risk (odds ratio¼ 1.68) and this deserves follow-upinvestigations in other populations and cohorts.18
12.2.4 Dioxins
Dioxins [polychlorinated dibenzo-p-dioxins (PCDDs)] resist degradation and arethus considered persistent organic pollutants. 2,3,7,8-tetrachlorodibenzo-p-dioxin (TCDD) is the most toxic dioxin and causes a variety of effects,including immunotoxicity, hepatotoxicity, teratogenicity, and tumorpromotion.74 Changes in gene expression induced by TCDD and relatedchemicals are initiated by binding to the aryl hydrocarbon receptor (AhR),75 andcrosstalk between AhR and ERa is well established. Activated AhR inhibits ERactivity through several mechanisms, whereas ERa has a positive role in AhRsignaling.76 Additionally, an inverse relationship was found between serumTCDD levels and serum testosterone in chemical production workers.77
Adult TCDD exposure at general population levels is associated with adecreasing risk of benign prostate hyperplasia (BPH) with higher exposurelevels.78 Further, TCDD increased tumor-free survival in transgenic TRAMPmice that spontaneously develop PC, while AhR activation decreased lymphnode metastasis, suggesting that TCDDs may protect against prostate cancer inadulthood. In contrast, in utero exposure to TCDD in mice interferes with
338 Chapter 12

prostate bud patterning and is associated with hyperplastic lesions in agedanimals. Together, these findings suggest that timing of TCDD exposures maydictate their effects on subsequent prostate disease.79
12.3 Environmental Chemicals and Prostate
Stem/Progenitor Cells
The prostate gland contains a simple columnar epithelium with three differ-entiated cell types— basal, luminal, and neuroendocrine—that are embedded ina fibro-muscular stroma.80,81 The major epithelial cell population is luminalsecretory cells, which express cytokeratins (CK) 8/18 and AR and areandrogen-dependent for growth, survival, and production of secretory proteinssuch as prostate specific antigen (PSA). Basal epithelial cells are interspersedalong the basement membrane and express p63 and CK5 but are largely ARnegative and androgen-independent. The scarce population of neuroendocrinecells is scattered within the basal layer and is identified by the expression ofchromogranin A and synaptophysin. Strong evidence now exists for thepresence of a rare population of adult stem cells within the human prostategland; these cells are capable of self-renewal, as well as differentiation into earlyprogenitor cells, which give rise to the three differentiated epithelial cellpopulations.81–85
It is widely accepted that adult stem cells are involved in normal tissuereplenishment throughout life, while cancer stem cells support cancergrowth,86,87 although the cell(s) of origin for prostate cancer may includeluminal, basal, neuroendocrine, progenitor, and stem cells.81,88 It is increasinglyevident that the resultant prostate cancers contain cancer stem cells thatcontinuously seed and maintain tumor growth.89,90 As the property of self-renewal allows for a long life span of stem cells, undifferentiated stem/progenitor cells are highly susceptible to environmental injuries over time andhave the capacity to transmit their ‘‘injury memory’’ to the differentiatedprogeny.91 Since the prostate gland is most susceptible to environmental insultsduring early development, it is reasonable to predict that prostate stem andearly stage progenitor cells may be the primary targets of estrogenic exposuresthroughout life.7
Recently, our laboratory reported that that human prostate stem/progenitorcells from normal, disease-free prostates express high levels of estrogenreceptors, including ERa, ERb, and GPR30, and exhibit a proliferativeresponse to 1 nM 17b-estradiol.13 New studies using side-population fluor-escence activated cell sorting (FACS) analysis of primary prostate epithelial cellcultures (Hoechst 33342 exclusion with and without verapamil) show a dose-dependent increase in human prostate stem cell numbers after 4 days of culturein 10–1000 nM E2 (Figure 12.1 A). Together, these results demonstrate thatnormal human prostate stem and progenitor cells are responsive to estrogenswith increased rates of self-renewal, implicating them as direct estrogen targets.Furthermore, treatment of primary prostate epithelial cells with 10 nM BPA
Environmental Chemicals and Prostate Cancer Risk 339

Figure 12.1 Effects of E2, BPA, arsenite and dioxin on prostate stem/progenitor cell proliferation, evaluated by side population analysis andprostasphere assay. (A) E2 (10–1000 nM) treatment increased the percentage of side population cells (R1) at all doses, asmeasured by Hoechst 33342 dye efflux using flow cytometry analysis. Prostate epithelial cells were stained with 5mgmL�1 ofHoechst 33342 either in the absence (graphs shown) or presence (not shown) of 50 mM of verapamil hydrochloride beforeanalysis. (B) BPA (10 nM) treatment also increased the percentage of side population cells (R1). (C) Dioxin (100 ngmL�1)treatment increased the percentage of side population cells (R1).
340
Chapter
12

increased the percentage of side population of prostate stem/progenitor cells(Figure 12.1 B), similar to the E2 exposures. Dioxin (100 ngmL�1) markedlyincreased side population numbers in 2-D prostate epithelial cell cultures,indicating a stimulation of stem cell self-renewal (Figure 12.1 C).13 Together,these findings support the hypothesis that ECs may target the prostate stem andearly-stage progenitor cell populations which may contribute to increasedprostate cancer risk following exposures.
12.4 Conclusion
There is accumulating and consistent evidence that exposures to ECs over a lifetime are associated with an increased risk of PC. Published findings for theindividual chemicals are summarized in Table 12.1. While the findings forindividual compounds and classes of compounds may be somewhat limited andat times contradictory, the evidence must be considered as a whole. Overall,there are clear trends that support a link between early-life EC exposures, aswell as accumulation of persistent ECs throughout life, and an increased risk ofPC. This is supported with a wealth of research using animal models, as well asin vitro systems, that has allowed researchers to dissect potential mechanisms ofaction. Clearly, continued animal and epidemiologic studies are required overthe next several years to accurately determine risks of cancers as a function ofaccumulating ECs in the environment. These evaluations will be critical for theestablishment of proper guidelines and federal regulations regarding use,exposure, and dispersal of these compounds. The development of biomarkersfor EC exposures would also be of great future benefit to the medical andregulatory community as we try to link exposures with disease outcomes. Insummary, while there has been significant progress in determining human PCrisks from ECs, there is much that remains to be done in the decades to come.
References
1. R. Swerdloff and B. C. Robaire, Handbook of Andrology, The AmericanSociety of Andrology, 2010, p. 2-1.
2. B. R. Zirkin and B. C. Robaire, Handbook of Andrology, The AmericanSociety of Andrology, 2010, p. 4-1.
3. A. Jemal, R. Siegel, E. Ward, Y. Hao, J. Xu, T. Murray and M. J. Thun,CA: A Cancer Journal for Clinicians, 2008, 58, 71.
4. M. A. Eisenberger, B. A. Blumenstein, E. D. Crawford, G. Miller,D. G. McLeod, P. J. Loehrer, G. Wilding, K. Sears, D. J. Culkin,I. M. Thompson Jr., A. J. Bueschen and B. A. Lowe, N. Engl. J. Med.,1998, 339, 1036.
5. C. Huggins and C. F. Hodges, Cancer Res., 1941, 1, 293.6. S. J. Ellem and G. P. Risbridger, Nat. Rev, 2007, 7, 621.7. W. Y. Hu, G. B. Shi, H. M. Lam, D. P. Hu, S. M. Ho, I. C. Madueke,
A. Kajdacsy-Balla and G. S. Prins, Endocrinology, 2011, 152, 2150.
Environmental Chemicals and Prostate Cancer Risk 341

8. G. S. Prins, L. Birch, W. Y. Yang and S. M. Ho, Reprod. Toxicol., 2007,23, 374.
9. G. S. Prins and K. S. Korach, Steroids, 2008, 73, 233.10. F. Modugno, J. L. Weissfeld, D. L. Trump, J. M. Zmuda, P. Shea,
J.A. Cauley and R. E. Ferrell, Clin. Cancer Res., 2001, 7, 3092.11. M. C. Bosland and Urol, Oncol, 1996, 2, 103.12. D. L. LaSalle Jr. and S. H. Reuben, 2008–2009 Annual Report: The
President’s Cancer Panel, National Institutes of Health, Bethesda, MD,April 2010.
13. W. Y. Hu, G. B. Shi, D. P. Hu and G. S. Prins, Mol. Cell. Endocrinol.,2012, 354, 63.
14. H. Morrison, D. Savitz, R. Semenciw, B. Hulka, Y. Mao, D. Morison andD. Wigle, Am. J. Epidemiol., 1993, 137, 270.
15. M. C. Alavanja, C. Samanic, M. Dosemeci, J. Lubin, R. Tarone,C. F. Lynch, C. Knott, K. Thomas, J. A. Hoppin, J. Barker, J. Coble, D.P. Sandler and A. Blair, Am. J. Epidemiol., 2003, 157, 800.
16. T. E. Meyer, A. L. Coker, M. Sanderson and E. Symanski, Occup. Environ.Med., 2007, 64, 155.
17. G. Van Maele-Fabry, G. Libotte, J. Willems and D. Lison, CancerCauses Control, 2006, 17, 353.
18. R. R. Band, Z. A. Abonto, J. Bert, B. Lang, R. Fang, R. P. Gallagher andN. D. Le, Prostate, 2011, 71, 168.
19. R. Mahajan, M. R. Bonner, J. A. Hoppin and M. C. Alavanja, Environ.Health Perspect., 2006, 114, 1205.
20. K. A. Usmani, R. L. Rose and E. Hodgson, Drug Metab. Dispos., 2003,31, 384.
21. K. A. Usmani, T. M. Cho, R. L. Rose and E. Hodgson., Drug Metab.Dispos., 2006, 34, 1606.
22. N. Finnstrom, C. Bjelfman, T. Soderstrom, G. Smith, L. Egevad,B. Norlen, C. R. Wolf and A. Rane, Eur. J. Clin. Invest., 2001, 31, 880.
23. T. Lawson and C. Kolar, Cancer Lett., 2002, 175, 141.24. K. M. Sterling and K. R. Cutrineo, J. Cell Biol., 2004, 91, 423.25. M. H. Kester, S. Bulduk, D. Tibboel, W. Meinl, H. Glatt, C. N. Falany, M.
W. Coughtrie, A. Bergman, S. H. Safe, G. G. Kuiper, A. G. Schuur,A. Brouwer and T. J. Visser, Endocrinology, 2000, 141, 1897.
26. M. H. Kester, S. Bulduk, H. van Toor, D. Tibboel, W. Meinl, H. Glatt, C.N. Falany, M. W. Coughtrie, A. G. Schuur, A. Brouwer andT.J. Visser, J Clin. Endocrinol. Metab., 2002, 87, 1142.
27. I. Leav, S. Ho, P. Ofner, F. Merk, P. Kwan and D. Damassa, J. Natl.Cancer Inst., 1988, 80, 1045.
28. S. G. Driscoll and S. G. Taylor, Obstet and Gynecol, 1980, 56, 537.29. C. Y. Yonemura, G. R. Cunha, Y. Sugimura and S. L. Mee, Acta Anat.,
1995, 153, 1.30. R. M. Giusti, K. Iwamoto and E. E. Hatch, Ann. Intern. Med., 1995,
122, 778.31. J. Rajfer and D. S. Coffey, Invest. Urol, 1978, 16, 186.
342 Chapter 12

32. Y. Arai, T. Mori, Y. Suzuki and H. A. Bern, Int. Rev. Cytol., 1983,84, 235.
33. L. Huang, Y. Pu, S. Alam, L. Birch and G. S. Prins, J. Androl., 2004,25, 330.
34. A. M. Calafat, X. Ye, L. Y. Wong, J. A. Reidy and L. L. Needham,Environ. Health Perspect., 2008, 116, 39.
35. G. G. Kuiper, J. G. Lemmen, B. Carlsson, J. C. Corton, S. H. Safe,P. T. van der Saag, B. van der Burg and J. A. Gustafsson, Endocrinology,1998, 139, 4252.
36. J. G. Lemmen, R. J. Arends, P. T. van der Saag and B. van der Burg,Environ. Health Perspect., 2004, 112, 1544.
37. T. Kurosawa, H. Hiroi, O. Tsutsumi, T. Ishikawa, Y. Osuga, T. Fujiwara,S. Inoue, M. Muramatsu, M. Momoeda and Y. Taketani, Endocr. J., 2002,49, 465.
38. K. H. Song, K. Lee and H. S Choi, Endocrinology, 2002, 143, 2208.39. D. E. Walsh, P. Dockery and C. M. Doolan, Mol. Cell. Endocrinol., 2005,
230, 23.40. R. Keri, S. M. Ho, P. A. Hunt, K. E. Knudsen, A. M. Soto and
G. S. Prins, Reprod. Toxicol., 2007, 24, 240.41. S. M. Ho, W. Y. Tang, J. Belmonte and G. S. Prins., Cancer Res., 2006,
66, 5624.42. J. M. Kaufman and A. Vermeulen, Endocr. Rev., 2005, 26, 833.43. W. Y. Tang, L. M. Morey, Y. Y. Cheung, L. Birch, G. S. Prins and
S.M. Ho, Endocrinology, 2012, 153, 42.44. L. Hardell, S. O. Andersson, M. Carlberg, L. Bohr, B. van Bavel,
G. Lindstrom, H. Bjornfoth and C. J. Ginman, Occup. Environ. Med.,2006, 48, 700.
45. L. E. Charles, D. Loomis, C. M. Shy, B. Newman, R. Millikan,L. A. Nylander-French and D. Couper, Am. J. Epidemiol., 2003, 157, 683.
46. J. M. Ritchie, S. L. Vial, L. J. Fuortes, H. Guo, V. E. Reedy andE. M. Smith, J. Occup. Environ. Med., 2003, 45, 692.
47. F. Cillo, M. de Eguileor, F. Gandolfi and T. Brevini, Endocr.-Relat.Cancer, 2007, 14, 257.
48. M. Schlumpf, P. Schmid, S. Durrer, M. Conscience, K. Maerkel,M. Henseler, M. Gruetter, I. Herzog, S. Reolon, R. Ceccatelli, O. Faass,E. Stutz, H. Jarry, W. Wuttke and W. Lichtensteiger, Toxicology, 2004b,205, 113.
49. M. Schlumpf, H. Jarry, W. Wuttke and W. Lichtensteiger, Toxicology,2004a, 199, 109.
50. M. D. Anway, A. S. Cupp, M. Uzumcu and M. K. Skinner, Science, 2005,308, 1466.
51. T. E. Stoker, C. Robinette and R. L. Cooper, Toxicol. Sci., 1999, 52, 68.52. P. A. MacLennan, E. Delzell, N. Sathiakumar, S. L. Myers, H. Cheng,
W. Grizzle, V. W. Chen and X. C. Xu, J. Occup. Environ. Med., 2002,44, 1048.
53. J. Sass, J. Occup. Environ. Med., 2004, 45, 343.
Environmental Chemicals and Prostate Cancer Risk 343

54. P. A. Hessel, R. Kalmes, T. J. Smith, E. Lau, P. J. Mink and J. Mandel,J. Occup. Environ. Med., 2004, 46, 379.
55. J. A. Rusiecki, A. De Roos, W. J. Lee, M. Dosemeci, J. H. Lubin,J.A. Hoppin, A. Blair and M. C. Alavanja, J. Natl. Cancer Inst., 2004,96, 1375.
56. M. E. Parent and J. Siemiatycki, Epidemiologic Reviews, 2001, 23, 138.57. L. Benbrahim-Tallaa, J. Liu, M. M. Webber and M. P. Waalkes, Prostate,
2007b, 67, 135.58. M. P. Waalkes, J. Inorg. Biochem., 2000, 79, 241.59. C. J. Chen, T. Kuo and M. Wu, Lancet, 1988, 1, 414.60. W. H. Watson and J. D. Yager, Toxicol. Sci., 2007, 98, 1.61. K. Straif, L. Benbrahim-Tallaa, R. Baan, Y. Grosse, B. Secretan, F. El
Ghissassi, V. Bouvard, N. Guha, C. Freeman, L. Galichet andV. Cogliano, Lancet Oncol., 2009, 10, 453.
62. L. Benbrahim-Tallaa and M. P. Waalkes, Environ. Health Perspect., 2008,116, 158.
63. C. Y. Yang, C. C. Chang and H. F. Chiu, J. Toxicol. Environ. Health,Part A, 2008, 71, 1559.
64. E. J. Tokar, L. Benbrahim-Tallaa, J. M. Ward, R. Lunn, R. L. Sams andM. P. Waalkes, Crit. Rev. Toxicol., 2010, 40, 912.
65. D. R. Lewis, J. W. Southwick, R. Ouellet-Hellstrom, J. Rench andR. Calderon, Environ. Health Perspect., 1999, 107, 359.
66. J. C. Davey, J. E. Bodwell, J. A. Gosse and J. Hamilton, Toxicol. Sci.,2007, 98, 75.
67. X. Zhou, X. Sun, K. L. Cooper, F. Wang, K. J. Liu and L. G. Hudson,J. Biol. Chem., 2011, 286, 22855.
68. R. Kavlok and A. Cummings, Crit. Rev. Toxicol., 2005, 35, 721.69. W. Yu, B. Lee, S. Nam, B. Ahn, J Hong, J. Do, Y. Kim, Y. Lee and
Y. Yun, J. Vet. Med. Sci, 2004, 66, 847.70. L. Benbrahim-Tallaa, M. M. Webber and M. P. Waalkes, Environ. Health
Perspect., 2007, 115, 243.71. W. G. Nelson, T. L. DeWeese and A. M. DeMarzo, Cancer Metastasis
Rev., 2002, 21, 3.72. L. E. Gray, C. Wolf, C. Lambright, P. Mann, M. Price, R. L. Cooper and
J. Ostby, J. Toxicol. Ind. Health, 1999, 15, 94.73. S. Lo, I. King, A. Allera and D. Klingmuller, Toxicol. In Vitro, 2007,
21, 502.74. N. Kuroda, Y. Kinoshita, Y. Sun, M. Wada, N. Kishikawa,
K. Nakashima, T. Makino and H. Nakazawa, J. Pharm. Biol. Anal, 2003,30, 1743.
75. M. Kuroda, K. Oikawa, T. Ohbayashi, K. Yoshida, K. Yamada,J. Mimura, Y. Matsuda, Y. Fujii-Kuriyama and K. Mukai, FEBS Lett,2005, 579, 167.
76. J. Matthews and J. A. Gustafsson, Nucl. Recept. Signal, 2006, 4, e016.77. G. M. Egel, M. H. Sweeney, M. A. Fingerhut, K. K. Wille,
T.M. Schnorr and W. E. Halperin, Am. J. Epidemiol., 1994, 139, 272.
344 Chapter 12

78. A. Gupta, N. Ketchum, C. G. Roehrborn, A. Schecter, C. C Aragaki andJ. E. Michalek, Environ. Health Perspect., 2006, 114, 1649.
79. C. M. Vezina, T. M. Lin and R. E. Peterson, Biochem. Pharmacol., 2009,77, 566.
80. J. T. Isaacs, E. R. Barrack, W. B. Isaacs and D. S. Coffey in The ProstaticCell: Structure and Function-Part A, (eds) G. P. Murphy, A. A. Sandburgand J. P. Karr, Publisher: Alan R Liss, New York, 1981, p. 1–24.
81. X. Wang, M. Kruithof-de Julio, K. D. Economides, D. Walker, H. Yu, M.V. Halili, Y. P. Hu, S. M. Price, C. Abate-Shen and M. M. Shen, Nature,2009, 461, 495.
82. P. E. Burger, X. Xiong, S. Coetzee, S. N. Salm, D. Moscatelli, K. Goto andE. L. Wilson, Proc. Natl. Acad. Sci. U. S. A., 2005, 102, 180.
83. A. De Marzo, W. Nelson, A. Meeker and D. Coffey, J. Urol., 1998,160, 2381.
84. K. G Leong, B. E. Wang, L. Johnson and W. Q. Gao, Nature, 2008,456, 804.
85. J. Miki and J. Rhim, Prostate Cancer Prostatic Dis., 2008, 11, 32.86. S. C. Presnell, B. Petersen and M. Heidaran, Semin. Cell Dev. Biol., 2002,
13, 369.87. S. Smith, W. Neaves and S. Teitelbaum, Science, 2007, 316, 5830.88. S. Kasper, Stem Cell Rev., 2008, 4, 193.89. G. Gu, J. Yuan, M. Wills and S. Kasper, Cancer Res., 2007, 67, 4708.90. S. Kasper, Urol. Oncol., 2009, 27, 301.91. A. S. Cheng, A. C. Culhane, M. W. Chan, C. R. Venkataramu, M. Ehrich,
A. Nasir, B. A. Rodriguez, J. Liu, P. S. Yan, J. Quackenbush, K.P. Nephew, T. J. Yeatman and T. H. Huang, Cancer Res., 2008, 68, 1786.
Environmental Chemicals and Prostate Cancer Risk 345

CHAPTER 13
The Aging Kidney and Exposureto the Nephrotoxic MetalsCadmium and Mercury
CHRISTY C. BRIDGES* AND RUDOLFS K. ZALUPS
Mercer University School of Medicine, Division of Basic Medical Sciences,Macon, Georgia 31207, USA*E-mail: [email protected]
13.1 Introduction
Aging is an inevitable fact of life. Owing to advances in modern medicine overthe past century, the life-expectancy of humans in developed and developingcountries has lengthened significantly. According to the World HealthOrganization, the global life expectancy has risen from 64 years in 1990 to 68years in 2011.1 In developed countries such as the United States, the average lifeexpectancy has increased from 47.3 years in 1900 to 77.9 years in 2007.2 Similartrends exist for other developed and developing countries, such as the UnitedKingdom, Japan, Chile and Sri Lanka. Increases in life expectancy have led toan increase in the aged and elderly population. World-wide, it is currentlyestimated that approximately 650million individuals are over the age of 60.Because of lengthening life expectancies, this figure is expected to increase to2 billion by 2050.1 In the United States alone, the percentage of individuals overthe age of 65 has increased approximately tenfold in the past century. In 1900,
Issues in Toxicology No. 16
Aging and Vulnerability to Environmental Chemicals: Age-related Disorders and their Origins in
Environmental Exposures
Edited by Bernard Weiss
r The Royal Society of Chemistry 2013
Published by the Royal Society of Chemistry, www.rsc.org
346

approximately 3.1million individuals, or 4.1% of the population, were over theage of 65. This number increased to approximately 35million (12.4% of thepopulation) in 2000.3 A thorough understanding of the impact of aging onorgan systems, such as the kidney, will be critical when managing the healthcareof elderly and aged individuals. Furthermore, aging may enhance individualsusceptibility to disease as well as increase one’s risk of being negatively affectedby exposure to environmental and/or occupational toxicants. Because ofincreased life expectancy and increased pollution in the environment, it is likelythat elderly and aged individuals will be exposed more often and possibly tohigher levels of toxic pollutants than individuals were decades ago. Given thistrend, it is important that we understand not only the normal aging process, butalso the effects of exposure of aging individuals to potential nephrotoxicants,such as the toxic metals cadmium (Cd) and mercury (Hg).
13.2 Aging and the Normal Kidneys
Aging results in many deleterious structural and physiological changes in thekidneys. These changes may be related entirely to renal cell senescence or,alternatively, they may be consequences of multiple factors, such as age-relatedhemodynamic changes, renal or non-renal disease, and/or life-long exposure toenvironmental and/or occupational toxicants. The aging kidneys are capable ofmaintaining normal renal function and systemic homeostasis in healthy indi-viduals, despite the fact that the normal aging process has been shown to havesignificant deleterious structural and physiological consequences. Thesechanges are thought to significantly affect the functional reserve of the kidneysin that the kidneys have a reduced capacity to respond to challenges such aschanges in hemodynamics and exposure to toxicants. Because of this reductionin functional reserve, the kidneys, and possibly other organs, may be moresusceptible to physiologic, pathologic, and toxicologic challenges.
13.2.1 Structural Changes within the Glomerulus
One of the primary targets of the aging process is the renal glomerulus.Significant ultrastructural changes occur within numerous glomeruli as a resultof the normal aging process. Indeed it has been reported that approximately30%–40% of all glomeruli become sclerotic by the eighth decade of life.4–7
Structural characteristics of a typical sclerotic glomerulus include a thickenedglomerular basement membrane (GBM), expanded mesangial matrix, andshrinkage and occlusion of the glomerular capillaries (Figure 13.1).6,8–10
Although the pathogenesis of this process is not completely understood, it isthought that age-related glomerulosclerosis and the resulting drop inglomerular filtration rate (GFR) are the results of multiple factors, includingincreased susceptibility to inflammatory cytokines, alterations in blood flow,and damage to the glomerular filtration barrier (Figure 13.2).11–13 A reductionin the total number of functioning nephrons appears to be an additional
The Aging Kidney and Exposure to the Nephrotoxic Metals Cadmium and Mercury 347

contributing factor in the development of glomerulosclerosis. As nephrons arelost, vascular and glomerular changes occur in remaining functional nephronsin an attempt to compensate for the reduction in GFR.11,15 These changes leadto glomerular hypertrophy, hyperperfusion, and hyperfiltration, which increasethe single nephron GFR (SNGFR) and thus predispose affected glomeruli tosclerotic changes.11,16–18
Indeed a positive correlation between glomerular hypertrophy and thedevelopment of glomerulosclerosis has been demonstrated in aging mice.19 Inaddition, proliferation of mesangial cells and expansion of mesangial matrix,both of which are often associated with glomerular hypertrophy, appear toprecede and contribute to the development of glomerulosclerosis.20 Alter-natively, age-related glomerulosclerosis may occur via immunologicmechanisms whereby formation of circulating or in situ immune complexesleads to glomerulonephritis.13
Interestingly, glomeruli in the outer cortex appear to be affected earlier andmore severely by sclerotic changes than those in the juxtamedullaryregion.6,21,22 As cortical glomeruli degenerate, glomerular capillaries atrophy,which leads to sclerosis. Interestingly, in juxtamedullary glomeruli, a directchannel is formed between the afferent and efferent arterioles, resulting in
Figure 13.1 Glomeruli of young rats display normal glomerular morphology(a) [periodic-acid Schiff (PAS) stain]; At 24 months of age rat kidneyscontained glomeruli that were characteristic of both focal segmentalglomerulosclerosis (b) and global glomerulosclerosis (c). Adhesions(arrow) between Bowman’s capsule and the glomerular tuft were alsoobserved in some glomeruli (d) [Silver stain]. (400�).Reprinted with permission from Ref. 14.
348 Chapter 13

arterioles that do not communicate hemodynamically with a glomerulus.11 Ingeneral, these aberrant glomeruli tend to be larger than other corticalglomeruli; therefore, a significant reduction in the functionality of this popu-lation of glomeruli likely leads to significant reductions in whole-body GFR.An important marker of glomerular damage is proteinuria, which results froma disruption of the glomerular filtration barrier. Indeed recent studies havesuggested that injury to and dysfunction of podocytes, which are keycomponents of the glomerular filtration barrier, may play a role in thepathogenesis of age-related glomerulosclerosis.23–25
Continued glomerular hypertrophy & damage
Increased SNGFR
Tubular Fibrosis
Glomerular Damage
Interstitial Fibrosis
Glomerular Hypertrophy
Hyperperfusion & Hyperfiltration
Aging
InflammationArterial Damage
Alterations in GBM
Glomerulosclerosis
RenalInsufficiency
Figure 13.2 Possible pathogenesis of age-related glomerulosclerosis. Many factorshave been proposed to contribute to age-related glomerulosclerosis; theseinclude hemodynamic and structural alterations at the site of theglomerulus. These changes may lead to glomerular hypertrophy followedby hyperperfusion and hyperfiltration of affected glomeruli. Owing tothese hypertrophic changes, single nephron glomerular filtration rateincreases and may lead to glomerular injury, and ultimately glomeru-losclerosis and renal insufficiency.
The Aging Kidney and Exposure to the Nephrotoxic Metals Cadmium and Mercury 349

13.2.2 Structural Changes in Renal Tubules and Interstitium
Age-related changes have also been observed within renal tubules. Thesechanges include atrophy and degeneration, formation of diverticula, irregularthickening of the tubular basement membrane, and tubulointerstitial fibrosis,which is associated with interstitial inflammation, fibroblast activation, andincreased deposition of collagen.10,26–28 Ding and colleagues26 examinedsenescent tubular epithelial cells and found increased expression of trans-forming growth factor b-1 (TGF-b1), which plays a role in cell cycle regulation,and p21WAF1/CIP1, a cyclin-dependent kinase inhibitor thought to be involvedin regulating cell growth. Although the reason for the upregulation of TGF-b1and p21WAF1/CIP1 is unclear, it is possible that this increased expression leads toa dysregulation of the cell cycle and consequently, cell growth. Similarly,increased expression of genes such as the hypoxia-inducible factor 1 (HIF-1),which mediates cell and tissue responses to hypoxia,29 appears to play a role inthe development of interstitial fibrosis.30 In addition, accumulations ofmacrophages and myofibroblasts, which are involved in collagen deposition,have been shown to be present in interstitial areas of fibrosis.31 Given thepresence of myofibroblasts, it is not surprising that increased deposition ofcollagens (types I and III),31 as well as noncollagenous proteins,27 has beendetected in the interstitial space of fibrotic nephrons. This deposition is thoughtto contribute to fibrosis and expansion of the interstitium. An increase inapoptosis of tubular and interstitial cells has also been observed in areas offibrosis.10 This apoptosis may be one reason for the documented decreases involume, length, and number of tubular segments from fibrotic nephrons.13,28,32
As a consequence of these structural changes, alterations in tubular functionare also likely to occur. These alterations include a reduced ability toconcentrate/dilute urine,33 maintain acid/base balance,34 and filter solutes,especially sodium.28,35
13.2.3 Physiologic Changes in the Kidney
Since the aging kidney is subjected to considerable changes in structure, it is notsurprising to find that GFR also changes significantly as the kidneyages.6,9,22,28,36,37 Estimates indicate that beginning at an age of 30–40 years,total GFR decreases by approximately 10% per decade of life.9,13,17,37,38 Therate of decline has been shown to increase after the age of 65.35,37,39 TheBaltimore Longitudinal Study of Aging, which collected data from patientsaged 17 to 96, over a 23-year period, found that creatinine clearance (i.e., GFR)declined by 0.75 mL min�1 per year.40,41 This decrease is most likely a conse-quence of multiple factors, including damage to and inadequate regeneration ofpodocytes, glomerulosclerosis, and an eventual reduction in the total number offunctioning nephrons.25,42,43 Interestingly, the findings from the BaltimoreLongitudinal Study suggested that GFR may not decrease in every patient.Although the overall findings of this study suggested that GFR is reducedsteadily over time, of the 254 patients evaluated, 92 (36%) showed no
350 Chapter 13

significant reduction in GFR.40 Since the publication of this study, weakness inthe design and analysis of data have been noted by others.44 Interestingly,several recent studies have proposed a link between one’s genetic backgroundand the tendency to develop age-related glomerular changes that lead toreductions in GFR.45–48 Thus individual genetic differences may account forthe lack of change in GFR observed in some patients. Despite the mixedfindings of the Baltimore Longitudinal Study, there is overwhelming evidenceto suggest that a decline in GFR is a normal consequence of aging.5,13,37,44
In addition to changes in GFR, aging also appears to affect renal blood flow(RBF) to the kidney.5,9,22 Maximum RBF is reached around the third decade,following which RBF has been shown to decrease by approximately 10% perdecade of life.6 This decrease appears to be related to changes in the vascularresistance in afferent and efferent arterioles rather than to changes in cardiacoutput49 or renal perfusion.50 Because the decrease in total GFR is generallyless than the decrease in RBF, filtration fraction (FF) increases in mostpatients.5,13,22,38 It should be pointed out that although overall RBF decreases,variable changes in blood flow occur at the level of the individual nephron.Within a single, hypertrophied nephron, RBF increases as a result of thehypertrophic changes that occur within that nephron.51,52 Increases in RBFmay lead to increased intraglomerular pressure, which may then lead toglomerular injury.
Renal functional reserve may also be altered in elderly and aged individuals.Renal functional reserve is the ability of the kidney to increase its basal RBFand GFR by 20% or more after a stimulus, such as a protein load.36,53 Studiesof renal functional reserve in elderly individuals have yielded mixed results.While some studies found that the functional reserve of the kidneys is preservedto some extent in healthy elderly individuals,54,55 a separate study reported thatrenal functional reserve is reduced or depleted in the elderly and aged, in orderto accommodate for the age-related decline in renal function and as an attemptto preserve normal renal function.56 Another study found that the renalfunctional reserve of the elderly remained intact, but its magnitude was lower inolder individuals than in younger individuals.57 Similarly, in vivo studies usingaged Sprague-Dawley rats provided evidence for an age-related decline in renalfunctional reserve.58 Moreover, it has been shown that functional reserve ofthe kidneys is decreased or absent in patients with diseases such as diabetesand hypertension.59–62
Aging and cell senescence also leads to changes at the cellular level. Undernormal conditions, the mitotic index for renal epithelial cells is low, withproliferation occurring in approximately 1% of renal tubular cells. Thispercentage declines with age and may impair the ability of renal tubules torepair themselves.63 Similarly, studies in mouse kidneys have shown that thenormal burst of proliferation observed following an acute insult to renaltubules is reduced in aged kidneys.64 These data are supported by the findingsof Shurin and colleagues, who assessed plasma levels of various cytokines inindividuals ranging from 45 to 78 years old65 and found that levels of insulin-like growth factor-1 (IGF-1) were lower in aged individuals.65 Others have
The Aging Kidney and Exposure to the Nephrotoxic Metals Cadmium and Mercury 351

reported decreases in epidermal growth factor (EGF).52 Furthermore, resultsfrom cDNA microarray profiling of genes from human kidneys indicate thatmany genes are down-regulated in aged kidneys. Most of these genes appear tobe related to energy metabolism, as well as nucleotide, amino acid, and proteinturnover. An increase in gene expression was noted in a selected set of genesresponsible for immune and inflammatory responses.47 Indeed, in separatestudies, increases in the expression of tumor necrosis factor (TNF)-a andinterleukin (IL)-6, which are both involved in inflammatory processes, werefound to be associated with aging.66–68 In addition to changes in cytokinesresponsible for growth and inflammation, it appears that aging also negativelyaffects the regulatory control of apoptosis, leading to an increase in the basallevels of apoptosis in the kidney.69
13.3 Aging and Kidney Disease
There is a clear association between aging and the development of kidneydisease. One can speculate that as the kidneys age, they lose their capacity tocope with certain challenges. Therefore, when an aged kidney is challenged,physiologically, pathologically, or toxicologically, renal function will likely beaffected. Indeed an epidemiological study analyzing 437 cases of acute renalfailure in Spain demonstrated that acute renal failure was 3.5 times moreprevalent in adults over the age of 70 than in younger adults.70 Similarly, ananalysis of data obtained from the Third National Health and NutritionExamination Study (NHANES) in the United States identified an associationbetween age and the incidence of chronic renal failure.71 It was noted that, evenin the absence of other diseases such as hypertension and diabetes,approximately 11% of individuals over the age of 65 have been diagnosed withmoderate to severe renal failure.71 The progression of renal failure alsoappeared to occur more rapidly in aged patients than in younger patients.71
Another study of elderly patients with acute or chronic renal failure suggestedthat older individuals are at greater risk of morbidity associated with theirdisease.72
Comorbidities such as hypertension and diabetes are common in the elderlypopulation and are likely to increase the susceptibility of individuals to renaldisease.73,74 In the United States, approximately 30% of the adult population isaffected by hypertension,75 the incidence of which has been shown to increasewith age. Approximately 70% of adults over the age of 65 have beendiagnosed with the disease.75 A similar trend exists for diabetes, which affectsapproximately 8% of the population in the United States.76 Of individuals aged65 and older, nearly 27% have been diagnosed with diabetes.76 The presenceof diseases such as hypertension and/or diabetes in aging patients likelyenhances the normal age-related decline in renal function compared withhealthy individuals.77 Therefore, it is reasonable to suggest that aged andelderly patients with superimposed diseases are more susceptible to thedevelopment of acute or chronic renal failure.
352 Chapter 13
It is also important to consider the increase in prescription drug use in theelderly and aged population. Aging not only leads to a reduction in renalfunction, but can also lead to a reduced ability to metabolize drugs and eliminatedrug metabolites.78 For example, non-steroidal anti-inflammatory drugs(NSAIDs) such as salicylate may be used frequently by aged and elderly indi-viduals. In fact, the use of these drugs by the aged and elderly population isestimated to be three times that of the younger population.78 In addition, timerequired to eliminate drugs such as salicylate has been shown to be greater in theelderly population than in younger individuals.79 This reduction may be due, inpart, to age-related loss of renal function. Considering the increased use andreduced elimination of certain drugs in the elderly and aged population, itis possible that the use of these drugs may predispose individuals to kidneydiseases, such as analgesic nephropathy (which often leads to renal insufficiencyor failure).
13.4 Aging and Exposure to Toxic Metals
Owing to naturally occurring and chemically manufactured toxicants in theenvironment, individuals are exposed frequently over their lifetime to toxicantsthat have the capacity to negatively affect various organ systems. Just as aging inthe presence of diseases can have a negative impact on renal function and mayenhance the development of renal disease, exposure of elderly and aged indi-viduals to nephrotoxicants may promote or enhance the progression of renaldisease. Since not all relevant nephrotoxicants can be addressed here, we willfocus on two prevalent environmental metal toxicants, cadmium and mercury.Because of their abundance in the environment and in numerous occupationalsettings, exposure of humans to each of these metal toxicants is nearlyunavoidable. The toxic effects of cadmium and mercury have been characterizedextensively and a great deal is known about the mechanisms by which they gainaccess to target cells. Based on that knowledge and the frequency of humanexposure, we have chosen to use cadmium and mercury as example nephrot-oxicants in our discussion of aging and exposure to toxic metals.
As discussed in previous sections, the major age-related change within thenephron is glomerulosclerosis. As the sclerotic process progresses andglomeruli become non-functional, this decrease in functional renal mass leadsto hypertrophy of remaining functional glomeruli. Glomerular and tubularhypertrophy is associated with hyperperfusion and an increase in SNGFR.80
Consequently, the luminal and basolateral surfaces of renal tubular epithelialcells are potentially exposed to higher levels of xenobiotics, metabolic wastes,and nephrotoxicants. In addition, these substances may be taken up morereadily by hypertrophied tubular cells because of increases in the expression ofcertain cellular transport mechanisms. The increased exposure to, and probableuptake of, available xenobiotics, metabolic wastes, and nephrotoxicants likelyenhances the risk of hypertrophied tubular cells being affected adversely bythese substances.11 These adverse effects could conceivably lead to additional
The Aging Kidney and Exposure to the Nephrotoxic Metals Cadmium and Mercury 353

cell death and glomerulosclerosis, which would further reduce the functionalrenal mass of the patient.
13.4.1 Cadmium
Cadmium (Cd) is a prevalent environmental pollutant and nephrotoxicant.Industrial uses of cadmium include manufacture of batteries, pigments,coatings, and plastics.81 Current regulations regarding cadmium emissionsand disposal have reduced occupational exposure to cadmium, yet theenvironments and surrounding areas where cadmium is/was used industriallyremain heavily contaminated. Additionally, the use of this metal in phosphatefertilizers can leave soil and water heavily contaminated with cadmium residue.Cadmium concentrates in soils and subsequently accumulates in plants,particularly root vegetables, as well as grains and tobacco.82 Cadmium is alsopresent in high concentrations in aquatic animals such as seals and mollusks,and in crustaceans such as oysters and crabs.82
Diet is the primary means by which the general, non-smoking population isexposed to cadmium.82 In contrast, individuals who smoke are exposed to thismetal primarily via the inhalation of cigarette smoke due to the high concen-tration of cadmium in tobacco.82 Each cigarette contains approximately 1–2 mgof cadmium.83 About 10% of the cadmium contained in a cigarette is inhaled,84
with approximately 50% of that being absorbed in the lungs.85 Therefore, it isestimated that individuals who smoke one pack of 20 cigarettes each day willabsorb approximately 1–2 mg of cadmium daily.86 Cadmium is also present inair and drinking water in various regions of the world, although the concen-tration of cadmium in air is relatively low and drinking water is generally not amajor source of exposure for the general population.82,86,87
In a recent assessment by the US Centers for Disease Control and Prevention,as part of the NHANES, blood and urine content of cadmium was analyzedin over 5000 individuals. In individuals over the age of 20, the average blood levelwas 0.376mgL�1 while the average urinary concentration of cadmiumwas 0.232mgL�1.88 Both urinary and blood levels of cadmium have remainedfairly steady over the past decade. These data suggest that individuals continueto be exposed chronically to cadmium. Thus, a thorough understanding of theeffects of exposure to cadmium on an organ system is important to overall humanhealth.
13.4.1.1 Renal Handling of Cadmium
Cadmium appears to gain access to renal epithelial cells by several differentmechanisms. When bound to the metal-binding protein, metallothionein (MT),it is thought to be taken up via receptor-mediated endocytosis. Cadmium is alsoa strong electrophilic cation, which enables it to compete for and interact withmembrane transporters that are involved in the uptake of nutritive metals, suchas calcium, iron, and zinc. Alternatively, cadmium(II) ions may form linearcomplexes with select sulfhydryl (thiol)-containing biomolecules, such as
354 Chapter 13

glutathione (GSH), cysteine (Cys), or homocysteine (Hcy).89,90 Thesecadmium-thiol complexes may gain access to cells at the site of membranetransporters normally involved in the transport of endogenous amino acids,oligopeptides, organic anions, or organic cations.91,92
Following exposure and absorption, a significant amount of cadmium istransported to the liver, where it becomes associated with MT to formCdMT.93,94 It is believed by numerous investigators that when cadmiuminduces hepatocellular necrosis, CdMT is released into sinusoidal blood. This isespecially true following acute exposure to nephrotoxic doses. CdMT is filteredfreely at the glomerulus and is then thought to be taken up at the luminalplasma membrane of proximal tubular epithelial cells via receptor-mediatedendocytosis.92,95–102 This route of uptake appears to be a major route ofproximal tubular entry for cadmium.103 Indeed, the cells of the proximalconvoluted tubule are the primary sites adversely affected byCdMT.93,97,99,104–108 Following uptake by proximal tubular cells, CdMT isdelivered to endosomes and lysosomes, where Cd21 is dissociated fromMT andtransported into the cytoplasm via the divalent metal transporter 1(DMT1).96,109 DMT1 is also localized in the luminal plasma membrane of theepithelial cells lining the ascending thick limb of the loop of Henle, the distalconvoluted tubule, and the principal cells of the cortical collecting duct,110
where it may play a role in the uptake of cadmium ions and lead to adverseeffects within these cells.
Cadmium ions may also be taken up from the proximal tubular lumen by amechanism involving ligand exchange. Cadmium may dissociate from MT orother ligands under certain conditions,111 and the process of ligand exchangemay allow the cadmium ion to exchange from a protein or non-protein thiol tothe binding site of a cation transporter. Certain zinc transporters appear to becapable of utilizing cadmium ions as substrates. ZIP8 (SLC39A8) and ZIP14(SLC39A14) have both been identified in the kidney and have been shownin vitro to mediate the uptake of cadmium ions into cultured renal epithelialcells stably transfected with either of these carriers.112–115 Cadmium ions andcomplexes appear to utilize additional mechanisms to gain access to renalepithelial cells; however, those mechanisms and processes remain unclear atpresent.
13.4.1.2 Renal Effects of Cadmium Exposure
Exposure to cadmium can be assessed by measuring cadmium concentrationsin urine or blood. Urinary excretion of cadmium is considered to be a reliableindicator of renal and body burden and typically represents chronic levels ofexposure.86,116,117 In contrast, plasma levels of cadmium usually reflect a morerecent exposure, such as one occurring within the previous month.86,116,118
Cadmium has a long half-life within the body, partly due to its incorporationinto bone.81 Therefore, following exposure, decades may be required forcomplete elimination of this toxic metal.86
The Aging Kidney and Exposure to the Nephrotoxic Metals Cadmium and Mercury 355

Following chronic exposure to cadmium, approximately 50% of the totalbody stores accumulate in the kidney.119,120 Thus, it is not surprising to findthat this organ is a primary target of cadmium toxicity, which leads toreductions in GFR and generalized tubular dysfunction (i.e., Fanconi’ssyndrome).116,120,121 One of the earliest signs of renal damage is the presence ofurinary biomarkers, such as b2-microglobulin, N-acetyl-b-D-glucosamidase(NAG), and kidney injury molecule-1 (Kim-1).116 b2-microglobulin is a lowmolecular weight protein that is filtered freely at the glomerulus and is normallyabsorbed by proximal tubules.122 Following tubular damage, a small fractionof b2-microglobulin escapes absorption and is excreted in urine. Alternatively,NAG is derived from mitochondria within proximal tubular epithelial cells andthus, following cellular damage, this enzyme is released into tubular fluid foreventual elimination in urine.123 More recently, Kim-1, which is a trans-membrane protein not normally detectable in urine, has been shown to be auseful marker of renal tubular cell injury and/or death.124
Recently, studies have shown that chronic exposure to even low levels ofcadmium can result in early signs of renal toxicity.121,125–129 The earliest sign ofcadmium-induced renal damage is microproteinuria, which is usually identifiedby the presence of b2-microglobulin in urine.82,86 After exposure to greaterdoses of cadmium, tubular damage is evidenced by the presence of a Fanconi’ssyndrome, which is typically characterized by glucosuria, aminoaciduria,hyperphosphaturia, and hypercalciuria.82 In addition, the glomerulus is injuredand consequently, GFR declines. This decline results in increased detectablelevels of urinary protein.82,86,130 The incidence of kidney stones also increases inindividuals exposed chronically to (or to larger doses of) cadmium, possibly dueto the increased concentration of calcium in tubular fluid and urine.131 Owingto the fact that the active form of vitamin D (1,25 dihydroxy-cholecalciferol) isformed in the kidneys, it is possible that renal damage would impede theconversion of the inactive form of this vitamin to the active form. Indeed,studies from cadmium-polluted areas report an association between cadmium-induced renal damage and lowered plasma levels of active vitamin D.132,133
Interestingly, the renal changes that are observed following chronic exposure toa low dose of cadmium are similar to those observed with normal aging of thekidneys.86
13.4.1.3 Aging and the Effects of Cadmium Exposure on theKidneys
Epidemiological studies have demonstrated a positive correlation betweenage and the renal accumulation of cadmium in individuals exposed chronicallyto this metal.128,134 Since the normal filtration capacity of the kidney appears todecline with aging, exposure of elderly individuals to cadmium appears topotentiate the negative effects of age-related renal dysfunction. Consequently, itis reasonable to postulate that exposure of elderly and aged individuals tocadmium may be especially detrimental to target organs. In aged kidneys, the
356 Chapter 13

threshold at which nephrotoxic effects are observed may be lower than in thekidneys of a younger individual. Indeed, it has been suggested that long-termexposure to cadmium exacerbates the age-related decline in GFR.135,136
Moreover, exposure to cadmium or other nephrotoxicants may furtherreduce or completely eliminate the renal functional reserve and the ability of theremaining functional renal mass to maintain normal homeostasis whenchallenged.137–139 Sprague-Dawley rats exposed chronically to oral cadmiumhave been shown to have less renal functional reserve than unexposed rats.58
Similarly, in an epidemiological study assessing renal function in cadmium/zincsmelter workers with detectable amounts of cadmium in their urine, it wasfound that age-related reduction in renal functional reserve was enhancedfollowing exposures to cadmium that resulted in microproteinuria.140
Collectively, these studies suggest that exposure to cadmium, and perhapsother nephrotoxicants, can abolish renal functional reserve, which may increasethe susceptibility of these individuals to renal failure resulting from other riskfactors, such as hypertension and diabetes.
Given that smoking is a common route of exposure to cadmium, it is notsurprising to find that urinary and blood levels of cadmium increase with age incurrent smokers.128,141,142 Individuals who smoke may have blood cadmiumlevels as high as 4–5 times greater than that of non-smokers.86 This increasedexposure to cadmium may lead to an increased susceptibility of smokers to thenephrotoxic effects of cadmium. Furthermore, increased exposure to cadmiummay eventually play a role in the development of chronic kidney disease.
Aging kidneys are often characterized by areas of glomerular and tubularhypertrophy, hyperfiltration, and glomerulosclerosis. This pathologicalscenario is somewhat similar to the experimental model created by auninephrectomy. In uninephrectomized animals, the contralateral kidneyundergoes significant compensatory hypertrophy in order to maintain normalfluid and solute homeostasis.52,143 As part of the compensatory mechanism, thetranscription and translation of numerous proteins, including membranetransporters and metal-binding proteins (MT1 and MT2), are upregulatedsignificantly.52,143,144 An increase in the number and/or activity of transportproteins involved in the proximal tubular uptake of cadmium may enhance thenephropathy induced by this metal. When uninephrectomized and shamSprague-Dawley rats were exposed to cadmium, the renal burden of cadmiumwas greater in the contralateral kidney of uninephrectomized rats than in thecorresponding kidney of sham rats.108 In addition, urinary excretion of NAGand cadmium was greater in uninephrectomized rats than in sham rats.Furthermore, when a toxic dose of cadmium was administered to each group ofrats, it was found that uninephrectomized rats were more susceptible to thetoxic effects of cadmium than corresponding sham rats.108 Considering thesedata, it is logical to suggest that exposure to cadmium following a reduction infunctional renal mass may lead to more severe nephropathy.108
Diseases that affect renal health, such as hypertension and diabetes, arecommon in elderly and aged individuals. Therefore, it is important tounderstand the relationship between aging, cadmium exposure, and
The Aging Kidney and Exposure to the Nephrotoxic Metals Cadmium and Mercury 357

superimposed diseases. A link between aging and body levels of cadmiumfollowing chronic exposure has been clearly established. Similarly, numerousepidemiological and animal studies have provided evidence suggesting anassociation between exposure to cadmium and the occurrence and severity ofdiabetes.145,146 While diabetes alone may lead to decreased GFR, albuminuria,and morphological alterations along the nephron.147 chronic exposure tocadmium may enhance the onset of these negative renal effects.145 Indeed studiesin which normal Sprague-Dawley rats were injected intraperitoneally withcadmium showed that administration of cadmium induced hyperglycemia.148,149
This hyperglycemia may be the result of increases in levels of the gluconeogenicenzymes, glucose-6-phosphatase, fructose-1,6-diphosphatase, phosphoenolpyruvate carboxykinase, and pyruvate carboxylase.149 Exposure of rats tocadmium chloride also appears to decrease the gene expression and release ofinsulin.150–152 Taken together, these studies suggest that exposure to cadmiummay increase one’s susceptibility of developing diabetes. Exposure to cadmiummay also promote the development of signs and symptoms in a diabetic patient.Diabetes-induced renal pathology may be observed earlier in patients that areexposed chronically to low levels of cadmium compared with un-exposedpatients. This theory is supported by studies comparing streptozotocin-induceddiabetic Wistar rats and non-diabetic Wistar rats.153 The findings from thesestudies showed that urinary levels of protein, NAG, and g-glutamyltransferasewere greater in diabetic rats than in controls, suggesting that renal damagewas more extensive in diabetic rats.153 In addition, diabetic rats were found toexcrete less cadmium in urine and consequently had a greater renal burden ofcadmium than that of non-diabetic rats, suggesting the presence of glomerulardamage.153 In a similar study it was found that exposure of diabetic Sprague-Dawley rats to cadmium significantly increased the urinary excretion of albumin,transferring, and IgG.154 In a separate study, varying concentrations of CdMTwere injected into normal or obese hyperglycemic (ob/ob) mice.155 Pathologicalsigns of nephron damage (proteinuria and calciuria) were observed at lowerconcentrations of cadmium in the ob/ob mice than in normal mice, suggestingthat the hyperglycemic state increases susceptibility to cadmium-inducednephropathy.155
The results of multiple epidemiological studies correlate well with theaforementioned animal studies and provide additional support for the notionthat exposure to cadmium enhances the renal pathology associated withdiabetes. In a cross-sectional study carried out in the Torres Strait Islands,located between Australia and New Guinea, investigators identified a strongpositive correlation between urinary markers of cadmium exposure anddiabetic nephropathy.156 Similarly, a cross-sectional study of 1699 Belgiansubjects suggested that diabetic patients may be more susceptible to thenephrotoxic effects of cadmium.157 Moreover, Akesson and colleagues assessedthe effect of cadmium exposure on diabetes-induced renal dysfunction in 10 766subjects and reported that the nephrotoxic effects of cadmium exposure couldbe observed at lower levels in diabetic patients compared with non-diabeticpatients.121
358 Chapter 13

Interestingly, cadmium levels in men and women appear to differsignificantly. The body burden of cadmium in women tends to be significantlygreater than that in men. In a study of healthy Thai men and women, it wasfound that the average urinary excretion of cadmium in non-smoking womenwas similar to that of men who smoked cigarettes.158 In a study of 57 non-smoking women, it was found that urinary and blood levels of cadmiumcorrelated with age and body iron stores.159 Women with lower serum ferritinwere found to have higher levels of cadmium.159,160 In general, women havelower iron stores than men; when iron stores are low, the divalent metaltransporter 1 (DMT1) in the intestine is upregulated to facilitate increasedintestinal uptake of ferrous iron (Fe21).161 DMT1 has also been shown tomediate the intestinal uptake of cadmium;161,162 therefore, upregulation of thiscarrier could potentially increase the absorption of dietary cadmium ions fromthe lumen of the intestine. Indeed, it has been proposed that an increase inDMT1 expression and consequent increase in cadmium absorption is theprimary reason for the greater levels of cadmium detected in women.158–160
13.4.2 Mercury
Mercury is a toxic metal found in many environmental and occupationalsettings. It exists in elemental (metallic), inorganic, and/or organic forms.Elemental mercury (Hg0) is unique in that it exists as a liquid at roomtemperature. Inorganic mercury may be found as mercurous (Hg11) or mercuric(Hg21) ions, which are usually bonded with anionic species of chlorine, sulfur,or oxygen to form mercurous or mercuric salts. In the environment, inorganicmercury is usually found in the mercuric form. Organic forms of mercuryinclude phenylmercury, dimethylmercury, and monomethylmercury. Of theseforms, methylmercury (CH3Hg1) is the most frequently encountered in theenvironment. It is formed primarily when inorganic mercuric ions aremethylated by microorganisms present in soil and water.163–166
Humans may be exposed to mercury in occupational and environmentalsettings, as well as through dental amalgams, and medicinal and dietarysources.163,164,166,167 The majority of human exposure, however, results fromthe ingestion of food and water contaminated with CH3Hg1. Much of thedietary intake of this metal is via ingestion of large predatory fish, such asnorthern pike, salmon, swordfish, and shark, which may contain high levels ofCH3Hg1. Upon ingestion, CH3Hg1 is absorbed readily by the gastrointestinaltract of humans and other mammals.163 Mercuric ions can then enter systemiccirculation where they can be delivered to target organs.
13.4.2.1 Renal Handling of Mercury
Inorganic and organic forms of mercury accumulate readily in the kidney.While the kidney is the primary site of accumulation of and intoxication byinorganic forms of mercury, organic forms of mercury, which primarily affectthe central nervous system, also have serious toxicological effects in the
The Aging Kidney and Exposure to the Nephrotoxic Metals Cadmium and Mercury 359

kidney.168–171 Within this organ, the primary site of uptake and accumulationof mercuric species is the proximal tubule.166 It should be noted that followingexposure to CH3Hg1, a fraction of absorbed CH3Hg1 will be oxidized withintissues and cells to form Hg21.172–175 It is also important to note that withinbiological systems, mercurous, mercuric, or methylmercuric ions do not exist asinorganic salts, or in an unbound, ‘‘free’’ ionic state.176 Rather, mercuric ionsare found bonded to one or more thiol-containing biomolecules, such as GSH,Cys, Hcy, N-acetylcysteine (NAC), and albumin. For Hg21, this bondingoccurs in a linear II, coordinate covalent manner while thiol-conjugates ofCH3Hg1 form linear I, coordinate covalent complexes.179,180
Renal accumulation of as much as 50% of a nontoxic dose of Hg21 occursrapidly in the kidneys within a few hours of exposure.177 The vast majority ofthis Hg21 accumulates in the epithelial cells of the proximal tubule.166 Apreponderance of data collected in the past decade indicates that mercuric ionsgain access to proximal tubular cells viamechanisms present on both the luminaland basolateral plasma membranes.178–182 Early studies utilizing isolatedperfused proximal tubules indicate that the primary transportable, biologicalform of mercury across the luminal membrane of the proximal tubule is a CysS-conjugate (Cys-S-Hg-S-Cys).183–185 Additional studies in isolated perfusedtubules indicate that amino acid transporters located in the luminal plasmamembrane are likely involved in the uptake of mercuric conjugates from thetubular lumen.178,179 It has been hypothesized that since Cys-S-Hg-S-Cys issimilar in size and shape to the amino acid cystine, this mercuric conjugate maybe a substrate of a cystine transporter. Studies using Madin-Darby CanineKidney (MDCK) cells stably transfected with the sodium-independent cystinetransporter, system b0,1, provide strong evidence implicating this carrier in theuptake of Cys-S-Hg-S-Cys from the lumen into the proximal tubular cell.186
Similar studies have also identified the Hcy S-conjugate of Hg(Hcy-S-Hg-S-Hcy) as a substrate for system b0,1.187 To our knowledge, asodium-dependent mechanism for the luminal uptake of Cys-S-Hg-S-Cys andHcy-S-Hg-S-Hcy by proximal tubular cells has not yet been identified. Incontrast, experimental evidence from Xenopus laevis oocytes indicates that Cys-and Hcy-S-conjugates of CH3Hg1 (Cys-S-CH3Hg1 and Hcy-S-CH3Hg1
respectively) are substrates of the sodium-dependent amino acid carrier,system B0,1.188 Currently, there are no experimental data supporting a role forsystem B0,1 in the uptake of Cys-S-Hg-S-Cys or Hcy-S-Hg-S-Hcy.188
Approximately 40–60% of the mercury that accumulates in proximal tubularcells is taken up at the basolateral plasma membrane.180,182,185,189–192
Numerous in vitro studies using cultured MDCK cells stably transfected withthe organic anion transporter (OAT)-1 provide strong evidence indicating thatmercuric conjugates of Cys, Hcy, and NAC (NAC-S-Hg-S-NAC) are taken upby this carrier.193–203 Cys-S-Hg-S-Cys has also been shown to be a trans-portable substrate of another isoform of OAT, namely OAT3.204 Both, OAT1and OAT3 are localized in the basolateral plasma membrane of proximaltubular epithelial cells.195,196 Based on published reports, it appears thatOAT1 is the primary mechanism involved in the basolateral transport of
360 Chapter 13

Cys-S-Hg-S-Cys, NAC-S-Hg-S-NAC, and Hcy-S-Hg-S-Hcy into proximaltubular cells.180,181,185,189–192,204–206 In addition to conjugates of inorganicmercury, Cys-, NAC-, and Hcy-S-conjugates of CH3Hg1 have also beenidentified as substrates for OAT1.201–203 Collectively, these data provide strongsupport for a role of OAT1 and OAT3 in the basolateral uptake of certainmercuric complexes.
Once mercuric ions gain access to the intracellular compartment of cells, theyform strong bonds with protein and non-protein thiol-containing biomolecules.Intracellular mercuric ions also induce, and bind to, MT and/or GSH.207,208
Bonding to these biomolecules often prevents or reduces greatly the export ofmercuric ions from the cell. However, it is well-documented that mercuric ionscan be extracted from renal tubular cells following treatment with a metalcomplexing agent, such as 2,3-bis(sulfanyl)propane-1-sulfonic acid (formallyknown as 2,3-dimercaptopropane-1-sulfonic acid, DMPS)209 or 2,3-dimer-captosuccinic acid (DMSA).209–214 It is thought that DMPS and DMSA gainaccess to proximal tubular cells at the basolateral membrane via OAT1, OAT3and/or the sodium-dependent dicarboxylate transporter (NaC2).215–218 It ishypothesized that once internalized, DMPS and DMSA form complexes withintracellular Hg21 and these complexes are then exported across the luminalmembrane via the multidrug resistance-associated protein 2 (MRP2). In arecent study, TR� rats, which lack Mrp2, were exposed to a non-nephrotoxicdose of HgCl2 and treated subsequently with DMPS or DMSA. The results ofthis study provided strong evidence for a role of Mrp2 in the DMPS- andDMSA-mediated extraction of mercuric ions from proximal tubular cells.219,220
In addition, in vitro studies utilizing inside-out, brush-border membrane vesiclesprepared from Sf9 cells transfected with human MRP2 provided direct evidenceindicating that DMPS- and DMSA-S-conjugates of Hg21 are transportablesubstrates of MRP2.219,220 Mrp2 also appears to play a role in the NAC-mediatedextraction of mercuric ions following exposure to CH3Hg1.221 In vivo studies inTR� rats suggest that Mrp2 plays a role in the transport of CH3Hg-S-NAC fromwithin proximal tubular cells into the tubular lumen.222 The ability of Mrp2 toutilize CH3Hg-S-NAC as a substrate was also shown directly via studies usinginside-out, brush-border membrane vesicles prepared from the kidneys of TR�
rats.222 Similarly, Mrp2 has been implicated in the DMPS- and DMSA-mediatedelimination of CH3Hg1 from proximal tubular cells using TR– rats and inside-out, brush-border membrane vesicles from MRP2-expressing Sf9 cells asexperimental models.223 Collectively, these data provide strong support for thehypothesis that MRP2 plays an important role in the renal elimination ofmercuric ions following exposure to forms of Hg12 or CH3Hg1.
13.4.2.2 Renal Effects of Mercury Exposure
Exposure to all forms of mercury can have nephrotoxic effects;168–171 however,exposure to conjugates of inorganic mercury induces the most severe acutenephropathy. Following exposure to a low dose of HgCl2, cellular damage canbe observed in the pars recta of the proximal tubule, suggesting that this region
The Aging Kidney and Exposure to the Nephrotoxic Metals Cadmium and Mercury 361

of the nephron is the most sensitive to the toxic effects of mercury.166 Exposureto higher doses of HgCl2 not only results in more rapid induction of cellularnecrosis, but also leads to necrosis in the pars convoluta and distal segments ofthe nephron.224,225 Following exposure to a nephrotoxic dose of mercury,injury can be detected at the cellular level in pars recta segments in as little asthree hours.226 Changes in mitochondrial structure are evident and pyknoticnuclei can be identified. After six hours, cells begin to lose microvilli, mito-chondrial swelling worsens, and dilation of the endoplasmic reticulum can bedetected.224 Reductions in enzymatic activity in the pars recta have also beenreported.225 Twelve hours after exposure to HgCl2, electron microscopicanalyses of cells reveal rupture of the plasma membrane, loss of microvilli,decreased contact with the basement membrane, and loss of cell shape.227 After24 hours, cellular fragments can be identified in the tubular lumen, junctionalcomplexes between cells are absent, and nuclear structure is compromised.225–227
When tubular epithelial cells are injured and die, numerous brush-border andintracellular enzymes, such as alkaline phosphatase, g-glutamyltransferase,lactate dehydrogenase, aspartate aminotransferase (AST), and alanine amino-transferase (ALT) can be detected in urine.213,228–232 As the extent of mercury-induced renal injury progresses, there is also a simultaneous increase in theurinary excretion of mercuric ions.233–235
Exposure to HgCl2 can also have detrimental effects on glomeruli. Hall andcolleagues236 exposed rats to a non-nephrotoxic dose of HgCl2 for 21 weeks. Atthe end of the exposure period there were no significant differences in theparameters of renal function (i.e., plasma urea nitrogen, plasma creatinine,protein excretion); yet significant histological changes were noted in thekidneys. Tubular, interstitial and glomerular lesions were found to besignificantly worse in rats exposed to HgCl2 than in control animals.236
Similarly, in rats exposed to methylmercury over a two-year period, fibroticchanges were identified in a fraction of glomeruli.237 In addition, deposits ofIgG, IgM, and C3 were detected along the glomerular basement membrane,237
suggestive of the development of membranous glomerulonephritis.166,238–240
Glomerular changes such as fibrosis and glomerulonephritis often lead toreductions in GFR. Therefore, it is not surprising that following exposure tomercury, reductions in GFR have been observed.224,241
Based on these studies, it is clear that acute and chronic exposure to mercuriccompounds has numerous, deleterious effects in the kidneys. Considering thataged and elderly individuals have reduced functional renal mass (due toglomerulosclerosis, tubular atrophy, and interstitial fibrosis), it is possible thatexposure of these individuals to mercuric compounds may be even moredetrimental to renal health.
13.4.2.3 Aging and the Effects of Mercury Exposure on theKidney
Although the aged and elderly make up a significant percentage of the popu-lation, and exposure to mercury and mercuric compounds appears to be
362 Chapter 13

increasing, little is known about the relationship between aging kidneys and therenal effects of mercury exposure. Several in vitro studies suggest thataccumulation of mercuric ions is greater in aged animals than younger animals.Hirayama and Yasutake242 exposed C57BL/6N mice, ages two weeks to45 weeks, to a single dose of methylmercury and found that accumulation ofmercuric ions was greater in older mice than in younger mice. This study alsofound that urinary excretion of mercury was lower in older mice, suggestingthat more mercury was retained within the kidneys and other organs.242
Interestingly, increases in the expression of MT and GSH, which have beenshown to occur with aging, may lead to increased binding and retention ofmercuric ions within target cells.243
As the kidneys age, the total number of functioning nephrons decreasessignificantly. This decline in functional renal mass is somewhat similar to anexperimental model in which animals are uninephrectomized. Although theuninephrectomized rat model does not mimic exactly the changes that occur inan aging kidney, similarities exist between the two systems. In each, asignificant number of nephrons are lost and remaining nephrons must gothrough a compensatory, hypertrophic phase in order to maintain normal fluidand electrolyte homeostasis.51,52,143 It has been suggested by a number ofinvestigators that hyperfiltration and hyperperfusion occurring in hyper-trophied nephrons may result in these nephrons being exposed to higher levelsof potential nephrotoxicants such as mercury. This increased exposure mayincrease the susceptibility of these nephrons to the deleterious effects ofmercury or other nephrotoxicants.231,244–250
Several studies in uninephrectomized rats support the idea that hyper-trophied nephrons are more sensitive to the toxic effects of mercury. Ramos-Frendo and colleagues246 exposed uninephrectomized and sham rats to anephrotoxic dose of HgCl2 and found that the development of acute renalfailure was more pronounced in uninephrectomized animals than in shamanimals. Similarly, Houser and Berndt244 exposed uninephrectomized andsham Sprague-Dawley rats to a nephrotoxic dose of HgCl2, following whichthey assessed renal susceptibility to mercuric ions. Exposure to HgCl2 includedglomerular and tubular dysfunction, which appeared to be more severe inuninephrectomized rats than in sham rats.244 In a separate, more detailed studyusing uninephrectomized and sham Sprague-Dawley rats exposed to a neph-rotoxic dose of HgCl2, it was discovered that mercuric ions were redistributedwithin the kidney following uninephrectomy. The concentration of mercuricions was greater in the renal cortex and outer stripe of the outer medulla inuninephrectomized rats than in sham animals.245 Not surprisingly, the urinaryexcretion of mercury (per kidney) was greater in uninephrectomized rats thanin shams.244,245 A similar study was carried out in uninephrectomized and shamLong Evans hooded rats, which were exposed to nephrotoxic doses of HgCl2.
231
It was found that mercury-induced proximal tubular necrosis was moreextensive in uninephrectomized animals than in sham animals. In addition, theurinary excretion of cellular enzymes and plasma proteins, including lactatedehydrogenase, g-glutamyltransferase and albumin, was greater in
The Aging Kidney and Exposure to the Nephrotoxic Metals Cadmium and Mercury 363
uninephrectomized animals than in sham animals.231,251 Collectively, theresults of these studies indicate that kidneys of animals with reduced renal massare more susceptible to the toxic effects of mercury. Similarly, elderly and agedindividuals who have reduced renal function, due to normal aging processesand/or superimposed disease processes may be more susceptible to renal injuryfollowing exposure to a nephrotoxicant such as mercury.
Chronic kidney disease, which may lead to end-stage renal failure, frequentlyaffects the elderly and aged population. This disease, which is often caused byuncontrolled diabetes and hypertension, is characterized by a progressive andpermanent loss of functioning nephrons. In the United States, which has one ofthe highest rates of chronic kidney disease in the world,252 nearly 50% ofpatients with this disease are over the age of 65.253 Because many patients in theearly stages of chronic kidney disease are asymptomatic, a diagnosis is oftennot made until renal function has been compromised significantly and GFR iswell below the normal range. During this period, patients may continue to beexposed to nephrotoxicants such as mercury. Such exposure may enhancemorbidity and mortality as these patients may be more sensitive to the toxiceffects of mercury. In rat models of chronic kidney disease (i.e., 75% neph-rectomy), the disposition of mercuric ions differs significantly from that in shamor uninephrectomized animals.254 The renal accumulation of mercuric ions hasbeen shown to be significantly lower in 75% nephrectomized rats comparedwith uninephrectomized rats. This finding is likely related to the fact that GFRis reduced more in 75% nephrectomized rats than in uninephrectomized rats.Based on these data, it has been suggested that the uptake of a large fraction ofthe mercuric ions that accumulate within the kidney is dependent uponfiltration of these ions at the glomerulus.251,254 A reduction in GFR would beexpected to decrease the amount of mercury filtered at the glomerulus andpresented to the tubular epithelial cells. This theory is consistent with thefinding that the concentration of mercuric ions in blood is significantly greaterin 75% nephrectomized rats than uninephrectomized or sham rats. Inter-estingly, the hepatic accumulation and fecal excretion of mercury have beenshown to be significantly greater in 75% nephrectomized rats than in sham oruninephrectomized rats. The increased concentration of mercuric ions couldenhance the injurious effects of mercury in hepatocytes, which may lead to adecline in overall health.251,254
13.5 Summary
The aging process in the kidneys has been studied and characterizedextensively. It is well known that glomerulosclerosis leads to decreases in GFRand RBF. However, there is little information regarding the response of agedkidneys to environmental toxicants such as cadmium or mercury. Because ofthe prevalence of these metals in the environment, human exposure is nearlyunavoidable. Furthermore, it is well-known that acute and chronic exposuresto each of these toxic metals can be detrimental to the kidneys of normal adults,thus it can be postulated that exposure of the elderly and aged to these metals
364 Chapter 13

may lead to additional reductions in renal function. Individuals withcompromised renal function, either from aging, disease, or a combination ofaging and disease, are especially susceptible to nephrotoxicants. The few studiesavailable have demonstrated an association between exposure to mercury orcadmium and an increase in the incidence and severity of renal disease. It isimportant to note that early signs of renal dysfunction often go unnoticed, thusindividuals with reduced renal function are often unaware that they are at riskduring the early stages of disease. Exposure to nephrotoxicants may occurduring this early period, and this exposure may be especially detrimental tothese individuals. Therefore, a thorough and complete understanding of theway in which nephrotoxicants are handled by aging kidneys is of utmostimportance. Because of the paucity of data available on this topic, additionalstudies are clearly necessary.
References
1. World Health Organization, World Health Statistics, Geneva,Switzerland, 2011, 1, 45–53, Available at: www.who.int/shoisi/whostat/2011/en/index.html.
2. Centers for Disease Control and Prevention, Health, US, with a specialfeature on death and dying. National Center for Health Statistics,Hyattsville, MD, 2010, 10, 10, Available at www.cdc.gov/nchs/data/hus/hus10.pdf.
3. F. S. Hobbs, United States Census Bureau, 2002, 58–59, Available at:www.census.gov/prod/2002pubs/censr-4.pdf.
4. C. Kaplan, B. Pasternack, H. Shah and G. Gallo, Am. J. Pathol., 1975,80, 227.
5. M. Epstein, J. Am. Soc. Nephrol., 1996, 7, 1106.6. D. Rodriguez-Puyol, Kidney Int., 1998, 54, 2247.7. B. Kappel and S. Olsen, Virchows Arch. A: Pathol. Anat. Histol, 1980,
387, 271.8. X. J. Zhou, Z. G. Laszik, F. G. Silva, in The Aging Kidney in Health
and Disease, eds. J. F. M. Nunez, J. S. Cameron and D.G. Oreopoulos,Springer, New York, 2008, p. 39.
9. E. V. Lerma, Clin. Geriatr. Med., 2009, 25, 325.10. S. E. Thomas, S. Anderson, K. L. Gordon, T. T. Oyama, S. J. Shankland
and R. J. Johnson, J. Am. Soc. Nephrol., 1998, 9, 231.11. J. M. Lopez-Novoa, in The Aging Kidney in Health and Disease, eds.
J. F. M. Nunez, J. S. Cameron, and D. G. Oreopoulos, Springer, NewYork, 2008, p. 113.
12. J. E. Wiggins, S. R. Patel, K. A. Shedden, M. Goyal, B. L. Wharram,S. Martini, M. Kretzler and R. C. Wiggins, J. Am. Soc. Nephrol., 2010,21, 587.
13. F. G. Silva, Int. Urol. Nephrol., 2005, 37, 185.14. Thomas et al., J. Am. Soc. Nephrol., 1998, 9, 231–242.15. R. Zatz and C. K. Fujihara, Kidney Int. Suppl., 1994, 45, S27.
The Aging Kidney and Exposure to the Nephrotoxic Metals Cadmium and Mercury 365

16. A. B. Fogo, Kidney Int. Suppl., 2000, 75, S15.17. J. R. Weinstein and S. Anderson, Adv. Chronic Kidney Dis., 2010,
17, 302.18. S. Anderson and B. M. Brenner, Am. J. Med., 1986, 80, 435.19. L. Ferder, F. Inserra, L. Romano, L. Ercole and V. Pszenny, J. Am. Soc.
Nephrol., 1994, 5, 1147.20. J. Floege, R. J. Johnson and W. G. Couser, Clin. Investig, 1992,
70, 857.21. A. Ljungqvist and C. Lagergren, J. Anat., 1962, 96, 285.22. D. Choudhury, D. S. C. Raj, M. Levi, in The Kidney, eds. B. M. Brenner
and F. C. Rector, Elsevier, Philadelphia, 2004, vol. 2 , p. 2305.23. J. Wiggins, Semin. Nephrol., 2009, 29, 587.24. M. Camici, A. Carpi, G. Cini, F. Galetta and N. Abraham, Front. Biosci.
(Schol Ed), 2011, 3 , 995.25. B. L. Wharram, M. Goyal, J. E. Wiggins, S. K. Sanden, S. Hussain,
W. E. Filipiak, T. L. Saunders, R. C. Dysko, K. Kohno, L. B. Holzmanand R. C. Wiggins, J. Am. Soc. Nephrol., 2005, 16, 2941.
26. G. Ding, N. Franki, A. A. Kapasi, K. Reddy, N. Gibbons andP. C. Singhal, Exp. Mol. Pathol., 2001, 70, 43.
27. C. K. Abrass, M. J. Adcox and G. J. Raugi, Am. J. Pathol., 1995,146, 742.
28. X. J. Zhou, D. Rakheja, X. Yu, R. Saxena, N. D. Vaziri and F. G. Silva,Kidney Int., 2008, 74, 710.
29. Q. Ke and M. Costa, Mol. Pharmacol., 2006, 70, 1469.30. K. Kimura, M. Iwano, D. F. Higgins, Y. Yamaguchi, K. Nakatani,
K. Harada, A. Kubo, Y. Akai, E. B. Rankin, E. G. Neilson, V. H. Haaseand Y. Saito, Am. J. Physiol. Renal Physiol, 2008, 295, F1023.
31. S. Nakatsuji, J. Yamate and S. Sakuma, Vet. Pathol., 1998, 35, 352.32. R. D. Lindeman and R. Goldman, Exp. Gerontol., 1986, 21, 379.33. J. W. Rowe, N. W. Shock and R. A. DeFronzo, Nephron, 1976, 17, 270.34. S. Adler, R. D. Lindeman, M. J. Yiengst, E. Beard and N. W. Shock,
J. Lab. Clin. Med., 1968, 72, 278.35. J. F. Macıas-Nunez, J. M. Lopez-Novoa, in The Aging Kidney in Health
and Disease, eds. J. F. Macias Nunez, J. S. Cameron andD. G. Oreopoulos, Springer, New York, 2008, p. 93.
36. C. G. Musso and D. G. Oreopoulos, Nephron Physiol Suppl 1., 2011,119, 1.
37. D. F. Davies and N. W. Shock, J. Clin. Invest., 1950, 29, 496.38. C. Baylis and R. Schmidt, Semin. Nephrol., 1996, 16, 265.39. N. W. Shock, Geriatrics, 1946, 1, 232.40. R. D. Lindeman, J. Tobin and N. W. Shock, J. Am. Geriatr. Soc., 1985,
33, 278.41. N. W. Shock, R. C. Greulick, R. Andres, D. Arenberg, P. T. Costa,
E. G. Lakatta and J. D. Tobin, Public Health Service, United StatesDepartment of Health and Human Services Publication No. 84-2450, 1984, 175,Available at: www.grc.nia.nih.gov.blsahistory/blsa-1984/index.html.
366 Chapter 13

42. A. D. Rule, L. D. Cornell and E. D. Poggio, Nephron Physiol., 2011,119(Suppl 1), p. 6.
43. S. Hoshi, Y. Shu, F. Yoshida, T. Inagaki, J. Sonoda, T. Watanabe,K. Nomoto and M. Nagata, Lab. Invest, 2002, 82, 25.
44. R. J. Glassock and C. Winearls, Trans. Am. Clin. Climatol. Assoc., 2009,120, 419.
45. F. Zheng, A. R. Plati, A. Banerjee, S. Elliot, L. J. Striker andG. E. Striker, Sci. Aging Knowledge Environ, 2003, 2003, PE20.
46. A. Melk, B. M. Schmidt, O. Takeuchi, B. Sawitzki, D. C. Rayner andP. F. Halloran, Kidney Int., 2004, 65, 510.
47. A. Melk, E. S. Mansfield, S. C. Hsieh, T. Hernandez-Boussard,P. Grimm, D. C. Rayner, P. F. Halloran and M. M. Sarwal, Kidney Int.,2005, 68, 2667.
48. Y. Zha, T. Taguchi, A. Nazneen, I. Shimokawa, Y. Higami andM. S. Razzaque, Am. J. Nephrol., 2008, 28, 755.
49. R. Naeije, A. Fiasse, E. Carlier, M. Opsomer and M. Leeman, Eur. J.Clin. Pharmacol., 1993, 44, 35.
50. N. K. Hollenberg, D. F. Adams, H. S. Solomon, A. Rashid, H. L. Abramsand J. P. Merrill, Circ. Res., 1974, 34, 309.
51. N. J. Fine LG, D. A. Kujubu and A. Knecht, in The Kidney: Physiologyand Pathophysiology, eds. D.W. Seldin and G. Giebisch, Raven Press,New York, 2nd edn, 1992, p. 3113.
52. J. P. Hayslett, Physiol. Rev., 1979, 59, 137.53. J. P. Bosch, S. Lew, S. Glabman and A. Lauer, Am. J. Med., 1986, 81, 809.54. J. Bohler, D. Gloer, P. Reetze-Bonorden, E. Keller and P. J. Schollmeyer,
Clin. Nephrol., 1993, 39, 145.55. D. Fliser, M. Zeier, R. Nowack and E. Ritz, J. Am. Soc. Nephrol., 1993,
3, 1371.56. C. Esposito, A. Plati, T. Mazzullo, G. Fasoli, A. De Mauri, F. Grosjean,
F. Mangione, F. Castoldi, N. Serpieri, F. Cornacchia and A. Dal Canton,J. Nephrol, 2007, 20, 617.
57. C. G. Musso, J. Reynaldi, B. Martinez, A. Pierangelo, M. Vilas andL. Algranati, Int. Urol. Nephrol., 2011, 43, 253.
58. K. Uriu, K. Kaizu, Y. L. Qie, A. Ito, I. Takagi, K. Suzuka, Y. Inada,O. Hashimoto and S. Eto, Toxicol. Appl. Pharmacol., 2000, 169, 151.
59. A. Raes, R. Donckerwolcke, M. Craen, M. C. Hussein and J.Vande Walle, Pediatr. Nephrol., 2007, 22, 1903.
60. J. Zaletel, D. Cerne, K. Lenart, S. Zitta, G. Jurgens, W. Estelberger andA. Kocijancic, Wien. Klin. Wochenschr., 2004, 116, 246.
61. F. B. Gabbai, Semin. Nephrol., 1995, 15, 482.62. I. M. Pecly, V. Genelhu and E. A. Francischetti, Int. J. Clin. Pract., 2006,
60, 1198.63. R. Schmitt and L. G. Cantley, Am. J. Physiol. Renal Physiol, 2008,
294, F1265.64. R. Schmitt, X. Zhu and L. G. Cantley, J. Am. Soc. Nephrol., 2006,
17, 530A.
The Aging Kidney and Exposure to the Nephrotoxic Metals Cadmium and Mercury 367

65. G. V. Shurin, Z. R. Yurkovetsky, G. S. Chatta, I. L. Tourkova,M. R. Shurin and A. E. Lokshin, Cytokine, 2007, 39, 123.
66. H. Bruunsgaard, M. Pedersen and B. K. Pedersen, Curr. Opin. Hematol.,2001, 8, 131.
67. R. Gerli, D. Monti, O. Bistoni, A. M. Mazzone, G. Peri, A. Cossarizza,M. Di Gioacchino, M. E. Cesarotti, A. Doni, A. Mantovani,C. Franceschi and R. Paganelli, Mech. Ageing Dev., 2000, 121, 37.
68. J. Mysliwska, E. Bryl, J. Foerster and A. Mysliwski, Mech. Ageing. Dev.,1999, 107, 1.
69. A. M. Joaquin and S. Gollapudi, J. Am. Geriatr. Soc., 2001, 49, 1234.70. J. Pascual, L. Orofino, F. Liano, R. Marcen, M. T. Naya, L. Orte and
J. Ortuno, J. Am. Geriatr. Soc., 1990, 38, 25.71. J. Coresh, B. C. Astor, T. Greene, G. Eknoyan and A. S. Levey, Am. J.
Kidney Dis., 2003, 41, 1.72. T. Ali, I. Khan, W. Simpson, G. Prescott, J. Townend, W. Smith and
A. Macleod, J. Am. Soc. Nephrol., 2007, 18, 1292.73. A. H. Abdelhafiz, S. H. Brown, A. Bello and M. El Nahas, Nephron Clin.
Pract., 2010, 116, c19.74. F. G. Silva, Int. Urol. Nephro.l, 2005, 37, 419.75. Centers for Disease Control and Prevention, Prevalence of hypertension
and controlled hypertension - United States, 2005–2008, Morbidity andMortality Weekly Report, Atlanta, GA, 2011, 1, 94–97, Available at:www.cdc.gov/mmwr/preview/mmwrhtml/su6001a21.htm.
76. Centers for Disease Control and Prevention, National Diabetes FactSheet: National Estimates and General Information on Diabetes andPrediabetes in the United States, Atlanta, GA, 2011, 1, 1–12, Available at:www.cdc.gov/diabetes/pubs/pdf/ndfs_2011.pdf.
77. K. Abdel-Kader and P. M. Palevsky, Clin. Geriatr. Med., 2009,25, 331.
78. M. Jerkic, S. Vojvodic and J. M. Lopez-Novoa, Int. Urol. Nephrol., 2001,32, 539.
79. G. Cuny, R. J. Royer, J. M. Mur, J. M. Serot, G. Faure, P. Netter,A. Maillard and F. Penin, Gerontology, 1979, 25, 49.
80. N. S. Bricker and L. G. Fine, in The Kidney, eds. B. M. Brenner BM andF. C. Rector, Saunders, Philadelphia, 2nd edn, 1981, 1, p. 1056.
81. Agency for Toxic Substance and Drug Registry, Cadmium, 2008, 1, 1–512,Available at: www.atsdr.cdc.gov/ToxProfiles/tp5.pdr.
82. World Health Organization, Cadmium - Environmental Health Criteria 134,Geneva, Switzerland, 1992, Available at: www.inchem.org/documents/ehc/ehc/ehc134.htm.
83. L. Friberg, M. Piscator, G. Nordberg, T. Kjellstrom, Cadmium inthe Environmnent, CRC Press, Cleveland, 2nd edn,1974.
84. C. G. Elinder, T. Kjellstrom, B. Lind, L. Linnman, M. Piscator andK. Sundstedt, Environ. Res., 1983, 32, 220.
85. C. G. Elinder, B. Lind, T. Kjellstrom, L. Linnman and L. Friberg, Arch.Environ. Health., 1976, 31, 292.
368 Chapter 13

86. L. Jarup, M. Berglund, C. G. Elinder, G. Nordberg and M. Vahter,Scand. J. Work. Environ. Health., 1998, 24(Suppl 1), 1.
87. I. M. Olsson, I. Bensryd, T. Lundh, H. Ottosson, S. Skerfving andA. Oskarsson, Environ. Health. Perspect., 2002, 110, 1185.
88. Centers for Disease Control and Prevention, Fourth National Report onHuman Exposure to Environmental Chemicals, Atlanta, 2009.
89. D. L. Rabenstein, A. A. Isab, W. Kadima and P. Mohanakrishnan,Biochim. Biophys. Acta, 1983, 762, 531.
90. D. L. Rabenstein, in Glutathione: Chemical, Biochemical and MedicalAspects, Coenzymes and Cofactors, eds. D. Dolphin, O. Auromovibic andR. Poulson, Wiley, New York, 1989, vol. 3, p. 147.
91. Y. Wang, R. K. Zalups and D. W. Barfuss, Toxicol. Lett., 2010,193, 61.
92. R. K. Zalups and S. Ahmad, Toxicol. Appl. Pharmacol,., 2003, 186, 163.93. E. Felley-Bosco and J. Diezi, Toxicol. Appl. Pharmacol., 1989, 98, 243.94. O. Barbier, G. Jacquillet, M. Tauc, P. Poujeol and M. Cougnon, Am. J.
Physiol. Renal Physiol, 2004, 287, F1067.95. R. E. Dudley, L. M. Gammal and C. D. Klaassen, Toxicol. Appl. Pharmacol,
1985, 77, 414.96. C. Erfurt, E. Roussa and F. Thevenod, Am. J. Physiol. Cell Physiol, 2003,
285, C1367.97. M. Murakami, K. Sano and M. Webb, Arch. Toxicol., 1987, 60, 365.98. C. Dorian, V. H. Gattone and C. D. Klaassen, Toxicol. Appl. Pharmacol.,
1992, 117, 242.99. C. Dorian, V. H. Gattone and C. D. Klaasen, Toxicol. Appl. Pharmacol.,
1992, 114, 173.100. E. C. Foulkes, Toxicol. Appl. Pharmacol., 1978, 45, 505.101. M. Nordberg, T. Jin and G. F. Nordberg, IARC Sci. Publ, 1992, 293.102. M. Webb, in Cadmium, eds. E. C. Foulkes, Springer-Verlag, Berlin/New
York, 1986.103. F. Thevenod, Nephron Physiol., 2003, 93, 87.104. G. F. Nordberg, R. Goyer and M. Nordberg, Arch. Pathol, 1975, 99, 192.105. M. G. Cherian and M. Nordberg, Toxicology, 1983, 28, 1.106. E. Felley-Bosco and J. Diezi, Toxicol. Appl. Pharmacol., 1987, 91, 204.107. M. Murakami, K. Cain and M. Webb, J. Appl. Toxicol., 1983, 3, 237.108. R. K. Zalups, R. M. Gelein and M. G. Cherian, J. Pharmacol. Exp. Ther.,
1992, 262, 1256.109. M. Abouhamed, N. A. Wolff, W. K. Lee, C. P. Smith and F. Thevenod,
Am. J. Physiol. Renal Physiol, 2007, 293, F705.110. C. J. Ferguson, M. Wareing, D. T. Ward, R. Green, C. P. Smith and
D. Riccardi, Am. J. Physiol. Renal Physiol, 2001, 280, F803.111. A. M. Scheuhammer and M. G. Cherian, Toxicol. Appl. Pharmacol.,
1986, 82, 417.112. B. Wang, S. N. Schneider, N. Dragin, K. Girijashanker, T. P. Dalton,
L. He, M. L. Miller, K. F. Stringer, M. Soleimani, D. D. Richardson andD. W. Nebert, Am. J. Physiol. Cell Physiol, 2007, 292, C1523.
The Aging Kidney and Exposure to the Nephrotoxic Metals Cadmium and Mercury 369

113. K. Girijashanker, L. He, M. Soleimani, J. M. Reed, H. Li, Z. Liu,B. Wang, T. P. Dalton and D. W. Nebert, Mol. Pharmacol., 2008,73, 1413.
114. H. Fujishiro, S. Okugaki, K. Kubota, T. Fujiyama, H. Miyataka andS. Himeno, J. Appl. Toxicol., 2009, 29, 367.
115. F. Thevenod, Biometals, 23, 857.116. W. C. Prozialeck and J. R. Edwards, Biometals, 2010, 23, 793.117. C. G. Elinder, L. Gerhardsson and G. Oberdorster, in Biological Moni-
toring of Toxic Metals, eds. T. W. Clarkson, L. Friberg, G. F. Nordbergand P. R. Sager, Plenum Press, London, 1988, p. 1.
118. G. F. Nordberg, K. Nogawa, M. Nordberg and J. M. Friedmann, inHandbook on the Toxicology of Metals, eds. G. F. Nordberg,B. A. Fowler, M. Nordbergand L. Friberg, Elsevier, Amsterdam, 2007,p. 445.
119. G. F. Nordberg and M. Nordberg, in Biological Monitoring ofToxic Metals, eds. T. W. Clarkson, L. Friberg, G. F. Nordberg andP. R. Sager, Plenum Press, New York, 2001, p. 151.
120. N. Johri, G. Jacquillet and R. Unwin, Biometals, 2010, 23, 783.121. A. Akesson, T. Lundh, M. Vahter, P. Bjellerup, J. Lidfeldt, C. Nerbrand,
G. Samsioe, U. Stromberg and S. Skerfving, Environ. Health Perspect.,2005, 113, 1627.
122. K. Tsuchiya, S. Iwao, M. Sugita and H. Sakurai, Environ. HealthPerspect., 1979, 28, 147.
123. T. Jin, G. Nordberg, X. Wu, T. Ye, Q. Kong, Z. Wang, F. Zhuang andS. Cai, Environ. Res., 1999, 81, 167.
124. W. C. Prozialeck, V. S. Vaidya, J. Liu, M. P. Waalkes, J. R. Edwards,P. C. Lamar, A. M. Bernard, X. Dumont and J. V. Bonventre, KidneyInt., 2007, 72, 985.
125. L. Jarup and T. Alfven, Biometals, 2004, 17, 505.126. L. Jarup, L. Hellstrom, T. Alfven, M. D. Carlsson, A. Grubb, B. Persson,
C. Pettersson, G. Spang, A. Schutz and C. G. Elinder, Occup. Environ.Med., 2000, 57, 668.
127. C. W. Noonan, S. M. Sarasua, D. Campagna, S. J. Kathman,J. A. Lybarger and P. W. Mueller, Environ. Health. Perspect., 2002,110, 151.
128. M. E. Mortensen, L. Y. Wong and J. D. Osterloh, Int. J. Hyg.Environ. Health, 214, 305.
129. M. Huang, S. J. Choi, D. W. Kim, N. Y. Kim, C. H. Park, S. D. Yu,D. S. Kim, K. S. Park, J. S. Song, H. Kim, B. S. Choi, I. J. Yu andJ. D. Park, J. Toxicol. Environ. Health. A, 2009, 72, 1493.
130. L. Jarup, B. Persson and C. G. Elinder, Occup. Environ. Med, 1995,52, 818.
131. L. Jarup and C. G. Elinder, Br. J. Ind. Med., 1993, 50, 598.132. K. Aoshima and M. Kasuya, Toxicol. Lett, 1991, 57, 91.133. I. Tsuritani, R. Honda, M. Ishizaki, Y. Yamada, T. Kido and
K. Nogawa, J. Toxicol. Environ. Health, 1992, 37, 519.
370 Chapter 13

134. M. Huang, S. J. Choi, D. W. Kim, N. Y. Kim, H. S. Bae, S. D. Yu, D. S.Kim, H. Kim, B. S. Choi, I. J. Yu and J. D. Park, Environ. Toxicol., 2011,Available at: http://onlinelibrary.wiley.com/doi/10.1002/tox20750/pdf.
135. H. C. Gonick, Indian J. Med. Res., 2008, 128, 335.136. R. Lauwerys, A. Bernard and A. Cardenas, Toxicol. Lett., 1992, 33.137. G. A. Porter, Toxicol. Lett., 1989, 46, 269.138. H. A. Roels, P. Hoet and D. Lison, Ren. Fail, 1999, 21, 251.139. P. W. Mueller, R. G. Price and W. F. Finn, Environ. Health Perspect.,
1998, 106, 227.140. H. A. Roels, R. R. Lauwerys, A. M. Bernard, J. P. Buchet, A. Vos and
M. Oversteyns, Br. J. Ind. Med., 1991, 48, 365.141. T. Watanabe, A. Koizumi, H. Fujita, H. Fujimoto, A. Ishimori and
M. Ikeda, Tohoku J. Exp. Med, 1982, 138, 443.142. M. Baecklund, N. L. Pedersen, L. Bjorkman andM. Vahter, Environ. Res,
1999, 80, 222.143. L. G. Fine and J. Norman, Annu. Rev. Physiol., 1989, 51, 19.144. R. K. Zalups, J. Fraser and J. Koropatnick, Am. J. Physiol, 1995,
268, F643.145. J. R. Edwards and W. C. Prozialeck, Toxicol. Appl. Pharmacol., 2009,
238, 289.146. G. F. Nordberg, T. Jin, X. Wu, J. Lu, L. Chen, L. Lei, F. Hong and
M. Nordberg, Biochimie, 2009, 91, 1282.147. B. F. Schrijvers, A. S. De Vriese and A. Flyvbjerg, Endocr. Rev., 2004,
25, 971.148. R. R. Bell, J. L. Early, V. K. Nonavinakere and Z. Mallory, Toxicol.
Lett., 1990, 54, 199.149. K. D. Chapatwala, M. Boykin, A. Butts and B. Rajanna, Drug Chem.
Toxicol., 1982, 5, 305.150. L. J. Lei, T. Y. Jin and Y. F. Zhou, Biomed. Environ. Sci., 2007, 20, 295.151. Z. Merali and R. L. Singhal, Br. J. Pharmacol., 1980, 69, 151.152. L. J. Lei, T. Y. Jin and Y. F. Zhou, Wei Sheng Yan Jiu, 2005, 34, 394.153. T. Jin, G. Nordberg, J. Sehlin, H. Wallin and S. Sandberg, Toxicology,
1999, 142, 69.154. A. Bernard, C. Schadeck, A. Cardenas, J. P. Buchet and R. Lauwerys,
Toxicol. Lett, 1991, 58, 51.155. T. Jin, G. F. Nordberg, J. Sehlin, P. Leffler and J. Wu, Toxicology, 1994,
89, 81.156. M. Haswell-Elkins, S. Satarug, P. O’Rourke, M. Moore, J. Ng,
V. McGrath and M. Walmby, Environ. Res., 2008, 106, 379.157. J. P. Buchet, R. Lauwerys, H. Roels, A. Bernard, P. Bruaux, F. Claeys,
G. Ducoffre, P. de Plaen, J. Staessen, A. Amery, P. Lijnen, L. Thijs,D. Rondia, F. Sartor, A. Saint Remy and L. Nick, Lancet, 1990, 336, 699.
158. S. Satarug, P. Ujjin, Y. Vanavanitkun, J. R. Baker and M. R. Moore,Toxicol. Lett., 2004, 148, 177.
159. M. Berglund, A. Akesson, B. Nermell and M. Vahter, Environ. HealthPerspect., 1994, 102, 1058.
The Aging Kidney and Exposure to the Nephrotoxic Metals Cadmium and Mercury 371

160. A. Akesson, M. Berglund, A. Schutz, P. Bjellerup, K. Bremme andM. Vahter, Am. J. Public Health, 2002, 92, 284.
161. D. W. Kim, K. Y. Kim, B. S. Choi, P. Youn, D. Y. Ryu, C. D. Klaassenand J. D. Park, Arch. Toxicol., 2007, 81, 327.
162. D. A. Vesey, Toxicol. Lett., 2010, 198, 13.163. Agency for Toxic Substances and Drug Registry, Mercury, Public Health
Service, United States Department of Health and Human Services,Centers for Disease Control, Atlanta, 2008.
164. T. W. Clarkson and L. Magos, Crit. Rev. Toxicol., 2006, 36, 609.165. J. P. Rooney, Toxicology, 2007, 234, 145.166. R. K. Zalups, Pharmacol. Rev., 2000, 52, 113.167. J. F. Risher and C. T. De Rosa, J. Environ. Health, 2007, 70, 9.168. M. J. Murphy, E. J. Culliford and V. Parsons, Resuscitation, 1979, 7, 35.169. B. Rowens, D. Guerrero-Betancourt, C. A. Gottlieb, R. J. Boyes and
M. S. Eichenhorn, Chest, 1991, 99, 185.170. E. R. Samuels, H. M. Heick, P. N. McLaine and J. P. Farant, J. Anal.
Toxicol., 1982, 6, 120.171. A. Yasutake, K. Hirayama and M. Inoue, Arch. Toxicol., 1989,
63, 479.172. J. C. Gage, Br. J. Ind. Med, 1964, 21, 197.173. T. Norseth and T. W. Clarkson, Arch. Environ. Health., 1970, 21, 717.174. T. Norseth and T. W. Clarkson, Biochem. Pharmacol., 1970, 19, 2775.175. S. Omata, M. Sato, K. Sakimura and H. Sugano, Arch. Toxicol., 1980,
44, 231.176. W. L. Hughes, Ann. N. Y. Acad. Sci, 1957, 65, 454.177. R. K. Zalups, Toxicology, 1993, 79, 215.178. V. T. Cannon, D. W. Barfuss and R. K. Zalups, J. Am. Soc. Nephrol.,
2000, 11, 394.179. V. T. Cannon, R. K. Zalups and D. W. Barfuss, Pharmacol. Exp. Ther.,
2001, 298, 780.180. R. K. Zalups, Toxicol. Appl. Pharmacol., 1998, 151, 192.181. R. K. Zalups and L. H. Lash, Biochem. Pharmacol., 1997, 53, 1889.182. R. K. Zalups and K. H. Minor, J. Toxicol. Environ. Health, 1995, 46, 73.183. R. K. Zalups and D. W. Barfuss, J. Toxicol. Environ. Health, 1995,
44, 385.184. R. K. Zalups and D. W. Barfuss, Toxicology, 1996, 109, 15.185. R. K. Zalups and D. W. Barfuss, J. Am. Soc. Nephrol., 1998, 9, 551.186. C. C. Bridges, C. Bauch, F. Verrey and R. K. Zalups, J. Am. Soc. Nephrol,
2004, 15, 663.187. C. C. Bridges and R. K. Zalups, Am. J. Pathol., 2004, 165, 1385.188. C. C. Bridges and R. K. Zalups, J. Pharmacol. Exp. Ther., 2006, 319, 948.189. R. K. Zalups and D. W. Barfuss, Toxicology, 1995, 103, 23.190. R. K. Zalups and D. W. Barfuss, Toxicol. Appl. Pharmacol., 1998,
148, 183.191. R. K. Zalups, Toxicol. Appl. Pharmacol., 1995, 132, 289.192. R. K. Zalups, J. Toxicol. Environ. Health A, 1998, 55, 13.
372 Chapter 13
193. B. Ferrier, M. Martin and F. Roch-Ramel, J. Pharmacol. Exp. Ther, 1983,224, 451.
194. A. S. Koh, T. A. Simmons-Willis, J. B. Pritchard, S. M. Grassl andN. Ballatori, Mol. Pharmacol., 2002, 62, 921.
195. R. Kojima, T. Sekine, M. Kawachi, S. H. Cha, Y. Suzuki and H. Endou,J. Am. Soc. Nephrol., 2002, 13, 848.
196. H. Motohashi, Y. Sakurai, H. Saito, S. Masuda, Y. Urakami, M.Goto, A. Fukatsu, O. Ogawa and K. Inui, J. Am. Soc. Nephrol., 2002,13, 866.
197. J. B. Pritchard, Am. J. Physiol., 1988, 255, F597.198. A. Shimomura, A. M. Chonko and J. J. Grantham, Am. J. Physiol., 1981,
240, F430.199. T. Tanaka, A. Naganuma, N. Miura and N. Imura, Toxicol.
Appl. Pharmacol, 1992, 112, 58.200. K. J. Ullrich, G. Rumrich, G. Fritzsch and S. Kloss, Pflugers Arch, 1987,
408, 38.201. R. K. Zalups and S. Ahmad, Kidney Int., 2005, 68, 1684.202. R. K. Zalups and S. Ahmad, J. Pharmacol. Exp. Ther., 2005, 315, 896.203. R. K. Zalups and S. Ahmad, J. Pharmacol. Exp. Ther., 2005, 314,
1158.204. A. G. Aslamkhan, Y. H. Han, X. P. Yang, R. K. Zalups and
J. B. Pritchard, Mol. Pharmacol., 2003, 63, 590.205. R. K. Zalups and S. Ahmad, J. Am. Soc. Nephrol., 2004, 15, 2023.206. R. K. Zalups, A. G. Aslamkhan and S. Ahmad, Kidney Int., 2004, 66, 251.207. M. G. Cherian and T. W. Clarkson, Chem. Biol. Interact., 1976, 12, 109.208. R. K. Zalups and J. Koropatnick, J. Pharmacol. Exp. Ther., 2000, 295, 74.209. J. Ruprecht, Scientific Monograph for Dimaval. Houston, TX, 2008,
Available at: heyl-berlin.de.210. H. V. Aposhian, Annu. Rev. Pharmacol. Toxicol., 1983, 23, 193.211. H. V. Aposhian, R.M.Maiorino, D. Gonzalez-Ramirez,M. Zuniga-Charles,
Z. Xu, K. M. Hurlbut, P. Junco-Munoz, R. C. Dart and M. M. Aposhian,Toxicology, 1995, 97, 23.
212. H. V. Aposhian, R. M. Maiorino, M. Rivera, D. C. Bruce, R. C. Dart,K. M. Hurlbut, D. J. Levine, W. Zheng, Q. Fernando, D. Carter, et al.,J. Toxicol. Clin. Toxicol., 1992, 30, 505.
213. F. Planas-Bohne, Toxicology, 1981, 19, 275.214. R. K. Zalups, J. Pharmacol. Exp. Ther., 1993, 267, 791.215. M. Rodiger, X. Zhang, B. Ugele, N. Gersdorff, S. H. Wright,
G. Burckhardt and A. Bahn, Can. J. Physiol. Pharmacol., 2010, 88, 141.216. A. Bahn, M. Knabe, Y. Hagos, M. Rodiger, S. Godehardt,
D. S. Graber-Neufeld, K. K. Evans, G. Burckhardt and S. H. Wright,Mol. Pharmacol., 2002, 62, 1128.
217. B. C. Burckhardt, B. Drinkuth, C. Menzel, A. Konig, J. Steffgen,S. H. Wright and G. Burckhardt, J. Am. Soc. Nephrol., 2002, 13, 2628.
218. F. Islinger, M. Gekle and S. H. Wright, J. Pharmacol. Exp. Ther, 2001,299, 741.
The Aging Kidney and Exposure to the Nephrotoxic Metals Cadmium and Mercury 373

219. C. C. Bridges, L. Joshee and R. K. Zalups, Toxicol. Sci., 2008, 105, 211.220. C. C. Bridges, L. Joshee and R. K. Zalups, J. Pharmacol. Exp. Ther.,
2008, 324, 383.221. D. A. Aremu, M. S. Madejczyk and N. Ballatori, Environ. Health
Perspect., 2008, 116, 26.222. M. S. Madejczyk, D. A. Aremu, T. A. Simmons-Willis, T. W. Clarkson
and N. Ballatori, J. Pharmacol. Exp. Ther., 2007, 322, 378.223. R. K. Zalups and C. C. Bridges, Toxicol. Appl. Pharmacol, 2009, 235, 10.224. E. M. McDowell, R. B. Nagle, R. C. Zalme, J. S. McNeil,
W. Flamenbaum and B. F. Trump, Virchows Arch. B. Cell. Pathol., 1976,22, 173.
225. R. C. Zalme, E. M.McDowell, R. B. Nagle, J. S. McNeil, W. Flamenbaumand B. F. Trump, Virchows Arch. B. Cell. Pathol, 1976, 22, 197.
226. A. E. Rodin and C. N. Crowson, Am. J. Pathol, 1962, 41, 485.227. T. L. Gritzka and B. F. Trump, Am. J. Pathol., 1968, 52, 1225.228. R. K. Zalups, Toxicol. Appl. Pharmacol., 2000, 164, 15.229. C. A. Gotelli, E. Astolfi, C. Cox, E. Cernichiari and T. W. Clarkson,
Science, 1985, 227, 638.230. R. G. Price, Toxicology, 1982, 23, 99.231. R. K. Zalups and G. L. Diamond, Virchows Arch. B. Cell. Pathol. Incl.
Mol. Pathol., 1987, 53, 336.232. R. K. Zalups, C. Cox and G. L. Diamond, Histological and urinalysis
assessment of nephrotoxicity induced by mercuric chloride in normal anduninephrectomized rats, in Biological Monitoring of Toxic Metals, eds.T. W. Clarkson, L. Friberg, G. F. Nordberg and P. R. Sager, FirstEdition, Plenum Publishing Corporation, New York, 1988, 531.
233. T. W. Clarkson and L. Magos, Br. J. Pharmacol. Chemother, 1967, 31, 560.234. L. Magos and T. Stoytchev, Br. J. Pharmacol, 1969, 35, 121.235. B. Trojanowska, J. K. Piotrowski and S. Szendzikowski, Toxicol. Appl.
Pharmacol., 1971, 18, 374.236. R. L. Hall, W. L. Wilke and M. J. Fettman, Vet. Hum. Toxicol., 1986,
28, 305.237. K. Eto, A. Yasutake, K. Miyamoto, H. Tokunaga and Y. Otsuka,
Tohoku. J. Exp. Med., 1997, 182, 197.238. P. Druet, E. Druet, F. Potdevin and C. Sapin, Ann. Immunol. (Paris),
1978, 129 C, 777.239. P. E. Bigazzi, Clin. Immunol. Immunopathol., 1992, 65, 81.240. P. E. Bigazzi, J. Toxicol. Clin. Toxicol., 1988, 26, 125.241. R. C. Vanholder, M. M. Praet, P. A. Pattyn, I. R. Leusen and
N. H. Lameire, Kidney Int, 1982, 22, 162.242. K. Hirayama and A. Yasutake, J. Toxicol. Environ. Health, 1986,
18, 49.243. W. R. Swindell, Ageing Res. Rev, 2011, 10, 132.244. M. T. Houser and W. O. Berndt, Toxicol. Appl. Pharmacol., 1986,
83, 506.245. M. T. Houser and W. O. Berndt, Toxicol. Appl. Pharmacol, 1988, 93, 187.
374 Chapter 13

246. B. Ramos-Frendo, R. Perez-Garcia, J. M. Lopez-Novoa andL. Hernando-Avendano, Biomedicine, 1979, 31, 167.
247. R. K. Zalups, Exp. Mol. Pathol., 1991, 54, 10.248. R. K. Zalups, J. Toxicol. Environ. Health, 1997, 50, 173.249. R. K. Zalups, D. W. Barfuss and P. J. Kostyniak, Toxicol. Appl.
Pharmacol., 1992, 115, 174.250. R. K. Zalups, J. M. Klotzbach and G. L. Diamond, Toxicol. Appl.
Pharmacol., 1987, 89, 226.251. R. K. Zalups, Toxicol. Appl. Pharmacol., 1997, 143, 366.252. B. Stengel and C. Couchoud, J. Am. Soc. Nephrol., 2006, 17, 2094.253. Centers for Disease Prevention and Control, Chronic Kidney Disease
Fact Sheet, Department of Health and Human Services, CDC, Atlanta,2010, pp. 1.
254. R. K. Zalups, Toxicol. Appl. Pharmacol., 1995, 130, 121.
The Aging Kidney and Exposure to the Nephrotoxic Metals Cadmium and Mercury 375

CHAPTER 14
Age Related Effects of Cadmiumand Possible Roles in AgingProcesses
BRUCE A FOWLER
ICF International, Fairfax, VA 22031, USAE-mail: [email protected]
14.1 Introduction
14.1.1 Cadmium Exposures
The element cadmium (Cd) is atomic number 48 in the Periodic Table ofElements and is used in a wide variety of industrial applications, includingbatteries, solar cells, and various alloys.1 It is also found as a contaminant insuper phosphate fertilizers and municipal sewage sludge,2 where it may betaken up by certain food crops such as rice, leafy green vegetables, and tobaccoplants.1,2 In addition, filter feeding shellfish, such as oysters, have been found toaccumulate Cd from seawater.3,4 Organ meats from the liver and kidneys oflivestock1 also accumulate cadmium, depending on dietary feed stocks. Stat-istical associations between dietary intakes of cereals, leafy green vegetables,organ meats, yams, and tofu with urinary Cd were reported in a study of 191premenopausal women.5 Interestingly, consumption of tofu showed thestrongest association in this study.
Issues in Toxicology No. 16
Aging and Vulnerability to Environmental Chemicals: Age-related Disorders and their Origins in
Environmental Exposures
Edited by Bernard Weiss
r The Royal Society of Chemistry 2013
Published by the Royal Society of Chemistry, www.rsc.org
376

14.1.2 Cadmium from Diet and Tobacco
The main sources of human exposure to Cd are from consumption of food itemscontaining Cd and from use of tobacco products such as cigarettes. The lattercan greatly increase body burden.5,6 The absorption of Cd from dietaryexposures is of the order of 5–10%, while inhalation absorption from sourcessuch as tobacco smoke is estimated to be of the order of 50%.1 The reduction insmoking rates in the US has recently been shown7 to reduce urinary Cd excretionpatterns. Several factors have been reported to be associated with differences inCd uptake. Low iron status has been shown to exert a marked increase in uptakeof Cd from the gastrointestinal tract.8–12 Race and ethnic differences amongwomen of child bearing age have also been reported,13 with higher Cd uptakelevels among Hispanics and African Americans. These factors may haveimportant health consequences for these sub-populations at later life stages.A recent study,14 which modeled the National Health and Nutrition Exam-ination Study (NHANES) dataset for urinary Cd in a representative sample ofthe general US population from ages 2–70 years, showed that dietary uptakesvaried as a function of age and gender, with females showing approximately2-fold greater uptake than males. Even though Cd uptake among females washigher, both genders showed marked increases in urinary Cd concentrations inthe 6–11 year old age range, followed by a monotonic increase throughout lateryears. These increased uptakes in early life are potentially of great importancesince Cd has an estimated half-life in the human body of the order of decades.Thus early life exposures may have health impacts in later years and may impacta number of diseases associated with old age, as well as the aging process itself.
This chapter will review a number of human health studies which haveevaluated human exposures to Cd, accumulation of this element in variousorgan systems, and known health outcomes associated with Cd in the elderly.These results will be compared with those from experimental animal studieswhich examined accumulation of toxic effects of Cd as a function of age, toassess similarities and differences. Studies focused on the mechanisms of Cd-induced toxicity/carcinogenicity will be evaluated in order to understand theorgan system effects of this element at the target cell level of biologicalorganization. Finally, the chapter will include a discussion of how availabledata from these studies may suggest roles for Cd in contributing to the agingprocess itself15 through the production of oxidative stress16 in target cellpopulations of major organ systems such as the kidney, lungs, skeleton,endocrine/reproductive, and visual and cardiovascular systems.
14.2 Cadmium Accumulation and Effects in Humans
14.2.1 Kidney and Skeletal Effects
14.2.1.1 Role of Gender
Early occupational studies in Japan of Cd-exposed workers1,17 and multiparouselderly women consuming Cd-contaminated rice demonstrated age-related
Age Related Effects of Cadmium and Possible Roles in Aging Processes 377

accumulation of Cd in kidneys; this was associated with tubular proteinuria,calciuria, and an osteomalacia, known in Japan as Itai-itai disease.1 Similarlosses of bone mineral density have been reported among older females withenvironmental exposures to Cd in Thailand18 and Korea,19 but not Poland.20
Other studies from the US using data from the NHANES III21 showed thatlong-term exposure to environmental cadmium levels was associated withincreased bone mineral loss, increased serum levels of follicle stimulatinghormone (FSH), and urinary cadmium concentrations in women in the 42–60year old age group, suggesting that a complex set of factors may be involved inthe degree of bone mineral loss in females. It is generally agreed that the skeletaleffects of Cd are primarily related to renal toxicity of Cd and depletion ofcalcium body stores since osteomalacia has also been observed in batteryworkers who were occupationally exposed to Cd,1 but Cd-induced hormonaldisruptive effects may also play a role at the level of bone cells.
As noted,14 age and gender comparisons from the NHANES studies, whichare representative of the general US population, demonstrated that females hadmuch higher urinary cadmium concentrations than males. The data show amarked increase in urinary concentrations of Cd in the 6–11 year old age group,with females approximately twice as high as males, followed by a monotonicrise into the 8th decade of life. It is worth noting that since Cd has a half-life inhumans of the order of decades, the early accumulation pattern may well havehealth consequences in later life. More recent studies from Japan22 showedsimilar age-related increases in both blood and urinary Cd as function of age inwomen from the general population. Urinary Cd more closely correlated withproteinuria biomarkers than blood Cd. Other studies15 also reported genderrelated findings using scalp hair as the biomonitoring matrix for Cd, withfemales showing higher concentrations than males. The authors also suggestedan age-dependent hair accumulation of Cd and suggested that it, along withother toxic elements such as arsenic and mercury, may play a role in aging andeven increase the rate of aging. Other Japanese studies23 which measuredurinary markers of oxidative stress, such as 8-OH deoxyguanosine (8-OHDG),found that these markers were positively associated with urinary Cd andnegatively associated with selenium. The probable role of Cd-induced oxidativestress in mediating the target organ system effects of Cd and the more globalassociations of Cd with age-related disease processes will be discussed in greaterdetail in following sections. As noted, the effects of Cd on target organ systemsin humans, such as the kidneys, lungs and skeleton, have been appreciated formany years, but Cd is a broad-spectrum toxic agent that is increasingly beingrecognized to produce toxicity in a number of other organ systems, as discussedin the following sections.
14.2.2 Effects on the Blood Vasculature
More recent studies have also demonstrated effects on cells of the bloodvasculature24–27 and the retina.28–31 In agreement with these laboratory findings,several large scale epidemiological studies32–34 have reported associations of
378 Chapter 14
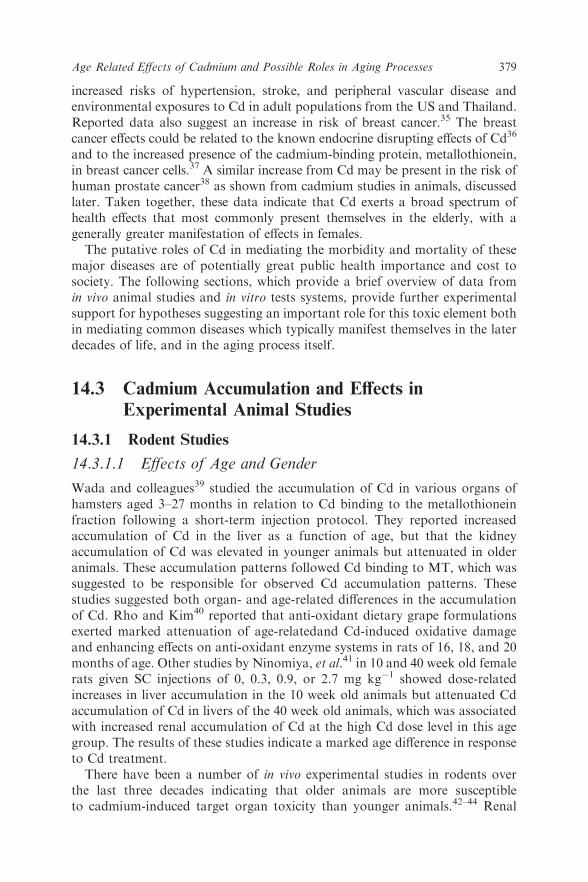
increased risks of hypertension, stroke, and peripheral vascular disease andenvironmental exposures to Cd in adult populations from the US and Thailand.Reported data also suggest an increase in risk of breast cancer.35 The breastcancer effects could be related to the known endocrine disrupting effects of Cd36
and to the increased presence of the cadmium-binding protein, metallothionein,in breast cancer cells.37 A similar increase from Cd may be present in the risk ofhuman prostate cancer38 as shown from cadmium studies in animals, discussedlater. Taken together, these data indicate that Cd exerts a broad spectrum ofhealth effects that most commonly present themselves in the elderly, with agenerally greater manifestation of effects in females.
The putative roles of Cd in mediating the morbidity and mortality of thesemajor diseases are of potentially great public health importance and cost tosociety. The following sections, which provide a brief overview of data fromin vivo animal studies and in vitro tests systems, provide further experimentalsupport for hypotheses suggesting an important role for this toxic element bothin mediating common diseases which typically manifest themselves in the laterdecades of life, and in the aging process itself.
14.3 Cadmium Accumulation and Effects in
Experimental Animal Studies
14.3.1 Rodent Studies
14.3.1.1 Effects of Age and Gender
Wada and colleagues39 studied the accumulation of Cd in various organs ofhamsters aged 3–27 months in relation to Cd binding to the metallothioneinfraction following a short-term injection protocol. They reported increasedaccumulation of Cd in the liver as a function of age, but that the kidneyaccumulation of Cd was elevated in younger animals but attenuated in olderanimals. These accumulation patterns followed Cd binding to MT, which wassuggested to be responsible for observed Cd accumulation patterns. Thesestudies suggested both organ- and age-related differences in the accumulationof Cd. Rho and Kim40 reported that anti-oxidant dietary grape formulationsexerted marked attenuation of age-relatedand Cd-induced oxidative damageand enhancing effects on anti-oxidant enzyme systems in rats of 16, 18, and 20months of age. Other studies by Ninomiya, et al.41 in 10 and 40 week old femalerats given SC injections of 0, 0.3, 0.9, or 2.7 mg kg�1 showed dose-relatedincreases in liver accumulation in the 10 week old animals but attenuated Cdaccumulation of Cd in livers of the 40 week old animals, which was associatedwith increased renal accumulation of Cd at the high Cd dose level in this agegroup. The results of these studies indicate a marked age difference in responseto Cd treatment.
There have been a number of in vivo experimental studies in rodents overthe last three decades indicating that older animals are more susceptibleto cadmium-induced target organ toxicity than younger animals.42–44 Renal
Age Related Effects of Cadmium and Possible Roles in Aging Processes 379

damage has been related to mitochondrial gene deletion in rats45 and found toaccelerate age-related changes in mitochondrial DNA in kidney epithelialcells.46,47 Other studies48 on renal metabolism of calciotropic hormones in agedfemale rats indicated marked decreases in serum 25OH vitamin D and 1,25 di-OH vitamin D and in 1,25 di-OH vitamin D in the renal mitochondrial fraction.These changes were associated with increases in calcitonin and parathyroidhormone. These data were correlated with decreases in renal GFR and alteredbone mineralization and suggest that long-term low dose exposure to Cd mayproduce the known bone demineralization secondary to renal damage via thisphysiological mechanism.
Studies by Yang et al.49 have also noted cadmium-induced death inmesangial cells via an apoptotic pathway involving Ca21 release from the ERand cellular autophagy. Other studies50 have reported that Cd exposureproduces altered insulin metabolism via pancreatic toxicity, possibly leading torenal vascular damage secondary to development of some forms of diabetes.
Organs, such as the testes51 are also sensitive to Cd toxicity, and Cd mayhence play a role in declining sperm counts observed in modern male popu-lations in developed countries. Ototoxicity from Cd exposure52 is anotherimportant effect that clearly has implications for elderly populations.
14.3.2 Effects of In Utero Exposures
Studies in rats concerning the effects of in utero exposure to Cd have reporteddecreased body size.53 Other studies54 have reported delayed effects in renalfunction of offspring of female rats treated with Cd via the oral routethroughout gestation. The changes were not observed until postnatal day 45and renal failure, characterized by decreased GFR and altered excretion ofelectrolytes, was observed at postnatal day 60. The importance of these datarests with the growing appreciation that in utero exposures to toxic agents, suchas Cd, may produce deleterious delayed health consequences at later life stages.
Cadmium exposure has also been demonstrated to produce cancer inexperimental animals and IARC has designated Cd a human carcinogen55
based on combined lines of evidence. The results of these investigations are alsoconsistent with the observations from analogous studies in humans and providefurther impetus for examining the effects of Cd at later stages in life andconsidering the elderly as a subpopulation at special risk for Cd toxicity. Inaddition, the observed low-dose effects of Cd exposure in exacerbating theeffects of the aging process on important organ systems, such as the kidneys,blood vasculature, lungs and skeleton, suggest an important set of inter-relationships from the perspective of public health. The relevance of cadmiumin development of cancer is an obvious concern in elderly populations. Furtherresearch concerning the roles of Cd as a factor in mediating aging processes oftarget organ systems disease is clearly warranted. As discussed in the followingsection, Cd-induced production of reactive oxygen species (ROS) in target cellpopulations appears to play a major role in the mechanisms of Cd toxicity. Theattenuating effects of cellular antioxidant systems, metallothionein, and the
380 Chapter 14

stress protein response must also be considered in developing mode of actionrisk assessment strategies. This observation is of particular importance forelderly organisms in which such protective cellular systems may be diminishedas a result of the aging process itself combined with marginal nutritional status.
Based on the information from the human and animal studies discussed it isclear that there are a number of analogous organ system effects that areproduced by environmental or low-level exposures to Cd. Furthermore, theseeffects seem to exacerbate similar effects produced by the aging process, suchthat organisms at later life stages may be rendered as sensitive subpopulations.This observation has important implications for risk assessment strategies toprotect the public health.
14.4 Molecular Mechanisms of Cadmium Toxicity
14.4.1 Roles of Cd-Induced Oxidative Stress and Anti-Oxidant
Systems
In order to make a clear linkage between Cd exposures and observed targetorgan toxicities, it is essential to have an understanding of the underlyingmechanisms of action and factors, such as age, that may modulate the shape ofthe dose–response curve for a given toxicological endpoint. Cd is a broad-spectrum toxic agent which may affect a number of intracellular systems. Cd-induced production of ROS, leading to oxidative stress, appears to play acentral role in mediating a number of these effects, which include induction ofcellular anti-oxidant systems such as glutathione (GSH), superoxide dismutase(SOD), and the metal-binding protein metallothionein (MT). Attenuatedcontrol of ROS leads to alterations of cell signaling pathways which regulatecellular replication and cell death by induction of apoptosis. The healthconsequences of these events may hence include cancer and physiologicaldecrements in target organ function commonly associated with old age. It mustbe noted that all of these cellular processes are inter-related and the timing anddegree to which these important processes become engaged appear to be largelyregulated by production of ROS and the ability of cells to sequester Cd21 ionsand regulate the production and activity of ROS.
14.4.1.1 Insulin Signaling Pathway Effects
There are a number of papers describing relationships between genes regulatinglongevity in the worm C. elegans and Cd exposure in vitro. Studies by Barsyteet al.56 described the interaction of the insulin-like receptor protein DAF-2,AGE-1 and DAF-16 in mediating resistance to a number of cellular insultswhich produce oxidative stress. In particular, they found that mutations in daf-2 and age-1, but not daf-16, increased resistance to Cd ion toxicity in a 24-hourassay. They also found that induction of MT1 and MT2 was markedly higherin daf-2 mutant worms. They concluded that the insulin signaling pathwaydetermines lifespan in this species by modulating stress-related proteins such
Age Related Effects of Cadmium and Possible Roles in Aging Processes 381

as MT. Regulation of MT hence also influences susceptibility to Cd toxicity inthis species. Subsequent studies by Wang et al.57 studied the combined effectsof Ca and Cd on the lifespan of C. elegans and found that the combination ofthese elements increased oxidative damage and resulted in the inductionof hsp-16. They observed that a mutation in daf-16 increased the toxicity ofCa/Cd on lifespan while mutation of daf-2 attenuated the combined effects ofCa/Cd mixtures on life span. Other studies by Tvermoes et al.,58 who examinedthe metal-inducible genes numr-1 and numr-2, also demonstrated their role inmediating Cd resistance and increasing C. elegans’ lifespan. These findings areof interest in that these genes also act through interactive effects on the insulinsignaling pathway in this species with daf-16 and skn-1.
Studies using mammalian cells from long-lived mouse systems59 have alsoreported increased resistance to oxidative stress produced by agents such as Cdand that these systems also produce reduction of the insulin/GF-1FOXOpathway, which is connected to several other cell signaling pathways. The linkagewith the insulin signaling pathways in relation to longevity in both C.elegans andlong-lived mice is intriguing and seems to suggest an inter-connection withformation of ROS generated by agents such as Cd at a basic molecular level.Studies by other investigators60,61 using cells from long-lived mice have alsodemonstrated resistance to Cd-induced oxidative stress, but the results high-lighted the complexity of this resistance at several levels of biological organ-ization and the involvement with cell signaling pathways, including the inductionof immediate early genes in response to Cd exposure. These investigators62 alsonoted the important protective roles played by cellular anti-oxidant systems inmediating oxidative stress and consequently the aging process.
Studies in mammalian systems have shown similar effects in relation toregulation of the anti-oxidant response element (ARE) by the transcriptionalfactor nrf2 in long-lived Snell dwarf mice.63 The anti-oxidant systems of thesemice (e.g., glutathione) are elevated, and treatment of cells from control micewith an inducer of oxidative stress (arsenite) also increases resistance to otheroxidative stress inducers such as Cd. The authors suggest that the enhancedactivity of genes regulated by the Nrf2/ARE may confer stress resistance in cellsfrom the Snell dwarf mice and hence increase longevity.
14.4.2 Oxidative Stress, Protein Turnover and Chromosomal
Effects
Other recent studies64 on mouse embryo fibroblasts have demonstrated, usingsystem-based gene expression systems, the confirmation of ROS formation inresponse to in vitro Cd exposure, which was associated with alterations in cell-cycle regulation and disruption of the ubiquitin–proteosome system in thesecells. The importance of these data rests with a more complete understanding ofthe mechanisms and consequences of Cd cellular toxicity to essential cellularmachinery that is also intimately involved in the aging process, systemic chronicdiseases, and cancer.
382 Chapter 14

Studies using cultured lymphocytes from young (18–30 years) and old (80–93years) persons65 exposed to Cd demonstrated that those from the older grouphad increased decondensation in both facultive and constitutive regions of theheterochromatin relative to that observed in lymphocytes from youngerpersons. These data suggest that heterochromatin remodeling processes arealtered as a function of age and that consequently the effects of metals, such asCd, on these processes will be changed.
It is important to note that Cd exposure may also alter epigeneticmechanisms of cell injury and cancer. Doi et al.66 recently reported down-regulation of the DNA methyl transferase gene (DNMT3A/3B) in chickembryos incubated with Cd for 60 hours and harvested at a 4 hour time pointrelative to saline controls. They also reported decreased immunoreactivity of50-methyl cytidine (50MeC) at this time point. The 4 hour time point is animportant time period in body wall formation in the chick, and these epigeneticeffects may underlie Cd-induced formation of ventral body wall defects in chickembryos. Other recent reports67 have noted the importance of Cd-inducedformation of ROS in mediating the carcinogenic effects of Cd, which results in apanoply of effects on signal transduction pathways, DNA damage, and theroles of antioxidant systems, stress proteins, and molecular regulatory factorsin mediating these effects. Again, age-related attenuation of these protectivesystems may facilitate the development of Cd-induced cancer in elderlyindividuals.68
14.5 Potential Roles of Cadmium in Aging Processes
It is clear from the previous discussion that Cd could play a role in the agingprocess/longevity via formation of ROS and that older organisms, includingman, have a more limited capacity to deal with Cd-induced cell injury followinglifetime exposures to this element. This limited ability appears to be largely afunction of attenuation of cellular antioxidant systems, such as GSH and SOD,but also includes limitations in the stress protein response including synthesis ofMT. The net result of this interaction between Cd exposures and the agingprocess is that older organisms are more susceptible to the toxic effects of Cd ontarget organ systems, such as the lungs, kidneys, blood vasculature, andskeleton. Hence future risk assessments for Cd should take the elderly intoaccount as a sensitive subpopulation. In addition, based on the previousdiscussion, the female gender seems to be at elevated risk for Cd toxicity, andfurther research is needed to understand the mechanisms underlying thesegender-specific effects.
14.6 Summary and Conclusions
Based on the evidence, it is clear that Cd is a broad-spectrum toxic agentthat accumulates in people over the course of a lifetime and affects a numberof organ systems. These effects usually manifest themselves in the later stagesof life. Females appear to be a subpopulation at particular risk. From
Age Related Effects of Cadmium and Possible Roles in Aging Processes 383

experimental animal and cellular studies, Cd-induced production of oxidativestress in target cell populations is a major underlying cause of toxicity, whichseems to occur largely by the process of apoptosis. The toxic effects of Cd aremodulated by cellular anti-oxidant systems and binding to MT. It appears thatthe capacity of these protective molecular systems attenuates with age, andthese systems may play a role in the manifestations of toxicity which occursin the elderly from life-tem exposures to this element. In addition, it has beenhypothesized that Cd, which is present in all living organisms, may actuallyplay a role in the aging process itself by persistent production of oxidative stressin target tissues until the capacity of anti-oxidant systems becomes depleted.
References
1. G. F. Nordberg, K. Nogawa, M. Nordberg and L. T. Friberg in Handbookof the Toxicology of Metals, eds. G. F. Nordberg, B. A. Fowler,M. Nordberg and L. T. Friberg, Elsevier, Amsterdam, 3rd edn, 2007,pp. 446–479.
2. Ministry of Agriculture and Forestry, Cadmium in Fertilizers: Risks toHuman Health and the Environment, 2000, pp. 1–120.
3. D. W. Engel, W. Sunda and B. A. Fowler in Biological Monitoring ofMarine Pollutants, eds. F. J. Vernberg, A. Calabrese, F. P. Thurberg andW. B. Vernberg, Academic Press, New York, 1981, pp. 127–144.
4. R. Copes, N. A. Clark, K. Rideout, J. Palaty and K. Tesche, Environ. Res.,2008, 107, 160–169.
5. S. V. Adams, P. A. Newcomb, M. M. Shafer, C. Atkinson, E. J. Bowles,K. M. Newton and J. W. Lampe, Sci. Total Environ., 2011, 409, 1632–1637.
6. P. A. Richter, E. E. Bishop, J. Wang and M. H. Swahn, J. Environ. Res.Public Health, 2009, 6, 1930–1946.
7. M. Tellez-Plaza, A. Navas-Acien, K. L. Caldwell, A. Menke, P. Muntnerand E. Guallar, Environ. Health Perspect., 2012, 120, 204–209.
8. R. Apinan, S. Satarug, R. Ruengweeravut, W. Mahavorasirkul andK. Na-Bangchang, Environ. Geochem. Health, 2010, 32, 237–242.
9. H. M. Meltzer, A. L. Brantsaeter, B. Borch-Ionsen, D. G. Ellingsen,J. Alexander, Y. Thomassen, H. Stigum and T. A. Ydersbond, Environ.Res., 2010, 110, 497–504.
10. C. M. Gallagher, J.J. Chen and J.S. Kovach, Environ. Res., 2011, 111,702–707.
11. B. Julin, M. Vahter, B. Amzal, A. Wolk, M. Berglund and A. Akesson,Environ. Health, 2011, 10, 105–111.
12. M. Berglund, A. L. Lindberg, M. Rahman, M. Yunus, M. Grander,B. Lonnerdal and M. Vahter, Environ. Res., 2011, 111, 1271–1279.
13. R. S. Mijal and C. B. Holzman, Environ. Res., 2010, 110, 505–512.14. P. Ruiz, M. Mumtaz, J. Osterloh, J. Fisher and B. A. Fowler,
Toxicol. Lett., 2010, 198, 44–48.15. H. Yasuda, K. Yoshida, Y. Yasuda and T. Tsutsui, Curr. Aging Sci., 2012,
5, 105–111.
384 Chapter 14

16. R. C. Patra, A. K. Rautray and D. Swarup, Veterinary Medicine Inter-national, 2011, Article ID 457327, 9 pages, 2011. doi:10.4061/2011/457327.(www. hindawi.com/journals/vmi/2011/457327/cta, accessed 01/25/2012).
17. G. Kazantsis, Biometals, 2004, 17, 493–498.18. P. Limpatanachote, W. Swaddiwudhipong, M. Nishijo, R. Honda,
P. Mahasakpan, K. Nambunmee and W. Ruangyuttikarn, J. Med.Assoc. Thai., 2010, 93, 1451–1457.
19. M. Shin, D. Paek and C. Yoon, Environ. Res., 2011, 111, 101–109.20. M. Trzcinka-Ochocka, M. Jakubowski, W. Szymczak, B. Janasik and
R. Brodzka, Environ. Res., 2010, 110, 286–293.21. C. M. Gallagher, B. S. Moonga and J. S. Kovach, Environ. Res., 2010, 110,
106–111.22. M. Ikeda, F. Ohashi, Y. Fukui, S. Sakuragi and J. Moriquchi, Int. Arch.
Occup. Environ. Health, 2011, 84, 121–129.23. B. A. Muzembo, D. Narongpon, N. R. Ngatu, M. Eitoku, R. Hirota and
N. Suganuma, Geriatr. Gerontol. Int., 2011 Dec 28. doi: 10.1111/j.1447-0594.2011.00793.x. (Epub ahead of print).
24. W. C. Prozialeck, J. R. Edwards and J. M. Woods, Life Sci., 2006, 79,1493–1506.
25. W. C. Prozialeck, J. R. Edwards, D. W. Nebert, J. M. Woods,A. Barchowsky and W. D. Atchison, Toxicol. Sci., 2008, 102, 207–218.
26. B. Messner, M. Knoflach, A. Seubert, A. Ritsch, K. Pfaller, B. Henderson,Y. H. Shen, I. Zeller, J. Willeit, G. Laufer, G. Wick, S. Kiechl andD. Bernhard, Arterioscler., Thromb., Vasc. Biol., 2009, 29, 1392–1398.
27. E. M. Alissa and G. A. Ferns, J. Toxicol., 2011, doi: 10.1155/2011/870125,21 pages. (www.hindawi.com accessed 01/25/2012).
28. N. K. Wills, V. M. Ramanujam, J. Chang, N. Kalariya, J .R. Lewis,T. X. Weng and F. J. van Kujik, Exp. Eye Res., 2008, 86, 41–51.
29. N. M. Kalariya, N. K. Wills, K. V. Ramana, S. K. Srivastava and F. J. vanKujik, Exp. Eye Res., 2009, 89, 494–502.
30. N. M. Kalariya, B. Nair, D. K. Kalariya, N. K. Wills and F. J. vanKujik,Toxicol. Lett., 2010, 198, 56–62.
31. A. B. Lansdown, Met. Ions Life Sci., 2011, 8, 187–246.32. J. L. Peters, T. S. Perlstein, M. J. Perry, E. McNeely and J. Weuve, Environ.
Res., 2010, 110, 199–206.33. M. Tellez-Plaza, A. Navas-Acen, C. M. Crainiceanu, A. R. Sharret and
E. Guallar, Am. J. Epidemiol., 2010, 172, 671–681.34. W. Swaddwudhipong, P. Mahasakpan, P. Limpatanachote and
S. Krintratun, Environ. Res., 2010, 110, 612–616.35. C. M. Gallagher, J. J. Chen and J. S. Kovach, Aging, 2010, 2, 804–814.36. C. Byrne, S. D. Divekar, G. B. Storchan, D. A. Parodi and M. B. Martin,
Toxicol. Appl. Pharmacol., 2009, 238, 266–271.37. L. Gallicchio, J. A. Flaws, B. A. Fowler and O. B. Loffe, Cancer Detect.
Prev., 2005.38. G. S. Prins, Endocr.-Relat. Cancer, 2008, 15, 649–656.
Age Related Effects of Cadmium and Possible Roles in Aging Processes 385
39. O. Wada, M. Ouchi, S. Manabe, H. Iwai, H. Suzuki, H. Matsui andT. Ono, J. Toxicol. Sci., 1981, 6, 115–22.
40. K. A. Rho and M. K. Kim, J. Nutr. Sci. Vitaminol., 2006, 52, 33–46.41. R. Ninomiya, N. Koizumi and D. Fujita, Environ. Health Prev. Med., 1997,
1, 178–83.42. T. Yamano, M. Shimizu and T. Noda, Toxicol. Sci., 1998, 46, 393–402.43. T. Yamano, S. D. Kosanke and L. E. Rikana, Toxicol. Appl. Pharmacol.,
1999, 161, 225–230.44. K. Uriu, K. Kaizu, Y. L. Qie, A. Ito, I. Takagi, K. Suzuka, Y. Inada,
O. Hashimoto and S. Eto, Toxicol. Appl. Pharmacol., 2000, 169, 151–158.45. S. Takebayashi, S. Jimi, M. Segawa and A. Takai, Clin. Exp. Nephrol.,
2003, 1, 18–26.46. A. Takaki, S. Jimi, M. Segawa and H. Iwasaki, Ann. N. Y. Acad. Sci., 2004,
1011, 3332–3338.47. A. Takaki, S. Jimi, M. Segawa, S. Hisano, S. Takebayashi and H. Iwasaki,
Toxicology, 2004, 203, 145–154.48. M. M. Brzoska and J. Moniuszko-Jakoniuk, Arch. Toxicol., 2005, 79,
636–646.49. L. Yang, K. Wu, W. Chiu, S. Wang and C. Shih, Autophagy, 2009, 5,
571–572.50. J. Edwards and W.C. Proziakeck, Toxicol. Appl. Pharmacol., 2009, 3,
289–293.51. E. R. Siu, D. D. Mruk, C. S. Porto and C. Y. Cheng, Toxicol. Appl.
Pharmacol., 2009, 238, 240–249.52. S. Kim, H. Jeong, N. Myung, M. Kim, J. Lee, H. So, R. Park, H. Kim,
J. Um and S. Hong, Environ. Health Perspect., 2008, 116, 854–862.53. R. Couto-Moraes, L. F. Felicio and M. M. Bernardi, J. Appl. Toxicol.,
2010, 3, 233–241.54. G. Jacquillet, O. Barbier, I. Rubera,M. Tauc, A. Borderie, M. C. Namorado,
D. Martin, G. Sierra, J. L. Reyes, P. Poujeol and M. Cougnon, Am.J. Physiol: Renal, 2007, 293, 1450–1460.
55. International Agency for Research against Cancer (IARC), Beryllium,Cadmium, Mercury, and Exposures in the Glass Manufacturing Industry,Vol. 58, 1997.
56. D. Barsyte, D. A. Lovejoy and G. J. Lithgow, FASEB J., 1002, 15, 627–634.57. S. Wang, M. Tang, B. Pei, X. Xiao, J. Wang, H. Hang and L. Wu, Toxicol.
Sci., 2008, 102, 345–351.58. B. E. Tvermoes, W. A. Boyd and J. H. Freedman, J. Cell Sci., 2010, 123,
2124–2134.59. S. Murakami, Exp. Gerontol., 2006, 10, 2014–2019.60. A. B. Salmon, S. Murakami, A. Bartke, J. Kopchick, K. Yasumura and
R. A. Miller, Am. J. Physiol.: Endocrinol. Metab., 2005, 289, E23–E29.61. A. B. Salmon, A. A. S. Akha, R. Buffenstein and R. A. Miller, J. Gerontol.
A. Biol. Sci. Med. Sci., 2008, 63, 232–241.62. A. B. Salmon, A. Richardson and V. I. Perez, Free Radic. Biol. Med., 2010,
48, 642–673.
386 Chapter 14

63. S. F. Leiser and R. A. Miller, Mol. Cell. Biol., 2010, 30, 871–874.64. T. Lezhava, J. Monaselidze, T. Jokhadze, M. Gorgoshidze, M. Kiladze,
M. Gaiozishvili, Age, 2011, 33, 433–438.65. X. Yu, J. F. Robinson, J. S. Sidhu, S. Hong and E. M. Faustman, Toxicol.
Sci., 2010, 114, 356–377.66. T. Doi, P. Puri, A. McCann, J. Bannigan and J. Thompson, Toxicol. Sci.,
2011, 120, 475–480.67. P. Koedrith and Y. R. Seo, Int. J. Mol. Sci., 2011, 12, 9576–9595.68. E. J. Tokar, L. Benbrahim-Tallaa and M. P. Waalkes, Met. Ions Life Sci.,
2011, 8, 375–401.
Age Related Effects of Cadmium and Possible Roles in Aging Processes 387

CHAPTER 15
Lead Exposure andOsteoporosis: Mechanismsand Clinical Manifestations
J. EDWARD PUZAS,* CATHERINE A. MUZYTCHUKAND JONATHAN D. HOLZ
Department of Orthopaedics, University of Rochester School of Medicineand Dentistry, Rochester, NY 14642, USA*E-mail: [email protected]
15.1 Introduction
Lead exposure and osteoporosis represent two of the most widespread healthconcerns facing the people of the United States and the world. These twoentities are inextricably linked by virtue of the fact that almost all of the lead inhumans resides in their skeleton. Yet the toxic effects of lead on the musculo-skeletal system have been an under-investigated topic. As we betterunderstand the interrelationship between environmental toxins and theskeleton, it should improve our ability to diagnose and treat bone diseases suchas osteoporosis.
Osteoporosis is a disease characterized by an increased risk of skeletalfracture. The underlying causes for the increased risk are numerous; however,the two most important contributing factors are a decrease in bone mass andbone quality. Bone mass is measured with techniques that can assess themineral density at susceptible skeletal sites. The lower the bone mineral density,
Issues in Toxicology No. 16
Aging and Vulnerability to Environmental Chemicals: Age-related Disorders and their Origins in
Environmental Exposures
Edited by Bernard Weiss
r The Royal Society of Chemistry 2013
Published by the Royal Society of Chemistry, www.rsc.org
388

the higher the risk of fracture. Bone quality is an encompassing term thatrelates to the micro architecture of bone, the organic composition of the tissue,the degree of mineralization and the ability to repair micro damaged areas.More recent data has begun to show that environmental agents such as lead cancontribute to decreases in both the mass and quality of the skeleton.
Lead, in its ionic form, affects the functioning of both bone forming cells(osteoblasts) as well as bone resorbing cells (osteoclasts). However, it appearsthat the effects of this heavy metal are more deleterious on the action ofosteoblasts and as such, the normal remodeling process in humans can becompromised. That is, lead decreases the rate of new bone formation relative tothe rate of bone resorption and the skeleton loses mass and quality over alifetime. Interestingly, since lead is stored in the osseous compartment, it ispossible to observe harmful effects on bone, even at blood levels that could beconsidered normal.
In this treatise we will explore the issues of lead in our environment, its routeof exposure and accumulation in the skeleton. We will also discuss how thistoxin affects the cells of bone to predispose exposed individuals to an increasedrisk of osteoporosis.
15.2 Lead in the Environment
The widespread use of lead in manufacturing, gasoline, paints and plumbinghas led to its dispersal throughout the environment.1,2 Lead persists in theenvironment as it binds to soil and cannot be broken down.3 No safe lowerlimit of lead exposure has been found and in fact, recently, the Center forDisease Control in the United States has issued a statement acknowledgingthis. Lead can affect virtually all organs and systems, causing adverse effects inthe reproductive system and kidneys, and exerting a wide variety of neuro-logical and cognitive effects, as well as being a potential carcinogen. We believethat we have identified another target of low level lead exposure that may beaffecting the morbidity of a large part of the population, i.e. the structuralskeleton responsible for mechanical support.
15.2.1 Is Lead a Physiologically Important Environmental
Toxicant?
The answer is a definitive yes. And it may pose serious health issues in bone atlevels well below any adopted safety threshold in blood. That is, bone cells areexposed to lead from two different sources, the extracellular fluid and themineralized compartment of bone. This is due to their proximity to andmetabolism of mineralized tissues, where greater than 90% of the body burdenof lead resides. In fact, it has been shown that bone cells (both osteoclasts andosteoblasts), when cultured on bone wafers containing lead, show a depressedfunction in the absence of any detectable lead in the media. If this phenomenonexists in vivo then it is likely that we are grossly underestimating the effect of thisheavy metal on skeletal metabolism.
Lead Exposure and Osteoporosis: Mechanisms and Clinical Manifestations 389

Lead toxicity has become a controversial topic. Some organizations suggestthat the levels of lead in the environment and in humans are not dangerous. It istrue that the average blood lead level has been decreasing since the late 1960’sand 1970’s and that the childhood lead levels are the lowest in decades,averaging around 6 mg dL�1. These data have been used by organizations suchas the Small Property Owners Association (http://www.spoa.com/pages/lead-paint.html) to make the case that lead is no longer a safety issue in our country.They claim that de-leading houses and raising concerns for new sources of leadis an antiquated idea worthy of abandoning. They also state that the risk oflead poisoning in inner-city homes can be brought to zero with minimalmeasures such as wiping one’s feet upon entering the house. Although some ofthese points are based on research data, many claims have been taken out ofcontext. The overwhelming evidence in the literature supports the fact that leadremains an environmental problem. In fact, as our ability to perform carefulclinical and basic science research becomes more refined, it is apparent that10 mg dL�1 in blood is no longer a safe threshold. A recent case in point showsthat there is a decrease in IQ in children with each 1.0 mg dL�1 increase in bloodlead levels and that the effect is largest at levels below 10 mg dL�1.4 This toxin,previously thought to be harmless below 10 mg dL�1, is not.
We now have definitive data demonstrating that a stunting of skeletal growthin children, a predisposition to osteoporosis later in life and a compromisedability to heal osteoporotic fractures are all manifestations of lead-exposedindividuals. The fact that women currently entering the menopause had thegreatest exposure to lead in their formative years (in the 1960’s and early1970’s) suggests that we may on the verge of experiencing a significant increasein lead-related osteoporotic fractures.
15.2.2 Routes of Exposure
Elemental lead has two primary routes of absorption into the body, oralingestion and inhalation. Lead may also be absorbed through cuts in the skin,however an intact integument represents a barrier to absorption. One third toone half of inhaled lead is absorbed into the bloodstream. Aside from behaviorthat increases lead exposure, physiological differences contribute to elevatedlead exposure in children. The intestinal track of young children absorbs30–40% of ingested lead, while adults absorb only 5–10%. In spite of reducedabsorption in adults, lead bioaccumulates over time due to its slow release fromthe body. Once ingested, the skeleton acts to sequester lead, effectivelyremoving it from the bioavailable extracellular fluid pool, and documentedfindings have confirmed that the skeleton is the major reservoir of lead in thebody (harboring nearly 95% of the total lead burden). Once stored in theskeleton, the half-life of lead has been estimated to be from 20 to 30 years.5–7
Lead localized to the bone continues to contribute to toxicity by exposing bonecells to high concentrations, even though circulating and soft tissue levels arelow. Additionally in times of excessive skeletal remodeling, such as menopause,paraplegic immobilization, endocrine diseases such as thyrotoxicosis, and after
390 Chapter 15

a fracture, the re-release of lead from bone back into circulation8–11 can elevateblood levels by 2–5 mg dL�1.
15.2.3 Bioaccumulation of Lead
Lead is an insidiously unique toxicant in that no safe level of lead exposure hasbeen found. In general, animals bioaccumulate lead due to its long half-life inthe body and persistence in nature, providing continued exposure; however,biomagnification up the food chain does not generally occur. Additionally,increases in environmental lead have given rise to increased body burden, withpreindustrial skeletons of native Americans containing 1000 fold lower leadlevels than modern counterparts. As lead affects numerous organs and systems,its compartmentalization and deposition throughout the body is of greatinterest. Of US preschoolers, 10–15%, have blood lead levels above the formerCenter for Disease Control (CDC) acceptable range.
15.2.4 Blood Levels, Intracellular Concentrations, Mitochondrial
Storage
Blood levels are a poor surrogate for assessing long-term lead exposure as thehalf life for the metal in blood is 30 days12 and in serum is between 100 and 200days. However, for assessing short-term exposure where 99% of lead is boundto erythrocytes, blood lead levels can be a sensitive metric. While in the blood,lead is capable of passing through the blood brain barrier and placenta.Furthermore, blood lead levels reflect the interaction of environmental levelswith humans as the mean blood lead level of persons between the ages of 1 and74 has gone from 12.8 mg dL�1 in 1976 to 2.8 mg dL�1 in 1991.
Cellular uptake of lead can vary dramatically between cell types, with dorsalroot ganglia allowing no entry13 and cultured CHO cells taking up lead toachieve a concentration of 97 mM.14 It seems that cells of the skeleton, such asosteoblasts and chondrocytes, have intracellular lead levels hovering around120–180 nM.
Mitochondria serve as an intracellular calcium storage site and contain acalcium transporter on the inner membrane to sequester calcium from thecytosol into the mitochondrial matrix. This transporter also moves lead into themitochondrial matrix and exhibits an even greater affinity for the heavymetal.15 This lead sequestration could result in higher levels of lead in themitochondrial compartment and is known to interfere with mitochondrialcalcium uptake.16
15.2.5 Lead in the Skeleton and Teeth
As a divalent cation, lead exhibits a strong affinity for calcified tissues of theskeleton and dentition, with490% of the total body burden residing in bone.17
It has been shown that levels of lead in pre- and post-natally formed dentine
Lead Exposure and Osteoporosis: Mechanisms and Clinical Manifestations 391

and enamel correlate with blood lead levels at the time of their formation,18 andtooth lead levels have been used as an indicator of exposure in adults as well.19
Experiments using lead isotopes show that in humans, 40–70% of blood leadoriginates from re-release of skeletal repositories.20 Bone and tooth lead levelsare more indicative of long-term lead exposure levels, relative to blood, as thehalf-life of lead in bone is estimated to be over 20 years. Due to a slower relativeturnover rate, cortical bone may have a longer half-life of lead retention thantrabecular bone. To measure bone lead levels, k-shell X-ray fluorescencespectrometry (k-XRF) can be used. The latest generation of instrumentsemployed utilizes a 109Cd source to excite the lead K shell electrons to producegamma rays (i.e., X-ray fluorescence) and a four detector array, each with itsown multi-channel analyzer. This system is more precise than earliergenerations and can accurately detect lead levels in the range of 2–4 mg g�1
bone.
15.3 Skeletal Effects of Lead
15.3.1 Suppression of 1,25-Dihydroxycholecalciferol
Until relatively recently, it was held that skeletally sequestered lead was inertwith regard to the body’s soft tissues; however, a growing body of evidenceshows that lead can exert its toxic effects upon the skeletal system directly andindirectly. One of the most important and far-reaching of these effects isreducing vitamin D levels. The effect of lead on vitamin D was proposed as anexplanation for the observed correlation between elevated lead levels andosteoporosis.21 This correlation was corroborated by associative findingslinking lead exposure to reductions in active vitamin D levels22,23 and the abilityof ethylenediaminetetraacetic acid (EDTA) chelation to restore the levels. Themechanism behind the suppression of vitamin D is most likely due to severalnon-mutually exclusive factors. It is well established that oral lead exposure canlead to appetite suppression and vomiting.24 Reduction in overall food intakecould contribute to reduced vitamin D intake. The ability of EDTA to restore1,25 (OH)2 vitamin levels without altering levels of 25 (OH) vitamin D points tolead impairment of renal biosynthesis of the active form of the vitamin, and thisrenal impairment has been shown to be a secondary effect of lead toxicityresulting from a reduction in the heme body pool.25 Lead-induced musculo-skeletal pathologies result from direct effects of lead on the cells of this system;however, the possible contribution of vitamin D suppression to these skeletalpathologies is an important factor.
15.3.2 Developmental Effects
The spatial distribution of lead in the proximity of the growth plate is evidencedradiographically by lead lines.26,27 Exposure to lead in utero as well as post-natally can disrupt normal skeletal development. It compromises chondrocyte
392 Chapter 15

function, leads to skeletal malformations, reduces bone formation rates andprevents children from achieving a normal stature. Ronis et al. found that miceexposed to lead from gestational day 4 to day 55 had significantly ‘‘reducedsomatic growth, longitudinal bone growth, and bone strength’’ compared tocontrols.28 Maternal lead exposure prior to and throughout pregnancy waslikewise shown to reduce early post-natal growth as measured by tail length andtail vertebral bone growth.29 Moreover, data from NHANES II in humansshowed that blood lead levels of 20–30 mg dL�1 were associated with decreasedheight in children aged 1–7.30,31 The data showed a 1.57 cm decrease in statureand 0.52 cm decrease in head circumference for every 10 mg dL�1 increase inblood lead concentration.32 Even in utero lead may be exerting skeletal effects,as prenatal lead exposure has been linked to shorter birth lengths.33,34 Inter-estingly, lead suppression of skeletal growth continues well after the cessationof exposure, a finding that implicates the skeletal release of lead in extendingthe duration of its effect. Chelation, however, was found to amelioratesuppression of skeletal development by lead.35
Lead has been shown to delay growth plate chondrocyte maturation,36,37 butthe most probable mechanism by which lead toxicity on skeletal maturationoccurs is through inducing a defect in osteoblast function. Historically, therehave been a number of reports describing the effect of lead on osteoblasts.38–41
These studies have been performed in transformed cell lines, freshly isolatednormal cells and in in vivo experiments. Uniformly, it has been observed thatlead is deleterious to the functioning of these cells. The metal ion has beenshown to inhibit secretion of osteonectin, alkaline phosphatase activity andtype I collagen synthesis.42,43 Lead also adversely affects osteoblast cellproliferation and the effect of regulatory growth factors.44,45
In animal experiments directly analogous to what occurs in humans, it hasbeen shown that osteoblast activity is suppressed and stem cell frequency isdecreased with lead exposure. In dogs, lead exposure resulted in a suppressionof osteoblastic activity that continued after cessation of exposure.46 In micethat were exposed to lead in their drinking water for 6–12 weeks,47 osteogenicprecursor cells isolated from bone marrow demonstrated a decreased numberof mineralized nodules, a measure of osteogenic precursor cell frequency. Evena brief exposure of the animals to lead led to an approximately 50% decrease incolony forming ability. This occurred at a dose of 55 ppm lead in the water.This concentration achieved a blood lead level in the mice similar to thatobserved in exposed humans (i.e. approximately 20 mg dL�1).
One of the key paracrine factors that regulates the progression of cells frommesenchymal stem cells into osteoprogenitor cells is TGF-b. The currentthinking is that the TGF-b pathway stimulates the expansion of osteoblastnumbers and maintains a pool of cells that can be primed for newbone formation.48 Inhibition of the pathway would then favor a depletionof osteoprogenitor cell number. Recent data support this observation andsuggest that the mechanism by which lead has its effects on bone formation mayinvolve a decrease in the pool of phosphorylated TGF-b intermediates inexposed cells.
Lead Exposure and Osteoporosis: Mechanisms and Clinical Manifestations 393

15.3.3 Delayed Tooth Development and Increased Incidence of
Dental Caries
Lead also affects another of its mineralized repositories, delaying toothdevelopment and increasing the incidence of dental caries. Eruption rate andenamel formation are both susceptible to lead.49 In rats, intraperitonealinjection of lead acetate was responsible for delaying tooth eruption rate anddecreasing mineralization.50 These findings implicate enamel development as atarget of lead toxicity. A potential mechanism by which lead might be exertingthese effects is disruption of specific enzyme cascades, a mechanism common toother lead pathologies. Enamel mineralization occurs on a protein scaffold(i.e. amelogenin), which is then removed by matrix metalloproteinases;51 lead,however, disrupts the activity of these enzymes.52
A number of epidemiological studies have found an association between highlead levels and the presence of dental caries. Analysis of the third NHANESstudy showed an association between elevated blood lead levels and dentalcaries in both deciduous and permanent teeth.53 In a survey of children aged6–10 years, a positive correlation between lead levels and dental caries wasagain found, with a stronger association observed in primary teeth thanpermanent teeth, as well as higher incidence of caries on occlusal, lingual andbuccal tooth surfaces.54 Furthermore, the ability of lead to exert effects beyondinitial exposure was again demonstrated when it was found that infants (aged18–37 months) exposed to lead were more likely to have developed caries on thelingual surface of their primary teeth than later in life.55
15.3.4 Fracture Healing and Incidence of Non-Union
Paralleling the inhibitory effect of pre- and perinatal lead exposure on skeletaldevelopment, lead exposure in older animals has also been shown to delayfracture healing and increase the incidence of fibrous non-unions.56 Theseinvestigations utilized a closed tibial model of fracture on mice that had beentreated with lead for 6 weeks and found that bridging cartilage formation andoverall amount of cartilage types II and X were suppressed and delayed, as wasmaturation and calcification of osseous tissue. No effects on osteoclasts wereobserved, therefore the observed effects were attributed to disruption ofchondrocyte function, resulting in inhibition of endochondral ossification.Lead was shown to exert effects on chondrocyte populations through themodulation of TGF-b and BMP signaling. Taken in concert, these findings onchondrocytes offer a mechanistic explanation of shorter birth lengths. Leadcauses an initial increase in chondrogenesis, resulting in increased growth plateactivity but with premature closure and overall reduction in bone mineral-ization and density, while in the fracture callus, this process is paralleled andossification is delayed and reduced. Not only are these findings important forobserving lead effects on fracture healing, but in the larger scope of skeletalpathology, they show that lead can affect chondrocytes through disruption ofTGF-b signaling.
394 Chapter 15

15.4 Osteoporosis and the Mechanism of Lead Toxicity
in Bone Cells
15.4.1 Osteoporosis
While the developing skeleton may be susceptible to lead toxicity at lower dosesor shorter exposure times, the adult skeleton also is a vulnerable target.57 Alongwith increased tooth degeneration and disruption of fracture healing, numerousstudies have identified a reduction in bone density as an effect of lead exposure.Examination of NHANES II data revealed a positive correlation betweenblood lead levels and osteoporosis in post-menopausal women.58 A case studypresented by Berlin et al. similarly found evidence of elevated skeletal turnoverand osteoporotic fracture in a lead poisoned individual.59 Animal studies havefurther elucidated lead effects on bone density. After 7 months of low-level leadexposure, adult beagles experienced reductions in bone formation rates.60 Inadult rats exposed to lead, during which they maintained a biologically relevantblood level of 21 mg dL�1 for one year, a significant decrease in bone densitywas observed.61 The cellular mechanisms for this effect included a number ofbone related processes, as reviewed by Holz et al.62 In lead-exposed adults,Ronis et al. found decreased bone density and less formation of new endostealbone.63 Lead-induced disruption of bone density resulted from inhibition ofosteoblastogenesis,64 as well as increased osteoclast number, potent inhibitionof downstream effects of vitamin D and (it was speculated) inhibition ofcollagen or collagen precursor synthesis.65
15.4.2 Mechanisms of Action for Lead Toxicity
15.4.2.1 Enzyme and Kinase Inhibition
Heavy metals such as lead are transported across cell membranes and caninterfere with a number of cellular processes. In particular, kinase activities canbe markedly affected. This would include the kinases associated with Smadphosphorylations in the TGF-b and BMP pathways. Since these are keypathways for the control of mesenchymal stem cell expansion and differen-tiation, they represent a sensitive target for agents such as lead.
15.4.2.2 Generation of Reactive Oxygen Species
Reactive oxygen species (ROS) are oxygen containing molecules with highlyreactive unpaired valence electrons. These molecules are produced as normalbyproducts of cellular respiration but can exert a number of toxic effects, suchas damaging DNA and forming adducts with cellular molecules.66 One possiblesource of the ROS that have been associated with musculoskeletal disease islead. As stated, lead accumulation at concentrations greater than that seen inbone and blood occurs in the articular cartilage, synovial fluid and mineralizedcartilage matrix. Furthermore, heavy metals have been shown to induce ROS
Lead Exposure and Osteoporosis: Mechanisms and Clinical Manifestations 395

production through the widely known Fenton reaction, involving iron.67
Interestingly, Huang et al. found that lead induced ROS in S. alfredii roots68
and, more importantly, has been shown to induce oxidative stress in mice.69
High levels of lead and cadmium have been associated with elevated levels ofROS in humans.70 Mechanistically, lead depletes cellular defenses againstoxidative stress, such as glutathione and protein-bound sulfhydryl groups, andexerts pro-oxidant activity through Fenton-like reactions, phagocytic cellrecruitment and redox cycling quinines. These combined effects result in anincreasingly oxidized cellular state.71 DNA damage, formation of other adductsand alterations in ROS sensitive signaling pathways are some of themechanisms by which ROS play a well-documented role in pathologicaletiologies, and their role in heavy metal toxicity further illustrates this. Stohset al. reasoned that the cell damage caused by heavy metals was due at least inpart to ROS generation, and Ercal et al., reviewing a more recent and broaderliterature base, go further and state that most heavy metal pathology is exertedthrough ROS and disruption of oxidative state.72 Ahamed et al. concluded thathypertension, kidney disease, neurodegenerative disease and cognitiveimpairment could be caused by ROS generated by high-level lead exposure andthat increasing evidence for low-level lead exposure similarly affecting thesediseases was accruing.73 Furthermore, lead disrupts the expression of growthfactor receptors through ROS intermediates,74 and lead generated ROS is alsoknown to induce apoptosis.
15.4.3 Bone Mass and Osteoporosis
Osteoporosis is a disease of epidemic proportions in the United States, with anestimated 25million affected individuals.75,76 The health care costs associatedwith treatment of osteoporotic hip and spine fractures and associatedmorbidity may exceed $15 billion per year. During childhood and adolescence,bone mass accretion occurs through both the activities of the chondrocytes inthe growth plates and the bone forming activity of osteoblasts. Thus bone massand bone mineral density (BMD) gradually increase during growth. Bone massis a reflection of the relative rates of bone formation and bone resorption, andcontinues to increase into early adulthood after growth plate closure, until peakbone mass is reached at age 25–30. After peak bone mass is reached, boneresorption rates exceed formation rates, and there is a gradual loss of bone withfurther aging in both men and women. At menopause, the loss of estrogenresults in an acceleration of the rate of bone loss, which occurs overapproximately a 10 year period, subsequently slowing to a rate resembling pre-menopausal bone loss. Systemic stimuli of bone resorption, such as cortico-steroids, thyroid or parathyroid disease, can further enhance the rate of boneloss. BMD correlates directly with bone strength and inversely with fracturerisk. As bone is lost, an individual can cross a theoretical ‘‘fracture threshold,’’where the BMD and associated bone strength are insufficient to resist non-traumatic forces on the bone and can lead to fractures. Men achieve greater
396 Chapter 15

peak bone mass levels and are not subject to the accelerated decline associatedwith menopause, so bone density levels are less likely to cross the fracturethreshold, explaining the 5–6-fold higher incidence of osteoporosis in women ascompared to men. Also, there are other genetic determinants of bone mass,such as race. Black men and women have been shown to have higher peak bonemass compared with White and Hispanic individuals, thus accounting for thedecreased incidence of osteoporosis among Blacks. Antiresorptive treatmentssuch as estrogen, estrogen analogs and bisphosphonates at menopause havebeen shown to prevent accelerated bone loss and reduce fracture risk inperimenopausal women.77–82 The inhibitory effects of lead on chondrocytesand osteoblasts could result in attainment of a lower peak bone mass, predis-posing lead-exposed individuals to osteoporosis later in life. Furthermore, leadreleased from bone matrix during increased resorption, such as at menopause,could increase local concentrations at bone surfaces, worsening the inhibitionof osteoblastic bone formation and therefore accelerating the loss of bone byfurther disturbing the balance of bone formation and resorption. Osteoporosisassociated with lead intoxication has been previously reported,83 consistentwith our own findings and those of others who have shown lead toxicity causingosteopenia in animal models.
15.4.3.1 Bone Quality vs. Bone Density
Bone densitometry with dual energy X-ray absorptiometry (DXA) has been anextremely valuable tool for the identification of patients with low bone mass. Infact, the operational definition for osteoporosis has been defined as at-scorer�2.5 as measured by DXA. At this time, and probably for areasonable period into the future, DXA will remain the gold standard for thediagnosis of patients with osteoporosis and a tool to measure the effect ofmedications.84 However, as has become more apparent over the past five years,there are a number of measurements of bone strength that cannot be explainedsolely on changes measured by DXA. This is due to the inherent limitations ofthe DXA measurements.85 DXA cannot distinguish i) specific attributes of 3Dgeometry, ii) cortical vs. cancellous density, iii) trabecular architecture andiv) intrinsic material properties of bone matrix. Because of this, the correlationof DXA data with bone strength varies considerably and ranges from r2¼ 0.5to 0.7 at different sites in the body (i.e., radius, vertebrae and proximal femur).Furthermore, the ability of DXA to predict changes in fracture risk aftertreatment with medications is also low.
When these data are analyzed with logistic regression models, they show thatthe ability of DXA to predict fracture risk reduction is poor. The percentagechange in bone mineral density with various treatments accounts for only asmall percentage of the observed reduction in fracture risk.86–92 The impli-cations of these findings are that changes other than bone density have occurredthat account for the increase in strength. That is, osteoclast and osteoblastactivity has been able to create a skeletal structure that resists mechanical forceswith only a small change in the total amount of bone.
Lead Exposure and Osteoporosis: Mechanisms and Clinical Manifestations 397

The work by Hochberg et al.93 analyzed the change in BMD as a function ofantiresorptive therapy and found a regression line that showed a change inbone strength that was only partially dependent on BMD. In this work, theauthor plotted the percent change in BMD vs. the relative risk of fracture. IfBMD could explain entirely the change in fracture risk, then at a ‘‘0’’ percentchange in BMD the relative risk of fracture should be 1.0. What they found wasan approximate 30% reduction in fracture risk with a 0% change in BMD. Thissuggested that the medications were altering another parameter of bonestrength that was independent of the quantity of bone. This parameter is likelyto be the micro architecture of the tissue.
A more careful analysis of skeletal structure has documented at least eightparameters of architecture that can be involved in altering the mechanicalstrength of the bone. These micro architectural parameters can be measuredwith micro computed tomography and magnetic resonance imaging. Usingthree of these analytic measures, Dufresne et al. 94 showed that within 1–2years after the menopause, bone mineral density can decrease by a littlemore than 3%, but deterioration of the micro architecture and true 3D bonedensity can occur to levels of 13–20%. These findings highlight the need toevaluate parameters of bone quality other than simple density with DXA.Additionally, the picture appears more complex as age, prior fracture andskeletal turnover also appear to contribute independently to the risk offracture.95–98
15.4.4 Lead and Osteoporosis
Our hypothesis, along with preliminary data in both in vitro and in vivo animaland human models, suggests that a significant proportion of people withosteoporosis may have the disease due to lead exposure and that lead in theskeleton will prevent normal healing of fractures.
It appears that environmental lead exposure prevents a person from attaininga high peak bone density during skeletal development. This is accomplishedmechanistically by interfering with endochondral bone formation andbone remodeling. Additionally, compromising osteoclast and osteoblast func-tion would cause an individual to cross over a ‘‘fracture threshold’’ at an earlierage and predispose them to a decrease in bone strength and osteoporoticfractures.
15.4.4.1 Lead and the DXA Measurement Artifact
The skeletal data on rats with lead exposure is somewhat controversial. Gruberet al.99 demonstrated that lead caused a decrease in bone mass by DXA,histomorphometry, and mineral analysis. In a subsequent study, the effect oflead exposure was ameliorated by calcium supplementation.100 Lead-exposedrats have also been shown to have decreased femoral weights and L5 vertebralbody heights, as well as histomorphometric evidence of osteopenia.101
398 Chapter 15
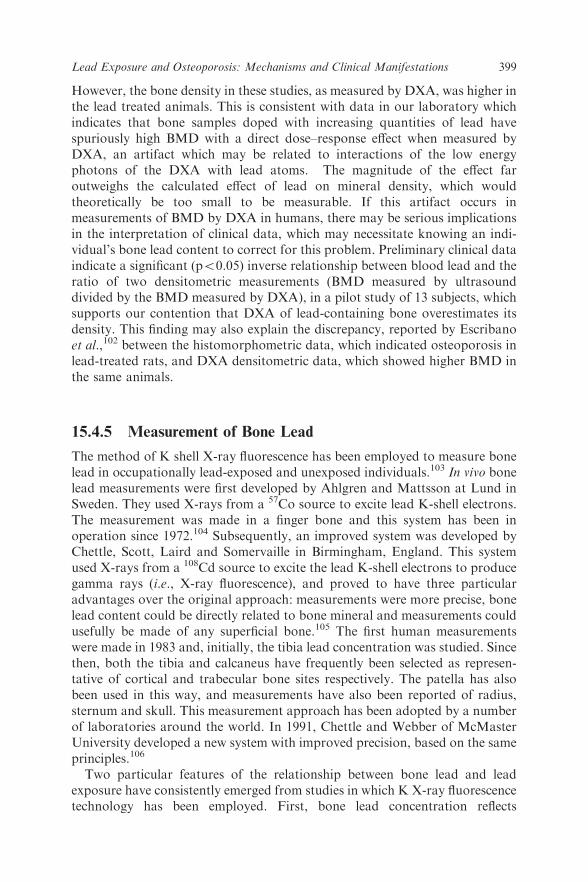
However, the bone density in these studies, as measured by DXA, was higher inthe lead treated animals. This is consistent with data in our laboratory whichindicates that bone samples doped with increasing quantities of lead havespuriously high BMD with a direct dose–response effect when measured byDXA, an artifact which may be related to interactions of the low energyphotons of the DXA with lead atoms. The magnitude of the effect faroutweighs the calculated effect of lead on mineral density, which wouldtheoretically be too small to be measurable. If this artifact occurs inmeasurements of BMD by DXA in humans, there may be serious implicationsin the interpretation of clinical data, which may necessitate knowing an indi-vidual’s bone lead content to correct for this problem. Preliminary clinical dataindicate a significant (po0.05) inverse relationship between blood lead and theratio of two densitometric measurements (BMD measured by ultrasounddivided by the BMD measured by DXA), in a pilot study of 13 subjects, whichsupports our contention that DXA of lead-containing bone overestimates itsdensity. This finding may also explain the discrepancy, reported by Escribanoet al.,102 between the histomorphometric data, which indicated osteoporosis inlead-treated rats, and DXA densitometric data, which showed higher BMD inthe same animals.
15.4.5 Measurement of Bone Lead
The method of K shell X-ray fluorescence has been employed to measure bonelead in occupationally lead-exposed and unexposed individuals.103 In vivo bonelead measurements were first developed by Ahlgren and Mattsson at Lund inSweden. They used X-rays from a 57Co source to excite lead K-shell electrons.The measurement was made in a finger bone and this system has been inoperation since 1972.104 Subsequently, an improved system was developed byChettle, Scott, Laird and Somervaille in Birmingham, England. This systemused X-rays from a 108Cd source to excite the lead K-shell electrons to producegamma rays (i.e., X-ray fluorescence), and proved to have three particularadvantages over the original approach: measurements were more precise, bonelead content could be directly related to bone mineral and measurements couldusefully be made of any superficial bone.105 The first human measurementswere made in 1983 and, initially, the tibia lead concentration was studied. Sincethen, both the tibia and calcaneus have frequently been selected as represen-tative of cortical and trabecular bone sites respectively. The patella has alsobeen used in this way, and measurements have also been reported of radius,sternum and skull. This measurement approach has been adopted by a numberof laboratories around the world. In 1991, Chettle and Webber of McMasterUniversity developed a new system with improved precision, based on the sameprinciples.106
Two particular features of the relationship between bone lead and leadexposure have consistently emerged from studies in which K X-ray fluorescencetechnology has been employed. First, bone lead concentration reflects
Lead Exposure and Osteoporosis: Mechanisms and Clinical Manifestations 399

cumulative lead exposure. Cumulative exposure can be represented by thetime-weighted integral of blood lead, monitored regularly in lead-exposedworkers. Second, release of lead from bone contributes to circulating leadin blood, thus constituting an endogenous exposure. This relationship isparticularly clear when industrial exposure has ceased. For such people,endogenous exposure can often be the dominant contributor to currentblood lead.
15.4.6 Skeletal Effects of Lead Exposure – in vitro and Animal
Studies
Lead has been associated with both low birth weight and short stature,although there is controversy as to whether this results from specific skeletaleffects or is related to systemic and nutritional factors.107–109 Substantialpreliminary data demonstrate potent specific effects of low levels of lead onchondrocytes, osteoblasts, osteoclasts, and mesenchymal stem cells. In vitrostudies have shown that lead has specific effects on growth plate chondrocytesthat alter cell phenotype and function.110 Also, potent inhibitory effects onosteoblast and osteoclast phenotype and function have been demon-strated.111–113 suggesting that lead may have effects on bone development andremodeling. Importantly, lead toxicity at environmentally relevant levels hasbeen shown to decrease BMD in rats and produce osteoporosis in other animalmodels.114–116 Thus while systemic effects of lead on other organ systems mayinfluence the skeleton, there appears to be direct effects of low levels of lead onthe cells involved in bone development, remodeling and repair. Examination ofthe histomorphometry of lead intoxicated rats shows abnormalities of thegrowth plates, including defective remodeling and altered growth platethickness, with loss of proliferating cells and disorganization of the growthplate architecture.117
15.4.7 Skeletal Effects of Lead Exposure – Clinical Studies
Despite the extensive laboratory research on the effects of lead exposure onbone metabolism, human studies on this association are limited. Laraque et al.found that lead-exposed African-American children had a higher mean mineralcontent than age-matched, white norms.118 At age 36–47 months, the meanbone mineral content of the radius of the lead-exposed subjects and normswere 0.268 gm cm�2 vs. 0.215 gm cm�2 respectively (po0.005). The authorsattributed the findings to racial differences in bone density. In further analyses,Laraque plotted age against bone density among children with low vs. high leadexposure (i.e., blood lead levelr29 mg dL�1 vs. Z30 mg dL�1); the difference inbone density was not significant (p¼ 0.63). Laraque concluded that leadexposure is not associated with changes in bone mass. However, since thecomparison group was made up of children with moderate-level lead exposure
400 Chapter 15

(i.e., blood lead level 12–29 mg dL�1), such an analysis cannot exclude thepossibility that lead exposure has a threshold effect on bone density at lowerblood lead levels.
Although recent studies report a dramatic decrease in the prevalence of leadexposure in the US,119,120 this does not imply that adults have not had exposurein the past. As recently as the late 1970s, 78% of the entire US population—children and adults—had blood lead levels Z10 mg dL�1,121 the threshold ofconcern defined by the Centers for Disease Control (CDC, 1991) at that time.This means that the majority of adults in the US had, at some time in the past,an elevated blood lead level, and therefore currently have elevated bone leadlevels, given the extremely long half life of lead in bone (t1/2¼ 20 years).122 Withthis large number of adults who have elevated bone lead levels, and themorbidity associated with osteoporosis, it is important to investigate whetheran association exists between lead exposure and the disease, osteoporosis. Thisresearch, however, should not be limited to adults. Although osteoporosis is anaffliction of the elderly, its roots may be established during childhood. Anindividual who does not achieve peak bone mass during childhood may be atrisk for osteoporosis in later life.123 Since 90% or more of bone mass isachieved by age 17–20 years,124,125 the association between lead exposure andbone density should be examined among children and skeletally matureadolescents.
15.5 Summary
In summary, lead toxicity in the skeleton is emerging as an important riskfactor in diseases of bone, especially in older adults and women. These wouldinclude such conditions as growth plate defects, impairment in remodeling,fracture healing and osteoporosis. It appears that an exposure to lead, even atan early age, can predispose individuals to any of these conditions, with thepossibility of more serious manifestations later in life. Osteoporosis is the mostwidespread of these afflictions and consumes the greatest number of health caredollars. When considering the effects of lead exposure on osteoporosis, it isimportant to note that the effects of lead may begin prior to development of apeak bone density. Considering that the half-life of lead is of the order ofdecades, even an early exposure can be a life-long hazard to one’s skeletalhealth. This is diagrammatically depicted in Figure 15.1.
Early exposure will prevent attaining a peak bone mass that can protect anindividual later in life. Lead exposure also accelerates the rate of bone loss afterthe menopause, driving a number of individuals, mainly females, across afracture threshold at younger age. Along with these effects of lead in bone, theheavy metal tends to mask the diagnosis of low bone mass by DXA andprevents the body from normally healing fractures. All things considered,significant lead exposure in humans, though decreasing in incidence, continueto represent a real health hazard to the skeleton.
Lead Exposure and Osteoporosis: Mechanisms and Clinical Manifestations 401

References
1. B. L. Gulson, K. J. Mizon, J. D. Davis, J. M. Palmer and G. Vimpani,Environmental Health Perspectives, 2004, 112(1), 52–60.
2. P. Glorennec, C. Peyr, J. Poupon, Y. Oulhote and B. Le Bot, Journal ofOccupational and Environmental Hygiene, 2010, 7(5), 253–260.
3. B. Wilson and F. B. Pyatt, Ecotoxicology and Environmental Safety, 2007,66(2), 224–231.
4. R. Lanphear, J. Hornung, K. Khoury, P. Yolton, D. C. Baghurst,R. L. Bellinger, K. N. Canfield, R. Dietrich, T. Bornschein, S. J. Greene,H. L. Rothenberg, L. Needleman, G. Schnaas, Wasserman andJ. Graziano, Environ Health Perspect, 2005, 113, 894–899.
5. N. Khalil, L. A. Morrow, H. Needleman, E. O. Talbott, J. W. Wilson andJ. A. Cauley, Neuropsychology, 2009, 23(1), 10–19.
6. E. W. Grimsley and L. Adams-Mount, South Med J, 1994, 87(7),689–691.
High Risk of Fracture
Age
Unexposed male
Unexposed female
Pb-exposed female(hypothesized)
Bon
e M
iner
al D
ensi
ty
10 20 30 40 50 60 70 80
Figure 15.1 The general trends for bone mineral density (i.e., skeletal mass) in malesand females is depicted in this stylized diagram. Both males and femalesachieve a peak bone density between the ages of 20 and 30. Skeletal massthen plateaus for approximately 20 to 30 years, at which time all indi-viduals begin to lose bone. Healthy males that are not exposed to highlevels of lead infrequently cross the ‘‘fracture threshold’’ during a normallifespan. However, females, by virtue of the fact that they never attain thesame peak density as males and lose bone more rapidly after themenopause, enter a region of high fracture risk more often than males.All laboratory and clinical evidence points to the observation that lead-exposed females do not reach the same density as unexposed females andlose bone at an even faster rate than their healthy counterparts. Thiswould hypothetically lead to crossing into the high fracture risk region atan earlier age.
402 Chapter 15

7. J. O. Christoffersson, L. Ahlgren, A. Schutz, S. Skerfving andS. Mattsson, Arch Environ Health, 1986, 41(5), 312–318.
8. E. K. Silbergeld, J. Schwartz and K. Mahaffey, Environ Res, 1988, 47(1),79–94.
9. M. Shannon, H. Lindy, C. Anast and J. Graef, Vet Hum Toxicol, 1988,30(6), 586–588.
10. R. H. Goldman, R. White, S. N. Kales and H. Hu, Am J Ind Med, 1994,25(3), 417–424.
11. E. Symanski and I. Hertz-Picciotto, Am J Epidemiol, 1995, 141(11),1047–1058.
12. M. B. Rabinowitz, Environ Health Perspect, 1991, 91, 33–37.13. R. Domann, L. Wunder and D. Busselberg, Cell Mol Neurobiol, 1997,
17(3), 305–314.14. J. P. Wise, D. M. Stearns, K. E. Wetterhahn and S. R. Patierno, Carci-
nogenesis, 1994, 15(10), 2249–2254.15. J. G. Pounds, R. Wright and R. L. Kodell, Toxicol Appl Pharmacol, 1982,
66(1), 88–101.16. J. G. Pounds, G. J. Long and J. F. Rosen, Environ Health Perspect, 1991,
91, 17–32.17. F. Barbosa, Jr., J. E. Tanus-Santos, R. F. Gerlach and P. J. Parsons,
Environmental Health Perspectives, 2005, 113(12), 1669–1674.18. M. Arora, B. J. Kennedy, S. Elhlou, N. J. Pearson, D. M. Walker, P. Bayl
and S. W. Chan, Sci Total Environ, 2006, 371(1–3), 55–62.19. J. Pusapukdepob, P. Sawangwong, C. Pulket, D. Satraphat,
S. Saowakontha and P. S. Source, Southeast Asian J Trop Med PublicHealth, 2007, 38(1), 168–177.
20. D. R. Smith, J. D. Osterloh and A. R. Flegal, Environ Health Perspect,1996, 104(1), 60–66.
21. E. K. Silbergeld, J. Schwartz and K. Mahaffey, Environ Res, 1988, 47(1),79–94.
22. K. R. Mahaffey, J. F. Rosen, R. W. Chesney, J. T. Peeler, C. M. Smithand H. F. DeLuca, Am J Clin Nutr, 1982, 35(6), 1327–1331.
23. J. F. Rosen, R. W. Chesney, A. Hamstra, H. F. DeLuca and K. R.Mahaffey, N Engl J Med, 1980, 302(20), 1128–1131.
24. A. Pagliuca and G. J. Mufti, BMJ, 1990, 300(6728), 830.25. L. Patrick, Altern Med Rev, 2006, 11(1), 2–22.26. A. J. Leone, Am J Roentgenol Radium Ther Nucl Med, 1968, 103(1),
165–167.27. M. Pearl and L. M. Boxt, Radiology, 1980, 136(1), 83–84.28. E. I. Chopin and B. J. Alloway, The Science of the Total Environment,
2007, 373(2–3), 488–500.29. J. D. Hamilton and E. J. O’Flaherty, Fundam Appl Toxicol, 1994, 22(4),
594–604.30. C. R. Angle and D. R. Kuntzelman, Journal of Toxicology and Environ-
mental Health, 1989, 26(2), 149–156.31. J. Schwartz, C. Angle and H. Pitcher, Pediatrics, 1986, 77(3), 281–288.
Lead Exposure and Osteoporosis: Mechanisms and Clinical Manifestations 403

32. C. Ballew, L. K. Khan, R. Kaufmann, A. Mokdad, D. T. Miller andE. W. Gunter, J Pediatr, 1999, 134(5), 623–630.
33. M. Hernandez-Avila, K. E. Peterson, T. Gonzalez-Cossio, L. H. Sanin,A. Aro, L. Schnaas and H. Hu, Arch Environ Health, 2002, 57(5),482–488.
34. R. Shukla, R. L. Bornschein, K. N. Dietrich, C. R. Buncher, O. G. Berger,P. B. Hammond and P. A. Succop, Pediatrics, 1989, 84(4), 604–612.
35. M. Pearl and L. M. Boxt, Radiology, 1980, 136(1), 83–84.36. A. Zhitnikov and P. M. Mazhuga, Tsitol Genet, 1987, 21(4), 248–252.37. A. Zhitnikov and P. M. Mazhuga, Tsitol Genet, 1988, 22(2), 3–7.38. J. J. Sauk, T. Smith, E. K. Silbergeld, B. A. Fowler and M. J. Somerman,
Toxicol Appl Pharmacol, 1992, 116(2), 240–247.39. R. F. Klein and K. M. Wiren, Endocrinology, 1993, 132(6), 2531–2537.40. C. R. Angle, D. J. Thomas and S. A. Swanson, Toxicol Appl Pharmacol,
1990, 103(2), 281–287.41. G. J. Long, J. G. Pounds and J. F. Rosen, Calcif Tissue Int, 1992, 50(5),
451–458.42. Y. Ma, D. Fu and Z. Liu, Toxicol Ind Health, 2012 Mar, 28(2),
136–146.43. R. F. Klein and K. M. Wiren, Endocrinology, 1993, 132(6), 2531–257.44. C. R. Angle, D. J. Thomas and S. A. Swanson, Toxicol Appl Pharmacol,
1990, 103(2), 281–287.45. F. A. Schanne, R. K. Gupta and J. F. Rosen, Biochim Biophys Acta, 1992,
1180(2), 187–194.46. C. Anderson and K. D. Danylchuk, J Environ Pathol Toxicol, 1980, 3(5–6),
413–422.47. A. M. Sharifi, R. Ghazanfari, N. Tekiyehmaroof and M. A. Sharifi,
Toxicol Mech Methods, 2011, 21(3), 225–230.48. K. Janssens, P. ten Dijke, S. Janssens and W. Van Hul, Endocr Rev, 2005,
26(6), 743–774.49. M. Pearl and N. M. Roland, ASDC J Dent Child, 1980, 47(4), 269–271.50. R. F. Gerlach, D. B. Toledo, P. D. Novaes, J. Merzel and S. R. Line, Arch
Oral Biol, 2000, 45(11), 951–955.51. M. Matsuzawa, T. J. Sheu, Y. J. Lee, M. Chen, T. F. Li, C. T. Huang,
J. D. Holz and J. E. Puzas, J Periodontal Res, 2009, 44(3), 289–296.52. R. F. Gerlach, A. P. de Souza, J. A. Cury and S. R. Line, Eur J Oral Sci,
2000, 108(4), 327–334.53. M. E. Moss, B. P. Lanphear and P. Auinger, JAMA, 1999, 281(24),
2294–2298.54. A. Gemmel, M. Tavares, S. Alperin, J. Soncini, D. Daniel, J. Dunn,
S. Crawford, N. Braveman, T. W. Clarkson, S. McKinlay and D. C.Bellinger, Environ Health Perspect, 2002, 110(10), A625–A630.
55. J. R. Campbell, M. E. Moss and R. F. Raubertas, Environ HealthPerspect, 2000, 108(11), 1099–1102.
56. J. J. Carmouche, J. E. Puzas, X. Zhang, P. Tiyapatanaputi, D. A.Cory-Slechta, R. Gelein, M. Zuscik, R. N. Rosier, B. F. Boyce,
404 Chapter 15

R. J. O’Keefe and E. M. Schwarz, Environ Health Perspect, 2005, 113(6),749–755.
57. J. G. Pounds, G. J. Long and J. F. Rosen, Environ Health Perspect, 1991,91, 17–32.
58. E. K. Silbergeld, J. Schwartz and K. Mahaffey, Environ Res, 1988, 47(1),79–94.
59. K. Berlin, L. Gerhardsson, J. Borjesson, E. Lindh, N. Lundstrom,A. Schutz, S. Skerfving and C. Edling, Scand J Work Environ Health,1995, 21(4), 296–300.
60. C. Anderson and K. D. Danylchuk, Lab Invest, 1977, 37(5), 466–469.61. H. E. Gruber, H. C. Gonick, F. Khalil-Manesh, T. V. Sanchez,
S. Motsinger, M. Meyer and C. F. Sharp, Miner Electrolyte Metab, 1997,23(2), 65–73.
62. J. D. Holz, T. J. Sheu, H. Drissi, M. Matsuzawa, M. J. Zuscik andJ. E. Puzas, Birth Defects Research Part C, 2007, 81(1), 41–50.
63. M. J. Ronis, J. Aronson, G. G. Gao, W. Hogue, R. A. Skinner, T. M.Badger and C. K. Lumpkin, Jr., Toxicol Sci, 2001, 62(2), 321–329.
64. J. R. Campbell and P. Auinger, Environ Health Perspect, 2007, 115(7),1018–1022.
65. G. M. Hass, W. Landerholm and A. Hemmens, Am J Pathol, 1967, 50(5),815–847.
66. D. F. Stowe and A. K. Camara, Antioxid Redox Signal, 2009, 11(6),1373–1414.
67. S. K. Bopp, H. K. Abicht and K. Knauer, Aquat Toxicol, 2008, 86(2),197–204.
68. H. Huang, T. Li, S. Tian, D. K. Gupta, X. Zhang and X. E. Yang,Bioresour Technol, 2008, 99(14), 6088–6096.
69. J. Xu, L. J. Lian, C. Wu, X. F. Wang, W. Y. Fu and L. H. Xu, Food ChemToxicol, 2008, 46(5), 1488–1494.
70. A. R. Kiziler, B. Aydemir, I. Onaran, B. Alici, H. Ozkara, T. Gulyasarand M. C. Akyolcu, Biol Trace Elem Res, 2007, 120(1–3), 82–91.
71. S. J. Stohs and D. Bagchi, Free Radic Biol Med, 1995, 18(2), 321–336.72. N. Ercal, H. Gurer-Orhan and N. Aykin-Burns, Curr Top Med Chem,
2001, 1(6), 529–539.73. M. Ahamed and M. K. Siddiqui, Clin Chim Acta, 2007, 383(1–2), 57–64.74. S. J. Flora, M. Mittal and A. Mehta, Indian J Med Res, 2008, 128(4),
501–523.75. National Institute of Health. Osteoporosis prevention, diagnosis and
therapy. NIH Consensus Statement, 2000, March 27–29, 17(1), 1–45.76. R. N. Rosier, Clinical Orthopaedics & Related Research, 2001, 385,
57–67.77. S. Adami, M. Passeri, S. Ortolani, M. Broggini, L. Carratelli, I. Caruso,
G. Gandolini, L. Gnessi, M. Laurenzi and A. Lombardi, Bone, 1995, 17,383–390.
78. D. M. Black, S. R. Cummings, D. B. Karpf, J. A. Cauley, D. E.Thompson, M. C. Nevitt, D. C. Bauer, H. K. Genant, W. L. Haskell,
Lead Exposure and Osteoporosis: Mechanisms and Clinical Manifestations 405

R. Marcus, S. M. Ott, J. C. Torner, S. A. Quandt, T. F. Reiss andK. E. Ensrud, Fracture Intervention Trial Research Group. Lancet, 1996,348, 1535–1541.
79. H. G. Bone, R. W. Downs, J. R. Tucci, S. T. Harris, R. S. Weinstein,A. A. Licata, M. R. McClung, D. B. Kimmel, B. J. Gertz, E. Hale andW. J. Polvino, J Clin Endo Metabol, 1997, 82, 265–274.
80. C. H. Chesnut, M. R. McClung, K. E. Ensrud, N. H. Bell, H. K. Genant,S. T. Harris, F. R. Singer, J. L. Stock, R. A. Yood and P. D. Delmas, AmJ Med, 1995, 99, 144–152.
81. B. Ettinger, D. M. Black, B. H. Mitlak, R. K. Knickerbocker,T. Nickelsen, H. K. Genant, C. Christiansen, P. D. Delmas, J. R.Zanchetta, J. Stakkestad, C. C. Gluer, K. Krueger, F. J. Cohen, S. Eckert,K. E. Ensrud, L. V. Avioli, P. Lips and S. R. Cummings, JAMA, 1999,282, 637–645.
82. D. B. Karpf, D. R. Shapiro, E. Seeman, K. Ensrud, C. C. Johnson,S. Adami, S. T. Harris, A. C. Santora 2nd, L. J. Hirsch, L. Oppenheimerand D. Thompson, JAMA, 1997, 277, 1159–1164.
83. K. Berlin, L. Gerhardsson, J. Borjesson, E. Lindh, N. Lundstrom,A. Schutz, S. Skerfving and C. Edling, Scan J Work, Environment, Health,1995, 21, 296–300.
84. D. Marshall, O. Johnell and H. Wedel, BMJ, 1996, 312, 697–711.85. M. L. Bouxsein, B. S. Coan and S. C. Lee, Bone, 1999, 25, 49–54.86. C. H. Chesnut, S. Silverman, K. Andriano, H. Genant, A. Gimona,
S. Harris, D. Kiel, M. LeBoff, M. Maricic, P. Miller, C. Moniz,M. Peacock, P. Richardson, N. Watts and D. A. Baylink, Am J Med, Sep,2000, 109(4), 267–276.
87. B. Ettinger, D. M. Black, B. H. Mitlak, R. K. Knickerbocker,T. Nickelsen, H. K. Genant, C. Christiansen, P. D. Delmas, J. R.Zanchetta, J. Stakkestad, C. C. Gluer, K. Krueger, F. J. Cohen, S. Eckert,K. E. Ensrud, L. V. Avioli, P. Lips and S. R. Cummings, JAMA, 1999Aug 18, 282(7), 637–645.
88. S. Sarkar, B. H. Mitlak, M. Wong, J. L. Stock, D. M. Black andK. D. Harper, J Bone Miner Res., 2002 Jan, 17(1), 1–10.
89. S. T. Harris, N. B. Watts, H. K. Genant, C. D. McKeever, T. Hangartner,M. Keller, C. H. Chesnut, 3rd, J. Brown, E. F. Eriksen, M. S. Hoseyni,D. W. Axelrod and P. D. Miller, JAMA, 1999 Oct 13, 282(14), 1344–1352.
90. Z. Li, M. P. Meredith and M. S. Hoseyni, Stat Med Nov 15, 2001, 20(21),3175–3188.
91. D. M. Black, S. R. Cummings, D. B. Karpf, J. A. Cauley, D. E.Thompson, M. C. Nevitt, D. C. Bauer, H. K. Genant, W. L. Haskell, R.Marcus, S. M. Ott, J. C. Torner, S. A. Quandt, K. E. Ensrud. Lancet.1996 Dec 7, 348(9041), 1535–1541.
92. S. R. Cummings, D. B. Karpf, F. Harris, H. K. Genant, K. Ensrud,A. Z. LaCroix and D. M. Black, Am J Med Mar, 2002, 112(4),281–289.
406 Chapter 15

93. M. C. Hochberg, S. Greenspan, R. D. Wasnich, P. Miller, D. E.Thompson and P. D. Ross, J Clinical Endocrinology & Metabolism, 2002,87(4), 1586.
94. T. E. Dufresne, P. A. Chmielewski, M. D. Manhart, T. D. Johnson andB. Borah, Calcif Tiss Int, 2003, 73(5), 423–432.
95. J. A. Kanis, D. Black, C. Cooper, P. Dargent, B. Dawson-Hughes,C. De Laet, P. Delmas, J. Eisman, O. Johnell, B. Jonsson, L. Melton,A. Oden, S. Papapoulos, H. Pols, R. Rizzoli, A. Silman andA. Tenenhouse, Osteoporosis Int, 2002, 13, 527–636.
96. P. D. Ross, H. K. Genant, J. W. Davis, P. D. Miller and R. D. Wasnich,Osteoporos Int, 1993, 3, 120–126.
97. R. Eastell, I. Barton, R. A. Hannon, A. Chines, P. Garnero and P. D.Delmas, J Bone Miner Res, 2003, 18, 1051–1056.
98. P. Garnero, E. Hausherr, M. C. Chapuy, C. Marcelli, H. Grandjean,C. Muller, C. Cormier, G. Breart, P. J. Meunier and P. D. Delmas, J BoneMiner Res, Oct 1996, 11(10), 1531–1538.
99. H. E. Gruber, H. C. Gonick, F. Khalil-Manesh, T. V. Sanchez,S. Motsinger, M. Meyer and C. F. Sharp, Mineral & Electrolyte Meta-bolism, 1997, 23(2), 65–673.
100. H. E. Gruber, Y. Ding, A. A. Stasky, M. Meyer, M. R. Pandian,D. Pandian, N. D. Vaziri, J. Grigsby and H. C. Gonick, Mineral Elec-trolyte Metabolism, 1999, 25, 143–146.
101. A. Escribano, M. Revilla, E. R. Hernandez, C. Seco, J. Gonzalez-Riola,L. F. Villa and H. Rico, Calcified Tissue International, 1997, 60(2),200–203.
102. A. Escribano, M. Revilla, E. R. Hernandez, C. Seco, J. Gonzalez-Riola,L. F. Villa and H. Rico, Calcified Tissue International, 1997, 60(2), 200–203.
103. A. Aro, C. Amarasiriwardena, M. L. Lee, R. Kim and H. Hu, MedicalPhysics, 2000, 27, 119–123.
104. L. Ahlgren and S. Mattsson, Physics in Medicine & Biology, 1979, 24(1),136–145.
105. L. J. Somervaille, D. R. Chettle, M. C. Scott, D. R. Tennant, M. J.McKiernan, A. Skilbeck and W. N. Trethowan, Br J Ind Med, 1988, 45,174–181.
106. C. L. Gordon, D. R. Chettle and C. E. Webber, Basic Life Sciences, 1993, 60,285–288.
107. J. G. Pounds, G. J. Long and J. F. Rosen, Env. Health Perspectives, 1991,91, 17–32.
108. D. G. Hicks, R. J. O’Keefe, K. J. Reynolds, D. A. Cory-Slechta,J. E. Puzas, A. Judkins and R. N. Rosier, Toxicol Appl Pharmacol, 1996,140, 164–172.
109. P. B. Hammond, S. D. Chernausek, P. A. Succop, R. Shukla andR. L. Bornschein, Toxicol. Appl. Pharmacol, 1989, 99, 474–486.
110. D. G. Hicks, R. J. O’Keefe, K. J. Reynolds, D. A. Cory-Slechta,J. E. Puzas, A. Judkins and R. N. Rosier, Toxicol Appl Pharmacol, 1996,140, 164–172.
Lead Exposure and Osteoporosis: Mechanisms and Clinical Manifestations 407

111. J. E. Puzas, M. J. Sickel and M. E. Felter, Neurotoxicol, 1992, 13,800–806.
112. E. Bonucci, Clin Orth Rel Res, 1981, 158, 252–269.113. R. F. Klein and K. M. Wiren, Endocrinol, 1993, 132, 264–268.114. A. Escribano, M. Revilla, E. R. Hernandez, C. Seco, J. Gonzalez-Riola,
L. F. Villa and H. Rico, Calcified Tissue International, 1997, 60(2),200–203.
115. H. E. Gruber, H. C. Gonick, F. Khalil-Manesh, T. V. Sanchez,S. Motsinger, M. Meyer and C. F. Sharp, Mineral & Electrolyte Meta-bolism, 1997, 23(2), 65–73.
116. F. G. Clegg and J. M. Rylands, J. Comparative Pathol, 1966, 76, 15–22.117. J. D. Hamilton and E. J. O’Flaherty, Fundamental Appl Toxicol, 1994, 22,
594–604.118. D. Laraque, L. Arena, J. Karp and D. Gruskay, Pediatr Radiol, 1990, 20,
461–463.119. D. J. Brody, J. L. Pirkle, R. A. Kramer, K. M. Flegal, T. D. Matte,
E. W. Gunther and D. C. Paschal, JAMA, 1994, 272, 277–283.120. J. L. Pirkle, R. B. Kaufmann, D. J. Brody, T. Hickman, E. W. Gunter and
D. C. Paschal, Environ Health Perspect, 1998, 106, 745–750.121. K. R. Mahaffey, J. L. Annest, J. Roberts, R. S. Murphy, N Engl J Med.
1982, 307, 573–579.122. R. P. Wedeen, Neurotox, 1992, 13, 843–852.123. National Institute of Health. Osteoporosis prevention, diagnosis and
therapy, NIH Consensus Statement, 2000, March 27–29, 17(1), 1–45.124. A. M. Magarey, T. J. Boulton, B. E. Chatterton, C. Schultz, B. E. Nordin
and R. A. Cockington, Acta Paediatrica, 1999, 88, 139–146.125. T. Lloyd, V. M. Chinchilli, D. F. Eggli, N. Rollings and H. E. Kulin, Arch
Pediat Adolesc Med, 1998, 152, 998–1002.
408 Chapter 15

CHAPTER 16
Liver Disease
MATT CAVE,* MOHAMMAD K. MOHAMMAD,GAVIN ARTEEL, KEITH CAMERON FALKNER ANDCRAIG J. MCCLAIN
Department of Medicine, Division of Gastroenterology, Hepatology, andNutrition, Department of Pharmacology and Toxicology, University ofLouisville, CTR Building Room 503, 505 S. Hancock St., Louisville,KY 40202, USA*E-mail: [email protected]
16.1 Introduction
The liver is the largest organ in the body, weighing approximately 1.5 kg inadults, and it is possibly the most complex organ in terms of metabolism. It hasa unique dual blood supply, being perfused by both the portal vein and hepaticartery, and comprises multiple cell types having differing functions. Hepa-tocytes make up over 80% of total liver mass and play a critical role in themetabolism of amino acids and ammonia, biochemical oxidation reactions, anddetoxification of a variety of drugs, vitamins, hormones, and environmentaltoxicants. Kupffer cells represent the largest reservoir of fixed macrophages inthe body. They play a protective role against gut-derived toxins that haveescaped into the portal circulation, and they are a major producer of cytokines,which can influence the toxicity of environmental toxicants. Hepatic stellatecells are the major storehouse for vitamin A in the body and play an importantrole in collagen formation during liver injury. Other specific cell types also haveunique functions (e.g., bile duct epithelium in bile flow, sinusoidal endothelialcells in adhesion molecule expression and endocytosis). The liver plays a vital
Issues in Toxicology No. 16
Aging and Vulnerability to Environmental Chemicals: Age-related Disorders and their Origins in
Environmental Exposures
Edited by Bernard Weiss
r The Royal Society of Chemistry 2013
Published by the Royal Society of Chemistry, www.rsc.org
409

role in protein, carbohydrate, and fat metabolism, as well as micronutrientmetabolism. It synthesizes plasma proteins, nonessential amino acids, urea (forammonia excretion), glycogen, and critical hormones such as the anabolicmolecule, insulin-like growth factor-1. The liver is a major site for fatty acidmetabolism, and bile from the liver is needed for fat absorption from theintestine. The liver plays a critical role in protecting against gut-derived toxinsand converting environmental toxicants/xenobiotics into non-toxic agents.While the liver is generally considered somewhat resistant to the effects ofaging, important changes do occur. This chapter reviews the effects of aging onthe liver and its response to environmental toxicants.
16.2 Aging Associated Changes in Liver Structure and
Function
Aging is associated with changes in hepatic morphology, physiology,biochemistry, immune function, and regeneration, which could increasesusceptibility to toxicants, resulting in liver disease (Table 16.1). These changesare subsequently discussed.
16.2.1 Morphologic Changes
Aging is associated with a 20% reduction in liver weight. Macroscopically, theliver undergoes ‘brown atrophy’ with old age, secondary to accumulation ofpigmented waste products within the hepatocytes. The major pigment is lipo-fuscin. Lipofuscin is composed of insoluble, cytoplasmic, highly oxidizedproteins related to chronic oxidative stress and end products of lipid per-oxidation in lysosomes.
In addition to a reduced number of hepatocytes, several microscopic changesoccur with hepatocyte aging, including increased binuclear index, and nuclearpolyploidy. Nuclear vacuoles become larger in size and more irregularly shapedwith aging. These ‘‘terminal hepatocytes’’ are incapable of cell division.Mitochondrial volume (but not number) increases, and there is a decrease in the
Table 16.1 Age-related hepatic changes conferring increased susceptibility totoxicant exposures.
Category Change
Morphologic k Hepatic massPhysiologic Sinusoidal pseudocapillarization
k Bile salt formation and bile flowMitochondrial dysfunction
Biochemical k Phase I activity (cytochrome P450)Altered III activity (k xenobiotic transporters)
Antioxidant Defenses k GlutathioneImmune Function m Kupffer cells and pro-inflammatory cytokinesRegeneration k Regeneration (shortened telomeres)
410 Chapter 16

smooth endoplasmic reticulum.1,2 The liver sinusoidal endothelial cells(LSECs) lose fenestrations and became 50% thicker with sub-endothelialcollagen deposition (Pseudocapillarization).3,4 The presence of completebasement membrane in liver sinusoids is a sign of age-related degeneration.Unlike ‘‘capillarization’’ seen in other liver pathology, aging is not associatedwith bridging fibrosis and nodular regeneration.5 Therefore, pseudocapillar-ization leads to relative hypoxia of hepatocytes and may be reflected by lowerATP/ADP ratios in older versus younger subjects. This process could beimportant for drug therapy in old age, because the clearance of drugs undergoingoxidative metabolism, such as theophylline and propranolol, has been shown tobe impaired.6 Kupffer cell (resident macrophage) morphology remainsunchanged, but both numbers and phagocytic activity increase with aging.3,7
16.2.2 Physiologic Changes
The most striking age-related change in liver physiology is the approximately40% reduction in blood flow primarily due to sinuosoidal pseudocapillar-ization.2,4 Declines in hepatic volume and blood flow may strongly contributeto age-related diminished oxygen-dependent hepatocyte functions, includingxenobiotic metabolism and drug clearance and the liver’s overall functionalcapacity.3,8 Also, bile flow and bile salt formation are decreased by about 50%,resulting in reduced hepatic clearance of certain drugs, e.g. cardiac glycosides,with biliary elimination.2,3 Additionally, recent studies have demonstrated amarked age-related increase in the cholesterol content of rat liver microsomes,leading to increased rigidity of the membrane lipid domain, thus impeding theability of cytochrome P450 isoforms (CYPs) to interact efficiently with othermono-oxygenase components.3
16.2.3 Biochemical Changes
There are several biochemical mechanisms that underlie the primary agingprocess and probably contribute to age-related changes in adaptive responsesand functions (e.g., toxicant clearance), thereby increasing susceptibility toenvironmental or endogenous stresses.2,9 These mechanisms include: alteredxenobiotic metabolism, reduced antioxidant capacity, immune dysfunction,and impaired regeneration.
16.2.3.1 Xenobiotic Metabolism
Foreign compound and drug metabolism occurs generally in three phases. Thefirst phase involves activation of the foreign chemical by oxidative enzymes,predominantly the cytochrome P450 family. Following activation, the meta-bolite is frequently conjugated with sulfate, glutathione or sugar (glucuronide),which simultaneously reduces the ability of the metabolite to react with eitherprotein or DNA and facilitates excretion of the metabolite. The final phaseinvolves elimination of the conjugate by specialized transporters. The liver is
Liver Disease 411

the major organ in the body responsible for drug and foreign compoundmetabolism, and the levels of these enzyme systems are greatest in this organ.
In general, there is an age-related decline in phase I drug metabolism of theorder of 30–50%, which appears to be isozyme specific.2,10–12 Phase II meta-bolism appears to be well maintained;12 however, glutathione levels do declinewith advancing age,13,14 and more importantly, the ability to recover after anevent that depletes glutathione is impaired.15 The effects of aging on Phase IIImetabolism, which involves transporters on either the basolateral or apicalsurfaces of hepatocytes, are not well characterized; however, some age-relateddeclines have been observed.
16.2.3.1.1 Phase I Metabolism. Foreign chemicals and drugs are meta-bolized by relatively few of the cytochromes P450 expressed in the body. Themajor enzymes include the CYP1A1, CYP1A2, CYP2C8, CYP2C9,CYP2C19, CYP2D6, CYP2E1, and CYP3A4.12,16,17 The most notable age-related declines occur in the expression of CYP1A2, CYP2C9/10, andCYP2C18/19. Some studies have implicated declines in other isoenzymes,including CYP2A, CYP2E1, and CYP3A4. However, these are inconclusive,in part because these are frequently inducible enzymes, and expression levelsmay vary widely between individuals as a function of environmentalexposure to foreign compounds. Likewise, other isoenzymes, such asCYP1A1, have very low basal levels of expression in the absence of aninducer.
The genes controlling induction of the cytochromes P450 include the Arylhydrocarbon receptor (AhR), whose ligands include planar aromaticcompounds, such as benzo[a]pyrene, and chlorinated compounds, such as2,3,7,8-tetrachlorodibenzodioxin (TCDD).18 The cytochromes P450 expressedin liver and which are are induced by this mechanism are CYP1A1 andCYP1A2. Induction of enzymes by this mechanism does not appear to beaffected by aging.
A second important system for induction of drug metabolism is the inductionof drug metabolism by the N1I class of nuclear receptors, which, in the liver,includes the constitutive androstane receptor (CAR) and the pregnane andxenobiotic receptor (PXR). Increasing interest is being focused on thesereceptors in liver disease, as CAR activation is thought to reduce obesity inanimals fed a high fat diet, while PXR activation is thought to promote obesityin animals fed a high fat diet.19 As obesity is the major contributor to thedevelopment of non-alcoholic fatty liver disease, the intersection of drug andforeign compound metabolism is a current novel area for research. From anaging perspective, these receptors appear to be close homologues of theCaenorhabditis elegans receptor, DAF-12.20 DAF-12 is a critical determinant oflifespan in C. elegans and is critical for the larvae to enter the non-feeding,stress-resistant dauer diapause state under unfavorable conditions. Thisdiapause state can greatly increase lifespan in C. elegans from 2 weeks to 3–6months, with the larvae returning to normal development and the reproductivestate once conditions are favorable. DAF-12 lies at an intersection of signaling
412 Chapter 16

pathways that includes the insulin-like growth factor-1 (IGF-1), transforminggrowth factor-b, target of rapamycin (TOR), and G-protein-mediatedpathways, all of which contain genes that alter the lifespan of C. elegans and areimplicated in the development of liver disease in humans. C. elegans cannotsynthesize cholesterol, and the ligand for DAF-12 is thought to be thecholesterol metabolite, dafachronic acid (a potential metabolite of thecytochrome P450, DAF-9, and a Rieske-like oxygenase, DAF 36).21 Thus, inthe absence of a source of cholesterol from the environment, C. elegans entersdiapause. In mammalian systems, mutations in the IGF-1 signaling pathwayare thought to affect lifespan; however, the roles of CAR and PXR are yet to befully elucidated.
An important consideration of these pathways is, however, the ability ofboth CAR and PXR to interact with the forkhead family of transcriptionfactors, FoxO1 and FoxA2,22 mammalian homologs of the C. elegans geneDAF-12. The forkhead transcription factors are part of the insulin and insulin-like signaling pathway(s) and are important regulators of both gluconeogenesisand lipid metabolism. Both CAR and PXR inhibit Forkhead box protein O1(FoxO1), which is an important transcription factor for the expression ofphosphoenolpyruvate carboxykinase (PEPCK), a critical step in early gluco-neogenesis. Thus, activation of CAR or PXR by environmental chemicals tendsto reduce gluconeogenesis and decrease circulating glucose levels. PXR can alsointeract with FoxA2, inhibiting its activity on target genes such as the carnitinepalmitoyl transfease 1 (CPT1) gene and the hydroxymethylglutarate-CoAsynthetase gene, which are rate-limiting steps in mitochondrial b-oxidation andketone body synthesis respectively. Both of these processes are critical in lipidcatabolism and may partially explain the obeseogenic effects of PXR ligands inanimals fed a high fat diet and are likely to augment nonalcoholic fatty liverdisease associated with a high fat diet. This suggests that the ability to respondto environmental change is a critical determinant of both lifespan and thedevelopment of fatty liver diseases. It also implies that the pathways connectedto both processes are somewhat conserved in nematodes and mammals,although the outcomes are subtly different.
A final xenobiotic sensor of relevance in the expression of phase I metabolismand liver disease is the peroxisome proliferator activated receptor a (PPARa),which is activated by phthalates and clofibric acid derivatives. PPARa isintimately involved in the catabolism of fatty acids and is an important tran-scription regulator of b oxidation, both mitochondrial and peroxisomal, whereit induces the CYP4A. In addition, it is an important regulator of CPT1 and2, fatty acyl CoA oxidase (FACO), and many other genes involved withb- oxidation.23
16.2.3.1.2 Phase II Metabolism. Phase II detoxification involves theconjugation of reactive compounds with hydrophilic compounds such asglutathione, sugars (glucuronidation) or sulfate, which reduces the reactivelyof the parent compound and makes it more easily excreted (as conjugationmakes the molecules more hydrophilic and targets them for export by
Liver Disease 413

Phase III transporters). Most studies indicate that phase II enzymes, such asglutathione S-transferases, UDP-glucuronoslytranferases, and sulfotranferases,are not altered by aging.12,24 However, some pharmacokinetic studies doindicate that Phase II metabolism is impaired. This is consistent with theobservation that Phase II metabolism is impaired in aged Fisher 344 rats.25
16.2.3.1.3 Phase III Metabolism. This group includes protein transportersthat function to remove xenobiotics either into the blood or bile dependingon the location (on either the apical or basolateral surfaces of the hepa-tocyte). Studies on the effects of aging on the expression of Phase III systemsin humans are limited. Animal studies show that aging is associated with adecline in the expression of organic anion-transporting polypeptides (Oatps),including Oatp 1A1,1B2, and Oatp2b1.16 Likewise, expression of members ofthe multidrug resistance protein family (2,3, and 6) are reduced in aging.16 Incontrast, hepatic P-glycoprotein expression has been demonstrated toincrease in old age Fisher 344 rats.26
16.2.3.2 Antioxidant Defense
The antioxidant capacity of hepatocytes appears to be reduced with age.2
Mitochondria are both producers and targets of oxidative stress, which is thebasis for the mitochondrial theory of aging. Oxidative stress is a cellular state inwhich the generation of harmful molecules such as reactive oxygen species(ROS), peroxidized lipids, reactive quinones, and electrophiles is greater thanthe ability of the cell to remove these destructive agents.27 Both increased ROSproduction, due to mitochondrial respiratory chain defects,9 and decreasedROS scavenger levels (e.g., glutathione or GSH) are observed with aging, thusestablishing a ‘‘vicious cycle’’ of oxidative stress.4,9
Antioxidant defenses in the cell are regulated in part by three redox sensitivetranscription factors, Nrf-2, activator protein 1 (AP-1) family members, andnuclear factor kappa b (NF-kB). Nrf-2, or nuclear factor erythroid 2-relatedfactor-2, is a transcription factor that mediates the synthesis of glutathione,which is the most abundant antioxidant in the liver and controls the redoxpotential of the hepatocyte.28,29 Nrf-2 is a member of the basic region leucinezipper (bZIP) family of transcription factors and Cap ‘n’ Collar subfamily, andpreferentially forms heterodimers with members of the musculoaponeuroticfibrosarcoma proteins (Mafs). In the absence of environmental stress, Nrf-2 isusually sequestered in the cytosol by Kelch-like ECH-associated protein-1(Keap-1). This association targets Nrf-2 for ubiquitination and subsequentdegradation. Thus, the half-life of Nrf-2 in an unstressed animal is relativelyshort (15 min). Keap-1 contains several reactive thiol groups which, if modifiedby agents such as xenobioitic electrophiles, release Nrf-2, allowing it to trans-locate to the nucleus, heterodimerize with a Maf, and upregulate a wide varietyof genes involved with antioxidant stress. This includes those involved withglutathione synthesis, thioredoxin, peroxiredoxin, sulfredoxin, ferritin, metal-lothionein, and heme oxygenase-1.30 In addition, Nrf-2 is involved in the
414 Chapter 16

expression of molecular chaperones, sub-units of both the 26S and 20Sproteosome, and thus increases the cells’ ability to degrade unfolded orubiquitinated proteins. Nrf-2 can also interact with other transcription factorsand is thought to antagonize NF-kB signaling and inhibit TNFa production,reducing the inflammatory response.31 Activators of Nrf-2 tend to be relativelyhydrophobic electrophiles rather than pure oxidative stress factors.32 Stressorslike hydrogen peroxide are relatively weak inducers of Nrf-2 signaling, whilecompounds such as sulforaphane, the isothiocyanate metabolite found inbroccoli, are excellent Nrf-2 inducers. Thus, diet and malnutrition in the elderlyare likely to have a significant impact on Nrf-2 signaling. Nrf-2 levels declineduring aging, as manifested by a reduced response to a stressor.33 In mice,acetaminophen treatment rapidly depletes glutathione. In young mice, GSHlevels soon rebound due to Nrf-2 activation; however, in older mice, therecovery is much slower.15 This phenomenon is, in part, due to reduced Nrf-2levels, but changes in the heterodimerization pattern of Nrf-2 are also present.34
In younger animals, Nrf-2 heterodimerizes with Maf family members toactivate genes such as the g-glutamyl cysteine ligase; however, in older animals,an increase in heterodimerization with c-fos is observed, and this subtly changesthe response element binding profile and decreases transactivation potential,leading to a reduced induction of glutathione synthesis. Likewise, age-relateddeclines in Nrf-2 signaling are also likely to affect the inflammatory response,with greater production of pro-inflammatory cytokines.
16.2.3.3 Immune Function
Inflammation is a critical component in the development of liver diseases andmarks the progression of steatosis to steatohepatitis in both alcoholic and non-alcoholic liver diseases. During aging there is a phenotypic change in theexpression of immune cells of the liver, which include resident populations ofmacrophages (Kupffer cells) and lymphocytes (including pit cells). Both cellpopulations change with aging.35 Kupffer cell numbers increase with aging,36 asdoes the basal level of expression of pro-inflammatory cytokines such as TNFaand IL-6. Many liver diseases involve a combination of enhanced immuno-logical responses and the sensitization of hepatocytes, potentially by xenobioticinsults that result in normally resistant hepatocytes becoming susceptible toTNFa-dependent cell death.
Changes in the lymphocyte population of the liver with aging are morecomplex. The liver contains resident lymphocytes, including NK cells and NKTcells. The origins of these cells are complex and include cells derived from boththe thymus and from c-kit1 pluripotent hematopoitic stem cells found in theliver. Mice cells of thymic origin tend to decrease with aging, while theextrathymic-derived cells increase. Likely reflecting this change in phenotype,aging is associated with decreased serum levels of IL2 and increased expressionof the pro-inflammatory cytokines, TNFa and IL-6. The levels of thesecytokines also reflect a change in the T-cell pool, with an age-related increaseand accumulation of more differentiated memory cells and a decline in naıve
Liver Disease 415

T-cells. Some of these cells have the capacity to produce large amounts of pro-inflammatory cytokines. Consistent with this view is an increased expression ofpro-inflammatory cytokine genes in the liver with aging. In addition, thenumber of lymphocytes in the liver increases with age, and, in aged mice, thenumber of lymphocytes is approximately 3-fold higher. Lymphocytes andKupffer cells interact via a feed-forward mechanism to increase this responseand therefore, with aging, the liver’s response to an inflammatory stimulus suchas endotoxemia, will have a more pro-inflammatory profile, with increasesTNFa-secretion and TNFa-dependent hepatocyte death.
16.2.4 Regeneration
The liver has tremendous regenerative capacity. This capacity distinguishes itfrom other vital organs (e.g., the brain, heart and lungs) that are far less able toreplace functional tissue once it has been destroyed. As the main detoxifyingorgan in the body, the liver has a high likelihood of toxic injury. However, dueto its regenerative properties, the liver is able to restore itself to full size andensure survival of the organism. The liver can fully regenerate within 7–10 daysin experimental models (e.g., mice).37 Although hepatocytes rarely proliferatein the healthy adult liver, virtually all surviving hepatocytes replicate at leastonce after 70% partial hepatectomy. Residual hepatocytes upregulate bothproliferative and liver-specific gene expression in order to preserve tissue-specific function. In addition to hepatocyte proliferation, there is a tightlycoordinated response to complement the regenerative process (e.g., angio-genesis, extracellular matrix metabolism), so that the entire organ can bereconstituted within days. During liver regeneration, a complex network ofcytokines, growth factors, kinases, and transcription factors drives hepatocytesout of the G0 phase to enter and progress through replication.38
The complex and synchronized regenerative response in the liver can beperturbed and therefore can impact recovery of normal tissue from injury ordamage. Indeed, it is now clear that impaired regeneration and/or restitution iscritical to the chronicity of numerous hepatic diseases. Although aging does notdramatically affect hepatic histology and architecture, the response to injurycan be severely impaired. In animal models, aging has been shown to impairhepatic regeneration.39 In humans, the risk of liver failure in response to acuteinjury or hepatic resection increases dramatically in the older patient.40,41
Aging has also been associated with poor outcome in chronic liver diseases.For example, age at the time of infection is major risk factor for severe liverdisease in chronic hepatitis C, and livers from older patients progress throughthe fibrosis phases more rapidly than those from younger patients.42,43 It ishypothesized that impaired regeneration contributes, at least in part, to theincreased susceptibility of the aged liver to acute and chronic injury.1
A major mechanism proposed to contribute to replication senescence in theaged liver is telomere shortening. Telomeres are repeated hexonucleotidesequences at the end of the chromosome. Telomeres function to protect thechromosomes against fusion, non-reciprocal translocations, and deterioration.
416 Chapter 16

During normal cell division, telomere length shortens with each round ofdivision. Thus, the number of telomere repeats normally decreases with age.The rate of telomere shortening is accelerated in organs during chronicinflammation,44 including in liver.45 The shortening of telomeres withsuccessive divisions impairs their ability to protect against chromosomalinstability. As a result, the cell normally undergoes replicative senescence toprevent clonal expansion of potentially damaged chromosomes. Indeed, loss ofthis regulation is a key step in carcinogenesis.46 It is hypothesized that thisreplicative senescence enhances the rate of remodeling (i.e., fibrosis) duringchronic liver injury. In support of that hypothesis, Rudolph, et al. demon-strated that livers from telomerase deficient mice progressed to fibrosis andcirrhosis more rapidly during experimental liver disease.47 In comparison toother organs, hepatic regeneration is robust; but impaired liver regenerationwith aging could contribute to age-related susceptibility to hepatotoxicants.
16.3 Occupational and Environmental Hepatotoxicants
As of May 2011, over 60million unique chemicals were registered with theChemical Abstracts Service (CAS). Notably, only two years had passed sincethe registration of the 40millionth chemical. Due to rapid commercialization,it is impossible to fully understand the potential impact of these new chemicalson liver disease. However, the problem could be significant because 33% of the677 most common workplace chemicals reported in the National Institute ofOccupational Safety and Health (NIOSH) Pocket Guide are associated withhepatotoxicity.48 Occupational and environmental liver diseases may presentwith a wide clinical spectrum, ranging from asymptomatic liver enzymeelevation to acute liver failure, cirrhosis, and cancer. In addition to age, anindividual’s susceptibility to chemical-induced liver disease is determined bypolymorphisms in the genes of xenobiotic metabolism, concomitant use ofalcohol or prescription medications, nutritional factors, and obesity (as manyorganic chemicals are lipid soluble).49,50 Recently, it was demonstrated thathypertriglyceridemia is a risk factor for greater absorption of inhaled organicchemicals because it changes the blood/air partition coefficient to increasesolubility of these molecules within the bloodstream.51 High-level vinyl chloride(VC)52 and solvent exposures53 have historically been associated with occu-pational liver disease, and classical mediators of environmental liver diseaseinclude aflatoxins54 and analines (Epping Jaundice55,56 and Toxic OilSyndrome57). However, recent population-based studies suggest an emergingrole for polychlorinated biphenyls (PCBs), organochlorine insecticides, volatileorganic compounds (VOCs), and metals58–60 in environmental liver disease.These and other historically important chemical hepatotoxicants were recentlyreviewed.61
Toxicant exposure patterns, distribution, metabolism, and elimination mayall increase susceptibility to liver injury. Hepatotoxicant exposures vary withage. While occupational exposures occur in adults, children may inadvertentlyingest toxic chemicals (e.g., yellow phosphorus from fireworks62) or
Liver Disease 417

inadvertently be exposed to them through medical care (e.g., Di(2-ethylhexyl)phthalate in IV tubing63). Several persistent organic pollutants (POPs)associated with adult liver disease are present in breast milk,64 but the effects ofthese chemicals, if any, on pediatric liver disease are uncertain. Likewise, POPs(including PCBs) associated with liver disease bio-accumulate with age,meaning older subjects are more likely to have higher liver and adipose tissuelevels. Subsequently, in this chapter, histopathologic subtypes of chemical liverdisease as well as selected hepatotoxicants (VC, aflatoxin, and arsenic) arepresented with an emphasis on aging.
16.3.1 Pathologic Forms of Liver Injury Attributed to Industrial
Chemicals
Chemical liver injury typically results in non-specific hepatitis, althoughunusual lesions such as hemangiosarcoma may occur. Most industrialchemicals, including solvents, exhibit dose-dependent hepatocyte cytotoxicityand typically result in hepatocellular necrosis.61 However, both cholestasis65,66
and acute hepatitis accompanied by rash and eosinophilia resembling animmunologic drug reaction have been reported.53 Examples of histopathologicliver lesions associated with industrial chemicals are given in Table 16.2.
Recently, our group coined the term, toxicant-associated steatohepatitis(TASH) to describe steatohepatitis in highly exposed chemical workers andassociated with increased pro-inflammatory cytokines, insulin resistance, andantioxidant depletion.52,67 Liver biopsies resembled alcoholic or non-alcoholicsteatohepatitis (NASH), but affected workers were non-drinkers and were notobese. Hepatocyte lipid accumulation has historically been considered a benigntoxicologic finding and has been described in many forms of chemicalhepatitis.52,61 However, given the increase in cirrhosis and hepatocellularcarcinoma associated with the current NASH epidemic, the significance ofsteatohepatitis due to industrial chemicals must be re-evaluated. Indeed,emerging evidence suggests that steatohepatitis, often with normal serumaminotransferases, may be one of the most common forms of chemical-inducedhepatitis.52,53,67,68 Serum cytokeratin 18 (non-caspase cleaved), a biomarker ofnecrotic hepatocyte death, is more reliably elevated in these workers.52,69
Recently, POPs which bio-accumulate with age (including PCBs) have beenassociated with suspected TASH in epidemiologic studies.59 Nutritional status,co-exposures, and diseases associated with aging—including diabetes andobesity—appear to confer increased susceptibility to TASH, but more clinicaldata are needed.49,52,70
16.3.2 Vinyl Chloride
Vinyl chloride monomer (VC, C2H3Cl, CAS 75-01-4) is a colorless gas andclassically described mediator of occupational liver disease.71 Hepatotoxicityhas also been documented in other structurally related haloalkanes (e.g.,
418 Chapter 16

carbon tetrachloride) and haloalkenes (e.g., trichloroethylene, TCE).65,72,73
However, the identification of three cases of vinyl chloride-related heman-giosarcoma at a single B.F. Goodrich chemical plant in Louisville, KY in the1970’s is perhaps the most important sentinel event in occupational hepa-tology.71 Subsequent studies have documented associations between VCexposures and a variety of other liver diseases, including hepatocellularcarcinoma (HCC),49 TASH,52 cirrhosis,49 peliosis hepatitis, focal hepatocytichyperplasia (FHH), and focal mixed hyperplasia (FMH).74 VC exposure,metabolism, hemangiosarcoma, and TASH are subsequently discussed, withemphasis on the effects of aging on VC toxicity.
VC is a high production volume chemical, and worldwide productioncapacity exceeds 35million lbs. VC is used for polymer production, mostnotably, polyvinyl chloride (PVC), and for the synthesis of chlorinatedsolvents. To date, more than 80,000 American chemical workers have beenexposed to VC.75 At production facilities such as those at Louisville, prior to1975, high level exposures estimated to exceed 1,000 ppm occurred in ‘‘polycleaners’’, who entered and manually cleaned PVC batch reactor vessels. VCexposures were subsequently limited by the Occupational Safety and HealthAdministration’s Vinyl Chloride Standard (29 CFR 1910.1017) to less than
Table 16.2 Pathology of Chemical Liver Disease in Humans or AnimalModels.
Category Selected Examples
Steatohepatitis Vinyl chloride, aflatoxin, trichloroethylene,tetrachloroethylene, trichloroethane, carbon tetrachloride,petrochemical mixtures, atrazine, paraquat, chlordecone,polychlorinated biphenyls, nitrobenzene, nitrotoluene,arsenic, methylmercury, thallium, yellow phosphorus,aflatoxin
Necrosis Carbon tetrachloride and other halogenated aliphatichydrocarbons, haloaromatic compounds, nitroaromaticcompounds, arsenic, yellow phosphorus
Cholestasis Beryllium, copper, di(2-ethylhexyl) phthalate,methylenedianiline, paraquat, toxic rapeseed oil
Cirrhosis Arsenic, carbon tetrachloride, polychlorinated biphenyls,trichloroethane, trichloroethylene, trinitrotoluene, vinylchloride
Peliosis hepatitis Thorotrast, urethane, vinyl chlorideGranulomas Beryllium, copperPigment deposition Anthracite, thorotrast, titaniumCholangiocarcinoma Thorotrast, polychlorinated biphenylsHepatocellularCarcinoma
Arsenic, carbon tetrachloride, polychlorinated biphenyls,tetrachloroethylene, thorotrast, trichloroethylene,trinitrotoluene, vinyl chloride, aflatoxin
Hemangiosarcoma Vinyl chloride, butoxyethanol, chloronitrobenzene,polyhexamethylene biguanine, urethane, tetrafluoroethylene
Adapted from M. Cave, K. C. Falkner and C. J. McClain in Zakim and Boyer’s Hepatology: ATextbook of Liver Disease, 6th edn, Elsevier Saunders, Philadelphia, 2011.
Liver Disease 419

1 ppm averaged over an 8 hour work day. In addition to chemical workers, highlevel occupational exposures occurred in hair dressers, as VC was used as anaerosol propellant in hair spray from approximately 1962 to 1974.76 VC hasbeen identified as a solvent degradation product, and it is present in landfillleachate, where it potentially places surrounding populations at risk. VC mayalso leach from PVC pipes which are used to carry drinking water, or may formas a disinfection byproduct.
VC is metabolized in a strikingly similar fashion to ethanol, producingreactive VC metabolites. At concentrations up to approximately 220 ppm, VCis metabolized by CYP2E1, forming the highly reactive genotoxic epoxide,chloroethylene oxide.77 CYP2E1 polymorphisms were associated with fibrosis,liver injury, and chromosomal damage in Asian VC workers, and possiblyhemangiosarcoma at the Louisville plant.50,78–80 Chloroethylene oxide is eitherspontaneously or enzymatically converted to chloroacetaldehyde (CAA).81
CAA may be metabolized by aldehyde dehydrogenase 2 or scavenged bysulfhydryl groups/glutathione. VC exposure may be associated with increasedsystemic pro-inflammatory cytokines and reduced antioxidant defenses;52
indeed, GST polymorphisms have been associated with increased biomarkersof genotoxicity and liver disease in VC workers.79,80 Likewise, we recentlyshowed, in vitro, that CAA treatments induced mitochondrial dysfunction, ahallmark of aging.82 Therefore, VC metabolism, like aging, may be associatedwith inflammation, oxidative stress, and mitochondrial dysfunction; andgenetic variation may confer increased susceptibility.
Hepatic hemangiosarcoma (Figures 16.1, 16.2) is a vascular tumor believedto originate from sinusoidal endothelial cells. Although hemangiosarcoma mayoccur spontaneously with some frequency in other mammalian species, it isexceptionally rare in humans.83 However, 26 highly-exposed B.F. Goodrichworkers from the Louisville plant have developed hepatic hemangiosarcoma,
Figure 16.1 Computed tomography scan from a VC worker with a 20 cm hypodenseliver mass which was subsequently confirmed to be hemangiosarcoma onbiopsy.
420 Chapter 16

and this is likely the largest single-site cluster worldwide.84 This association hasbeen confirmed in large epidemiologic studies of more than 10,000 NorthAmerican and more than 12,000 European VC workers.85,86 Consistent withthe Louisville data, duration of exposure, cumulative exposure, andemployment as an autoclave cleaner were risk factors for hemangiosarcoma inthese studies. At cumulative exposures below 1,500 ppm per year, mortalityfrom hemangiosarcoma approached that of the entire cohort, again demon-strating the dose-dependence of this cancer.86 Peculiarly, even though VC isgenotoxic, in Louisville workers, hemangiosarcoma presented with aging,following a long latency period. Hemangiosarcoma presented at a mean age of57.9� 12.2 and at a mean of 32.2 � 11.9 years after initial occupational VCexposure. Given this prolonged latency period, cases continue to present, evendecades after the last VC exposure. Some studies have implicated p53 andpolymorphisms in DNA repair genes in VC-related hepatocarcinogenesis.87–89
However, more work is required to better understand why VC exposures mayresult in cancer with aging following a prolonged latency period.
As early as 1975, it was recognized that ‘‘fatty changes’’ similar to thoseobserved in alcoholic liver disease were present in about half of biopsiedchemical workers with high cumulative exposures.90 In fact, in his final paperaddressing focal hepatocytic hyperplasia (FHH) and focal hepatocytic hyper-plasia (FMH,) Hans Popper noted that FHH and FMH were often obscured by‘‘fatty infiltration and/or chronic disease (hepatitis/granuloma)’’.74 Our groupbecame interested in this topic following the publication of reports docu-menting NASH in lean Brazilian petrochemical workers exposed to chemicalmixtures including vinyl chloride,68and ultrasound studies observing hepa-tomegaly, steatosis, and fibrosis in VC workers.91,92 Subsequently, 25 liverbiopsies from highly exposed VC workers at the Louisville plant werere-analyzed, yielding an 80% steatohepatitis prevalence (Figure 16.3).52 Fibrosis
Figure 16.2 Photomicrograph (100�, H&E stain) of a liver biopsy from a second VCworker with hemangiosarcoma.
Liver Disease 421

was present in 55% of TASH cases. Remarkably, serum transaminases werenormal in most cases. TASH was associated with insulin resistance, reducedserum adiponectin levels, marked elevation of pro-inflammatory cytokines, andreduced serum antioxidants. TASH was associated with primarily necrotic,rather than apoptotic, hepatocellular death. Similar biochemical findings werepresent in elastomer/polymer workers with suspected TASH and who wereexposed to mixtures of acrylonitrile, 1,3-butadiene, and styrene.67 Because thesemodes of action have been associated with aging, interactions between aging andTASH could be anticipated, but have not been studied.
16.3.3 Aflatoxin
While VC is historically associated with occupational liver disease, aflatoxinsare classically described, and still relevant, environmental hepatoxicants.Aflatoxins are unavoidable food contaminants, produced by Aspergillusspecies, including A. flavus.54 These mycotoxins are produced by fungal actionduring the production harvest, storage, and processing of peanuts, corn, andgrains, particularly under warm and moist conditions. Aflatoxins were initiallyidentified 50 years ago as the cause of ‘‘turkey X disease’’, but they weresubsequently found to produce human disease as well.54 In developedcountries, aflatoxin levels in both food for human consumption and livestockfeed are regulated. Two well-defined clinical syndromes have been described inhumans: acute aflatoxicosis and hepatocellular carcinoma; although someevidence suggests that aflatoxins may also cause hepatomegaly,93 cirrhosis,94
and growth restriction95 in children, who appear to have increasedsusceptibility.96
Acute aflatoxicosis results from high-dose exposures and occurs periodicallyin mini-epidemics in developing countries. Aflatoxicosis results in vomiting,
Figure 16.3 Photomicrograph of a liver biopsy (100�, H&E stain) of a VC workerwith TASH and cirrhosis.
422 Chapter 16

hepatic steatosis, bile duct proliferation, hemorrhagic necrosis, pulmonaryedema, and hepatic encephalopathy.54 The largest reported outbreak occurred inKenya in 2004–2005 following ingestion of contaminated maize and resulted in317 cases and 125 deaths.97 Experimental studies have confirmed microvesicularsteatosis with glutathione depletion following acute exposure, with aspartateaminotransferase (AST)4alanine aminotransferase (ALT) elevation andimpaired mitochondrial respiration similar to Reye’s syndrome.98–100 Thus, acuteaflatoxicosis could be considered to represent ‘‘fulminant TASH’’.
In contrast to acute aflatoxicosis, hepatocellular carcinoma is increasinglyprevelent, and occurs as a consequence of low-level chronic exposures.Experimental studies have confirmed carcinogenesis with chronic aflatoxin B1
(AFB1) exposure across multiple species.54 However, human epidemiologicalstudies have typically focused on aflatoxin (urinary aflatoxin-N7-guanine) andhepatitis B virus (serum HBV surface antigen) co-exposures in Asia. Notably,in the People’s Republic of China, the incidence of HCC is 700,000 cases peryear. The first major cohort study, comprising more than 18,000 men inShanghai, determined HCC relative risks of 3.4, 7, and 59 for aflatoxin, HBV,and combined aflatoxin/HBV exposures. These synergistic results have beenconfirmed in other studies, and in high risk areas in China, the onset of livercancer also begins early in life, starting at age 20.54
Aflatoxin hepatocarcinogensis has been attributed to the genotoxicity ofmetabolites of AFB1 and AFG1. AFB1 is oxidized by CYP1A2 and CYP3A4to metabolites including the epoxide, AFB1-8,9-oxide, which may form DNAadducts (most notably aflatoxin-N7-guanine), or be conjugated with glut-athione to eventually form aflatoxin-N-acetylcysteine (AFB-NAC). IndeedGST polymorphisms have been associated with increased incidence of HCCdue to aflatoxin exposures.54 Ongoing chemoprevention studies focus on theability of Nrf2 activators, such as oltipraz or broccoli sprouts tea, to enhancedetoxification, as measured by increased urinary AFB-NAC and decreasedaflatoxin adducts.54
16.3.4 Arsenic
Inorganic arsenic is a ubiquitous element and a natural drinking watercontaminant. Owing to its toxic potential to humans, it is a high priorityhazardous substance in the United States. Chronic exposure to arsenic has beenlinked with a myriad of possible health effects, including skin lesions, hyper-tension, cardiovascular disease, respiratory disease, and malignancies of theskin and internal organs.101 The liver is a well-known target organ of arsenicexposure. Hepatic abnormalities caused by arsenic exposure include hepa-tomegaly, non-cirrhotic portal fibrosis, and portal hypertension.102–104
Furthermore, arsenic exposure has been linked to hepatic malignancies,namely hepatic hemangiosarcoma and hepatocellular carcinoma in bothhumans and in animal models.105,106 Straub et al. demonstrated that mouseliver is also sensitive to more subtle hepatic changes (e.g., hepatic endothelialcell capillarization and vessel remodeling) at lower arsenic exposure levels
Liver Disease 423

(250 ppb) without any gross pathologic effects.105 It is nevertheless unclear atthis time if environmental arsenic exposure at the levels observed in the UScauses liver disease.
Another major health concern for the US population is obesity, theprevalence of which is increasing at an alarming rate. Among the myriad ofhealth complications associated with obesity (e.g., diabetes, cardiovascular risk,etc.) is non-alcoholic fatty liver disease (NAFLD). Risk factors for primaryNAFLD (i.e., not secondary to other proximate causes) are analogous to thoseof metabolic syndrome (e.g., obesity, type II diabetes, and dyslipidemia). It isalso clear however, that there are likely other unidentified risk factors thatcontribute to the development of disease. A striking feature of arsenic exposureand non-alcoholic fatty liver disease is that there is significant overlap betweenareas of risk in the US.107,108 For example, states with clusters of municipalwells with high levels of arsenic (e.g., Michigan, Texas, West Virginia, andOklahoma) also have high incidences of obesity and diabetes.109,110
Furthermore, high arsenic in the drinking water is generally localized toprivate artesian water supplies (not regulated by the EPA) in rural commu-nities, where the incidence of obesity tends to be even higher than in most areasof the country. It is therefore possible that arsenic exposure is an unidentifiedenvironmental risk factor in the development of NAFLD. In support of thishypothesis, it was recently demonstrated that liver injury during experimentalNAFLD is enhanced by concomitant arsenic exposure in mice.111 As describedsubsequently, the course of NAFLD is worsened with aging.
16.4 Aging and Clinical Liver Disease
There are no liver diseases specific to advanced age. However, the clinicalcourse and management of the elderly with liver diseases differs in severalaspects from that of young individuals. Reduction in protective enzymes,decline in response to growth factors, and increased pathogen load from the gutall put the aged liver at increased risk for disease.9,112 In this section, alcoholicliver disease, NAFLD, viral hepatitis, and drug-induced liver injury (DILI) willbe discussed with regard to aging and susceptibility.
16.4.1 Alcoholic Liver Disease
Alcohol consumption is common in old age, and approximately 62% of indi-viduals over 60 years old are heavy alcohol drinkers.113 The majority(90–100%) of individuals with chronic alcohol consumption develop alcoholicfatty liver (AFL). About 30% of AFL individuals develop alcoholic steato-hepatitis (ASH), and approximately 10–20% develop alcoholic cirrhosis.114
The liver is the main organ for ethanol metabolism. Ethanol is primarilymetabolized to acetaldehyde (B80%) by alcohol dehydrogenase (ADH), andby cytochrome P450 2E1 (CYP2E1) and catalase. ADH transfers electronsfrom ethanol to the reducing equivalent NADP1; the cytochrome P450 system
424 Chapter 16

transfers the electrons to molecular oxygen (O2), and catalase reduces hydrogenperoxide (H2O2) to water. Age associated diminished activity of these enzymesmakes the liver vulnerable to the toxicity of alcohol.115,116 Additionally, theshift in hepatic redox state that occurs with oxidation of ethanol inhibitsmitochondrial b-oxidation of fatty acids and increases fatty acid synthesis andesterification,117 thereby contributing to the development of alcoholic fattyliver (AFL). In the aging population, AFL can lead directly to cirrhosis viaenhanced fibrogenesis.
More than 28% of alcoholic liver disease (ALD) diagnoses are in patientsaged 60 or over.116 Half of the elderly patients who develop cirrhosis die withina year of its diagnosis.113 The most common presentation in patients over 70years is dizziness and non-specific symptoms such as malaise, anorexia,abdominal pain.112 Because aged individuals often have other diseases, elderlypatients who have ALD may have more severe symptoms and a higherfrequency of complications.116 One study identified that 100% of men agedover 70 presenting with ALD had a more severe clinical presentation (jaundice,ascites, portal hypertension, gynecomastia) and cirrhosis on biopsy, comparedto 55% of men aged 20–59 years.112 In patients with severe ASH or cirrhosis, avariety of prognostic criteria exist: edema, esophageal variceal bleeding, andhepatic encephalopathy, all of which increase mortality significantly.116 TheGlasgow score for alcoholic hepatitis considers that age 450 is a significantfactor for a worse prognosis.112 In a British study, mortality from cirrhosis inalcoholic liver disease at years 1 and 3 of follow-up was 34% and 54%respectively in patients over 60, compared with 5% and 24% respectively inpatients under 60.118 Also, age over 55 is associated with an increased incidenceof central nervous system damage in patients with ALD when compared toyounger individuals.114 Thus, the severity and prognosis of ALD is worse withaging, and ethanol can increase susceptibility to injury from specific xenobioticsmetabolized by CYP2E1.
16.4.2 Nonalcoholic Fatty Liver Disease
NAFLD is composed of a spectrum of liver pathology ranging from steatosis toinflammation, often with fibrosis (non-alcoholic steatohepatitis), to cirrhosis.NAFLD is regarded as the hepatic manifestation of the metabolic syndrome,and its prevalence has risen in parallel with the obesity epidemic. A recent studyshowed that NAFLD accounted for 75% of chronic liver disease in the UnitedStates (NHANES 2005–2008), increasing from 47% in the previous decade(NHANES 1988–1994).119 Fatty liver was detected by magnetic resonancespectroscopy in 33.6% of the 2,349 adult (age 18–65) participants in the DallasHeart Study.120 The prevalence of NAFLD increases with age and ranges from1–3% in children, 5% in teenagers, 18% in adults aged 20–40, 39% in adultsaged 40–50, to over 40% in adults over 70 years of age.121 Not only is NAFLDmore common with aging, it also appears to be more severe. Age (especially450) was associated with increased fibrosis using multivariate analysis inmultiple cross-sectional studies.121 In the only liver biopsy study of NAFLD in
Liver Disease 425

patients over 70, exceptionally high prevalences of fibrosis (40%) and cirrhosis(14%) were observed.122 In addition to age, insulin resistance is an importantdeterminant of fibrosis progression. However, the interaction between NAFLDand insulin resistance is complex, as NAFLD is also associated with thesubsequent development of overt diabetes, metabolic syndrome, and cardio-vascular disease.121 The presence of NAFLD is associated with increasedmortality, and ischemic heart disease, cancer, and cirrhosis are the leadingcauses of death in NAFLD.121
Several mechanisms have been proposed to explain increased susceptibility toNAFLD with aging.121 Foremost among these are age-related loss of lean bodymass and an increased prevalence of metabolic syndrome. These conditions areassociated with fat redistribution from subcutaneous adipose tissue (SAT) tovisceral adipose tissue (VAT). This shift increases the flux of free fatty acids tothe liver and eventually overwhelms the oxidative (age-related decrease inmitochondrial function) and antioxidant capacities of the liver, resulting inincreased hepatic lipid accumulation, oxidative stress, and inflammation.NAFLD has also been associated with abnormal xenobiotic metabolism,independent of aging. Thus, NAFLD may increase susceptibility to liver injuryfrom xenobiotic compounds. The weight of evidence indicates that NAFLD isassociated with down-regulation of CYP1A2 and cellular glutathione(GSH).123 CYP2E1 is upregulated in the majority of human and rat, but notmouse, studies. Limited human data suggest that specific hepatic uptaketransporters may also be downregulated,124 while ATP-binding cassette (efflux)transporters may be upregulated (albeit with abnormal cellular localization insome cases)125 with increasing severity of NAFLD. Not only does NAFLDpotentially increase susceptibility to xenobiotic toxicity, some toxicantshave clearly been associated with the development of NAFLD/TASH(Table 16.2).
16.4.3 Viral Hepatitis
Worldwide, HBV accounts for an estimated 370million chronic infections.126
Older age at the time of acute HBV infection is associated with increased ratesof progression to chronic HBV.127 However, spontaneous annual seroclearancerates of hepatitis B surface antigen are higher in older subjects with chronicHBV.127 While progression to cirrhosis is best correlated with higher HBVDNA levels, older age and male sex are also important risk factors.128 Olderage also increases the risk for development of hepatocellular carcinoma.129
Approximately 3% (B170million) of the world’s population has beeninfected with Hepatitis C (HCV), and adults aged 40–49 have the highestseroprevalence.127 However, subjects older than 65 are more likely to presentwith decompensated cirrhosis and HCC.130 A liver biopsy study in patientsover the age of 65 showed that 60% had cirrhosis, 30% had HCC, and 10%had chronic active hepatitis.112 The probability of fibrosis progression isaccelerated with aging; and men aged 61–70 years with HCV had 300 timesgreater fibrosis progression per year than men aged 21–40 years.131 Likewise,
426 Chapter 16

the median time to development of cirrhosis was 33 years in those infectedduring the third decade of life, compared to 16 years in those infected at age 40or older.132 Older age is also associated with decreased rates of sustainedvirologic response with HCV pharmacotherapy, and this lack of response hasbeen attributed, in part, to increased drop-outs due to medication side effects.HCV is the leading indication for liver transplantation in the US, but olderdonor age is associated with increased graft loss due to more aggressiverecurrence of HCV infection.133
The more rapid course of HCV observed with aging has been proposed to berelated to a reduction in hepatic blood flow, reduced mitochondrial function,and cumulative exposures to environmental hepatotoxicants.118,127 Mixedexposures to 1,2-ethylene dichloride and vinyl chloride have a synergistic effectwith hepatitis B virus infection for liver injury (elevated serum aminotrans-ferases) in exposed workers.134 Likewise chronic HBV was a risk factor for thedevelopment of hepatocellular carcinoma in vinyl chloride workers.134,135
Moreover, aflatoxin co-exposures may synergistically increase the risk forhepatocellular carcinoma in subjects with chronic HBV or HCV infection.136
Exposure to acrolein, an environmental aldehyde, has been associated withdecreased responsiveness in vitro to interferon alpha, which is used to treatchronic viral hepatitis.137
16.4.4 Drug Induced Liver Injury
Older age is traditionally considered to be a susceptibility factor for druginduced liver injury (DILI).138 It is estimated that over 1100 drugs and herbalsare associated with DILI, and DILI remains the leading cause of acute liverfailure (ALF).139 Furthermore, older age negatively impacted survival of ALFin some, but not all, studies.140 In the Acute Liver Failure Study Group,acetaminophen (APAP) accounted for 46% of ALF, while non-APAP DILIaccounted for 12% of ALF.141 Older age is a traditional risk factor for bothAPAP and idiosyncratic DILI (e.g., diclofenac, isoniazid, flucloxacillin,amoxicillin/clavulanic acid, erythromycin, nitrofurantoin, and methot-rexate).138,139 In Spain, 45% of DILI cases during 1994–2004 occurred inpatients aged460.142 More recent data from DILI registries challenge thenotion that age alone is risk factor for ALF from DILI.139 However, agecontinues to be associated with increased susceptibility to cholestatic DILI.139
In addition to age-related changes in drug absorption, distribution, meta-bolism, and elimination, age and frailty may be associated with additional riskfactors for DILI, including concomitant ethanol use, polypharmacy, mal-nutrition, NAFLD, and cognitive impairment affecting adherence.138 From amechanistic standpoint, mitochondrial toxicity appears to be an early event inidiosyncratic DILI, and age-related mitochondrial damage could confound thisproblem.138 Aging related risk factors appear to increase susceptibility to DILI,and mitochondrial dysfunction and malnutrition remain important associatedmechanisms. However, more data are needed to better understand thisimportant topic.
Liver Disease 427

16.5 Conclusions
The liver is the largest and most biochemically complex organ in the body.Normal aging is associated with morphologic, physiologic, biochemical,immunologic, and regenerative changes, which may increase susceptibility tohepatotoxic chemicals. Industrial chemicals and food contaminants such asaflatoxin have been associated with a myriad of pathologic liver injuries,ranging from acute hepatitis to chronic hepatitis, cirrhosis, and liver cancer.The hepatic response to toxic chemicals may be even more complex in olderindividuals with underlying liver diseases, including alcoholic liver disease,nonalcoholic fatty liver disease, and viral hepatitis.
Abbreviations
AFB1 aflatoxin B1ADH alcohol dehydrogenaseALD alcoholic liver diseaseAFL alcoholic fatty liverALF acute liver failureALT alanine aminotransferaseASH alcoholic steatohepatitisAST aspartate aminotransferaseAP-1 activator protein 1ARE antioxidant response elementAhR aryl hydrocarbon receptorbZIP basic region leucine zipperCAA chloroacetaldehydeCAR constitutive androstane receptorCAS chemical abstracts serviceCYP cytochrome P450DILI drug-induced liver injuryFHH focal hepatocytic hyperplasiaFMH focal mixed hyperplasiaGCL glutamate cysteine ligaseGSH reduced glutathioneGST glutathione S-transferasesHBV hepatitis B virusHCV hepatitis C VirusHCC hepatocellular carcinomaIGF-1 insulin-like growth factorKeap1 kelch-like-ECH-associated protein 1LSECs liver sinusoidal endothelial cellsNASH nonalcoholic steatohepatitisNF-kB nuclear factor kappa BNIOSH National Institute of Occupational Safety and HealthNrf2 nuclear factor (erythroid-derived 2)-like 2
428 Chapter 16

PCBs polychlorinated biphenylsPOPs persistent organic pollutantsPPARa peroxisome proliferator activated receptor aPXR pregnane and xenobiotic receptorROS reactive oxygen speciesSAT subcutaneous adipose tissueTCDD 2,3,7,8-tetrachlorodibenzodioxinFox01 Forkhead box protein 01PEPCK Phosphoenolpyruvate carboxykinaseCPT1 carnitine palmitoyl transfersase 1FACO fatty acyl CoA oxidaseOtap organic anion transporting peptideNFkB nuclear factor kappa BMafs musculoaponeurotic fibrosarcoma proteinsTASH toxicant-associated steatohepatitisTOR target of rapamycinVAT visceral adipose tissue
References
1. M. Hoare, T. Das and G. Alexander, J. Hepatol., 2010, 53, 950–961.2. D. G. Le Couteur and A. J. McLean, Clin. Pharmacokinetics, 1998, 34,
359–373.3. D. L. Schmucker, Drugs Aging, 2001.4. S. J. Mitchell, A. E. Kane and S. N. Hilmer, Curr. Gerontol. Geriatr. Res.,
2011, 2011, 624156.5. D. G. Le Couteur, A. Warren, V. C. Cogger, B. Smedsrod, K. K. Sorensen,
R. De Cabo, R. Fraser and R. S. McCuskey, Anat. Rec., 2008, 291,672–683.
6. O. Junaidi and A. M. Di Bisceglie, Clinics in Geriatric Medicine, 2007, 23,889–903, viii.
7. S. J. Mitchell and S. N. Hilmer, Ther. Adv. Drug Safety, 2010, 1, 65–77.8. P. L. Jansen, Best Practice & Research. Clinical Gastroenterology, 2002,
16, 149–158.9. A. J. McLean and D. G. Le Couteur, Pharmacol. Rev., 2004, 56, 163–184.
10. H. A. Wynne, L. H. Cope, O. F. James, M. D. Rawlins andK. W. Woodhouse, Age Ageing, 1989, 18, 415–418.
11. E. A. Sotaniemi, A. J. Arranto, O. Pelkonen and M. Pasanen, ClinicalPharmacology and Therapeutics, 1997, 61, 331–339.
12. U. Klotz, Drug Metab. Rev., 2009, 41, 67–76.13. G. A. Hazelton and C. A. Lang, The Biochemical Journal, 1980, 188,
25–30.14. C. A. Lang, S. Naryshkin, D. L. Schneider, B. J. Mills and
R. D. Lindeman, The J. Lab. Clin. Med., 1992, 120, 720–725.15. T. S. Chen, J. P. Richie, Jr. and C. A. Lang, Drug Metabolism and
Disposition: the Biological Fate of Chemicals, 1990, 18, 882–887.
Liver Disease 429

16. Y. K. Zhang, K. W. Saupe and C. D. Klaassen, Drug Metabolism andDisposition: the Biological Fate of Chemicals, 2010, 38, 1122–1131.
17. A. Parkinson, D. R. Mudra, C. Johnson, A. Dwyer and K. M. Carroll,Toxicol. Appl. Pharmacol., 2004, 199, 193–209.
18. M. S. Denison and J. P. Whitlock, Jr., The Journal of BiologicalChemistry, 1995, 270, 18175–18178.
19. T. Wada, J. Gao and W. Xie, Trends Endorinol. Metab., 2009, 20, 273–279.20. S. P. Mooijaart, B. W. Brandt, E. A. Baldal, J. Pijpe, M. Kuningas,
M. Beekman, B. J. Zwaan, P. E. Slagboom, R. G. Westendorp and D. vanHeemst, Ageing Research Reviews, 2005, 4, 351–371.
21. B. Gerisch, V. Rottiers, D. Li, D. L. Motola, C. L. Cummins, H. Lehrach,D. J. Mangelsdorf and A. Antebi, Proc.Natl. Acad. Sci. U.S.A., 2007,104, 5014–5019.
22. Y. Konno, M. Negishi and S. Kodama, Drug Metab. Pharmacokinet.,2008, 23, 8–13.
23. E. R. Kallwitz, A. McLachlan and S. J. Cotler, World J. Gastroenterol.,2008, 14, 22–28.
24. J. B. Schwartz, Clin. Pharm. Ther., 2007, 82, 87–96.25. J. S. Lee, W. O. Ward, J. Liu, H. Ren, B. Vallanat, D. Delker and
J. C. Corton, PloS One, 2011, 6, e24381.26. J. S. Warrington, D. J. Greenblatt and L. L. von Moltke, J. Pharmacol.
Exp. Ther., 2004, 309, 730–736.27. R. N. Hardwick, C. D. Fisher, M. J. Canet, A. D. Lake and
N. J. Cherrington, Drug Metabolism and Disposition: the Biological Fateof Chemicals, 2010, 38, 2293–2301.
28. P. D. Ray, B. W. Huang and Y. Tsuji, Cell. Signalling, 2012, 24, 981–990.29. K. N. Lewis, J. Mele, J. D. Hayes and R. Buffenstein, Integr. Comp. Biol.,
2010, 50, 829–843.30. H. Y. Cho, S. P. Reddy, A. Debiase, M. Yamamoto and S. R. Kleeberger,
Free Radic. Biol. Med., 2005, 38, 325–343.31. X. L. Chen, G. Dodd, S. Thomas, X. Zhang, M. A. Wasserman,
B. H. Rovin and C. Kunsch, American Journal of Physiology. Heart andCirculatory Physiology, 2006, 290, H1862–1870.
32. T. Nguyen, T. H. Rushmore and C. B. Pickett, The Journal ofBiological Chemistry, 1994, 269, 13656–13662.
33. J. H. Suh, S. V. Shenvi, B. M. Dixon, H. Liu, A. K. Jaiswal, R. M.Liu and T. M. Hagen, Proc.Natl. Acad. Sci. U.S.A., 2004, 101,3381–3386.
34. S. V. Shenvi, E. Smith and T. M. Hagen, Aging Cell, 2012, 11, 297–304.35. A. Tsukahara, S. Seki, T. Iiai, T. Moroda, H. Watanabe, S. Suzuki,
T. Tada, H. Hiraide, K. Hatakeyama and T. Abo, Hepatology, 1997, 26,301–309.
36. S. N. Hilmer, V. C. Cogger and D. G. Le Couteur, The Journals ofGerontology. Series A, Biological Sciences and Medical Sciences, 2007, 62,973–978.
37. R. Taub, Nat. Rev. Mol. Cell Biol., 2004, 5, 836–847.
430 Chapter 16

38. R. F. Schwabe, E. Seki and D. A. Brenner, Gastroenterology, 2006, 130,1886–1900.
39. P. Iakova, S. S. Awad and N. A. Timchenko, Cell, 2003, 113, 495–506.40. A. Regev and E. R. Schiff, Gastroenterol. Clin. North. Am., 2001, 30,
547–563, x–xi.41. J. S. Hammond, I. N. Guha, I. J. Beckingham and D. N. Lobo, Br. J.
Surg., 2011, 98, 1188–1200.42. T. Poynard, P. Bedossa and P. Opolon, Lancet, 1997, 349, 825–832.43. S. B. Missiha, M. Ostrowski and E. J. Heathcote, Gastroenterology, 2008,
134, 1699–1714.44. M. W. Djojosubroto, Y. S. Choi, H. W. Lee and K. L. Rudolph,
Mol. Cells, 2003, 15, 164–175.45. H. Aikata, H. Takaishi, Y. Kawakami, S. Takahashi, M. Kitamoto,
T. Nakanishi, Y. Nakamura, F. Shimamoto, G. Kajiyama and T. Ide,Exp. Cell Res., 2000, 256, 578–582.
46. Y. Deng, S. S. Chan and S. Chang, Nat. Rev. Cancer, 2008, 8, 450–458.47. K. L. Rudolph, S. Chang, M. Millard, N. Schreiber-Agus and
R. A. DePinho, Science, 2000, 287, 1253–1258.48. K. G. Tolman and R. Sirrine, Clin. Liver Dis., 1998, 2.49. G. Mastrangelo, U. Fedeli, E. Fadda, F. Valentini, R. Agnesi,
G. Magarotto, T. Marchi, A. Buda, M. Pinzani and D. Martines, Environ.Health Perspect., 2004, 112, 1188–1192.
50. H. I. Hsieh, P. C. Chen, R. H. Wong, J. D. Wang, P. M. Yang andT. J. Cheng, Toxicology, 2007, 239, 34–44.
51. Y. S. Lin, T. J. Smith, D. Wypij, K. T. Kelsey and F. M. Sacks, Environ.Health Perspect., 2002, 110, 165–168.
52. M. Cave, K. C. Falkner, M. Ray, S. Joshi-Barve, G. Brock, R. Khan,M. Bon Homme and C. J. McClain, Hepatology, 2010, 51, 474–481.
53. N. Brautbar and J. Williams, 2nd, Int. J. Hyg. Environ. Health, 2002, 205,479–491.
54. T. W. Kensler, B. D. Roebuck, G. N. Wogan and J. D. Groopman,Toxicol. Sci., 2011, 120(Suppl 1), S28–48.
55. H. Kopelman, P. Scheurer and R. Williams, Quart. J. Med., 1966, 35,533–564.
56. L. Nichols, Int. Arch. Occup. Environ. Health, 2004, 77, 592–594.57. E. Gelpi, M. P. de la Paz, B. Terracini, I. Abaitua, A. G. de la Camara,
E. M. Kilbourne, C. Lahoz, B. Nemery, R. M. Philen, L. Soldevilla andS. Tarkowski, Environ. Health Perspect., 2002, 110, 457–464.
58. M. Patel, K. C. Falkner, C. J. McClain, G. Brock, S. Appana andM. Cave, Gastroenterology, 2009, 136, 289.
59. M. Cave, S. Appana, M. Patel, K. C. Falkner, C. J. McClain andG. Brock, Environ. Health Perspect., 2010, 118, 1735–1742.
60. J. Liu, W. Drane, X. Liu and T. Wu, Environ. Res., 2009, 109, 193–199.61. M.Cave, K. C.Falkner and C. J.McClain, in Zakim and Boyer’s Hepa-
tology: A Textbook of Liver Disease, eds. T. Boyer, M. Manns andA. Sanyal, Elsevier Saunders, Philadelphia, 6th edn., 2011, pp. 476–492.
Liver Disease 431

62. M. Ates, A. Dirican, D. Ozgor, C. Aydin, B. Isik, C. Ara, M. Yilmaz,M. Ayse Selimoglu, C. Kayaalp and S. Yilmaz, Liver Transpl., 2011, 17,1286–1291.
63. H. von Rettberg, T. Hannman, U. Subotic, J. Brade, T. Schaible,K. L. Waag and S. Loff, Pediatrics, 2009, 124, 710–716.
64. H. L. Tsang, S. Wu, C. K. Leung, S. Tao and M. H. Wong, Environ. Int.,2011, 37, 142–151.
65. H. Zimmerman, Hepatotoxicity: The Adverse Effects Of Drugs And OtherChemicals On The Liver, Lippincott Williams & Wilkins, Philadelphia, 2edn, 1999.
66. G.Farrell, Drug-Induced Liver Disease, Churchill Livingstone, New York,1994.
67. M. Cave, K. C. Falkner, L. Henry, B. Costello, B. Gregory andC. J. McClain, J Occup. Environ. Med., 2011, 53, 1128–1133.
68. H. P. Cotrim, L. A. De Freitas, C. Freitas, L. Braga, R. Sousa,F. Carvalho, R. Parana, R. Santos-Jesus and Z. Andrade, Liver Int., 2004,24, 131–135.
69. M. Cave, K. C. Falkner, B. Costello, B. Gregory, L. D. Henry andC. J. McClain, The Toxicologist CD Supplement to ToxicologicalSciences — An Official Journal of the Society of Toxicology, 2011,120(Suppl 2).
70. M. Cave, I. Deaciuc, C. Mendez, Z. Song, S. Joshi-Barve, S. Barve andC. McClain, The Journal of Nutritional Biochemistry, 2007, 18, 184–195.
71. J. L. Creech, Jr. and M. N. Johnson, J. Occup Med., 1974, 16, 150–151.72. R. J. Bull, Environ. Health Perspect., 2000, 108(Suppl 2), 241–259.73. L. H. Lash and J. C. Parker, Pharmacol. Rev., 2001, 53, 177–208.74. C. H. Tamburro, L. Makk and H. Popper, Hepatology, 1984, 4, 413–418.75. J. Kielhorn, C. Melber, U. Wahnschaffe, A. Aitio and I. Mangelsdorf,
Environ. Health Perspect., 2000, 108, 579–588.76. P. F. Infante, S. E. Petty, D. H. Groth, G. Markowitz and D. Rosner, Int.
J. Occup. Environ. Health, 2009, 15, 36–42.77. R. E. Hefner, Jr., P. G. Watanabe and P. J. Gehring, Environ.
Health Perspect., 1975, 11, 85–95.78. D. Antonino-Green, M. W. Linder, P. Fortwengler, S. Looney,
T. E. Geoghegan and R. J. Valdes, Proc. Am. Assoc. Cancer Res., 2000, 41.79. F. Ji, Y. J. Zheng, Q. Wang, W. Wang, Y. L. Qiu, F. Wu, S. J. Chai, J. Li
and Z. L. Xia, Zhonghua Lao Dong Wei Sheng Zhi Ye Bing Za Zhi, 2011,29, 583–588.
80. C. Y. Huang, K. L. Huang, T. J. Cheng, J. D. Wang and L. L. Hsieh,Arch. Toxicol., 1997, 71, 482–488.
81. H. M. Bolt, Criti. Rev. Toxicol., 2005, 35, 307–323.82. K. C. Falkner, B. G. Hill, B. Sansbury, C. J. McClain and M. Cave,
Hepatology, 2010, 52, 266A.83. S. M. Cohen, R. D. Storer, K. A. Criswell, N. G. Doerrer, V. L. Dellarco,
D. G. Pegg, Z. W. Wojcinski, D. E. Malarkey, A. C. Jacobs,
432 Chapter 16

J. E. Klaunig, J. A. Swenberg and J. C. Cook, Toxicol. Sci., 2009, 111,4–18.
84. M. Cave, R. Groce, A. Mahalingashetty, S. Joshi-Barve, L. Reynolds andC. J. McClain, Hepatology, 2007, 46.
85. K. A. Mundt, L. D. Dell, R. P. Austin, R. S. Luippold, R. Noess andC. Bigelow, Occup. Environ. Med., 2000, 57, 774–781.
86. E. Ward, P. Boffetta, A. Andersen, D. Colin, P. Comba, J. A. Deddens,M. De Santis, G. Engholm, L. Hagmar, S. Langard, I. Lundberg,D. McElvenny, R. Pirastu, D. Sali and L. Simonato, Epidemiology, 2001,12, 710–718.
87. Y. L. Qiu, P. Sun, W. Wang, T. Wang and Z. L. Xia, J. Occup. Environ.Med., 2011, 53, 1442–1446.
88. Y. L. Qiu, W. Wang, T. Wang, P. Sun, F. Wu, S. M. Zhu, J. Qian, L. Jin,W. Au and Z. L. Xia, Int. J. Hyg. Environ. Health, 2011, 214, 225–230.
89. G. E. Trivers, H. L. Cawley, V. M. DeBenedetti, M. Hollstein,M. J. Marion, W. P. Bennett, M. L. Hoover, C. C. Prives, C. C. Tamburroand C. C. Harris, J. Natl Cancer Inst., 1995, 87, 1400–1407.
90. P. Gedigk, R. Muller and H. Bechtelsheimer, Ann. N. Y. Acad. Sci., 1975,246, 278–285.
91. T. J. Hsiao, J. D. Wang, P. M. Yang, P. C. Yang and T. J. Cheng,J. Occup. Environ. Med., 2004, 46, 962–966.
92. M. Maroni, F. Mocci, S. Visentin, G. Preti and A. C. Fanetti, Occup.Environ. Med., 2003, 60, 60–65.
93. Y. Y. Gong, S. Wilson, J. K. Mwatha, M. N. Routledge, J. M. Castelino,B. Zhao, G. Kimani, H. C. Kariuki, B. J. Vennervald, D. W. Dunne andC. P. Wild, Environ. Health Perspect., 2012.
94. I. Amla, C. S. Kamala, G. S. Gopalakrishna, A. P. Jayaraj,V. Sreenivasamurthy and H. A. Parpia, Am. J. Clin. Nutr., 1971, 24,609–614.
95. P. Khlangwiset, G. S. Shephard and F. Wu, Crit. Rev. Toxicol., 2011, 41,740–755.
96. J. H. Williams, T. D. Phillips, P. E. Jolly, J. K. Stiles, C. M. Jolly andD. Aggarwal, Am. J. Clin. Nutr., 2004, 80, 1106–1122.
97. L. Lewis, M. Onsongo, H. Njapau, H. Schurz-Rogers, G. Luber,S. Kieszak, J. Nyamongo, L. Backer, A. M. Dahiye, A. Misore,K. DeCock and C. Rubin, Environ. Health Perspect., 2005, 113,1763–1767.
98. L. Zhang, Y. Ye, Y. An, Y. Tian, Y. Wang and H. Tang, J. Proteome.Res., 2011, 10, 614–623.
99. A. G. Valdivia, A. Martinez, F. J. Damian, T. Quezada, R. Ortiz,C. Martinez, J. Llamas, M. L. Rodriguez, L. Yamamoto, F. Jaramillo,M. G. Loarca-Pina and J. L. Reyes, Poult. Sci., 2001, 80, 727–734.
100. M. P. Sajan, J. G. Satav and R. K. Bhattacharya, Indian J. Exp. Biol.,1997, 35, 1187–1190.
Liver Disease 433

101. M. P. Waalkes, J. Liu, H. Chen, Y. Xie, W. E. Achanzar, Y. S. Zhou,M. L. Cheng and B. A. Diwan, J. Natl. Cancer Inst., 2004, 96, 466–474.
102. D. N. Mazumder, Toxicol. Appl. Pharmacol., 2005, 206, 169–175.103. A. Santra, J. Das Gupta, B. K. De, B. Roy and D. N. Guha Mazumder,
Indian J. Gastroenterol., 1999, 18, 152–155.104. A. Santra, A. Maiti, S. Das, S. Lahiri, S. K. Charkaborty and
D. N. Mazumder, J. Toxicol. Clin. Toxicol, 2000, 38, 395–405.105. A. C. Straub, D. B. Stolz, M. A. Ross, A. Hernandez-Zavala, N. V. Soucy,
L. R. Klei and A. Barchowsky, Hepatology, 2007, 45, 205–212.106. M. P. Waalkes, J. Liu, J. M. Ward and B. A. Diwan, Toxicol. Appl.
Pharmacol., 2006, 215, 295–305.107. A. H. Mokdad, E. S. Ford, B. A. Bowman, W. H. Dietz, F. Vinicor,
V. S. Bales and J. S. Marks, JAMA, 2003, 289, 76–79.108. A. H. Welch, S. A. Watkins, D. R. Helsel and M. J. Focazio, U. S.
Geological Survey Fact Sheet FS-063-00, 2000.109. U. S. G. Survey, 2007.110. C. f. D. C. a. Prevention, 2007.111. M. Tan, R. H. Schmidt, J. I. Beier, W. H. Watson, H. Zhong, J. C. States
and G. E. Arteel, Toxicol. Appl. Pharmacol., 2011, 257, 356–364.112. J. Frith, D. Jones and J. L. Newton, Age Ageing, 2009, 38, 11–18.113. A. Floreani, Dig Dis, 2007, 25, 138–143.114. P. Meier and H. K. Seitz, Curr. Opin. Clin. Nutr. Metab. Care, 2008, 11,
21–26.115. D. L. Schmucker and R. K. Wang, Exp. Gerontol., 1980, 15, 423–431.116. H. K. Seitz and F. Stickel, Clinics in Geriatric Medicine, 2007, 23,
905–921, viii.117. C. S. Lieber, Annu.Rev. Nutr., 2000, 20, 395–430.118. O. Falade-Nwulia and C. L. Thio, Sexual health, 2011, 8, 512–520.119. Z. M. Younossi, M. Stepanova, M. Afendy, Y. Fang, Y. Younossi,
H. Mir and M. Srishord, Clin. Gastroenterol. Hepatol., 2011, 9, 524–530e521; quiz e560.
120. L. S. Szczepaniak, P. Nurenberg, D. Leonard, J. D. Browning,J. S. Reingold, S. Grundy, H. H. Hobbs and R. L. Dobbins, Am. J.Physiol. Endocrinol. Metab., 2005, 288, E462–468.
121. L. Gan, S. Chitturi and G. C. Farrell, Curr. Gerontol. Geriatr. Res., 2011,2011, 831536.
122. J. Frith, C. P. Day, E. Henderson, A. D. Burt and J. L. Newton,Gerontology, 2009, 55, 607–613.
123. M. D. Merrell and N. J. Cherrington, Drug. Metab. Rev., 2011, 43,317–334.
124. A. D. Lake, P. Novak, C. D. Fisher, J. P. Jackson, R. N. Hardwick,D. D. Billheimer, W. T. Klimecki and N. J. Cherrington, Drug Metabolismand Disposition: the Biological Fate of Chemicals, 2011, 39, 1954–1960.
125. R. N. Hardwick, C. D. Fisher, M. J. Canet, G. L. Scheffer andN. J. Cherrington, Drug Metabolism and Disposition: the Biological Fateof Chemicals, 2011, 39, 2395–2402.
434 Chapter 16

126. M. K. Mohommad, Z. Zhou, M. Cave, A. Barve and C. J. McClain,Nutrition in Clinical Practice: Official Publication of the American Societyfor Parenteral and Enteral Nutrition, 2012, 27, 8–20.
127. A. F. Carrion and P. Martin, Am. J. Gastroenterol., 2012, 107, 691–697.128. U. H. Iloeje, H. I. Yang, J. Su, C. L. Jen, S. L. You and C. J. Chen,
Gastroenterology, 2006, 130, 678–686.129. A. S. Lok and B. J. McMahon, Hepatology, 2009, 50, 661–662.130. D. Thabut, S. Le Calvez, V. Thibault, J. Massard, M. Munteanu, V. Di
Martino, V. Ratziu and T. Poynard, Am. J. Gastroenterol., 2006, 101,1260–1267.
131. T. Poynard, V. Ratziu, F. Charlotte, Z. Goodman, J. McHutchison andJ. Albrecht, J. Hepatol., 2001, 34, 730–739.
132. E. Minola, D. Prati, F. Suter, F. Maggiolo, F. Caprioli, A. Sonzogni,M. Fraquelli, S. Paggi and D. Conte, Blood, 2002, 99, 4588–4591.
133. J. R. Lake, J. S. Shorr, B. J. Steffen, A. H. Chu, R. D. Gordon andR. H. Wiesner, Am. J. Transplant., 2005, 5, 549–557.
134. H. I. Hsieh, J. D. Wang, P. C. Chen and T. J. Cheng, Occup. Environ.Med., 2003, 60, 774–778.
135. C. L. Du and J. D. Wang, Occup. Environ. Med., 1998, 55, 528–532.136. C. P. Wild and R. Montesano, Cancer Lett., 2009, 286, 22–28.137. S. Joshi-Barve, K. Amancherla, M. Patil, A. Bhatnagar, S. Mathews,
L. Gobejishvili, M. Cave, C. McClain and S. Barve, Free Radic. Biol.Med., 2009, 47, 47–54.
138. S. J. Mitchell and S. N. Hilmer, Therapeutic Advances in Drug Safety,2010, 1, 65–77.
139. J. G. Stine and J. H. Lewis, Expert Opin. Drug Metab. Toxicol., 2011, 7,875–890.
140. J. Polson and W. M. Lee, Hepatology, 2005, 41, 1179–1197.141. W. M. Lee, Best Practice & Research. Clinical Gastroenterology, 2012, 26,
3–16.142. R. J. Andrade, M. I. Lucena, M. C. Fernandez, G. Pelaez, K. Pachkoria,
E. Garcia-Ruiz, B. Garcia-Munoz, R. Gonzalez-Grande, A. Pizarro,J. A. Duran, M. Jimenez, L. Rodrigo, M. Romero-Gomez, J. M. Navarro,R. Planas, J. Costa, A. Borras, A. Soler, J. Salmeron andR. Martin-Vivaldi, Gastroenterology, 2005, 129, 512–521.
Liver Disease 435

CHAPTER 17
Immune System Disorders
RODNEY R. DIETERT
Department of Microbiology and Immunology, College of VeterinaryMedicine, Cornell University, North Tower Rd. Ithaca, NY 14853, USAE-mail: [email protected]
17.1 Introduction
The immune system is composed of a variety of different cell types thatcontribute in a coordinated manner to provide: 1) host defense, 2) tissuesurveillance and integrity, and 3) the homeostatic regulation of function oftissue and organs. Because immune cells are distributed during early devel-opment to virtually every tissue and organ of the body, the functional status ofthese resident immune cells can greatly influence the overall function of thetissue or organ, as well as the risk of subsequent pathology. Besides systemicimmune dysfunction, immune dysfunction of specialized populations such asmicroglia in the brain, alveolar macrophages in the respiratory tract, andKupffer cells in the liver can directly mediate organ pathologies and diseases.
Therefore, immune system disorders should not be thought of as diseasesrestricted to the primary and secondary lymphoid organs (e.g., thymus, spleen).Instead, immune disorder-based diseases span every medical categorization andcoding.1 Of course this also means that immune disorders are usually under-estimated since they are likely to be given a different medical label. Examples ofthis would be for diseases such as psoriasis, atherosclerosis, asthma, auto-immune thyroiditis, and inflammatory bowel disease, which are likely to becategorized as dermal, cardiovascular, respiratory, endocrine, and gastro-intestinal diseases respectively. However, in reality—if one examines the basis
Issues in Toxicology No. 16
Aging and Vulnerability to Environmental Chemicals: Age-related Disorders and their Origins in
Environmental Exposures
Edited by Bernard Weiss
r The Royal Society of Chemistry 2013
Published by the Royal Society of Chemistry, www.rsc.org
436

of these diseases and not just the involved tissues where the pathologyoccurs—these are all immune dysfunction-based diseases featuring inflam-matory misregulation.2
A recent topic of interest has been the various ways in which environmentalfactors such as pollutants can cause immune alterations that then lead tochronic diseases. Historically, the focus of immunotoxicology was on ensuringthe integrity of the immune system to provide host defense, protecting againstinfectious agents.3 Detection of detrimental effects of the environment onimmune-mediated host defense was seen as the foremost priority during the erawhere HIV/AIDS-associated immunosuppression was emerging as a criticalhealth threat. Obviously, reduction of immune function remains a concern. Butmore recently, this priority was overshadowed by the potential for environ-mental risk factors to cause other adverse immune outcomes that are far moredirectly connected to the risk of major chronic diseases: inappropriate immuneenhancement, autoimmunity, and misregulated inflammation.1
As will be described in this chapter, health risks tied to environmentally-induced immune system disorders are not restricted to a handful of randomdiseases and conditions, such as loss of host defense, increased risk ofinfections, and leukemia. In stark contrast, the immune system disorders thatresult from early-life environmental insult predispose individuals not just toacute illnesses, but also to chronic diseases. They also increase the probabilitythat individuals will carry the burden of multiple chronic diseases over alifetime.4 New patterns of elevated health risks for several interlinked chronicdiseases and conditions can emerge from a single ill-timed environmentalexposure.5 Many of these immune-based chronic diseases will emerge later inlife during the normal aging process. This chapter describes the cause–effectrelationships between problematic environmental conditions, developmentalimmunotoxicity (DIT), immune dysfunction, inflammatory misregulation, andchronic diseases. It also discusses opportunities that could reduce the risk ofprevalence of chronic diseases that emerge during the aging process.
17.2 Immune Cells as Environmental Sentries at the
Portals of Entry
Components of the immune system are dispersed throughout the body and areparticularly concentrated at the portals where initial environmental exposureoccurs (airways, gastrointestinal system, skin, and reproductive-excretorysystems). It is here that these resident immune cells play a role in sampling theenvironment for danger signals, including the introduction of potentialpathogens. But it is also these same cells that are among the first to encounterpotentially harmful environmental factors. By location alone, virtually anyenvironmental exposure is likely to involve the exposure of at least someimmune cell populations (via the airways, skin, and gut). The question thenbecomes not whether any immune cell populations were exposed to a toxicant,but rather when are exposures significant relative to risk of immune
Immune System Disorders 437

dysfunction, pathology, and disease? Isolated exposure of small populations ofspecialized cells such as brain microglia, alveolar macrophages, gut intrae-pithelial lymphocytes, or skin dendritic cells might be viewed as having quitelimited consequences. But the relative sensitivity and functional implications ofenvironmental damage to these immune cell residents in tissues is often eitherunderestimated or uncertain. For example in the child, environmental factorsinteract with both the gut microbial population and mucosal immune cells toproduce significant local immune alteration.6–8 But this alteration can result inimmune problems and elevated risk of diseases that extend beyond the gut toseveral other tissues and organs. In mice, investigators recently demonstratedthat the status of the gut microbiome and changes in gastrointestinal immunecell populations affect the risk of neurologically-based experimental auto-immune encephalomyelitis.9 This is an important concept: that the status ofgastrointestinal immune cell populations appears to affect the risk of neur-ological chronic disease. The implications are that environmentally-inducedalterations of local resident immune cell populations may elevate health risksinvolving other tissues and organs, or even systemically. But how or why mightthis happen? At least one possible explanation lies in the observation that theimmune system appears to exist as a fractal network, despite its dispersal intissues. With this in mind, local effects have the potential to lead to functionalor pathological ramifications in non-local tissues.1
17.3 Early-Life Origins of Adult Immune-Based
Diseases
17.3.1 Development Origins of Disease: The Barker Hypothesis
One of the challenges in identifying the risk of immune-based diseases fromexposure to environmental factors such as toxicants is the issue of the timeinterval between problematic exposures and disease onset. The concept of adevelopmental basis of adult disease was advanced in prior decades and becameknown as the ‘‘Barker Hypothesis’’.10–12 But while the original concept wasframed primarily as related to undernutrition and risk of subsequent cardiov-ascular disease,13 it is now clear that the connection between fetal environmentand adult disease is far more extensive in scope and impact.14–16 The range ofenvironmental factors that can produce a fetal linkage with risk of adult diseasegoes well beyond undernutrition, and the adverse outcomes are not restricted tojust cardiovascular disease.17 The concept of developmental origins of chronicdiseases has become a major issue in toxicology.18–20
17.3.2 Critical Windows of Immune Vulnerability
While early-life insult and developmentally programmed dysfunction can affectany physiological system, the immune system represents a particular concern asa target. In general, environmentally-induced immune alterations in the young
438 Chapter 17

are termed developmental immunotoxicity (DIT), as the categorizationencompasses many different types of environmental factors or agents.21
Immune maturation occurs in discrete steps during both prenatal andpostnatal development.22,23 These steps must occur with precision and precisedevelopmental timing to produce a functioning, effectively regulated, and well-balanced immune system in the child.
The basic concept that during development there are critical windows ofvulnerability for the immune system has existed for more than a decade.24–28
The conceptual framework states that specific maturational events are preciselytimed with specific windows of prenatal and/or neonatal development. Becausethe maturational events are both critical for integrity of the child’s immunesystem and may be restricted to one or a few windows of development, theirdisruption can have not only devastating effects on subsequent immunefunction, but also environmentally-mediated effects that are likely distinct fromthose produced by similar exposures at other periods of development.Examples of critical windows for the immune system would be: 1) emergence ofmyelomonocytic cells and seeding of tissues and organs, 2) first appearance ofmicroglia cells, 3) seeding and expanded distribution of microglia cells in thecerebral wall, 4) appearance and expansion of astrocyte populations, 5) seedingof thymus with thymocytes and selection against autoreactive T-cell clones, 6)emergence, seeding, and expansion of Treg populations as well as Th17 cells, 7)emergence and expansion of intraepithelial lymphocytes (IELs) contributing tothe gastrointestine-associated lymphoid tissue (GALT), 8) alteration ofmacrophages and macrophage-related cells in response to collectins(surfactants), 9) maturation of dendritic cells to promote Th1 responses, and10) maturation of innate immune cells in response to neonatal intestinalmicrobiota (information adapted from ref. 29).
While this conceptual framework for ‘‘critical windows’’ emerged for theimmune system and had strong biological plausibility,28 proof of concept wasneeded. Data supporting proof of concept for the existence and significance ofcritical developmental windows of immune vulnerability were obtained viaexamination of the effects of developmental exposure to the heavy metal lead.30
When lead exposure was restricted to different narrow windows of earlydevelopment, different immune alterations were observed in the offspring.Developmentally-restricted exposure to lead produced both quantitatively andqualitatively different adverse immune outcomes in the young. Because similarresults were obtained comparing development windows using two different testspecies,30 the ‘‘critical window’’ of lead exposure appeared to be paramount indetermining what kind of immune alterations would be seen in the offspring.This and other studies indicated that developmental timing is of vitalimportance when it comes to both dose–response sensitivity and the spectrumof toxicant-induced immune alterations that will result.
Age-based comparisons among several chemicals and drugs led to theconclusion that children are more susceptible to immmuntoxicity than areadults.31 This increased susceptibility can take several forms. Lower doses ofchemicals and drugs are likely to produce adverse immune effects following
Immune System Disorders 439

exposure of the young, compared to adults. Additionally, immunotoxicexposures of the young are more likely to produce a broader spectrum ofadverse effects than exposures of adults. The adverse effects of immunotoxicityin the young (i.e., DIT) are more likely to persist than those in the adult.Immunotoxicity following exposure of the young is more likely to appear at amuch later age following some second environmental exposure (or conditions,e.g., stress). The early-life, seemingly innocuous, exposure developmentalprogramming for dysfunction becomes apparent following a later, often adult,environmental exposure. A classic example of this is described where prenatalexposure of mice to disethylstilbesterol (DES) appears to permanently alter thecytokine programming of lymphocytes, which becomes physiologically evidentafter a second low-level adult exposure to DES.32 It is important to recognizethat: 1) some maturational steps are systemic, while others occur only in specificorgans or tissues, and 2) even organ-specific maturational steps may affectimmune status of other tissues later in life. An example of the latter is the abilityof the environmental influences on the immune–gut microbiome interaction inthe neonate to affect the risk of multiple manifestations of allergic diseases inthe child.33,34
This concept of ‘‘critical windows’’ in the young becomes important inestimations of health risk in the absence of age-relevant data. For example, ifonly adult exposure data exist for the immune system, it is not possible to knowwhether environmental exposure might disrupt a key immune maturation eventthat is restricted to early development. This is not a matter of simple dose-sensitivity differences, but rather, it is an issue of whether critical targets arelacking in the adult test system. In effect, it nullifies the utility for the adultexposure test system for non-adults. For this reason, four immunotoxicologistsrecently called for required DIT testing of chemicals and drugs.5
17.3.3 The Scope of Adverse Outcomes Occurring with DIT
As mentioned briefly in the introduction, the historical focus of immunotoxicitytesting had two primary goals: 1) detection of immunosuppression,35 and 2) theidentification chemicals that could serve as sensitizers.36,37 Assays andbiomarkers were designed accordingly and many were intended to serve assurrogates of host resistance challenges (again, where a loss of host defense wasmeasured).38 These were quite effective for their intended purposes, and it wasfound that a small collection of assays were capable of providing reliableindications of chemically-induced immunosuppression in animal models.39
However, the scope of the required detection of adverse immune outcomes,and particularly that associated with early developmental exposures, haschanged dramatically. It is no longer risk of immunosuppression that is thepreeminent concern. Given current disease prevalences, identification of therisk of allergic, autoimmune, and inflammatory diseases is a major priority insafety testing. This shift in safety testing focus was recently discussed in thecontent of immune-based diseases.5 Because of the broader scope of potentiallyproblematic immune alterations that can occur and the disease ramifications,
440 Chapter 17

new approaches are needed to ensure protection of the developing immunesystem.1 To emphasize the range of immune dysfunction-based outcomes thatcan occur from a single toxicant source, Figure 17.1 illustrates the elevatedimmune-inflammatory disease risks reported to be linked with early-lifeexposure to tobacco smoke. The elevated risks of disease run the full gamutof adverse immune outcomes, ranging from elevated risk of infections andcancer to increased risk of allergic, autoimmune and inflammatory diseases.While tobacco smoke contains numerous immunotoxicants, it is still only oneof many sources for environmental insult of the immune system. Among thediseases and conditions characterized by inflammatory misregulation andlinked with early-life exposure to tobacco smoke are: asthma,40 athero-sclerosis,41 atopic dermatitis,42,43 Crohn’s disease,44 dental caries,45 early-onsetchronic obstructive pulmonary disease,46 insulin resistance,47 obesity,48 osteo-porosis,49 pediatric psoriasis,50 rheumatoid arthritis,51 susceptibility to respiratoryinfections,52 and sleep disorders.53
Environmental events that affect immune development and programminghave significant ramifications in later life, and there is increasing appreciationof the potential impact of these exposures across all aspects of immune systemfunction (e.g., both adaptive and innate immunity). Maternal exposures havebeen reported to alter the course of innate immune development in the offspringsuch that the risk of immune imbalances54 and inflammatory disease is
Multiple Adverse Outcomes From a Single Environmental Risk Factor
Environmental Risk Factor
Early-Life Exposure to Tobacco Smoke
Elevated Risk of Disease or Condition
Adverse Immune- Inflammatory Outcomes
Immunosuppression Inflammation Autoimmunity Allergy
Asthma
Atopic Dermatitis
DentalCaries
Respiratory Infections
Sleep Disorders
COPD
Osteoporosis Atherosclerosis
Insulin Resistance
Obesity
Pediatric Psoriasis
Rheumatoid Arthritis
Crohn’sDisease
Figure 17.1 The figure illustrates the multiple immune dysfunctions and/orinflammatory-based health risks associated with early-life exposure totobacco smoke. Immunosuppression (i.e., reduced host resistance) is farfrom the only concern. In fact, improper immune enhancement,including elevated risk of allergic, autoimmune, and inflammatorydiseases, is a significant chronic health concern.
Immune System Disorders 441

increased.55 Figure 17.2 provides examples of innate immune cell immuno-toxicity by chemicals and drugs that result in inappropriate inflammation intissues. It is precisely these types of adverse immune outcomes, particularly inchildren, that can establish a life course of inflammation-driven chronicdiseases.
Feltes et al.56 postulated that prenatal programming establishes the pathwayto aging in adults, in which inflammation plays a major role. Microbes in thegastrointestinal tract and possibly the respiratory tract play a significant role inthe early-life immune programming process.57 This means that environmentalconditions that affect the microbiome can exert a disproportionate influence onimmune programming for risk of adult disease.58 Other groups have shownthat early neonatal exposure can have similar effects in which the developingimmune system is programmed for later dysfunctional responses in the adultwhen the immune system is challenged.59 Several research groups haveattributed the rise in inflammatory-based diseases, including allergic andautoimmune diseases, to suboptimum early-life environmental effects on theprenatal and neonatal immune system.60 Even inappropriately timed immuneactivation can have later life ramifications. For example, prenatal immunechallenges can establish a cascade of metabolic and immune-inflammatoryalterations that contribute to the risk of schizophrenia.61,62
Environmental Chemicals and Drugs and Innate Immune Cell Inflammatory Changes
Alcohol Microglia
Organochlorinepesticides
Lead Testicular macrophages Elevated ROS production
TCDD Neutrophils Improper antiviral responses in the lungconnectedto airway changes
Diesel exhaust Macrophage “foam cells”
in unstable plaques Increased oxidative stress
Ozone Lung macrophages
Increases TLR-4 signaling and airway hyperreactivity
Microglia Increased proinflammatorycytokine production
Hyperinflammation
Microglia Elevated ROS production
Kupffer cells Increased TLR-4 signaling
HexachlorobenzeneSkin macrophages
Granulomatous skin inflammation
Figure 17.2 Environmental chemicals and drugs can produce immunotoxicity inresident innate immune cells in tissues, resulting in inappropriateinflammatory responses and subsequent pathology.(Information adapted from Dietert, 2009a).
442 Chapter 17

Examples of specific chronic diseases and conditions that are connected toimmune-inflammatory dysfunction, have environment determinants, and arethought to have earlier-in-life origins include: Alzheimer’s disease,63 asthma,64
atherosclerosis,65 atopic dermatitis,42 autism,4,66 autoimmune thyroiditis,67
celiac disease,68 chronic kidney disease,69,70 chronic obstructive pulmonarydisease,71 depression,72,73 endometriosis,74 food allergies,75,76 inflammatorybowel disease,44,77 myalgic encephalomyelitis,78 multiple sclerosis,79 psoriasis,80
rheumatoid arthritis,81 schizophrenia,61,62 sleep disorders,53 systemic lupuserythematosus,82 and type 1 diabetes.83,84
17.3.4 Sex-Specific Adverse Outcomes and Diseases
Implications
One of the more recent findings concerning DIT and health risks is that malesand females can differ in the specific adverse outcomes that may occurfollowing an early-life immune insult. In fact, a majority of chemicals and drugsexamined thus far exhibit strong sex-specificity for the nature of the immunealterations that are seen with DIT. It is useful to recognize that if the sameexposure can induce differences in immune alterations between males andfemales, then it is likely to result in sex-specific chronic disease outcomes aswell. For example, exposure of the young to the same dose of an immunot-oxicant might produce an elevated risk of atherosclerosis in males and systemiclupus erythematosus (SLE) in females. Environmental epigenetic programmingalso appears to exhibit sexual dimorphism.85 As a result it is important toconsider the likelihood that early-life immunotoxic exposures will producedifferent outcomes in males vs. females and different elevated risks of specificimmune-dysfunction-based diseases.
Examples of sex-specific adverse immune outcomes have been reported for thefollowing: atrazine,86 lead,87 genistein,88 mercury,89 TCDD,90 and nonylphenol.91
This also translates to differences among sexes for environmentally-influenced immune dysfunction-based diseases. For example, Caesarian(vs. vaginal) delivery has been reported to increase the risk for Crohn’s diseasein boys but not in girls.92 In mice, a neonatal chlamydial respiratory infectionwas reported to differentially alter the immune gene expression pathways ofmales vs. females. An infection-driven Th2 helper bias was observed in adultfemales after the neonatal exposures, but did not occur in infected male mice.93
The existence of sex-specific differences in immunotoxicity in many waysparallels, and may partially explain, observed sex-specific difference in theprevalences of specific inflammatory diseases. For example, autoimmunediseases occur in both sexes, yet for the majority of autoimmune diseases, thereis sexual dimorphism with a strong preponderance of females affectedcompared with males.94,95 This is seen in diseases such as SLE, multiplesclerosis, Hashimoto’s thyroiditis, Sjogren syndrome, and rheumatoidarthritis.96–98 An environmental component has been suggested for a least partof the sex bias that has been observed in autoimmune diseases.99 There are
Immune System Disorders 443
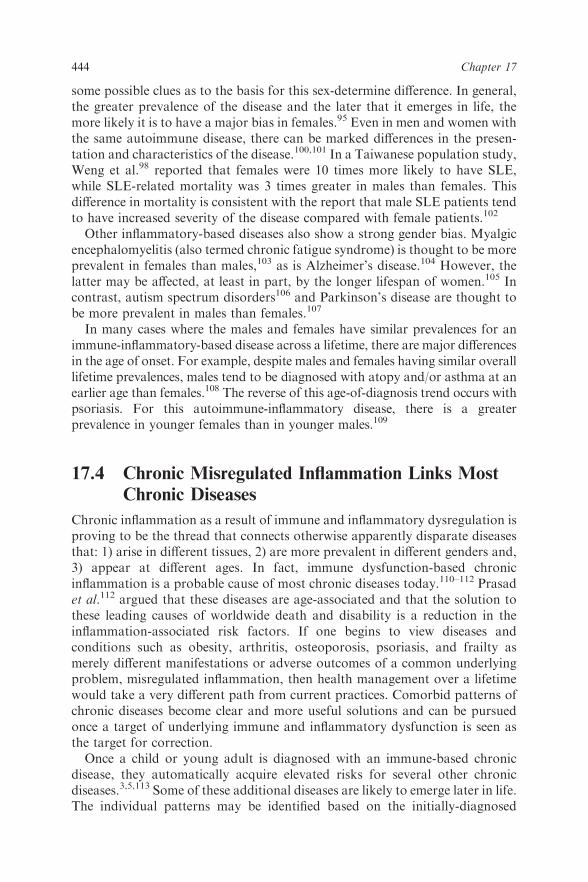
some possible clues as to the basis for this sex-determine difference. In general,the greater prevalence of the disease and the later that it emerges in life, themore likely it is to have a major bias in females.95 Even in men and women withthe same autoimmune disease, there can be marked differences in the presen-tation and characteristics of the disease.100,101 In a Taiwanese population study,Weng et al.98 reported that females were 10 times more likely to have SLE,while SLE-related mortality was 3 times greater in males than females. Thisdifference in mortality is consistent with the report that male SLE patients tendto have increased severity of the disease compared with female patients.102
Other inflammatory-based diseases also show a strong gender bias. Myalgicencephalomyelitis (also termed chronic fatigue syndrome) is thought to be moreprevalent in females than males,103 as is Alzheimer’s disease.104 However, thelatter may be affected, at least in part, by the longer lifespan of women.105 Incontrast, autism spectrum disorders106 and Parkinson’s disease are thought tobe more prevalent in males than females.107
In many cases where the males and females have similar prevalences for animmune-inflammatory-based disease across a lifetime, there are major differencesin the age of onset. For example, despite males and females having similar overalllifetime prevalences, males tend to be diagnosed with atopy and/or asthma at anearlier age than females.108 The reverse of this age-of-diagnosis trend occurs withpsoriasis. For this autoimmune-inflammatory disease, there is a greaterprevalence in younger females than in younger males.109
17.4 Chronic Misregulated Inflammation Links Most
Chronic Diseases
Chronic inflammation as a result of immune and inflammatory dysregulation isproving to be the thread that connects otherwise apparently disparate diseasesthat: 1) arise in different tissues, 2) are more prevalent in different genders and,3) appear at different ages. In fact, immune dysfunction-based chronicinflammation is a probable cause of most chronic diseases today.110–112 Prasadet al.112 argued that these diseases are age-associated and that the solution tothese leading causes of worldwide death and disability is a reduction in theinflammation-associated risk factors. If one begins to view diseases andconditions such as obesity, arthritis, osteoporosis, psoriasis, and frailty asmerely different manifestations or adverse outcomes of a common underlyingproblem, misregulated inflammation, then health management over a lifetimewould take a very different path from current practices. Comorbid patterns ofchronic diseases become clear and more useful solutions and can be pursuedonce a target of underlying immune and inflammatory dysfunction is seen asthe target for correction.
Once a child or young adult is diagnosed with an immune-based chronicdisease, they automatically acquire elevated risks for several other chronicdiseases.3,5,113 Some of these additional diseases are likely to emerge later in life.The individual patterns may be identified based on the initially-diagnosed
444 Chapter 17

disease. For example, childhood asthma might be an entryway disease for anallergy pattern, type 1 diabetes initiates an autoimmune disease pattern,psoriasis initiates an inflammatory disease pattern, schizophrenia beginsan immune activation pattern, and obesity starts a metabolic disease pattern.But in reality, these patterns have major overlaps and intersection points.5
For example, depression and sleep disorders fall at the center of manyinflammatory-based disease patterns because of the specific cytokineimbalances that are associated with the underlying immune dysfunction.Additionally, frailty is an end-stage inflammatory-based condition114 that iscomorbid for numerous other earlier-age-of onset diseases.110,115
Figure 17.3 illustrates the point that chronic diseases have many intersectionsand overlaps. Each childhood- or young adult- initiated disease pattern hasboth unique features as well a common ground in terms of predictable later-onset chronic diseases and conditions. Skin cancer is a predicted elevated laterlife risk of children and young adults with psoriasis. It is not a likely outcomefor cohorts diagnosed with chronic kidney disease or type 1 diabetes. Yet,individuals with all of these conditions are at an elevated risk of inflammation-associated depression.
Lifecourse of Comorbid Chronic Diseases With Increased Aging
Prenatal-Neonatal Immune
Insult Frailty
Childhood asthma
Major depressive disorder
Kawasaki disease
Chronic kidney disease
Cardiovascular disease
Lung cancer Obesity
Osteoporosis
Type 1 diabetes
PediatricCrohn’s disease
Rheumatoidarthritis
Crohn’sdisease
Coloncancer
Psoriasis
Skincancer
Figure 17.3 Early-life immune insult can produce dysfunction that results in one ormore patterns of comorbid, interlinked, chronic diseases or conditions.This figure illustrates the extensive interconnectivity that exists amongseemingly disparate chronic diseases and conditions. These diseases andconditions are all driven by misregulated inflammation.
Immune System Disorders 445

Among the defects that appear common to many chronic diseases is theinability to resolve acute inflammation and, as a result, avoid inappropriatechronic inflammatory insults in the tissues.116 Even low levels of chronicinflammation persisting over decades in tissues can result in loss of organfunction, oxidative damage to cells increasing the risk of cancer in that tissue,and autoimmune reactions to components of the damaged tissue. Moleculesthat can correct this defect and permit acute inflammation to resolve appro-priately offer significant promise as a more potential therapeutic of severalchronic diseases.117–119
17.5 Environmental Triggers of Chronic Diseases
When immune dysfunction and a predisposition for misregulated inflammationis established in the young following environmental insult, there can still be amissing piece that is needed before the onset of many chronic diseases. Thatpiece is a challenge for the immune system, which triggers the dysfunctional andinappropriate response in the tissues. In the case of childhood asthma, that islikely to be a combination of a propensity for IgE production againstinnocuous antigens, mobilization of eosinophils, and inappropriate inflam-matory responses in the lung resulting in airway hyperreactivity and damage.64
What has become clear is that many immune-based chronic diseases arediagnosed shortly after an infection. In the case of asthma, it is usually arespiratory infection. For gastrointestinal tract autoimmune conditions, itcould well be a gastrointestinal infection that serves as a trigger. Dietert3
discusses the role of infections as triggering agents for immune-based chronicdisease. In this case, while the infections are risk factors for the diseases, theyare not causative in the same way as the environmental factors (e.g., toxicants)that cause the underlying immune dysfunction.
17.6 Environmental Risk Factors Including
Environmental Chemicals
The literature contains a number of environmental risk factors for early-lifeimmune programming and elevated risk of chronic disease (reviewed in ref. 1).Different categories include environmental chemicals (e.g., metals, poly-chorinated biphenyls, dioxins, organochlorine pesticides, halogenated aromatichydrocarbons, polyaromatic hydrocarbons, mycotoxins), drugs, diet, variousstressors, infections, and birth delivery mode. Among drugs, examples ofreported developmental immunotoxicants include alcohol,120 antibiotics,121
paracetamol,122 dexamethasone,123 and diethylstilbesterol.124 Prenatal dietaryfactors include minerals,125 vitamins,126 fatty acids,127 and phytoestrogens.128
In addition to external environmental risk factors such as chemicals anddrugs, stress is major contributor to early-life programmed adverse immuneoutcomes.129 This can come in the form of physical-psychological stress,130,131
as well as stress from infectious challenges.132 Additionally, the birth delivery
446 Chapter 17

mode (Caesarian vs. vaginal delivery) plays a major role in the immune statusof the child. It is not yet clear which factors linked with delivery mode mightmediate this immune effect (e.g., use of prophylatic drugs, delivery stress,differences in microbial exposure).
Environmental chemicals represent a prominent category of developmentalimmunotoxicants, many of which produce multiple adverse immune outcomesfollowing early-life exposure.3 The chemicals are not toxic solely to the immunesystem. However, in some cases, the immune system represents one of the moresensitive targets for toxicity. Grandjean and colleagues reported that highintake of marine-based dietary PCBs by pregnant women in the Faroe Islandsincreased the risk of both allergic sensitization133 and suppressed vaccineresponses133,134 in the offspring. Additionally, in mouse studies2,3,7,8-tetrachlorodibenzodioxin (TCDD), a dioxin, appears to disrupt earlyimmune development in several ways, resulting in inappropriate inflammatoryresponses,135 a predisposition for some forms of autoimmunity,136 andsuppression of cell-mediated immunity.137 Based on animal and human studies,developmental exposure to organochlorine pesticides can affect both adaptiveimmune responses,138 as well as innate immune cell function such as inducingthe elevated production of tumor necrosis factor-alpha (TNF-a), a pro-inflammatory cytokine.139 Several studies in mice and humans suggest a role fortrichloroethylene in causing immunosuppression140 and in promoting auto-immunity, as reviewed by Cooper et al.141 Also, from animal and humansstudies, early-life exposure to Pb is able to elevate IgE levels,142 particularly inchildren who are also exposed to cigarette smoke.143 Early-life exposure tobisphenol A appears to promote a Th2 bias.88,144 Perfluorinated compoundsused in various industrial applications have also been reported to be immu-notoxic in rodents and to promote inappropriate inflammation.145
17.7 Summary
Early-life immune insult, also known as developmental immunotoxicity (DIT),is a serious component of current health risks. Environmental risk factorsfor DIT, including environmental chemicals and drugs, can program thedeveloping immune system toward dysfunction, including misregulation ofinflammation. The inability to resolve acute inflammation and resultingongoing chronic inflammation in tissues is a major health threat, and chronicinflammation is a common adverse outcome of DIT. It is also a unifying featureand likely requirement of a majority of chronic diseases and conditions. Malesand females often respond differently to early-life environmental exposures thataffect the immune system. Sex-based differences in DIT have been reported fora significant percentage of immunotoxic chemicals and drugs examined to date,and these can extend to the very nature of the immune alterations that areproduced. The ramifications are that the specific health risks for males vs.females can be markedly different after DIT-inducing environmental exposures.For this reason, sex-based immunotoxicological evaluation and health riskreduction planning is needed.
Immune System Disorders 447

Effective measures to prevent chronic diseases should include: 1) thedetection of DIT that contributes to life-long inflammatory misregulation, and2) the management of chronic diseases to correct underlying immunedysfunction and reduce the risk of additional comorbidities. A focus on earlylife should be a research and safety testing priority given the uniqueness of thecritical developmental windows of immune vulnerability and the chronicdisease burdens that are associated with disruption of immune maturation andearly-life programming for immune dysfunction.
Acknowledgements
The author thanks Janice Dietert, Performance Plus Consulting, for hereditorial assistance.
References
1. R. R. Dietert, J. Immuntoxicol., 2011, 8, 101.2. R. R. Dietert and R. W. Luebke (eds), Immunotoxicity, Immune
Dysfunction, and Chronic Disease, Springer, New York, 2012.3. R. R. Dietert and J. T. Zelikoff, Curr. Pediatr. Rev., 2009, 5, 36.4. R. R. Dietert, J. M. Dietert and J. C. DeWitt, Emerging Health Threats
Journal, 2011, 4, 7111.5. R. R. Dietert, J. C. DeWitt, D. R. Germolec and J. T. Zelikoff, Environ.
Health. Perspect., 2010, 118, 1091.6. D. A. Peterson and R. A. Cardona, Adv. Immunol., 2010, 107, 71.7. N. H. Salzman, Curr. Opin. Microbiol., 2011, 14, 95.8. A. L. Kau, P. P. Aherrn, N. W. Griffin, A. L. Goodman and J. I. Gordon,
Nature, 2011, 474, 327.9. Y. K. Lee, J. S. Menezes, Y. Umesaki and S. K. Mazmanian, Proc. Natl.
Acad. Sci. USA, 2011, 108, 4615.10. D. J. Barker and C. Osmond, Lancet, 1986, 1(8489), 1077.11. D. J. Barker and C. N. Martyn, The maternal and fetal origins of
cardiovascular disease, J. Epidemiol. Community Health, 1992, 46, 8.12. D. J. Barker, J. Intern. Med., 2007, 261, 412.13. D. J. Barker, Brit. Med. Bull., 1997, 53, 96.14. E. J. Tokar, W. Qu and M. P. Waalkes, Arsenic, stem cells, and the
developmental basis of adult cancer, Toxicol. Sci, 2011, 120(Suppl 1), S192.15. D. I. Phillips and S. G. Matthews, World J. Diabetes, 2011, 2, 211.16. L. Harvey, T. H. Burne, J. J. McGrath and D. W. Eyles, J. Steroid
Biochem. Mol. Biol., 2010, 121, 239.17. S. Darney, B. Fowler, P. Grandjean, J. Heindel, D. Mattison and
W. Slikker Jr., Reprod. Toxicol., 2011, 31, 271.18. X. Zhang, J. H. Sliwowska and J. Weinberg, Exp. Biol. Med. (Maywood),
2005, 230, 376.19. S. Bezek, E. Ujhazy, M. Mach, J. Navarova and M. Dubovicky, Inter-
discip. Toxicol, 2008, 1, 29.
448 Chapter 17

20. M. Vahter, Basic Clin. Pharmacol. Toxicol., 2008, 102, 204.21. M. I. Luster, R. R. Dietert, D. R. Germolec, R. W. Luebke, and S. L.
Makris in Encyclopedia of Children Health, ed., J. O. Nriagu, Elsevier,Oxford, 2011, pp. 44–50; Developmental immuntoxicants, pp. 44–50.In [ed.], J. O. Nriagu, Encyclopedia of Children Health. ISBN:978-0-444-52272-6.
22. K. S. Landreth, Hum. Exp. Toxicol., 2002, 21, 493.23. M. P. Holsapple, L. J. West and K. S. Landreth, Birth Defects Res. B Dev.
Reprod. Toxicol., 2003, 68, 321.24. J. B. Barnett, Environ. Toxicol. Pharmacol., 1997, 4, 315.25. T. E. Miller, K. A. Golemboski, R. S. Ha, T. Bunn, F. S. Sanders and
R. R. Dietert, Toxicol. Sci., 1998, 42, 129.26. S. E. Moore, Proc. Nutr. Soc., 1998, 57, 241.27. S. D. Holladay and R. J. Smialowicz, Environ. Health. Perspect., 2000,
108(Suppl 3), 463.28. R. R. Dietert, R. A. Etzel, D. Chen, M. Halonen, S. D. Holladay,
A. M. Jarabek, K. Landreth, D. B. Peden, K. Pinkerton, R. J. Smialowiczand T. Zoetis, Environ. Health. Perspect., 2000, 108(Suppl 3), 483.
29. R. R. Dietert and J. M. Dietert, J. Toxicol. Environ. Health B Crit. Rev.,2008, 11, 660.
30. T. L. Bunn, P. J. Parsons, E. Kao and R. R. Dietert, J. Toxicol. Environ.Health A, 2001, 64, 223.
31. R. W. Luebke, D. H. Chen, R. Dietert, Y. Yang, M. King, M. I. Lusterand Immunotoxicology Workgroup, J. Toxicol. Environ. Health B Crit.Rev., 2006, 9, 1.
32. E. Karpuzoglu-Sahin, Y. Zhi-Jun, A. Lengi, N. Sriranganathan andS. Ansar Ahmed, Effects of long-term estrogen treatment on IFN-gamma,IL-2 and IL-4 gene expression and protein synthesis in spleen and thymusof normal C57BL/6 mice, Cytokine, 2001, 14, 208.
33. N. P. Ly, A. Litonjua, D. R. Gold and J. C. Celedon, J. Allergy Clin.Immunol., 2011, 127, 1087.
34. R. M. McLoughlin and K. H. Mills, J. Allergy Clin. Immunol., 2011,127, 1097.
35. M. I. Luster, C. Portier, D. G. Pait and D. R. Germolec, Toxicology,1994, 92, 229.
36. I. Kimber, G. F. Gerberick, H. Van Loveren and R. V. House, Fundam.Appl. Toxicol., 1992, 19, 479.
37. G. F. Gerberick, R. V. House, E. R. Fletcher and C. A. Ryan, Fundam.Appl. Toxico.l, 1992, 19, 438.
38. M. I. Luster, C. Portier, D. G. Pait, G. J. Rosenthal, D. R. Germolec,E. Corsini, B. L. Blaylock, P. Pollock, Y. Kouchi, W. Craig, K. L. White,A. Munson and C. H. Comment, Fundam. Appl. Toxicol., 1993, 21, 71.
39. M. I. Luster, C. Portier, D. G. Pait, K. L. White, C. Jennings, A. E. Munsenand G. J. Rosenthal, Fund. Appl. Toxicol., 1992, 18, 200.
40. M. Kanoh, Y. Kaneita, M. Hara, S. Harada, Y. Gon, H. Kanamaru andT. Ohida, Prev Med, 2012, 54, 94.
Immune System Disorders 449

41. C. C. Geerts, M. L. Bots, D. E. Grobbee and C. S. Uiterwaal, Arterioscler.Thromb. Vasc. Biol., 2008, 28, 2296.
42. I. J. Wang, W. S. Hsieh, K. Y. Wu, Y. L. Guo, Y. H. Hwang, S. H. Jeeand P. C. Chen, Pediatr. Allergy Immunol., 2008, 19, 580.
43. D. Hinz, M. Bauer, S. Roder, S. Olek, J. Huehn, U. Sack, M. Borte,J. C. Simon, I. Lehmann and G. Herberth for the LINA study group,Allergy, 2012, 67, 380.
44. S. E. Roberts, C. J. Wotton, J. G. Williams, M. Griffith andM. J. Goldacre, World J. Gastroenterol., 2011, 17, 743.
45. K. Tanaka, Y. Miyake, M. Arakawa, S. Sasaki and Y. Ohya, BMC PublicHealth, 2010, 10, 335.
46. M. G. Foreman, L. Zhang, J. Murphy, N. N. Hansel, B. Make,J. E. Hokanson, G. Washko, E. A. Regan, J. D. Crapo, E. K. Silverman,D. L. DeMeo and COPD Gene Investigators, Am. J. Respir. Crit. CareMed., 2011, 184, 414.
47. E. Thiering, I. Bruske, J. Kratzsch, J. Thiery, S. Sausenthaler, C. Meisinger,S. Koletzko, C. P. Bauer, B. Schaaf, A. von Berg, D. Berdel, I. Lehmann,O. Herbarth, U. Kramer, H. E. Wichmann, J. Heinrich and GINIplus andLISAplus Study Groups, Int. J. Hyg. Environ. Health,, 2011, 214, 361.
48. E. Raum, J. Kupper-Nybelen, A. Lamerz, J. Hebebrand,B. Herpertz-Dahlmann and H. Brenner, Obesity (Silver Spring), 2011,19, 2411.
49. M. K. Javaid and C. Cooper, Best Pract. Res. Clin. Endocrinol. Metab,2002, 16, 349.
50. M. G. Ozden, N. S. Tekin, M. A. Gurer, D. Akdemir, C. Dogramacı,S. Utas- , A. Akman, S. E. Evans, S. Bahadır, S. Ozturkcan, G. Ikizoglu,N. Sendur, O. Kose, Y. Bek, S. Yaylı, T. Canturk and A. Y. Turanl,Pediatr. Dermatol., 2011, 28, 306.
51. A. N. Colebatch and C. J. Edwards, Clin. Exp. Immunol., 2011, 163, 11.52. L. L. Jones, A. Hashim, T. McKeever, D. G. Cook, J. Britton and
J. Leonardi-Bee, Respir. Res., 2011, 12, 5.53. K. Yolton, Y. Xu, J. Khoury, P. Succop, B. Lanphear, D. W. Beebe and
J. Owens, Associations between secondhand smoke exposure and sleeppatterns in children, Pediatrics, 2010, 125, e261.
54. T. H. Nesterenko and H. Aly, Am. J. Perinatol., 2009, 26, 191.55. N. A. Hodyl, M. J. Stark, A. Osei-Kumah and V. L. Clifton, Expert. Rev.
Clin. Immunol., 2011, 7, 579.56. B. C. Feltes, J. de Faria Poloni and D. Bonatto, Biogerontology, 2011,
12, 293.57. J. L. Kaplan, H. N. Shi and W. A. Walker, Pediatr. Res., 2011, 69, 465.58. T. M. Marques, R. Wall, R. P. Ross, G. F. Fitzgerald, C. A. Ryan and
C. Stanton, Curr. Opin. Biotechnol., 2010, 21, 149.59. S. J. Spencer, M. A. Galic and Q. J. Pittman, Am. J. Physiol. Endocrinol.
Metab., 2011, 300, E11.60. J. G. Lisciandro and A. H. van den Biggelaar, Clin. Exp. Allergy, 2010,
40, 1719.
450 Chapter 17

61. U. Meyer, Prog Neuropsychopharmacol Biol Psychiatr, 2011, Nov 15,[Epub ahead of print] http://dx.doi.org/101016/j.pnpbp.2011.11.003.
62. G. Pacheco-Lopez, S. Giovanoli, W. Langhans and U. Meyer, SchizophrBull, 2011, Dec 19. [Epub ahead of print] PMID: 22186136.
63. D. E. Barnes and S. J. Lee, Alzheimers Res. Ther., 2011, 3, 33.64. R. R. Dietert, Reproduct. Toxicol., 2011b, 32, 198.65. W. Palinski, T. Yamashita, S. Freigang and C. Napoli, Nutr. Rev., 2007,
65, S182.66. C. Onore C, M. Careaga and P. Ashwood, Brain Behav. Immun., 2012,
26, 383.67. G. E. Krassas, K. Tziomalos, N. Pontikides, H. Lewy and Z. Laron, Eur.
J. Endocrinol., 2007, 156, 631.68. E. Decker, G. Engelmann, A. Findeisen, P. Gerner, M. Laass, D. Ney,
C. Posovszky, L. Hoy and M. W. Hornef, Pediatrics, 2010, 125, e1433.69. V. M. Vehaskari, Curr. Opin. Pediatr., 2010, 22, 176.70. A. Shankar, L. Sun, B. E. Klein, K. E. Lee, P. Muntner, F. J. Nieto,
M. Y. Tsai, K. J. Cruickshanks, C. R. Schubert, P. C. Brazy, J. Coreshand R. Klein, Kidney Int., 2011, 80, 1231.
71. A. Bush, COPD, 2008, 5, 53.72. R. Dantzer, Biol. Psychiatry, 2012, 71, 4.73. D. K. Kinney and M. Tanaka, J. Nerv. Ment. Dis., 2009, 197, 561.74. M. Umezawa, C. Sakata, N. Tanaka, M. Tabata, K. Takeda, T. Ihara and
M. Sugamata, J. Toxicol. Sci., 2011, 36, 493.75. P. Grandjean, L. K. Poulsen, C. Heilmann, U. Steuerwald and P. Weihe,
Environ. Health Perspect., 2010, 118, 1429.76. A. Misak, Proc. Nutr. Soc., 2011, 70, 465.77. H. Renz, P. Brandtzaeg and M. Hornef, Nat. Rev. Immunol., 2012, 12, 9.78. C. Heim, U. M. Nater, E. Maloney, R. Boneva, J. F. Jones and
W. C. Reeves, Arch. Gen. Psychiatry, 2009, 66, 72.79. D. A. Fernandes de Abreu, V. Landel and F. Feron, J. Neurol. Sci., 2011,
311, 64.80. A. R. Setty, G. Curhan and H. K. Choi, Am. J. Med., 2007, 120, 953.81. J. J. Jaakkola and M. Gissler, J. Epidemiol., 2005, 34, 664.82. C. J. Edwards, H. Syddall, R. Goswami, P. Goswami, E. M. Dennison
and C. Cooper, Lupus, 2006, 15, 213.83. M. A. D’Angeli, E. Merzon, L. F. Valbuena, D. Tirschwell, C. A. Paris
and B. A., Arch. Pediatr. Adolesc. Med., 2010, 164, 732.84. J. Virk, J. Li, M. Vestergaard, C. Obel, M. Lu and J. Olsen, PLoS One,
2010, 5, e11523.85. A. Gabory, L. Attig and C. Junien, Mol. Cell. Endocrinol., 2009, 304, 8.86. A. A. Rooney, R. A. Matulka and R. W. Luebke RW, Toxicol. Sci., 2003,
76, 366.87. T. L. Bunn, P. J. Parsons, E. Kao andR. R. Dietert,Toxicol. Sci., 2001, 64, 57.88. H. Guo, T. Liu, Y. Uemura, S. Jiao, D. Wang, Z. Lin, Y. Narita, M. Suzuki,
N. Hirosawa, Y. Ichihara, O. Ishihara, H. Kikuchi, Y. Sakamoto, S. Senju,Q. Zhang and F. Ling, Cell Mol. Immunol., 2010, 7, 227.
Immune System Disorders 451

89. I. A. Silva, M. El Nabawi, D. Hoover and E. K. Silbergeld, Dev. Comp.Immunol., 2005, 29, 171.
90. B. C. Gehrs and R. J. Smialowicz, Toxicology, 1999, 134, 79.91. N. A. Karrow, T. L. Guo, K. B. Delclos, R. R. Newbold, C. Weis,
D. R. Germolec, K. L. White Jr. and J. A. McCay JA., Toxicology, 2004,196, 237.
92. P. Malmborg, S. Bahmanyar, L. Grahnquist, H. Hildebrand andS. Montgomery, Cesarean section and the risk of pediatric Crohn’sdisease, Inflamm. Bowel Dis., 2011, Apr 27. doi: 10.1002/ibd.21741.
93. O. Wynne, J. C. Horvat, A. Osei-Kumah, R. Smith, P. M. Hansbro,V. L. Clifton and D. M. Hodgson, Stress, 2011, 14, 247.
94. P. A. McCombe, J. M. Greer and I. R. Mackay, Curr. Mol. Med., 2009,9, 1058.
95. O. L. Quintero, M. J. Amador-Patarroyo, G. Montoya-Ortiz,A. Rojas-Villarraga and J. M. Anaya, J. Autoimmun., 2012, 38, 109.
96. R. Voskuhl., Biology of Sex Differences, 2011, 2, 1.97. J. Sellner, J. Kraus, A. Awad, R. Milo, B. Hemmer and O. Stuve,
Autoimmun. Rev., 2011, 10, 495.98. M. Y. Weng, Y. T. Huang, M. F. Liu and T. H. Lu, J. Rheumatol., 2011,
38, 706.99. K. M. Pollard, J. Autoimmun., 2012, 38, J177.
100. U. Nussinovitch and Y. Shoenfeld Y., Autoimmun Rev, 2012, 11, A377.101. M. M. Schoonheim, H. E. Hulst, S. Landi, O. Ciccarelli,
S. D. Roosendaal, E. J. Sanz-Arigita, H. Vrenken, C. H. Polman,C. J. Stam, F. Barkhof and J. J. Geurts, Mult Scler, 2012, 18, 164.
102. K. L. Crosslin and K. L. Wiginton, Gend. Med, 2011, 8, 365.103. B. Evengard, A. Jacks, N. L. Pedersen and P. F. Sullivan, Psychol. Med.,
2005, 35, 1317.104. M. Musicco, Funct. Neurol., 2009, 24, 89.105. L. E. Hebert, P. A. Scherr, J. J. McCann, L. A. Beckett and D. A. Evans,
Am. J. Epidemiol., 2001, 153, 132.106. Centers for Disease Control and Prevention, MMWR Surveill. Summ.,
2009, 58, 1.107. G. F. Wooten, L. J. Currie, V. E. Bovbjerg, J. K. Lee and J. Patrie,
J. Neurol. Neurosurg. Psychiatry, 2004, 75, 637.108. A. J. Lowe, J. B. Carlin, C. M. Bennett, C. S. Hosking, M. J. Abramson,
D. J. Hill and S. C. Dharmage, J. Allergy Clin. Immunol., 2008, 121, 1190.109. J. M. Gelfand, R. Weinstein, S. B. Porter, A. L. Neimann, J. A. Berlin and
D. J. Margolis, Arch. Dermatol., 2005, 141, 1537.110. I. Manabe, Circ. J., 2011, 75, 2739.111. R. R. Dietert, J. C. DeWitt and R. W. Luebke in Immunotoxicity, Immune
Dysfunction, and Chronic Disease, eds. R. R. Dietert and R. W. Luebke,Springer, New York, 2012, pp. 419–440.
112. S. Prasad, B. Sung and B .B. Aggarwal, Prev. Med., 2012, 54, S29.113. R. R. Dietert and J. T. Zelikoff, World J. Pediatr., 2010, 6, 111.114. X. Yao, H. Li and S. X. Leng, Clin. Geriatr. Med., 2011, 27, 79–87.
452 Chapter 17

115. S. S. Chang, C. O. Weiss, Q. F. Xue and L. P. Fried, Arch. Gerontol.Geriatr., 2012, 54, 9.
116. C. N. Serhan, J. Thromb. Haemost., 2009, 7(Suppl 1), 44.117. G. Bannenberg and C. N. Serhan, Biochim. Biophys. Acta., 2010,
1801, 1260.118. T. Ishida, M. Yoshida, M. Arita, Y. Nishitani, S. Nishiumi, A. Masuda,
S.Mizuno, T. Takagawa, Y.Morita, H. Kutsumi, H. Inokuchi, C. N. Serhan,R. S. Blumberg and T. Azuma, Inflamm. Bowel Dis., 2010, 16, 87.
119. M. Spite and C. N. Serhan, Circ. Res., 2010, 107, 1170.120. F. Sozo, L. O’Day, G. Maritz, K. Kenna, V. Stacy, N. Brew, D. Walker,
A. Bocking, J. Brien and R. Harding, Am. J. Physiol. Lung Cell. Mol.Physiol, 2009, 296, L510.
121. M. B. Azad and A. L. Kozyrskyj, Clin. Dev. Immunol., 2012, 2012, 9.Article ID 932072, doi: 10.1155/2012/9320720.
122. S. O. Shaheen, R. B. Newson, G. D. Smith and A. J. Henderson, Int.J. Epidemiol., 2010, 39, 790.
123. S. Roque, T. G. Oliveira, C. Nobrega, P. Barreira-Silva, C. Nunes-Alves,N. Sousa, J. A. Palha and M. Correia-Neves, Front. Behav. Neurosci.,2011, 5, 4.
124. N. Brown, M. Nagarkatti and P. S. Nagarkatti, Toxicol. Appl.Pharmacol., 2006, 212, 119.
125. M. T. Sharkar, M. Y. Jou, M. B. Hossain, B. Lonnerdal, C. B. Stephensenand R. Raqib, J. Nutr., 2011, 141, 1559.
126. A. A. Ginde, J. M. Mansbach and C. A. Camargo Jr., Curr. AllergyAsthma Rep., 2009, 9, 81.
127. L. S. Kremmyda, M. Vlachava, P. S. Noakes, N. D. Diaper, E. A. Milesand P. C. Calder, Clin. Rev. Allergy Immunol., 2011, 41, 36.
128. T. L. Guo, K. L. White Jr., R. D. Brown, K. B. Delclos, R. R. Newbold,C. Weis, D. R. Germolec and J. A. McCay, Toxicol. Appl. Pharmacol.,2002, 181, 219.
129. E. Merlot, D. Couret and W. Otten, Brain. Behav. Immun., 2008, 22, 42.130. M. Von Korff, J. Alonso, J. Ormel, M. Angermeyer, R. Bruffaerts,
C. Fleiz, G. de Girolamo, R. C. Kessler, V. Kovess-Masfety,J. Posada-Villa, K. M. Scott and H. Uda, Pain, 2009, 143, 76–83.
131. N. M. Nielsen, A. V. Hansen, J. Simonsen and A. Hviid, Am.J. Epidemiol., 2011, 173, 990.
132. C. S. Algert, J. R. Bowen, S. L. Lain, H. D. Allen, J. M. Vivian-Taylorand C.L. Roberts, Pediatr. Allergy Immunol., 2011, 22, 836.
133. C. Heilmann, E. Budtz-Jørgensen, F. Nielsen, B. Heinzow, P. Weihe andP. Grandjean, Environ. Health Perspect., 2010, 118, 1434.
134. C. Heilmann, P. Grandjean, P. Weihe, F. Nielsen andE. Budtz-Jørgensen, PLoS Med, 2006, 3, e311.
135. J. P. Hogaboam, A. J. Moore and B. P. Lawrence, Toxicol. Sci., 2008,102, 160.
136. A. Mustafa, S. D. Holladay, S. Witonsky, D. P. Sponenberg,E. Karpuzoglu and R. M. Gogal Jr., Toxicology, 2011, 290, 157.
Immune System Disorders 453

137. B. C. Gehrs, M. M. Riddle, W. C. Williams and R. J. Smialowicz,Toxicology, 1997, 122, 229.
138. K. L. White Jr., D. R. Germolec, C. D. Booker, D. M. Hernendez,J. A. McCay, K. B. Delclos, R. R. Newbold, C. Weis and T. L. Guo,Toxicology, 2005, 207, 271.
139. M. F. Schaalan, S. M. Abdelraouf, W. A. Mohamed and F. S. Hassanein,J Immunotoxicol., 2012, 9, 15.
140. M. M. Peden-Adams, J. G. Eudaly, L. M. Heesemann, J. Smythe,J. Miller, G. S. Gilkeson and D. E. Keil, J. Environ. Sci. Health. A Tox.Hazard Subst. Environ. Eng., 2006, 41, 249.
141. G. S. Cooper, S. L. Makris, P. J. Nietert and J. Jinot, Environ. HealthPerspect., 2009, 117, 696.
142. J. E. Snyder, N. M. Filipov, P. J. Parsons and D. A. Lawrence, Toxicol.Sci., 2000, 57, 87.
143. P. M. Lutz, E. A. Kelty, T. D. Brown, T. J. Wilson, G. Brock andR. E. Neal, Toxicology, 2012, 291, 43.
144. H. Yan, M. Takamoto and K. Suganem, Environ. Health Perspect., 2008,116, 514.
145. J. C. Dewitt, M. M. Peden-Adams, J. M. Keller and D. R. Germolec,Toxicol. Pathol., 2012, 40, 300.
454 Chapter 17

CHAPTER 18
Aging and Vulnerability toAmbient Air Pollution
MORTON LIPPMANN
New York University School of Medicine, Nelson Institute of EnvironmentalMedicine, 57 Old Forge Road, Tuxedo, NY, USA 10987E-mail: [email protected]
18.1 Background
We have had solid quantitative evidence of the role of age in the vulnerability toadverse effects of ambient air pollution since the publication of the InterimReport of the Committee on Air Pollution1 on the December 1952 ‘‘killer fog’’in London, England. As shown in Table 18.1, the number of deaths in GreaterLondon in the four weeks following the killer fog episode was much higher thanthat of the four weeks that preceded it, with the relative risks (RRs) beinghighest for bronchitis (6.7), influenza (5.1), other respiratory (4.0), andpneumonia (3.5). It should also be noted that while the RRs were greatest forpulmonary endpoints, the numbers of excess deaths were greatest for heartdisease. Table 18.2 shows the deaths for this period by age range, with the RRbeing about 2 for those older than 65. An RR of 2 was also seen for childrenbetween 1 month and 1 year of age. Lung capacity is growing very rapidly in thefirst year of life and is dropping markedly, especially for smokers, in the lastdecades, and greater RRs attributable to the added stress to health and survivalfor vulnerable individuals resulting from inhaling the dirty air could have beenanticipated.
Issues in Toxicology No. 16
Aging and Vulnerability to Environmental Chemicals: Age-related Disorders and their Origins in
Environmental Exposures
Edited by Bernard Weiss
r The Royal Society of Chemistry 2013
Published by the Royal Society of Chemistry, www.rsc.org
455

Table 18.1 Greater London Deaths Divided According to Cause – Nov. andDec. 1952.
Cause
Av. Numberof deaths inweeks ending8th, 15th,22nd, 29thNov.
Number of deaths registeredin week ending
For weeksending 6th,13th, 20th, 27thDec.
6thDec.
13thDec.
20thDec.
27thDec.
Av. No.of deaths RR
PulmonaryTuberculosis
17 14 77 37 21 37.25 2.19
Lung Cancer 34 45 69 32 36 45.50 1.34Heart Disease 226 273 707 389 272 410.25 1.82High BloodPressure
14 19 47 36 21 30.75 2.20
Other Circulatory 22 26 46 31 32 33.75 1.53Influenza 2 2 24 9 6 10.25 5.13Pneumonia 31 45 168 125 91 107.25 3.46Bronchitis 51 76 704 396 184 340.00 6.67Other Respiratory 6 9 52 21 13 23.75 3.96Ill-defined Causes 20 25 79 35 37 36.50 1.83All Other Causes 340 411 511 412 316 412.50 1.21
All causes 763 945 2,484 1,523 1,029 1,495 1.96
From: Comm. on Air Pollution: Interim Report, Cmd 9011, London. H.M. Stationery Office(Dec. 1953).
Table 18.2 Greater London Deaths Divided According to Age – Nov. andDec. 1952.
Dec. Age
Av. Numberof deaths inweeks ending8th, 15th,22nd, 29thNov.
Number of deaths registered inweek ending
For weeks ending6th, 13th, 20th,27th
6thDec.
13thDec.
20thDec.
27thDec.
Av. No.of deaths RR
Weeks:0–4 20 16 28 19 12 18.75 0.944–52 8 12 26 15 11 16.00 2.00
Years:1–4 7 6 7 13 7 8.25 1.185–14 4 4 6 6 2 4.50 1.1815–24 7 9 7 14 7 9.25 1.3225–34 11 16 28 17 11 18.00 1.6435–44 26 36 64 29 34 40.75 1.5745–54 70 80 204 96 83 115.75 1.6555–64 133 157 448 251 167 255.75 1.9265–74 211 254 717 444 258 418.25 1.9875 and over 266 355 949 619 437 590.00 2.22
All ages 763 945 2,484 1,523 1,029 1,495.00 1.96
From: Comm. on Air Pollution: Interim Report, Cmd 9011, London, H.M. Stationery Office(Dec. 1953).
456 Chapter 18

The only air quality indices being measured in London in that era were BlackSmoke (BS), as measured by light reflectance of the blackish particles collectedon a filter, and the acidity in a water-filled bubbler flask that collected bothwater-soluble gases and particles. The BS readings were expressed in mg m�3,based on gravimetric laboratory calibrations. The acidity was expressed as theconcentration of sulfur dioxide (SO2) in mg m�3. The peak day BS concen-trations exceeded the calibration range limit of B2 mg m�3, and the visualrange was so limited that all surface traffic had to cease. At lower BSconcentrations, the excess daily mortality in London for the winter of1958–1959 varied in an almost linear fashion,2 as illustrated in Figure 18.1.
Contemporary concentrations of particulate matter (PM) suspended inthe outdoor air are based on gravimetric measurements on filter discs, andpeak levels are typically about two orders of magnitude lower than those ofthe 1952 killer smog episode. However, as discussed later in this chapter, westill have statistically significant excesses of daily mortality associated withPM mass concentrations, and still have the greatest RRs for mortality in theelderly.
We have also seen substantial declines of long-term or cumulative exposuresto ambient air PM in the UK and the US since the end of World War II, whichhas resulted in much lower rates of annual mortality and the burdens of chronicdiseases. Table 18.3 illustrates the declines in chronic bronchitis and respiratorytract cancer mortality rates in 64 UK county boroughs as the UK Clean AirAct was implemented.3 As shown later in this chapter, contemporary studiesstill show significant associations of annual mortality from lung cancer andfrom cardiac and respiratory causes with PM concentrations, albeit at muchlower rates.
BS (µg/m3), 24hr. Average
( ) Indicates number of days during the winter with concentrations in the range surrounding the point–20
0
+20
+40
12008004000
(6)
(12)(18)
(19)
(9)
(6)
(7)
(10)
(5)D
aily
Mor
talit
y
Figure 18.1 Martin and Bradley (1960) data for winter of 1958–1959 in London,as summarized by Ware et al. (1981), showing average deviations ofdaily mortality from 15-day moving average by concentration ofblack smoke.
Aging and Vulnerability to Ambient Air Pollution 457

18.2 Introduction to Contemporary Ambient Air
Pollution and its Health Effects
Ambient air pollution, i.e., the gaseous pollutants, such as ozone (O3), nitrogendioxide (NO2), SO2, and carbon monoxide (CO), and PM suspended in theoutdoor air, are well-established risk factors affecting public health in terms ofexcess mortality, morbidity, and function. The risks are highly variable amongpollutants due to their differing physical and chemical properties. They are alsohighly variable within the members of populations due to: 1) substantialvariations in pollutant concentrations in the outdoor air; 2) attenuation inconcentration of the concentrations in indoor microenvironments where mostpeople spend most of their time; 3) respiratory rates and air volumes inhaled;4) fractional depositions within respiratory tract regions (upper respiratorytract, tracheobronchial airways, and gas exchange region) that depend onparticle size distributions and solubility; 5) retention at deposition sites and/ortranslocation via surface transport or within blood to other organs; 6) chemicaltransformations within the airways, at deposition sites, along translocationpathways, and within other organ systems; and 7) factors affecting inter-individual vulnerability.
18.2.1 Vulnerability
Health-related responses to ambient air pollutants depend greatly on inter-individual differences within a population that determine whether they respond
Table 18.3 Standardized annual mortality rate regression coefficients onsmokea for 64 UK county boroughs.
Sex Ages Mortality inCancer of Trachea,Bronchus & Lung
ChronicBronchitis
Males 45–64 1969–1973 0.07 0.021958–1964 0.53b 0.32a
1948–1954 0.71c 0.48c
65–74 1969–1973 0.15 � 0.061958–1964 0.68c 0.311948–1954 0.87c 0.37a
Females 45–64 1969–1973 � 0.02 � 0.021958–1964 � 0.64b 0.33a
1948–1954 0.49a 0.49b
65–74 1969–1973 0.07 0.031958–1964 0.25 0.40a
1948–1954 0.61b 0.31
aBased on index of black smoke pollution 20 years before death (Br. J. Prev. Soc. Med., 1959, 13,14–27).bpo0.05.cpo0.01.dpo0.001.Source: Adapted from Ref. 3.
458 Chapter 18

and the extent of their responses, i.e., their vulnerability. The major factorsaffecting an individual’s vulnerability to the adverse effects of inhaled ambientair pollutants include: 1) age; 2) genetic predispositions; 3) prior epigeneticchanges resulting from earlier lifetime exposures to ambient air pollutants,indoor air pollutants, and other toxicants: 4) pre-existing diseases; 5) smokinghistory; 6) occupational exposures; 7) prenatal exposures; 8) nutritional defi-ciencies. This chapter is focused on age as a determinant of vulnerability, andthe other factors enumerated above will be cited as they influence the effectsof age.
18.2.2 Age
Health risks associated with ambient air pollution vary with age, with atendency to decrease during childhood, and to increase with age in our last fewdecades. Parental exposures, and especially maternal exposures, to ambient airpollutants and cigarette smoke components and their metabolites affect fetusesin utero and early childhood development in ways that can predispose the fetusand young child to health risks later in life. In young children, the lungs are notyet fully developed and they therefore differ from those of adults in terms of thedeposition and retention of inhaled pollutants. Also, infants and youngchildren have much higher ratios of inhaled volumes to body size than adults,even when at rest, and still further increases when they are in motion withassociated increases in their ventilation rates and volumes.
Lung volumes reach their peaks in our third decade, and ventilatory capacitybegins an accelerating rate of decline in our fourth decade. The rate of decline ispredictive of premature mortality, and is much greater in smokers and workerswith emphysema than in healthy nonsmokers.
18.2.3 Ambient Air Pollutants
The literature on the effects of age on human responsiveness to exposures toambient air pollutants is largely limited to pollutants that have been regulatedbecause of widespread exposures and the extent of their public health impacts,i.e., the criteria pollutants having National Ambient Air Quality Standards(NAAQS).4 There are currently six criteria pollutants, which are expressed interms of mass concentrations. In addition to PM, which covers all solid andliquid particles irrespective of chemical composition, there are NAAQS forphotochemical oxidants, expressed as the concentrations of CO and O3;nitrogen oxides, expressed as the concentration of NO2; sulfur oxides,expressed as the concentration of SO2; and lead (Pb) in terms of the metal andall of its compounds. Of these, there is extensive literature on variation invulnerability by age only for PM, O3, CO, and Pb. The gaseous pollutants arespecific molecules. Pb and PM can be present in varying particle sizedistributions. PM includes a vast array of chemicals, ranging from mineraldusts, soot, pollens, and other biological particles emitted as primary particles,to a broad range of secondary PM composed of inorganic and organic
Aging and Vulnerability to Ambient Air Pollution 459

chemicals that are condensed from vapors or formed in the ambient air bychemical reactions.
The current PMNAAQS are specified in terms of mass concentrations withintwo particle size ranges, those less than 10 mm in aerodynamic diameter (PM10)and those below 2.5 mm in aerodynamic diameter (PM2.5). PM10 excludesparticles larger than 10 mm on the basis that they do not penetrate beyond thelarynx to deposit in the lungs. The distinction at 2.5 mm is based on thedifferences in particle composition, with most of the larger particles beingmechanically generated, irregular in shape, and alkaline, while the smallerparticles are carbonaceous and/or acidic. Furthermore, most of the mass ofPM10 particles deposit within the lung conductive airways within the thorax,while the smaller (fine) particles penetrate the conductive airways and depositwithin the gas exchange region, where they have greater access to thebloodstream.5
18.2.4 Human Responses to Ambient Air Pollutants
The known population-based human responses to inhaled pollutants have beenlargely limited to the pulmonary, cardiovascular, and nervous systems, anddescribed in terms of premature mortality, excess hospital and/or emergencyroom admissions, and loss of functional capacity. Short-term human responsesof limited numbers of volunteer subjects undergoing controlled, short-termlaboratory exposures have provided data on acute functional responses,symptoms, and biomarkers. In addition, there have been studies of short-termfunctional responses in field studies of volunteers engaged in normalrecreational outdoor exercise. Long-term and cumulative exposures have beenassociated with lifespan shortening and the prevalence of chronic diseases andfunctional losses.
Pulmonary responses in humans have most often been associated withexposures to O3, SO2, and PM10. Cardiovascular responses have most oftenbeen associated with exposures to PM10, CO, and Pb. Nervous systemresponses have most often been associated with exposures to Pb. These andsome other responses are described and discussed in greater detail for criteriaair pollutants in the next section.
18.3 Health-Related Effects of Ambient Air Pollutants
18.3.1 Ozone
O3 is an especially strong oxidant, but is relatively low in terms of aqueoussolubility. Thus it is poorly taken up in passage through the upper respiratorytract or the mucus lining the larger tracheobronchial airways. Much of itpenetrates to the gas exchange region of the lungs, where the mucus barrier ispatchy or absent, and where it reacts with lung surfactant and with bronchiolarand alveolar epithelial cells.6
460 Chapter 18

18.3.1.1 Short-Term Effects on Respiratory Function
Even at atmospheric concentrations that conform to the NAAQS, the reactionsat the lung surfaces cause constriction of C-fibers within the lung airways inmany people, resulting in small, but significant short-term reductions in thelung volumes and maximal flow rates of forced expiratory maneuvers, i.e.,forced vital capacity (FVC), forced expiratory flow rate in 1 second (FEV1),and peak expiratory flow rate (PEFR). In controlled laboratory O3 exposurestudies in healthy children and young adults engaged in moderate exercise, sucheffects can readily be measured in most subjects, but with a very wide range ofreproducible responsiveness in the individual subjects.6 Figure 18.2 shows theextent of the decline in FEV1 as a function of the O3 concentration for healthyyoung adults after 6.6 hours of exposure while mildly exercising. Shorterexposures would cause smaller FEV1 decrements, while more vigorous exercisewould increase the decrements.7 Field studies of healthy children at summercamps in wooded northeastern US sites, performed to determine whether therewere similar O3-associated pulmonary function decrements as those seen in thecontrolled laboratory studies, showed greater average decrements in the naturalsettings.8
Upon repetitive daily exposures, the maximal functional responses are seenon the first or second days, with lesser responses on successive days. However,after several weeks without further exposures, their initial responsiveness isrestored.6 Such functional adaptation is also seen on a seasonal basis in areaswith prolonged high levels of O3. Subjects are more responsive in the Springthan in the Summer, and they are minimally responsive in the Winter.
However, as illustrated in Figure 18.3, the acute responsiveness to O3 seen inchildren and young adults diminishes with age. It is also noteworthy that
Figure 18.2 Comparison of mean O3-induced FEV1 decrements due to 6.6 hexposures with mild exercise in the various studies described (inset).
Aging and Vulnerability to Ambient Air Pollution 461

responsiveness is usually lower in people who smoke or have asthma than inhealthy nonsmokers, which may possibly be due to the thicker mucus layers ontheir airways.9
In a field study of children with moderate to severe asthma at a summer campin the Connecticut River Valley,10 the associations between decrements in peakexpiratory flow rates and ambient O3 concentration were similar in magnitudeto those reported by the same group of investigators for other, healthy,children.8 However, the level of physical activity, and hence the O3 uptake, ofthe asthmatic children was lower, and they needed, and were provided with,rescue medication by an on-site physician.
18.3.1.2 Other Short-Term Respiratory System Effects
Controlled exposure studies, sometimes conducted simultaneously with therespiratory function studies described previously, have shown responses interms of respiratory symptoms, airway reactivity, pulmonary inflammation,pulmonary permeability, mucociliary particle clearance rates, and aerosoldispersion within the airways. However, the effects of age or aging on suchfunctional responses were not studied for any of these effects.6
18.3.1.3 Epidemiological Studies
18.3.1.3.1 Long-Term Effects on Respiratory Function. Since O3 was theonly criteria pollutant that consistently produced short-term changes inrespiratory function at current NAAQS levels, it was anticipated that itwould also be associated with chronic functional losses. However, theChildren’s Health Study (CHS) of cohorts of 4th through 12th grade children
Figure 18.3 Predicted mean decrements in forced expiratory volume in L(DFEV1)following 2 hour exposures to ozone while undergoing heavy intermittentexercise for three ages.From: Ref. 9.
462 Chapter 18

in 12 Southern California communities found that lung development was notrelated to long-term average O3 concentration, but was significantlyassociated with the long-term average concentrations of PM10, PM2.5, NO2,and acidic vapors.11
18.3.1.3.2 Long-Term Effects on Hospital Admissions. As summarized byThurston and Ito,12 studies by Schwartz and colleagues reported increasesassociated with ambient O3 concentrations for respiratory hospitalizations ofMedicare patients in eleven US cities, as illustrated in Figure 18.4. Thisfigure also shows comparable increases in European cities, with higher ratesindicated for those over 65 years of age than for those under 65.
18.3.1.3.3 Short- and Long-Term Effects on Mortality. The NationalMortality and Morbidity Air Pollution Study (NMMAPS) of 95 US commu-nities reported statistically significant associations in seven of them and forthe 95 as a whole. The lag effects for a 20 ppb increase in 24 h average O3 areshown in Figure 18.5 for the 95-city data.13
Figure 18.4 Reported relative risk of respiratory hospital admission associated with a100 ppb increase in daily 1 h maximum O3 (with 95% CI).From: Ref. 12.
Aging and Vulnerability to Ambient Air Pollution 463

While O3 has an impact on short-term mortality, primarily in the warmermonths, its long-term average concentration has not been shown to beassociated with annual mortality.14
18.3.2 Particulate Matter
The major source of the PM in London in 1952, as described in Section 18.1,was the inefficient burning of soft coal for space heating within individualdwellings. It had high concentrations of acidic sulfates as well as a variety ofhydrocarbons that were products of incomplete combustion. The UK CleanAir Act mandated the replacement of soft coal with coke, resulting in majorreductions in the sulfur and hydrocarbon concentrations of the ambient airPM, as well as major reductions in air pollution-associated health impacts.Coke was subsequently replaced by natural gas from the North Sea deepwaterwells, leading to further improvements in air quality. In the US, the switch tonatural gas for urban space heating during the 2nd half of the 20th Century hadsimilar beneficial effects, and the more recent switch of many coal-fired powerplants to natural gas is further reducing the sulfur and hydrocarbon concen-trations in our ambient air.
PM in contemporary ambient air has always been, and will continue to be, acomplex mixture of solid and liquid particles of varying sizes, originating froma variety of sources of varying strengths. The chemical composition of the PMmixture has changed, as motor vehicles became a major source category, and iscontinuing to change as new engine technologies and better exhaust emissioncontrols are substantially reducing tailpipe emissions. In every denselypopulated region there are sources of PM associated with traffic, includingtailpipe emissions from diesel- and gasoline-powered engines, brake and tirewear, and dusts that are re-suspended from roadway surfaces by the vehiclemotions. The proportions contributed by each source vary with the size of the
0.50–0.5 1 1.5 2.0% Change in Mortality
Multiday Lag 0-6
Single-day Lags3 2 1
0
5
4
3
2
1
0
Den
sity
Figure 18.5 Comparison of single-day lags (0-,1-,2-, and 3-day) to a cumulativemulti-day lag (1- to 6-day) for % changes in all cause mortality per20 ppb increase in 24 h average O3 in all age groups.Source: From EPA O3 Criteria Document, 2005.
464 Chapter 18

fleet, types and sizes of the engines, traffic density, road surfaces, wind speeds,solar intensity, and moisture on the roadway and in the air.
There will also always be emissions from local and regional fossil fuel poweredelectric power plants, but the mixtures vary with fuel source. The eastern US isstill heavily impacted by coal combustion effluents, but it and the western UShave seen reduced emissions as natural gas has replaced coal as the fuel of choice.Major port cities in the US are impacted by the residual oil burned in powerplants and by the effluents of bunker oil fuels consumed by internationalshipping. Mining, materials processing, and industrial emissions are highlyvariable across the US, as are the organic products of secondary aerosolformation such as PAHs, and inorganic products of secondary aerosol formationsuch as sulfuric acid. The more acidic atmosphere in the eastern US can alsoincrease the solubility and bioavailability of trace toxic metals in the ambient air,while the greater solar radiation in the southwestern US may lead to greateratmospheric photochemical formation of PAH compounds.
18.3.2.1 Associations of PM2.5 and its Components with AnnualMortality and Hospital Admissions
The significant associations of PM mass concentrations with prematuremortality, combined with the high valuation of human life, drives the highbenefit/cost ratio established for EPA’s implementation of the US Clean Air Act.The Harvard Six-Cities study, a prospective cohort study of annual adultmortality rates in 6 eastern and midwestern US cities, showed that there weresignificant, almost linear relationships between mortality and variouscomponents of PM mass.15,16 As shown in Figure 18.6, the association becomesstronger as one goes from total suspended PM mass to thoracic PM (PM10), tofine PM (PM2.5), and is approximately equally strong for the sulfate andnonsulfate components fraction of the PM2.5. The PM2.5 contains most of thesulfuric acid and toxic transition metals originating from the combustion of coaland of bunker and residual oils, as well as most of toxic PAH and other semi-volatile organic compounds in the ambient air, and has been more closelyassociated with cardiovascular mortality than the PM10–2.5 mass. By contrast, thePM10–2.5 mass has been more closely associated with respiratory mass than thePM2.5 mass. Since both PM2.5 and PM10–2.5 are complex mixtures that vary incomposition both spatially and temporally, it has been impractical to reproduceexposures for controlled chamber exposures and their short-term functionaleffects. Thus the information that we have on the health-related effects of PM2.5
have come from observational studies of human populations in relation to PM2.5
mass concentrations in most cases, with some more recent studies demonstratingassociations with specific PM2.5 constituents and/or source categories.
Ito et al.17 performed an analysis of total daily mortality and hospitaladmissions for Medicare recipients (people over 65 years of age) that inves-tigated the influences of PM2.5 constituents. They used factor analysis ofshort-term fluctuations of PM2.5 chemical constituents and gaseous pollutantsin 64 individual US cities, and identified six major sources of ambient air
Aging and Vulnerability to Ambient Air Pollution 465

pollution: traffic, soil, coal, salt, metals, and residual oil combustion in 64individual US cities and identified traffic and soil factors in the majority of thesecities. In time-series analysis, PM2.5 chemical constituents and gaseous pollutantswere often at least as strongly associated with the health outcomes as PM2.5 massconcentrations. As shown on the right side of Figure 18.7, SO4
2– and PM2.5 masswere more closely associated with mortality in the second stage analysis, toidentify the most influential constituents, than were the other measuredconstituents of the pollution mixture, while for cardiovascular hospitaladmissions on the left side of Figure 18.7, transition metals (Cu, Ni, V, and Fe)appeared to be more influential than PM2.5 mass and SO4
2–.In another recent study of hospital admissions, using the same PM2.5
speciation and Medicare data resources, Bell18 performed a second stageanalysis to identify influential constituents. Table 18.4 summarizes her findingson cardiovascular and respiratory hospital admissions, as well asPM10-associated daily mortality rates from the NMMAPS study, which areassociated with PM2.5 constituents in the same communities. It can be seen thatthe only PM2.5 constituents that were significantly associated with the hospitaladmissions (in both categories) were EC, Ni, and V. Ni was the only PM2.5
constituents that was significantly associated with mortality.
Figure 18.6 Relative Risks for annual mortality in six U.S cities (P¼Portage, WI;W¼Watertown, MA; T-Topeka, KS; H¼Harriman, TN; L¼ SaintLouis, MO; and S¼ Steubenville, WV), expressed in terms of differentindices of PM component concentrations.From: Ref. 16.
466 Chapter 18

Figure 18.7 Risks of acute exposure to components of ambient air PM for cardio-vascular hospitalizations (left) and all-cause mortality (right), in termsof PM sources (top), PM components (bottom left), and otherfactors(bottom right).From: Ref. 17.
Aging and Vulnerability to Ambient Air Pollution 467

18.3.2.2 Long-Term Effects of PM2.5 on Chronic DiseasePrevalence
The Chemical Speciation Network (CSN) PM component concentration data,when averaged over seasonal and annual averages, have been used to determinethe associations of the component concentrations with annual mortality rates formembers of the American Cancer Society (ACS II) cohort residing in CSNcommunities.19 Figure 18.8 A shows the associations of annual mortality rates forindividual measured PM2.5 constituents, while Figure 18.8 B shows the asso-ciations for source-related PM2.5 factors. It can be seen that the coal combustionsource, and its most characteristic components (Se, As, and Br) are signifi-cantly, and more closely, associated with annual mortality rates than the others.
18.3.3 Carbon Monoxide
CO binds firmly to caboxyhemoglobin (COHb), reducing the capacity ofCOHb to carry inhaled oxygen to the bloodstream.
Table 18.4 Percentage Change in the Lag-0 PM Total Mass Health EffectEstimates per IQR Increase in the Component Fraction of PM2.5
Total Mass (95% PI).a,b,c,d
PM2.5 and CardiovascularHospitalization n¼ 106
PM2.5 and RespiratoryHospitalization onn¼ 106
PM10 and Mortalityn¼ 100
Al � 5.4 (� 14.9 to 4.1) 856 (� 122 to 293) � 6.6 (� 15 to 1.5)NH4
1 � 1.9 (� 43 to 39) � 687 (� 1500 to 129) 27 (� 11 to 66)As � 9.4 (� 38 to 19) � 106 (� 706 to 495) � 15 (� 56 to 26)
Ca � 11 (� 34 to 12) 408 (� 45 to 861) � 11 (� 26 to 3.0)Cl 13 (� 1.1 to 26) 200 (� 75 to 475) � 8.2 (� 26 to 10)Cu 4.4 (� 20 to 29) 243 (� 277 to 762) � 4.3 (� 30 to 21)
EC 26 (4.4 to 47) 511 (81 to 941) � 9.9 (� 35 to 15)Fe � 7.2 (� 27 to 12) � 125 (� 535 to 285) 1.1 (� 13 to 15)Pb 2.6 (� 20 to 25) � 76 (� 546 to 395) � 8.9 (� 40 to 22)
Mg � 18 (� 41 to 4.3) 87 (� 375 to 548) � 7.2 (� 25 to 11)Ni 19 (9.9 to 28) 223 (37 to 410) 145 (4.0 to 25)NO3
� 16 (� 11 to 42) 37 (� 514 to 588) � 10 (� 48 to 28)
OCM � 5.6 (� 38 to 27) 350 (� 289 to 989) � 17 (� 50 to 16)K � 13 (� 35 to 8.0) 35 (� 424 to 495) � 23 (� 50 to 4.3)Si � 11 (� 26 to 4.5) 186 (� 139 to 511) � 10 (� 21 to 1.3)
Na1 8.2 (� 12 to 28) 355 (� 55 to 766) � 13 (� 39 to 13)SO4¼ � 15 (� 38 to 8.9) � 321 (� 810 to 167) 31 (� 2.7 to 64)Ti � 22 (� 44 to 0.3) 155 (� 315 to 624) � 7.0 (� 26 to 12)
V 28 (11 to 44) 392 (46 to 738) 29 (� 0.5 to 58)Zn 7.9 (� 8.0 to 24) � 38 (� 384 to 308) 6.4 (� 14 to 27)
aThe IQR increase In the fraction of PM2.5 represented by each component is based on the IQRvalues displayed in Figure 7.
bBell et al. 2009b.cn¼number of counties.dBold values are statistically significant.
468 Chapter 18

Figure 18.8 Influences of PM components (left) and sources (right) on annual ischemic disease mortality.From: Ref. 19.
AgingandVulnera
bility
toAmbien
tAirPollu
tion
469

18.3.3.1 Effects of CO on the Onset of Angina in CardiovascularPatients
Each NAAQS is based on the need to protect the most vulnerable segment ofthe population. For CO, the people needing the greatest degree of protectionare cardiovascular patients subject to recurring bouts of angina (mostly elderlypeople), and controlled clinical exposure studies of volunteers demonstratedthat a shortening of the time to angina was observed at COHb concentrationsof 2.9 to 4.5%.20
18.3.4 Lead
Pb was, until the 1970s, added to gasoline in the US as an antiknock agent inthe form of tetraethyl and tetramethyl lead. When the fuel was consumed, mostof the oxidized Pb was emitted into the roadway air as fine particles, and mostof the Pb that accumulated within the exhaust piping was eventually dischargedfrom the tailpipe as larger particles. Some of the lead-bearing particles in theambient air were inhaled, while others were deposited on plant and groundsurfaces and incorporated into foods consumed by humans or into fodderconsumed by animals that were in turn consumed by humans. With theremoval of organic Pb compounds from gasoline, air concentrations of Pbdropped precipitously, and blood levels of Pb (PbB) also fell precipitously, withan approximate 3 to 6 month lag.
When Pb concentrations were elevated, many studies of the NHANESpopulations showed strong associations of PbB and indices of health inchildren and adults.21 The effects in children include decreased IQ, increasedauditory thresholds, decreased postural stability, and an increase in behavioralproblems. In adults, PbB elevations were associated with increased bloodpressure.
18.3.5 Sulfur Dioxide
SO2 exposures of volunteers in controlled laboratory studies have producedtransient bronchoconstriction responses in people with asthma, when engagingin moderate to heavy exercise, at concentrations as low as 0.04 ppm. However,this response does not appear to be age-dependent.22
Epidemiological studies show associations of SO2 with a variety of healtheffects at lower concentrations over longer averaging times, but it is highlylikely that the effects are more related to other components of the ambient airpollution mixture than to SO2.
18.3.6 Nitrogen Dioxide
NO2 concentrations in ambient air have been significantly associated with avariety of health effects in human populations, but there have been noconsistent studies linking NO2 to health-related effects in controlled exposure
470 Chapter 18

studies in human volunteers at levels approaching typical or even maximalambient concentrations. There is no evidence that these responses wereage-dependent.23
As with SO2, epidemiological studies show associations of NO2 with a varietyof health effects at lower concentrations, but it is highly likely that the effectsare more closely related to other components of the ambient air pollutionmixture than to NO2.
References
1. Committee on Air Pollution, Interim Report, Cmd 9011. London, H.M.Stationery Office. 1953, p. 58.
2. J. H. Ware, L. A. Thibodeau, F. E. Speizer, S. Colome and B. G. Ferris Jr.,Environ. Health Perspect, 1981, 41, 255–276.
3. S. Chinn, C. Florey, V. Du, I. G. Baldwin and M. Gorgol, J. Epid.Comm. Health, 1981, 35, 174–179.
4. M. Lippmann, Air in Air Pollutants and the Respiratory Tract, ed.W. M. Foster and D. L. Costa, Marcel Dekker, New York, 2nd edn, 2005,pp. 405–441.
5. M. Lippmann in Environmental Toxicants: Human Exposures and theirHealth Effects, ed. M. Lippmann, Wiley, Hoboken, 2009, pp. 317–365.
6. M. Lippmann in Environmental Toxicants: Human Exposures and theirHealth Effects, ed. M. Lippmann, Wiley, Hoboken, 2009, pp. 869–936.
7. W. F. McDonnell, D. H. Horstman, M. J. Hazucha, E. Seal, E. D. Haak,S. A. Salaam and D. E. House, J. Appl. Physiol., 1983, 54, 1345–1352.
8. D. M. Spektor, G. D. Thurston, J. Mao, D. He, C. Hayes andM. Lippmann, Environ. Res., 1991, 55, 107–122.
9. W. F. McDonnell, K. E. Muller, P. A. Bromberg and C. M. Shy, Am. Rev.Respir. Dis., 1993, 147, 818–825.
10. G. D. Thurston, M. Lippmann, M. B. Scott and J. M. Fine, Am. Rev.Respir. Crit. Care Med, 1997, 155, 654–660.
11. W. J. Gauderman, E. Avol, F. Gillil, H. Vora, D. Thomas, K. Berhane,R. McConnell, N. Kunzli, F. Lurmann, E. Rappaport, H. Margolis,D. Bates and M. Peters, N. Engl. J. Med., 2005, 351, 1057–1067.
12. G. D. Thurston and K. Ito in Air Pollution and Health, ed. S. T. Holgate,J. M. Samet, H. S. Koren and R. L. Maynard, Academic Press, London,1999, pp. 485–510.
13. M. L. Bell, F. Dominici and J. M. Samet, Epidemiol, 2005, 16, 436–445.14. C. A. Pope III, R. T. Burnett, M. J. Thun, E. E. Calle, D. Krewski, K. Ito
and G. D. Thurston, J. Am. Med. Assoc, 2002, 287, 1132–1147.15. US EPA, Review of the National Ambient Air Quality Standards for
Particulate Matter: OAQPS Staff Paper, 1996, EPA-452/R-96-013,Research Triangle Park, US Environmental Protection Agency.
16. D. W. Dockery, C. A. Pope III, X. Xu, J. D. Spengler, J. H. Ware,M. E. Fay, B. G. Ferris Jr. and F. E. Speizer, N. Engl. J. Med., 1993, 329,1753–1759.
Aging and Vulnerability to Ambient Air Pollution 471

17. K. Ito in Characteristics of PM Associated with Health Effects, HEIResearch Report No. 165, 2012. Health Effects Institute, Boston.
18. M. L. Bell, HEI Research Report No. 161, 2012, Health Effects Institute,Boston.
19. G. D. Thurston in Characteristics of PM Associated with Health Effects,HEI Research Report No. 165, 2012. Health Effects Institute, Boston.
20. M. T. Kleinman in Environmental Toxicants: Human Exposures and theirHealth Effects, ed. M. Lippmann, Wiley, Hoboken, 2009, pp. 499–528.
21. L. T. Grant in Environmental Toxicants: Human Exposures and theirHealth Effects, ed. M. Lippmann, Wiley, Hoboken, 2009, pp. 757–809.
22. M. Lippmann in Environmental Toxicants: Human Exposures and theirHealth Effects, ed. M. Lippmann, Wiley, Hoboken, 2009, pp. 957–1000.
23. R. B. Schlesinger in Environmental Toxicants: Human Exposures and theirHealth Effects, ed. M. Lippmann, Wiley, Hoboken, 2009, pp. 823–868.
472 Chapter 18

Subject Index
References to figures are given in italic type. Reference to tables are given inbold type.
activities of daily living(ADL), 132–3, 138–9, 145
aflatoxins, 422–3Afton Corporation, 153Agent Orange, 190aging, 1
Alzheimer’s disease and, 65–8cadmium toxicity and, 383changes in functional capacity, 4kidneys, 347–9
cadmium exposure and,356–7
mercury and, 362–3liver
diseases and, 424–5normal changes, 410–17
manganese toxicity and, 155–6mercury toxicity and, 138–9, 140
Agricultural Health Study, 282air pollution, 455–7
age and, 459carbon monoxide, 468–9lead, 470nitrogen oxides, 470ozone, 460
epidemiological studies,462–4
short-term effects, 461–2particulate matter, 464–8sulfur dioxide, 470vulnerability, 458–9
ALAD genes, 21–2
alcohol consumptionbreast cancer and, 309liver disease and, 424–5
aluminumabsorption, 34, 41accumulation, 34–6
neurons, 36–7Alzheimer’s disease and, 33–4
common neuropathology, 44–8calcium metabolism, 48–9iron metabolism, 49–51
studies, 38–9apolipoprotein E-dependent
neuroplasticity and, 64–5dietary supplements, 68exposure, 38–9
animal models, 40, 43–4, 69controlled study, 39–40
microtubule depletion and, 55–6neuropathology, 41–3
neurofibrillary tangles andhyperphosphorylated tauproteins, 57–60
neurotoxicity, 37, 41–3disruption of cellmetabolism, 37
hippocampal granulovasculardegeneration, 59–60
inflammatory effects, 53neurotransmitter levels, 52oxidative damage, 37–8
uptake, 34–6

Alzheimer’s disease, 12–13, 32aluminum and, 41
common neuropathology, 44–8calcium metabolism, 48–9iron metabolism, 49–51neurotransmitter levels,
51–2neuropathology, 41–3
apolipoprotein E-dependentneuroplasticity, 63–4
cognitive deterioration, 43–4comorbidity, 65–8disruption of aluminum
neurotoxicity, 48–9hippocampal granulovacuolar
degeneration (GVD), 59–60inflammatory effects, 52–3insulin resistance and, 98–9neurofibrillary tangles, 56–60neuropathology
cortical atrophy, 56microtubules, 53–6
ambient air pollution see air pollutionAmerican Cancer Society, 293–4a-amino-3-hydroxy-5-methyl-4-
isoxazolepropionic acid(AMPA), 49
amphetamine, 161amyloid b proteins, 12, 60–3androgen receptor, 332animal models
aluminum exposure, 40, 43–4, 69Alzheimer’s disease, 64–5bisphenol A, 251cadmium exposure, 357–8cadmium toxicity, 379–80diabetes (type I), 226lead toxicity, 393–4manganese dosimetry, 159–60manganese toxicity, 167–8mercury toxicity, 140metabolic syndrome, 250obesity, 211–13polychlorinated biphenyls, 89–90,
92–3rodent development, 304–5
antioxidant defense, 414–15see also oxidative stress
antioxidant response element, 382apolipoprotein E (ApoE), 63–5appetite, 204–6Aroclors, 88arsenic, 333, 337
liver toxicity, 423–4arsenite, 340
aryl amines, 314
aryl hydrocarbon (Ah) receptor,85, 412
aspartate aminotransferase, 362Aspergillus spp., 422astrocytes, 53, 63, 153–4,
165–8, 166atherosclerosis, 192–3atrazine, 316, 333
prostate cancer and, 333, 336automobile industry, 6–7
Baltimore Longitudinal Study ofAging, 350–1
Baltimore Memory Study, 19–20Barker hypothesis, 438behavioral teratology, 134–5beta cells, 217–19b-amyloid proteins, 60–3bisphenol A (BPA), 184, 211–12,
221–2, 241–3, 242, 304, 340biomonitoring studies, 244–5breast cancer and, 306
epidemiology, 252–3exposure, 244–5infertility and, 256–7metabolic syndrome and, 249–50,
253–4prostate cancer and, 248–9, 333,
335, 340reproductive health and, 278–9sources, 243–4
bisphenol A diglycidyl ether(BADGE), 243
Black Smoke, 457blood vessels, 378–9body mass index (BMI), 305–11
474 Subject Index

bonesaging and osteoporosis, 66–7fracture risk, 398, 401, 402lead concentration, 19, 389–90mass and osteoporosis, 396–7see also osteoporosis
brain imaginglead neurotoxicity, 16–17, 20polychlorinated biphenyls, 90
breast cancer, 293–5bisphenol A and, 253breast development
dysregulation, 296, 297diet and, 311future research directions, 319–20incidence, 293–4, 294life stage factors, 316–18premature thelarche, 295–6prevention, 319risk factors, 305
alcohol consumption, 309breast density, 309endocrine disruptors, 306–10
environmental, 311–12ethnicity, 312–13non-genetic, 305–11obesity, 305, 309smoking, 313–16working patterns, 312
breast development, 296, 297abnormal
humans, 302–4rodents, 304–5
timing and regulation, 299–302Breast Imaging Reporting and Data
Systems, 309Brodmann’s areas, 44–5Bureau of Mines, 7
cadmium, 3, 223, 271, 333, 376–7animal models, rodent
studies, 379–80dietary exposure, 354, 377effects on blood vasculature,
378–9gender differences, 359
insulin signaling pathwaysand, 381–2
kidney disease and, 354–9, 377–8prostate cancer and, 336
reproductive health and, 269,276–7
role in aging process, 383skeletal effects, 377
Caenorhabitis elegans, 382, 412calcium metabolism, 48–9, 87–8calmodulin, 48cancer, 248–9
bisphenol A and, 253breast see breast cancerimmune disorders and, 445liver, 423male reproductive tract, 281–2prostate see prostate cancerrespiratory tract, 457, 458
carbaryl, 276carbon disulfide, 117carbon monoxide, 468–70cardiovascular disease, 182–4, 190–2
atherosclerosis, 192–3bisphenol A and, 253–4cadmium and, 378–9carbon monoxide and, 470see also atherosclerosis; metabolic
syndromecaspase, 57Centers for Disease Control
(CDC), 10, 401central nervous system (CNS), 12–13
see also neurotoxicityChemical Speciation Network, 468children see early life exposureChildren’s Health Study, 462–3China
lead exposure studies, 18reproductive health, 273
chlorine compounds seeorganochlorines
chloroacetaldehyde (CAA), 420chlorpyrifos, 276, 333choline acetyltransferase
(ChAT), 51–2, 52
475Subject Index

chromium, 277chronic disease, 446Clean Air Act (UK), 457, 458Clean Air Act (US), 465Connecticut River Valley, 462copper, 114cytochrome P450 (CYP)
enzymes, 193, 334, 412–13, 424–5cytokeratins, 339
dementia, 12–13lead exposure and, 22see also Alzheimer’s disease;
Parkinson’s diseasedendritic dieback, 55–6Denmark, 296dentate gyrus, 44, 63Denver Developmental Screen
Test, 135, 135–6developmental exposure
early life see early life exposureprenatal see prenatal exposure
developmental immunotoxicity(DIT), 439, 440–2
diabetes, 202, 202–3, 357–8Alzheimer’s disease and, 97–8associated chemicals, 221
blood glucose levels, 219–20developmental programming, 220–2exposure studies
adult, 222–3developmental, 222during pregnancy, 223
genetic factors, 204incidence, 202kidney disease and, 352–3, 364maternal, 208polychlorinated biphenyls
and, 97–9type I, 217, 223–4, 223–7
animal exposures, 226–7endocrine, 224–5incidence, 224
type II, 203, 217–19developmental exposurestudies, 222–3
dibutyl phthalate (DBP), 272–32,4-dichlorophenoxyacetic acid, 115dichlorodiphenyltrichloroethane
(DDT), 268–9, 303, 307,316–18, 333prostate cancer and, 338
dichlorodiphenyltrichloroethene(DDE), 303, 316–18
dieldrin, 307
dietary exposurealuminum, 33–4, 38, 39, 43, 59,
62, 65bisphenol A, 243, 251breast cancer and, 311–12cadmium, 354, 377manganese, 154mercury, 359nitrates and nitrites, 226polychlorinated biphenyls, 95–6
dietary practicesbreast cancer and, 311kidney function and, 415obesity and, 305
dietary supplements, 68diethylstilbestrol (DES), 310–31, 440
prostate cancer and, 3341,25-dihydroxycholecalciferol, 3922,3-dimercaptosuccinic acid, 361Dioscorides, 5dioxins, 84, 86, 187, 188–9, 190,
338–9breast development and, 302–3,
308
mechanism of action, 193prostate cancer and, 338–9, 340
diptheria-pertussis-tetanus (DPT)vaccines, 35
divalent metal transporter 1(DMT1), 161–2
DNA, lead toxicity, 12dopamine, 164Down’s syndrome, 41drinking water see water
contaminationdrug induced liver injury
(DILI), 427–8
476 Subject Index

dual X-ray absorptiometry(DXA), 397–8
DuPont, 7
early life exposure, 459diabetes, 222immune disorders, 444–6immune system
susceptibility, 438–40lead, 23–4manganese, 156–7mercury vapor exposure, 142–3obesity, 208–11see also prenatal exposure
endocrine disruptors (EDC), 183–4,204–6, 208–9, 296, 302–3,306–11, 331diabetes and, 224–5, 225–7
entorhinal cortex, 44–5Environmental Protection Agency
(EPA), 8epidemiological studies, 157
aluminum exposure, 38–9Alzheimer’s disease, 39–40bisphenol A, 252–3diabetes, 222lead toxicity, 18–20methylmercury exposure, 135–8ozone pollution, 462, 462–4persistent organic pollutants, 188–9
estradiol, 221, 242, 255, 278reproductive health and, 276
estrogen, 93estrogen receptors, 335estrogens, see also bisphenol A;
diethylstilbestrolEthyl Gasoline Corporation, 8ethylene-bi(dithiocarbamates), 280
Faroe Islands, 133, 136–7fertilizers, 226fetal exposure see prenatal exposurefetal Minimata disease see Minimata
diseasefish, 95–6, 135, 138
mercury, 359
flame retardants see polybrominatedbiphenyls
focal hepatocytic hyperplasia, 421Food and Drug Administration
(FDA), 8, 33Framinton Heam study, 1
G-protein coupled receptors(GPCR), 48
gasoline, 6–7, 7–8, 153gastrointestinal tract, 34gastrointestine-associated lymphoid
tissue, 439gene expression
effect of lead, 11–12obesity and, 203–4
General Motors, 6genetic factors
breast cancer, 312–13diabetes, 203–4lead toxicity and, 21–2
genistein, 312Ghana, 152glomerulosclerosis, 347–9, 349, 353–4glucose, 219–20glutamate, 164–5glutamic acid decarboxylase
(GAD), 162–3glutathione, 381gonadal hormones, 92–3Great Lakes, 95–7, 280green chemistry, 319gynecomastia, 296–7
hair, 158haloacetic acids (HAA), 274halogenated aromatic hydrocarbons
(HAH), 84–5, 86see also polybrominated biphenyls;
polychlorinated biphenylsHarvard Six-Cities Study, 465–6heart disease see cardiovascular
diseaseheart failure, 183heavy metals see metalshemangiosarcoma, 421
477Subject Index

hepatic function and toxicity see liverhepatic hemangiosarcoma, 420hepatitis, 416, 418hepatocellular carcinoma, 423hepatocytes, 416heterocyclic amines, 315
hexane, 116hippocampal granulovacuolar
degeneration (GVD), 59–60homocysteine, 12Hudson River, 89hyperglycemia, 99, 202–3, 219–20
see also diabetes; insulin resistancehypertension, 188, 357–8
kidney disease and, 352
immune system, 3, 436–7diabetes comorbidities, 203disease, developmental
origins, 438–44environmental risk factors, 446–7immune cells as sentries, 437–8misregulated inflammation,
444–6sex-specific outcomes, 443–4
in utero exposure see prenatalexposure
in vitro fertilization (IVF), 250, 255–6India, 152infertility, 251, 254–6
see also reproductive health (male);semen
inflammationbrain, 52–3chronic misregulated, 444–6liver, 415–16manganese toxicity, 165–7
insulin resistance, 98–9, 183, 381–2, 382see also diabetes; hyperglycemia
insulin-like growth factor 1(IGF-1), 413
intraepithelial lymphocytes, 439Iraq, 131iron homeostasis, 359iron metabolism, 49–50, 163iron regulatory proteins (IRP), 163
JapanMinimata mercury
poisoning, 132–3, 137–8polychlorinated biphenyls, 91–2
job exposure matrices (JEM), 13juveniles see early life
K-x-ray fluorescent spectroscopy(KXRF), 15–16, 19
kidney injury molecule-1 (Kim-1), 356kidneys
disease, 352–3chronic, 364
glomerulosclerosis, 347–9, 349metals, 352–3
cadmium, 354–9, 377–8mercury, 359–61
normal agingcell senescence, 351–2physiological changes, 350–1renal tubules andinterstitium, 350
renal glomerulus, 347–9knocking, 6–7, 153Kupffer cells, 415
lactation, 299lead, 269, 388–9
in air, 459atmospheric, 470blood levels, 391in bones and teeth, 391–2
fracture healing and, 394–5measurement, 399–400mechanisms of toxicity, 395–6osteoporosis, 395–401skeletal effects, 392–3teeth, 394
current exposure, levels, 5–6dementia and, 22exposure
assessment, 13–14in gasoline, 6–7historical, 5, 6, 17sources, 9–11, 390–1
gene expression and, 11–12
478 Subject Index

historical use and exposure,5, 6, 17
neurotoxicity, 7adults
high-dose occupational, 15–17low-dose non-occupational,
17–20children, 14genetic factors, 21–2mechanisms, 11–13psychosocial factors, 20–1
paints, 8Parkinson’s disease and, 112–13physiological role, 389–90reproductive health and, 277in teeth and bones, 1,25-
dihydroxycholecaliferolsuppression, 392–3
lipid disturbances, 188liver, 3, 409–10
antioxidant defense, 414–15cirrhosis, 19
diseasealcoholic, 424–5drug induced, 427nonalcoholic fatty liver, 425–6viral hepatitis, 426–7
immune function, 415–16normal aging
physiological changes, 410–11xenobiotic metabolism, 411–14
regeneration, 416–17toxicity, 417–18, 419
aflatoxins, 422–3arsenic, 423–4vinyl chloride, 418–22
London, deaths from airpollution, 455–7, 456
long-term potentiation (LTP), 48lymphocytes, 415–16
magnesium, 37magnetic resonance spectroscopy
(MRS), 17male reproductive health see
reproductive health (male)
mammary development see breastdevelopment
maneb, 116manganese, 151–2
animal models, 159–60, 167–8applications, 152–3biological functions, 153–4early life exposure, 156–7epidemiological studies, 156–7exposure markers, 157–8exposure sources, 152–3neurotoxicity, 156–7
glial activation, 165inflammation, 165–7nitrosative stress, 165
Parkinson’s disease and, 108–12,110, 111
toxicity, 154–6, 161–2dopamine function, 164glutamate function, 164–5iron homeostasis, 163nitrosative stress, 165oxidative stress, 162–3
menopause, 92–3mercury
auditory impairment, 140compound classification, 125–6dietary exposure, 359elemental vapor
coexposure withmethylmercury, 143–4
exposure, 126, 139–40, 146exposure duringgestation, 143–5
health effects, 127, 139metabolism, 126–7neonatal exposure, 142–3physicochemical properties, 126prenatal exposure,141–2, 146–7
toxicity, 127kidneys and, 359–61mercuric (divalent)
compounds, 127–8mercurous (monovalent)
compounds, 128–9
479Subject Index

mercury (continued)organic compounds, 129–31
adult exposure, 131–2aging effects, 138–9behavioral teratologyassessments, 135–6
cardiovascular effects, 133coexposure with mercuryvapor, 143–4
developmental toxicity, 132–3exposure and absorption, 129exposure studies, 134–8fetal exposure, 131, 135–8metabolism, 129–31methyl, 131
metabolic syndrome, 183–4,184–90, 426bisphenol A and, 249–50, 253–4diagnostic criteria, 184–5epidemiological studies, 185–6
metallothionein, 128metals, 271, 276–7
breast cancer and, 307
kidney disease and, 353–4male reproductive health and, 271prostate cancer and, 333
thyroid hormones, 280–1see also aluminum; cadmium; lead;
manganese; mercurymethomyl, 116methyl paraben, 273methylcyclo-pentadienyl manganese
tricarbonyl (MMT), 153methylethylketone, 116Mexico, 152, 271, 276microglial cells, 53, 168–9, 442b-2-microglobulin, 356microproteinuria, 356microtubules, 53–6, 360, 362
depletion, 54–6Midgely, Thomas, 7milk streal, 299miners, 139Minimata disease, 131–2, 132–3, 138
cardiovascular autonomic nervousfunctions, 133
mitochondria, 162–3, 391, 414mitochondrial superoxide-dismutase,
153–4mitogen activated protein (MAP)
kinase, 165monobutyl phthalate (MBP),
272–3myalgic encephalomyelitis, 444
National Ambient Air QualityStandards, 459–60
National Health and NutritionExamination Survey(NHANES), 18–19, 185, 191,222–3, 277, 377bisphenol A, 253–4cadmium, 378kidney disease, 352lead, 395
National Mortality andMorbidity Air PollutionStudy, 463
Neonatal Behavioral AssessmentScale, 137–8
nephron function, mercuryand, 362–3
nerve cells, 11neurofibrillary tangles, 56–60neuroplasticity, 63–5neurotoxicity
aluminum, 37, 41–3, 52, 53,59–60
lead, 7, 11–12, 15–21manganese, 156–7, 165–7
neurotransmitters, 11, 42,51–2
New Zealand, 135nitrites and nitrates, 226–7nitrogen oxides, 168, 459, 470nitrosative stress, 165non-alcoholic fatty liver disease
(NAFLD), 424non-steroidal anti-inflammatory
drugs (NSAID), 353nonylphenol, 306
Nurses’ Health Study, 19
480 Subject Index

obesity, 188, 201–2animal models, 211–13
nicotine and cigarettesmoke, 212–13
organotins, 212breast cancer and, 305–11, 309, 311comorbidity, 202–3differences between obese and lean
individuals, 207
endocrine mechanismsregulating, 204–6
etiology, 206–8genetic basis, 203–4human studies, 213–15
persistent organicpollutants, 215–17
metabolic programming, 208–11metabolic syndrome and, 253–4obesogen hypothesis, 211see also metabolic syndrome
occupational exposurelead, 7–8, 15–17liver damage, 418manganese, 109–10, 154, 156mercury, 139–40, 146pesticides, 332–3polychlorinated biphenyls, 90–1
Occupational Health and SafetyAdministration, 23
Old Age, 31–2organic ion-transporting polypeptides
(Oatps), 414organochlorine compounds, 268–9
reproductive health (male) and, 275thyroid hormones and, 279–80see also polychlorined biphenyls
organotin compounds, 212osteoporosis, 66–7, 388–9, 395
bone mass and, 396–8lead’s role, 398–9
oxidative damage, 37–8cadmium-induced, 381, 382–3manganese, 162–3role of liver, 414–15
oxidative stress, lead, 12–13ozone, epidemiological studies, 462–3
Paige, Satchel, 4paints, 8parabens, 273–4paraquat, 115–16Parkinsonism, 104–5Parkinson’s disease, 90, 104–5
epidemiological studies, 105–8, 106exposure, 109–10
industrialization and, 105–6manganese toxicity and, 155–6prevalence, 105–6risk factors, 108
copper, 114lead, 112–14manganese, 109–12metals, 109–15, 114–15pesticides, 115–16solvents, 116–17
symptoms, 104–5particulate matter (PM), 457, 458,
460, 464–8air quality standards, 460components, 469
perfluorooctanoic acid (PFOA),304, 308
perforant path, 44–5, 45periosteum, 66persistent organic pollutants
(POP), 184, 185, 209, 222–3cardiovascular disease and,
190–2obesity and, 215–17see also organochlorines
pesticides, 222–3, 268–9breast development and, 307
organochlorine seeorganochlorines
Parkinson’s disease and, 115–16prostate cancer and, 332–4, 333reproductive health and,
270–1, 276thyroid hormones, 280
thyroid hormones and, 280see also
dichlorodiphenyltrichloroethane(DDT)
481Subject Index

phthalates, 272–3, 277–8, 306–7reproductive health and, 277–8
phytoestrogen, 311–12plastic associated compounds
(PAC), 184, 189polybrominated biphenyls
(PBB), 97–8, 186, 280–1polychlorinated biphenyls
(PCB), 83–4, 84–8, 138, 222–3,273, 274, 307animal models, 89–90atherosclerosis, 192–3breast development and, 307
cardiovascular disease and, 190coplanar, 85, 86diabetes and, 97–9effects on motor function, 93–5environmental levels, 88–9exposure, 90
coexposure with othertoxins, 95–7
non-occupational, 91–3occupational, 90–1
grounds for ongoingconcern, 88–90
metabolic syndromeand, 185–6, 189neurotoxicity, 90–1ortho-substituted, 86prostate cancer and, 333, 335–6reproductive health and, 269,
273–4, 275–6structure-activity relationship,
86–9, 87trauma as trigger for
neurodegeneration, 92–3polychlorinated dibenzodioxins
(PCDDs), 187polycyclic aromatic hydrocarbons
(PAH), 314–15
polycystic ovarian syndrome(PCOS), 255
polyfluoroalkynes (PFOA), 213polyvinyl chloride (PVC), 419–20potassium permanganate, 152–3pregnancy, 307–10
see also prenatal exposure
pregnane and xenobiotic receptor(PXR), 412
prenatal exposure, 255–6bisphenol A, 250, 255cadmium, 380–1diabetes and, 221, 222, 223lead, 392–3mercury, 131, 132–3, 134–8,
143–4polychlorinated biphenyls, 447smoking, 213–15
propargite, 116prostate cancer, 248–9, 281–2
anti-androgens, 337–8bisphenol A and, 248–9cadmium and, 379dioxins, 338–9estrogens and
bisphenol A, 335diethylstilbestrol (DES), 334
prevalence, 332prostate stem/progenitor
cells, 339–41risk factors, 333
prostate specific antigen (PSA), 339protein kinase C, 49protein kinase C (PKC), 87protein phosphatase 2A (PP2A), 57proteinuria, 349psychosocial stress, 20–1pyramidal cells, 41–2
Quebec, 157
rat models, 40aluminum exposure, 43–4
reactive oxygen species (ROS), 37–8,53, 62, 381lead and, 395–6
renal blood flow (RBF), 351renal disease see kidneysreproductive health, 92–3
organochlorines, 268–9reproductive health (female), 254–5
see also pregnancy; prenatalexposure
482 Subject Index

reproductive health (male)bisphenol A and, 254–5, 278–9cancers, 281–2gynecomastia, 296–8metals and, 271–2, 276–7,
277–8non-persistent pesticides,
270–1, 276organochlorines and, 275–6phthalates, 273–4sperm DNA damage, 268thyroid hormones, 279
organochlorines and, 279–80see also prostate cancer
reward systems, 204–5Romans (ancient), 6rubella, 226
semen quality, 268effect of organochlorines,
268–9heavy metals and, 271non-persistent pesticides
and, 270–1Sertoli cells, 279Seveso disaster, 190sexual health see reproductive healthSeychelles, 135–6shift working, 312single positron computerized
tomography (SPECT), 90skeleton see bonesSmall Property Owners’
Association, 390smoke see particulate mattersmoking see tobacco smokingsolvents, 116–17soy, 311Spain, 271steatohepatitis, 419
stem cells, prostate, 339–41streptozotocin, 226–7stress, 20–1stroma, 299sulfur dioxide, 459, 470Sweden, 272–3
Taiwan, 337, 444tau proteins, 56–7
hyperphosphorylation, 56–60teeth, 158, 391–2, 394telomere shortening, 416–17terminal ductar lobular units
(TDLU), 300terminal end buds (TEB), 300, 316testicular germ cell tumors
(TGCT), 2822,3,7,8-tetrachlorodibenzodioxin
(TCDD), 84, 308, 412–13tetraethyl lead (TEL), 7tetrahydrobiopterin, 51–2TGF-b, 393, 395thelarche, 296, 296thyroid hormones, 279
metals, 280–1organochlorines, 279–80
tobacco smoking, 212–13, 313–16,314, 459cadmium and, 354, 357, 377immune disorders and, 441
Torres Strait Islands, 358–9toxicant-associated steatohepatitis
(TASH), 418toxicokinetics, manganese,
159–60tributyl tin (TBT), 212trichloroethylene, 116–17trihalomethanes (THM), 274turkey X disease, 422
ultraviolet filters, 333, 336United Kingdom, 457, 458United States
aluminum consumption, 33–4obesity, 201–2prevalence of Parkinson’s
disease, 107reproductive health, 271
vaccination, 35–6, 68vinclozolin, 337–8vinyl chloride, 418–22
metabolism, 420
483Subject Index

viral hepatitis, 426–7visceral adipose tissue (VAT), 426vitamin D, 356
water contamination, 10, 116aluminum, 35, 38arsenic, 337, 423cadmium, 354
lead, 393manganese, 156, 157pesticides, 105, 112, 116
welding, 109–10, 155, 156, 277World Health Organization
(WHO), 135
xenobiotic metabolism, 411–16
484 Subject Index