Master essay in : Applying the Fourier transform to solve ODEs and PDEs
ABSTRACT: A new procedure for determining free fatty acids(FFA) in olive oil based on spectroscopic Fourier transform in-frared–attenuated total reflectance spectroscopy measurementsis proposed. The range of FFA contents of samples was extendedby adding oleic acid to several virgin and pure olive oils, from0.1 to 2.1%. Calibration models were constructed using partialleast-squares regression (PLSR). Two wavenumber ranges(1775–1689 cm−1 and 1480–1050 cm−1) and several pretreat-ments [first and second derivative; standard normal variate(SNV)] were tested. To obtain good results, splitting of the cali-bration range into two concentration intervals (0.1 to 0.5% and0.5 to 2.1%) was needed. The use of SNV as a pretreatmentallows one to analyze samples of different origins. The best re-sults were those obtained in the 1775–1689 cm−1 range, using3 PLSR components. In both concentration ranges, at a confi-dence interval of α = 0.05, no significant differences betweenthe reference values and the calculated values were observed.Reliability of the calibration vs. stressed oil samples was tested,obtaining satisfactory results. The developed method was rapid,with a total analysis time of 5 min; it is environment-friendly,and it is applicable to samples of different categories (extra vir-gin, virgin, pure, and pomace oil).
Paper no. J8932 in JAOCS 76, 611–616 (May 1999).
KEY WORDS: ATR, free fatty acid, FTIR, multivariate calibra-tion, olive oil, PLSR, quality control.
Olive oil is an essential component of the Mediterranean diet.The European Union (EU) has established different categoriesof olive oil according to the production process (1). In order toensure the quality within the different categories, several analy-ses should be made. One of the important methods to determineolive oil quality is the free fatty acid (FFA) content.
Official wet chemistry methods are time consuming, laborintensive, and require skilled technicians and reagents that arecostly to dispose of safely. This can be avoided by using a spec-troscopic technique which offers the potential for rapid deter-mination of large numbers of samples by unskilled workerswith minimal use and disposal of costly solvents and chemi-cals. Most vegetable oil spectroscopic applications focus on de-tecting adulteration (2), determining classification (3), and es-tablishing geographical origins (4). Also, a few quantitative
determinations have been done without any previous separa-tion techniques. Thus, Fourier transform infrared (FTIR)spectroscopy has become an alternative to these techniquesbecause of its simplicity in sample handling and unnecessarypretreatment. Several lipid analysis FTIR methods (5–8) havebeen reported, such as the monitoring of the oxidation of edi-ble oils, the determination of their cis and trans content, per-oxide values, and free fatty acids.
The need to develop new simplified routine methods hasresulted in little attention given to the selection of samplesand their calibration; however, this process is essential if reli-able predictions are desired. Thus, an overfitted calibrationmodel may provide good results for the calibration set butpoor predictive ability for similar samples if sufficient vari-ability is not included in the calibration process. Therefore,proper development of analytical methods in this context re-quires careful use of multivariate calibration methods to ob-tain reliable results. The application to external predictionsamples and its comparison to official reference methods im-proves the consistency of the results (9,10).
The objective of the research was to develop a rapid FTIRmethod for olive oil FFA analysis using multivariate treat-ments of the data obtained by direct attenuated total re-flectance (ATR)–FTIR measurements with the aim of replac-ing laborious official methods when a large number of sam-ples must be analyzed.
MATERIALS AND METHODS
Samples. In order to ensure that the study would be representa-tive of the different types and categories of commercially avail-able olive oil, samples of different origins and ages were ana-lyzed. A total of 87 olive oil samples of different categories,with FFA contents between 0.1 and 2.1% were analyzed, in-cluding 36 virgin, 40 pure, and 11 pomace olive oil samples.Although the FFA contents of extra virgin olive oils range from0 and 1%, in an effort to expand the calibration interval, sev-eral samples were prepared with added oleic acid to increasethe range of FFA contents studied. Also, 13 additional sampleswere prepared by heating several olive oil samples at 250°Cfor 2–3 h to obtain thermally stressed samples.
Chemical procedures. FFA contents were determined byusing the reference method (11). Briefly, this consists of a
Copyright © 1999 by AOCS Press 611 JAOCS, Vol. 76, no. 5 (1999)
*To whom correspondence should be addressed. E-mail: [email protected]
Determination of Olive Oil Free Fatty Acid by FourierTransform Infrared Spectroscopy
Enriqueta Bertran, Marcelo Blanco, Jordi Coello, Hortensia Iturriaga*,Santiago Maspoch, and Ivan Montoliu
Unitat de Química Analítica, Departament de Química, Edifici CN,Universitat Autònoma de Barcelona, E-08193 Bellaterra, Barcelona, Spain
nonaqueous titration of the sample in a diethyl ether–ethanolmedium (1:1), using an ethanolic solution of 0.1 M KOH asthe standard reagent.
Physical measurements. FTIR spectra were recorded in theATR mode on a Perkin-Elmer 16PC (Norwalk, CT) spec-trophotometer equipped with a Graseby Specac p/n 11130(Kent, United Kingdom) horizontal ATR device. This is achanneling device suitable for viscous fluids that uses a45°ZnSe parallelogram with mirrored angle faces providingsix reflections on the crystal surface. The spectrophotometerwas run under software 16PC Instrument Control v. 2.20(Perkin-Elmer); and IR Data Manager v. 3.34 (Perkin-Elmer),which was used for recording and processing the spectra.
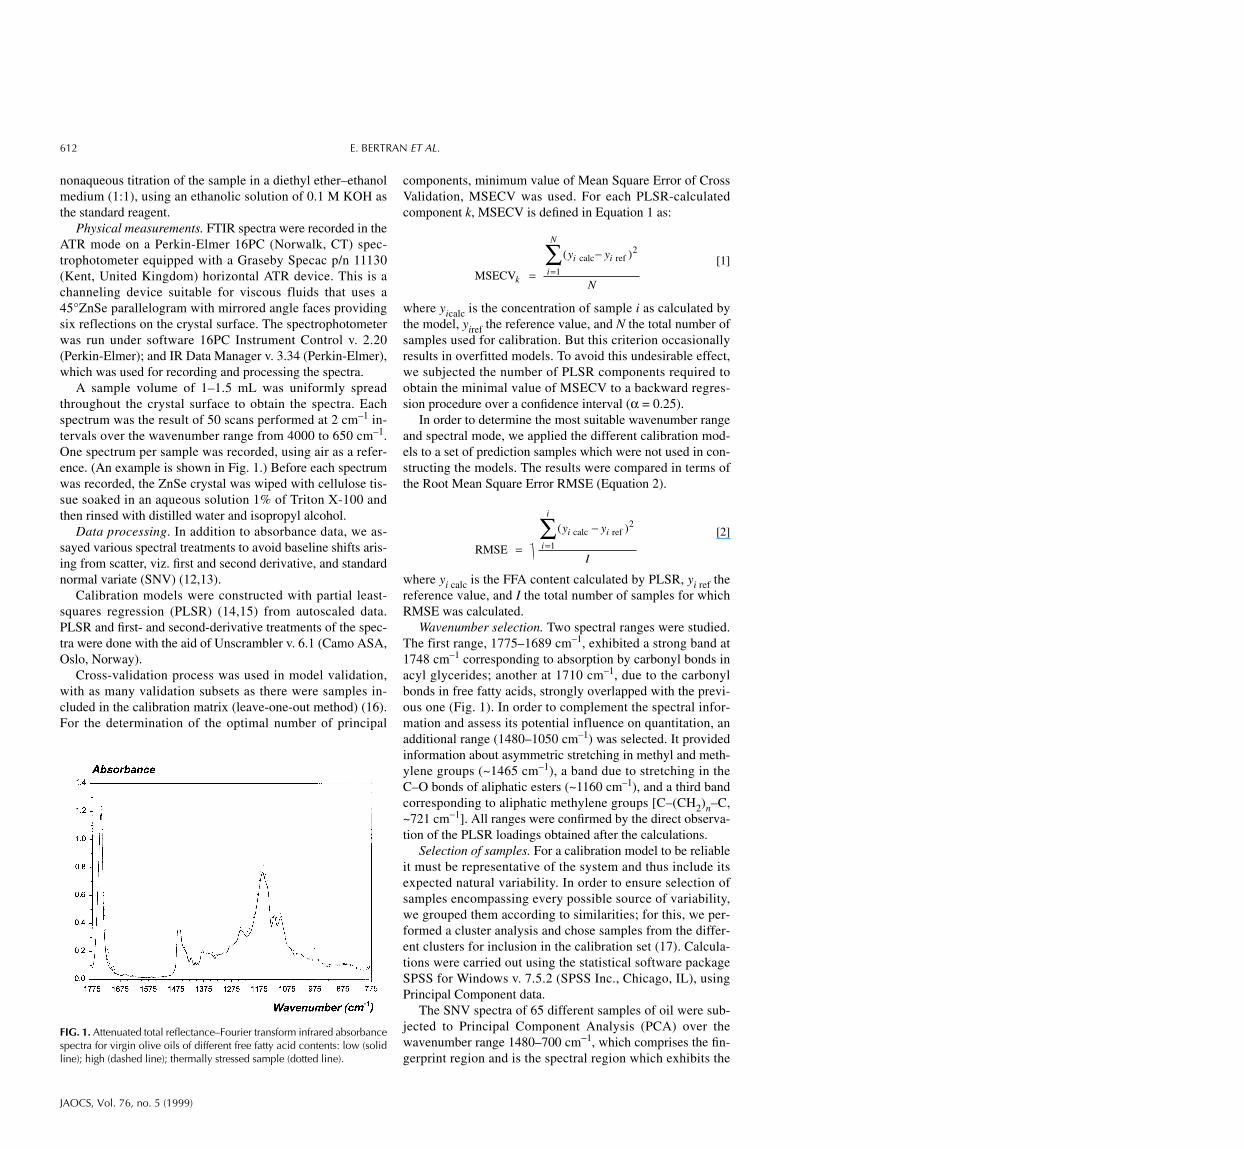
A sample volume of 1–1.5 mL was uniformly spreadthroughout the crystal surface to obtain the spectra. Eachspectrum was the result of 50 scans performed at 2 cm–1 in-tervals over the wavenumber range from 4000 to 650 cm–1.One spectrum per sample was recorded, using air as a refer-ence. (An example is shown in Fig. 1.) Before each spectrumwas recorded, the ZnSe crystal was wiped with cellulose tis-sue soaked in an aqueous solution 1% of Triton X-100 andthen rinsed with distilled water and isopropyl alcohol.
Data processing. In addition to absorbance data, we as-sayed various spectral treatments to avoid baseline shifts aris-ing from scatter, viz. first and second derivative, and standardnormal variate (SNV) (12,13).
Calibration models were constructed with partial least-squares regression (PLSR) (14,15) from autoscaled data.PLSR and first- and second-derivative treatments of the spec-tra were done with the aid of Unscrambler v. 6.1 (Camo ASA,Oslo, Norway).
Cross-validation process was used in model validation,with as many validation subsets as there were samples in-cluded in the calibration matrix (leave-one-out method) (16).For the determination of the optimal number of principal
components, minimum value of Mean Square Error of CrossValidation, MSECV was used. For each PLSR-calculatedcomponent k, MSECV is defined in Equation 1 as:
[1]
where yicalc is the concentration of sample i as calculated bythe model, yiref the reference value, and N the total number ofsamples used for calibration. But this criterion occasionallyresults in overfitted models. To avoid this undesirable effect,we subjected the number of PLSR components required toobtain the minimal value of MSECV to a backward regres-sion procedure over a confidence interval (α = 0.25).
In order to determine the most suitable wavenumber rangeand spectral mode, we applied the different calibration mod-els to a set of prediction samples which were not used in con-structing the models. The results were compared in terms ofthe Root Mean Square Error RMSE (Equation 2).
[2]
where yi calc is the FFA content calculated by PLSR, yi ref thereference value, and I the total number of samples for whichRMSE was calculated.
Wavenumber selection. Two spectral ranges were studied.The first range, 1775–1689 cm–1, exhibited a strong band at1748 cm–1 corresponding to absorption by carbonyl bonds inacyl glycerides; another at 1710 cm–1, due to the carbonylbonds in free fatty acids, strongly overlapped with the previ-ous one (Fig. 1). In order to complement the spectral infor-mation and assess its potential influence on quantitation, anadditional range (1480–1050 cm–1) was selected. It providedinformation about asymmetric stretching in methyl and meth-ylene groups (~1465 cm–1), a band due to stretching in theC–O bonds of aliphatic esters (~1160 cm–1), and a third bandcorresponding to aliphatic methylene groups [C–(CH2)n–C,~721 cm−1]. All ranges were confirmed by the direct observa-tion of the PLSR loadings obtained after the calculations.
Selection of samples. For a calibration model to be reliableit must be representative of the system and thus include itsexpected natural variability. In order to ensure selection ofsamples encompassing every possible source of variability,we grouped them according to similarities; for this, we per-formed a cluster analysis and chose samples from the differ-ent clusters for inclusion in the calibration set (17). Calcula-tions were carried out using the statistical software packageSPSS for Windows v. 7.5.2 (SPSS Inc., Chicago, IL), usingPrincipal Component data.
The SNV spectra of 65 different samples of oil were sub-jected to Principal Component Analysis (PCA) over thewavenumber range 1480–700 cm−1, which comprises the fin-gerprint region and is the spectral region which exhibits the
RMSE
calc ref
( )
=
−=∑ y y
I
i i
i
i2
1
MSECV
calc ref
k
i i
i
N
y y
N
( )
=
−=∑ 2
1
612 E. BERTRAN ET AL.
JAOCS, Vol. 76, no. 5 (1999)
FIG. 1. Attenuated total reflectance–Fourier transform infrared absorbancespectra for virgin olive oils of different free fatty acid contents: low (solidline); high (dashed line); thermally stressed sample (dotted line).
most marked differences among samples, as can be seen inFigure 1.
RESULTS AND DISCUSSION
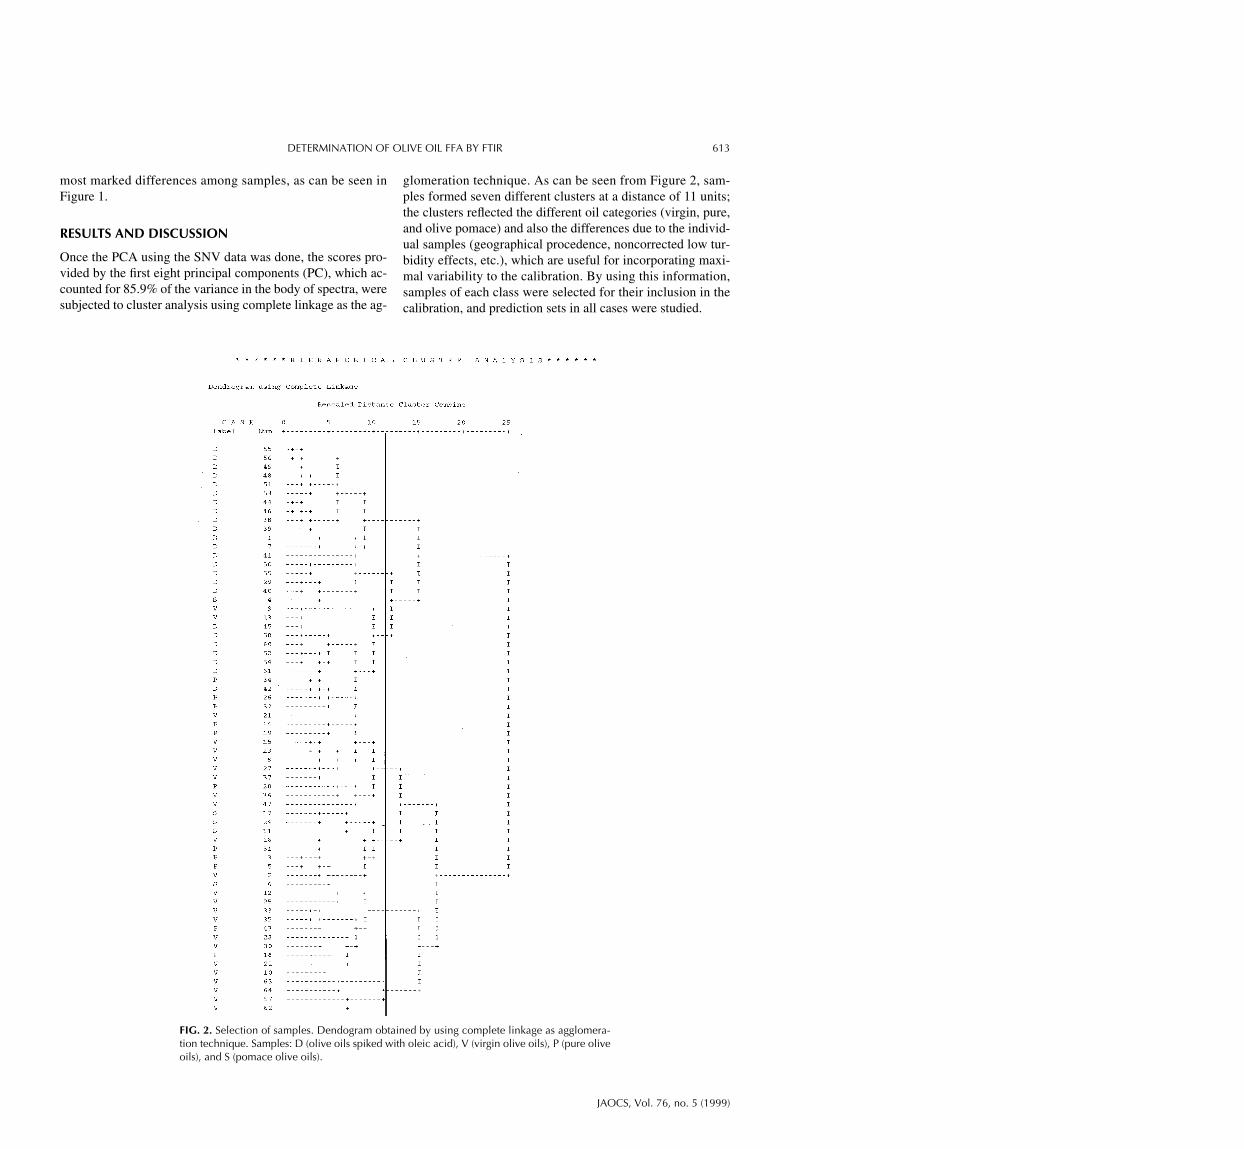
Once the PCA using the SNV data was done, the scores pro-vided by the first eight principal components (PC), which ac-counted for 85.9% of the variance in the body of spectra, weresubjected to cluster analysis using complete linkage as the ag-
glomeration technique. As can be seen from Figure 2, sam-ples formed seven different clusters at a distance of 11 units;the clusters reflected the different oil categories (virgin, pure,and olive pomace) and also the differences due to the individ-ual samples (geographical procedence, noncorrected low tur-bidity effects, etc.), which are useful for incorporating maxi-mal variability to the calibration. By using this information,samples of each class were selected for their inclusion in thecalibration, and prediction sets in all cases were studied.
DETERMINATION OF OLIVE OIL FFA BY FTIR 613
JAOCS, Vol. 76, no. 5 (1999)
FIG. 2. Selection of samples. Dendogram obtained by using complete linkage as agglomera-tion technique. Samples: D (olive oils spiked with oleic acid), V (virgin olive oils), P (pure oliveoils), and S (pomace olive oils).
From the clusters of the obtained dendrogram, a calibra-tion set C1 consisting of 37 samples was constructed with 16virgin oil, 17 pure, and 4 pomace olive oil samples. They uni-formly spanned the FFA range from 0.1 to 2.12%. In the sameway, the prediction set P1 was selected consisting of 22 sam-ples. This set was used to assess the predictive capacity of thedifferent calibration models and compare the results providedby the different spectral modes and wavenumber ranges.
Table 1 gives the RMSE for sets C1 (RMSEC1) and P1(RMSEP1) in the wavenumber ranges studied. As can beseen, prediction errors were, in general, much greater thancalibration errors, thus suggesting that the models were over-fitted. Inclusion of the 1480–1050 cm−1 range increased theerror for the prediction set because absorption by other prod-ucts present in the sample caused spectral changes similar tothose produced by FFA. For this reason it was not recom-mended to include this range in this and next models.
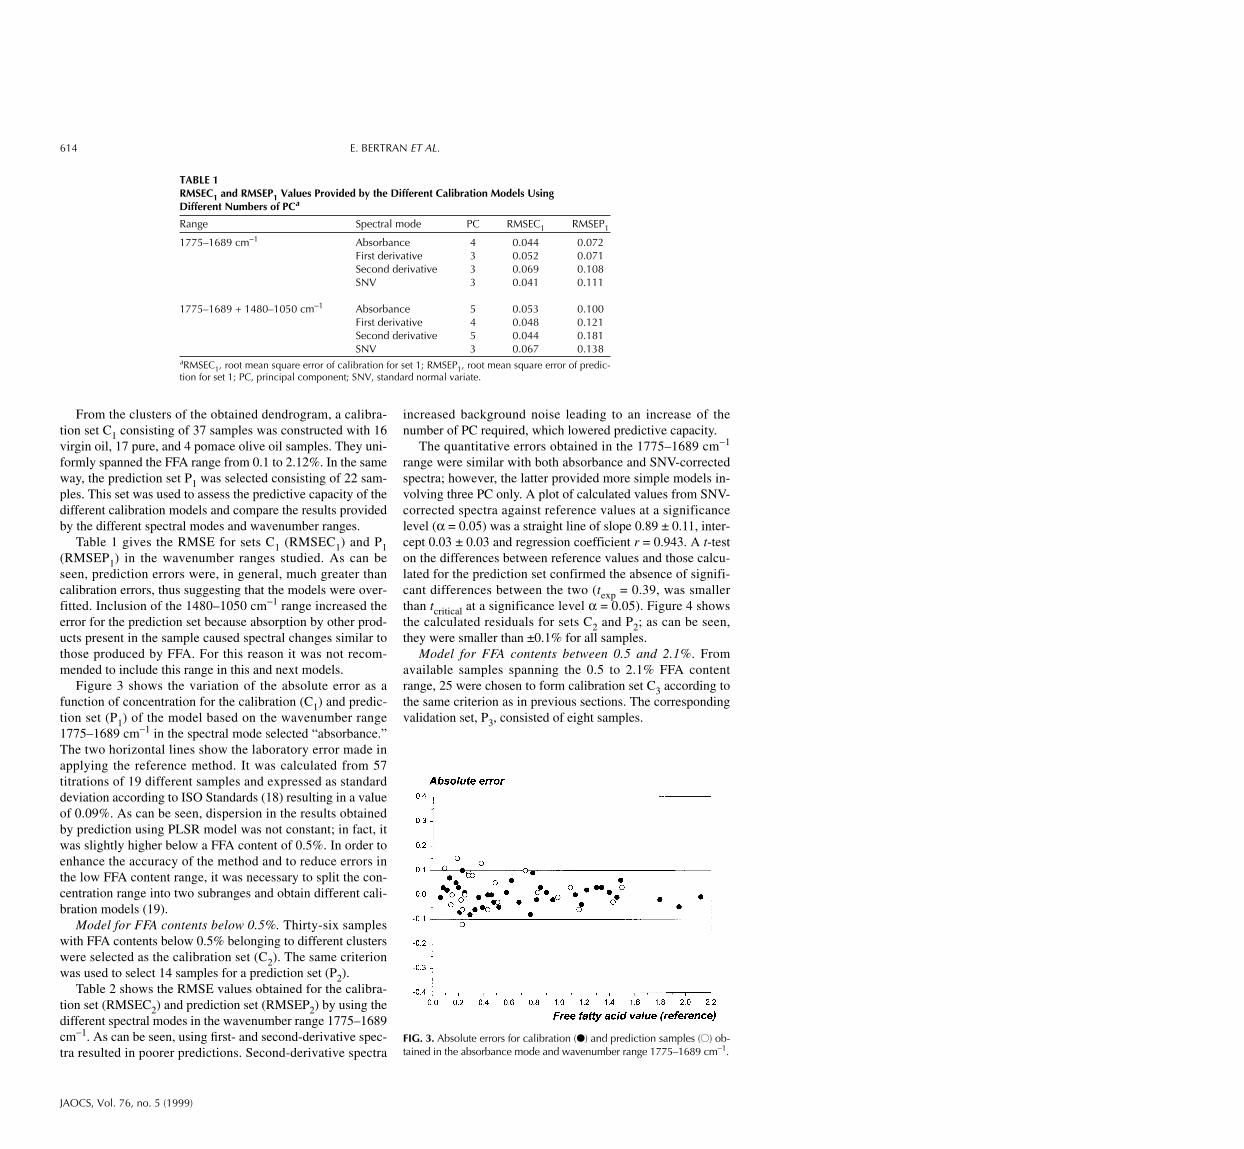
Figure 3 shows the variation of the absolute error as afunction of concentration for the calibration (C1) and predic-tion set (P1) of the model based on the wavenumber range1775–1689 cm−1 in the spectral mode selected “absorbance.”The two horizontal lines show the laboratory error made inapplying the reference method. It was calculated from 57titrations of 19 different samples and expressed as standarddeviation according to ISO Standards (18) resulting in a valueof 0.09%. As can be seen, dispersion in the results obtainedby prediction using PLSR model was not constant; in fact, itwas slightly higher below a FFA content of 0.5%. In order toenhance the accuracy of the method and to reduce errors inthe low FFA content range, it was necessary to split the con-centration range into two subranges and obtain different cali-bration models (19).
Model for FFA contents below 0.5%. Thirty-six sampleswith FFA contents below 0.5% belonging to different clusterswere selected as the calibration set (C2). The same criterionwas used to select 14 samples for a prediction set (P2).
Table 2 shows the RMSE values obtained for the calibra-tion set (RMSEC2) and prediction set (RMSEP2) by using thedifferent spectral modes in the wavenumber range 1775–1689cm−1. As can be seen, using first- and second-derivative spec-tra resulted in poorer predictions. Second-derivative spectra
increased background noise leading to an increase of thenumber of PC required, which lowered predictive capacity.
The quantitative errors obtained in the 1775–1689 cm−1
range were similar with both absorbance and SNV-correctedspectra; however, the latter provided more simple models in-volving three PC only. A plot of calculated values from SNV-corrected spectra against reference values at a significancelevel (α = 0.05) was a straight line of slope 0.89 ± 0.11, inter-cept 0.03 ± 0.03 and regression coefficient r = 0.943. A t-teston the differences between reference values and those calcu-lated for the prediction set confirmed the absence of signifi-cant differences between the two (texp = 0.39, was smallerthan tcritical at a significance level α = 0.05). Figure 4 showsthe calculated residuals for sets C2 and P2; as can be seen,they were smaller than ±0.1% for all samples.
Model for FFA contents between 0.5 and 2.1%. Fromavailable samples spanning the 0.5 to 2.1% FFA contentrange, 25 were chosen to form calibration set C3 according tothe same criterion as in previous sections. The correspondingvalidation set, P3, consisted of eight samples.
614 E. BERTRAN ET AL.
JAOCS, Vol. 76, no. 5 (1999)
TABLE 1RMSEC1 and RMSEP1 Values Provided by the Different Calibration Models UsingDifferent Numbers of PCa
Range Spectral mode PC RMSEC1 RMSEP1
1775–1689 cm−1 Absorbance 4 0.044 0.072First derivative 3 0.052 0.071Second derivative 3 0.069 0.108SNV 3 0.041 0.111
1775–1689 + 1480–1050 cm−1 Absorbance 5 0.053 0.100First derivative 4 0.048 0.121Second derivative 5 0.044 0.181SNV 3 0.067 0.138
aRMSEC1, root mean square error of calibration for set 1; RMSEP1, root mean square error of predic-tion for set 1; PC, principal component; SNV, standard normal variate.
FIG. 3. Absolute errors for calibration (●) and prediction samples (●●) ob-tained in the absorbance mode and wavenumber range 1775–1689 cm−1.
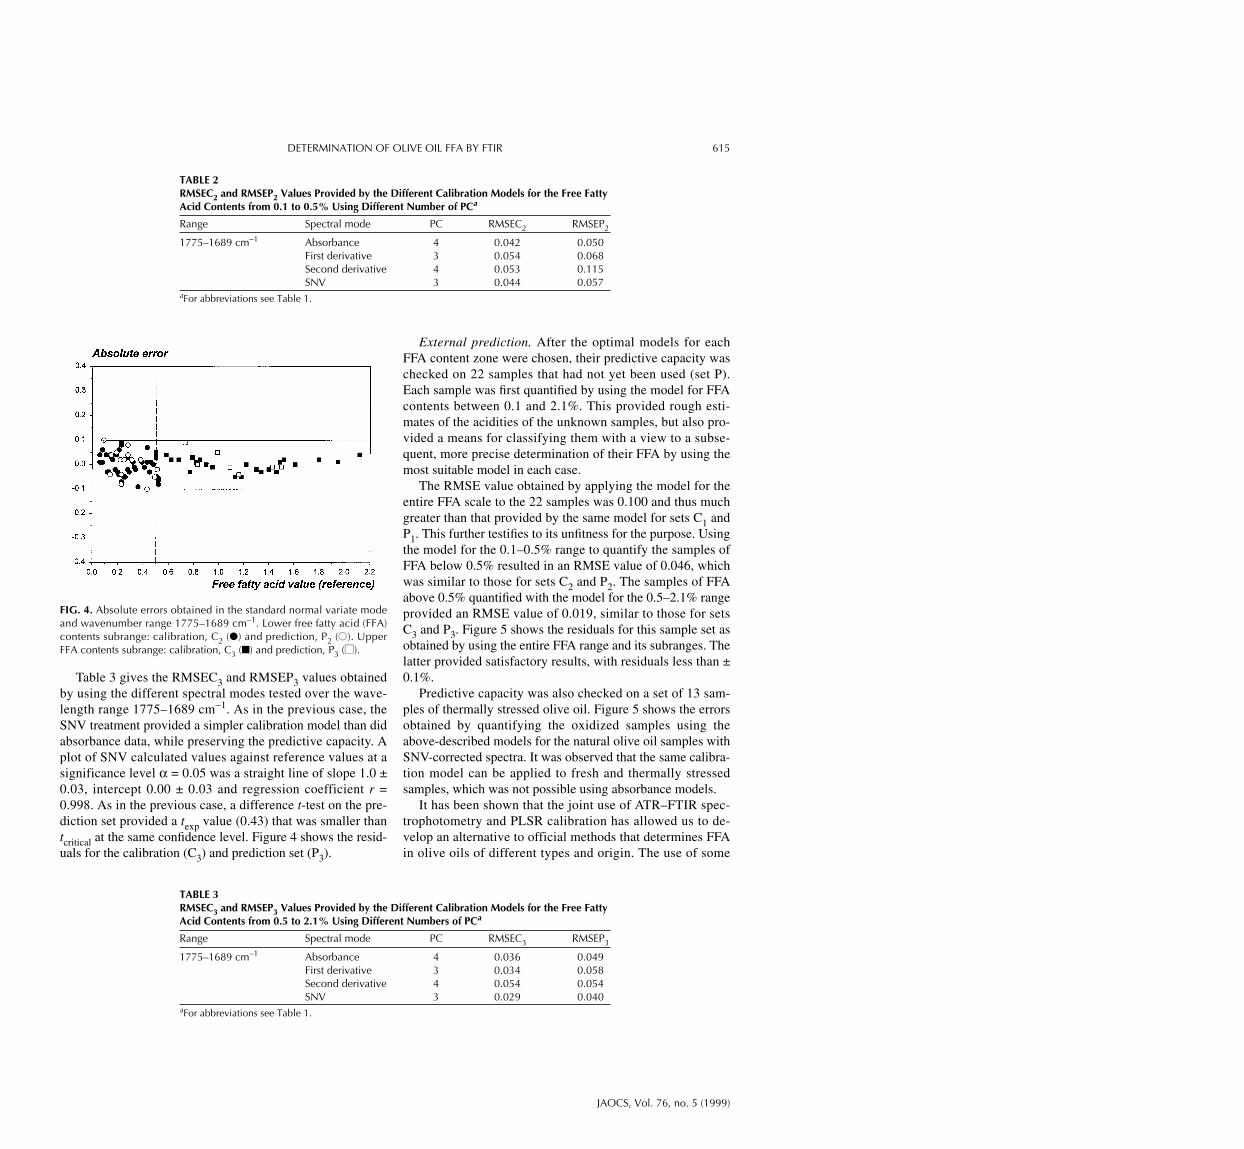
Table 3 gives the RMSEC3 and RMSEP3 values obtainedby using the different spectral modes tested over the wave-length range 1775–1689 cm−1. As in the previous case, theSNV treatment provided a simpler calibration model than didabsorbance data, while preserving the predictive capacity. Aplot of SNV calculated values against reference values at asignificance level α = 0.05 was a straight line of slope 1.0 ±0.03, intercept 0.00 ± 0.03 and regression coefficient r =0.998. As in the previous case, a difference t-test on the pre-diction set provided a texp value (0.43) that was smaller thantcritical at the same confidence level. Figure 4 shows the resid-uals for the calibration (C3) and prediction set (P3).
External prediction. After the optimal models for eachFFA content zone were chosen, their predictive capacity waschecked on 22 samples that had not yet been used (set P).Each sample was first quantified by using the model for FFAcontents between 0.1 and 2.1%. This provided rough esti-mates of the acidities of the unknown samples, but also pro-vided a means for classifying them with a view to a subse-quent, more precise determination of their FFA by using themost suitable model in each case.
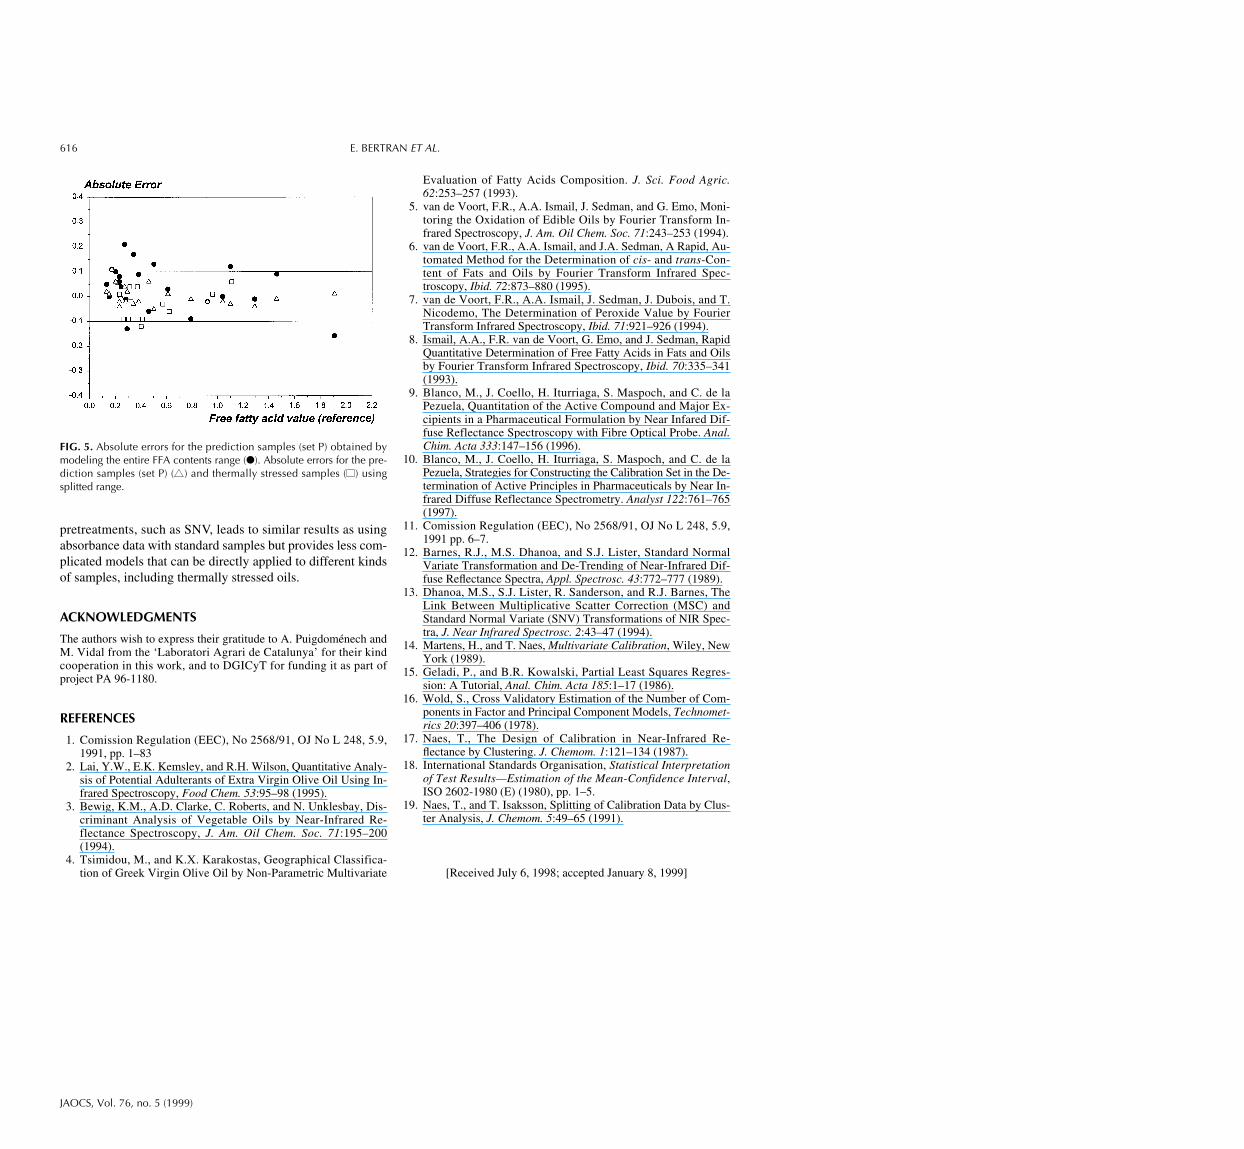
The RMSE value obtained by applying the model for theentire FFA scale to the 22 samples was 0.100 and thus muchgreater than that provided by the same model for sets C1 andP1. This further testifies to its unfitness for the purpose. Usingthe model for the 0.1–0.5% range to quantify the samples ofFFA below 0.5% resulted in an RMSE value of 0.046, whichwas similar to those for sets C2 and P2. The samples of FFAabove 0.5% quantified with the model for the 0.5–2.1% rangeprovided an RMSE value of 0.019, similar to those for setsC3 and P3. Figure 5 shows the residuals for this sample set asobtained by using the entire FFA range and its subranges. Thelatter provided satisfactory results, with residuals less than ±0.1%.
Predictive capacity was also checked on a set of 13 sam-ples of thermally stressed olive oil. Figure 5 shows the errorsobtained by quantifying the oxidized samples using theabove-described models for the natural olive oil samples withSNV-corrected spectra. It was observed that the same calibra-tion model can be applied to fresh and thermally stressedsamples, which was not possible using absorbance models.
It has been shown that the joint use of ATR–FTIR spec-trophotometry and PLSR calibration has allowed us to de-velop an alternative to official methods that determines FFAin olive oils of different types and origin. The use of some
DETERMINATION OF OLIVE OIL FFA BY FTIR 615
JAOCS, Vol. 76, no. 5 (1999)
TABLE 2RMSEC2 and RMSEP2 Values Provided by the Different Calibration Models for the Free FattyAcid Contents from 0.1 to 0.5% Using Different Number of PCa
Range Spectral mode PC RMSEC2 RMSEP2
1775–1689 cm−1 Absorbance 4 0.042 0.050First derivative 3 0.054 0.068Second derivative 4 0.053 0.115SNV 3 0.044 0.057
aFor abbreviations see Table 1.
FIG. 4. Absolute errors obtained in the standard normal variate modeand wavenumber range 1775–1689 cm−1. Lower free fatty acid (FFA)contents subrange: calibration, C2 (●) and prediction, P2 (●●). UpperFFA contents subrange: calibration, C3 (■) and prediction, P3 (■■).
TABLE 3RMSEC3 and RMSEP3 Values Provided by the Different Calibration Models for the Free FattyAcid Contents from 0.5 to 2.1% Using Different Numbers of PCa
Range Spectral mode PC RMSEC3 RMSEP3
1775–1689 cm−1 Absorbance 4 0.036 0.049First derivative 3 0.034 0.058Second derivative 4 0.054 0.054SNV 3 0.029 0.040
aFor abbreviations see Table 1.
pretreatments, such as SNV, leads to similar results as usingabsorbance data with standard samples but provides less com-plicated models that can be directly applied to different kindsof samples, including thermally stressed oils.
ACKNOWLEDGMENTS
The authors wish to express their gratitude to A. Puigdoménech andM. Vidal from the ‘Laboratori Agrari de Catalunya’ for their kindcooperation in this work, and to DGICyT for funding it as part ofproject PA 96-1180.
REFERENCES
1. Comission Regulation (EEC), No 2568/91, OJ No L 248, 5.9,1991, pp. 1–83
2. Lai, Y.W., E.K. Kemsley, and R.H. Wilson, Quantitative Analy-sis of Potential Adulterants of Extra Virgin Olive Oil Using In-frared Spectroscopy, Food Chem. 53:95–98 (1995).
3. Bewig, K.M., A.D. Clarke, C. Roberts, and N. Unklesbay, Dis-criminant Analysis of Vegetable Oils by Near-Infrared Re-flectance Spectroscopy, J. Am. Oil Chem. Soc. 71:195–200(1994).
4. Tsimidou, M., and K.X. Karakostas, Geographical Classifica-tion of Greek Virgin Olive Oil by Non-Parametric Multivariate
Evaluation of Fatty Acids Composition. J. Sci. Food Agric.62:253–257 (1993).
5. van de Voort, F.R., A.A. Ismail, J. Sedman, and G. Emo, Moni-toring the Oxidation of Edible Oils by Fourier Transform In-frared Spectroscopy, J. Am. Oil Chem. Soc. 71:243–253 (1994).
6. van de Voort, F.R., A.A. Ismail, and J.A. Sedman, A Rapid, Au-tomated Method for the Determination of cis- and trans-Con-tent of Fats and Oils by Fourier Transform Infrared Spec-troscopy, Ibid. 72:873–880 (1995).
7. van de Voort, F.R., A.A. Ismail, J. Sedman, J. Dubois, and T.Nicodemo, The Determination of Peroxide Value by FourierTransform Infrared Spectroscopy, Ibid. 71:921–926 (1994).
8. Ismail, A.A., F.R. van de Voort, G. Emo, and J. Sedman, RapidQuantitative Determination of Free Fatty Acids in Fats and Oilsby Fourier Transform Infrared Spectroscopy, Ibid. 70:335–341(1993).
9. Blanco, M., J. Coello, H. Iturriaga, S. Maspoch, and C. de laPezuela, Quantitation of the Active Compound and Major Ex-cipients in a Pharmaceutical Formulation by Near Infared Dif-fuse Reflectance Spectroscopy with Fibre Optical Probe. Anal.Chim. Acta 333:147–156 (1996).
10. Blanco, M., J. Coello, H. Iturriaga, S. Maspoch, and C. de laPezuela, Strategies for Constructing the Calibration Set in the De-termination of Active Principles in Pharmaceuticals by Near In-frared Diffuse Reflectance Spectrometry. Analyst 122:761–765(1997).
11. Comission Regulation (EEC), No 2568/91, OJ No L 248, 5.9,1991 pp. 6–7.
12. Barnes, R.J., M.S. Dhanoa, and S.J. Lister, Standard NormalVariate Transformation and De-Trending of Near-Infrared Dif-fuse Reflectance Spectra, Appl. Spectrosc. 43:772–777 (1989).
13. Dhanoa, M.S., S.J. Lister, R. Sanderson, and R.J. Barnes, TheLink Between Multiplicative Scatter Correction (MSC) andStandard Normal Variate (SNV) Transformations of NIR Spec-tra, J. Near Infrared Spectrosc. 2:43–47 (1994).
14. Martens, H., and T. Naes, Multivariate Calibration, Wiley, NewYork (1989).
15. Geladi, P., and B.R. Kowalski, Partial Least Squares Regres-sion: A Tutorial, Anal. Chim. Acta 185:1–17 (1986).
16. Wold, S., Cross Validatory Estimation of the Number of Com-ponents in Factor and Principal Component Models, Technomet-rics 20:397–406 (1978).
17. Naes, T., The Design of Calibration in Near-Infrared Re-flectance by Clustering. J. Chemom. 1:121–134 (1987).
18. International Standards Organisation, Statistical Interpretationof Test Results—Estimation of the Mean-Confidence Interval,ISO 2602-1980 (E) (1980), pp. 1–5.
19. Naes, T., and T. Isaksson, Splitting of Calibration Data by Clus-ter Analysis, J. Chemom. 5:49–65 (1991).
[Received July 6, 1998; accepted January 8, 1999]
616 E. BERTRAN ET AL.
JAOCS, Vol. 76, no. 5 (1999)
FIG. 5. Absolute errors for the prediction samples (set P) obtained bymodeling the entire FFA contents range (●). Absolute errors for the pre-diction samples (set P) (▲▲) and thermally stressed samples (■■) usingsplitted range.
Copyright © 2022 FDOKUMEN