Determination of liver-specific r 2 * of a highly monodisperse USPIO by 59 Fe iron core-labeling in...
10
Determination of liver-specific r 2 * of a highly monodisperse USPIO by 59 Fe iron core-labeling in mice at 3 T MRI Nina Raabe a *, Evelyn Forberich a , Barbara Freund a , Oliver T. Bruns c , Markus Heine d , Michael G. Kaul a , Ulrich Tromsdorf e , Lena Herich f , Peter Nielsen b , Rudolph Reimer c , Heinrich Hohenberg d , Horst Weller e , U. Schumacher d , Gerhard Adam a and Harald Ittrich a Accurate determination of tissue concentration of ultrasmall superparamagnetic iron oxide nanoparticles (USPIO) using T 2 * MR relaxometry is still challenging. We present a reliable quantification method for local USPIO amount with the estimation of the liver specific relaxivity r 2 * using monodisperse 59 Fe-core-labeled USPIO ( 59 FeUSPIO). Dynamic and relaxometric in vivo characteristics of unlabeled monodisperse USPIO were determined in MRI at 3 T. The in vivo MR studies were performed for liver tissue with 59 FeUSPIO using iron dosages of 9 (n= 3), 18 (n= 2) and 27 (n= 3) μmol Fe kg 1 body weight. The R 2 * of the liver before and after USPIO injection (ΔR 2 *) was measured and correlated with 59 Fe activity measurements of excised organs by a whole body radioactivity counter (HAMCO) to define the dependency of ΔR 2 * and 59 FeUSPIO liver concentration and calculate the r 2 * of 59 FeUSPIO for the liver. Ultrastructural analysis of liver uptake was performed by histology and transmission elec- tron microscopy. ΔR 2 * of the liver revealed a dosage-dependent accumulation of 59 FeUSPIO with a percentage up- take of 70–88% of the injection dose. Hepatic ΔR 2 * showed a dose-dependent linear correlation to 59 FeUSPIO activity measurements (r= 0.92) and an r 2 * in the liver of 481 ± 74.9 mM 1 s 1 in comparison to an in vitro r 2 * of 60.5 ± 3.3 mM 1 s 1 . Our results indicate that core-labeled 59 FeUSPIO can be used to quantify the local amount of USPIO and to estimate the liver-specific relaxivity r 2 *. Copyright © 2014 John Wiley & Sons, Ltd. Additional supporting information may be found in the online version of this article at the publisher’s web site. Keywords: USPIO; relaxometry; 3T MRI; quantification; animal study 1. INTRODUCTION Superparamagnetic iron oxide nanoparticles (SPIO) have been used as a magnetic resonance (MR) contrast agent for several years. The iron oxide core provides the particles with a high mag- netic moment, generating microscopic magnetic stray field lines when they are exposed to an external magnetic field (1). Those strong susceptibility effects shorten the spin–spin (T 2 and T 2 *) or to a lesser extent the spin–lattice relaxation time (T1) of adja- cent water molecules (1–3). Normally, SPIO are nonspecifically phagocytized by cells of the reticulo-endothelial system (4,5), a finding that led to the main clinical use of SPIO for the detection of liver lesions, since the signal decrease by the SPIO uptake of Kupffer cells improves the contrast between liver lesions (e.g. malignancies) and normal liver parenchyma (4). However, since their initial development, many trials for further and more spe- cific applications have been proposed, including the detection of cancer (6,7), inflammation (8,9), atherosclerosis (10,11) and cell tracking (12–14). Since the development of target-specific contrast agents has become more widespread, it is of utmost importance to charac- terize those particles for future in vivo application. Such a precise characterization is not only important for the development of target specific nanoparticles but is also of major interest in the * Correspondence to: Nina Raabe, Department of Diagnostic and Interventional Radiology, University Medical Centre Hamburg-Eppendorf, Hamburg, Germany. E-mail: [email protected] a N. Raabe, E. Forberich, B. Freund, M. G. Kaul, G. Adam, H. Ittrich Department of Diagnostic and Interventional Radiology, University Medical Centre Hamburg-Eppendorf, Hamburg, Germany b P. Nielsen Department of Biochemistry and Molecular Biology II, University Medical Centre Hamburg-Eppendorf, Hamburg, Germany c O. T. Bruns, R. Reimer Heinrich-Pette-Institute for Experimental Virology and Immunology of the University of Hamburg, Hamburg, Germany d M. Heine, H. Hohenberg, U. Schumacher Department of Anatomy II: Experimental Morphology, University Medical Centre Hamburg-Eppendorf, Hamburg, Germany e U. Tromsdorf, H. Weller Institute of Physical Chemistry, University Hamburg, Hamburg, Germany f L. Herich Department of Medical Biometry and Epidemiology, University Medical Centre Hamburg-Eppendorf, Hamburg, Germany Full Paper Received: 3 June 2013, Revised: 30 April 2014, Accepted: 25 May 2014, Published online in Wiley Online Library (wileyonlinelibrary.com) DOI: 10.1002/cmmi.1612 Contrast Media Mol. Imaging (2014) Copyright © 2014 John Wiley & Sons, Ltd. 1
Transcript of Determination of liver-specific r 2 * of a highly monodisperse USPIO by 59 Fe iron core-labeling in...
Determination of liver-specific r2* of a highlymonodisperse USPIO by 59Fe iron core-labelingin mice at 3 T MRINina Raabea*, Evelyn Forbericha, Barbara Freunda, Oliver T. Brunsc,Markus Heined, Michael G. Kaula, Ulrich Tromsdorfe, Lena Herichf,Peter Nielsenb, Rudolph Reimerc, Heinrich Hohenbergd, Horst Wellere,U. Schumacherd, Gerhard Adama and Harald Ittricha
Accurate determination of tissue concentration of ultrasmall superparamagnetic iron oxide nanoparticles (USPIO)using T2* MR relaxometry is still challenging. We present a reliable quantification method for local USPIO amountwith the estimation of the liver specific relaxivity r2* using monodisperse 59Fe-core-labeled USPIO (59FeUSPIO).Dynamic and relaxometric in vivo characteristics of unlabeled monodisperse USPIO were determined in MRI at3 T. The in vivo MR studies were performed for liver tissue with 59FeUSPIO using iron dosages of 9 (n= 3),18 (n= 2) and 27 (n=3) μmol Fe kg�1 body weight. The R2* of the liver before and after USPIO injection (ΔR2*)was measured and correlated with 59Fe activity measurements of excised organs by a whole body radioactivitycounter (HAMCO) to define the dependency of ΔR2* and 59FeUSPIO liver concentration and calculate the r2* of59FeUSPIO for the liver. Ultrastructural analysis of liver uptake was performed by histology and transmission elec-tron microscopy. ΔR2* of the liver revealed a dosage-dependent accumulation of 59FeUSPIO with a percentage up-take of 70–88% of the injection dose. Hepatic ΔR2* showed a dose-dependent linear correlation to 59FeUSPIO activitymeasurements (r =0.92) and an r2* in the liver of 481±74.9 mM
�1 s�1 in comparison to an in vitro r2* of 60.5±3.3mM
�1 s�1. Our results indicate that core-labeled 59FeUSPIO can be used to quantify the local amount of USPIO and toestimate the liver-specific relaxivity r2*. Copyright © 2014 John Wiley & Sons, Ltd.Additional supporting information may be found in the online version of this article at the publisher’s web site.
Keywords: USPIO; relaxometry; 3T MRI; quantification; animal study
1. INTRODUCTION
Superparamagnetic iron oxide nanoparticles (SPIO) have beenused as a magnetic resonance (MR) contrast agent for severalyears. The iron oxide core provides the particles with a high mag-netic moment, generating microscopic magnetic stray field lineswhen they are exposed to an external magnetic field (1). Thosestrong susceptibility effects shorten the spin–spin (T2 and T2*)or to a lesser extent the spin–lattice relaxation time (T1) of adja-cent water molecules (1–3). Normally, SPIO are nonspecificallyphagocytized by cells of the reticulo-endothelial system (4,5), afinding that led to the main clinical use of SPIO for the detectionof liver lesions, since the signal decrease by the SPIO uptake ofKupffer cells improves the contrast between liver lesions (e.g.malignancies) and normal liver parenchyma (4). However, sincetheir initial development, many trials for further and more spe-cific applications have been proposed, including the detectionof cancer (6,7), inflammation (8,9), atherosclerosis (10,11) and celltracking (12–14).Since the development of target-specific contrast agents has
become more widespread, it is of utmost importance to charac-terize those particles for future in vivo application. Such a precisecharacterization is not only important for the development oftarget specific nanoparticles but is also of major interest in the
* Correspondence to: Nina Raabe, Department of Diagnostic and InterventionalRadiology, University Medical Centre Hamburg-Eppendorf, Hamburg, Germany.E-mail: [email protected]
a N. Raabe, E. Forberich, B. Freund, M. G. Kaul, G. Adam, H. IttrichDepartment of Diagnostic and Interventional Radiology, University MedicalCentre Hamburg-Eppendorf, Hamburg, Germany
b P. NielsenDepartment of Biochemistry and Molecular Biology II, University MedicalCentre Hamburg-Eppendorf, Hamburg, Germany
c O. T. Bruns, R. ReimerHeinrich-Pette-Institute for Experimental Virology and Immunology of theUniversity of Hamburg, Hamburg, Germany
d M. Heine, H. Hohenberg, U. SchumacherDepartment of Anatomy II: Experimental Morphology, University MedicalCentre Hamburg-Eppendorf, Hamburg, Germany
e U. Tromsdorf, H. WellerInstitute of Physical Chemistry, University Hamburg, Hamburg, Germany
f L. HerichDepartment of Medical Biometry and Epidemiology, University Medical CentreHamburg-Eppendorf, Hamburg, Germany
Full Paper
Received: 3 June 2013, Revised: 30 April 2014, Accepted: 25 May 2014, Published online in Wiley Online Library
(wileyonlinelibrary.com) DOI: 10.1002/cmmi.1612
Contrast Media Mol. Imaging (2014) Copyright © 2014 John Wiley & Sons, Ltd.
1
context of the implementation of new imaging methods, forexample, the magnetic particle imaging (MPI).
This MPI has the potential to directly quantify informationabout temporal and spatial resolution in combination with ahigh sensitivity but it is still unclear whether the numerous avail-able (U)SPIO constructs/conjugates can fulfil the requirementsfor a successful use in the MPI. Since MPI is supposed to providequantifiable data it is of utmost importance to have comparabledata of the used particles, which can be provided by the presentmethod of quantification of local amounts of USPIO.
While many trials for quantification of the (U)SPIO load in tis-sue have been performed, none of them is appropriate for a re-liable and noninvasive procedure in vivo (8,15–20). There aremany sources of systematic errors. One potential problem canbe the polydisperse nature of (U)SPIO solutions since they con-tain many subfractions with various biodistributions and bloodhalf-times, turning into a heterogeneous mixture of intracellular,circulating and already degraded (U)SPIO, making the definitionof a timepoint for reliable and repetitive quantification measure-ments difficult. To avoid this systematic error we have used ahighly monodisperse (U)SPIO probe (homogeneous core size,singular particles) with precise physicochemical and pharmaco-dynamic characteristics and defined in vitro and in vivo charac-teristics. Nevertheless there are of course many other sourcesof potential errors such as static field inhomogenities throughheterogeneous tissue composition, for example, fibrosis and,natural iron stores (2), as well as possible technical sources of sys-tematic errors for quantification of R2*, such as an overestimationof R2* caused by macroscopic B0 inhomogenities (21).
One essential requirement for a reliable determination of tissue-specific relaxivities is the exact determination of the local amountof (U)SPIO. Unfortunately most laboratory iron measurementdevices can not differentiate between the administered iron ((U)SPIO) and the endogenous iron pool so that a co-labeling isneeded for any quantification. Some studies have already shownthat co-labeling of iron oxide particles with a radioactive tracer ispossible (22–26). Thereby the labeling of the iron core instead ofthe shell is favored to insure the relationship between MR signalchange owing to accumulated particles and measured activity.The novelty of our approach is thereby the determination ofliver-specific r2* using a high-grade monodisperse particle with ahigh cristallinity in combination with 59Fe core-labeling.
2. RESULTS
2.1. MR Dynamic Measurements
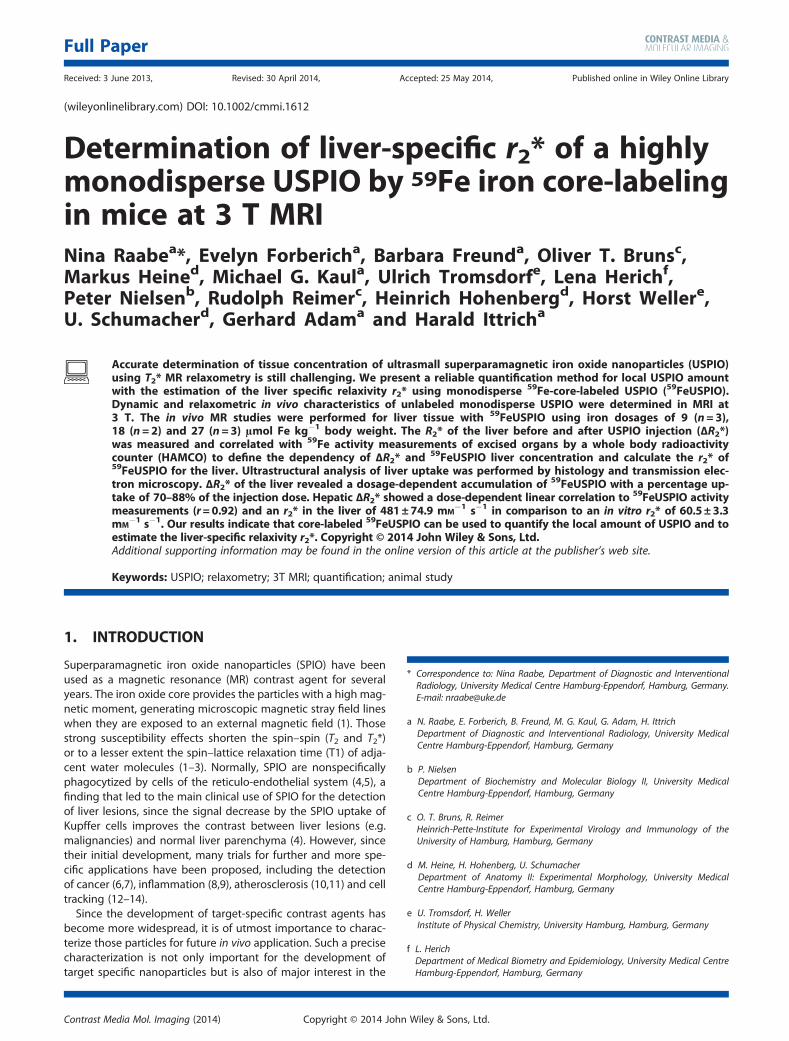
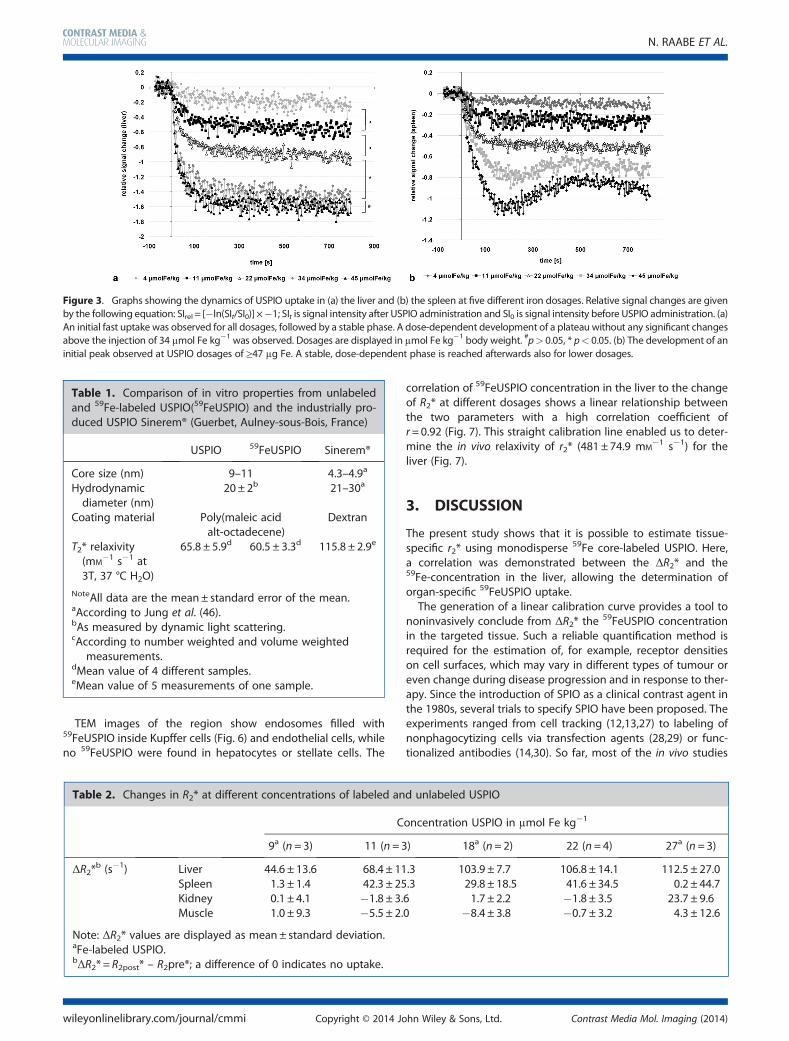
Dynamic susceptibility contrast (DSC) measurements showed anorgan-specific distribution of USPIO (Fig. 1). While the highestsignal decrease was observed in liver and spleen (Fig. 1a), no sig-nal change was detected in kidneys and muscle (Fig. 1b). An ini-tial perfusion peak in the inferior cava vena was observed at thetime of injection for all USPIO concentrations used, serving as acontrol for successful intravascular injection (Fig. 1a). Visual in-spection of MR images showed a homogenous USPIO distribu-tion in liver and spleen (Fig. 2). The observed signal intensity inthe liver revealed a rapid signal drop immediately after the intra-venous injection of USPIO followed by the formation of a stablephase for all tested iron concentrations (Fig. 1a, 3a). The kineticsof USPIO accumulation in the spleen also showed a concentra-tion-dependent development of a stable phase after a fast signaldecrease (Fig. 3b). Additionally, from the injection of ≥34 μmolFe kg�1, an initial peak was observed before the stable phasewas formed (Fig. 3b).The last 100 measurements (last 4.9 min) of the stable phase
of different dosages were compared to evaluate the relationshipbetween the relative signal change and the injected iron dose inthe liver. A significant difference between the dosages wasfound (p< 0.001). Post-tests revealed relevant differencesbetween 4 and 11 μmol Fe kg�1, 11 and 22 μmol Fe kg�1 and 22and 34 μmol Fe kg�1 (p< 0.05). The signal decrease did not signif-icantly change above the injection of 34 μmol Fe kg�1(Fig. 3a).The last 100 measurements of the spleen were not compared
with each other, since a tendency toward a late second signaldecrease at the end of the stable phase at high USPIO concentra-tions was observed (Fig. 3b).
2.2. Relaxometric Measurements (R2*)
Unlabeled and labeled USPIO did not substantially deviate in theirin vitro characteristics (Table 1, Supporting Information, Fig. 9). Adose-dependent and homogeneous R2* increase after the injectionof USPIO was detected in the liver. However, this concentration-dependent change was only measured up to 22 μmol Fe kg�1 withno further increase at higher USPIO concentrations.
Figure 1. Mean values (n=4) of dynamic measurements of ultrasmall superparamagnetic iron oxide nanoparticles (USPIO) (22 μmol Fe kg�1) showparticle accumulation in (a) liver, spleen, inferior vena cava (IVC) and (b) in kidney and muscle. Highest USPIO uptake is seen in the liver, followedby the spleen (a). No significant uptake in kidneys or muscle (b). Relative signal change is given by the following equation: SIrel = [�ln(SIt/SI0)] ×�1;SIt is signal intensity after USPIO administration and SI0 is signal intensity before USPIO administration.
N. RAABE ET AL.
wileyonlinelibrary.com/journal/cmmi Copyright © 2014 John Wiley & Sons, Ltd. Contrast Media Mol. Imaging (2014)
2
The evaluation of relaxation rate changes in smaller organssuch as the spleen proved to be difficult owing to the small sizeand artifacts caused by physiologic organ movement, resultingin unreliable values. Since mice were not moved between pre-and post-contrast imaging, potential major sources of errorssuch as different region of interest (ROI) positioning or shimmingdifferences were negligible and the same for all measuredorgans. Nevertheless a homogeneous signal decrease wasobserved on visual inspection of MR images. Measurements ofR2* in kidney, muscle and inferior vena cava after the injectionof USPIO did not deviate substantially from R2* measured beforeUSPIO application.The injection of different 59FeUSPIO concentrations showed
comparable results to unlabeled USPIO for dynamic andrelaxometric measurements (Table 2). The long-term observationof R2* in the liver showed no significant changes for the firstweek of measurements and only a slowly decrease for a periodof 32 weeks without reaching the native data (see SupportingInformation, Fig. 10).
2.3. 59Fe Radiotracer Studies
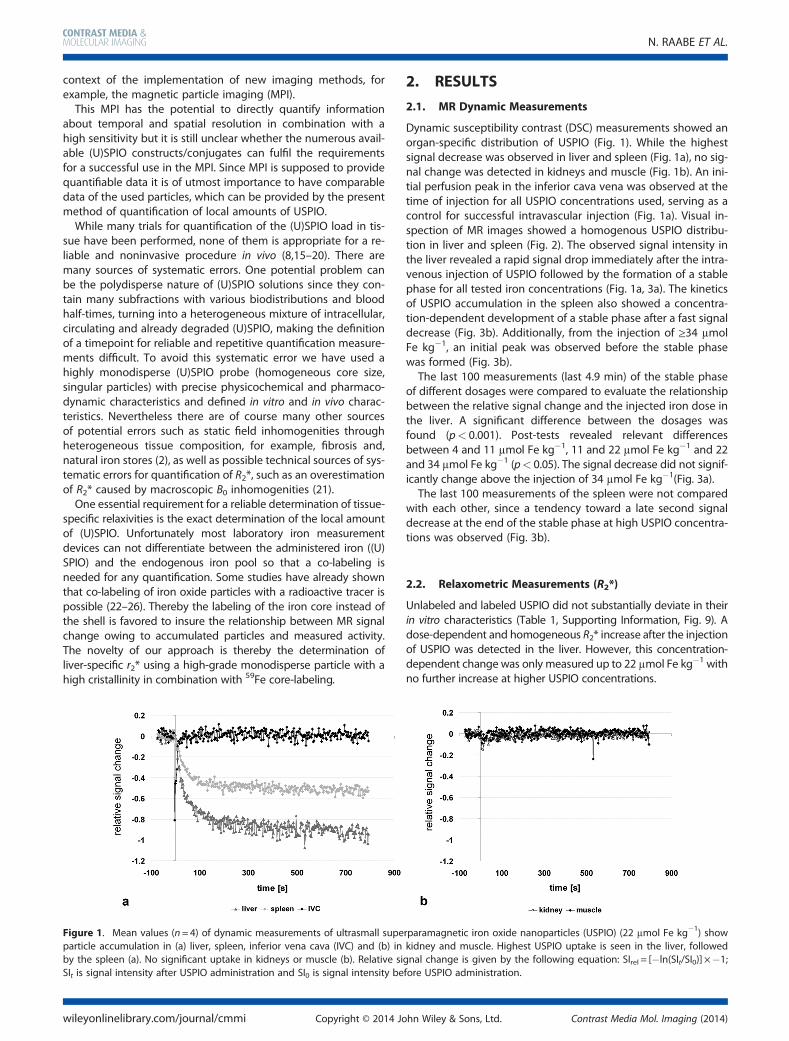
Values of ΔR2* for liver, spleen and muscle are displayed inTable 2. There was a dose-dependent signal decrease in the liver(Figs. 2a and 3a). The percentage 59FeUSPIO accumulation,referred to the injected dose, calculated by activity measure-ments on the Hamburg whole body counter (HAMCO), revealedan accumulation of 59FeUSPIO of 70–88% in the liver while therewas no significant difference between the injected dosages(Fig. 4). The 59FeUSPIO uptake in the spleen was much lower(0.7–2%) and the activity measurements in the other organs(kidneys, muscle, lungs and brain) were negligible (Fig. 4a).
The calculation of 59FeUSPIO adjusted to the weight of liverand spleen showed a concentration-dependent particle uptake(Fig. 4b). Prussian blue staining and transmission electronmicroscope (TEM) images indicate the intracellular uptake of59FeUSPIO (Figs. 5 and 6). Stained iron can be detected in cellsadjacent to the liver sinusoids on histology examinations(Fig. 5).
Figure 2. T2*-weighted (left) images and corresponding relaxometric maps(right) and ΔT2* maps (bottom row) of (a) the liver (l) and (b) the spleen (s) andkidneys (k) before (pre) and after (post) the application of different 59FeUSPIO concentrations (9, 18 and 27 μmol Fe kg�1). A concentration-dependent de-crease in T2* was detected in the liver. (b) There was no change in T2* in the kidneys. p, External control phantom with USPIO; ivc, inferior vena cava.
59FE CORE-LABELED USPIO FOR DETERMINATION OF LIVER-SPECIFIC R2*
Contrast Media Mol. Imaging (2014) Copyright © 2014 John Wiley & Sons, Ltd. wileyonlinelibrary.com/journal/cmmi
3
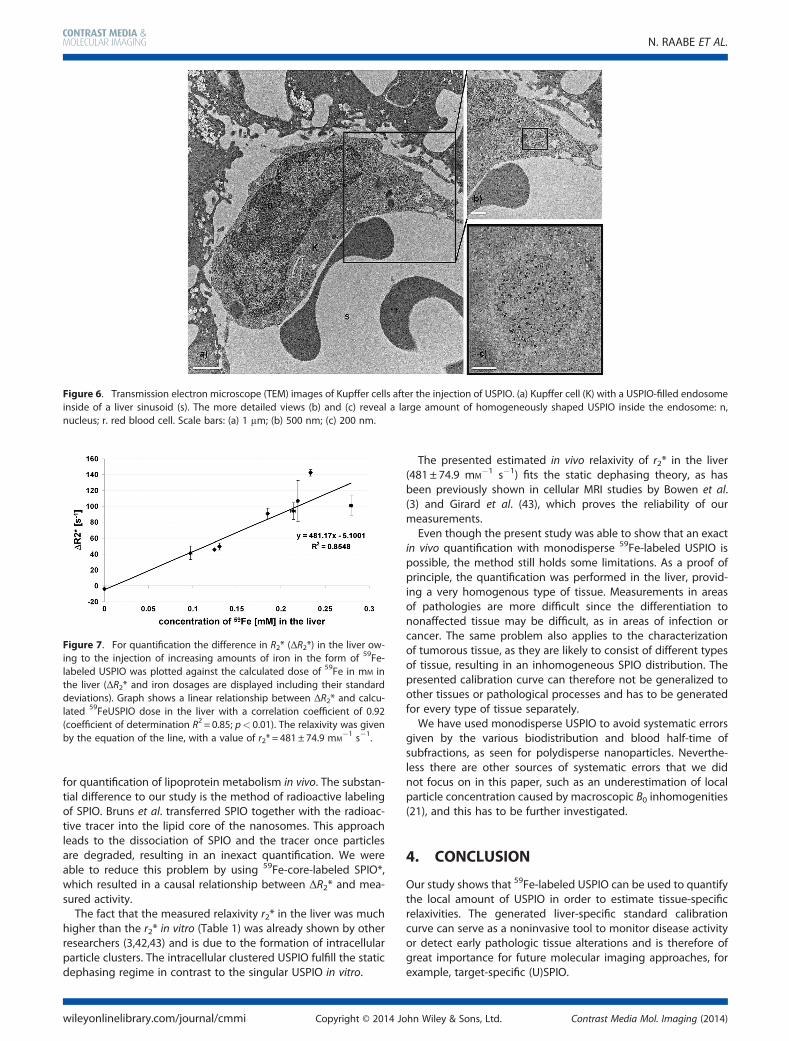
TEM images of the region show endosomes filled with59FeUSPIO inside Kupffer cells (Fig. 6) and endothelial cells, whileno 59FeUSPIO were found in hepatocytes or stellate cells. The
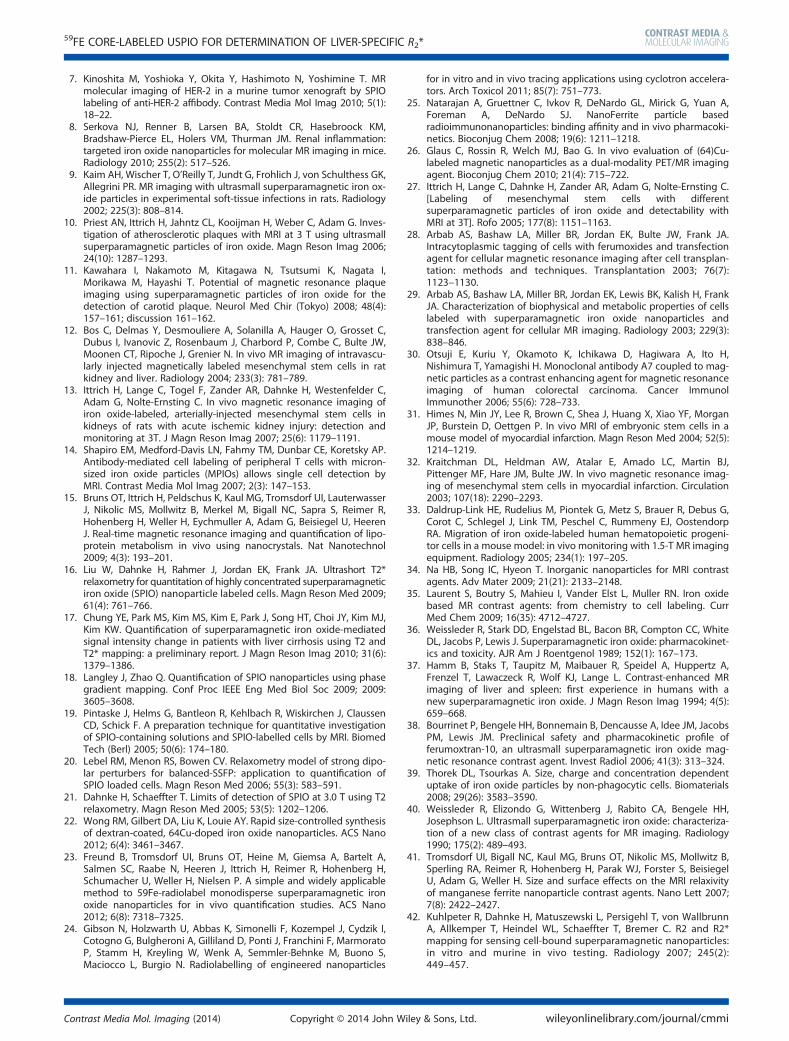
correlation of 59FeUSPIO concentration in the liver to the changeof R2* at different dosages shows a linear relationship betweenthe two parameters with a high correlation coefficient ofr = 0.92 (Fig. 7). This straight calibration line enabled us to deter-mine the in vivo relaxivity of r2* (481 ± 74.9 mM
�1 s�1) for theliver (Fig. 7).
3. DISCUSSION
The present study shows that it is possible to estimate tissue-specific r2* using monodisperse 59Fe core-labeled USPIO. Here,a correlation was demonstrated between the ΔR2* and the59Fe-concentration in the liver, allowing the determination oforgan-specific 59FeUSPIO uptake.The generation of a linear calibration curve provides a tool to
noninvasively conclude from ΔR2* the59FeUSPIO concentration
in the targeted tissue. Such a reliable quantification method isrequired for the estimation of, for example, receptor densitieson cell surfaces, which may vary in different types of tumour oreven change during disease progression and in response to ther-apy. Since the introduction of SPIO as a clinical contrast agent inthe 1980s, several trials to specify SPIO have been proposed. Theexperiments ranged from cell tracking (12,13,27) to labeling ofnonphagocytizing cells via transfection agents (28,29) or func-tionalized antibodies (14,30). So far, most of the in vivo studies
Figure 3. Graphs showing the dynamics of USPIO uptake in (a) the liver and (b) the spleen at five different iron dosages. Relative signal changes are givenby the following equation: SIrel = [�ln(SIt/SI0)] ×�1; SIt is signal intensity after USPIO administration and SI0 is signal intensity before USPIO administration. (a)An initial fast uptake was observed for all dosages, followed by a stable phase. A dose-dependent development of a plateau without any significant changesabove the injection of 34 μmol Fe kg�1 was observed. Dosages are displayed in μmol Fe kg�1 body weight. #p> 0.05, * p< 0.05. (b) The development of aninitial peak observed at USPIO dosages of ≥47 μg Fe. A stable, dose-dependent phase is reached afterwards also for lower dosages.
Table 1. Comparison of in vitro properties from unlabeledand 59Fe-labeled USPIO(59FeUSPIO) and the industrially pro-duced USPIO Sinerem® (Guerbet, Aulney-sous-Bois, France)
USPIO 59FeUSPIO Sinerem®
Core size (nm) 9–11 4.3–4.9a
Hydrodynamicdiameter (nm)
20 ± 2b 21–30a
Coating material Poly(maleic acidalt-octadecene)
Dextran
T2* relaxivity(mM
�1 s�1 at3T, 37 °C H2O)
65.8 ± 5.9d 60.5 ± 3.3d 115.8 ± 2.9e
NoteAll data are the mean± standard error of the mean.aAccording to Jung et al. (46).bAs measured by dynamic light scattering.cAccording to number weighted and volume weighted
measurements.dMean value of 4 different samples.eMean value of 5 measurements of one sample.
Table 2. Changes in R2* at different concentrations of labeled and unlabeled USPIO
Concentration USPIO in μmol Fe kg�1
9a (n= 3) 11 (n= 3) 18a (n= 2) 22 (n= 4) 27a (n= 3)
ΔR2*b (s�1) Liver 44.6 ± 13.6 68.4 ± 11.3 103.9 ± 7.7 106.8 ± 14.1 112.5 ± 27.0
Spleen 1.3 ± 1.4 42.3 ± 25.3 29.8 ± 18.5 41.6 ± 34.5 0.2 ± 44.7Kidney 0.1 ± 4.1 �1.8 ± 3.6 1.7 ± 2.2 �1.8 ± 3.5 23.7 ± 9.6Muscle 1.0 ± 9.3 �5.5 ± 2.0 �8.4 ± 3.8 �0.7 ± 3.2 4.3 ± 12.6
Note: ΔR2* values are displayed as mean± standard deviation.aFe-labeled USPIO.bΔR2* = R2post* – R2pre*; a difference of 0 indicates no uptake.
N. RAABE ET AL.
wileyonlinelibrary.com/journal/cmmi Copyright © 2014 John Wiley & Sons, Ltd. Contrast Media Mol. Imaging (2014)
4

showed qualitative or semi-quantitative evaluations of SPIOaccumulation in tissues. Reliable quantifications have only beenperformed for the in vivo tracking of progenitor and stem cellsor inflammatory cells (13,31–33). Here, cells were SPIO-labeledex vivo before administration with the advantage of known cellnumbers. From this knowledge a linear calibration curve forthe change of relaxation rates related to number and iron con-centration of cells was created. The quantification of intrave-nously injected SPIO is more difficult, since their accumulationprofile in different tissues is unknown. An additional problem isthe high endogenous iron pool, which cannot be differentiatedfrom the exogenously applied iron by regular laboratorymethods, for example, atomic absorption spectrometry. Anotherlimitation of previous quantification approaches is theSPIO themselves, since the commercially available SPIO/USPIO(e.g. Resovist®, Schering AG, Berlin, Germany; Endorem® andSinerem®, Guerbet, Aulney-sous-Bois, France) and most of theindustrially produced SPIO for preclinical experiments are onlyavailable in a clustered form. These polydisperse particles arethe potential source of systematic errors given by theirsubfractions with various in vivo characteristics, so that monodis-perse USPIO are favored for quantification approaches.Several quantification approaches have been performed with
the use of quantum dots (QD) (15) or special MRI sequences
(16,18–20), all of them holding some limitations. Experimentswith quantum dots or fluorescence dyes are invasive and havethe drawback of quenching or fast fading of fluorescence dye.The quantification of local USPIO amount only by MRI sequencesis difficult since the sequence development relies on theoreticalconsiderations and the determination of local particle concentra-tion can be challenging owing to possible particle agglomera-tion or opsonization with an increase of hydrodynamicdiameters (34,35).
The approach to label SPIO with 59Fe has been used previouslyfor the first studies on the in vivo distribution of Resovist®,Endorem® and Sinerem® (36–38). However, as far as we are con-cerned, no quantification approaches have been performed. Thelabeling of nanoparticles with 59Fe was first performed to de-scribe the kinetics and biodistribution of SPIO. The labeling with59Fe therefore does not change the magnetic properties sincethe electrons that determine the magnetic properties remainthe same and changes are only made in the nucleus of the (U)SPIO. Studies with 59Fe-ferumoxtran-10 (Sinerem®) detected thehighest percentage of injected dose (per gram of organ) in thespleen (50–60%), whereas the accumulation in the liver was only2% (38). A possible explanation for these striking differences incomparison to our results is the diverse coating of the particles.Even though both particles are USPIO, we already know thatin vivo kinetics of nanoparticles are not one-dimensionally de-pendent on size, but depend also on other characteristics, forexample, charge and coating (39–41). Studies on 59Fe-labeledferucarbotran revealed a biodistribution more comparable toour findings. These in vivo studies resulted in a percentage SPIO*accumulation of injected dose of around 80% in the liver and8–9% in the spleen (37). Weissleder et al. studied thebiodistribution of Endorem® by labeling the iron oxide corewith 59Fe, and activity measurements showed that 82 ± 0.26%of the injected dose accumulated in the liver and 6.2 ± 7.31% inthe spleen (36). Those results fit the findings of Hamm et al.(37) and those from our study. The high standard deviations inthe spleen as measured by Weissleder et al. (36) fit our findings,emphasizing the problem of in vivo measurements in smallorgans.
To the best of our knowledge there is only one other studythat performed quantification of SPIO biodistribution by compar-ing ΔR2* with activity measurements of radioactive labeled parti-cles (15). Bruns et al. (15) labeled nanosomes with QDs, SPIOsand SPIOs together with radioactive 3H-cholesteryl oleyl ether
Figure 4. (a) Percentage accumulation of 59FeUSPIO based on the activity measurements at HAMCO. Graphs show the 59FeUSPIO activity for liver,spleen, lung, kidney and muscle measured 1 h after intravenous injection by HAMCO. Organ uptake of 59Fe-USPIO was calculated as percentage ofinjected dose. Comparison of three different injected dosages shows the highest uptake of in the liver. (b) Calculated amount of 59Fe per gram for liverand spleen. Bars delineate the dose dependent uptake of 59FeUSPIO up to 27 μmol Fe kg�1 in the liver. Statistic evaluation of the spleen was inexactowing to the high standard deviations. Dosages are displayed in μg Fe/100 μl saline.
Figure 5. Light microscopy of the liver after Prussian blue staining fol-lowing the injection of 34 μmol Fe kg�1 (mouse weight 25 g). Scalebar, 200 μm. Arrows show stained iron (blue) adjacent to the sinusoids(s) of the liver. cv, Central vein.
59FE CORE-LABELED USPIO FOR DETERMINATION OF LIVER-SPECIFIC R2*
Contrast Media Mol. Imaging (2014) Copyright © 2014 John Wiley & Sons, Ltd. wileyonlinelibrary.com/journal/cmmi
5
for quantification of lipoprotein metabolism in vivo. The substan-tial difference to our study is the method of radioactive labelingof SPIO. Bruns et al. transferred SPIO together with the radioac-tive tracer into the lipid core of the nanosomes. This approachleads to the dissociation of SPIO and the tracer once particlesare degraded, resulting in an inexact quantification. We wereable to reduce this problem by using 59Fe-core-labeled SPIO*,which resulted in a causal relationship between ΔR2* and mea-sured activity.
The fact that the measured relaxivity r2* in the liver was muchhigher than the r2* in vitro (Table 1) was already shown by otherresearchers (3,42,43) and is due to the formation of intracellularparticle clusters. The intracellular clustered USPIO fulfill the staticdephasing regime in contrast to the singular USPIO in vitro.
The presented estimated in vivo relaxivity of r2* in the liver(481 ± 74.9 mM
�1 s�1) fits the static dephasing theory, as hasbeen previously shown in cellular MRI studies by Bowen et al.(3) and Girard et al. (43), which proves the reliability of ourmeasurements.Even though the present study was able to show that an exact
in vivo quantification with monodisperse 59Fe-labeled USPIO ispossible, the method still holds some limitations. As a proof ofprinciple, the quantification was performed in the liver, provid-ing a very homogenous type of tissue. Measurements in areasof pathologies are more difficult since the differentiation tononaffected tissue may be difficult, as in areas of infection orcancer. The same problem also applies to the characterizationof tumorous tissue, as they are likely to consist of different typesof tissue, resulting in an inhomogeneous SPIO distribution. Thepresented calibration curve can therefore not be generalized toother tissues or pathological processes and has to be generatedfor every type of tissue separately.We have used monodisperse USPIO to avoid systematic errors
given by the various biodistribution and blood half-time ofsubfractions, as seen for polydisperse nanoparticles. Neverthe-less there are other sources of systematic errors that we didnot focus on in this paper, such as an underestimation of localparticle concentration caused by macroscopic B0 inhomogenities(21), and this has to be further investigated.
4. CONCLUSION
Our study shows that 59Fe-labeled USPIO can be used to quantifythe local amount of USPIO in order to estimate tissue-specificrelaxivities. The generated liver-specific standard calibrationcurve can serve as a noninvasive tool to monitor disease activityor detect early pathologic tissue alterations and is therefore ofgreat importance for future molecular imaging approaches, forexample, target-specific (U)SPIO.
Figure 6. Transmission electron microscope (TEM) images of Kupffer cells after the injection of USPIO. (a) Kupffer cell (K) with a USPIO-filled endosomeinside of a liver sinusoid (s). The more detailed views (b) and (c) reveal a large amount of homogeneously shaped USPIO inside the endosome: n,nucleus; r. red blood cell. Scale bars: (a) 1 μm; (b) 500 nm; (c) 200 nm.
Figure 7. For quantification the difference in R2* (ΔR2*) in the liver ow-ing to the injection of increasing amounts of iron in the form of 59Fe-labeled USPIO was plotted against the calculated dose of 59Fe in mM inthe liver (ΔR2* and iron dosages are displayed including their standarddeviations). Graph shows a linear relationship between ΔR2* and calcu-lated 59FeUSPIO dose in the liver with a correlation coefficient of 0.92(coefficient of determination R2 = 0.85; p< 0.01). The relaxivity was givenby the equation of the line, with a value of r2* = 481± 74.9 mM
�1 s�1.
N. RAABE ET AL.
wileyonlinelibrary.com/journal/cmmi Copyright © 2014 John Wiley & Sons, Ltd. Contrast Media Mol. Imaging (2014)
6

5. EXPERIMENTAL
5.1. Iron Oxide Nanoparticles
USPIO were synthesized according to a published procedure(23,44) with a core size of 10 ± 1 nm as measured by transmissionelectron microscopy (Fig. 8a). Particles were encapsulated withthe amphiphilic poly(maleic acid-alt-1-octadecene) polymer(hydrodynamic diameter of 20 nm according to dynamic lightscattering; Fig. 8b). The industrially produced USPIO Sinerem®(Guerbet, Aulney-sous-Bois, France) were analyzed by TEM forultrastructural comparison (Fig. 8c, Table 1) and were coatedwith dextran.The home-made USPIO were core-labeled with 59Fe(23) to
generate 59Fe-USPIO (59FeUSPIO) and mixed with unlabeledparticles (56Fe) of the same characteristics (59Fe:56Fe = 0.09%;Table 1) to reach an activity of 6000 Bq/13 μg Fe, 12,000 Bq/25 μgFe and 18,000 Bq/38 μg Fe.
5.2. Biodistribution and Dose Optimization Studies
All in vivo studies were approved by the local licensing authority(Behörde für Soziales, Familie, Gesundheit und Verbraucherschutz;Amt für Gesundheit und Verbraucherschutz, Hamburg, Germany,project number 92/09). In vivoMRI measurements were performedon a clinical whole-body 3 T MRI scanner (Intera®, Philips, TheNetherlands) using a custom-made small animal solenoid coil(Philips Research Laboratories). Relaxometric and dynamicmeasurements were initially performed with unlabeled USPIO to
estimate the optimal concentration of USPIO. Five different ironconcentrations (4, 11, 22, 34 and 45 μmol Fe kg�1 body weight)were tested for the extent of linearity of R2* change (ΔR2*). Threeto four severe combined immunodeficiency mice (SCIDmice, aver-age age 12 weeks, Charles River, MA, USA) were used for each con-centration. For MR measurements mice were anesthetized by anintraperitoneal injection of a mixture of ketanest (Graeub AG, Bern,Switzerland) and rompun (Bayer Health Care, Germany) at a ratioof 2:3 adjusted to their body weight (0.1 ml/10 g). USPIO wereinjected through the tail vein during dynamic imaging using astandardized catheter. MR relaxometry was performed applying amultishot T2* fast field echo sequence before and after 59FeUSPIOadministration. Two stacks were created to cover liver, kidneys andspleen. Imaging parameters are summarized in Table 3.
Determination of T2* was performed using a dedicatedIDL-based software (Relax Fit version 1.7, Philips Research Labora-tories) after manual placement of an ROI in the tissue. Therelaxation rate R2* is given by the reciprocal value of T2*. Theorgan-specific change of R2* (ΔR2*) owing to USPIO accumulationwas calculated according to the following equation (R2*pre = R2*before USPIO injection; R2*post = R2* after USPIO injection):
ΔR2* ¼ R2post* � R2 pre*
DSC measurements were performed with a multishot T2*-weighted fast field echo sequence (Table 3). A keyhole techniquewith the first image as reference and a key factor of 40% was
Figure 8. TEM images of (a, b) unlabeledUSPIO and (c) Sinerem®. (a) Unstained images show the homogeneous iron core and (b) additional stained imagesvisualize the round-shaped shell of the USPIOs; (c) unstained images of Sinerem® reveal the higher heterogeneity of core sizes. Scale bars, 50 nm.
Table 3. Imaging parameters of in vivo MR sequences
Scanmode
TR(ms)
TE(ms)
FA(deg)
FoV(mm)
Matrix Spatialresolution inplane (mm2)
Slicethickness(mm)
NSA ETL ES(ms)
Bandwidth/
pixel (Hz)
Time ofacquisition
(min.)
T2* liver pre FFE 320 / 20 50 128 0.39 × 0.39 2 4 15 3.14 21.1 2:49T2* kidney pre FFE 426 / 20 50 128 0.39 × 0.39 2 2 25 3.14 12.7 1:48T2* liver post FFE 259 / 20 50 128 0.39 × 0.39 2 10 15 3.14 21.1 5:52T2* kidney post FFE 441 / 20 50 128 0.39 × 0.39 2 3 25 3.14 12.7 3:01T2* DSC-MRI FFE 57 6.9 20 80 376 0.21 × 0.21 1.3 6 / / 188.9 14:60
Note: TR, time to repetition; TE, time to echo; FA, flip angle; FoV, field of view; NSA, number of signal acquisitions; ETL, echo trainlength; ES, echo spacing; FFE, fast field echo.
59FE CORE-LABELED USPIO FOR DETERMINATION OF LIVER-SPECIFIC R2*
Contrast Media Mol. Imaging (2014) Copyright © 2014 John Wiley & Sons, Ltd. wileyonlinelibrary.com/journal/cmmi
7

applied. Two stacks were positioned over liver (stack one) andkidney/spleen (stack two) in correspondence to the position ofrelaxometric measurements. Three-hundred measurementswere performed for each stack with a temporal resolution of2.92 s and a total acquisition time of 14.6 min. SPIO were injectedafter 76 s to acquire enough data points for calculation of thebaseline. Dynamic DICOM images were post-processed withImageJ® (Version 1.44f, NIH). ROIs were manually placed overliver, inferior vena cava, spleen, back muscle and kidney for mea-surements of signal intensity for each timepoint. Data wereexported and signal intensities after USPIO injection (SIt) werenormalized to the average baseline signal intensity before USPIOadministration (SI0) after the following equation for calculation ofrelative signal intensity (SIrel):
SI rel ¼ �lnSI tSI0
� �� �x � 1
Results were displayed as a time vs intensity curve.Three additional SCID mice were used for long-term observa-
tion of T2* in the liver after the injection of unlabeled USPIO(22 μmol Fe kg�1 body weight). Mice were imaged for a periodof 32 weeks and T2* of the liver was measured with the previ-ously described relaxometric sequences.
5.3. 59Fe Radiotracer Studies
For radiotracer studies nine SCID mice were used (averageage 12 weeks, Charles River, MA, USA). Three different 59FeUSPIOconcentrations were chosen according to the preliminaryresults of the initial dynamic and relaxometric measurements[9 μmol Fe kg�1 (n= 3), 18 μmol Fe kg�1 (n= 2) and 27 μmolFe kg�1 (n= 3)]. One mouse served as a control (no 59FeUSPIOinjected). Imaging and MRI protocols were performed asdescribed for the unlabeled USPIO.
5.4. Histology, TEM and Activity Measurements
Immediately after MRI measurements mice were sacrificed bythe injection of a lethal dose of the aforementioned ketamin/rompun mixture and perfused with 4% formaldehyde; organswere dissected and weighted. Standard Prussian blue stainingwas performed after fixation in 4% formaldehyde and furtherprocession to paraffin. Sections were cut at 4 μm and examinedunder a Zeiss Axioplan photomicroscope, photographed with anAxioCam MRc5, and analyzed with AxioVison software (Zeiss,Germany).
For analysis of electron microscopy, samples were fixed with2.5% glutaraldehyde before ultrathin sectioning. Samples weredehydrated with ethanol and embedded in EPON (Carl Roth,Karlsruhe, Germany) resin. Electron micrographs were obtainedwith a Tecnai 20 TEM at 80 or 200 kV equipped with an Eagle4k camera (FEI, Eindhoven, The Netherlands).
Activity measurements of excised liver, spleen, kidneys, mus-cle, lung and brain were performed at the Hamburger wholebody counter (HAMCO, gamma counter) (45) immediately afterMRI measurements. The HAMCO was chosen as activity measure-ment system owing to its high sensitivity for small samples incombination with its construction of nonisotope-contaminatediron material, which reduces the influence of inherent radiationas in other radioation measurement systems.
5.5. 59Fe-quantification
The amount of 59FeUSPIO in the liver was calculated accordingto the results of percentage 59FeUSPIO accumulation arrivedfrom activity measurements (HAMCO). The iron concentrationin the liver tissue (ccalc in mmol l�1) was calculated based on59FeUSPIO uptake (59FeUSPIOliver, evaluated from activitymeasurement), the liver volume (Vliver), which was estimatedfrom the liver weight (1 g = 1 ml), and the molar weight of iron(55.845 g mol�1) after the following equation:
Ccalc ¼59FeUSPIOliver μgFeð Þ
V liver mlð Þ�55:8 g=molð Þ
The results were plotted against ΔR2* and the linear regressiondetermined r2*(mM
�1 s�1).
5.6. Statistical Analysis
Mixed model analysis was performed to investigate the effect offive different concentrations of USPIO on the relative signalintensity in the liver. Mice were randomly sorted to the differentiron concentrations. Pairwise comparisons were performed usingFisher´s least significant difference post-tests. The two-sided levelof significance was p< 0.05. The relationship between ΔR2* andcalculated iron concentration in the liver and determination ofr2* were analyzed using linear regression analysis and the correla-tion coefficient was determined. Calculations were performedusing SPSS (version 17.0.0) and Microsoft Office Excel 2003.
Acknowledgments
The authors thank H. Hermann (Heinrich-Pette-Institute forExperimental Virology, Hamburg, Germany) for help with theelectron microscopy and A. Japke and J. Kemmling (Departmentof Anatomy II: Experimental Morphology, University MedicalCenter Hamburg-Eppendorf, Germany) for their assistance withhistology and mouse handling. The research project was finan-cially supported by the Federal Ministry of Education andResearch for the Tailored Magnetic Nanoparticles for CancerTargeting project (TOMCAT, 01 EZ 0824).
REFERENCES1. Saini S, Stark DD, Hahn PF, Bousquet JC, Introcasso J, Wittenberg J,
Brady TJ, Ferrucci JT, Jr. Ferrite particles: a superparamagnetic MRcontrast agent for enhanced detection of liver carcinoma. Radiology1987; 162(1 Pt 1): 217–222.
2. Yablonskiy DA, Haacke EM. Theory of NMR signal behavior in mag-netically inhomogeneous tissues: the static dephasing regime. MagnReson Med 1994; 32(6): 749–763.
3. Bowen CV, Zhang X, Saab G, Gareau PJ, Rutt BK. Application of thestatic dephasing regime theory to superparamagnetic iron-oxideloaded cells. Magn Reson Med 2002; 48(1): 52–61.
4. Schnorr J, Wagner S, Abramjuk C, Drees R, Schink T, SchellenbergerEA, Pilgrimm H, Hamm B, Taupitz M. Focal liver lesions: SPIO-,gadolinium-, and ferucarbotran-enhanced dynamic T1-weightedand delayed T2-weighted MR imaging in rabbits. Radiology 2006;240(1): 90–100.
5. Bremer C, Allkemper T, Baermig J, Reimer P. RES-specific imaging ofthe liver and spleen with iron oxide particles designed for blood poolMR-angiography. J Magn Reson Imag 1999; 10(3): 461–467.
6. Montet X, Weissleder R, Josephson L. Imaging pancreatic cancer witha peptide-nanoparticle conjugate targeted to normal pancreas.Bioconjug Chem 2006; 17(4): 905–911.
N. RAABE ET AL.
wileyonlinelibrary.com/journal/cmmi Copyright © 2014 John Wiley & Sons, Ltd. Contrast Media Mol. Imaging (2014)
8
7. Kinoshita M, Yoshioka Y, Okita Y, Hashimoto N, Yoshimine T. MRmolecular imaging of HER-2 in a murine tumor xenograft by SPIOlabeling of anti-HER-2 affibody. Contrast Media Mol Imag 2010; 5(1):18–22.
8. Serkova NJ, Renner B, Larsen BA, Stoldt CR, Hasebroock KM,Bradshaw-Pierce EL, Holers VM, Thurman JM. Renal inflammation:targeted iron oxide nanoparticles for molecular MR imaging in mice.Radiology 2010; 255(2): 517–526.
9. Kaim AH, Wischer T, O’Reilly T, Jundt G, Frohlich J, von Schulthess GK,Allegrini PR. MR imaging with ultrasmall superparamagnetic iron ox-ide particles in experimental soft-tissue infections in rats. Radiology2002; 225(3): 808–814.
10. Priest AN, Ittrich H, Jahntz CL, Kooijman H, Weber C, Adam G. Inves-tigation of atherosclerotic plaques with MRI at 3 T using ultrasmallsuperparamagnetic particles of iron oxide. Magn Reson Imag 2006;24(10): 1287–1293.
11. Kawahara I, Nakamoto M, Kitagawa N, Tsutsumi K, Nagata I,Morikawa M, Hayashi T. Potential of magnetic resonance plaqueimaging using superparamagnetic particles of iron oxide for thedetection of carotid plaque. Neurol Med Chir (Tokyo) 2008; 48(4):157–161; discussion 161–162.
12. Bos C, Delmas Y, Desmouliere A, Solanilla A, Hauger O, Grosset C,Dubus I, Ivanovic Z, Rosenbaum J, Charbord P, Combe C, Bulte JW,Moonen CT, Ripoche J, Grenier N. In vivo MR imaging of intravascu-larly injected magnetically labeled mesenchymal stem cells in ratkidney and liver. Radiology 2004; 233(3): 781–789.
13. Ittrich H, Lange C, Togel F, Zander AR, Dahnke H, Westenfelder C,Adam G, Nolte-Ernsting C. In vivo magnetic resonance imaging ofiron oxide-labeled, arterially-injected mesenchymal stem cells inkidneys of rats with acute ischemic kidney injury: detection andmonitoring at 3T. J Magn Reson Imag 2007; 25(6): 1179–1191.
14. Shapiro EM, Medford-Davis LN, Fahmy TM, Dunbar CE, Koretsky AP.Antibody-mediated cell labeling of peripheral T cells with micron-sized iron oxide particles (MPIOs) allows single cell detection byMRI. Contrast Media Mol Imag 2007; 2(3): 147–153.
15. Bruns OT, Ittrich H, Peldschus K, Kaul MG, Tromsdorf UI, LauterwasserJ, Nikolic MS, Mollwitz B, Merkel M, Bigall NC, Sapra S, Reimer R,Hohenberg H, Weller H, Eychmuller A, Adam G, Beisiegel U, HeerenJ. Real-time magnetic resonance imaging and quantification of lipo-protein metabolism in vivo using nanocrystals. Nat Nanotechnol2009; 4(3): 193–201.
16. Liu W, Dahnke H, Rahmer J, Jordan EK, Frank JA. Ultrashort T2*relaxometry for quantitation of highly concentrated superparamagneticiron oxide (SPIO) nanoparticle labeled cells. Magn Reson Med 2009;61(4): 761–766.
17. Chung YE, Park MS, Kim MS, Kim E, Park J, Song HT, Choi JY, Kim MJ,Kim KW. Quantification of superparamagnetic iron oxide-mediatedsignal intensity change in patients with liver cirrhosis using T2 andT2* mapping: a preliminary report. J Magn Reson Imag 2010; 31(6):1379–1386.
18. Langley J, Zhao Q. Quantification of SPIO nanoparticles using phasegradient mapping. Conf Proc IEEE Eng Med Biol Soc 2009; 2009:3605–3608.
19. Pintaske J, Helms G, Bantleon R, Kehlbach R, Wiskirchen J, ClaussenCD, Schick F. A preparation technique for quantitative investigationof SPIO-containing solutions and SPIO-labelled cells by MRI. BiomedTech (Berl) 2005; 50(6): 174–180.
20. Lebel RM, Menon RS, Bowen CV. Relaxometry model of strong dipo-lar perturbers for balanced-SSFP: application to quantification ofSPIO loaded cells. Magn Reson Med 2006; 55(3): 583–591.
21. Dahnke H, Schaeffter T. Limits of detection of SPIO at 3.0 T using T2relaxometry. Magn Reson Med 2005; 53(5): 1202–1206.
22. Wong RM, Gilbert DA, Liu K, Louie AY. Rapid size-controlled synthesisof dextran-coated, 64Cu-doped iron oxide nanoparticles. ACS Nano2012; 6(4): 3461–3467.
23. Freund B, Tromsdorf UI, Bruns OT, Heine M, Giemsa A, Bartelt A,Salmen SC, Raabe N, Heeren J, Ittrich H, Reimer R, Hohenberg H,Schumacher U, Weller H, Nielsen P. A simple and widely applicablemethod to 59Fe-radiolabel monodisperse superparamagnetic ironoxide nanoparticles for in vivo quantification studies. ACS Nano2012; 6(8): 7318–7325.
24. Gibson N, Holzwarth U, Abbas K, Simonelli F, Kozempel J, Cydzik I,Cotogno G, Bulgheroni A, Gilliland D, Ponti J, Franchini F, MarmoratoP, Stamm H, Kreyling W, Wenk A, Semmler-Behnke M, Buono S,Maciocco L, Burgio N. Radiolabelling of engineered nanoparticles
for in vitro and in vivo tracing applications using cyclotron accelera-tors. Arch Toxicol 2011; 85(7): 751–773.
25. Natarajan A, Gruettner C, Ivkov R, DeNardo GL, Mirick G, Yuan A,Foreman A, DeNardo SJ. NanoFerrite particle basedradioimmunonanoparticles: binding affinity and in vivo pharmacoki-netics. Bioconjug Chem 2008; 19(6): 1211–1218.
26. Glaus C, Rossin R, Welch MJ, Bao G. In vivo evaluation of (64)Cu-labeled magnetic nanoparticles as a dual-modality PET/MR imagingagent. Bioconjug Chem 2010; 21(4): 715–722.
27. Ittrich H, Lange C, Dahnke H, Zander AR, Adam G, Nolte-Ernsting C.[Labeling of mesenchymal stem cells with differentsuperparamagnetic particles of iron oxide and detectability withMRI at 3T]. Rofo 2005; 177(8): 1151–1163.
28. Arbab AS, Bashaw LA, Miller BR, Jordan EK, Bulte JW, Frank JA.Intracytoplasmic tagging of cells with ferumoxides and transfectionagent for cellular magnetic resonance imaging after cell transplan-tation: methods and techniques. Transplantation 2003; 76(7):1123–1130.
29. Arbab AS, Bashaw LA, Miller BR, Jordan EK, Lewis BK, Kalish H, FrankJA. Characterization of biophysical and metabolic properties of cellslabeled with superparamagnetic iron oxide nanoparticles andtransfection agent for cellular MR imaging. Radiology 2003; 229(3):838–846.
30. Otsuji E, Kuriu Y, Okamoto K, Ichikawa D, Hagiwara A, Ito H,Nishimura T, Yamagishi H. Monoclonal antibody A7 coupled to mag-netic particles as a contrast enhancing agent for magnetic resonanceimaging of human colorectal carcinoma. Cancer ImmunolImmunother 2006; 55(6): 728–733.
31. Himes N, Min JY, Lee R, Brown C, Shea J, Huang X, Xiao YF, MorganJP, Burstein D, Oettgen P. In vivo MRI of embryonic stem cells in amouse model of myocardial infarction. Magn Reson Med 2004; 52(5):1214–1219.
32. Kraitchman DL, Heldman AW, Atalar E, Amado LC, Martin BJ,Pittenger MF, Hare JM, Bulte JW. In vivo magnetic resonance imag-ing of mesenchymal stem cells in myocardial infarction. Circulation2003; 107(18): 2290–2293.
33. Daldrup-Link HE, Rudelius M, Piontek G, Metz S, Brauer R, Debus G,Corot C, Schlegel J, Link TM, Peschel C, Rummeny EJ, OostendorpRA. Migration of iron oxide-labeled human hematopoietic progeni-tor cells in a mouse model: in vivo monitoring with 1.5-T MR imagingequipment. Radiology 2005; 234(1): 197–205.
34. Na HB, Song IC, Hyeon T. Inorganic nanoparticles for MRI contrastagents. Adv Mater 2009; 21(21): 2133–2148.
35. Laurent S, Boutry S, Mahieu I, Vander Elst L, Muller RN. Iron oxidebased MR contrast agents: from chemistry to cell labeling. CurrMed Chem 2009; 16(35): 4712–4727.
36. Weissleder R, Stark DD, Engelstad BL, Bacon BR, Compton CC, WhiteDL, Jacobs P, Lewis J. Superparamagnetic iron oxide: pharmacokinet-ics and toxicity. AJR Am J Roentgenol 1989; 152(1): 167–173.
37. Hamm B, Staks T, Taupitz M, Maibauer R, Speidel A, Huppertz A,Frenzel T, Lawaczeck R, Wolf KJ, Lange L. Contrast-enhanced MRimaging of liver and spleen: first experience in humans with anew superparamagnetic iron oxide. J Magn Reson Imag 1994; 4(5):659–668.
38. Bourrinet P, Bengele HH, Bonnemain B, Dencausse A, Idee JM, JacobsPM, Lewis JM. Preclinical safety and pharmacokinetic profile offerumoxtran-10, an ultrasmall superparamagnetic iron oxide mag-netic resonance contrast agent. Invest Radiol 2006; 41(3): 313–324.
39. Thorek DL, Tsourkas A. Size, charge and concentration dependentuptake of iron oxide particles by non-phagocytic cells. Biomaterials2008; 29(26): 3583–3590.
40. Weissleder R, Elizondo G, Wittenberg J, Rabito CA, Bengele HH,Josephson L. Ultrasmall superparamagnetic iron oxide: characteriza-tion of a new class of contrast agents for MR imaging. Radiology1990; 175(2): 489–493.
41. Tromsdorf UI, Bigall NC, Kaul MG, Bruns OT, Nikolic MS, Mollwitz B,Sperling RA, Reimer R, Hohenberg H, Parak WJ, Forster S, BeisiegelU, Adam G, Weller H. Size and surface effects on the MRI relaxivityof manganese ferrite nanoparticle contrast agents. Nano Lett 2007;7(8): 2422–2427.
42. Kuhlpeter R, Dahnke H, Matuszewski L, Persigehl T, von WallbrunnA, Allkemper T, Heindel WL, Schaeffter T, Bremer C. R2 and R2*mapping for sensing cell-bound superparamagnetic nanoparticles:in vitro and murine in vivo testing. Radiology 2007; 245(2):449–457.
59FE CORE-LABELED USPIO FOR DETERMINATION OF LIVER-SPECIFIC R2*
Contrast Media Mol. Imaging (2014) Copyright © 2014 John Wiley & Sons, Ltd. wileyonlinelibrary.com/journal/cmmi
9
43. GirardOM, Ramirez R, McCarty S, Mattrey RF. Toward absolute quantifica-tion of iron oxide nanoparticles as well as cell internalized fraction usingmultiparametric MRI. Contrast Media Mol Imag 2012; 7(4): 411–417.
44. Hyeon T, Lee SS, Park J, Chung Y, Na HB. Synthesis of highly crystal-line and monodisperse maghemite nanocrystallites without a size-selection process. J Am Chem Soc 2001; 123(51): 12798–12801.
45. Braunsfurth JS, Gabbe EE, Heinrich HC. Performance parameters ofthe Hamburg 4 pi whole body radioactivity detector. Phys Med Biol1977; 22(1): 1–17.
46. Jung CW, Jacobs P. Physical and chemical properties ofsuperparamagnetic iron oxide MR contrast agents: ferumoxides,ferumoxtran, ferumoxsil. Magn Reson Imag 1995; 13(5): 661–674.
SUPPORTING INFORMATION
Additional supporting information may be found in the onlineversion of this article at the publisher’s web site.
N. RAABE ET AL.
wileyonlinelibrary.com/journal/cmmi Copyright © 2014 John Wiley & Sons, Ltd. Contrast Media Mol. Imaging (2014)
10