DEMAND BASED OPTIMAL PERFORMANCE OF A HYDROELECTRIC POWER PLANT
Upload
independentCategory
view
0download
0
DETERMINATION OF HYDROELECTRIC POWER GENERATION POTENTIAL; CASE STUDY OF
OWU AND ERO-OMOLA FALL, IN KWARA STATE, NIGERIA
BY
LAWAL KOLA MAROOF(mnse)LOWER NIGER RIVER BASIN DEVELOPMENT
AUTHORITY KWARA STATE, ILORIN
TEL:+234-8056667954 E-mail:[email protected]


The national electric power authority (NEPA) now PHCN plc was created by decree no. 24 of 1972 upon the merger of Electricity Corporation of Nigeria(ECN) and the Niger Dams Authority on the recommendation of Shawmont report. The construction of Jebba Hydro dam, in 1985 and Shiroro hydro dam in 1990 were successfully completed afterwards. Yet, a cursory look at the operational problems of NEPA and Nigeria power system immediately suggests the need to take an integrated approach to electric power development and planning which lead to the creation of Energy Commission of Nigeria in 1979.

Energy Commission of Nigeria was established by act 62 of 1979 as amended by act no. 19 of 1998. ECN has the statutory mandate for strategic planning and coordination of national policies in the field of energy resources in Nigeria, by this mandate the Energy Commission of Nigeria from where National Centre for Hydropower Research and Development, derives its mandate is the apex governmental organ empowered to carry out overall energy sector planning and policy implementation, by promoting diversifications of energy resources development and optimal utilization of all, including alternative energy resources like solar, wind, and biomass.

ORGANIZATIONAL CHART FOR THE ENERGY COMMISSION OF NIGERIA
BOARD OF THE COMMISSION
DIRECTOR GENERAL
TECHNICAL ADVISORY COMMITTE
ADM INISTRATION & FINANCE DEPT
ENERGY INFORM ATION DEPT.
ENERGY M ANAGEM ENT &TRAINNING AND M ANPOW ER DEVELOPM ENT
ENERGY PLANNING AND ANALYSIS DEPARTM ENT
NUCLEAR SCIENCE &TECHNOLOGY DEPARTM ENT
RENEW ABLE ENERGY DEPARTM ENT
ENERGY RESEARCH CENTRES
UNITS UNDER DG’S OFFICE
NACHRED UNI-ILORIN (HYDROPOW ER)
NCECE. UNILAG, LAGOS
NCPRD. ABTU, BAUCHI
(NUCLEAR)
NCERD, UN,NSUKKA
(SOLAR &RENEW ABLES
SERC. UDU, SOKOTO(SOLAR & Renewable)
NCERE, UNIBEN, BENIN

The organizational structure of ECN comprises of the following member:
Board of the commissionTechnical Advisory Committee (TAC)
Office of the DG\CEOSix department and
Six research centre’s namely;i)National Centre For Hydropower Research And Development, at university of Ilorin.(NACHRED) ii) National Centre For Energy Conservation and Efficiency at University of Lagos, Lagos. (NCECE)iii) National Centre For Petroleum Research and Development at Abubakar Tafawa Balewa University, Bauchi.(NCPRD)iv) National Centre For Energy Research And Development, at university of Nigeria, Nsukka. (NCERD)v) Sokoto Energy Research Centre at Usman Danfodio University, Sokoto.(SERC).vi) National Centre For Energy Research And Environment at University of Benin,(NCERE).
The technical advisory committee of ECN comprises all the 6 research centre’s and other federal Government organs.

Why small hydro: Poor planning and under investment had created a huge generation and supply deficit over time, despite poor routine maintenance for the existing hydro infrastructures. There is a heavy reliance on public electricity supply in Nigeria, demand for electricity keep outstripping supply. In order to augment supply, It is but obvious that a new approach and fresh initiatives to development of energy producing resources and the implementation of developmental plans has to be accelerated, if vision 2020 target is to be met.

Hydroelectricity enjoys several advantages over most other sources of electrical power. These include a high levels of reliability, proven technology, high efficiency, very low operating and maintenance cost, and the ability to easily adjust to load fluctuations. Hydropower project often provide flood control and recreational benefits. Hydropower does not produce waste products that contribute to air quality problems, acid rain, and green house gases, it is a renewable resources that minimize the use of other fuels(oil, gas and coal). With rising astronomical demand of electric power, increased environmental consciousness and the need for improved agricultural goals, hydro facilities are being developed nation wide to augment, reduce or eliminate dependence on fossil fuel facilities which are known to be major sources of environmental pollutions.

Electricity Demand ScenariosThe presidential steering committee on National Integrated Power Projects (NIPP) had stated on July 22nd 2009 that, only 2500MW was being distributed, out of the 4500MW being generated. But later drop to 1800MW due to militancy insurgency in the Niger delta who, disrupted gas supply to thermal stations.Total install energy capacity presently across the country is estimated at 6,021 MW while the National Integrated Power Project (NIPP) is estimated at 6,814 MW (ECN,2007). As at July 22nd Kainji generates 127mw from an installed capacity of 760mw ,Jebba 225mw out of 540mw,Shiroro 242mw out of 600mw. With the power projections in 2010 estimated at 16,000mw Table 1.It seems the dream of meeting the nations energy requirement still remains daunting as the present status of less than 4,500MW is far from meeting basic national power demand requirement ,even with recent award of contract to push it to 6,000MW by December 2009.

Table 1. Nigeria Electricity Dem and Scenarios.
Scenario Dem and MW 2010 2015 2020 2025 2030 Reference(7% ) 15,730 28,360 50,820 77,450 119,200
High reference(10% ) 15,920 30,210 58,180 107,220 192,000
Optim istic(11.5% ) 16,000 31,240 70,760 137,370 250,000 Source: Energy Com m ission of Nigeria (2006)

Table 2: Existing Sm all and Large Hydropow er Plant
No Nam e Source Ow ner Location Storage Capacity M CM
Head (m )
Potential Pow er (KW )
Discharge M 3/s
1 Kainji Dam
River N iger
PHCN Kainji-New -Bussa
150,000 36 760 -
2 Jebba River N iger
PHCN Jebba 100,000 29 540 -
3 Shiroro Trib. To R.N iger
PHCN Shiroro 700,000 112 600 -
4 Itapaji Ele-River BORBDA
Ondo State
932 21 300 2.0
5 W aya Dam
Ganjuw a River
UBRBDA
Bauchi State
30 12 150 2.4

The Mandate: The first hydro-power investigation of the river Niger, upstream of Jebba commenced in 1951, after considering various economics potentials of the river Niger, the federal government in 1953 invited NEDECO (Dutch Engineering firm and a British firms, Balfour Beatty to undertake prefeasibility studies of the hydro project. The recommendation of which led to the establishment of Niger Dam Authority in 1962, the construction of Kainji dam, commenced in may 1963 and final commissioning by February 15th 1969.Kainji plant started with electricity generation of 717MW in 1972 and move to about 1,600MW in 1999.(Umolu,1999)

We are today celebrating the establishment of a unique research centre under the auspices of Energy Commission of Nigeria. This is after 39years of commissioning the first hydropower station in Nigeria. This centre no doubt will fast rack the development of hydropower technical capabilities now and in the future. Owu falls and Ero-omola fall has been identified, in response to the mandate of this centre to develop all available potential hydropower site all over the country. This paper will therefore focus on two potential hydro site under investigation by the centre.
Physical Characteristics and Description of the study Areas :Owu fall is located at Owa Kajola in Owu-Isin LGA of kwara state near Omu-Aran about 127km from Ilorin the state capital. The run-off is perennial from a hill of about 120m heights. Owu fall can be describe between Latitude North N080 20’ 23.2” and N080 20’ 23.1” and between Longitude East E0050 08’ 34.8” and E0050 08’ 34.7”.
The rainfall is moderate with general annual average of about 1,250mm with maximum rainfall occurring in the months of June and August and a low humidity of about 50%.

Ero-Omola fall is located along Osi- Isolo-Ajuba Road off Osi-Idofin road in Ekiti LGA, (Araromi-Opin) about 116 km from Ilorin. The runoff is perennial with a height of about 42m high, but of higher unit discharge than Owu-falls. The catchments area of Ero-omola falls is about 45km2 with contribution from two rivers namely, Ero-river from Iddo- faboro near Ifaki in Ekiti state and Odo-Otun from Ajuba itself.Ero-Omola falls can be describe between Latitude North N080 09’ 34.6” and N080 09’ 30.8” and between Longitude East E0050 14’ 07.4” and E0050 14’ 06.7”.

Owu fall
Ero-Omola Fall

Objective of the study :The main objective of this study is the determination and development of an appropriate optimal power generation potential for two locations namely Owu fall and Ero-Omola fall in kwara state of Nigeria.Scope Of Study: In achieving the main objective stated above, the following scope would be covered.
(1) Installation of hydrologic instrument for data collection.(2) Collection of hydrologic data and topographical maps of the two sites and adjoining catchments. (3) Simulation of water resource reliability for the project. (4) Establishing the energy output using sequential stream flow – routing method.(5)Determination of potential hydropower generation capacity of each fall.


Theory of hydropower generation: In a hydroelectric power plant the motion of water is used to move big fan like blades in a turbine to then turn a shaft connected to a generator. The generator has a powerful electromagnet (a rotor) which is turned inside a "'coil" of copper bars (a starter).This produces "electromotive force," or the process of exciting electrons to jump from atom to atom. When electrons flow along a wire or other conductor, jumping from atom to atom, they create an electric current, or a flow of electricity. Generators cannot store the energy they create. Once the mechanical energy from the flow of water is converted into electricity it must be used immediately. Therefore, electrical demand must be well anticipated to avoid wasting the resources used to make electricity. The water then returns to the river through the tail race. From the powerhouse, transmission lines carry electricity to communities.

The major types of hydroelectric power development are:a) Run-of river developmentb) Pondage development (Dam toe based)c) Storage development d) Regulating development (canal fall based)e) Pumped storage development (diversion)The proposed developmental option for the two sites is the Run-of river type. The run-off river plants are such plants that do not substianly alter the flow regime of the river, this implies that the river is not diverted materially away from its natural course since no impoundment is envisaged. The run-off river plants will certainly have small pools of reservoirs to provide the necessary pondage in order to balance day to day fluctuations.

RUN-OFF RIVER DEVELOPMENT
RUN-OFF RIVER DEVELOPMENT

RUN-OFF RIVER DEVELOPMENT


c) Operating Head. The operating head is equal to the difference of the water level in the forebay (or foreway) and that in the tail race.d) Hydraulic Efficiency of plant. The hydraulic efficiency of a hydropower Scheme is equal to the ratio of the net head to the gross head.e) Overall Efficiency of Hydropower Scheme. The overall efficiency of a hydropower plant is equal to the product of the hydraulic efficiency, the turbine efficiency, and the generator efficiency.(normally between 60%-70%) f) Overall Efficiency of a Plant. The hydraulic efficiency of a plant is equal to the product of turbine efficiency and the generator efficiency.(normally about 80%).g) Installed Capacity. The installed capacity (or plant capacity) is the maximum power which can be developed by all the generators of the plant at the normal head and with full flow. (normally 1.1 times the peak load)

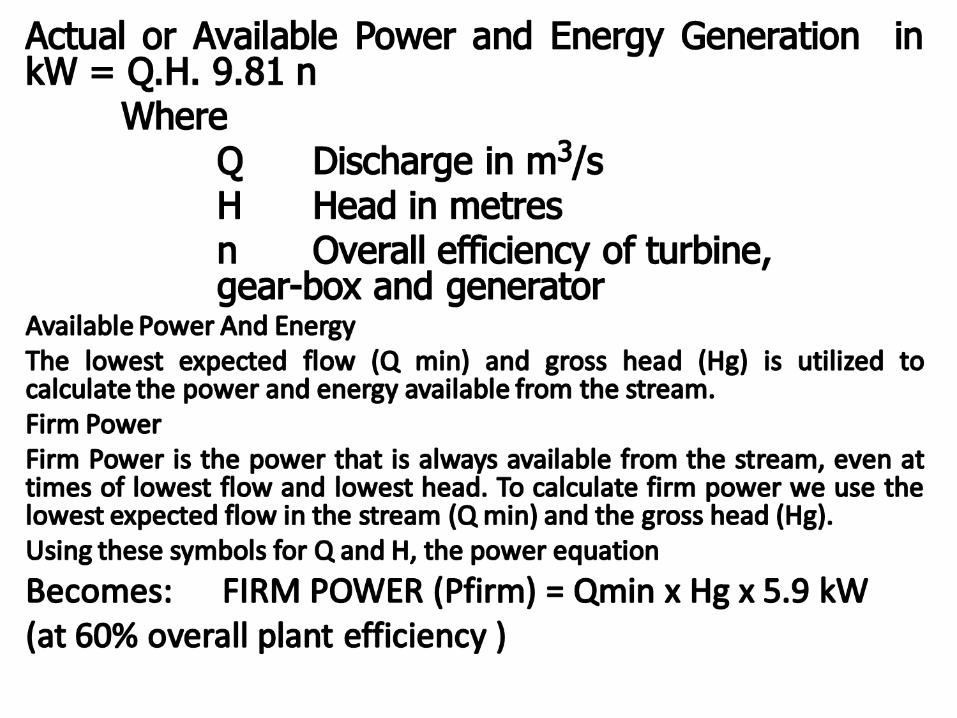
h) Capacity Factor. The capacity factor(also called plant factor) is the ratio of the average output of the plant for a given period of time to the installed capacity. In order words, the capacity factor is the ratio of energy actually produced by the plant for a given period of time to the energy it is capable of producing at full capacity.Thus: Capacity Factor=Average Output Plant CapacityI)The Firm Power. The firm power (or primary power) is the amount of power which a plant can deliver throughout the year (or 100% of time). It is the power which will be available when the flow in the river is minimum for a run-off river plant.

j.) Secondary Power. The secondary power (or surplus power) is the amount of power which is in the excess of the firm power. In a run-off river plant, the secondary power is available when the discharge in the river is greater than the minimum discharge.k.) Load Factor. The load factor is the ratio of the average load during a period to the peak load during the same period. The load factor is therefore for a specific period, depending upon the period specified. It can be daily load factor, weekly load factor, monthly load factor, or yearly load factor. It is pertinent to note that the load factor will be equal to the capacity factor, when the peak load is equal to the plant capacity. Load Factor=Average Load
Peak Load l.) Power Factor. The power factor is the ratio of the actual power in kilowatts (Kw) to the theoretical power in kilowatts-hour (Kwh).(power factor cannot be greater than unity.) Power Factor=Actual Power
Theoretical power

m.) Utilization factor. The utilization factor (or plant use factor) is the ratio of the power corresponding to the peak load developed during a certain period, to the installed capacity of the plant. In other words, it represents the maximum proportion of the installed capacity utilized during the peak demand. If the head remains constant, the utilization factor will also be equal to the ratio of the quantity of water actually utilized for generating power corresponding to the peak load to the maximum quantity of water available in the river.(normally between 0.4-0.9)
Utilization Factor=Peak Power Installed
Capacity n.) Diversity Factor. The diversity factor is the ratio of the sum of the maximum demands of the individual consumers to the simultaneous maximum demand of all the consumers during a certain period. Diversity factor is always greater than unity. A high diversity factor will improve the overall load factor because the maximum demand will be less. With less installed capacity, more energy can be supplied on account of greater diversity and it would reduce the overall cost.
Diversity Factor=Sum of Individual Maximum Demand Simultaneous Maximum Demand

The following is the basic steps for computing average annual power generation potentials. Using the flow duration method US Army Corps of Engineer. 1.Development of flow duration curve – the use of available stream flow records to reflect depletion and stream flow regulation.2.Adjustment of flow duration curve: The U.S Army Corps of Engineers, recommend that if less than 30 years of flow data is available, stream flow records from nearby stations with larger periods should be analyzed to determine if substantially wetter or drier periods of long-term average occurred. 3.Determination of the flow losses: Flow losses such as consumptive losses include reservoir surface evaporation losses and diversion such as for Irrigation and water supply. Non-consumptive losses include: Irrigation requirement, ecological requirement, and leakage through around dams and embankment structures, leakage around spillway or regulating outlet gate.

4.Development of Head Data – A head versus discharge curve would be developed that reflects the variation at tail water elevation with discharge. 5.Selection of plant site: First the plant hydraulic maximum discharge that can be met through the turbine is selected. For preliminary studies the initial plant size can be based on the average annual flow or a point between 15% and 30% exceedence on the flow duration curve. Next the net head corresponding to the assumed hydraulic capacity is identified. For Pure Run of river plants, the head at hydraulic capacity is the rated head. 6.Definition of usable flow range and derivation of head–duration curve: The flow duration is reduced to include only the usable flow range, because the turbine characteristics limit the data at stream flow that can be used for power generation using the flow – duration data and time versus discharge data, a head – duration curve can be constructed.

7.Derivation of Power Duration Curve: Use 20 to 30
points from the flow duration curve to determine the
power for each using the water equation. Heads are
then computed for each or are taken from the head –
discharge curve. Losses are subtracted from the flow in
the flow duration curve. The results are plotted as a
useable generation with the generation values at the
percent exceedence points corresponding to the
discharges on the flow duration curve. Data from the
usable generation – duration curve can be used to
develop a true duration curve.

8) Com putational of average annual Energy The area under this curve represents the average annual energy expressed as
Annual Energy (kwh) = wo
oPdp100
8760
P = is the power in kw and p is the % of tim e 9.) Com putation of dependable capacity – The dependable capacity is the average power obtained from the generation – duration curve. For a run-off river project, the generation is on stream flows for the peak dem and m onths. The dependable capacity is = average generation =
100
oPdp100
1 . For poundage project a peaking capacity – duration curve is
developed to determ ine dependable capacity. The power – duration curve and the duration for run-off river project are identical.

Framework Design Outlined: Data Collection:, Topographical survey, Load demand survey, Stream flow, and corresponding head must be estimated or measured, before one can calculate the power that could be developed from a stream. Stream flow is the most difficult to measure or estimate. Understanding of its sources, its fluctuations and flow measurements is important. Stream flow: the major component of the stream flow during dry periods is the lowest minimum flow. This hydro project would be designed for dry, low flow periods. Stream flow Fluctuations: Stream flow fluctuates, often daily, always seasonally and yearly. To visualize these fluctuations, values of flow shall be plotted against time, these plots are called hydrographs.

Project Layouts: The location MAP of the intake, dam or run-off river, penstocks, powerhouse and transmission line and the position of the turbine are indicated on the topographical map.Design Capacity of Hydro Plant: The design capacity (or installed capacity) of hydro plant is the maximum power it can produce. For this stage in the planning process, it is assumed that the design capacity is made equal to the maximum load, it is also assume that the plant can produce maximum output -equal to the maximum controlled load -- when the flow in the stream is at its lowest. This means that the plant will be able to produce all the power required, even during dry periods.


Hydropower scheme components: Run- off river typea) Civil works:
River diversion worksCanal
PenstockForebay
Power houseTailrace
b) Electro MechanicalTurbineGenerator
Speed increase/Gear box

Transmission and distributionSwitch gear
c) Electricity distribution network
Transmission and distribution network
Sub-stationMetering
Controls and protection

Sedimentation Basin: To prevent sediment from flowing into the turbine, a sediment trap shall be built upstream of the intake structure or within the structure; or immediately downstream, as a separate self-flushing tank built into the penstocks. Provision of trash rack may prevent floating debris from entering the penstocks.Run-off River Intakes/forebay: The water carried by the intakes is distributed to various penstocks leading to the turbines through the forebay, also known as the head pond. Water is temporarily stored in the forebay in the event of a rejection of load by the turbine and withdrawal when the load is increased. Thus the forebay also acts as a sort of regulating reservoir. Often a bell mouth entrance which is guarded by an RCC or steel grid is utilized, forming the trash tracks, the control valve or gate is situated immediately after the bell mouthing.. ahead of the valve are provided the stop log grooves in case access for the valve repairs is needed.

Penstocks: Penstocks are the pipes that supply water from the head pond or the forebay to the turbines. The penstocks are the pressure conduit and non-pressure conduit are the canal and flumes. The design for the penstocks are the same for the pressure vessels and tanks, however due to pressure fluctuations from governors control and turbine gate operation, sudden pressure due to water hammer are developed, and must be taken into consideration using a surge tank.

Economic diameter of penstocks: Once the number of penstocks is fixed, the discharge to be conveyed by each penstocks is also fixed. The next step is to determine the size of the pipe to transport the required discharge. The two variables under considerations are, diameter of the penstock D and the velocity of flow which is inversely proportional to D. thus there are various combinations of V and D which would give the same discharge.Empirical Formulae:USBR formulae V=0.125√2gHWhere V=optimum velocity in m/s and H=maximum working head in m. hf=flQ2
12.1D5
Frictional losses = hfL=length of the pipeQ=discharge in m3/sD=diameter of penstocks

Surge tanks are device storage provided near the downstream end of the long penstock to relieve excess pressure caused by sudden closure of the valve, it also provide a supply of water when the valve suddenly opened. Penstocks have to be designed to withstand maximum water hammer pressure developed due to sudden closure of valve, if surge tank is not provided, however if surge tank is provided, the water hammer effect occurs only on the length of the penstock between the surge tank and the turbine inlet, hence the surge tank should be provided as close to the turbine as possible. The best location is usually at a point where the ground slope changes from a flat slope to a steep slope.Types of surge tank Simple surge tank Restricted entry surge tank Differential surge tank


Powerhouse: The size of the powerhouse is determined by the type and size of the turbine installed. Tailrace: The tailrace is a channel, which leads the water from the turbine back into the stream, a lake or the sea. It should prevent the water from damaging any structure or the landscape. Transmission Line: Route survey of transmission line to the National Grid at Omu-aran shall be carried out AdvisorsTurbine manufacturers, pipe suppliers, contractors and electricians shall be contacted. Owners of small hydro plants, particularly those who have built their own, might be pleased to tell us about their experiences and offer advice.

Cost elem ent of a hydropower schem e S/N ACTIVITY DETAILS 1. Planning and Design Engineering, energy survey, hydrology study,
site survey, pre-feasibility report, training m anuals.
2. Managem ent Legal fram ework with IPP, insurance, internal rate of return from projected cash flows, com pensation records and resettlem ent plans, training, m anagem ent, EIA and com pliance to green house em ission criteria. etc.
3. Penstocks Procurem ent and installations 4. Civil works W eir and intake channel powerhouse, site
preparation/access roads etc.

5. Electro-m echanical Turbine, generator, switch gear etc. 6. Electricity distribution Transm ission lines, dom estic connections,
appliances. 7. Transportations Freight cost and Haulage 8. Installation
Cost of expertise
9. Operations and m aintenance
Running cost, fixed annual cost, variable running cost,
8. IPP Assessm ent

OWU FALLS

ERO-OMOLA FALLS

Copyright © 2022 FDOKUMEN