Need for, Purpose of and Alternatives to the Site C Hydroelectric Project
51
DRAFT Need for, Purpose of and Alternatives to the Site C Hydroelectric Project ABRIDGED VERSION prepared for the Joint Review Panel for the Site C Clean Energy Project on behalf of the Treaty 8 First Nations by Philip Raphals Executive Director Helios Centre April 2014
-
Upload
centrehelios -
Category
Documents
-
view
2 -
download
0
Transcript of Need for, Purpose of and Alternatives to the Site C Hydroelectric Project

DRAFT
Need for, Purpose of and
Alternatives to the Site C
Hydroelectric Project
ABRIDGED VERSION
prepared for the
Joint Review Panel
for the Site C Clean Energy Project
on behalf of
the Treaty 8 First Nations
by
Philip Raphals
Executive Director
Helios Centre
April 2014

Need for, Purpose of
and Alternatives to
the Site C Hydroelectric Project
Philip Raphals
for the Treaty 8 First Nations
April 2014
Table of Contents
1. ENERGY PLANNING CONTEXT .......................................................................... 1
2. NEED FOR, PURPOSE OF AND ALTERNATIVES TO THE PROPOSED
PROJECT .................................................................................................................... 2
2.1. Need for the Project ................................................................................................ 2 2.2. Purpose of the Project ............................................................................................. 2
2.3. Alternatives to the Project ....................................................................................... 3
3. THE PROPONENT’S ALTERNATIVES ANALYSIS ........................................... 4
3.1. Available Resources................................................................................................ 4 3.1.1. Simple Cycle Gas Turbines (SCGT) as a capacity resource ................................... 4 3.1.2. DSM Options .......................................................................................................... 6 3.1.3. DSM Capacity Initiatives ........................................................................................ 7
3.2. Block vs. Portfolio Analysis ................................................................................. 10 3.2.1. Block analysis ....................................................................................................... 10 3.2.2. Portfolio analysis (System Optimizer) .................................................................. 12
3.3. The Size and Cost of the Site C Surplus ............................................................... 13
4. ALTERNATIVES TO THE PROPOSED PROJECT .......................................... 18
4.1. Base Resource Plan without LNG ........................................................................ 21 4.1.1. BC Hydro’s Base Resource Plan without LNG, with Site C ................................. 21 4.1.2. BRP without LNG, with Site C (optimized) ........................................................... 22 4.1.3. BRP without LNG, without Site C ......................................................................... 23 4.1.4. Differential cost comparison ................................................................................ 25
4.2. Contingency Resource Plan with LNG ................................................................. 27 4.2.1. BC Hydro’s Contingency Resource Plan with LNG, with Site C .......................... 28 4.2.2. CRP with LNG — Site C (optimized) .................................................................... 29 4.2.3. CRP with LNG — without Site C .......................................................................... 31 4.2.4. Differential cost comparison ................................................................................ 33
4.3. Low Growth Resource Plan (LGRP) .................................................................... 34 4.3.1. Low Growth Resource Plan (LGRP) without LNG – with Site C ......................... 34 4.3.2. LGRP without LNG – without Site C .................................................................... 35 4.3.3. Differential cost comparison ................................................................................ 37
5. CONCLUSIONS ....................................................................................................... 38
APPENDIX 1
CAPACITY AND ENERGY BALANCES BASE RESOURCE PLAN (BRP) WITHOUT
LNG: “WITHOUT SITE C” PORTFOLIO ..................................................................................
APPENDIX 2
CAPACITY AND ENERGY BALANCES CONTINGENCY RESOURCE PLAN (CRP)
WITH LNG: “WITHOUT SITE C” PORTFOLIO .....................................................................
APPENDIX 3 — QUALIFICATIONS..................................................................................

Need for, Purpose of
and Alternatives to
the Site C Hydroelectric Project
ABRIDGED VERSION
Philip Raphals
for the Treaty 8 First Nations
April 2014
Page 1
1. ENERGY PLANNING CONTEXT
In many ways, the Site C environmental assessment proceeding is the fruit of various provisions
of British Columbia’s Clean Energy Act (the “CEA”). The CEA includes Site C as a “heritage
asset” (in Schedule 1) even though it has not been built, and exempts it from normal regulatory
scrutiny by the BCUC. It imposes several planning constraints on BC Hydro that seem to
presuppose that Site C will be developed.1 Furthermore, it also exempts BC Hydro’s Integrated
Resource Plan (IRP), which recommends building Site C for the earliest in-service date of 2024,
from the BCUC’s jurisdiction.
However, the process that led to the CEA did not include a careful weighing of the economic,
environmental, social and aboriginal rights implications of developing Site C, as compared to
other ways of meeting British Columbia’s energy and capacity needs. It is therefore essential that
the Joint Review Panel (JRP) and the governments to which it reports examine critically the pros
and cons of proceeding with the Site C Project.
The information submitted by BC Hydro to the Joint Review Panel (JRP) with respect to “need
for, purpose of and alternatives to” the Site C Project is, for all intents and purposes, drawn from
its Integrated Resource Plan (IRP). To get a sense of scale, the justification-related sections of
the EIS total less than 100 pages, whereas the IRP is more than 500 pages, plus over 1000 pages
of appendices. Explicitly or implicitly, the source of all information presented in the justification
section of the Environmental Impact Statement (EIS) is found in the IRP.
This unusual situation poses an important challenge. It is impossible to critically assess BC
Hydro’s case for the need for, purpose of and alternatives to the Site C project, based on a mere
1 These include a “self-sufficiency” requirement that blocks imports, a 93% minimum requirement for
“clean or renewable energy”, and the forced closure of the Burrard Thermal plant.
Need for, Purpose of
and Alternatives to
the Site C Hydroelectric Project
ABRIDGED VERSION
Philip Raphals
for the Treaty 8 First Nations
April 2014
Page 2
summary. To get to the heart of the matter, one must address the original documents, which are
found, to the extent that they have been made public, in the IRP and its appendices.
2. NEED FOR, PURPOSE OF AND ALTERNATIVES TO THE
PROPOSED PROJECT
2.1. Need for the Project
In the EIS, the Proponent states that: “The need for the Project is to address future customer
demand … for firm energy and dependable capacity...”2
The Proponent does not claim a need for the 5,100 GWh/yr of energy or for the 1,100 MW of
capacity starting in 2024 that the proposed Site C Project would provide. Rather, the need is
stated in general terms: the Proponent has a need for resources that would allow it to meet future
customer demand.
In fact, the 2013 IRP makes clear that it is the need for capacity that drives its planning process.
The problem that the Site C Project is intended to solve is thus BC Hydro’s need for additional
capacity.3
2.2. Purpose of the Project
In the EIS, BC Hydro states:
The purpose of the Project is to:
2 Section 5.2.
3 The term “capacity” refers to a utility’s ability to meet peak demand. For example, a hydro utility may
have enough water stored in its reservoirs to meet annual energy needs (energy adequacy), but still be unable to meet peak demand on the coldest or warmest day of the year (capacity shortfall). Energy requirements are measured in gigawatthours (1 GWh = 1,000,000 kWh); peak capacity requirements are measured in megawatts (1 MW = 1,000,000 watts).

Need for, Purpose of
and Alternatives to
the Site C Hydroelectric Project
ABRIDGED VERSION
Philip Raphals
for the Treaty 8 First Nations
April 2014
Page 3
• Cost-effectively meet BC Hydro’s forecasted need for energy and capacity …
• Align with the relevant objectives of Section 2 of the Clean Energy Act and relevant B.C.
Government policy statements, which in turn were used to develop Project-specific
objectives, including the objective to maximize the development of the hydroelectric
potential of the Site C Flood Reserve. …4
The primary purpose of the project is thus to meet the identified need “cost-effectively,” i.e. at
lower cost than the alternative means of meeting the need. As noted above, that need is above all
a need for capacity.
The EIS also asserts a secondary purpose, which is more problematic: “to maximize the
development of the hydroelectric potential of the Site C Flood Reserve.” If this objective is
retained, there can be no alternatives possible — only “alternative means to carry out the
Project”, since none of the alternatives to meet BC Hydro’s capacity needs would maximize the
development of the hydroelectric potential of the Site C Flood Reserve.
The Joint Review Panel’s terms of reference require it to examine “alternatives to the Project” (s.
2.2), as recommended by the Operational Policy Statement. In order to make such an
examination possible, the Joint Review Panel should follow the lead of the Panel in the Lower
Churchill Panel Review and disregard the claimed objective “to maximize the development of
the hydroelectric potential of the Site C Flood Reserve”. Instead, it should conclude that the
Purpose of the Project, from the Proponent’s perspective, is to cost-effectively meet BC Hydro’s
forecast need for capacity and, to a lesser extent, energy.
2.3. Alternatives to the Project
In the EIS, the Proponent describes the “technically and economically feasible alternatives to the
Project” by first identifying Available Resources, after “Screening” potential alternatives that it
4 EIS, s. 5.3, p.5-22
Need for, Purpose of
and Alternatives to
the Site C Hydroelectric Project
ABRIDGED VERSION
Philip Raphals
for the Treaty 8 First Nations
April 2014
Page 4
considers to be “not viable”.
It is important to recognize that the Available Resources do not in themselves constitute
Alternatives to the Project. Rather, they are components of larger portfolios that may or may not
include the Project. Portfolios without the Project are thus the Alternatives to which the Project
(or rather, a portfolio including the Project) is compared.
Thus, it is only through portfolio analysis that one can determine the cost-effectiveness of the
Project as compared to the Alternatives. Considerable scrutiny is therefore required of this
portfolio analysis and of the choice of resources to be included or excluded.
3. THE PROPONENT’S ALTERNATIVES ANALYSIS
3.1. Available Resources
BC Hydro begins its analysis by identifying the Available Resources. In doing so, however, it
has:
applied a constraint that artificially limits the use of Simple Cycle Gas Turbines for
capacity needs;
neglected to include DSM Capacity Resources, which are “screened” (excluded) by
the Proponent; and
neglected to include DSM Option 3, a more aggressive version of the existing
demand-side management programs.
In the following sections, we shall look at each of these in turn.
3.1.1. Simple Cycle Gas Turbines (SCGT) as a capacity resource
The CEA establishes the objective of generating at least 93% of the electricity in B.C. from clean
(i.e. non-greenhouse gas emitting) or renewable resources. The 2013 IRP concludes that the

Need for, Purpose of
and Alternatives to
the Site C Hydroelectric Project
ABRIDGED VERSION
Philip Raphals
for the Treaty 8 First Nations
April 2014
Page 5
optimal use of the remaining 7% “GHG headroom” is as a transmission alternative or as a
“capacity and contingency resource”.
BC Hydro correctly identifies simple-cycle gas turbines (SCGTs) as a capacity resource.
However, it makes an unjustified assumption that substantially limits the usefulness of this
resource: that SCGTs will operate with an 18% capacity factor. This implies that, on average, an
SCGT will operate 18% * 8760 = 1577 hours per year —the equivalent of operating 8 hours a
day for almost 200 days a year.
BC Hydro justifies this position by maintaining that capacity resources should be capable of
operating from 6am to 10pm, 6 days a week, from November through February.5 However, just
because a resource is capable of operating for that many hours does not mean that it is likely to
do so. In reality, some capacity resources are operated less than 1% of the time, others around
5%, and so on.6
Assuming such a high capacity factor means that each SCGT uses up a significant portion of the
7% “GHG headroom” under the Clean Energy Act. Because so much natural gas is assumed to
be used each time an SCGT is built for capacity purposes, this flexible and inexpensive capacity
resource is used only sparingly in the Proponent’s scenarios.
The alternate resource scenarios presented below do not retain this assumption, allowing SCGT’s
to operate as little as 5% of the time. As a result, they become a much more flexible and cost-
effective capacity resource — far less expensive than developing Site C to meet capacity needs,
as we shall see below.
5 Rebuttal Testimony with respect to the Submissions of Philip Raphals, p. 14.
6 P. Raphals, Response to BC Hydro’s Rebuttal Testimony, pp. 14-18.

Need for, Purpose of
and Alternatives to
the Site C Hydroelectric Project
ABRIDGED VERSION
Philip Raphals
for the Treaty 8 First Nations
April 2014
Page 6
3.1.2. DSM Options
In the EIS, the Proponent describes its current DSM Target and describes the DSM Options that
it developed. To understand the full range of the five DSM Options considered by BC Hydro,
however, one must look to the 2012 Draft IRP.
Each of the five Options is a package of measures and programs, of increasing intensity,
consisting of five components: codes and standards, conservation rate structures, programs,
supporting initiatives and other tactics. Each DSM Option pursues these five components more
aggressively than the Option before it.
The current DSM path is Option 2. In the EIS, Options 4 and 5 were identified as Screened
Resources, because, in the Proponent’s view, they present “government and customer acceptance
issues” and delivery risk.
In the EIS, DSM Option 3 was neither screened nor included as an Available Resource. In
response to criticism, this omission was corrected in the Evidentiary Update,7 which identified
DSM Option 3 as an Available Resource. The Update then presented, in summary fashion, the
results of a portfolio comparison purporting to demonstrate that DSM Option 3 would result in
increasing present value costs. However, no details are provided as to the comparison made or
the assumptions used.
In the 2013 IRP, however, we learn the real reason for excluding DSM Option 3: that it is
incompatible with the need to scale back DSM in the short-term to respond to the current
energy surplus and the financial difficulties facing BC Hydro.
For DSM Option 3, the ability to reduce current expenditure levels was considered but
dismissed. Option 3 targeted increased program activities and expenditures to target the
greatest level of DSM program savings currently considered deliverable. It is BC Hydro’s
professional judgement that to reduce near-term expenditures but continue to rely upon the
7 BC Hydro, Evidentiary Update, Sept. 13, 2013, p. 4.

Need for, Purpose of
and Alternatives to
the Site C Hydroelectric Project
ABRIDGED VERSION
Philip Raphals
for the Treaty 8 First Nations
April 2014
Page 7
longer term savings is not believable or prudent in the case of DSM Option 3.8 (underlining
added)
In other words, BC Hydro chose Option 2 for the long term because, given its planned cutbacks
in DSM spending in the short-term, Option 3 was no longer viable.
Handicapping future DSM to palliate a surplus resulting from past planning errors is a short-
sighted strategy, and incompatible with the importance given to DSM in the statutory Energy
Objectives in the CEA. Forcing DSM to act as the marginal resource to be scaled down whenever
supply-side resources are over-acquired will continue to prevent DSM from taking its preferred
place in the resource portfolio. In fact, the short-term savings from cutting back DSM are small
compared to the long-term costs that flow from this short-sighted decision.
By the mid-2020s, choosing DSM Option 3 over DSM Option 2 would result in additional
savings of over 200 MW of capacity and over 1,200 GWh/yr of energy. These savings are
substantial and are used in the alternate portfolios described below in section 4.
3.1.3. DSM Capacity Initiatives
Traditional DSM programs are focussed primarily on saving energy, though they do also reduce
capacity needs.9 DSM Capacity Initiatives (also referred to as “Capacity-focused DSM”) refer to
measures that are specifically designed to reduce peak demand. These initiatives were
considered by BC Hydro not to be Available Resources, because they were found to be “not
viable”.
8 Final IRP, s. 4.2.5.2, “Delay Planned Ramp-ups in Spending on DSM Activities,” p. 4-18.
9 For example, a program that provides incentives for home insulation reduces the total amount of energy
a house requires per year (energy requirements), but it also reduces the amount of power required during the coldest day of the year (capacity requirements).
Need for, Purpose of
and Alternatives to
the Site C Hydroelectric Project
ABRIDGED VERSION
Philip Raphals
for the Treaty 8 First Nations
April 2014
Page 8
In defence of this position, BC Hydro argues that these resources are not yet well understood,
and that pilot projects will be required. These are legitimate concerns. As with energy-focused
DSM, there is a learning curve, and BC Hydro is less advanced with respect to capacity-focused
DSM.
It would be entirely reasonable, considering these factors, to discount to a certain extent the
amount of capacity-focused DSM that will actually be achieved. However, to screen this
potential entirely, thereby assuming that 0 MW of capacity-focused DSM will be achieved in
the next 20 years cannot be justified.
Not only does BC Hydro inappropriately exclude all DSM capacity initiatives, it has also chosen
to completely ignore the capacity-saving potential of time-of-use rates, which it had recognized
in its 2012 Draft IRP.
The capacity-focused DSM initiatives identified in the EIS consist of just two resources:
Industrial load curtailment and “capacity programs”, having mean expected capacity savings of
382 MW and 193 MW, respectively.
Time of use (TOU) rates were identified as a capacity resource in the 2012 Draft IRP. A time-of-
use rate structure, which imposes more expensive rates during peak periods, tends to shift
consumption from peak to off-peak, thereby reducing peak demand. Capacity savings of over
400 MW were attributed to this option in 2012, bringing the combined capacity savings for
capacity-focused DSM to over 1,000 MW, as shown in Figure 1.
None of these capacity resources are called upon in BC Hydro’s Integrated Resource Plan.

Need for, Purpose of
and Alternatives to
the Site C Hydroelectric Project
ABRIDGED VERSION
Philip Raphals
for the Treaty 8 First Nations
April 2014
Page 9
Figure 1. Figure 3-4 of the 2012 Draft IRP
During the debates about Smart Meters, the former energy Minister apparently spoke out against
time-of-use rates. However, in 2011, BC Hydro project manager Gary Murphy was quoted as
saying:
If the choice that customers have in the future is between building more generating capacity
or going to time-of-use rates, economically it’s a clear slam-dunk. It’s cheaper to conserve
than to build new generators.10
The current energy minister has in fact shown interest in time-of-use rates, asking the BC
Industrial Electricity Policy Review Task Force to study them. This Task Force has recently
recommended that BC Hydro offer options such as retail access and time-of-use rates to reduce
costs and electricity demand for industrial customers, and the government has indicated it will
act on this recommendation. There is thus no reason to exclude time-of-use rates from the
potential capacity-focused DSM.
10 “No time-of-use billing for B.C., Energy Minister insists,” The Globe and Mail, Tuesday, Sep. 27, 2011.

Need for, Purpose of
and Alternatives to
the Site C Hydroelectric Project
ABRIDGED VERSION
Philip Raphals
for the Treaty 8 First Nations
April 2014
Page 10
More broadly, there is no reason to exclude capacity-focused DSM from the Proponent’s list of
Available Resources. By all measures, capacity-focused DSM is an extremely important and
cost-effective component for alternate portfolios to be compared to those built around Site C.
Given the size of this resource (similar to that of Site C) and its very low cost, the
Proponent’s decision to exclude capacity-focused DSM entirely from consideration vitiates
and invalidates the alternatives analysis on which the EIS rests.
3.2. Block vs. Portfolio Analysis
The IRP makes clear that BC Hydro carries out two distinct types of resource analysis: block
analysis and portfolio analysis. While the EIS also mentions these two types of analysis, the
results presented therein are in fact those of the block analysis. The portfolio analysis, which
represents the heart of BC Hydro’s planning process, is essentially ignored in the EIS.
3.2.1. Block analysis
The Block Analysis compares Site C to similarly sized blocks of energy and capacity from other
sources. This approach is fundamentally flawed. The commissioning of Site C would be
accompanied by enormous capacity and energy surpluses, especially in low-load scenarios, and,
as we shall see below, the revenues that would result from exporting those surpluses are far less
than the annual cost of Site C. Thus, the “lumpiness” of Site C is a significant disadvantage in
relation to more modular resources. Indeed, grasping the scope and depth of these surpluses,
and their financial consequences, is one of the key challenges to assessing the
characteristics of Site C, from an energy planning perspective. Therefore, comparing Site
C to “blocks” of other resources that artificially reproduce the same surpluses is an
exercise of little value. Yet it is on this type of analysis that the conclusions presented in the
EIS are for the most part based.
The Block Analysis in the EIS refers to three categories of portfolios:

Need for, Purpose of
and Alternatives to
the Site C Hydroelectric Project
ABRIDGED VERSION
Philip Raphals
for the Treaty 8 First Nations
April 2014
Page 11
Portfolios including Site C,
Portfolios excluding Site C, which do not include thermal generation (Clean
Generation Portfolios), and
Clean + Thermal Generation Portfolios, which use SCGTs to provide capacity.
All three portfolios were designed to provide the same amounts of energy and capacity as Site C
(1100 MW and 5,100 GWh/yr). Figure 5.11 from the EIS, which compares the capacity of the
three block portfolios, is reproduced below as Figure 2.
Figure 2
In other words, the Block Analysis presented in the EIS compares three generation
portfolios, one of which unavoidably creates an expensive surplus (Site C), and the other
two which expressly and unnecessarily recreate the same expensive surplus. This analysis
is without probative value.

Need for, Purpose of
and Alternatives to
the Site C Hydroelectric Project
ABRIDGED VERSION
Philip Raphals
for the Treaty 8 First Nations
April 2014
Page 12
3.2.2. Portfolio analysis (System Optimizer)
The portfolio analysis eliminates this problem by building optimized portfolios for each set of
assumptions. A portfolio analysis of this type was explicitly presented in the IRP, but not in the
EIS.
In the IRP, two types of analysis are clearly distinguished:
1. The block comparison compares Site C to its alternatives over their project lives and
demonstrates the long term value of Site C.
2. The second method creates and evaluates portfolios using the linear optimization
model (System Optimizer) that selects the optimal combinations of resources over a 30-
year planning horizon under different assumptions and constraints. The analysis using
System Optimizer is a more sophisticated approach and provides additional information
not captured by the simple unit cost comparison …
The energy planning exercise that underpins the IRP is the second method. It examined more
than 50 scenarios, each one defined by the load growth scenario, the LNG scenario, the DSM
Option, DSM deliverability, the market price scenario, the inclusion or not of Site C, and other
parameters. For each scenario, System Optimizer selects the resource portfolio that minimizes
total present value costs.11
Thus, unlike in the Block Analysis, the alternative portfolios are not
forced to reproduce the Site C surplus. However, this portfolio analysis is nevertheless tainted by
its failure to consider the resources discussed above (low capacity-factor SCGTs, DSM Option 3,
and DSM Capacity Initiatives).
Based on BC Hydro’s portfolio analysis, the IRP develops Base Resource Plans (BRPs) and
Contingency Resource Plans (CRPs), both with and without LNG. The CRP with LNG is a
11 While a large number of scenarios are analyzed, the vast majority of them use the mid-load forecast
and DSM Option 2, with medium DSM deliverability. Only four scenarios use the low load forecast (with and without Site C, and with and without thermal resources); there is no exploration of the effect of low market prices or high DSM deliverability, for example, in a low load scenario. Similarly, only three scenarios use DSM Option 3. No scenarios use Capacity-focused DSM, and none use higher-than-average deliverability from DSM.

Need for, Purpose of
and Alternatives to
the Site C Hydroelectric Project
ABRIDGED VERSION
Philip Raphals
for the Treaty 8 First Nations
April 2014
Page 13
“worst-case” scenario from a reliability standpoint, with high load growth, low DSM
deliverability, and new loads due to LNG development.12
In Section 4, I will reconstruct these Resource Plans, taking into account the additional resources
described above.
3.3. The Size and Cost of the Site C Surplus
As we have seen, in the EIS BC Hydro calculates the benefits to the ratepayer of the Site C
Project, by comparing its cost to the “avoided cost” of similarly sized blocks of energy and
capacity. The results appear to present unequivocal proof the Site C Project is more cost-
effective than the alternatives.
However, these results are based on the Block Analysis described above. The Clean and
Clean + Thermal portfolios are forced to reproduce the large and expensive surplus that Site C
would create. The benefit flowing from the flexibility inherent in these approaches is simply
lost.
A significant portion of the Site C Project’s energy and capacity will be surplus to BC Hydro’s
needs for many years after the in-service date, and is subject to many uncertainties. Surplus
energy has little economic value considering current and expected export market prices, and
surplus capacity has little or no economic value.13
12 The new LNG loads do not include the energy required for compression, which it is assumed will be
provided by natural gas.
13 BC Hydro has recently argued that its surplus capacity may in fact have some value in the California
market. Even if this is turns out to be the case, it is unlikely that the value would be significant, in relation to the annual cost of the Site C Project.

Need for, Purpose of
and Alternatives to
the Site C Hydroelectric Project
ABRIDGED VERSION
Philip Raphals
for the Treaty 8 First Nations
April 2014
Page 14
There is no way to develop the Site C project without creating these large surpluses. However,
that is not true for the resources that make up the other two Block Portfolios (Clean and
Clean+Thermal). A present value cost comparison between these three Block Portfolios is
thus entirely misleading.
To better understand the scope of the energy surpluses in the Site C portfolios, it is necessary to
look at the scenarios presented in Appendix 6A of the 2013 IRP. For each one, a graph is
presented which shows year-by-year imports and exports under the scenario modelled. The blue
line in these figures shows the net exports (on- and off-peak exports minus off-peak imports) for
each year from 2016 through 2040.
Figure 3 shows imports and exports for the first portfolio presented by BC Hydro as the “Site C
Base Case.” 14
It shows net exports (the blue line) of about 6 TWh in 2016. They fall to 1 TWh
in 2022, and then rise gain to 6 TWh in 2024, with commissioning of Site C. Net exports remain
positive through 2033.
14 BC Hydro, Draft IRP, August 2013, Appendix 6A, Scenario M&M_1LC_NN0_05Q, p. 6A-40.

Need for, Purpose of
and Alternatives to
the Site C Hydroelectric Project
ABRIDGED VERSION
Philip Raphals
for the Treaty 8 First Nations
April 2014
Page 15
Figure 3. Site C Base Case
In order to get an idea of the magnitude of these effects, it is useful to evaluate the cost of the
Site C project from a capacity perspective. Given that the underlying need for the Site C project
is to meet the Proponent’s capacity requirements, one could also describe the costs of Site C as a
capacity resource.
In the years when much of the energy from Site C is surplus to BC needs and so will have to be
exported (at a loss), the Project’s capacity cost is very high. BC Hydro has acknowledged that,
under the medium market price scenario, Site C’s capacity cost will be over $300/kW-yr in the
initial years after commissioning, when its energy is 100% surplus. As seen in Figure 4, if all of

Need for, Purpose of
and Alternatives to
the Site C Hydroelectric Project
ABRIDGED VERSION
Philip Raphals
for the Treaty 8 First Nations
April 2014
Page 16
the energy from Site C were to be exported, its capacity unit cost would remain over $225/kW-yr
throughout the planning period, again under the medium market price scenario.15
Figure 4.
This is much higher than the cost of the other capacity resources considered in the IRP:
Capacity Cost
($/kW-yr)
Source
SCGT $100 Evidentiary Update, p. 60
Revelstoke Unit 6 $50 Evidentiary Update, p. 60
GSM Units 1-5 $35 Evidentiary Update, p. 60
Industrial load curtailment $45 2013 IRP, Table 3-6, p. 3-30
Capacity-Focused Programs $69 2013 IRP, Table 3-6, p. 3-30
TOU Rates Very low 2012 IRP, Figure 3-5, p. 3-21
15 BC Hydro acknowledges this in its Rebuttal Testimony, p. 12, Figure 1.
$0
$50
$100
$150
$200
$250
$300
$350
$400
20
24
20
25
20
26
20
27
20
28
20
29
20
30
20
31
20
32
20
33
20
34
20
35
20
36
20
37
20
38
20
39
20
40
mill
ion
s o
f d
olla
rs
Annual Capacity Cost of Site C assuming 100% of energy exported
high market price scenario
medium market price scenario
low market price scenario

Need for, Purpose of
and Alternatives to
the Site C Hydroelectric Project
ABRIDGED VERSION
Philip Raphals
for the Treaty 8 First Nations
April 2014
Page 17
In later years, the effective capital cost of Site C depends on the value we attribute to the energy
used in BC. If Site C energy used by BC Hydro customers is valued at the price at which it could
be purchased in the (import) market, the capacity cost remains at high levels. If, on the other
hand, it is assumed that the alternative energy supply consists of expensive new renewables, this
effect tapers off sharply. In either case, though, throughout the 2020s, Site C remains a very
expensive capacity resource.
The picture is much worse under the low load growth scenario. The following chart shows the
low load scenario, with Site C in service in 2024.
Figure 5. Scenario L&L_1LC_NN0_05Q (low load growth, DSM Option 2 with low deliverability, no LNG, Site C)
In this scenario, there is already a large surplus at the beginning of the period, with net exports of
about 9500 GWh in 2017. With Site C, net exports rise to almost 10,000 GWh in 2024, and
decline only gradually. By 2040, they are still almost 3000 GWh, or more than half of the
energy output of Site C. This would imply a capacity cost for Site C of more than $150/kW-
year, through 2040.

Need for, Purpose of
and Alternatives to
the Site C Hydroelectric Project
ABRIDGED VERSION
Philip Raphals
for the Treaty 8 First Nations
April 2014
Page 18
Without Site C, net exports would decrease much more rapidly, and reach zero around
2035. BC Hydro acknowledges that the present value costs for this scenario are more than
$1 billion dollars less than for the scenario with Site C.16
Given that the constant-dollar unit costs of Site C (about $94/MWh) are considerably greater
than the forecast export prices ($28 to $44/MWh, according to the medium forecast17
), the fact
that a substantial portion of the energy generated by Site C will be sold at export for a number of
years will inevitably have an adverse effect on the project’s profitability. However, the
Proponent’s methodology of using a Block Analysis to compare Site C to portfolios of the same
size (capacity and energy) has the result of making this effect disappear. It thus cannot be relied
on for decision-making purposes.
4. ALTERNATIVES TO THE PROPOSED PROJECT
As noted above, the Alternatives to the Project consist of portfolios that meet BC’s energy and
capacity needs but that do not include the Project.
We have seen in the previous section that the Proponent’s analysis of alternatives is
fundamentally flawed because it is based on a Block Analysis that only compares the proposed
Site C project to alternate portfolios that intentionally and unnecessarily share the proposed
Project’s greatest flaw — its large scale, and the surpluses that result therefrom.
We have also seen that the Proponent’s analysis ignored several alternate resources that should
have been considered, including DSM Option 3, DSM capacity-focused resources and SCGTs as
a pure capacity resource.
16 BC Hydro, 2013 Final IRP, Appendix 6A, Table 4, p. 6A-37 (small gap portfolios).
17 For the years 2024 through 2040. BC Hydro, 2013 Final IRP, Appendix 5A, p. 5A-7.

Need for, Purpose of
and Alternatives to
the Site C Hydroelectric Project
ABRIDGED VERSION
Philip Raphals
for the Treaty 8 First Nations
April 2014
Page 19
In this section, I will present an alternatives analysis that remedies both these flaws. Using
different load scenarios, this analysis compares the detailed resource plans prepared by BC
Hydro to alternate plans that take advantage of the additional resources described above in
section 3.1.
As we shall see, all of the alternative portfolios analyzed have lower present value costs than
the corresponding portfolios containing Site C. This demonstrates the importance of the
resource options that were excluded from the IRP and the EIS.
While the exercise described here is quantitative, its significance is qualitative. It demonstrates
that the exclusion of key Available Resources, such as DSM Option 3, DSM Capacity
Initiatives, and low capacity factor SCGTs, really does affect the outcome significantly. It
shows that, once corrected in this way, the portfolios containing Site C are consistently
more costly than the alternatives.
The Recommended Actions in BC Hydro’s 2013 IRP are based on four Resource Plans: Base
Resource Plans (BRPs) with and without LNG, and Contingency Resource Plans (CRPs), again
with and without LNG. These plans were all developed using the scenario portfolio analysis
described earlier. The BRPs are based on the medium load growth scenario, with medium
deliverability of DSM; the CRPs are based on the high load growth scenario and low
deliverability of DSM.
For the sake of simplicity, I will focus on the lowest and highest of the four scenarios: BRP
without LNG, and CRP with LNG. At the same time, I will look at outcomes under an additional
scenario that BC Hydro did not include in its Resource Plans, in which load growth follows the
low scenario (the “Low Growth Resource Plan”, or LGRP).
For each of these scenarios, I have prepared an alternate resource plan that does not include Site
C.

Need for, Purpose of
and Alternatives to
the Site C Hydroelectric Project
ABRIDGED VERSION
Philip Raphals
for the Treaty 8 First Nations
April 2014
Page 20
All of these alternate resource plans make use of the resources discussed above which were
unnecessarily excluded from the Proponent’s analysis, namely DSM Option 3, capacity-focused
DSM and low capacity-factor SCGTs.
These portfolios all respect the constraints created by the Clean Energy Act:
The self-sufficiency requirement, which dictates that in-province generation be
sufficient to meet the mid-load forecast;18
The requirement that 93% of all BC generation be from “Clean” or renewable
sources.
In each of these alternate portfolios, capacity savings for Industrial Load Curtailment and
Capacity-focused DSM programs have been maintained at the P10 level described in the EIS.19
Time of Use capacity savings have been reduced to 50% of the potential indicated in the 2012
Draft IRP. To respond to BC Hydro’s concerns about relying exclusively on demand-side
resources for capacity needs, an additional 200 MW or more of SCGTs or other supply-side
capacity resources have been added starting in 2020, resulting in a substantial planned capacity
surplus throughout the 2020s.
I have also proposed “optimized” Site C portfolios, which also use these demand-side resource
alternatives in addition to Site C, when doing so results in cost reductions.
For each alternate portfolio, I have calculated the year-by-year costs for resources which are
removed from or added to the underlying BRP or CRP scenario.20
The costs are based on
levelized unit energy costs provided by BC Hydro, as well as year-by-year import costs and
18 This does not apply to the CRP, which is based on high load forecast.
19 The P10 level is the level that BC Hydro estimates will be exceeded 90% of the time. It is thus a very
conservative estimate of future capacity savings.
20 These include capacity costs (annual cost of new equipment required to meet capacity requirements),
energy costs (market purchases and energy costs of clean and gas-fired resources, net of export revenues), and additional DSM costs.

Need for, Purpose of
and Alternatives to
the Site C Hydroelectric Project
ABRIDGED VERSION
Philip Raphals
for the Treaty 8 First Nations
April 2014
Page 21
export revenues, based on BC Hydro’s long-term medium market price forecast (found in
Appendix 5A of the 2013 IRP). The present value is then calculated for these year-to-year costs
and revenues, for each scenario.
This differential cost analysis only reflects the elements that change from one scenario to
another. Costs of elements that remain unchanged are not included in this analysis. Thus, the
costs reported here are only meaningful in comparison one to the other, and are not comparable
to the total portfolio costs presented in the EIS or the IRP.
4.1. Base Resource Plan without LNG
The Base Resource Plan (BRP) represents BC Hydro’s base-case scenario, based on the medium
load growth scenario and medium DSM deliverability.
4.1.1. BC Hydro’s Base Resource Plan without LNG, with Site C
BC Hydro’s Base Resource Plan (BRP) without LNG is portrayed graphically in the IRP as
follows:
Figure 6. BRP without LNG (Site C, IRP) − Energy

Need for, Purpose of
and Alternatives to
the Site C Hydroelectric Project
ABRIDGED VERSION
Philip Raphals
for the Treaty 8 First Nations
April 2014
Page 22
Figure 7. BRP without LNG (Site C, IRP) − Capacity
In this scenario, all of the energy and most of the capacity of Site C are surplus to BC Hydro’s
needs (the dashed green line, which represents demand after conservation) upon commissioning.
4.1.2. BRP without LNG, with Site C (optimized)
Capacity-focused DSM programs and DSM Option 3 make it possible to defer the capacity need
for Site C until 2029. GMS Units 1-5 Capacity Increase is added as of F2021, to provide
“insurance” for the reliance on DSM for capacity needs. This results in savings of $260 million
in relation to the original BRP. By deferring the commissioning date of Site C, this scenario also
creates an unquantified flexibility benefit, in delaying the go/no-go date to a point where many of
the uncertainties regarding demand-side resources and LNG development will likely be resolved.

Need for, Purpose of
and Alternatives to
the Site C Hydroelectric Project
ABRIDGED VERSION
Philip Raphals
for the Treaty 8 First Nations
April 2014
Page 23
Figure 8
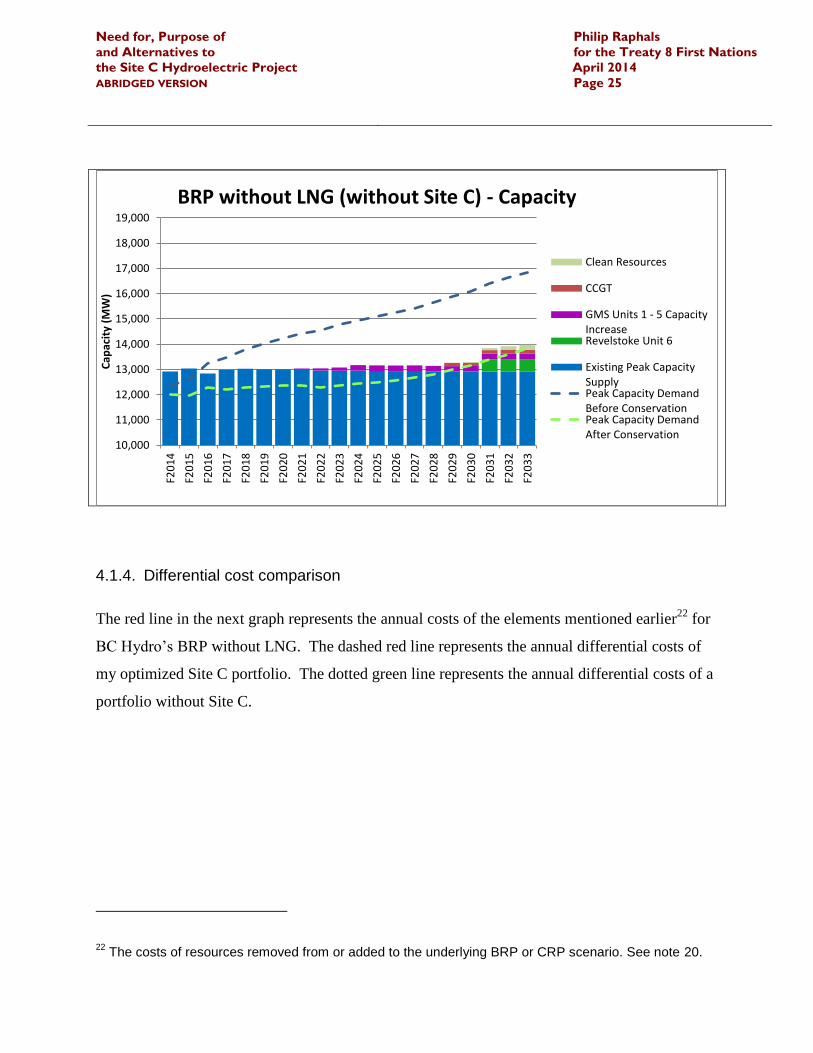
4.1.3. BRP without LNG, without Site C
As in the previous portfolio, GMS Units 1-5 Capacity Increase is added early to provide capacity
insurance, and CCGTs are added, within the limits of gas headroom, to meet energy needs.
Additional energy needs are met with Clean Resources. In F2029, 125 MW of CCGTs are added,
40,000
50,000
60,000
70,000
80,000
90,000
100,000
F20
14
F20
15
F20
16
F20
17
F20
18
F20
19
F20
20
F20
21
F20
22
F20
23
F20
24
F20
25
F20
26
F20
27
F20
28
F20
29
F20
30
F20
31
F20
32
F20
33
An
nu
al E
ner
gy (
GW
h/y
r)
BRP without LNG (Site C, optimized) - Energy
Site C
Total existing andcommitted supply
Annual Energy DemandBefore Conservation
Annual Energy DemandAfter Conservation
10,000
11,000
12,000
13,000
14,000
15,000
16,000
17,000
18,000
19,000
F20
14
F20
15
F20
16
F20
17
F20
18
F20
19
F20
20
F20
21
F20
22
F20
23
F20
24
F20
25
F20
26
F20
27
F20
28
F20
29
F20
30
F20
31
F20
32
F20
32
Cap
acit
y (M
W)
BRP without LNG (Site C, optimized) - Capacity
Site C
GMS Units 1 - 5 CapacityIncrease
Existing Peak CapacitySupply
Peak Capacity DemandBefore Conservation
Peak Capacity DemandAfter Conservation
Need for, Purpose of
and Alternatives to
the Site C Hydroelectric Project
ABRIDGED VERSION
Philip Raphals
for the Treaty 8 First Nations
April 2014
Page 24
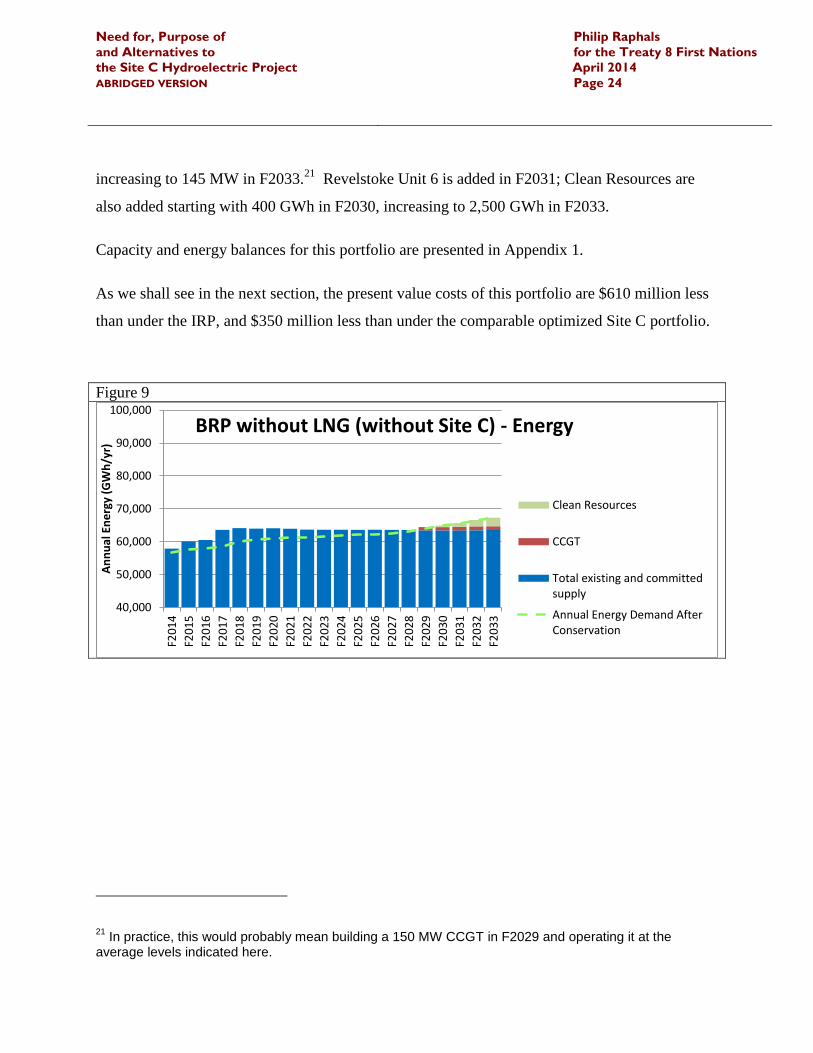
increasing to 145 MW in F2033.21
Revelstoke Unit 6 is added in F2031; Clean Resources are
also added starting with 400 GWh in F2030, increasing to 2,500 GWh in F2033.
Capacity and energy balances for this portfolio are presented in Appendix 1.
As we shall see in the next section, the present value costs of this portfolio are $610 million less
than under the IRP, and $350 million less than under the comparable optimized Site C portfolio.
Figure 9
21 In practice, this would probably mean building a 150 MW CCGT in F2029 and operating it at the
average levels indicated here.
40,000
50,000
60,000
70,000
80,000
90,000
100,000
F20
14
F20
15
F20
16
F20
17
F20
18
F20
19
F20
20
F20
21
F20
22
F20
23
F20
24
F20
25
F20
26
F20
27
F20
28
F20
29
F20
30
F20
31
F20
32
F20
33
An
nu
al E
ne
rgy
(GW
h/y
r)
BRP without LNG (without Site C) - Energy
Clean Resources
CCGT
Total existing and committedsupply
Annual Energy Demand AfterConservation
Need for, Purpose of
and Alternatives to
the Site C Hydroelectric Project
ABRIDGED VERSION
Philip Raphals
for the Treaty 8 First Nations
April 2014
Page 25
4.1.4. Differential cost comparison
The red line in the next graph represents the annual costs of the elements mentioned earlier22
for
BC Hydro’s BRP without LNG. The dashed red line represents the annual differential costs of
my optimized Site C portfolio. The dotted green line represents the annual differential costs of a
portfolio without Site C.
22 The costs of resources removed from or added to the underlying BRP or CRP scenario. See note 20.
10,000
11,000
12,000
13,000
14,000
15,000
16,000
17,000
18,000
19,000
F20
14
F20
15
F20
16
F20
17
F20
18
F20
19
F20
20
F20
21
F20
22
F20
23
F20
24
F20
25
F20
26
F20
27
F20
28
F20
29
F20
30
F20
31
F20
32
F20
33
Cap
acit
y (M
W)
BRP without LNG (without Site C) - Capacity
Clean Resources
CCGT
GMS Units 1 - 5 CapacityIncreaseRevelstoke Unit 6
Existing Peak CapacitySupplyPeak Capacity DemandBefore ConservationPeak Capacity DemandAfter Conservation

Need for, Purpose of
and Alternatives to
the Site C Hydroelectric Project
ABRIDGED VERSION
Philip Raphals
for the Treaty 8 First Nations
April 2014
Page 26
Figure 10. BRP (no LNG): Annual differential costs (capacity, energy and DSM)
Again, it is important to recall that these curves represent only the cost categories that vary
among the different plans. Thus, only their relative values are meaningful.
In the years 2014-2023, the alternative portfolios are more expensive than the IRP (Site C)
portfolio (the solid red line), primarily because of the additional DSM costs (Option 3 and the
new capacity-focused DSM programs). In the Site C (optimized) case (the dashed red line), the
spike representing commissioning of Site C is deferred by six years (due to the additional DSM),
and is also smaller, since the energy surplus is smaller as well. In both cases, the surpluses
resulting from the commissioning of Site C, which are exported at a price far below cost, result
in higher differential costs than the “without Site C” case, despite the higher unit costs of the
Clean Resources. This effect is limited because the natural gas headroom makes it possible to
meet some of the energy shortfall with CCGTs.
-200
-100
0
100
200
300
400
500
600
700F2
01
4
F20
15
F20
16
F20
17
F20
18
F20
19
F20
20
F20
21
F20
22
F20
23
F20
24
F20
25
F20
26
F20
27
F20
28
F20
29
F20
30
F20
31
F20
32
F20
33
$ (
mill
ion
s)
Site C (IRP)
Site C (optimized)
without Site C

Need for, Purpose of
and Alternatives to
the Site C Hydroelectric Project
ABRIDGED VERSION
Philip Raphals
for the Treaty 8 First Nations
April 2014
Page 27
The present value of each of these three cost series, using BC Hydro’s 5% real discount rate, is
shown in the following chart.
Figure 11
Again, it is the relationship between the differential PV costs of each portfolio that is
meaningful, not the absolute value. Thus, this exercise demonstrates that, in the BRP scenario
without LNG, optimizing Site C by delaying its commissioning through the use of additional
DSM and other options discussed above would reduce present value portfolio costs by $260
million. Eliminating Site C by adding low capacity factor SCGTs to meet peak capacity needs
would lower PV costs by an additional $350 million, for a total savings of $610 million
compared to BC Hydro’s BRP.
4.2. Contingency Resource Plan with LNG
The Contingency Resource Plan is meant to ensure that BC Hydro will be able to meet its
demand even under the most challenging conditions. This is thus BC Hydro’s most demanding
scenario, based on high load growth, low DSM deliverability and LNG loads.
$700
$800
$900
$1,000
$1,100
$1,200
$1,300
$1,400
$1,500
$1,600
Dif
fere
nti
al P
V (
$M
)
BRP without LNG
Site C (IRP)
Site C (optimized)
without Site C

Need for, Purpose of
and Alternatives to
the Site C Hydroelectric Project
ABRIDGED VERSION
Philip Raphals
for the Treaty 8 First Nations
April 2014
Page 28
4.2.1. BC Hydro’s Contingency Resource Plan with LNG, with Site C
The capacity chart for the CRP (with LNG) presented in the 2013 IRP is as follows:
Figure 12. CRP with LNG (Site C, IRP) - Energy
Figure 13. CRP with LNG (Site C, IRP) - Capacity

Need for, Purpose of
and Alternatives to
the Site C Hydroelectric Project
ABRIDGED VERSION
Philip Raphals
for the Treaty 8 First Nations
April 2014
Page 29
Under this BC Hydro portfolio, 400 MW of gas-fired generation are added in 2020, 294 MW in
2021, 196 MW in 2022, and another 1,078 MW between 2029 and 2032, for a total of 1960 MW
of simple cycle gas-fired generation (SCGT).
In both CRPs (with and without LNG) there are substantial market energy purchases later in this
decade, reaching 4.5 TWh in 2019.
As before, I have prepared two alternate resource plans based on BC Hydro’s Contingency
Resource Plan with LNG.
4.2.2. CRP with LNG — Site C (optimized)
As we saw earlier in the BRP, the economics of the Site C option can be improved by deferring
the In-Service Date, combined with the capacity-focused DSM programs discussed earlier and a
combination of combined-cycle and simple-cycle gas turbines.
It is interesting to note that, in the CRP scenario published in the 2013 IRP, gas-generated
electricity exceeds the 7% CEA Objective from F2031 on.23
In this optimized Site C portfolio,
gas generation never exceeds the 7% limit. It adds 125 to 225 MW of CCGTs, as well as 200
MW of SCGTs, increasing to 450 MW in F2026 and growing to 1,000 MW in the last three
years of the planning period.
I have also used market energy purchases to limit the amount of more expensive Clean
Resources required. In the detailed CRP (with LNG) published in the IRP, market purchases rise
to 4,506 GWh in F2019, but then taper off. As the self-sufficiency section of the CEA only
23 In F2033, App. 9A of the Final IRP shows 3,000 GWh of electricity from the 1,960 MW of SCGTs.
Added to the existing gas generation of 3,520 GWh, yields 6,520 GWh out of a total supply of 84,290 GWh, or 7.7%.

Need for, Purpose of
and Alternatives to
the Site C Hydroelectric Project
ABRIDGED VERSION
Philip Raphals
for the Treaty 8 First Nations
April 2014
Page 30
applies to planning under mid-level forecasts,24
there appears to be no legal obstacle to
continuing to use low-cost electricity imports in the CRP. In this and the following portfolios,
energy purchases up to, but not exceeding, the level used in BC Hydro’s CRP portfolios have
been allowed.
Even in this high load contingency scenario, the combination of capacity-focused DSM, gas
turbines, energy purchases and clean resources makes it possible to defer Site C until 2027. The
result is to avoid creating an energy surplus and to reduce differential costs by $435 million,
compared to BC Hydro’s CRP.
Figure 14
24 S. 6(2) requires BC Hydro to hold “rights to an amount of electricity that meets the electricity supply
obligations solely from electricity generating facilities within the Province”. “Electricity supply obligations” is defined in s. 6(1) to be determined “by using the authority’s prescribed forecasts”. “Prescribed forecasts” is defined in s. 2 of the Electricity Self-Sufficiency Regulation as “the authority’s mid-level forecasts”.
40,000
50,000
60,000
70,000
80,000
90,000
100,000
F2
01
4
F2
01
5
F2
01
6
F2
01
7
F2
01
8
F2
01
9
F2
02
0
F2
02
1
F2
02
2
F2
02
3
F2
02
4
F2
02
5
F2
02
6
F2
02
7
F2
02
8
F2
02
9
F2
03
0
F2
03
1
F2
03
2
F2
03
3
MW
CRP with LNG (Site C, optimized) - Energy
Site C
Clean Resources
SCGT
Market Purchases
CCGT
Total existing andcommitted supply
Annual Energy DemandBefore Conservation
Annual Energy DemandAfter Conservation

Need for, Purpose of
and Alternatives to
the Site C Hydroelectric Project
ABRIDGED VERSION
Philip Raphals
for the Treaty 8 First Nations
April 2014
Page 31
4.2.3. CRP with LNG — without Site C
As in the previous scenario, CCGTs, Clean Resources and purchases provide virtually all the
additional energy requirements. Additional capacity is provided by Revelstoke 6, GMS Units 1-
5 and SCGTs. The full 7% gas headroom is utilized for much of the planning period, but is
never exceeded.
Capacity and energy balances for this portfolio are presented in Appendix 2.
10,000
11,000
12,000
13,000
14,000
15,000
16,000
17,000
18,000
19,000
MW
CRP with LNG (Site C, optimized) – Capacity
Site C
Clean Resources
SCGT
CCGT
GMS Units 1 - 5 Capacity Increase
Revelstoke Unit 6
Market Purchases
Existing Peak Capacity Supply
Peak Capacity Demand BeforeConservationPeak Capacity Demand AfterConservation

Need for, Purpose of
and Alternatives to
the Site C Hydroelectric Project
ABRIDGED VERSION
Philip Raphals
for the Treaty 8 First Nations
April 2014
Page 32
Figure 15
Differential costs are $743 million less than in the original CRP, and are $309 million less than
the optimized CRP with Site C. Once again, the primary reasons are the substitution of energy
from Site C with energy from combined cycle gas turbines and from purchases, both at a
significantly lower cost.
10,000
11,000
12,000
13,000
14,000
15,000
16,000
17,000
18,000
19,000
MW
CRP with LNG (without Site C) - Capacity SCGT
Clean Resources
GMS Units 1 - 5Capacity IncreaseCCGT
Revelstoke Unit 6
Market Purchases
Existing Peak CapacitySupplyPeak Capacity DemandBefore ConservationPeak Capacity DemandAfter Conservation
40,000
50,000
60,000
70,000
80,000
90,000
100,000
F20
14
F20
15
F20
16
F20
17
F20
18
F20
19
F20
20
F20
21
F20
22
F20
23
F20
24
F20
25
F20
26
F20
27
F20
28
F20
29
F20
30
F20
31
F20
32
F20
33
CRP with LNG (without Site C) - Energy
SCGT
Clean Resources
CCGT
Market Purchases
Site C
Total existing andcommitted supplyAnnual Energy DemandBefore ConservationAnnual Energy DemandAfter Conservation

Need for, Purpose of
and Alternatives to
the Site C Hydroelectric Project
ABRIDGED VERSION
Philip Raphals
for the Treaty 8 First Nations
April 2014
Page 33
4.2.4. Differential cost comparison
As shown in the following graph, the differential present value costs for the Site C portfolio,
even when optimized, exceed those without Site C.25
Figure 16
These amended portfolios therefore confirm the “astounding result that even when there is
significant need the portfolios containing the Project are the high cost option.”26
25 The differential present value costs are considerably higher than in my original Submission because
they now include the full cost of all the Clean Resources (the pale green bars in the energy and capacity charts). The cost of Clean Resources was not a differential cost in the original Submission, because it did not vary from one scenario to another.
26 BC Hydro Rebuttal Evidence, p. 27, line 9.
11,000
11,500
12,000
12,500
13,000
13,500
Dif
fere
nti
al P
V (
$M
)
CRP with LNG
Site C (IRP)
Site C (optimized)
without Site C

Need for, Purpose of
and Alternatives to
the Site C Hydroelectric Project
ABRIDGED VERSION
Philip Raphals
for the Treaty 8 First Nations
April 2014
Page 34
4.3. Low Growth Resource Plan (LGRP)
Like most other utilities, in order to quantify the uncertainty in future load growth, BC Hydro
prepares a low and high load growth scenario as part of its annual load forecasting exercise. BC
Hydro’s Base Resource Plan is based on the medium load growth scenario, and its Contingency
Resource Plan is based on the high load growth scenario.
BC Hydro does not present a resource plan that follows its low load scenario. However, its
portfolio analysis does include a few runs based on the low scenario,27
and, using these data, it is
possible to generate graphs similar to those presented in the IRP.
4.3.1. Low Growth Resource Plan (LGRP) without LNG – with Site C
Figures 17 and 18 show the energy and capacity balances for under the low load growth
scenario, assuming that Site C is commissioned in F2024.
Figure 17
27 Such as the one shown in Figure 5 on page 17.
40,000
50,000
60,000
70,000
80,000
F20
14
F20
15
F20
16
F20
17
F20
18
F20
19
F20
20
F20
21
F20
22
F20
23
F20
24
F20
25
F20
26
F20
27
F20
28
F20
29
F20
30
F20
31
F20
32
F20
32
GW
h
LGRP (with Site C) - Energy
Site C
Total existing andcommitted supply
Annual Energy DemandBefore Conservation
Annual Energy DemandAfter Conservation

Need for, Purpose of
and Alternatives to
the Site C Hydroelectric Project
ABRIDGED VERSION
Philip Raphals
for the Treaty 8 First Nations
April 2014
Page 35
The upper chart shows that, under this scenario, the energy surplus in 2032 would be more than
10 TWh — almost double the average annual energy production of Site C!
As seen in the lower chart, under the low load growth scenario, the capacity of Site C would
remain entirely surplus to peak demand needs after conservation until 2032.
4.3.2. LGRP without LNG – without Site C
Given that, under the low load scenario, existing resources will exceed demand in 2032, I did not
analyze an optimized portfolio including Site C.
The LGRP portfolio without Site C is shown in Figure 18.
10,000
11,000
12,000
13,000
14,000
15,000
16,000F2
014
F201
5
F201
6
F201
7
F201
8
F201
9
F202
0
F202
1
F202
2
F202
3
F202
4
F202
5
F202
6
F202
7
F202
8
F202
9
F203
0
F203
1
F203
2
F203
2
MW
LGRP (with Site C) - Capacity
Site C
Existing Peak CapacitySupply
Peak Capacity DemandBefore Conservation
Peak Capacity DemandAfter Conservation

Need for, Purpose of
and Alternatives to
the Site C Hydroelectric Project
ABRIDGED VERSION
Philip Raphals
for the Treaty 8 First Nations
April 2014
Page 36
Figure 18
Even with no new generation resources, BC Hydro would still have surplus energy and capacity
under this scenario, thanks to the increased contribution of DSM. Depending on the relationship
between market prices and the marginal cost of these “negawatt-hours”, it may or may not be
cost-effective to maintain this level of DSM effort in the later years.
40,000
50,000
60,000
70,000
80,000
F20
14
F20
15
F20
16
F20
17
F20
18
F20
19
F20
20
F20
21
F20
22
F20
23
F20
24
F20
25
F20
26
F20
27
F20
28
F20
29
F20
30
F20
31
F20
32
F20
33
GW
h
LGRP (without Site C) - Energy
Total existing andcommitted supply
Annual EnergyDemand BeforeConservation
Annual EnergyDemand AfterConservation
10,000
11,000
12,000
13,000
14,000
15,000
16,000
F20
14
F20
15
F20
16
F20
17
F20
18
F20
19
F20
20
F20
21
F20
22
F20
23
F20
24
F20
25
F20
26
F20
27
F20
28
F20
29
F20
30
F20
31
F20
32
F20
33
MW
LGRP (without Site C) - Capacity
Existing PeakCapacity Supply
Peak CapacityDemand BeforeConservation
Peak CapacityDemand AfterConservation

Need for, Purpose of
and Alternatives to
the Site C Hydroelectric Project
ABRIDGED VERSION
Philip Raphals
for the Treaty 8 First Nations
April 2014
Page 37
4.3.3. Differential cost comparison
Not surprisingly, the portfolio without Site C displays dramatically lower costs (despite the
unnecessarily high levels of DSM), given that Site C would only add to the existing surplus of
both energy and capacity.
In the “without Site C” case, export revenues are lower, but eliminating the costs of Site C
results in a present value difference of over $1.1 billion, in favour of the “without Site C”
portfolio.28
This finding confirms the similar results of BC Hydro’s portfolio analysis, mentioned
on page 18, above.
Figure 19
28 The differential costs are negative because, in both scenarios, the export revenues exceed the other
differential costs. However, because the costs are so much greater in the Site C scenario, the present value costs for the scenario without Site C are over $1 billion less.
-2,500
-2,000
-1,500
-1,000
-500
0
Dif
fere
nti
al P
V
Low Growth Resource Plan without LNG
Site C
without Site C

Need for, Purpose of and Alternatives to the Site C Hydroelectric Project ABRIDGED VERSION
Philip Raphals for the Treaty 8 First Nations April 2014 Page 38
5. CONCLUSIONS
In essence, BC Hydro argues that:
1. British Columbia has a need for new energy and capacity resources within the next 10 to
15 years;
2. BC Hydro must be ready to respond to certain eventualities, such as high load growth,
low DSM delivery and additional LNG demand; and
3. BC Hydro’s Portfolio Analysis demonstrates that the Project is the most cost-effective
way to meet this need.
Regarding the first point, in some scenarios, BC will need new capacity and energy resources in
the next 10 to 15 years, though the amounts that will be required depend on many factors,
including load growth and the extent of investment in, and the performance of, DSM. BC Hydro
most certainly has not demonstrated that the Site C Project is well matched to the amounts
of energy and capacity that will be required.
As we have seen above, BC Hydro has acknowledged that it is the capacity needs that drive its
plan to commission Site C in F2024.
As for the second point, BC Hydro’s contingency resource plans, which rely primarily on gas-
fired generation, are meant to respond to these eventualities. (The BRP with LNG also relies on
natural gas to meet the additional demand.) Indeed, in the IRP, the “natural gas headroom”
allowed under the Clean Energy Act is expressly reserved for these situations. Similar strategies
can be applied with and without Site C.
The third point is the most important, as it is the only one that speaks specifically to the Site C
Project. BC Hydro writes:

Need for, Purpose of
and Alternatives to
the Site C Hydroelectric Project
ABRIDGED VERSION
Philip Raphals
for the Treaty 8 First Nations
April 2014
Page 39
Portfolios including the Project generally have a lower present value of costs to
ratepayers, as compared to portfolios including only clean or renewable resources,
and portfolios including both clean and thermal resources.29
This is indeed the heart of BC Hydro’s justification analysis. As we have shown above, it is
based on the Block Analysis:
The first method is a unit cost comparison whereby the cost of Site C is compared to the cost
of similar sized blocks of energy and capacity provided by alternative resources. 30
But, as we have shown, the size of the Site C Project is very problematic. Because of the
enormous spread between its unit energy costs and the forecast export prices, as long as Site C
contributes to a surplus that must be exported, it will create a financial deficit that will
have to be made up by either ratepayers or taxpayers.
By limiting its comparison to portfolios of the same size, the Proponent has managed to make
this problem seem to disappear. But the problem is still there — it is the analysis that is flawed.
This flaw can be remedied by turning to the “more sophisticated” second method described by
BC Hydro in its IRP, based on comparing the optimal combinations of resources under different
assumptions and constraints.
My analysis explores the consequences, for resource balance and differential costs, of different
ways of meeting forecast energy and capacity needs, under different scenarios. Proceeding this
way has also made it possible to correct a number of ill-founded choices made by BC Hydro,
such as the elimination of DSM Option 3, the total exclusion of DSM Capacity Initiatives, and
the assumption that SCGTs must have a minimum capacity factor of 18%.
29 BC Hydro, Site C EIS, p.6-121.
30 2013 IRP, pp. 6-30.

Need for, Purpose of
and Alternatives to
the Site C Hydroelectric Project
ABRIDGED VERSION
Philip Raphals
for the Treaty 8 First Nations
April 2014
Page 40
The following table summarizes the present value differential costs of the alternate resource
plans we have looked at (IRP, Optimized Site C, without Site C), for each of the three scenarios
(LGRP without LNG, BRP without LNG, CRP with LNG).
Figure 20
It is striking that, for every one of the scenarios reviewed, the portfolio without Site C
displays present value differential costs substantially lower than the corresponding Site C
portfolios, even when the latter is optimized using the same supply- and demand-side
resources as in the alternate portfolios.
Figure 21 shows the additional costs of the optimized Site C portfolio, in relation to portfolios
without Site C.
Figure 21
Present value differential costs ($ millions)
LGRP (no LNG) BRP (no LNG) CRP (LNG)
Site C (IRP) -1,073 1,545 13,161
Site C (optimized) 1,285 12,726
without Site C -2,216 935 12,418
0
200
400
600
800
1,000
1,200
LGRP (no LNG) BRP (no LNG) CRP (LNG)
$ m
illio
ns
Differential PV Costs (optimized Site C
compared to portfolio without Site C)

Need for, Purpose of
and Alternatives to
the Site C Hydroelectric Project
ABRIDGED VERSION
Philip Raphals
for the Treaty 8 First Nations
April 2014
Page 41
The bar on the left shows that, for a low growth scenario without LNG, the costs for the
optimized Site C portfolio are over $1.1 billion more than the portfolio without Site C. For both
the BRP without LNG and the CRP with LNG, the optimized Site C present value differential
costs are more than $300 million greater than for the corresponding “without Site C” portfolio.
Given these results, one can only conclude that Site C is not a cost-effective solution to
meeting BC Hydro’s forecast needs for additional energy and capacity. On the contrary,
when compared to alternative portfolios that are not overbuilt to mimic the Site C surpluses, we
see that Site C is in fact the most expensive of the alternatives studied.

Need for, Purpose of and Alternatives to the Site C Hydroelectric Project
Philip Raphals
for the Treaty 8 First Nations
April 2014
APPENDIX 1
BASE RESOURCE PLAN (BRP) WITHOUT LNG
CAPACITY AND ENERGY BALANCES
PORTFOLIO WITHOUT SITE C

BRP without LNG (without Site C) - Capacity (MW)Existing and Committed Heritage Resources
F2014 F2015 F2016 F2017 F2018 F2019 F2020 F2021 F2022 F2023 F2024 F2025 F2026 F2027 F2028 F2029 F2030 F2031 F2032 F2033
Heritage Hydroelectric 10,182 10,182 10,077 10,072 10,072 10,072 10,072 10,072 10,072 10,072 10,072 10,072 10,072 10,072 10,072 10,072 10,072 10,072 10,072 10,072
Heritage Thermal 946 496 46 46 46 46 46 46 46 46 46 46 46 46 46 46 46 46 46 46
Resource Smart 51 51 51 51 51 51 51 51 51 51 51 51 51 51 51 51 51 51 51 51
Waneta Transaction 256 249 249 249 249 249 249 249 249 249 249 249 249 249 249 249 249 249 249 249
Mica 5 0 465 465 465 465 465 465 465 465 465 465 465 465 465 465 465 465 465 465 465
Mica 6 0 0 460 460 460 460 460 460 460 460 460 460 460 460 460 460 460 460 460 460
Ruskin 0 0 73 76 114 114 114 114 114 114 114 114 114 114 114 114 114 114 114 114
John Hart 0 0 0 127 127 127 127 127 127 127 127 127 127 127 127 127 127 127 127 127
11,435 11,443 11,421 11,546 11,584 11,584 11,584 11,584 11,584 11,584 11,584 11,584 11,584 11,584 11,584 11,584 11,584 11,584 11,584 11,584
Existing and Committed IPP Resources
667 557 553 547 523 462 426 426 426 151 145 139 134 134 123 123 122 122 122 122
Pre-F06 Call EPAs (excl. Rio Tinto Alcan) F2006 Call 85 86 86 86 86 86 86 86 86 86 86 86 86 86 86 75 73 73 69 69
Standing Offer Program (signed EPAs) 10 11 11 11 11 11 11 11 11 11 11 11 11 11 11 11 10 10 9 9
Bioenergy Call Phase I 67 67 67 67 67 67 54 29 29 29 29 29 29 29 0 0 0 0 0 0
Clean Power Call 86 112 128 141 159 162 162 162 162 162 162 162 162 162 162 162 162 162 162 156
AltaGas Power (NTL) 0 26 31 31 31 31 31 31 31 31 31 31 31 31 31 31 31 31 31 31
Waneta Expansion 0 0 10 10 10 10 10 10 10 10 10 10 10 10 10 10 10 10 10 10
Integrated Power Offer 128 152 165 165 165 165 165 165 82 65 65 41 29 29 21 0 0 0 0 0
Bioenergy Call Phase II 0 15 65 65 65 65 65 65 65 65 65 65 65 65 65 65 65 65 65 65
Conifex 0 21 21 21 21 21 21 21 21 21 21 21 21 21 21 21 21 21 21 21
1,043 1,047 1,137 1,144 1,138 1,080 1,031 1,006 923 631 625 595 578 578 530 498 494 494 489 483
Future Supply-Side Resources
IPP Renewals 16 126 129 133 146 177 202 214 256 539 545 563 574 574 603 624 629 629 634 640
Standing Offer Program 0 0 2 4 6 8 10 12 14 16 18 20 22 24 26 29 31 33 35 37
IBAs 0 0 0 0 0 0 24 24 24 24 24 24 24 24 24 24 24 24 24 24
Revelstoke Unit 6 0 0 0 0 0 0 0 0 0 0 0 0 0 0 0 0 0 488 488 488
GMS Units 1 - 5 Capacity Increase 0 0 0 0 0 0 0 44 88 132 220 220 220 220 220 220 220 220 220 220
SCGT 0 0 0 0 0 0 0 0 0 0 0 0 0 0 0 0 0 0 0 0
CCGT 0 0 0 0 0 0 0 0 0 0 0 0 0 0 0 125 125 135 140 145
Clean Resources 0 0 0 0 0 0 0 0 0 0 0 0 0 0 0 35 85 151 201
Total Supply Requiring Reserves 12,494 12,616 12,689 12,827 12,874 12,849 12,851 12,884 12,889 12,926 13,016 13,006 13,002 13,004 12,987 13,104 13,142 13,692 13,765 13,822
Reserves
14% of Supply Requiring Reserves -1,749 -1,766 -1,776 -1,796 -1,802 -1,799 -1,799 -1,804 -1,804 -1,810 -1,822 -1,821 -1,820 -1,821 -1,818 -1,835 -1,840 -1,917 -1,927 -1,935
400 MW market reliance 400 400 0 0 0 0 0 0 0 0 0 0 0 0 0 0 0 0 0 0
-1,349 -1,366 -1,776 -1,796 -1,802 -1,799 -1,799 -1,804 -1,804 -1,810 -1,822 -1,821 -1,820 -1,821 -1,818 -1,835 -1,840 -1,917 -1,927 -1,935
Supply Not Requiring Reserves
Alcan 2007 EPA 419 419 153 153 153 153 153 153 153 153 153 153 153 153 153 153 153 153 153 153
Market Purchases 0 0 0 0 0 0 0 0 0 0 0 0 0 0 0 0
419 419 153 153 153 153 153 153 153 153 153 153 153 153 153 153 153 153 153 153
Effective Load Carrying Capability 11,564 11,669 11,066 11,184 11,225 11,203 11,205 11,233 11,238 11,269 11,347 11,338 11,335 11,336 11,322 11,422 11,455 11,928 11,991 12,040
2012 Mid Load Forecast Before DSM-11,011 -11,222 -11,451 -11,681 -11,971 -12,230 -12,443 -12,613 -12,743 -12,950 -13,125 -13,288 -13,438 -13,609 -13,817 -14,036 -14,258 -14,482 -14,701 -14,915
Future Demand Side Management & Other MeasuresSMI Theft Reduction 0 0 0 9 17 26 35 43 52 60 68 76 76 76 76 76 76 76 76 76
Voltage and VAR Optimization 0 0 0 0 0 0 0 0 0 0 0 0 0 0 0 0 0 0 0 0
DSM Option 2 / DSM Target 304 439 638 820 932 1,078 1,224 1,371 1,460 1,519 1,601 1,663 1,743 1,797 1,873 1,939 1,983 2,028 2,057 2,074
Differential DSM 3 to DSM 2 24 50 74 89 93 175 218 228 242 221 221 221 221 221 221 221 221
Industrial Load Curtailment 39 125 210 261 294 313 317 315 315 316 313 317 315 316 315 315 315 319 315 316
Capacity-focused DSM programs 14 44 80 119 133 137 133 135 136 134 135 135 135 137 135 136 135 136 136 135
Time-base rates 11 20 34 43 52 59 78 102 124 148 169 193 196 201 203 207 210 216 216 216
Total Capacity-focussed DSM 64 188 323 423 479 509 529 552 575 598 618 645 645 653 653 658 659 671 666 667
368 627 961 1276 1477 1687 1877 2058 2261 2395 2515 2626 2685 2747 2823 2894 2939 2996 3020 3038
Surplus / Deficit 921 1074 576 779 731 660 639 678 756 714 736 676 582 475 328 280 136 442 310 162

BRP without LNG (without Site C) – Energy (GWh)F2014 F2015 F2016 F2017 F2018 F2019 F2020 F2021 F2022 F2023 F2024 F2025 F2026 F2027 F2028 F2029 F2030 F2031 F2032 F2033
Existing and Committed Heritage Resources
44,962 44,884 45,737 42,425 42,048 42,048 42,048 42,048 42,048 42,048 42,048 42,048 42,048 42,048 42,048 42,048 42,048 42,048 42,048 42,048
0 0 0 4,100 4,100 4,100 4,100 4,100 4,100 4,100 4,100 4,100 4,100 4,100 4,100 4,100 4,100 4,100 4,100 4,100
31 31 31 180 180 180 180 180 180 180 180 180 180 180 180 180 180 180 180 180
60 86 113 133 133 133 133 133 133 133 133 133 133 133 133 133 133 133 133 133
1,003 874 865 865 865 865 865 865 865 865 865 865 865 865 865 865 865 865 865 865
0 73 145 145 145 145 145 145 145 145 145 145 145 145 145 145 145 145 145 145
0 0 28 56 56 56 56 56 56 56 56 56 56 56 56 56 56 56 56 56
0 0 30 221 319 338 338 338 338 338 338 338 338 338 338 338 338 338 338 338
0 0 0 300 806 806 806 806 806 806 806 806 806 806 806 806 806 806 806 806
46,056 45,948 46,949 48,425 48,652 48,671 48,671 48,671 48,671 48,671 48,671 48,671 48,671 48,671 48,671 48,671 48,671 48,671 48,671 48,671
Existing and Committed IPP Resources
Pre-F06 Call EPAs (incl. Rio Tinto Alcan) 7,078 6,865 4,309 5,936 5,786 5,135 4,977 4,869 4,869 2,699 2,437 2,197 2,057 1,956 1,851 1,561 1,497 1,482 1,481 1,477
F2006 Call 2,158 2,603 2,603 2,328 2,328 2,328 2,328 2,328 2,328 2,328 2,328 2,328 2,328 2,328 2,328 2,283 2,119 2,058 1,991 1,963
Standing Offer Program (signed EPAs) 214 228 228 201 201 201 201 201 201 201 201 201 201 201 201 201 197 190 187 186
Bioenergy Call Phase I 569 569 569 582 582 582 515 342 221 221 221 221 221 221 54 0 0 0 -2 -2
Clean Power Call 786 1,369 1,629 1,768 2,124 2,253 2,253 2,253 2,253 2,253 2,253 2,253 2,253 2,253 2,253 2,253 2,253 2,253 2,253 2,234
AltaGas Power (NTL) 0 593 873 947 947 947 947 947 947 947 947 947 947 947 947 947 947 947 947 947
Waneta Expansion 0 0 567 306 306 306 306 306 306 306 306 306 306 306 306 306 306 306 306 306
Integrated Power Offer 926 1,055 1,092 1,139 1,139 1,139 1,139 1,139 673 533 430 350 313 238 185 34 0 0 0 0
Bioenergy Call Phase II 0 109 360 565 565 565 565 565 565 565 565 565 565 565 565 565 565 565 565 565
Conifex 0 94 188 180 180 180 180 180 180 180 180 180 180 180 180 180 180 180 180 180
Sub-total 11,731 13,485 12,418 13,952 14,158 13,636 13,411 13,130 12,543 10,233 9,868 9,548 9,371 9,195 8,870 8,330 8,064 7,981 7,908 7,856
Total existing and committed supply 57,875 60,087 60,490 63,576 64,115 63,983 64,065 63,951 63,684 63,640 63,615 63,601 63,610 63,598 63,516 63,439 63,449 63,475 63,500 63,527
Future Supply-Side Resources
IPP Renewals 88 654 1,096 1,147 1,245 1,570 1,683 1,824 2,117 4,357 4,670 4,950 5,109 5,247 5,463 5,900 6,149 6,232 6,303 6,356
Standing Offer Program 0 0 27 52 60 106 133 159 186 212 239 265 292 318 345 371 398 424 451 477
IBAs 0 0 0 0 0 0 167 167 167 167 167 167 167 167 167 167 167 167 167 167
Revelstoke Unit 6 0 0 0 0 0 0 0 0 0 0 0 0 0 0 0 0 0 26 26 26
SCGT 0 0 0 0 0 0 0 0 0 0 0 0 0 0 0 0 0 0 0 0
CCGT 0 0 0 0 0 0 0 0 0 0 0 0 0 0 0 986 986 1,064 1,104 1,143
Clean Resources 0 0 0 0 0 0 0 0 0 0 0 0 0 0 0 0 450 1,100 1,950 2,604
SubTotal 88 654 1,123 1,199 1,305 1,676 1,983 2,150 2,470 4,736 5,076 5,382 5,568 5,732 5,975 7,424 8,150 9,013 10,001 10,773
Total Supply 57,875 60,087 60,490 63,576 64,115 63,983 64,065 63,951 63,684 63,640 63,615 63,601 63,610 63,598 63,516 64,425 64,885 65,665 66,580 67,300
Demand - Integrated System Total Gross Requirements
2012 Mid Load Forecast Before DSM -58,714 -60,378 -61,655 -63,238 -65,769 -67,545 -69,111 -70,207 -70,811 -71,721 -72,707 -73,428 -73,812 -74,512 -75,475 -76,366 -77,420 -78,433 -79,486 -80,316
Future DSM & Other Measures
SMI Theft Reduction 0 0 0 0 65 129 193 256 318 380 442 503 562 562 562 562 562 562 562 562
Voltage and VAR Optimization 38 162 229 273 288 304 314 326 328 329 331 333 334 336 338 339 341 343 345 346
DSM Option 2 / DSM Target 1,919 2,668 3,564 4,364 4,942 5,893 6,842 7,790 8,202 8,423 8,947 9,186 9,590 9,862 10,196 10,274 10,505 10,746 10,906 10,995
Differential DSM 3 to DSM 2 0 0 0 152 359 544 686 675 783 1,186 1,186 1,317 1,175 1,175 1,175 1,175 1,175 1,175 1,175 1,175
SubTotal 1,957 2,830 3,793 4,789 5,654 6,870 8,035 9,047 9,631 10,318 10,906 11,339 11,661 11,935 12,271 12,350 12,583 12,826 12,988 13,078
DSM as % of load growth 170% 129% 106% 80% 78% 77% 79% 80% 79% 78% 77% 77% 76% 73% 70% 67% 65% 63% 61%
Annual Energy Demand After Conservation 56,757 57,548 57,862 58,449 60,115 60,675 61,076 61,160 61,180 61,403 61,801 62,089 62,151 62,577 63,204 64,016 64,837 65,607 66,498 67,238
Gas as % of load 6.1% 5.9% 5.8% 5.5% 5.5% 5.5% 5.5% 5.5% 5.5% 5.5% 5.5% 5.5% 5.5% 5.5% 5.5% 7.0% 6.9% 7.0% 6.9% 6.9%
Surplus / Deficit (GWh) 1,118 2,539 2,628 5,127 4,000 3,308 2,989 2,791 2,504 2,237 1,814 1,512 1,459 1,021 312 409 48 59 82 62
Mica 6
Ruskin
John Hart
Sub-total
Heritage Hydroelectric
Heritage Hydroelectric Non-Firm / Market Allowance
Heritage Thermal
Resource Smart
Waneta Transaction
Mica 5

Need for, Purpose of and Alternatives to the Site C Hydroelectric Project
Philip Raphals
for the Treaty 8 First Nations
April 2014
APPENDIX 2
CONTINGENCY RESOURCE PLAN (CRP) WITH LNG CAPACITY AND ENERGY BALANCES
PORTFOLIO WITHOUT SITE C

CRP with LNG (without Site C) – Capacity (MW)Existing and Committed Heritage Resources
F2014 F2015 F2016 F2017 F2018 F2019 F2020 F2021 F2022 F2023 F2024 F2025 F2026 F2027 F2028 F2029 F2030 F2031 F2032 F2033
Heritage Hydroelectric 10,182 10,182 10,077 10,072 10,072 10,072 10,072 10,072 10,072 10,072 10,072 10,072 10,072 10,072 10,072 10,072 10,072 10,072 10,072 10,072
Heritage Thermal 946 496 46 46 46 46 46 46 46 46 46 46 46 46 46 46 46 46 46 46
Resource Smart 51 51 51 51 51 51 51 51 51 51 51 51 51 51 51 51 51 51 51 51
Waneta Transaction 256 249 249 249 249 249 249 249 249 249 249 249 249 249 249 249 249 249 249 249
Mica 5 0 465 465 465 465 465 465 465 465 465 465 465 465 465 465 465 465 465 465 465
Mica 6 0 0 460 460 460 460 460 460 460 460 460 460 460 460 460 460 460 460 460 460
Ruskin 0 0 73 76 114 114 114 114 114 114 114 114 114 114 114 114 114 114 114 114
John Hart 0 0 0 127 127 127 127 127 127 127 127 127 127 127 127 127 127 127 127 127
11,435 11,443 11,421 11,546 11,584 11,584 11,584 11,584 11,584 11,584 11,584 11,584 11,584 11,584 11,584 11,584 11,584 11,584 11,584 11,584
Existing and Committed IPP Resources
667 557 553 547 523 462 426 426 426 151 145 139 134 134 123 123 122 122 122 122
Pre-F06 Call EPAs (excl. Rio Tinto Alcan) F2006 Call 85 86 86 86 86 86 86 86 86 86 86 86 86 86 86 75 73 73 69 69
Standing Offer Program (signed EPAs) 10 11 11 11 11 11 11 11 11 11 11 11 11 11 11 11 10 10 9 9
Bioenergy Call Phase I 67 67 67 67 67 67 54 29 29 29 29 29 29 29 0 0 0 0 0 0
Clean Power Call 86 112 128 141 159 162 162 162 162 162 162 162 162 162 162 162 162 162 162 156
AltaGas Power (NTL) 0 26 31 31 31 31 31 31 31 31 31 31 31 31 31 31 31 31 31 31
Waneta Expansion 0 0 10 10 10 10 10 10 10 10 10 10 10 10 10 10 10 10 10 10
Integrated Power Offer 128 152 165 165 165 165 165 165 82 65 65 41 29 29 21 0 0 0 0 0
Bioenergy Call Phase II 0 15 65 65 65 65 65 65 65 65 65 65 65 65 65 65 65 65 65 65
Conifex 0 21 21 21 21 21 21 21 21 21 21 21 21 21 21 21 21 21 21 21
1,043 1,047 1,137 1,144 1,138 1,080 1,031 1,006 923 631 625 595 578 578 530 498 494 494 489 483
Future Supply-Side Resources
IPP Renewals 16 126 129 133 146 177 202 214 256 539 545 563 574 574 603 624 629 629 634 640
Standing Offer Program 0 0 2 4 6 8 10 12 14 16 18 20 22 24 26 29 31 33 35 37
IBAs 0 0 0 0 0 0 24 24 24 24 24 24 24 24 24 24 24 24 24 24
Revelstoke Unit 6 0 0 0 0 0 488 488 488 488 488 488 488 488 488 488 488 488 488 488 488
GMS Units 1 - 5 Capacity Increase 0 0 0 44 88 132 176 220 220 220 220 220 220 220 220 220 220 220 220 220
SCGT 0 0 0 0 0 0 100 125 150 250 250 350 500 650 800 1100 1300 1400 1600 1800
CCGT 0 0 0 0 100 130 140 170 170 180 190 190 190 185 180 180 175 175 175 175
Clean Resources 0 0 0 0 0 0 192 353 490 575 634 686 710 749 805 923 979 1042 1114 1183
16 126 131 181 340 935 1332 1606 1812 2292 2369 2541 2728 2914 3146 3588 3846 4011 4290 4567
Total Supply Requiring Reserves (d) =
a + b + c
12,494 12,616 12,689 12,871 13,062 13,599 13,947 14,196 14,319 14,507 14,578 14,720 14,890 15,076 15,260 15,670 15,924 16,089 16,363 16,634
Reserves
14% of Supply Requiring Reserves -1,749 -1,766 -1,776 -1,802 -1,829 -1,904 -1,953 -1,987 -2,005 -2,031 -2,041 -2,061 -2,085 -2,111 -2,136 -2,194 -2,229 -2,252 -2,291 -2,329
400 MW market reliance 400 400 0 0 0 0 0 0 0 0 0 0 0 0 0 0 0 0 0 0
-1,349 -1,366 -1,776 -1,802 -1,829 -1,904 -1,953 -1,987 -2,005 -2,031 -2,041 -2,061 -2,085 -2,111 -2,136 -2,194 -2,229 -2,252 -2,291 -2,329
Supply Not Requiring Reserves
Alcan 2007 EPA 419 419 153 153 153 153 153 153 153 153 153 153 153 153 153 153 153 153 153 153
Market Purchases 0 0 435 250 425 200 0 0 0 0 0 0 0 0 0 0 0 0 0 0
419 419 588 403 578 353 153 153 153 153 153 153 153 153 153 153 153 153 153 153
Effective Load Carrying Capability 11,564 11,669 11,501 11,472 11,811 12,048 12,147 12,362 12,467 12,629 12,690 12,812 12,958 13,119 13,276 13,630 13,847 13,989 14,225 14,458
2012 High Load Forecast Before DSM-11,421 -11,746 -12,074 -12,396 -12,832 -13,189 -13,438 -13,668 -13,823 -14,087 -14,139 -14,532 -14,721 -14,923 -15,178 -15,456 -15,747 -15,946 -16,231 -16,469
Expected LNG Load-120 -240 -360 -360 -360 -360 -360 -360 -360 -360 -360 -360 -360 -360
2012 High Load Forecast Before DSM w LNG-11,421 -11,746 -12,074 -12,396 -12,832 -13,189 -13,558 -13,908 -14,183 -14,447 -14,499 -14,892 -15,081 -15,283 -15,538 -15,816 -16,107 -16,306 -16,591 -16,829
Future Demand Side Management & Other Measures
SMI Theft Reduction 0 0 0 9 17 26 35 43 52 60 68 76 76 76 76 76 76 76 76 76
Voltage and VAR Optimization 0 0 0 0 0 0 0 0 0 0 0 0 0 0 0 0 0 0 0 0
DSM Option 2 / DSM Target - Low Deliverability 294 410 574 712 779 872 965 1,058 1,124 1,161 1,228 1,265 1,328 1,361 1,428 1,462 1,495 1,529 1,551 1,564
Differential DSM 3 to DSM 2 24 50 74 89 93 175 218 228 242 221 221 221 221 221 221 221 221
Industrial Load Curtailment 39 125 210 261 294 313 317 315 315 316 313 317 315 316 315 315 315 319 315 316
Capacity-focused DSM programs 14 44 80 119 133 137 133 135 136 134 135 135 135 137 135 136 135 136 136 135
Time-base rates 11 20 34 43 52 59 78 102 124 148 169 193 196 201 203 207 210 216 216 216
358 598 897 1168 1324 1481 1618 1745 1925 2037 2142 2228 2270 2311 2378 2417 2451 2497 2514 2528
Surplus / Deficit 501 521 324 244 304 340 207 199 210 219 333 148 147 147 116 230 192 180 148 157

CRP with LNG (without Site C) - Energy (GWh)
F2014 F2015 F2016 F2017 F2018 F2019 F2020 F2021 F2022 F2023 F2024 F2025 F2026 F2027 F2028 F2029 F2030 F2031 F2032 F2033
Existing and Committed Heritage Resources
44,962 44,884 45,737 42,425 42,048 42,048 42,048 42,048 42,048 42,048 42,048 42,048 42,048 42,048 42,048 42,048 42,048 42,048 42,048 42,048
0 0 0 4,100 4,100 4,100 4,100 4,100 4,100 4,100 4,100 4,100 4,100 4,100 4,100 4,100 4,100 4,100 4,100 4,100
31 31 31 180 180 180 180 180 180 180 180 180 180 180 180 180 180 180 180 180
60 86 113 133 133 133 133 133 133 133 133 133 133 133 133 133 133 133 133 133
1,003 874 865 865 865 865 865 865 865 865 865 865 865 865 865 865 865 865 865 865
0 73 145 145 145 145 145 145 145 145 145 145 145 145 145 145 145 145 145 145
0 0 28 56 56 56 56 56 56 56 56 56 56 56 56 56 56 56 56 56
0 0 30 221 319 338 338 338 338 338 338 338 338 338 338 338 338 338 338 338
0 0 0 300 806 806 806 806 806 806 806 806 806 806 806 806 806 806 806 806
46,056 45,948 46,949 48,425 48,652 48,671 48,671 48,671 48,671 48,671 48,671 48,671 48,671 48,671 48,671 48,671 48,671 48,671 48,671 48,671
Existing and Committed IPP Resources
Pre-F06 Call EPAs (incl. Rio Tinto Alcan) 7,078 6,865 4,309 5,936 5,786 5,135 4,977 4,869 4,869 2,699 2,437 2,197 2,057 1,956 1,851 1,561 1,497 1,482 1,481 1,477
F2006 Call 2,158 2,603 2,603 2,328 2,328 2,328 2,328 2,328 2,328 2,328 2,328 2,328 2,328 2,328 2,328 2,283 2,119 2,058 1,991 1,963
Standing Offer Program (signed EPAs) 214 228 228 201 201 201 201 201 201 201 201 201 201 201 201 201 197 190 187 186
Bioenergy Call Phase I 569 569 569 582 582 582 515 342 221 221 221 221 221 221 54 0 0 0 -2 -2
Clean Power Call 786 1,369 1,629 1,768 2,124 2,253 2,253 2,253 2,253 2,253 2,253 2,253 2,253 2,253 2,253 2,253 2,253 2,253 2,253 2,234
AltaGas Power (NTL) 0 593 873 947 947 947 947 947 947 947 947 947 947 947 947 947 947 947 947 947
Waneta Expansion 0 0 567 306 306 306 306 306 306 306 306 306 306 306 306 306 306 306 306 306
Integrated Power Offer 926 1,055 1,092 1,139 1,139 1,139 1,139 1,139 673 533 430 350 313 238 185 34 0 0 0 0
Bioenergy Call Phase II 0 109 360 565 565 565 565 565 565 565 565 565 565 565 565 565 565 565 565 565
Conifex 0 94 188 180 180 180 180 180 180 180 180 180 180 180 180 180 180 180 180 180
Sub-total 11,731 13,485 12,418 13,952 14,158 13,636 13,411 13,130 12,543 10,233 9,868 9,548 9,371 9,195 8,870 8,330 8,064 7,981 7,908 7,856
Total existing and committed supply 57,875 60,087 60,490 63,576 64,135 63,983 64,065 63,951 63,684 63,640 63,615 63,601 63,610 63,598 63,516 63,439 63,449 63,475 63,500 63,527
Future Supply-Side Resources
IPP Renewals 88 654 1,096 1,147 1,245 1,570 1,683 1,824 2,117 4,357 4,670 4,950 5,109 5,247 5,463 5,900 6,149 6,232 6,303 6,356
Standing Offer Program 0 0 27 52 80 106 133 159 186 212 239 265 292 318 345 371 398 424 451 477
IBAs 0 0 0 0 0 0 167 167 167 167 167 167 167 167 167 167 167 167 167 167
Revelstoke Unit 6 0 0 0 0 0 26 26 26 26 26 26 26 26 26 26 26 26 26 26 26
SCGT 0 0 0 0 0 0 44 55 66 110 110 153 219 285 350 482 569 613 701 788
CCGT 0 0 0 0 788 1,025 1,104 1,340 1,340 1,419 1,498 1,498 1,498 1,459 1,419 1,419 1,380 1,380 1,380 1,380
Clean Resources 0 0 0 0 0 200 2,677 4,826 6,315 7,258 8,008 8,658 8,958 9,458 10,158 11,620 12,159 12,885 14,006 14,963
Market Purchases 1,436 1,262 2,384 841 2,400 4,350 4,350 4,350 4,350 4,350 4,350 4,350 4,350 4,350 4,350 3,400 3,900 3,900 3,800 3,500
SubTotal 1,524 1,916 3,507 2,040 4,513 7,277 10,184 12,747 14,567 17,899 19,067 20,067 20,619 21,309 22,279 23,385 24,748 25,627 26,834 27,657
Total Supply 59,311 61,349 62,874 64,417 67,323 69,584 72,266 74,548 75,781 76,803 77,606 78,286 78,661 79,175 79,820 80,386 81,483 82,279 83,413 84,184
2012 High Load Forecast Before DSM -61,207 -64,003 -66,326 -68,569 -71,902 -74,610 -76,745 -78,203 -79,060 -80,234 -81,516 -82,401 -82,954 -83,617 -84,768 -85,974 -87,280 -88,192 -89,476 -90,366
Expected LNG Load -1,000 -2,000 -3,000 -3,000 -3,000 -3,000 -3,000 -3,000 -3,000 -3,000 -3,000 -3,000 -3,000 -3,000
2012 High Load Forecast Before DSM with LNG -61,207 -64,003 -66,326 -68,569 -71,902 -74,610 -77,745 -80,203 -82,060 -83,234 -84,516 -85,401 -85,954 -86,617 -87,768 -88,974 -90,280 -91,192 -92,476 -93,366
Annual Energy Demand Before Conservation 61,207 64,003 66,326 68,569 71,902 74,610 77,745 80,203 82,060 83,234 84,516 85,401 85,954 86,617 87,768 88,974 90,280 91,192 92,476 93,366
Future DSM & Other Measures
SMI Theft Reduction 0 0 0 65 129 193 256 318 380 442 503 562 562 562 562 562 562 562 562 562
Voltage and VAR Optimization 38 162 229 273 288 304 314 326 328 329 331 333 334 336 338 339 341 343 345 346
DSM Option 2 / DSM Target low deliverability 1,857 2,495 3,224 3,813 4,167 4,574 4,980 5,385 5,688 5,810 6,221 6,357 6,671 6,872 7,181 7,839 8,015 8,199 8,321 8,389
Differential DSM 3 to DSM 2 152 359 544 686 675 783 1,186 1,186 1,317 1,175 1,175 1,175 1,175 1,175 1,175 1,175 1,175
SubTotal 1,895 2,657 3,453 4,151 4,584 5,071 5,550 6,029 6,396 6,581 7,055 7,252 7,567 7,770 8,081 8,740 8,918 9,104 9,228 9,297
DSM as % of load growth 95% 67% 56% 43% 38% 34% 32% 31% 30% 30% 30% 31% 31% 30% 31% 31% 30% 30% 29%
Annual Energy Demand After Conservation 59,312 61,346 62,873 64,418 67,318 69,539 72,195 74,174 75,664 76,653 77,461 78,149 78,387 78,847 79,687 80,234 81,362 82,088 83,248 84,069
Total gas-fired generation 3,520 3,520 3,520 3,520 4,308 4,545 4,668 4,915 4,926 5,049 5,127 5,171 5,237 5,263 5,290 5,421 5,469 5,513 5,601 5,688
% gas-fired generation 6.1% 5.9% 5.8% 5.5% 6.6% 7.0% 6.9% 7.0% 6.9% 7.0% 7.0% 7.0% 7.0% 7.0% 7.0% 7.0% 7.0% 7.0% 7.0% 7.0%Surplus / Deficit (GWh) -1 3 1 -1 5 45 71 374 117 150 145 137 274 328 133 152 121 191 165 115
Mica 6
Ruskin
John Hart
Sub-total
Heritage Hydroelectric
Heritage Hydroelectric Non-Firm / Market Allowance
Heritage Thermal
Resource Smart
Waneta Transaction
Mica 5
Need for, Purpose of
and Alternatives to
the Site C Hydroelectric Project
ABRIDGED VERSION
Philip Raphals
for the Treaty 8 First Nations
April 2014
APPENDIX 3 — QUALIFICATIONS
Cofounder of the Helios Centre, Philip Raphals has extensive experience in many aspects of
sustainable energy policy, including least-cost energy planning, utility regulation (including
transmission ratemaking) and green power certification. He is the author of numerous studies
and reports and frequently appears as an expert witness in the regulatory arena.
From 1992 to 1994, Mr. Raphals was Assistant Scientific Coordinator for the Support Office of
the Environmental Assessment of the Great Whale hydro project, where he coauthored a study
on the role of integrated resource planning in assessing the project’s justification.31
In 1997, he advised the Standing Committee on the Economy and Labour of the Quebec National
Assembly in its oversight hearings concerning Hydro-Quebec. In 2001, he authored a major
study on the implications of electricity market restructuring for hydropower developments,
entitled Restructured Rivers: Hydropower in the Era of Competitive Energy Markets. In 2005,
he advised the Federal Review Commission studying the Eastmain 1A/Rupert Diversion hydro
project with respect to project justification. Later, he drafted a submission to this same panel on
behalf of the affected Cree communities of Nemaska, Waskaganish and Chisasibi.
Mr. Raphals appeared as an expert witness on behalf of Grand Riverkeeper Labrador Inc. in the
hearings of the Joint Review Panel (JRP) on the Lower Churchill Generation Project, which
retained many of his suggestions. He also presented testimony to the Newfoundland and
Labrador Public Utilities Board in the context of its advisory hearings concerning the Muskrat
Falls project.
31 J. Litchfield, L. Hemmingway, and P. Raphals. 1994. Integrated resources planning and the Great
Whale Public Review. Background paper no. 7, Great Whale Public Review Support Office, 115 pp. (also published in French).

Need for, Purpose of
and Alternatives to
the Site C Hydroelectric Project
ABRIDGED VERSION
Philip Raphals
for the Treaty 8 First Nations
April 2014
Last year, he presented expert testimony to the Nova Scotia Utility and Review Board in the
proceedings concerning the Maritime Link, on behalf of the Canadian Wind Energy Association
and, for the compliance phase, the Low Power Rates Alliance.
In British Columbia, he testified on behalf of the Treaty 8 Tribal Association before the Joint
Review Panel examining the proposal to build the Site C Hydroelectric Project.
For several years, Mr. Raphals chaired the advisory committee for renewable energies of the
Low Impact Hydropower Institute (LIHI) in the United States, and he now sits on LIHI’s
Renewable Markets Advisory Panel. He has also played a role in developing the low impact
renewable electricity guideline for the Canadian Ecologo programme.
Mr. Raphals is a frequent expert witness before the Quebec Energy Board (the Régie de l’énergie
du Québec). He has been qualified by the Régie de l’énergie as an expert witness with respect to
transmission tariffs (FERC), issues related to the integration of wind power, security of supply
with respect to hydropower, energy efficiency and avoided costs, and sustainable development
criteria. In Nova Scotia, he was recognized as an expert in sustainable energy policy, including
least-cost planning and utility regulation.