Determinants of unemployment in Turkey for 1988-2007 period: Sectoral versus aggregate shock
20
İktisat İşletme ve Finans 26 (308) 2011 :09-28 2011© Her hakkı saklıdır. All rights reserved. www.iif.com.tr doi: 10.3848/iif.2011.308.3168 Determinants of unemployment in Turkey for 1988-2007 period: Sectoral versus aggregate shocks Abstract . According to the sectoral shifts hypothesis of Lillien (1982), fluctuations in labor demand across sectors are responsible for a substantial fraction of the variation in unemployment. The main purpose of this paper is to test the Lillien hypothesis that sectoral shifts in employment are also responsible for fluctuations in aggregate unemployment for the Turkish economy. The long run relationship between sectoral shifts, as measured by Lillien index, and unemployment along with the other determinants of unemployment will be examined for Turkey by using Vector Error Correction Model over the period 1988-2007. The main result of the cointegration analysis is that one of the long run determinants of unemployment in Turkey is the sectoral employment demand shifts. Therefore, sectoral employment shifts may explain some part of the increase in unemployment. Our analysis also shows that there is cyclical component of unemployment in the long-run for the Turkish economy. Keywords: Unemployment, Sectoral shifts, Lillien hypothesis, Turkey, VECM JEL Classification: E24, J21 Özet. 1988-2007 döneminde Türkiye’de işsizliğin bileşenleri: Sektörel kaymalar ve makroekonomik şoklar Lillien (1982)’nin sektörel kaymalar hipotezine göre, işgücü talebinin sektörlera- rası değişimi toplam işsizlikteki dalgalanmaların önemli bir bölümününden sorumludur. Bu çalışmanın temel amacı, sektörel istihdam kaymalarının toplam işsizlikteki dalgalan- malara neden olduğu biçiminde ifade edilen Lillien hipotezinin Türkiye ekonomisi için geçerli olup olmadığını sınamaktır. Lillien endeksi ile ölçülen sektörel istihdam kaymaları ve istihdam arasındaki uzun dönemli ilişki istihdamın diğer belirleyenleri de göz önü- ne alınarak, 1988-2007 döneminde Türkiye için Vektör Hata Düzeltme Modeli yöntemi kullanılarak incelenecektir. Eşbütünleşme analizinin temel sonucu, Türkiye’de işsizliğin uzun dönemli belirleyicilerinden birisinin sektörel işgücü talebi kaymaları olduğudur. Diğer bir ifadeyle, sektörel istihdam kaymaları işsizlikteki artışın bir bölümünü açıkla- yabilmektedir. Diğer yandan, çalışmamız Türkiye ekonomisinde uzun dönemli işsizliğin devrevi bir bileşeni olduğunu da işaret etmektedir. Anahtar Kelimeler: İşsizlik, Sektörel kaymalar, Lillien hipotezi, Türkiye, VHDM JEL Sınıflaması: E24, J21 Received 23 April, 2011, accepted 5 July, 2011 Arzu Akkoyunlu Wigley * , Sevinç Mıhcı ** * Address for Correspondence: Hacettepe University, Department of Economics, Beytepe Campus 06800 Çankaya / Ankara. E-mail: [email protected] ** Hacettepe University, E-mail: [email protected]
Transcript of Determinants of unemployment in Turkey for 1988-2007 period: Sectoral versus aggregate shock
İktisat İşletme ve Finans 26 (308) 2011 :09-28
2011© Her hakkı saklıdır. All rights reserved.
www.iif.com.trdoi: 10.3848/iif.2011.308.3168
Determinants of unemployment in Turkey for 1988-2007 period: Sectoral versus aggregate shocks
Abstract .According to the sectoral shifts hypothesis of Lillien (1982), fluctuations in labor demand across sectors are responsible for a substantial fraction of the variation in unemployment. The main purpose of this paper is to test the Lillien hypothesis that sectoral shifts in employment are also responsible for fluctuations in aggregate unemployment for the Turkish economy. The long run relationship between sectoral shifts, as measured by Lillien index, and unemployment along with the other determinants of unemployment will be examined for Turkey by using Vector Error Correction Model over the period 1988-2007. The main result of the cointegration analysis is that one of the long run determinants of unemployment in Turkey is the sectoral employment demand shifts. Therefore, sectoral employment shifts may explain some part of the increase in unemployment. Our analysis also shows that there is cyclical component of unemployment in the long-run for the Turkish economy. Keywords: Unemployment, Sectoral shifts, Lillien hypothesis, Turkey, VECMJEL Classification: E24, J21
Özet. 1988-2007 döneminde Türkiye’de işsizliğin bileşenleri: Sektörel kaymalar ve makroekonomik şoklarLillien (1982)’nin sektörel kaymalar hipotezine göre, işgücü talebinin sektörlera-
rası değişimi toplam işsizlikteki dalgalanmaların önemli bir bölümününden sorumludur. Bu çalışmanın temel amacı, sektörel istihdam kaymalarının toplam işsizlikteki dalgalan-malara neden olduğu biçiminde ifade edilen Lillien hipotezinin Türkiye ekonomisi için geçerli olup olmadığını sınamaktır. Lillien endeksi ile ölçülen sektörel istihdam kaymaları ve istihdam arasındaki uzun dönemli ilişki istihdamın diğer belirleyenleri de göz önü-ne alınarak, 1988-2007 döneminde Türkiye için Vektör Hata Düzeltme Modeli yöntemi kullanılarak incelenecektir. Eşbütünleşme analizinin temel sonucu, Türkiye’de işsizliğin uzun dönemli belirleyicilerinden birisinin sektörel işgücü talebi kaymaları olduğudur. Diğer bir ifadeyle, sektörel istihdam kaymaları işsizlikteki artışın bir bölümünü açıkla-yabilmektedir. Diğer yandan, çalışmamız Türkiye ekonomisinde uzun dönemli işsizliğin devrevi bir bileşeni olduğunu da işaret etmektedir.
Anahtar Kelimeler: İşsizlik, Sektörel kaymalar, Lillien hipotezi, Türkiye, VHDMJEL Sınıflaması: E24, J21
Received 23 April, 2011, accepted 5 July, 2011
Arzu Akkoyunlu Wigley*, Sevinç Mıhcı**
* Address for Correspondence: Hacettepe University, Department of Economics, Beytepe Campus 06800 Çankaya / Ankara. E-mail: [email protected]** Hacettepe University, E-mail: [email protected]
10
İktisat İşletme ve Finans 26 (308) Kasım / November 2011
I. Introduction and Theoretical frameworkTurkey is an exemplar of a country that suffers from jobless growth.
Starting from 1990s, relatively high unemployment rates have been observed in Turkish economy. Turkish economy witnessed several economic shocks in last ten years. Following each crisis the divergent paths of output and employment have been observed. The performance of the labor market has not been in parallel with the recovery in the total output. After the financial crises of 2001 the unemployment rate increased from 6.5% in 2000 to 10.3% in 2002 even though economic growth was 7.9% in 2002. In 2004, unemployment rates remained stubbornly high, inspite of a GDP growth rate of 9.9%. In 2009 the Turkish economy contracted by 4.7% in real terms and the unemployment rate reached its record level 14.9% in May of that year. Similarly, the unemployment rate in the non-agricultural sectors has reached its highest level of 18.4% in the aftermath of the recession (Turkish Statistical Institute (TSI)). Between 2008-2009, the cumulative output loss in Turkey was largest among the OECD countries and is equal to 14.2% compared to and average of 4.6% for the OECD (OECD, 2010, p. 107).
Therefore, it is crucial to examine the sources of this high unemployment rate in Turkey during the recent years. Within this context, the question of to what extent the macroeconomic fluctuations or sectoral shifts of the labour demand are responsible for unemployment in Turkey is also an important question in the sense that policy recommendations to solve the unemployment problem depends on understanding the causes of unemployment.
With that in mind, the main purpose of this paper is to test the Lillien’s (1982) hypothesis that sectoral shifts in employment are also responsible for fluctuations in aggregate unemployment for Turkey. Thus, the long run relationship between sectoral shifts that are measured by the Lillien index and unemployment along with the other determinants of unemployment will be examined for Turkey by using VECM method over the period 1988-2007. To the best of our knowledge this represents the first study to test the Lillien’s sectoral shift hypothesis within the Turkey context.
The outline of the paper is as follows: the first part consists of a brief overview of the theoretical and empirical work on Lillien’s (1982) sectoral shift hypothesis. In the second part of the study, the Turkish labor market, with special reference to unemployment and structural change during the period 1988-2007, is briefly evaluated. In the third part of the study, we firstly estimate a cointegration vector and secondly a VECM with the interested variables. Part four concludes.
There has been an ongoing debate over the causes of unemployment in the literature. Within those discussions the distinction between cyclical and structural unemployment is crucial. While cyclical unemployment occurs
11
İktisat İşletme ve Finans 26 (308) Kasım / November 2011
when there is a general decline in labor demand combined with downwardly rigid real wages, structural unemployment is the result of shifts in relative demand for different types of labor. The transformation from an agricultural to industrial economy, the movement from goods-producing industries to service-producing industries, and the decline in funding for defense related activities are all examples of sectoral shifts (Rissman, 1997, pp.2-3). In addition, technological change which is specific to a sector, institutional and policy changes, including trade policy affecting particular sectors, are also the cause sectoral shifts. A key question is whether sectoral or the aggregate shocks are the main source of fluctuations in the unemployment rate. While there is a strong emphasize on aggregate shocks as the cause of unemployment, other branches of the literature also attribute unemployment primarily to sectoral shocks. Within this context, along with the other causes the question of the extent to which macroeconomic fluctuations or sectoral shifts of the labour demand are responsible for unemployment is an important topic in the unemployment literature.
In his influential paper, Lillien (1982) asserts that fluctuations in employment demand across industries have an impact on unemployment because labour reallocations across industries take time. According to the sectoral shifts hypothesis of Lillien (1982), fluctuations in demand across sectors are responsible from the substantial fraction of the variation in unemployment. Lillien (1982) uses the square root of the weighted sum of the variances of industry employment growth rates (dispersion index or Lillien’s sigma) as a measure of sectoral shifts. In order to test the sectoral shift hypothesis - in other words the effect of labour demand shifts across sectors on unemployment - the dispersion index is included in unemployment equation. Since he finds a statistically significant positive relationship between the dispersion measure and the unemployment rate he concludes that sectoral shifts increase aggregate unemployment. Lillien (1982) contends that most of the unemployment fluctuations of the 1970s were due to the structural shifts within the U. S. economy and reallocation of labour across sectors of the economy, accounting for as much as half of the fluctuations in unemployment in US during 1970s (Lillien, 1982, pp.777-778).
Abraham and Katz (1984 and 1986) criticize the methodology of Lillien (1982) on the grounds that increase in the Lillien’s sectoral dispersion index could reflect not only the reallocation of labour but also aggregate demand shocks having a differential impact on different industries. Abraham and Katz (1986) points out the weakness of Lillien’s sectoral dispersion index in capturing sectoral shifts, as the effects of business cycle is not neutral across different industries. Similarly, Abraham and Katz (1984) find that when Lillien’s dispersion index is isolated from the effects of aggregate
12
İktisat İşletme ve Finans 26 (308) Kasım / November 2011
demand shocks, this purged proxy variable can explain only a small fraction of unemployment fluctuations in the United States. In this respect, Rissman (1997) stresses that the business cycle systematically affects the distribution of employment across industries and manufacturing’s employment share typically declines during an economic downturn while the service sector’s share typically increases.
According to Brainard and Cutler (1993), a second flaw of the Lillien sectoral dispersion index is that even if the aggregate demand shocks have a neutral effect across different industries, the temporal relationship between the arrival of a reallocation shock and the employment response may differ among sectors, yielding an ambiguous reallocation signal (Brainard and Cutler, 1993, p.223).
Since the above mentioned studies show that effects of aggregate demand shocks and business cycles on employment growth rates must be purged in the measure of the dispersion, follow up work in the literature has focused on the issue of developing an alternative measure of sectoral shocks.
In order to incorporate the Abraham-Katz criticism, two different approaches have been adopted in the literature. The strand of the literature attempts to develop a “new dispersion index” which is still based on employment growth but isolates the aggregate demand shocks. Among these studies, Mills et al (1995) and Sakata (2002) constructed a purged dispersion index by isolating the effects of monetary shocks based on the assumption that that monetary shocks are the main source of aggregate shocks. According to that strategy the unanticipated monetary growth variable is obtained as a residual from the money growth regression and then a regression is established where unanticipated as well as anticipated monetary growth are used as explanatory variables for explaining sectoral growth rate. The residual obtained from the second regression is used as a proxy for sectoral growth rate in the original Lillien index. Similarly, in order to create a measure that reflects only sectoral reallocation Rismann (1997) and Aaronson, Rissman and Sullivan (2004) decompose the employment share growth rates into business cycles and industry specific or structural components by applying the Kalman filter to a model of industry employment growth and then they develop a dispersion index for the sectoral industrial employment growth. By applying the Kalman filter to a simple model of industry employment growth, a measure of dispersion that is isolated from the cyclical effects is obtained in these two studies.
Second strand of literature, Loungani, Rush, and Tave (1990), Brainard and Cutler (1993), Loungani and Trehan (1997) and Genay and Loungani (1997) constructed an index based on the dispersion of stock market prices across industries as a proxy for sectoral shifts. The main assumptions of these
13
İktisat İşletme ve Finans 26 (308) Kasım / November 2011
studies are that the effects of shocks will be reflected in stock market prices and dispersion of stock market prices is not effected by business cycles.
Following Lillien(1982), the sectoral shifts hypothesis has been tested in many studies by employing the above mentioned proxies. The majority of studies provide evidence to support the sectoral shift hypothesis.
By using an index measuring the dispersion among stock prices from different industries, Loungani, Rush, and Tave (1990), find that the lagged values of this index significantly affect unemployment in the U.S. for the years 1931 to 1987. Likewise, by using an index measuring the dispersion among stock prices Loungani and Trehan (1997) reaches the similar conclusion. According to that study, sectoral shifts explain a significant proportion of the variation in the unemployment rate especially the movements in long-duration unemployment. On the other hand, Brainard and Cutler (1993) and Genay and Loungani (1997) employed an index measuring the dispersion among stock prices and found that sectoral shifts play a moderate role in explaining the variation in unemployment rate. Brainard and Cutler (1993) conclude that even though sectoral shifts accounted for a substantial share of increases in unemployment in US for several periods, reallocation shocks explain only a moderate share of the fluctuations in aggregate unemployment on average over the period 1958-1991. Similarly, Genay and Loungani (1997) show that the stock market dispersion index has limited success in accounting for the shift of Beveridge curves and, therefore, unemployment in Japan and US.
One study that uses the purged dispersion index, namely Mills et al. (1995), supports the Lillien sectoral shifts hypothesis for the United States over the period 1960 to 1991. Using the same index, Sakata (2002) found no evidence for a long-term relationship between unemployment and sectoral shift in Japan. However, that study found a significant short-term effect of sectoral shifts on unemployment in recessions. Another striking result of the study is that the effects of sectoral shifts on male and female unemployment are different from each other.
Rissman (1997) adopted the measure of dispersion that is purged of cyclical effects and found that although the period 1970-1980 was subject to structural change there have been no large sectoral shifts effecting the US labor market since the early 1980’s. Similarly based on the methodology of Rissman (1997), Aaronson, Rissman and Sullivan (2004) conclude that there is little evidence of an increase in sectoral reallocation in USA during the 1990–91 and 2001 recessions. On the other hand, a more recent study by Heaton and Oslington (2010) reaches an analogous conclusion to Lillien (1982) for US employment over the period 1948 and 2002. That study employed the frequency domain exact factor model to decompose the aggregate unemployment rate into sector-specific and common shocks. The main conclusion of their study is
14
İktisat İşletme ve Finans 26 (308) Kasım / November 2011
that sectoral shocks are important and account for around half of the overall variation in employment for the period 1948-2002.
Although majority of the many empirical studies focus on US employment, there are also few studies focus on other countries. According to Neelin (1987) sectoral shift is positively correlated with unemployment in Canada when sectoral shift is measured by the Lillien index. However, when the sectoral shift is divided into its components this effect disappears. Therefore, Neelin (1987) concludes that sectoral shifts do not significantly affect aggregate unemployment. After decomposing the variability of employment shares in components to isolate the permanent change in the distribution across sectors, Chiarini and Piselli (2000) show that an important source of the persistence of unemployment for Italy over the period 1975-1993 is due to sectoral shifts.
In terms of the methodology of studies, it can be said that earlier empirical studies following Lillien (1982) estimated a reduced form unemployment equation that included a proxy for sectoral shift and other control variables, whereas more recent studies use the VAR method to identify the long run relation between sectoral shift and unemployment.
The next part of the study provides a brief account of the Turkish labor market with special reference to unemployment and structural change during the period 1988-2009.
II. Charecteristics of labour market in TurkeyTurkish labor market can be characterized as having a low labor force
participation and employment rate and high unemployment rate. In year 2009, labor force participation rate is lowest in Turkey among the OECD countries and equal to 51.7% compared to the 70.7% of OECD weighted average (OECD, 2010:271). High and persistent rate of unemployment rate is another important characteristic of the Turkish labour market. Similarly, the Turkish unemployment rate of 14.3% in 2009 was the second highest among OECD countries. Female unemployment rate of 14.7% in 2009 was the highest among the OECD countries (OECD, 2010, p.271).
15
İktisat İşletme ve Finans 26 (308) Kasım / November 2011
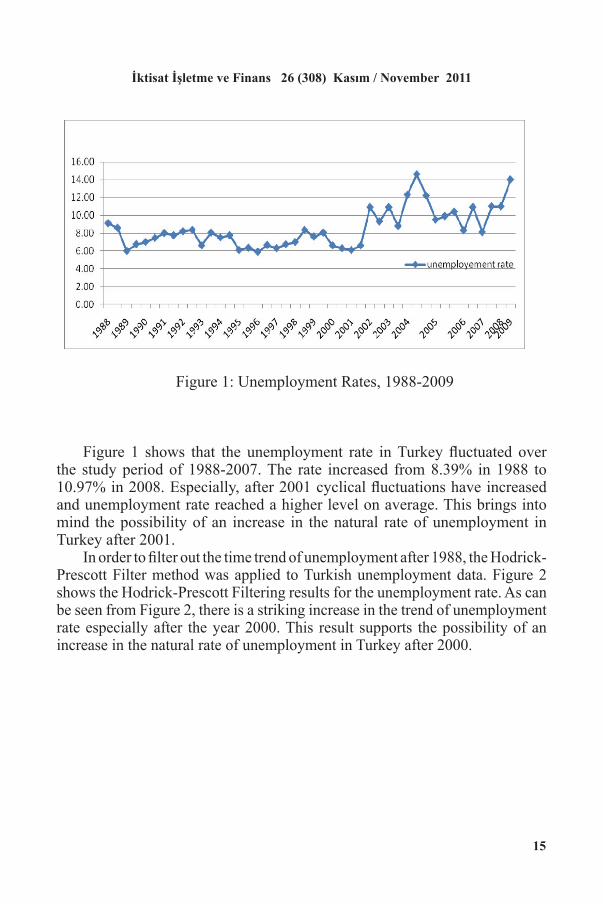
Figure 1: Unemployment Rates, 1988-2009
Figure 1 shows that the unemployment rate in Turkey fluctuated over the study period of 1988-2007. The rate increased from 8.39% in 1988 to 10.97% in 2008. Especially, after 2001 cyclical fluctuations have increased and unemployment rate reached a higher level on average. This brings into mind the possibility of an increase in the natural rate of unemployment in Turkey after 2001.
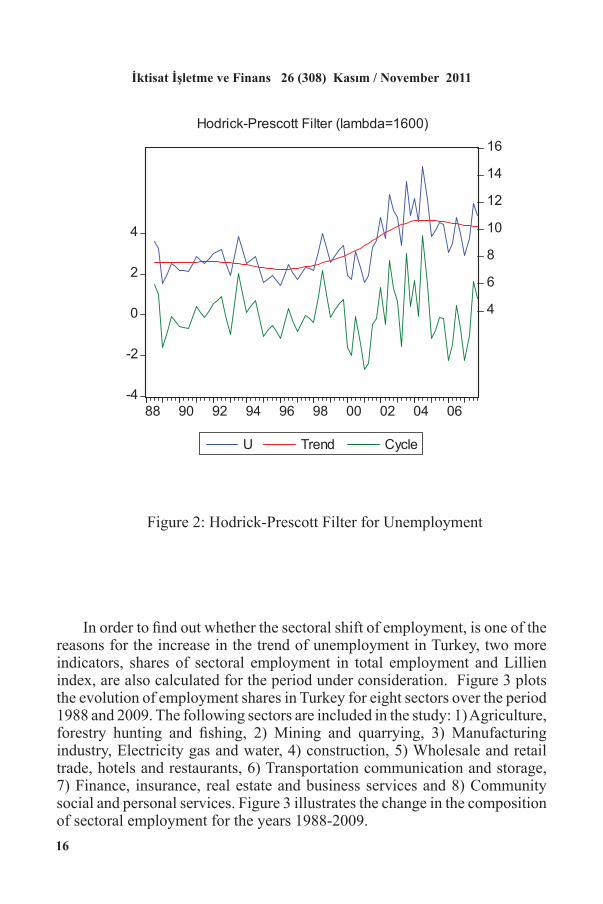
In order to filter out the time trend of unemployment after 1988, the Hodrick-Prescott Filter method was applied to Turkish unemployment data. Figure 2 shows the Hodrick-Prescott Filtering results for the unemployment rate. As can be seen from Figure 2, there is a striking increase in the trend of unemployment rate especially after the year 2000. This result supports the possibility of an increase in the natural rate of unemployment in Turkey after 2000.
1
Figure 1: Unemployment Rates, 1988-2009
Source: Turkish Statistical Institute (TSI)
16
İktisat İşletme ve Finans 26 (308) Kasım / November 2011
Figure 2: Hodrick-Prescott Filter for Unemployment
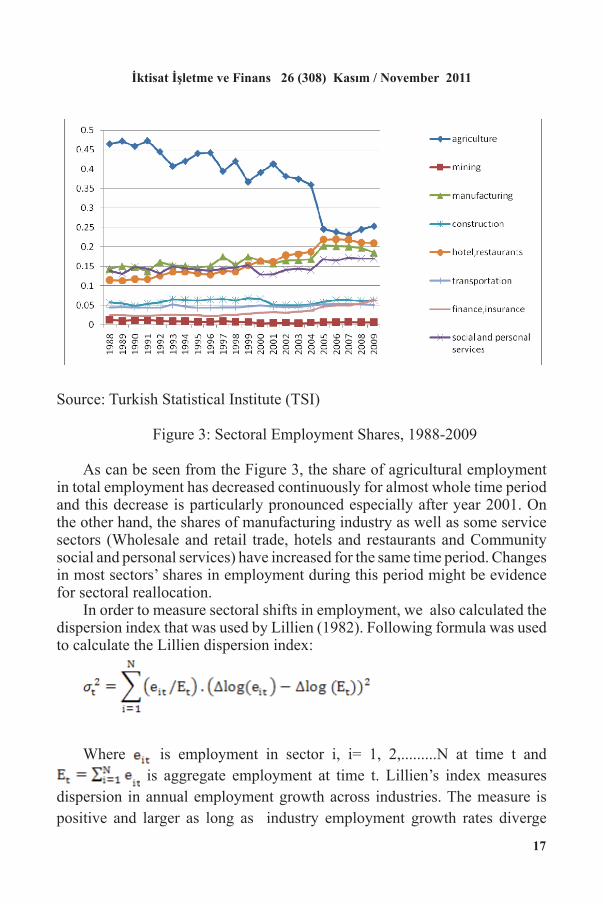
In order to find out whether the sectoral shift of employment, is one of the reasons for the increase in the trend of unemployment in Turkey, two more indicators, shares of sectoral employment in total employment and Lillien index, are also calculated for the period under consideration. Figure 3 plots the evolution of employment shares in Turkey for eight sectors over the period 1988 and 2009. The following sectors are included in the study: 1) Agriculture, forestry hunting and fishing, 2) Mining and quarrying, 3) Manufacturing industry, Electricity gas and water, 4) construction, 5) Wholesale and retail trade, hotels and restaurants, 6) Transportation communication and storage, 7) Finance, insurance, real estate and business services and 8) Community social and personal services. Figure 3 illustrates the change in the composition of sectoral employment for the years 1988-2009.
2
Figure 2: Hodrick-Prescott Filter for Unemployment
-4
-2
0
2
4
4
6
8
10
12
14
16
88 90 92 94 96 98 00 02 04 06
U Trend Cycle
Hodrick-Prescott Filter (lambda=1600)
17
İktisat İşletme ve Finans 26 (308) Kasım / November 2011
Source: Turkish Statistical Institute (TSI)
Figure 3: Sectoral Employment Shares, 1988-2009
As can be seen from the Figure 3, the share of agricultural employment in total employment has decreased continuously for almost whole time period and this decrease is particularly pronounced especially after year 2001. On the other hand, the shares of manufacturing industry as well as some service sectors (Wholesale and retail trade, hotels and restaurants and Community social and personal services) have increased for the same time period. Changes in most sectors’ shares in employment during this period might be evidence for sectoral reallocation.
In order to measure sectoral shifts in employment, we also calculated the dispersion index that was used by Lillien (1982). Following formula was used to calculate the Lillien dispersion index:
Where is employment in sector i, i= 1, 2,.........N at time t and is aggregate employment at time t. Lillien’s index measures
dispersion in annual employment growth across industries. The measure is positive and larger as long as industry employment growth rates diverge
3
Figure 3: Sectoral Employment Shares, 1988-2009
Source: Turkish Statistical Institute (TSI)
Where is employment in sector i, i= 1, 2,.........N at time t and is aggregate
employment at time t. Lillien’s index measures dispersion in annual employment growth across
industries. The measure is positive and larger as long as industry employment growth rates diverge
more from the average. Figure 4 plots the Lillien dispersion index values for the period 1989-2007.
18
İktisat İşletme ve Finans 26 (308) Kasım / November 2011
more from the average. Figure 4 plots the Lillien dispersion index values for the period 1989-2007.
Source: based on authors’ calculations
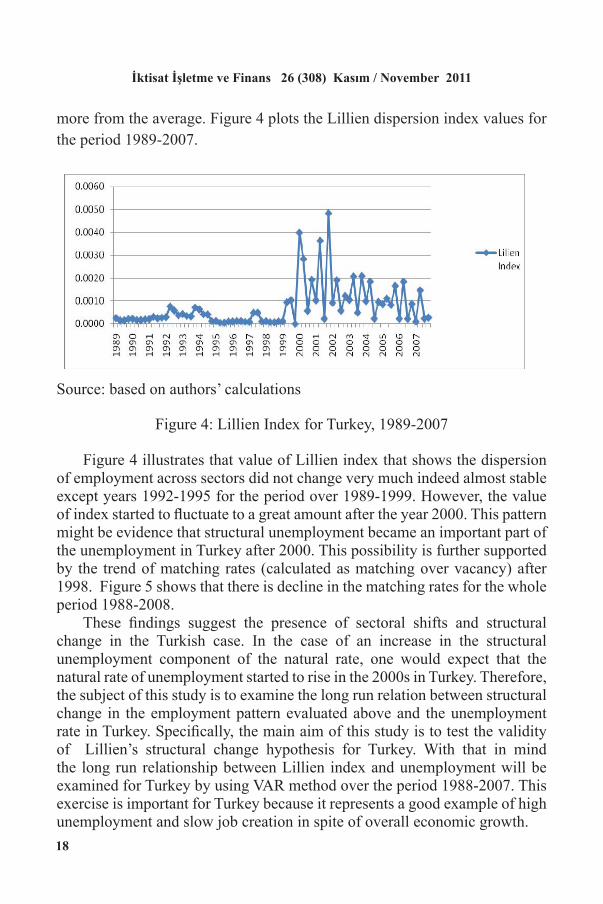
Figure 4: Lillien Index for Turkey, 1989-2007
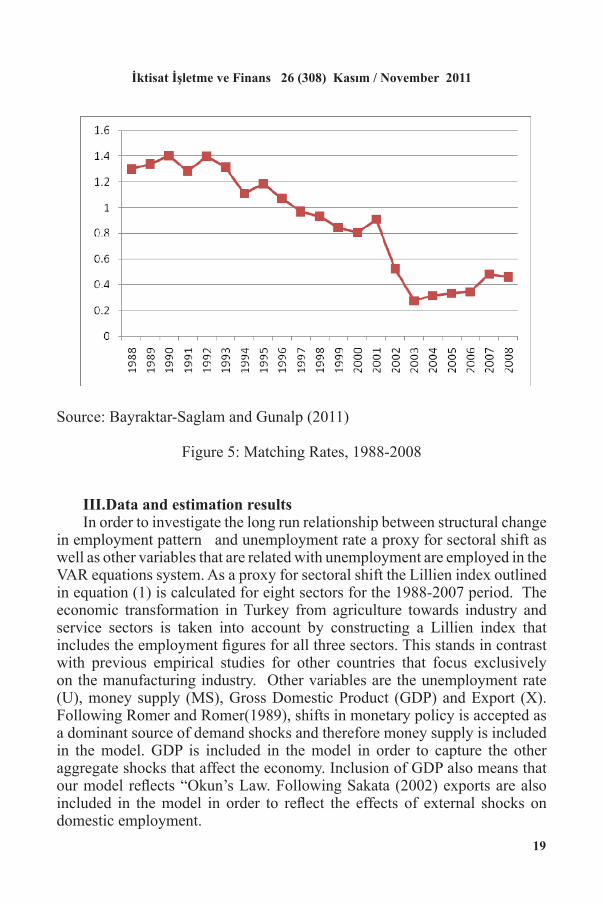
Figure 4 illustrates that value of Lillien index that shows the dispersion of employment across sectors did not change very much indeed almost stable except years 1992-1995 for the period over 1989-1999. However, the value of index started to fluctuate to a great amount after the year 2000. This pattern might be evidence that structural unemployment became an important part of the unemployment in Turkey after 2000. This possibility is further supported by the trend of matching rates (calculated as matching over vacancy) after 1998. Figure 5 shows that there is decline in the matching rates for the whole period 1988-2008.
These findings suggest the presence of sectoral shifts and structural change in the Turkish case. In the case of an increase in the structural unemployment component of the natural rate, one would expect that the natural rate of unemployment started to rise in the 2000s in Turkey. Therefore, the subject of this study is to examine the long run relation between structural change in the employment pattern evaluated above and the unemployment rate in Turkey. Specifically, the main aim of this study is to test the validity of Lillien’s structural change hypothesis for Turkey. With that in mind the long run relationship between Lillien index and unemployment will be examined for Turkey by using VAR method over the period 1988-2007. This exercise is important for Turkey because it represents a good example of high unemployment and slow job creation in spite of overall economic growth.
4
Figure 4: Lillien Index for Turkey, 1989-2007
Source: based on authors’ calculations
19
İktisat İşletme ve Finans 26 (308) Kasım / November 2011
Source: Bayraktar-Saglam and Gunalp (2011)
Figure 5: Matching Rates, 1988-2008
III.Data and estimation resultsIn order to investigate the long run relationship between structural change
in employment pattern and unemployment rate a proxy for sectoral shift as well as other variables that are related with unemployment are employed in the VAR equations system. As a proxy for sectoral shift the Lillien index outlined in equation (1) is calculated for eight sectors for the 1988-2007 period. The economic transformation in Turkey from agriculture towards industry and service sectors is taken into account by constructing a Lillien index that includes the employment figures for all three sectors. This stands in contrast with previous empirical studies for other countries that focus exclusively on the manufacturing industry. Other variables are the unemployment rate (U), money supply (MS), Gross Domestic Product (GDP) and Export (X). Following Romer and Romer(1989), shifts in monetary policy is accepted as a dominant source of demand shocks and therefore money supply is included in the model. GDP is included in the model in order to capture the other aggregate shocks that affect the economy. Inclusion of GDP also means that our model reflects “Okun’s Law. Following Sakata (2002) exports are also included in the model in order to reflect the effects of external shocks on domestic employment.
5
Figure 5: Matching Rates, 1988-2008
Source: Bayraktar-Saglam and Gunalp (2011)
20
İktisat İşletme ve Finans 26 (308) Kasım / November 2011
Money Supply variable is the real M2Y deflated by CPI. Money supply and CPI data are taken from Central Bank. GDP is the expenditure on gross domestic product at constant prices and obtained from Turkish Statistical Institute (TURKSTAT). Export is the value of total export in US dollars and obtained from Undersecretariat of Foreign Treasury. Employment variable is the sectoral employment over 15 years old. Unemployment shows the registered unemployment as a percentage of labor force. Both employment and unemployment data are taken from Household Labour Force Survey of Turkish Statistical Institute. Data for all variables are quarterly over the period 1988:1–2007:4.
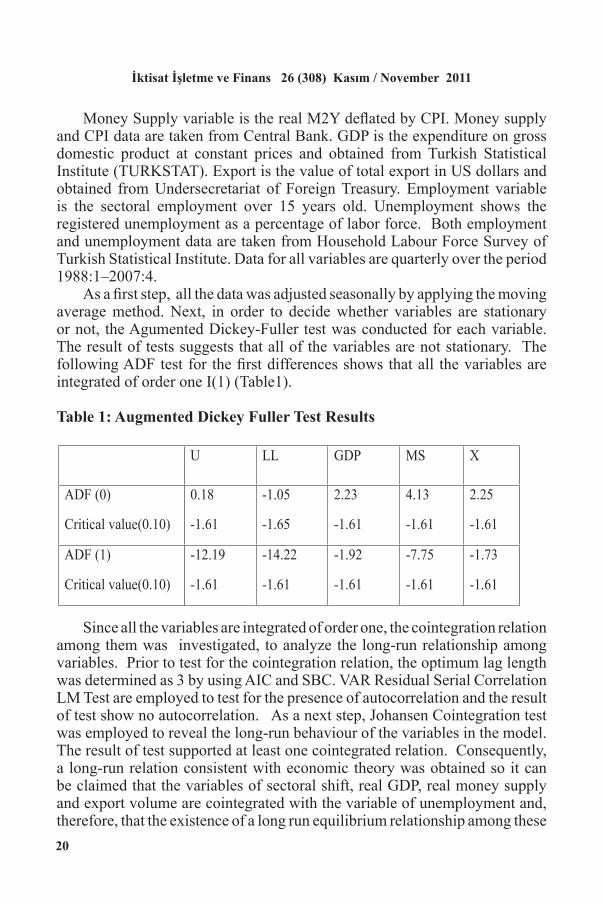
As a first step, all the data was adjusted seasonally by applying the moving average method. Next, in order to decide whether variables are stationary or not, the Agumented Dickey-Fuller test was conducted for each variable. The result of tests suggests that all of the variables are not stationary. The following ADF test for the first differences shows that all the variables are integrated of order one I(1) (Table1).
Table 1: Augmented Dickey Fuller Test Results
Since all the variables are integrated of order one, the cointegration relation among them was investigated, to analyze the long-run relationship among variables. Prior to test for the cointegration relation, the optimum lag length was determined as 3 by using AIC and SBC. VAR Residual Serial Correlation LM Test are employed to test for the presence of autocorrelation and the result of test show no autocorrelation. As a next step, Johansen Cointegration test was employed to reveal the long-run behaviour of the variables in the model. The result of test supported at least one cointegrated relation. Consequently, a long-run relation consistent with economic theory was obtained so it can be claimed that the variables of sectoral shift, real GDP, real money supply and export volume are cointegrated with the variable of unemployment and, therefore, that the existence of a long run equilibrium relationship among these
6
Table 1: Augmented Dickey Fuller Test Results
U LL GDP MS X
ADF (0)
Critical value(0.10)
0.18
-1.61
-1.05
-1.65
2.23
-1.61
4.13
-1.61
2.25
-1.61
ADF (1)
Critical value(0.10)
-12.19
-1.61
-14.22
-1.61
-1.92
-1.61
-7.75
-1.61
-1.73
-1.61

21
İktisat İşletme ve Finans 26 (308) Kasım / November 2011
variables was statistically established. According to the results of estimates of cointegration vector that is normalized with respect to unemployment variable, there is positive relation between the unemployment variable and Lillien index of sectoral shift (Table 2). These results indicate that increasing sectoral demand shifts are related with the increasing unemployment rates in Turkey. In other words, sectoral employment shifts may explain some part of the increase in unemployment. Table 2 also points out that real GDP has a negative relation with unemployment rate in the long run. This result, supports the validity of “Okun Law” in Turkey. This law, which asserts that an output level above potential lowers the unemployment rate, is also supported by other studies within the Turkish context (Mihci and Atılgan 2010; Tarı and Abasız 2010 and Tunalı 2010). The second implication of the negative relation between real GDP and unemployment is that there is cyclical component of unemployment in the long-run for the Turkish economy. The next relation observed in cointegration vector is the one between real money supply and unemployment rate (Table 2). The positive coefficient of money supply supports the theory that increasing money supply goes together with decreasing unemployment rates. Therefore, it can be claimed that, the positive effect of an increase in money supply leads to a decrease in unemployment over the long-run. Hence, it may show that monetary policy is effective in the Turkish economy for the long-run in accordance with the results of the study of Berument, Doğan and Tansel (2009). The last variable in the cointegration vector estimation is export volume. The sign of the coefficient of the export variable contradicts with theoretical expectations. The negative sign of the coefficient shows that, there is positive relation between unemployment rate and export volume. However, this conclusion is supported by the results of other studies as well. Aktar, Ozturk and Demirci (2008) also finds a positive relation between export volume and unemployment with the cointegration analysis of Turkish economy for the period 1987-2007. Similarly results of ECM estimation analysis of Tunalı (2010) suggest that exchange rate does not have any effect on unemployment in the Turkish economy for the period 2000-2008. Thus, we can say that policies to increase the volume of export is not a remedy for the unemployment problem in Turkey.
Table 2: Cointegration Vector Normalized with respect to Unemployment
7
Table 2: Cointegration Vector Normalized with respect to Unemployment
Variables U LL GDP MS X Constant
Coefficients 1.00000 -0.344133 2.797618 1.787068 -1.961611 -58.54701
22
İktisat İşletme ve Finans 26 (308) Kasım / November 2011
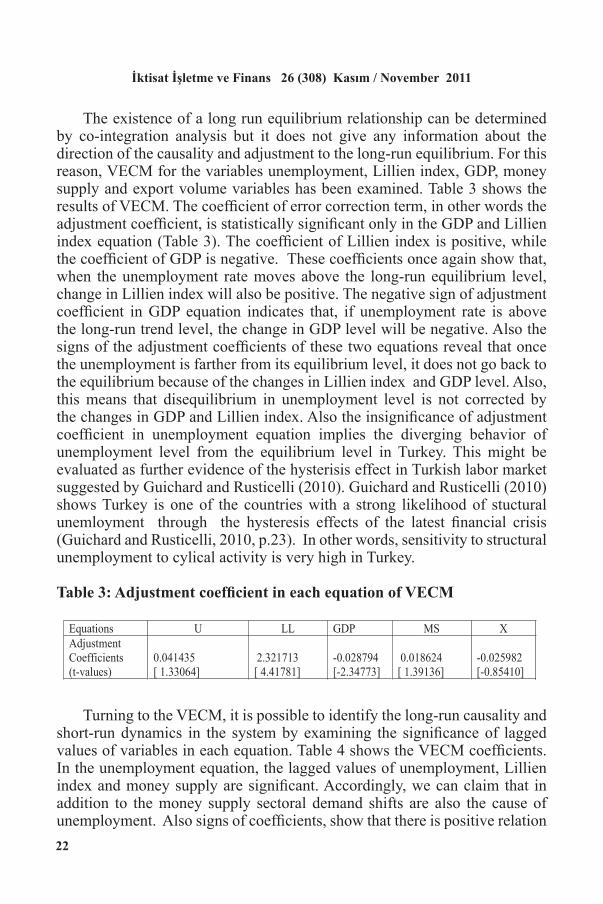
The existence of a long run equilibrium relationship can be determined by co-integration analysis but it does not give any information about the direction of the causality and adjustment to the long-run equilibrium. For this reason, VECM for the variables unemployment, Lillien index, GDP, money supply and export volume variables has been examined. Table 3 shows the results of VECM. The coefficient of error correction term, in other words the adjustment coefficient, is statistically significant only in the GDP and Lillien index equation (Table 3). The coefficient of Lillien index is positive, while the coefficient of GDP is negative. These coefficients once again show that, when the unemployment rate moves above the long-run equilibrium level, change in Lillien index will also be positive. The negative sign of adjustment coefficient in GDP equation indicates that, if unemployment rate is above the long-run trend level, the change in GDP level will be negative. Also the signs of the adjustment coefficients of these two equations reveal that once the unemployment is farther from its equilibrium level, it does not go back to the equilibrium because of the changes in Lillien index and GDP level. Also, this means that disequilibrium in unemployment level is not corrected by the changes in GDP and Lillien index. Also the insignificance of adjustment coefficient in unemployment equation implies the diverging behavior of unemployment level from the equilibrium level in Turkey. This might be evaluated as further evidence of the hysterisis effect in Turkish labor market suggested by Guichard and Rusticelli (2010). Guichard and Rusticelli (2010) shows Turkey is one of the countries with a strong likelihood of stuctural unemloyment through the hysteresis effects of the latest financial crisis (Guichard and Rusticelli, 2010, p.23). In other words, sensitivity to structural unemployment to cylical activity is very high in Turkey.
Table 3: Adjustment coefficient in each equation of VECM
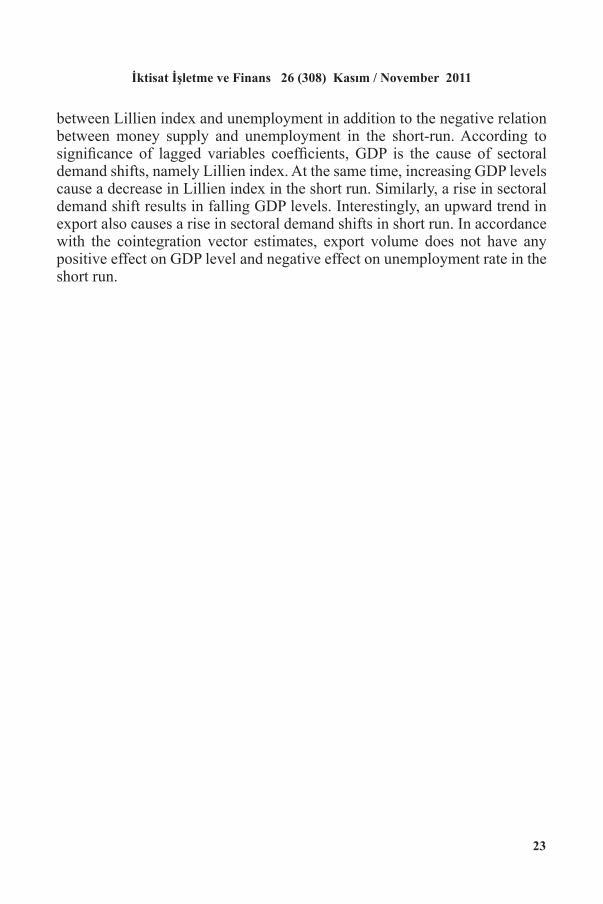
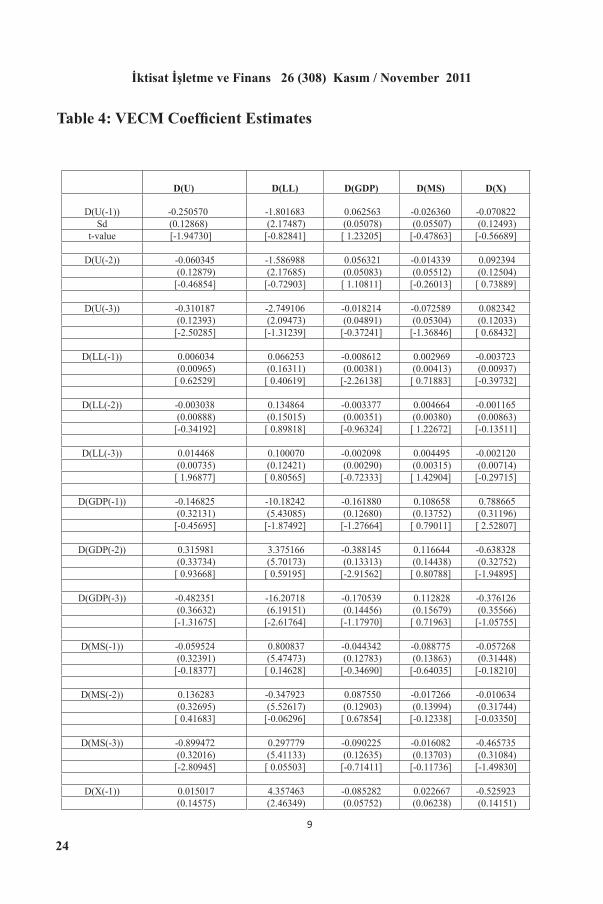
Turning to the VECM, it is possible to identify the long-run causality and short-run dynamics in the system by examining the significance of lagged values of variables in each equation. Table 4 shows the VECM coefficients. In the unemployment equation, the lagged values of unemployment, Lillien index and money supply are significant. Accordingly, we can claim that in addition to the money supply sectoral demand shifts are also the cause of unemployment. Also signs of coefficients, show that there is positive relation
8
Table 3: Adjustment coefficient in each equation of VECM
Equations U LL GDP MS X Adjustment Coefficients (t-values)
0.041435 [ 1.33064]
2.321713 [ 4.41781]
-0.028794 [-2.34773]
0.018624 [ 1.39136]
-0.025982 [-0.85410]
23
İktisat İşletme ve Finans 26 (308) Kasım / November 2011
between Lillien index and unemployment in addition to the negative relation between money supply and unemployment in the short-run. According to significance of lagged variables coefficients, GDP is the cause of sectoral demand shifts, namely Lillien index. At the same time, increasing GDP levels cause a decrease in Lillien index in the short run. Similarly, a rise in sectoral demand shift results in falling GDP levels. Interestingly, an upward trend in export also causes a rise in sectoral demand shifts in short run. In accordance with the cointegration vector estimates, export volume does not have any positive effect on GDP level and negative effect on unemployment rate in the short run.
24
İktisat İşletme ve Finans 26 (308) Kasım / November 2011
Table 4: VECM Coefficient Estimates
9
Table 4: VECM Coefficient Estimates
D(U) D(LL) D(GDP) D(MS) D(X)
D(U(-1)) -0.250570 -1.801683 0.062563 -0.026360 -0.070822 Sd (0.12868) (2.17487) (0.05078) (0.05507) (0.12493)
t-value [-1.94730] [-0.82841] [ 1.23205] [-0.47863] [-0.56689]
D(U(-2)) -0.060345 -1.586988 0.056321 -0.014339 0.092394 (0.12879) (2.17685) (0.05083) (0.05512) (0.12504) [-0.46854] [-0.72903] [ 1.10811] [-0.26013] [ 0.73889]
D(U(-3)) -0.310187 -2.749106 -0.018214 -0.072589 0.082342 (0.12393) (2.09473) (0.04891) (0.05304) (0.12033) [-2.50285] [-1.31239] [-0.37241] [-1.36846] [ 0.68432]
D(LL(-1)) 0.006034 0.066253 -0.008612 0.002969 -0.003723 (0.00965) (0.16311) (0.00381) (0.00413) (0.00937) [ 0.62529] [ 0.40619] [-2.26138] [ 0.71883] [-0.39732]
D(LL(-2)) -0.003038 0.134864 -0.003377 0.004664 -0.001165 (0.00888) (0.15015) (0.00351) (0.00380) (0.00863) [-0.34192] [ 0.89818] [-0.96324] [ 1.22672] [-0.13511]
D(LL(-3)) 0.014468 0.100070 -0.002098 0.004495 -0.002120 (0.00735) (0.12421) (0.00290) (0.00315) (0.00714) [ 1.96877] [ 0.80565] [-0.72333] [ 1.42904] [-0.29715]
D(GDP(-1)) -0.146825 -10.18242 -0.161880 0.108658 0.788665 (0.32131) (5.43085) (0.12680) (0.13752) (0.31196) [-0.45695] [-1.87492] [-1.27664] [ 0.79011] [ 2.52807]
D(GDP(-2)) 0.315981 3.375166 -0.388145 0.116644 -0.638328 (0.33734) (5.70173) (0.13313) (0.14438) (0.32752) [ 0.93668] [ 0.59195] [-2.91562] [ 0.80788] [-1.94895]
D(GDP(-3)) -0.482351 -16.20718 -0.170539 0.112828 -0.376126 (0.36632) (6.19151) (0.14456) (0.15679) (0.35566) [-1.31675] [-2.61764] [-1.17970] [ 0.71963] [-1.05755]
D(MS(-1)) -0.059524 0.800837 -0.044342 -0.088775 -0.057268 (0.32391) (5.47473) (0.12783) (0.13863) (0.31448) [-0.18377] [ 0.14628] [-0.34690] [-0.64035] [-0.18210]
D(MS(-2)) 0.136283 -0.347923 0.087550 -0.017266 -0.010634 (0.32695) (5.52617) (0.12903) (0.13994) (0.31744) [ 0.41683] [-0.06296] [ 0.67854] [-0.12338] [-0.03350]
D(MS(-3)) -0.899472 0.297779 -0.090225 -0.016082 -0.465735 (0.32016) (5.41133) (0.12635) (0.13703) (0.31084) [-2.80945] [ 0.05503] [-0.71411] [-0.11736] [-1.49830]
D(X(-1)) 0.015017 4.357463 -0.085282 0.022667 -0.525923 (0.14575) (2.46349) (0.05752) (0.06238) (0.14151)
25
İktisat İşletme ve Finans 26 (308) Kasım / November 2011
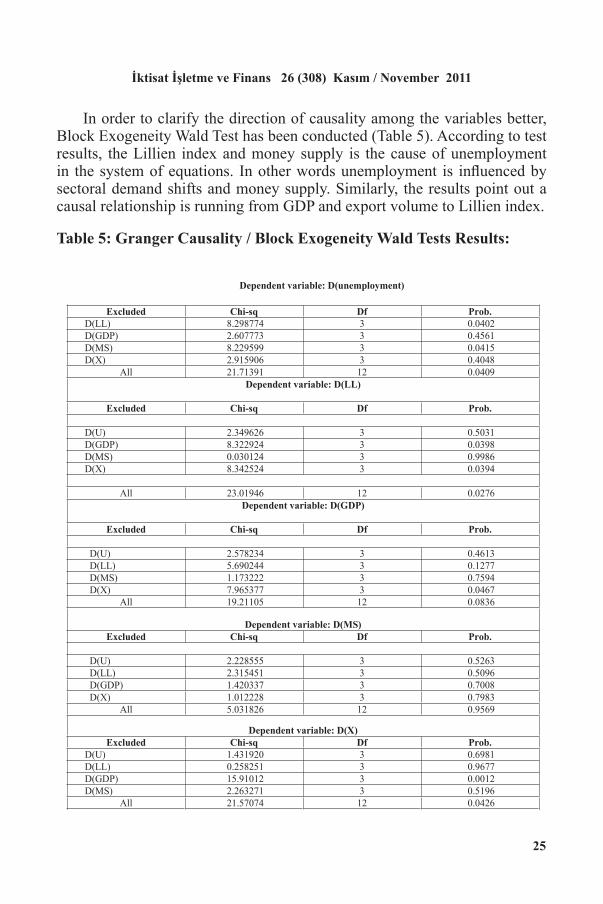
Table 4: VECM Coefficient Estimates In order to clarify the direction of causality among the variables better, Block Exogeneity Wald Test has been conducted (Table 5). According to test results, the Lillien index and money supply is the cause of unemployment in the system of equations. In other words unemployment is influenced by sectoral demand shifts and money supply. Similarly, the results point out a causal relationship is running from GDP and export volume to Lillien index.
Table 5: Granger Causality / Block Exogeneity Wald Tests Results:
11
Table 5: Granger Causality / Block Exogeneity Wald Tests Results:
Dependent variable: D(unemployment)
Excluded Chi-sq Df Prob. D(LL) 8.298774 3 0.0402 D(GDP) 2.607773 3 0.4561 D(MS) 8.229599 3 0.0415 D(X) 2.915906 3 0.4048
All 21.71391 12 0.0409Dependent variable: D(LL)
Excluded Chi-sq Df Prob.
D(U) 2.349626 3 0.5031 D(GDP) 8.322924 3 0.0398 D(MS) 0.030124 3 0.9986 D(X) 8.342524 3 0.0394
All 23.01946 12 0.0276 Dependent variable: D(GDP)
Excluded Chi-sq Df Prob.
D(U) 2.578234 3 0.4613 D(LL) 5.690244 3 0.1277 D(MS) 1.173222 3 0.7594 D(X) 7.965377 3 0.0467
All 19.21105 12 0.0836
Dependent variable: D(MS)Excluded Chi-sq Df Prob.
D(U) 2.228555 3 0.5263 D(LL) 2.315451 3 0.5096 D(GDP) 1.420337 3 0.7008 D(X) 1.012228 3 0.7983
All 5.031826 12 0.9569
Dependent variable: D(X)Excluded Chi-sq Df Prob.
D(U) 1.431920 3 0.6981 D(LL) 0.258251 3 0.9677 D(GDP) 15.91012 3 0.0012 D(MS) 2.263271 3 0.5196
All 21.57074 12 0.0426
26
İktisat İşletme ve Finans 26 (308) Kasım / November 2011
In sum the causality analysis shows that, Lillien index, namely sectoral demand shifts is the cause of unemployment. In other words sectoral demand shifts contributes to change in the unemployment in Turkish economy. Additionally, money supply is another determinant of persistent unemployment problem in Turkey.
Furthermore, as it is pointed out by Rissman (1993) and Chiarini and Piselli (2000), to the extent that the unemployment rate also reflects cyclical disturbances, unemployment will be Granger-causing dispersion of the sectoral employments. That is, unemployment does not Granger-cause the sectoral shift measure if sectoral shift is sterile from cyclical factor. Causality test results of our model shows that, unemployment doesn’t have any influence on Lillien index in terms of causality. Also according to results of Block Exogeneity test of our model money supply is not the cause of Lillien index. So it may also show that Lillien index is not affected by the cyclical disturbances reflected by money supply movements. In sum, it can be concluded that sectoral demand shifts are not endogenous to business cycles and therefore the Abraham-Katz criticism is not valid for the Turkish case.
IV. ConclusionThe causes of unemployment have garnered substantial interest in the
literature. Following the influential study of Lillien (1982), there are many theoretical and empirical studies focusing on the role of sectoral shifts of the labor demand on unemployment. Since Turkey suffers from high unemployment rates and “jobless growth”, the main aim of this study is to examine the causes of unemployment within the context of structural shift hypothesis. Specifically, the main aim of this study is to test the validity of Lillien’s structural change hypothesis for Turkey. With that purpose, the long run relationship between sectoral shifts that are measured by Lillien index and unemployment along with the other determinants of unemployment has been examined for Turkey by using VECM method over the period 1988-2007
The main result of the cointegration analysis is that sectoral demand shifts are one of the long run determinants of unemployment in Turkey. In other words, sectoral employment shifts may explain some part of the increase in unemployment. On the other hand, fluctuations in total output are also related with the changes of unemployment rates in Turkey. This means that there is cyclical component of unemployment in the long-run for the Turkish economy. This evidence is supported by the reductive effect of money supply on unemployment. Since adjustment coefficient in the unemployment equation of VECM is insignificant it can be said that once the unemployment level moves away from its long run equilibrium value, it diverges from its equilibrium level. This might be an evidence of the hysteresis effect in labor market of Turkey.
27
İktisat İşletme ve Finans 26 (308) Kasım / November 2011
Because our findings emphasize that one of the important source of unemployment comes from sectoral shifts, structural policies have a central role in solving mismatch problems in the Turkish labor market economy. In other words, “micro” models and policy interventions focusing on the relevant sectors are appropriate to alleviate the unemployment problem in Turkey. However, our study also shows that traditional macroeconomic policies are still relevant for Turkey.
References
Aaronson, D., Rissman, E., &Sullivan, D. (2004). Can Sectoral Reallocation Explain the Jobless Recovery? Economic Perspectives, Federal Reserve Bank of Chicago, 28(2), 36-39.
Abraham, K. G., & Katz, L. F. (1984).Cyclical Unemployment: Sectoral Shifts or Aggregate Disturbances. NBER Working Paper,1410.
Abraham K., & Katz L. (1986). Cyclical Unemployment: Sectoral Shifts or Aggregate Disturbances?. Journal of Political Economy, 94,507–522. doi:0022-3808/86/9403-0001$01.5
Aktar, I., Ozturk, L., & Demirci, N. (2008). The Impact of FDI, Export, Economic Growth, Total Fixed Investment on Unemployment in Turkey. First International Conference on Management and Economics, Vol.II, pp.69-76, 28-29 March 2008 in Apoke University in Tirana, Albania.
Bayraktar-Saglam, B.& Gunalp, B. (2011). The Beveridge Curve and Labour Market Dynamics in Turkey, Applied Economics, forthcoming. Doi:10.180/00036846.2011.570725
Berument, H. Doğan, N., & Tansel, A. (2009). Macroeconomic Policy and Unemployment by Economic Activity: Evidence from Turkey. Emerging Markets Finance and Trade, 45(3), 21–34. doi:10.2753/REE1540-496X450302
Brainard, S. L., & Cutler, D.M. (1993). Sectoral Shifts and Cyclical UnemploymentReconsidered.Quarterly Journal of Economics, 108(1), 219–243. doi: 10.2307/2118501
Chiarini, B., & Piselli, P. (2000). Unemployment, Wage Pressure and Sectoral Shifts: Permanent and Temporary Consequences of Intersectoral Shocks. Journal of Policy Modeling, 22(7),777–799. doi:10.1016/S0161-8938(00)00032-6
Genay, H., & Loungani, P. (1997). Labor market fluctuations in Japan and the U.S.: How Similar are They?. Economic Perspectives, Federal Reserve Bank of Chicago,21(3), 15–28.
Guichard, S., & Rusticelli. E. (2010). Assessing the Impact of the Financial Crisis on Structural Unemployment in OECD Countries, OECD Economics Department Working Papers, No. 767, OECD Publishing. doi:10.1787/5kmftp8khfjg-en
Heaton, C., & Oslington, P. (2010). Micro vs Macro Explanations of post-war US Unemployment
28
İktisat İşletme ve Finans 26 (308) Kasım / November 2011
Movements. Economics Letters, 106, 87–91. doi:10.1016/j.econlet.2009.10.009Lillien, D. M. (1982).Sectoral Shifts and Cyclical Unemployment. Journal of Political Economy, 90, 777–793.
Loungani, P., Rush, M. & Tave, W. (1990). Stock Market Dispersion and Unemployment. Journal of Monetary Economics, 25(3), 367–388. doi:10.1016/0304-3932(90)90059-D
Loungani, P., & Trehan, B. (1997). Explaining Unemployment: Sectoral and Aggregate Shocks. Economic Review. Federal Reserve Bank of San Francisco, 21, 3-15.
Mihci S., & Atılgan E. (2010).İşsizlik ve Büyüme: Türkiye Ekonomisi için Okun Katsayıları. İktisat İşletme ve Finans Dergisi, 25(296), 33-54. doi: 10.3848/iif.2010.296.2803
Mills, T. C., Pelloni, G. & Zervoyianni, A. (1995). Unemployment Fluctuations in the United States: Further Tests of the Sectoral-Shifts Hypothesis. The Review of Economics and Statistics, 77, 294–304.
Neelin, J.(1987). Sectoral Shifts and Canadian Unemployment. The Review of Economics and Statistics, 69(4), 718-723.
OECD (2010), OECD Employment Outlook, Paris.
Rissman, E.R. (1993). Wage Growth and Sectoral Shifts. Phillips curve redux. Journal ofMonetary Economics, 31, 395–416. doi:10.1016/0304-3932)93=90055-K
Rissman, E. R. (1997). Measuring Labor Market Turbulence. Economic Perspectives, Federal Reserve, Bank of Chicago, 21(3), 2–14.
Romer, C., & Romer, D. (1989). Does Monetary Policy Matter: A New Test in the Spirit of Friedman and Schwartz, NBER, Macroeconomics Annual 1989,121–170.
Sakata, K. (2002). Sectoral Shifts and Cylical Unemployment in Japan. Journal of Japanese and International Economies, 16, 227-252. doi:10.1006/jjie.2001.0476
Tarı, R., & Abasız, T. (2010). Asimetrik Etkiler Altında Okun Yasası’nın Eşik Hata Düzeltme Modeli İle Sınanması: Türkiye Örneği. İktisat İşletme ve Finans Dergisi, 25(291),53-77. doi: 10.3848/iif.2010.291.2600
Tunalı, H. (2010). The Analysis of Unemployment in Turkey: Some EmpiricalEvidence Using Co-integration Test. European Journal of Social Sciences, 18(1),18-38
Turkish Statistical Institute (TSI). Hanehalkı, İş İstatistikleri Internet Data Base, from www.tuik.gov.tr.