Detection of the vortices signs in the scalar fields - CiteSeerX
9
Optica Applicata, Vol. XXXVIII, No. 4, 2008 Detection of the vortices signs in the scalar fields YURIY GALUSHKO * , IGOR MOKHUN Chernivtsi University, 2, Kotsyubinsky str., Chernivtsi 12, 58012, Ukraine * Corresponding author: [email protected] The technique for determining the vortex sign in the scalar fields (including the statistical ones) un- der conditions when the use of the regular reference beam is impossible is described. The elaborated approach is based on the shift-interferometry technique. The conditions of the optimal vortices iden- tification are formulated. The results of the computer simulation and experimental confirmation are presented. Keywords: vortex, shift-interferometry, interference forklets, topological charge. 1. Introduction Restoration of the field phase distribution from the analysis of its intensity distribution (the so-called inverse source problems in optics) is an old optical problem. The theo- retical and practical aspects of this problem have been comprehensively reasearched (see, for example, [1]). However, new approaches to solving this problem are formed on the basis of understanding the special role of amplitude zeroes in a scalar field [2, 3]. As it follows from [2, 4], amplitude zeroes are wavefront dislocations (optical vortices) which are combined into some systems – vortex networks. Elements of these networks are connected to each other. Their characteristics define the behav- ior of a field phase in each point [3]. As a result, the information about characteristics of the networks and their vortices provides the feasibilities for restoring the field pa- rameters with high reliability. At the same time, such approaches to solving the in- verse source problems, being now at the initial stage of development, are not widely applied. One of the aspects of the problem is the impossibility of the field zeroes “identification”. The main characteristic of an optical vortex is its topological charge (sign), which defines the direction (clockwise or counter-clockwise) of the phase in- creasing under the bypass of the vortex centre (see, for example, [4, 5]). As it is known, the complete information on the vortex characteristics may be obtained only from the analysis of the data of the interferometric experiment [6–9]. At the same
-
Upload
khangminh22 -
Category
Documents
-
view
7 -
download
0
Transcript of Detection of the vortices signs in the scalar fields - CiteSeerX
Optica Applicata, Vol. XXXVIII, No. 4, 2008
Detection of the vortices signs in the scalar fields
YURIY GALUSHKO*, IGOR MOKHUN
Chernivtsi University, 2, Kotsyubinsky str., Chernivtsi 12, 58012, Ukraine
*Corresponding author: [email protected]
The technique for determining the vortex sign in the scalar fields (including the statistical ones) un-der conditions when the use of the regular reference beam is impossible is described. The elaboratedapproach is based on the shift-interferometry technique. The conditions of the optimal vortices iden-tification are formulated. The results of the computer simulation and experimental confirmation arepresented.
Keywords: vortex, shift-interferometry, interference forklets, topological charge.
1. Introduction
Restoration of the field phase distribution from the analysis of its intensity distribution(the so-called inverse source problems in optics) is an old optical problem. The theo-retical and practical aspects of this problem have been comprehensively reasearched(see, for example, [1]). However, new approaches to solving this problem areformed on the basis of understanding the special role of amplitude zeroes in a scalarfield [2, 3]. As it follows from [2, 4], amplitude zeroes are wavefront dislocations(optical vortices) which are combined into some systems – vortex networks. Elementsof these networks are connected to each other. Their characteristics define the behav-ior of a field phase in each point [3]. As a result, the information about characteristicsof the networks and their vortices provides the feasibilities for restoring the field pa-rameters with high reliability. At the same time, such approaches to solving the in-verse source problems, being now at the initial stage of development, are not widelyapplied.
One of the aspects of the problem is the impossibility of the field zeroes“identification”. The main characteristic of an optical vortex is its topological charge(sign), which defines the direction (clockwise or counter-clockwise) of the phase in-creasing under the bypass of the vortex centre (see, for example, [4, 5]). As it isknown, the complete information on the vortex characteristics may be obtained onlyfrom the analysis of the data of the interferometric experiment [6–9]. At the same

YU. GALUSHKO, I. MOKHUN706
time, as a rule, formation of the regular reference beam is impossible due to the lackof knowledge of the pre-history of the analyzed field.
Thus, the elaboration of the technique, which allows us to obtain the informationon the vortices signs at the field with some intensity distribution, is necessary. Note,that in general case this field is a statistical one or in other words – a speckle-field. Onthe other hand, we can state the following facts:
(i) Any field under its amplitude dividing enables us to form the coherent superpo-sition (see, for example, [16]). Such components may be easily shifted to one anotherin the transversal direction.
(ii) Phase is practically constant in the speckle centre due to the fact that the phasesaddle is positioned in this region [13].
(iii) The mean speckle dimension is comparable with the field intensity correlationlength [2, 14].
(iv) Field intensity and phase correlation lengths coincide if the field is analyzed infar field. Moreover, their magnitude coincides with the mean space between absoluteintensity minima (or phase vortices) [2, 14].
(v) Intensity networks and phase ones (at least, in statistical sense) are con-nected. First of all, positions of absolute intensity minima coincide with the locali-zation of the centers of phase vortices. The intensity saddle points are preferen-tially positioned in the areas with relatively large phase gradient [2, 10–12]. Thisallows us:
• to define the field correlation length as the magnitude which is an inverse ratio tothe spatial density of the field intensity minima (mean space between them);
• to indicate the areas where phase saddles are positioned.In accordance with the said above, if the field is divided by amplitude on trans-
versely shifted components it can be stated that the areas, where vortices of one of thecomponent are located, coincide with the regions, where the other component has itsphase saddle points (i.e., regions where the phase is practically constant). In this case theprocess of interference of the vortices related to the first component with the other(“shifted”) component may be interpreted as a “classical” interference of vortex fieldstructure with a reference plane wave. As a result of this superposition, the correspond-ing interference forklets appear in the positions of vortices localized in the both inter-fering components. Naturally, the shift must be less than mean speckle dimension.
It follows from these facts that one of the solutions of the problem of interest may bethe employment of the shift-interferometry techniques (see, for example, [15]).
This paper is devoted to the results of the shift-interferometry method of the vor-tices signs identification.
2. Method of the vortices signs identification
The base of the elaborated method is as follows. Obviously, each field may be dividedinto the identical components and one can obtain (see, for example, [15]) the inter-

Detection of the vortices signs in the scalar fields 707
ference of the field with itself. The angle between components, the shift betweenthem, and their intensity ratio can be easily controlled.
Let the field ),( υωU be divided into the components ),(~
1 υωU and ),(~
2 υωU . As-
sume that the component ),(~
2 υωU is shifted relatively to the field ),(~
1 υωU by ∆ in
the plane υω, in arbitrary direction. Naturally, the choice of the component ),(~
2 υωU
to be shifted is quite arbitrary, so both components are equivalent in this sense.Moreover, as it will follow from further considerations, only a relative componentshift is important.
Let us assume (without loss of generality) that the directions of the predominantpropagation of these fields are different and that they are described by the followingequations:
)](exp[),(),(~
)](exp[),(),(~
22
11
βυαωυωυωβυαωυωυω
υω +−−−=
+=
j��
UU
jUU(1)
where U1 and U2 are the “exact replicas” of the field U with corresponding amplitudecoefficients determining the mean intensity ratio of the components, α = ksinα ′,β = ksinβ ′ determine the “incline” of the fields U1 and U2 relative to the z-axis, de-
termining the predominant propagation of the resulting field, 222υω���
+= is a shift
of the field U2 relative to the field U1.The following relations describe the intensity of such superposition:
)]}(2sin[][
)](2cos[]{[2),(
2121
212121
βυαω
βυαωυω
+−+
++++=
RIIR
IIRRJJJ
(2)
where Ri, I i (i = 1, 2) – the real and imaginary parts of the fields U1 and U2.As it follows from eq. (2), the third term is zero, when ∆ = 0. Correspondingly, the
intensity of the resulting field is the interference pattern containing the set of straightfringes without any discontinuities. Such pattern is modulated by the intensity of thefield U(ω, υ).
The shift ∆ (less than lcor/2 and more than lcor/10÷lcor/5) between the fields
),(~
1 υωU and ),(~
2 υωU leads to the situation, when the areas of the fields containing
the vortices superpose with practically plane waves, corresponding to the areas withthe phase saddle points. Thus, “classical” interference forklets appear in the positionsof vortices of the fields U1 and U2 when ∆ is nonzero.
Note:(i) Vortices of different signs, associated with one of the fields (U1 or U2) form the
forklets with different directions.(ii) The directions of the forklets are also different when vortices of the same signs
are associated with different components.
YU. GALUSHKO, I. MOKHUN708
(iii) The direction of the forklets obtained as the result of the interference of thevortex field with a plane reference wave is determined by two factors [9]:
• topological charge of the vortex;• mutual orientation of the vortex and reference wave relatively to the observation
plane.(iv) The normal to the wavefront in the phase saddle points coincides with the pre-
dominant direction of wave propagation. Thus, one can state that information on thepredominant directions of propagation of the waves U1 and U2 unambiguously deter-mines the mutual orientation of the “vortex” and “reference” waves (the field partwith a saddle point) relatively to the observation plane.
As it follows from these facts, the control of the parameters of the interferingcomponents U1 and U2 (their propagation directions, relative shift) allows usto determine unambiguously the true value of topological charge of any field vor-tex.
As it is known, the maximal visibility of the interference pattern is achievedwhen the intensities of the superposing fields are equal. The uniform visibility isimpossible when superposing fields are statistical and the shift ∆ is nonzero. Visi-bility in the areas with vortices (for example, associated with the field U1) tends tothe maximal one, whereas the intensity J1 of one of the fields (in our case the fieldU1) is significantly higher than the intensity J2 of the other component (the field U2).In other words, the favorable conditions for visualizing the vortices associated withthe field U1 appear due to the fact that low intensity parts of the field U1 superposewith the parts of the field U2, which have similar intensity. At the same time, theinterference conditions for the areas with vortices associated with the component U2
are extremely unfavorable, even in comparison with the other parts of the field U2.Only the interference forklets corresponding to the non-shifted component must bewell observed when the intensity J1 is significantly higher than J2. And vice versa,when the intensity J2 is significantly higher than J1, the vortices of the field U2 arevisualized.
Thus, one can determine the positions and signs of the vortices of practicallyarbitrary field under the control of the components shift ∆ and their intensities J1
and J2.
3. Results of the computer simulation ofthe speckle field shift-interferometry
In this section, we present the results of the computer simulation of the vortices visu-alization by the speckle field shift-interferometry.
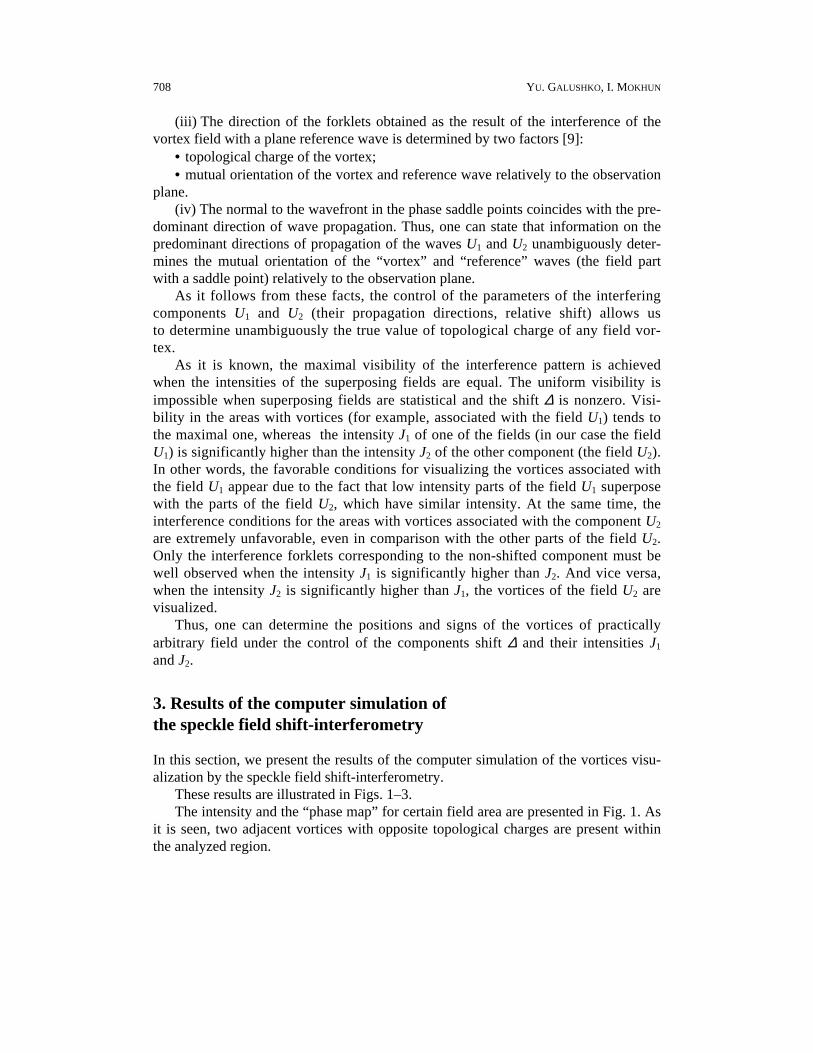
These results are illustrated in Figs. 1–3.The intensity and the “phase map” for certain field area are presented in Fig. 1. As
it is seen, two adjacent vortices with opposite topological charges are present withinthe analyzed region.

Detection of the vortices signs in the scalar fields 709
a b
Fig. 1. Space distributions of the intensity (a) and phase (b) of the speckle field fragment. The phasechanges from 0 (white) to 2π (black). Gray x-like areas in Figure (b) are the areas where phase saddlesare positioned. Two adjacent vortices are depicted by squares. A dark square with a white fringe effect isa negative vortex, and a light square with a black fringe effect is a positive one.
a b
c d
Fig. 2. Shift-interferograms of the speckle field for different magnitudes of the shift ∆. Interferenceforklets corresponding to the steady field (field U1) are indicated in Fig. d by white arrows. The direc-tion of the shift of the field U2 is shown in the same figure by the thick white arrow. Additionally, theshift magnitudes of the field U2 are denoted in Figures (b)–(d): a – ∆ = 0, b – ∆ = 0.1lcor, c – ∆ = 0.2lcor,d – ∆ = 0.3lcor.

YU. GALUSHKO, I. MOKHUN710
a b
c d
Fig. 3. Shift-interferograms of the speckle field for magnitudes of the shift ∆ = 0.3lcor and different intensityratios, corresponding to the components U1 and U2. Interference forklets corresponding to the steady field(field U1) are indicated in Figure a by white arrows. The shift direction of the field U2 is the same as inFigure 2. a – the mean intensity of the field U1 is equal to the intensity of the component U2, b – it exceedsthe intensity of the field U2 4 times, c – the intensity of the field U1 exceeds the intensity of the field U2
16 times, d – the intensity of the component U1 exceeds the intensity of the field U2 100 times.
The shift-interferograms for this field area and the shifts ∆ of different magni-tudes are presented in Fig. 2. The interference forklets, corresponding to the non-shifted field, are indicated in Fig. 2d by white arrows. The direction of the shift ofthe field U2 is shown in the same figure by a thick white arrow. Additionally, shiftmagnitudes of the field U2 are denoted in Figs. 2b–d. As it follows from Fig. 2a, theinterference fringes are straight and continuous, when ∆ = 0, and as a result, theinterference forklets corresponding to the vortices are absent. The pairs of the oppo-sitely directed interference forklets corresponding to the fields U1 and U2 appear fornon-zero shift (Figs. 2b–d) due to the interference of the vortices with smooth partsof these fields. The interference forklets associated with the component U2 shiftrelatively to the ones corresponding to the field U1 and they are in proportion to theincreasing shift ∆.
The results of the shift-interference for different intensity ratios of the fields U1 andU2 are illustrated in Fig. 3. As it follows from Figs. 3c, d, only the interference forklets

Detection of the vortices signs in the scalar fields 711
corresponding the the field U1 are reliably identified for the case when the intensity ofthe component U1 exceeds the intensity of the field U2 by 20 to 100 times.
4. Experimental disclosure of the vortices signs on the basis ofthe shift-interferometry
The experimental arrangement for detection of the vortices signs in the statistical sca-lar field is presented in Fig. 4.
Fig. 4. Experimental arrangement: 1 – object; 2 – Fourier-transform objective; 3, 6 – beam-splitters; 4, 5 – mirrors.
A non-collimated beam from the Не-Ne-laser illuminates the scattering object 1 –a ground glass screen, limited by a square hole. The magnitude of the phase varianceof the boundary field is chosen in such a manner that the regular component of thescattered field behind the object is absent. The Fourier-transform objective 2 is placedat the focal length from the object. Due to that, the Fourier-transform of the boundaryfield (far field) has been observed in the back focal plane of this objective. The Mach-Zehnder interferometer 3–6 is placed just behind the objective 2. One of its mirrors,4, and an output beam-splitter 6 are mounted on precise mechanical devices providingfine control of the shift and convergence angle of the field components. The resultinginterference patterns and component intensities are fixed by a CCD-camera.
The results of the shift-interference are presented in Fig. 5. Fig. 5a corresponds tothe zero shift between the field components. Fig. 5b illustrates the interference for thecase when a shift between the fields U1 and U2 is about a half of the correlation length(a half of a mean dimension of a speckle). The intensity of the steady component ex-ceeds the intensity of the shifted one by ~10 times.
As it follows from Fig. 5b, the vortices of the steady component are easily identi-fied in comparison with the vortices of the shifted one.
Naturally, determining the vortex characteristics from an interference pattern isnot a simple problem, and it is always subjective. Nevertheless, we state that the signsof all (practically, without any exclusions) vortices of the analyzed field may be iden-tified with high reliability due to the operative modifying of the intensity ratio of thecomponents and the shift magnitude between them, even in the case when the use ofthe regular reference beam is impossible.

YU. GALUSHKO, I. MOKHUN712
Fig. 5. The results of the experimental detection of the vortices signs on the basis of the shift-interfero-metry. a – interference pattern of the resulting field for zero shift between the components, c, d and e, f –intensity distributions of the steady and shifted field components, respectively, b – interference pattern ofthe resulting field for the shift between components, which is equal to about a half of correlation length.Distances ∆x, ∆y illustrate the magnitudes of the shifts in the corresponding directions of the coordinateplane. White arrows, numbers 1 and 2 in b, indicate the positions of the vortices (interference forklets)corresponding to different field components. 1 – vortex of the steady component, 2 – vortex of the shiftedcomponent. Squares in d, f illustrate the positions of the vortices. (d) – vortex of the steady component,(f) – vortex of the shifted component. Shift direction of the field U2 is denoted in f by the white thickarrow. Black and white lines denote the “coordinate map”, to make the observation and perception of thefields shifts easier.
5. Conclusions
1. The shift-interferometry technique can be used for determining the vortex charac-teristics of an arbitrary field, including statistical ones.2. The optimal conditions of the interferogram formation are the following:
(i) shift between the field components is about 0.3–0.5 of the field correlation length;(ii) intensity ratio of the components must be chosen in such a manner that the intensity
of the steady component exceeds the intensity of the shifted component by 20–50 times.

Detection of the vortices signs in the scalar fields 713
References
[1] BALTES H.P., Inverse Source Problems in Optics, Springer-Verlag, Berlin 1978.[2] FREUND I., SHVARTSMAN N., FREILIKHER V., Optical dislocation networks in highly random media,
Optics Communications 101(3–4), 1993, pp. 247–64.[3] ANGELSKY O., BRANDEL R., MOKHUN I., Characteristics of scalar random field and its vortex net-
works: recovery of the optical phase, Proceedings of the SPIE 4607, 2002, pp. 25–9.[4] FREUND I., SHVARTSMAN N., Wave-field phase singularities: the sign principle, Physical Review A
50(6), 1994, pp. 5164–72.[5] NYE J.F., HAJNAL J.V., HANNAY J.H., Phase saddles and dislocations in two-dimensional waves such
as the tides, Proceedings of the Royal Society of London, Series A 417(1852), 1988, pp. 7–20.[6] BARANOVA N.B., ZELDOVICH B.YA., Dislocations of wave front surfaces and amplitude zeros, Zhur-
nal Eksperimental’noi i Teoreticheskoi Fiziki 80(5), 1981, pp. 1789–97 (translation in: SovietPhysics JETP).
[7] HECKENBERG N.R., MCDUFF R., SMITH C.P., RUBINSZTEIN-DUNLOP H., WEGENER M.J., Laser beamswith phase singularities, Optical and Quantum Electronics 24(9), 1992, pp. S951–S962.
[8] WHITE A.G., SMITH C.P., HECKENBERG N.R., RUBINSZTEIN-DUNLOP H., MCDUFF R., WEISS C.O.,TAMM C., Interferometric measurements of phase singularities in the output of a visible laser, Jour-nal of Modern Optics 38(12), 1991, pp. 2531–541.
[9] BASISTY I.V., SOSKIN M.S., VASNETSOV M.V., Optical wavefront dislocations and their properties,Optics Communications 119(5–6), 1995, pp. 604–12.
[10] FREUND I., ‘1001’ correlations in random wave fields, Waves in Random Media 8(1), 1998, pp. 119–58.[11] FREUND I., SHVARTSMAN N., Vortices in random wave fields: nearest neighbor anticorrelations,
Physical Review Letters 72(7), 1994, pp. 1008–11.[12] MOKHUN I., Amplitude zeros and structure of statistical optical fields. Correlation between the
field’s intensity and phase, Proceedings of the SPIE 3573, 1998, pp. 567–71.[13] SHVARTSMAN N., FREUND I., Speckle spots ride phase saddles sidesaddle, Optics Communications
117(3–4), 1995, pp. 228–34.[14] BARANOVA N.B., ZELDOVICH B.YA., MAMAYEV A.V., PILIPETSKY N.F., SHKUNOV V.V., Dislocation
density on wavefront of a speckle-structure light field, Zhurnal Eksperimental’noi i TeoreticheskoiFiziki 83(5), 1982, pp. 1702–1710 (translation in: Soviet Physics JETP 83(5), 1982, pp. 983–88).
[15] GREIVENKAMP J.E., BRUNING J.H., Phase shifting interferometers, [in:] Optical Shop Testing, [Ed.]D. Malacara, 2nd ed., Wiley, New York 1992.
[16] BORN M., WOLF E., Principles of Optics, 6th ed. (corrected), Pergamon Press, Oxford 1987.
Received March 30, 2007in revised form August 28, 2007