
Detection of Pulsed X‐Ray Emission from XMM‐Newton Observations of PSR J0538+2817
24
arXiv:astro-ph/0303380v2 7 Apr 2003 Detection of Pulsed X-ray Emission from XMM-Newton Observations of PSR J0538+2817 K.E. McGowan 1 , J.A. Kennea 2 , S. Zane 3 , F.A. C´ordova 4 , M. Cropper 3 , C. Ho 1 , T. Sasseen 2 , W.T. Vestrand 1 [email protected] ABSTRACT We report on the XMM-Newton observations of the 143 ms pulsar PSR J0538+2817. We present evidence for the first detections of pulsed X- rays from the source at a frequency which is consistent with the predicted radio frequency. The pulse profile is broad and asymmetric, with a pulse fraction of 18 ± 3%. We find that the spectrum of the source is well-fit with a blackbody with T ∞ = (2.12 +0.04 −0.03 ) × 10 6 K and N H = 2.5×10 21 cm −2 . The radius deter- mined from the model fit of 1.68 ± 0.05 km suggests that the emission is from a heated polar cap. A fit to the spectrum with an atmospheric model reduces the inferred temperature and hence increases the radius of the emitting region, however the pulsar distance determined from the fit is then smaller than the dispersion distance. Subject headings: 1. INTRODUCTION Of the > 1000 radio pulsars detected so far, 51 have also been found in the X-rays (Becker & Aschenbach 2002). These X-ray emitting pulsars represent a wide range of ages (10 3 − 7 × 10 9 yrs), magnetic field strengths (10 8 − 10 13 G), periods (1.6 – 530 ms) and spectral properties. In particular, while non-thermal (power law) emission is supposed to dominate in the youngest objects (like the Crab), the soft X-ray radiation of rotation-powered 1 Los Alamos National Laboratory, MS D436, Los Alamos, NM 87545 2 University of California, Santa Barbara, CA 93106 3 Mullard Space Science Laboratory, University College of London, UK 4 University of California, Riverside, CA 92521
-
Upload
independent -
Category
Documents
-
view
0 -
download
0
Transcript of Detection of Pulsed X‐Ray Emission from XMM‐Newton Observations of PSR J0538+2817
arX
iv:a
stro
-ph/
0303
380v
2 7
Apr
200
3
Detection of Pulsed X-ray Emission from XMM-Newton
Observations of PSR J0538+2817
K.E. McGowan1, J.A. Kennea2, S. Zane3, F.A. Cordova4, M. Cropper3, C. Ho1,
T. Sasseen2, W.T. Vestrand1
ABSTRACT
We report on the XMM-Newton observations of the 143 ms pulsar
PSR J0538+2817. We present evidence for the first detections of pulsed X-
rays from the source at a frequency which is consistent with the predicted radio
frequency. The pulse profile is broad and asymmetric, with a pulse fraction of
18 ± 3%. We find that the spectrum of the source is well-fit with a blackbody
with T∞ = (2.12+0.04−0.03) × 106 K and NH = 2.5×1021 cm−2. The radius deter-
mined from the model fit of 1.68 ± 0.05 km suggests that the emission is from
a heated polar cap. A fit to the spectrum with an atmospheric model reduces
the inferred temperature and hence increases the radius of the emitting region,
however the pulsar distance determined from the fit is then smaller than the
dispersion distance.
Subject headings:
1. INTRODUCTION
Of the > 1000 radio pulsars detected so far, 51 have also been found in the X-rays
(Becker & Aschenbach 2002). These X-ray emitting pulsars represent a wide range of ages
(103 − 7 × 10⁹ yrs), magnetic field strengths (108 − 1013 G), periods (1.6 – 530 ms) and
spectral properties. In particular, while non-thermal (power law) emission is supposed to
dominate in the youngest objects (like the Crab), the soft X-ray radiation of rotation-powered
1Los Alamos National Laboratory, MS D436, Los Alamos, NM 87545
2University of California, Santa Barbara, CA 93106
3Mullard Space Science Laboratory, University College of London, UK
4University of California, Riverside, CA 92521

– 2 –
pulsars with ages as large as ≈ 105 − 106 yrs should be dominated by thermal emission from
the neutron star (NS) surface (see e.g. Becker & Pavlov 2002 for a recent review). These
“middle-aged pulsars” are old enough for their magnetospheric emission to have decreased
and become fainter than the thermal one. At the same time, they are young enough that
the NS surface is not too cool for its thermal radiation to still be detectable in the X-rays.
There are three middle-aged pulsars for which a thermal component, interpreted as
thermal emission from the surface, has certainly been observed: Geminga, PSR B0656+14
and B1055-52 (dubbed the three Musketeers by Becker & Trumper 1997). Due to its age, a
dominant thermal component was also expected from PSR J0538+2817.
PSR J0538+2817 is a 143 ms pulsar located in the direction of the Galactic anti-center
(Anderson et al. 1994). The source was detected during an untargeted pulsar survey at
430 MHz using the 305 m Arecibo radio telescope (Foster et al. 1995). PSR J0538+2817 is
located at a distance of 1.2 kpc (using the model of Cordes & Lazio 2002), with a spin down
age of 6× 10⁵ yrs. The source is believed to be associated with the supernova remnant S147
(Anderson et al. 1996) as the distance to the pulsar and the remnant are consistent, as are
their ages. Sun et al. (1996) detected X-ray emission from PSR J0538+2817 using data from
the ROSAT All Sky Survey (RASS). However, the photon statistics from the RASS were not
good enough to perform timing or spectral studies. Marginal evidence was found for pulsed
gamma-ray emission at the radio period from photon arrival time analysis of EGRET data
(Sun et al. 1996).
PSR J0538+2817 is a factor 5–10 more distant than Geminga, and only the large collec-
tive area of XMM-Newton has now made it possible to obtain good spectral information. In
this paper we report on XMM-Newton observations of PSR J0538+2817 and present timing
and spectral analyses of the source.
2. OBSERVATIONS
PSR J0538+2817 was observed with XMM-Newton for ∼18 ks on 2002 March 8 as a part
of the Guaranteed Time Program. The following analysis uses data from the three European
Photon Imaging Camera (EPIC) instruments: two EPIC MOS detectors (Turner et al. 2001)
and the EPIC PN detector (Struder et al. 2001). The thin optical blocking filter was used
on the PN. To provide a temporal resolution of 6 ms, which is needed for timing studies of
millisecond pulsars, the PN was operated in small window mode. The MOS1 was operated
in full window (imaging) mode with a time resolution of 1.4 s. In order to obtain better
temporal resolution the MOS2 was operated in timing mode; in this mode data from the
– 3 –
central CCD are collapsed into a one-dimensional row to achieve a 1.5 ms time resolution.
The medium filter was used for both MOS observations.
Observations of PSR J0538+2817 were taken with the Resolution Grating Spectrometer
(RGS), however we did not detect enough photons for a meaningful analysis. We also do not
detect the pulsar in the images taken with the OM. We are unable to determine a realistic
upper limit for the optical detection of PSR J0538+2817 as the position of the pulsar is
coincident with the stray light effect in the OM image.
We reduced the EPIC data with the XMM-Newton Science Analysis System (SAS
v5.3.0). To maximize the signal-to-noise we filtered the data to include only single, dou-
ble, triple and quadruple photon events for MOS, and only single and double photon events
for PN. We find no evidence for any extended emission in a spatial analysis of the MOS
and PN data, indicating that PSR J0538+2817 is consistent with being a point source from
XMM-Newton observations.
We extracted data for the source within a radius of 30′′ for the PN and MOS1 instru-
ments. While this radius encircles 100% of the flux for PSR J0538+2817 in the MOS1, only
89% of the flux is encompassed for the PN. However, due to the position of the source on
the PN detector we are restricted in our choice of radii. Hence, the flux measured from the
PN is corrected for in the following analyses. Selection of the photons from the MOS2 event
file was achieved by extracting 100% of the flux within a rectangular region centered on the
source.
In our temporal analysis we consider data within the 0.2–15 keV energy range for the
EPIC MOS2 and PN instruments. The timing studies were performed on barycentrically
corrected MOS2 and PN event files.
We used MOS1 and PN data to produce spectra of PSR J0538+2817. We subtracted
a background which was extracted from an annulus around the source fiducial region. We
also created the corresponding photon redistribution matrix (RMF) and ancillary region file
(ARF).
3. TIMING ANALYSIS
We determine a predicted pulse period for PSR J0538+2817 from the radio mea-
surements (Anderson et al. 1996) at the epoch of our XMM-Newton observations (MJD
2452341.5), assuming a linear spin-down rate. It is possible however that glitches could
alter the period from the predicted value. Therefore we searched for a pulsed signal in the

– 4 –
PN (∼6500 photons) and MOS2 (∼3300 photons) data over a wider frequency range centered
on the derived radio period, P = 143.158657 ms (f = 6.9852569 Hz).
We have employed two methods in our search for pulsed emission from PSR J0538+2817.
In the first method we implement the Z2n test (Buccheri et al. 1983). In the second method
we calculate the Rayleigh Statistic (see de Jager 1991; Mardia 1972) and then calculate the
Maximum Likelihood Periodogram (MLP) using the ∆C-statistic (Cash 1979) to determine
significant periodicities in the datasets (see Zane et al. 2002). The advantage of this method
is that the ∆C-statistic makes no assumptions about the distribution of the data, and is
itself distributed as χ2 which allows one to determine errors for the periods detected directly
from the periodogram.
We searched the PN data (0.2–15 keV) for a periodic signal using the Z2n test, with the
number of harmonics n being varied from 1 to 10. We find that in order to optimize the signal-
to-noise (S/N) ratio we must use the value n = 1. The resulting Z21 periodogram is shown
in Fig. 1 (top, left panel). We find a peak at f = 6.9852548+0.0000104−0.0000124 Hz, which, within the
quoted 90% uncertainty range, is consistent with the predicted radio frequency given above,
f = 6.9852569 Hz. The Z21 -statistic for this peak is 65.67, which has a probability of chance
occurrence of 5.5 × 10⁻¹⁵. Frequencies of this order are detected at the values expected,
given radio measurements, in similar objects (J.A. Kennea 2003, private communication).
The corresponding Z21 periodogram for the MOS2 data (0.2–15 keV) is shown in Fig. 1
(top, right panel). We note that the noise level is much greater in the MOS2 periodogram
compared to that for the PN data. The largest peak near to the predicted radio frequency,
and the second largest peak in the periodogram, is at f = 6.9852939+0.0000117−0.0000148 Hz. This
value, within the 90% confidence limit quoted, is not consistent with the frequency found
in the PN data, or the derived radio frequency. If we consider the 68% uncertainty range,
f = 6.9852939+0.0000243−0.0000262 Hz, the frequency is still not consistent with the predicted and PN
frequencies. The probability of chance occurrence for this peak is 1.5 × 10⁻³. The largest
peak in the MOS2 periodogram occurs at f = 6.9939901+0.0000103−0.0000133 Hz. However, it is difficult
to reconcile this value with the predicted radio frequency. Both peaks have a low significance
when compared with the noise level.
Assuming that the pulsed signal we have detected in the PN data is real we have
investigated the energy range over which we can detect a periodic signal for the PN data.
We separated the PN data into 4 energy bands, 0.2–1, 1–2, 2–3 and 3–10 keV, and generated
Z21 periodograms for each dataset. Our results show that we can detect a pulsed signal
in the 0.2–1 and 1–2 keV ranges, but at energies greater than 2 keV we do not find a
dominant peak in the periodograms near to the predicted radio frequency. We find a peak
at f = 6.9852548+0.0000095−0.0000139 Hz for the 0.2–1 keV data (Fig. 1, bottom, left panel), and

– 5 –
at f = 6.9852499+0.0000127−0.0000126 Hz for the 1–2 keV data (Fig. 1, bottom, right panel). Both
of these frequencies are consistent with the frequency found previously for the PN data
(0.2–15 keV), and the derived radio frequency, within the 90% uncertainty range quoted.
The probability of chance occurrence for the 0.2–1 and 1–2 keV peaks are 2.2 × 10⁻⁹ and
3.0 × 10⁻⁸, respectively. The frequencies being consistent within different energy ranges
is expected. The lower amplitude and significance of detection of pulsed emission in the
separate energy ranges is simply due to the fact that fewer events are detected.
We also searched for a periodic signal using the MLP method. Initially we constructed
the MLPs using the PN and MOS2 data in the 0.2–15 keV energy range to compare with
our Z21 results. We find a peak for the PN data at f = 6.9852540+0.0000049
−0.0000039 Hz, which is
detected at the 8-sigma level (Fig. 2, left panel). The frequency of the peak is consistent,
within the 90% confidence limit, with the Z21 value for the PN data, and with the predicted
radio frequency.
The largest peak in the MOS2 MLP occurs at f = 6.9852931+0.0000112−0.0000185 Hz (Fig. 2, right
panel). While this is not consistent with the PN and predicted radio frequencies, it is in
agreement with the values found from the Z21 test for the MOS2 data. While the peak could
represent a true periodicity, its significance above the noise is low.
We used the MLP method on the PN data which had been separated into different
energy ranges, given above. The results are in excellent agreement with the Z21 test, again
with the significance and amplitude of the detection decreasing with number of events.
While our results indicate that we have detected pulsed emission from PSR J0538+2817
in the PN data, the absence of a periodic signal at a similar frequency, within the 90%
confidence limit, in the MOS2 data is worrying. However, we note that the MOS2 receives
∼ 40% of the flux that is received by the PN, and that the quantum efficiency of the MOS
instruments is poorer than that for the PN, especially in the softer energies where we are
detecting the pulsed signal. Despite these factors, the most important consideration for this
analysis is the S/N ratio for the PN and MOS2 data. Our PN data has S/N ∼ 6, while for
the MOS2 we have S/N ∼ 2.5. This suggests that the lack of signal in the MOS2 data is
hampering the period search; our results for the MOS2 temporal analysis being consistent
with noise is perhaps not surprising.
The frequency found from the Z21 test for the PN data in the 0.2–15 and the 0.2–1 keV
band, f = 6.9852548 Hz, deviates from the derived radio frequency by 0.0000021 Hz, or
0.000043 ms. We have folded the PN light curves in the 0.2–15, 0.2–1, 1–2 and 2–10 keV
bands using our detected frequency, and the radio ephemeris (MJD 2449564.5).
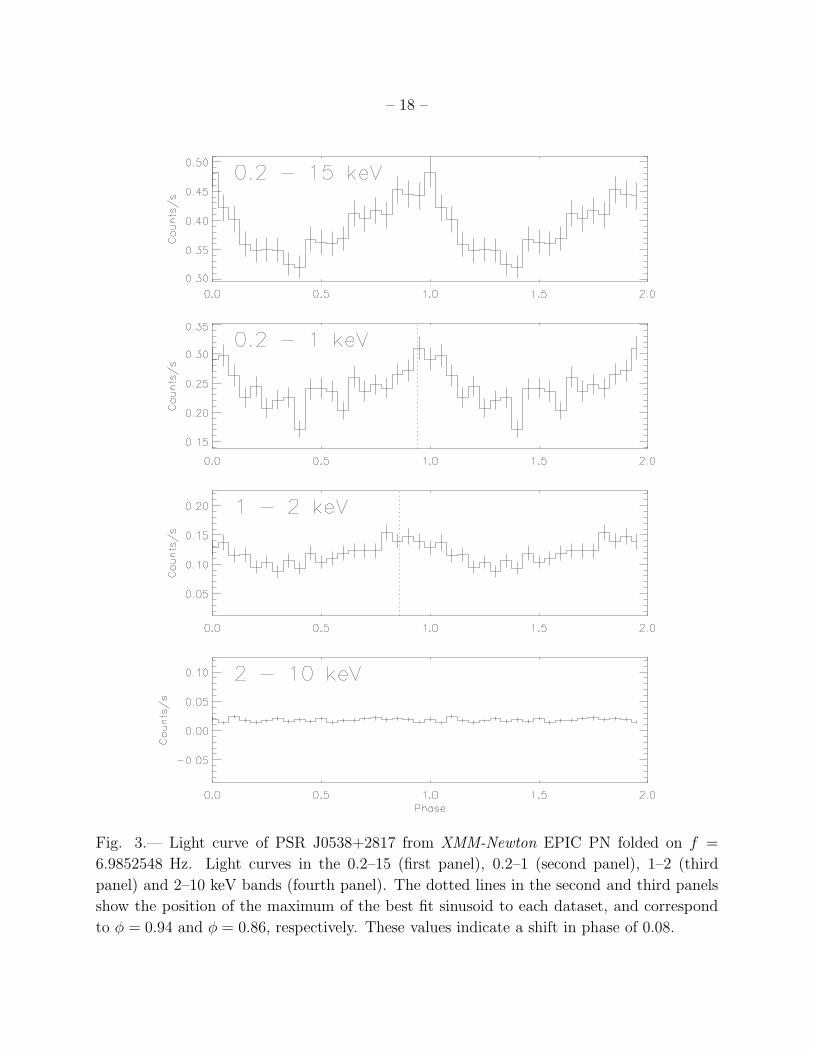
The 0.2–15 keV light curve (Fig. 3, top panel) has a pulse fraction of 18±3%. The pulse

– 6 –
profile is clearly asymmetric with a slower rise to and faster fall from maximum. Indicative
of this asymmetry, a sinusoidal fit to the light curve can be excluded with χ2ν = 4.0. The
arrival time of the radio pulse is consistent with the maximum of the X-ray peak. The light
curves in the 0.2–1 and 1–2 keV bands (Fig. 3, second and third panels) have pulse fractions
of 30 ± 3% and 27 ± 3%, respectively.
In order to investigate the asymmetry in the 0.2–15 keV light curve we determined
whether or not there is a phase shift between the 0.2–1 and 1–2 keV light curves. Although
the PN light curve in the 0.2–15 keV energy range was not well described by a sinusoid, as
a first estimate to the maxima of the 0.2–1 and 1–2 keV light curves we have employed the
method of fitting with a sinusoid, as these two light curves are more symmetrical. While the
fit for the 1–2 keV light curve is improved by a factor of ∼ two the fit is still not optimal, and
the value of χ2ν = 3.6 for the 0.2–1 keV light curve still indicates an asymmetry. However,
for estimation purposes we have marked the position of the maxima of the cosine curves for
each band in Fig. 3. The maximum in the 0.2–1 keV band occurs at φ = 0.94 ± 0.05, and
at φ = 0.86 ± 0.05 in the 1–2 keV band. While this indicates that the maxima in the two
bands are shifted by 0.08 in phase, corresponding to a pulse shift of 29◦, the uncertainty on
the peak positions does not rule out the null hypothesis that there is zero phase shift. We
note that this shift in phase is small compared to the pulse width. If the shift is real, this
could be the origin of the asymmetry in the 0.2–15 keV light curve.
In an attempt to improve the sparse information we have from the sinusoidal fit to the
PN light curve in the 0.2–15 keV band, we have also modeled the brightness variation with
a symmetrical polar cap model (Cropper et al. 2001), which includes gravitational bending
effects. The input parameters for the model are the angular size of the caps, the angle
between the magnetic and rotation axis and that between the viewing direction and the
rotation axis. The best fit to the data occurs for 20◦, 11◦ and 31◦ for the three angles
respectively, with a χ2ν of 1.71. The compactness parameter M/2R was set to a typical value
of 3. The χ2ν for the polar cap model is significantly better than for the sinusoidal fit with the
same number of free parameters, but falls short of that required because of the symmetry of
the model prediction.
The absence of any sharp features in the light curve, and the absence of any asymmetry
in our model results in degeneracies between the fit parameters and render the formal uncer-
tainties on their values to be large. By exploring the parameter space, we find that a range
of viewing directions between 10 and 60◦ is permitted, with the angle between magnetic and
rotation axis constrained to between 20 and 35◦ over this range. The change in viewing
direction is in fact accommodated by a change in cap size to produce the observed pulsation,
with the semi-angle subtended increasing from a negligible size to 30◦ as the viewing angle

– 7 –
increases from 10 to 60◦. This analysis is therefore limited given the systematic differences
between the model and the data. Nevertheless, the general point that we note is that the
method allows us to determine an upper limit for the emitting region. The pole cap size has
to be constrained to a full angle of ∼65◦, otherwise the observed pulsation amplitude cannot
be reproduced.
Another factor which could be responsible for the asymmetry is aberration (Cordes 1978).
This effect has been seen in radio observations of pulsars (Gangadhara & Gupta 2001) and is
due to corotation which causes the radiation beams to bend toward the azimuthal direction
(the direction of rotation of the pulsar) so that emission is received earlier than if there were
no rotation. The components emitted at higher altitudes in the light cone are shifted to an
earlier phase due to this aberration, resulting in an asymmetry in the location of the leading
and trailing components with respect to the center of the pulse profile. For the same cone,
the lower frequency radiation comes from a higher altitude, and hence is observed first, than
the higher frequency radiation. The effects of aberration increase with altitude. If we assume
that the emission we observe from PSR J0538+2817 originates from close to the surface of
the neutron star i.e. a heated polar cap, and not at a height which is near to that of the
light cylinder, the effects of aberration should be negligible.
4. SPECTROSCOPY
Data from MOS1 and PN were used to create spectra of PSR J0538+2817. In order to
preserve any features in the spectra while providing sufficient signal-to-noise, the spectra were
re-binned to ensure a minimum of 15 counts in each energy bin. We fit the combined MOS1
and PN spectra with the X-ray spectral analysis package XSPEC (v11.1.0) using various
models, each with interstellar absorption (NH) accounted for by XSPEC’s photoelectric
absorption model. The spectra were fit between 0.2–3 keV.
We used three different methods to determine the value of NH to be used in the model
fits: (1) NH was allowed to run free, (2) NH was fixed at the estimated fraction of galactic
absorption in the direction and at the distance of the pulsar with a value of 1.3×1021 cm−2
∗, (3) NH was fixed at the value of 2.5×1021 cm−2 as measured from a star near to the pulsar
in position and distance.
∗This was achieved by determining the galactic absorption in the direction of the pulsar
(Dickey & Lockman 1990), and calculating the fraction of this column depth at the distance of the pul-
sar.
– 8 –
PSR J0538+2817 is classed as a “middle-aged” pulsar and is thought to perhaps have
similar spectral properties to the three Musketeers (Becker & Trumper 1997; Becker & Pavlov 2002).
The spectra of PSR B0656+14 (Becker & Pavlov 2002) and B1055-52 (Pavlov et al. 2002)
are similar and can be well-fit with a model which comprises of two blackbodies and a power
law (PL), known as the TS+TH+PL model. The current interpretation is that the PL
component is due to some non-thermal magnetospheric emission, while the two blackbodies
represent a soft thermal component (TS) emerging from most of the NS surface and a hard
thermal component (TH) which originates from heated polar caps. Geminga is not bright
enough to allow one to discriminate between the different components of the temperature
distribution at the surface: its thermal spectrum is well-fit by a single blackbody plus power
law.
In order to study the spectra of PSR J0538+2817, and to investigate the pulsar’s sim-
ilarity to the three Musketeers we fit the PN and MOS1 spectra with a variety of models.
These were as follows, a single blackbody, a single power law, a blackbody plus power law,
a two blackbody, and the TS+TH+PL model.
We find that the multi-temperature models yield the same value for the temperature for
both components indicating that only one blackbody is required. The large uncertainties on
the power law index for the single power law, blackbody plus power law and TS+TH+PL
fit indicate that the PL component is not required.
Our results indicate that the spectra can be well-fit with a single blackbody (Fig. 4, top
panel). Table 1 shows the results for the fits with different NH values as described above.
Comparing the χ2ν values for the three fits, and the values of NH , suggests that the estimate
of the fraction of galactic absorption in the direction of PSR J0538+2817 is too low (fit (2)).
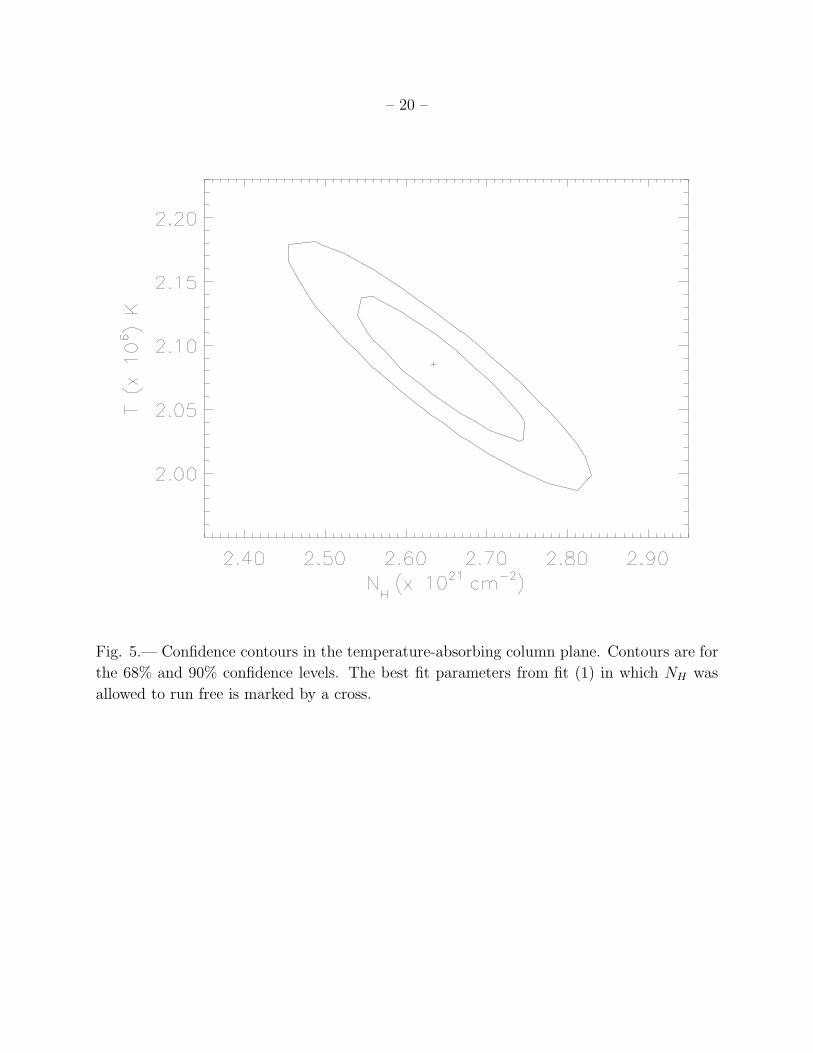
From our model fit we find NH = (2.63+0.02−0.02)×1021 cm−2 and T∞ = (2.09+0.06
−0.07) × 106 K
for fit (1) in which NH is allowed to run free. The fit results in χ2ν = 1.08 for 320 d.o.f. For fit
(3) in which NH is fixed at the measured value for a star at a similar distance and position
as the pulsar of NH = 2.51×1021 cm−2 gives T∞ = (2.12+0.04−0.03) × 106 K, with χ2
ν = 1.08 for
321 d.o.f. Employing the F-test we find a probability of 0.4 which indicates that freeing NH
is not warranted. In Fig. 5 we show the error ellipses in the temperature-absorbing column
plane which confirm this result.
We find unabsorbed luminosities of 4.0×1032 ergs s−1 and 2.7×1032 ergs s−1 from XSPEC
in the ROSAT 0.1–2.4 and 0.5–10 keV bands, and a blackbody luminosity of 4.6×1032 ergs s−1
for fit (3). The emitting radius resulting from the single blackbody fit is R∞ = 1.68±0.05 km.
This indicates that the emission originates from a region which is smaller than the surface
of the NS.

– 9 –
However, the radiation radius is representative of the stellar radius only when the
spectral properties of the emergent radiation are consistently accounted for. To inves-
tigate whether one can increase the emitting radius so that it represents the whole of
the neutron star we have fit the data with a pure-H, non-magnetized atmospheric model
(Pavlov et al. 1992; Zavlin et al. 1996) which is publicly available. We note that the ob-
served modulation in the light curve argues against the emission being generated by the full
surface of the NS as implied by an atmospheric model, however the size of the emitting region
determined from the model is dependent on the value of the normalization constant and can
therefore represent a smaller region. Typically, these models are found to require lower color
temperatures and larger radii with respect to a simple blackbody. The results of the fits are
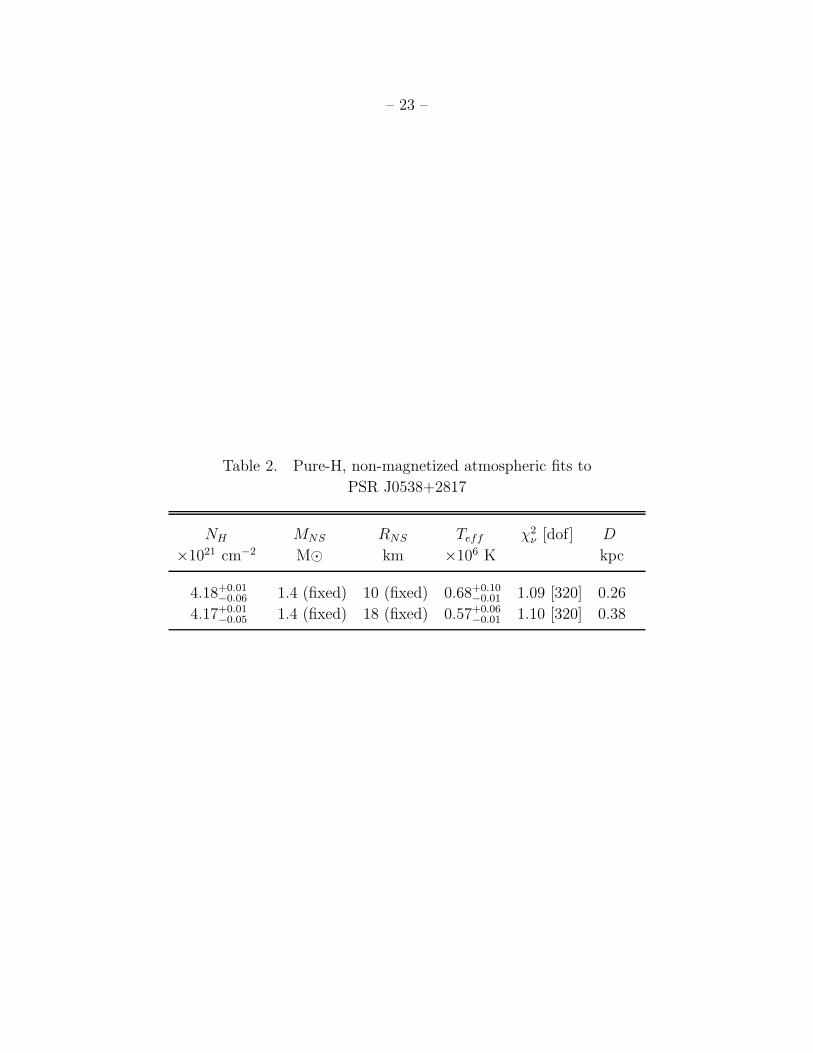
given in Table 2. In the fits we let NH run free, but we fix the mass, MNS , and radius, RNS,
of the NS. For MNS = 1.4 M⊙ and RNS = 10 km we find NH = (4.18+0.01−0.06)×1021 cm−2 and
Teff = (0.68+0.10−0.01)×106 K, with χ2
ν = 1.09 for 320 d.o.f (Fig. 4, bottom panel). For MNS =
1.4 M⊙ and RNS = 18 km we find NH = (4.17+0.01−0.05)×1021 cm−2 and Teff = (0.57+0.06
−0.01)×106
K, with χ2ν = 1.10 for 320 d.o.f.
The atmospheric model gives lower temperatures than the blackbody model which are
more in agreement with the predicted values from standard cooling curves (see e.g. Tsuruta
1998; Page 1998; Slane, Helfand & Murray 2002; see also Section 5). The standard cooling
model is based on neutrino emission via the modified URCA process, n-n and p-p neutrino
bremsstrahlung, crust neutrino bremsstrahlung, and plasmon neutrino processes. Assump-
tions about the form of the nucleon-nucleon force and the many-body technique used to
calculate the equation of state must be made in the cooling models. The standard curve
considered here (see Fig. 6, solid line) uses an equation of state of moderate stiffness. How-
ever, the distance to the pulsar derived from the atmospheric model fits are too low. We
find that the fit with RNS = 10 km gives a pulsar distance of 0.26 kpc, and 0.38 kpc with
RNS = 18 km (see Section 1). While this suggests that the atmospheric model can be ruled
out, we note that the model we have used is non-magnetized, and with B ∼ 7 × 10¹¹ G
for PSR J0538+2817 the applicability of this model is questionable. Further studies with a
magnetic model must be performed to address this.
We note that our spectral fits have been obtained from data which are averaged over
the spin pulse. However, the pulsation can in principle be caused by a local variation in the
emission properties of the NS surface, or by some absorption in a frame rotating with the
NS. These effects may have implications for any spectral fitting to a mean spectrum.

– 10 –
5. DISCUSSION
5.1. Results from the Spectral Analysis
We have analyzed spectra of PSR J0538+2817 from the MOS1 and PN instruments on
XMM-Newton. We find that the spectra are well described by a single blackbody with T∞ =
2.12× 10⁶ K and NH = 2.5×1021 cm−2. The temperature inferred from the model fit results
in an emitting radius of R∞ = 1.68 km. It is difficult to reconcile this radius with that of
the whole neutron star. The higher temperature implied by the blackbody fit could indicate
that there is a heating mechanism occurring at the poles i.e. magnetospheric processes,
inverse Compton scattered photons above the polar cap producing electron-positron pairs
resulting in surface heating by the returning positrons (see Greiveldinger et al. 1996; Harding
& Muslimov 2002).
An inferred temperature from a blackbody fit which results in a radius which is smaller
than the surface of the neutron star has been noticed in several other sources (Becker & Pavlov 2002).
In general, fits with un-magnetized, pure-H atmospheric cooling models give a temperature
lower by a factor 1.5–3, but often they also give radii that are too large (or, equivalently, dis-
tances which are too small). Therefore, caution must be taken in whether they are directly
applicable. The same is true in the assumption that the thermal emission is due to accretion
from the interstellar gas, since pure-H cooling and accretion spectra are almost indistinguish-
able in the X-rays (Treves et al. 2002). If the atmosphere is dominated by heavy-elements,
the fit values from the model spectra are close to those from a blackbody, but in this case
one also expects absorption lines and edges (Becker & Pavlov 2002).
In the case of PSR J0538+2817, we have found that a pure-H, un-magnetized atmo-
spheric model also provides an excellent fit to the spectral data. The resulting temperature
is a factor ∼ 3 lower than that derived from the blackbody fit. The value is therefore high,
but certainly in better agreement with that predicted by the cooling models (see Fig. 6).
However, these fits imply either very small distances to the pulsar (∼ 200 − 400 pc) or un-
acceptably large NS radii, so the applicability of these spectral models to PSR J0538+2817
is questionable. A similar conclusion has been reached by Pavlov et al. (2002) in the case of
PSR 0656+14, based on Chandra data. We note that in the case of PSR J0538+2817 fitting
with a magnetized must be performed to be able to rule out conclusively an atmospheric
model.
PSR J0538+2817 has often been claimed to be potentially similar to other middle-aged
sources, PSR B0656+14, B1055-52 and Geminga (the three Musketeers, see Table 3). As
noted in Section 4 the power law component is detected in the spectra of the three Musketeers.
Results from ROSAT indicate that all of the three objects exhibit a pulse shift of ∼ 100◦ at

– 11 –
E ∼ 0.4 − 0.6 keV, and an increase in the pulse fraction (confirming the different nature of
the thermal and non-thermal emission). However, recent results for B1055-52 deduced from
XMM-Newton observations indicate that the pulse phase energy dependence is not as strong
as suggested by ROSAT. The surface temperatures of the three Musketeers (as taken by the
blackbody fit) are in the range (0.3–1.2)×106 K which is typically too high to be reconciled
with that predicted by standard cooling curves (Becker & Pavlov 2002). We note that the
temperature determined for PSR J0538+2817 from the blackbody fit is even higher. The
inferred radii for the three Musketeers are compatible with the equation of state of a neutron
star, or smaller. However, as discussed above this issue is extremely delicate since the values
of peak temperature, star radius (and distance) are strongly dependent on the assumption
about the spectral model.
In the light of this situation, PSR J0538+2817 is an extremely interesting object. Its
spectrum only shows a thermal component: the non-magnetospheric power law has not been
detected by XMM-Newton. This result must be confirmed by further deep pointings: for
instance, we note that in the case of B1055-52 the ROSAT spectrum was well-fit by either two
blackbodies (Greiveldinger et al. 1996) or a flatter power law (Wang et al. 1998). Only very
recently have Chandra observations of B1055-52 (Pavlov et al. 2002) revealed the spectral
energy distribution in detail; the Chandra spectrum is well-fit by the TS+TH+PL model.
We note that B1055-52 is at a distance of ∼ 0.7 kpc and faint, PSR J0538+2817 is also faint
and at a larger distance, hence both sources are difficult to observe.
On the other hand, if confirmed, the absence, or very low level, of a hard tail in the
spectrum of PSR J0538+2817 is peculiar. While PSR J0538+2817 and B1055-52 have simi-
lar ages, PSR J0538+2817 may represent a transition object between those discussed above
(PSR B0656+14, B1055-52 and Geminga) and older (> 106 yrs) sources (e.g. B0950+08,
B1929+10, J0437-4715), based on its spectral properties. The latter have a NS surface
(excluding the cap) which is much cooler and therefore not detectable in the X-ray range.
However, the polar caps may be heated by accretion or bombardment of particles thus pro-
ducing the observed X-rays. In this case, the soft X-ray spectrum may be dominated by the
TH component discussed above. This interpretation may also help to reconcile the temper-
ature inferred from the spectral fit of PSR J0538+2817 which is higher than the predicted
surface temperature of a NS at the age of PSR J0538+2817 (and makes the comparison with
the cooling curves unfounded).
If the temperature from our blackbody fit to the spectrum of PSR J0538+2817 is taken
as the TH component, we find an upper limit, from the 90% uncertainty level, of 0.56×10⁶
K for the surface temperature (TS) of the neutron star. We find that the 2σ upper limit for
the unabsorbed flux in the 3.0–10.0 keV band for a power law with a photon index of 2.0 is

– 12 –
5.9×10⁻¹⁴ erg cm−2 s−1.
5.2. The Pulse Profile
The XMM-Newton observation of PSR J0538+2817 provides the first evidence for pulsed
X-ray emission at a period which is consistent, within errors, to the predicted radio pulse
period. The pulse profile is broad and slightly asymmetric, with a slower rise and more rapid
decline.
Pulsed X-rays from PSR J0538+2817 could be produced via one of two mechanisms.
The first is due to relativistic particles produced either in regions above the polar caps of the
neutron star or in outer gaps. These particles are accelerated by the magnetic field which is
aligned with the electric field and/or the drop in potential generated by the Deutsch wave.
Non-thermal X-ray emission results from the effects of curvature, synchrotron and inverse
Compton radiation on the accelerated particles. The other mechanism is thermal emission
which may be produced at the stellar surface due to the initial cooling of the neutron star,
or reheating of the polar caps by the bombardment of back-flowing particles and internal
friction.
The particular X-ray emission mechanism can sometimes be determined from the pulse
shape. High amplitude, sharp, narrow pulses can only be produced by a highly beamed, and
therefore relativistic population of electrons, while low amplitude, quasi-sinusoidal pulses
can be produced by either method. Since the latter characteristics are those seen in the
PN light curve of PSR J0538+2817, in principle we cannot discriminate between the two
mechanisms. However, the absence of a power law tail in the spectrum, argues toward a
thermal origin.
The observed pulsation may also be due to absorption in the rotating magnetosphere,
instead of being an intrinsic characteristic of the pulsar emission (see Cropper et al. 2002
for a discussion of a similar effect in the case of RX J0720–3125). However, the thermal
emission of PSR J0538+2817 is hotter than that of RX J0720–3125, and this implies a
higher ionization parameter (by a factor of ∼ 20). Moreover PSR J0538+2817 has a faster
rotation period (by a factor of > 50) which limits the maximum extent of the light cylinder
and therefore the volume of absorbing material. The high densities of largely neutral material
required, together with the rather weak magnetic field in this system to confine it, argue
against absorption as the origin of the pulsations.
The simplest explanation for the flux variation is therefore that it is due to hot, rotating
polar caps. The asymmetry in the pulse shape in Fig. 3 (top panel) cannot be produced by
– 13 –
any symmetrical structure on the NS, nor by any beaming effects, as long as these operate
symmetrically with respect to the magnetic or rotation axis. On the other hand, if the
emission originates in a hot spot (or cap), the observed asymmetry can be qualitatively
understood by requiring that the trailing edge of the cap is hotter and brighter than the
leading edge. The DC component of the pulse profile implies that there is never a time when
the emission is “off” (see Fig. 3). If the polar cap model is correct this suggests that part of
the cap is always visible.
6. CONCLUSIONS
We find that the spectra of PSR J0538+2817 can be well-fit with a blackbody. The value
for the emitting radius indicates that the emission is from a region which is smaller than
the surface of the NS, i.e. a hot spot. We investigated whether a pure-H atmospheric model
would provide model temperatures to be in line with that expected from the cooling curve.
We find that the model fits the spectra well, but the distance to the pulsar determined from
the fit is too small, unless we use unrealistically large radii for the NS. We do not find any
evidence for a non-thermal component in the spectra of PSR J0538+2817. However, we note
that the power law component was detected in B10522-52 only after deeper observations.
This may also be true for PSR J0538+2817.
We have detected for the first time pulsed X-ray emission from PSR J0538+2817, the
period of which is consistent, within errors, with the predicted radio period. Whether the
mechanism for X-ray emission is via non-thermal magnetospheric synchrotron or thermal
emission from the hot surface is not clear, as the broad asymmetric pulse shape found
for PSR J0538+2817 does not favor either model. However, the absence of a power law
component may indicate that the emission is thermal in origin.
We find an asymmetric pulse profile which may be due to hot, rotating polar caps, with
a temperature structure which is hotter at the trailing edge. If the polar cap model is correct,
the small radius we determine for the emission region is expected.
7. ACKNOWLEDGMENTS
This work is based on observations obtained with XMM-Newton, an ESA science mission
with instruments and contributions directly funded by ESA Member States and NASA. The
authors acknowledge support from the Institute of Geophysics and Planetary Physics (IGPP)
program at LANL and NASA grants S-13776-G and NAG5-7714. K. McGowan acknowledges

– 14 –
S. Trudolyubov, and S. Zane acknowledges R. Turolla, for helpful discussions.
REFERENCES
Anderson, S.B., Cadwell, B.J., Wolszczan, A., Foster, R.S., 1994, IAUC 6012
Anderson, S.B., Cadwell, B.J., Jocoby, B.A., Wolszczan, A., Foster, R.S., Kramer, M., 1996,
ApJ, 468, 1
Becker, W., Aschenbach, B., 2002, in Proceedings of the 270 WE-Heraues Seminar on “Neu-
tron Stars, Pulsars and Supernovae Remnants”, eds. Becker, W., Lesch, H., and
Trumper, J., MPE Reports 278, 64
Becker, W., Pavlov, G.G., 2002, astro-ph/0208356
Becker, W., Trumper, J., 1997, A&A, 326, 682
Buccheri, R., et al. 1983, A&A, 128, 245
Cash, W., 1979, ApJ, 228, 939
Cordes, J.M., 1978, ApJ, 222, 1006
Cordes, J.M., Lazio, T.J.W., 2002, astro-ph/0207156
Cropper, M., Zane, S., Ramsay, G., Haberl, F., Motch, C., 2001, A&A, 365, 302
de Jager, O.C., 1991, ApJ, 378, 286
Dickey, J.M., Lockman, F.J., 1990, ARA&A, 28, 215
Foster, R.S., Cadwell, B.J., Wolszczan, A., Anderson, S.B., 1995, ApJ, 454, 826
Gangadhara, R.T., Gupta, Y., 2001, ApJ, 555, 31
Greiveldinger, C., et al. 1996, ApJ, 465, L35
Harding, A.K., Muslimov, A.G., 2002, ApJ, 568, 862
Mardia, K.V., 1972, Statistics of Directional Data (London:Academic)
Page, D., 1998, in The Many Faces of Neutron Stars, ed. R. Buccheri, J. van Paradijs, &
M.A. Alpar (Dordrecht: Kluwer), 539

– 15 –
Pavlov, G. G., Shibanov, Yu. A., Zavlin, V.E., 1992, MNRAS, 253, 193
Pavlov, G. G., Zavlin, V.E., Sanwal, D., 2002, in Proceedings of the 270 WE-Heraues Seminar
on “Neutron Stars, Pulsars and Supernovae Remnants”, eds. Becker, W., Lesch, H.,
and Trumper, J., MPE Reports 278, 273
Slane, P.O., Helfand, D.J., Murray, S.S., 2002, ApJ, 571, 45
Struder, L., et al., 2001, A&A, 365, 18
Sun, X., et al., 1996, MPE Rep. 263
Taylor, J.H., Cordes, J.M., 1993, ApJ, 411, 674
Treves, A., Turolla, R., Zane, S., Colpi, M., 2002, PASP, 112, 297
Tsuruta, S., 1998, PhR, 292, 1
Turner, M., et al., 2001, A&A, 365, 27
Wang, F. et al. 1998, ApJ, 498, 373
Zane, S., Haberl, F., Cropper, M., Zavlin, V.E., Lumb, D., Sembay, S., Motch, C., 2002,
MNRAS, 344, 345
Zavlin, V. E., Pavlov, G. G., & Shibanov, Yu. A. 1996, A&A, 315, 141
This preprint was prepared with the AAS LATEX macros v5.0.

– 16 –
Fig. 1.— Z21 periodograms for PSR J0538+2817. Top, left panel, PN data in the 0.2–15
keV energy range, top, right panel, MOS2 data in the 0.2–15 keV energy range. Bottom,
left panel, PN data in the 0.2–1 keV energy range, bottom, right panel, PN data in the 1–2
keV energy range.

– 17 –
6.9840 6.9850 6.9860 6.9870 6.9880Frequency (Hz)
0
20
40
60
χ2 (1
degr
ee o
f fr
eedo
m)
PN
6.9840 6.9850 6.9860 6.9870 6.9880Frequency (Hz)
0
2
4
6
8
10
12
14
χ2 (1
degr
ee o
f fr
eedo
m)
MOS2
Fig. 2.— Maximum likelihood periodograms (MLP) for the PN data (left) and MOS2 data
(right). The peak in the MLP for the PN data is at 6.9852540 Hz. In the MLP for the
MOS2 data the peak nearest to the predicted frequency occurs at 6.9852931 Hz. The 68%
and 90% confidence levels for the periods are at χ2 = 1.0 and 2.71 (dotted lines).
– 18 –
Fig. 3.— Light curve of PSR J0538+2817 from XMM-Newton EPIC PN folded on f =
6.9852548 Hz. Light curves in the 0.2–15 (first panel), 0.2–1 (second panel), 1–2 (third
panel) and 2–10 keV bands (fourth panel). The dotted lines in the second and third panels
show the position of the maximum of the best fit sinusoid to each dataset, and correspond
to φ = 0.94 and φ = 0.86, respectively. These values indicate a shift in phase of 0.08.

– 19 –
Fig. 4.— PN and MOS1 spectra of PSR J0538+2817. Top panel, solid line is a blackbody
model with kT = 0.183 keV and NH = 2.51×1021 cm−2, the χ2ν for the fit is 1.08 for 321
d.o.f. Bottom panel, solid line is a pure-H, non-magnetized atmospheric model with MNS =
1.4 M⊙ and RNS = 10 km, NH = (4.18+0.01−0.06)×1021 cm−2 and Teff = (0.68+0.10
−0.01)×106 K, the
χ2ν for the fit is 1.09 for 320 d.o.f.
– 20 –
Fig. 5.— Confidence contours in the temperature-absorbing column plane. Contours are for
the 68% and 90% confidence levels. The best fit parameters from fit (1) in which NH was
allowed to run free is marked by a cross.

– 21 –
Fig. 6.— Standard cooling curves (see e.g. Tsuruta 1998; Page 1998). Original figure
from Slane et al. (2002). The filled circle corresponds to the temperature found from the
atmospheric fit with R = 10 km, and the open circle corresponds to the temperature found
from the atmospheric fit with R = 18 km. If error bar is not evident it is encompassed in
the data point.

– 22 –
Table 1. Blackbody fits to PSR J0538+2817
Fit NH kT χ2ν [dof] T∞ R∞
×1021 cm−2 keV ×106 K km
1 2.63+0.02−0.02 0.180+0.005
−0.006 1.08 [320] 2.09+0.06−0.07 1.79+0.13
−0.10
2 1.30 (fixed) 0.216+0.003−0.003 1.42 [321] 2.50+0.04
−0.03 0.87+0.03−0.02
3 2.51 (fixed) 0.183+0.003−0.003 1.08 [321] 2.12+0.04
−0.03 1.68+0.05−0.05
Note. — Fit 1: NH is allowed to run free, fit 2: NH fixed at the
estimated fraction of galactic absorption in the direction and at the
distance of the pulsar, fit 3: NH fixed at the measured value from a
star near to the pulsar in position and distance.
– 23 –
Table 2. Pure-H, non-magnetized atmospheric fits to
PSR J0538+2817
NH MNS RNS Teff χ2ν [dof] D
×1021 cm−2 M⊙ km ×106 K kpc
4.18+0.01−0.06 1.4 (fixed) 10 (fixed) 0.68+0.10
−0.01 1.09 [320] 0.26
4.17+0.01−0.05 1.4 (fixed) 18 (fixed) 0.57+0.06
−0.01 1.10 [320] 0.38

– 24 –
Table 3. Pulsar Parameters for the three Musketeers and PSR J0538+2817
Pulsar P P log(
P/2P)
D log B
ms 10−15 s/s yr kpc Gauss
B0633+17 (Geminga) 237.09 10.97 5.53 0.16 12.21
B0656+14 384.87 55.03 5.05 0.67 12.67
B1055-52 197.10 5.83 5.73 0.73 12.03
PSR J0538+2817 143.15 3.66 5.79 1.20 11.87
Note. — For all references we refer to Becker & Trumper (1997). The
magnetic field is computed from the spin-down formula. The pulsar distances
are computed according to the model of Cordes & Lazio (2002).