Detection of Mycobacterium avium Subspecies paratuberculosis from Patients with Crohn’s Disease...
11
Detection of Mycobacterium avium subspecies paratuberculosis in environmental samples by faecal culture and real-time PCR in relation to apparent within-herd prevalence as determined by individual faecal culture K. DONAT 1 *, J. KUBE 1 , J. DRESSEL 1 , E. EINAX 1 , M. PFEFFER 2 AND K. FAILING 3 1 Animal Health Service, Thuringian Animal Diseases Fund, Jena, Thuringia, Germany 2 Institute of Animal Hygiene and Veterinary Public Health, Centre of Veterinary Public Health, University of Leipzig, Leipzig, Saxony, Germany 3 Unit for Biomathematics and Data Processing, Veterinary Faculty, Justus-Liebig-University, Gießen, Hesse, Germany Received 18 April 2014; Final revision 24 August 2014; Accepted 30 August 2014 SUMMARY Environmental samples are a cost-saving and easy-to-use approach to diagnose paratuberculosis at the herd level. Detailed knowledge concerning its uncertainties in herds with a low prevalence of Mycobacterium avium spp. paratuberculosis (MAP) is required to design sampling strategies in control programmes. This study aimed to calculate a threshold level of the apparent within-herd prevalence (WHP app ) as determined by individual mycobacterial cultivation (faecal culture; FC) of all cows thus allowing the detection of a herd as MAP-positive at a certain probability level (P d ). Out of 200 environmental samples taken twice from five predefined locations in a barn, 25 were positive by FC and 60 were positive by a quantitative real-time PCR method (qPCR). A logistic regression model was used to calculate the WHP app threshold of detection. For 50% P d , a WHP app threshold of 2·9% was calculated for the combination of three samples (milking area, main cow alleyways, holding pen) tested simultaneously both by FC and qPCR. The threshold increased to 6·2% for 90% P d . Repeated environmental sampling did not reduce the WHP app threshold. Depending on the particular needs for prevalence estimation or in control programmes (single or repeated sampling) the provided WHP app thresholds at different P d will enable decisions to be made about various sampling strategies. Key words: Faecal culture, infectious disease control, Mycobacterium (avium paratuberculosis), veterinary epidemiology and bacteriology, zoonoses. INTRODUCTION Paratuberculosis, or Johne’s disease, is a chronic granu- lomatous enteric disease, predominantly of ruminants, which is caused by Mycobacterium avium subspecies (spp.) paratuberculosis (MAP). It is characterized by a long incubation period of up to 10 years, resulting in a latent, a subclinical, and a clinical stage of disease. Therapy-resistant aqueous diarrhoea and formation of oedema due to hypoproteinaemia are cardinal symptoms of late-stage clinical paratuberculosis [1]. Economic losses are caused by reduced slaughter weight [2], increased susceptibility to other diseases [3], premature culling [4] and, in the dairy industry, decreased milk production even in cows without clini- cal symptoms [5–8]. Furthermore, there may be a role * Author for correspondence: Dr. K. Donat, Thüringer Tierseuchenkasse, Victor-Goerttler-Strasse 4, D-07745 Jena, Germany. (Email: [email protected]) Epidemiol. Infect., Page 1 of 11. © Cambridge University Press 2014 doi:10.1017/S0950268814002465
-
Upload
independent -
Category
Documents
-
view
2 -
download
0
Transcript of Detection of Mycobacterium avium Subspecies paratuberculosis from Patients with Crohn’s Disease...
Detection of Mycobacterium avium subspecies paratuberculosisin environmental samples by faecal culture and real-time PCRin relation to apparent within-herd prevalence as determinedby individual faecal culture
K. DONAT1*, J. KUBE1, J. DRESSEL1, E. EINAX1, M. PFEFFER2AND
K. FAILING3
1Animal Health Service, Thuringian Animal Diseases Fund, Jena, Thuringia, Germany2 Institute of Animal Hygiene and Veterinary Public Health, Centre of Veterinary Public Health, University ofLeipzig, Leipzig, Saxony, Germany3Unit for Biomathematics and Data Processing, Veterinary Faculty, Justus-Liebig-University, Gießen, Hesse,Germany
Received 18 April 2014; Final revision 24 August 2014; Accepted 30 August 2014
SUMMARY
Environmental samples are a cost-saving and easy-to-use approach to diagnose paratuberculosisat the herd level. Detailed knowledge concerning its uncertainties in herds with a low prevalenceof Mycobacterium avium spp. paratuberculosis (MAP) is required to design sampling strategies incontrol programmes. This study aimed to calculate a threshold level of the apparent within-herdprevalence (WHPapp) as determined by individual mycobacterial cultivation (faecal culture; FC)of all cows thus allowing the detection of a herd as MAP-positive at a certain probability level(Pd). Out of 200 environmental samples taken twice from five predefined locations in a barn, 25were positive by FC and 60 were positive by a quantitative real-time PCR method (qPCR). Alogistic regression model was used to calculate the WHPapp threshold of detection. For 50% Pd,a WHPapp threshold of 2·9% was calculated for the combination of three samples (milking area,main cow alleyways, holding pen) tested simultaneously both by FC and qPCR. The thresholdincreased to 6·2% for 90% Pd. Repeated environmental sampling did not reduce the WHPappthreshold. Depending on the particular needs for prevalence estimation or in control programmes(single or repeated sampling) the provided WHPapp thresholds at different Pd will enabledecisions to be made about various sampling strategies.
Key words: Faecal culture, infectious disease control, Mycobacterium (avium paratuberculosis),veterinary epidemiology and bacteriology, zoonoses.
INTRODUCTION
Paratuberculosis, or Johne’s disease, is a chronic granu-lomatous enteric disease, predominantly of ruminants,which is caused by Mycobacterium avium subspecies(spp.) paratuberculosis (MAP). It is characterized by a
long incubation period of up to 10 years, resulting ina latent, a subclinical, and a clinical stage of disease.Therapy-resistant aqueous diarrhoea and formationof oedema due to hypoproteinaemia are cardinalsymptoms of late-stage clinical paratuberculosis [1].Economic losses are caused by reduced slaughterweight [2], increased susceptibility to other diseases[3], premature culling [4] and, in the dairy industry,decreased milk production even in cows without clini-cal symptoms [5–8]. Furthermore, there may be a role
* Author for correspondence: Dr. K. Donat, ThüringerTierseuchenkasse, Victor-Goerttler-Strasse 4, D-07745 Jena,Germany.(Email: [email protected])
Epidemiol. Infect., Page 1 of 11. © Cambridge University Press 2014doi:10.1017/S0950268814002465

of MAP as a potential zoonotic pathogen. A linkbetween MAP and Crohn’s disease, a human inflam-matory bowel disease, is discussed [9, 10]. MAPsurvives current pasteurization treatments and, there-fore, is a potential human foodborne pathogen [11].
With respect to the economic impact of Johne’s dis-ease and the potential risk for human health, effectivemeasures to control the disease should be implemen-ted in MAP-positive herds to limit the spread of thedisease, and to reduce the shedding of MAP into theenvironment, and the carry-over into the food chain.Currently, identification of MAP-positive herds bytesting individual animals is hampered by the lackof affordable, specific and sufficiently sensitiveapproaches for a diagnosis at the herd level. First, bac-terial culture of faecal samples on solid or liquidmedia (faecal culture; FC) is still considered the‘gold standard’ for MAP identification [9, 12], but itis time-consuming and costly. Further, it may renderfalse-negative results when applied at a samplingtime point without MAP shedding. Bacterial cultureof pooled faecal samples can reduce the testing costsper animal by 43% up to 73%, but it decreases testsensitivity at the individual animal level to 60% [13].Second, ELISA tests, which are commerciallyavailable and commonly used, perform with a lackin sensitivity and specificity, and do not allow thecategorization of a herd as MAP-positive orMAP-negative in specific cases [1, 14]. Therefore, acost-efficient and manageable screening method tocategorize herds with regard to their MAP statuswould be valuable. Bacterial culture of environmentalfaecal samples has been shown to detect dairy herdswith an estimated moderate to high within-herd preva-lence (WHP) as MAP-positive [15–17]. This approachutilizes the long-term survival of MAP under variousenvironmental conditions. In liquid manure MAP cansurvive at 5 °C for more than 9 months and at 15 °Cfor at least 3·5 months [18, 19]. In the absence ofessential nutrients MAP may enter a ‘state of dor-mancy’ and return to a viable state under better con-ditions [20]. In freestall herds, targeted sampling inalleyways, waiting yards, manure storage areas andholding pens showed the best outcome of detection[15–17, 21, 22].
The number of positive environmental samples andthe amount of MAP in those samples are positivelycorrelated with WHP [15, 16]. The sensitivity at theherd level as determined by composite environmentalsampling varies in a wide range from 33·3% to 89·7%depending on the number of samples and WHP [23].
Recently, sensitivity of a set of six environmentalsamples collected from different locations within abarn and tested by FC was found to be 71% (95%confidence interval 49–86) compared to a herd classi-fication based on pooled FC samples, with samplesfrom five cows in each pool [24].
Due to the higher test sensitivity and test specificity,the studies that determined individual Johne’s diseasestatus by identification of the organism [21, 22, 25],are less susceptible to misclassification bias thanthose using identification based on percentage of anti-bodies against MAP [26], which is particularly import-ant in herds with low prevalence. These studiesindicated that environmental samples tested by FCdo not identify MAP-positive herds with a WHP<2% and showed inconsistent results when apparentWHP (WHPapp) ranged between 2% and 10%.
For the last decades attempts have been made toapply polymerase chain reaction (PCR) techniquesdirectly on faecal samples, which is able to providemuch faster results than FC [1]. A variety of primersagainst different targets in the MAP genomehas been established, i.e. IS900, IS Mav3, F57 andlocus 255. Most of the single-step methods are re-liable, while nested PCR methods are at a higherrisk of being disturbed by contaminations [27].Sensitivity of PCR from faecal samples depends onthe DNA extraction procedures, which should ensurean effective removal of PCR inhibitors like phyticacid, polysaccharides, phenolics or bile salts [28].Therefore, most PCR methods are less sensitive thanFC [29]. Recently, real-time PCR for the detectionof MAP combined with a high-efficiency DNA extrac-tion was developed which was reported to have anequal or higher sensitivity compared to FC onHerrold’s egg yolk medium (HEYM) [30–32].
Therefore, our study aimed to calculate a thresholdof WHP that allows the identification of low-prevalence herds as MAP-positive with an acceptableprobability using environmental samples tested by FCand quantitative real-time PCR (qPCR).
MATERIAL AND METHODS
Study population
Twenty Holstein dairy herds enrolled in the‘Paratuberculosis Control Programme in ThuringianCattle Herds’ and housed in freestalls, with an averageherd size of 253 cows (40–538) were selected for thisstudy. The programme included, among other
2 K. Donat and others
measures, annual screenings of all cows for MAPby FC. If a cow tested positive by FC (FC+), it wasnot retested the next year. The Thuringian MAP con-trol programme followed the recommendations ofSweeney et al. [9], who suggested immediate cullingof heavy shedders and the elimination of low sheddersat the end of lactation or in case of other problems.
According to the aim of the present study, 14 herdswith a WHPapp (see below) less than 10% were selectedbased on the results of herd screenings for the years2008–2010, and three herds had a WHPapp largerthan 10%. Additionally, three herds which never hada FC+ test result in the annual herd screenings duringthe previous three years were included (Table 1).
Estimation of WHPapp
All cows in the 20 herds without a FC+ test result, i.e.first lactation cows and cows tested FC-negative (FC–)in previous years were tested once by individual FCduring January and June 2011. Samples were takenby a veterinarian of the Thuringian Animal HealthService using a new glove for each cow and a sterile125 ml plastic cup with a screw cap and bar code forsample identification. The numbers of tested cows,cows with MAP-positive test results from previousyears, and number of cows in each herd are given inTable 1. We calculated WHPapp using the FC resultof each cow in the herd (Table 1) and therefore,WHPapp was estimated with a high accuracy leveland not biased by pooling or selection of sampledindividuals.
Environmental sampling
Faecal samples from the barn environment of thecattle were collected by a veterinarian of the AnimalHealth Service. In a previous study [22] a total offive sampling sites within the barns were identifiedand proven to be suitable for environmental sampling:milking area (waiting pen), main alleyway, lactatingcow floor (fresh cow pen), maternity (calving) pen,and crossover to calf area. For each of these fiveareas a composite sample consisting of ten randomlycollected subsamples was taken at different sites with-in the sampling location using a clean and disinfectedscraper. The subsamples were placed together in asterile 125 ml plastic cup with a screw cap and trans-ported in a cooler to the laboratory within 2 h.Environmental samples were taken twice for eachherd within 4 months with a median interval of 132
days (minimum 118, maximum 160) in different sea-sons. In the cool season sampling was performed dur-ing March and April 2011 and in the warm seasonsamples were taken during July and August 2011.
Bacterial culture
After transportation to the laboratory all faecalsamples were stored at −20 °C until cultivation toavoid undesired bacterial and fungal growth and toensure consistent sample handling. FC of individualsamples and environmental samples was performedaccording to the official manual of diagnostic pro-cedures published by the FLI [33]. Differentiation ofcharacteristic colonies was done by Ziehl–Neelsenstaining and an IS900 PCR [29].
DNA isolation from faeces
The DNA was extracted from faeces using theMagMax™ Total Nucleic Acid isolation kit (LifeTechnologies GmbH, Germany) according to themanufacturer’s instructions. The samples were thawed,homogenized and 0·3 g was transferred into 1 ml phos-phate buffered solution. The MagMax™ Express 96instrument (Life Technologies GmbH) was appliedfor nucleic acid purification and DNA was eluted ina final volume of 200 μl buffer solution.
DNA amplification and real-time PCR
For the detection of MAP DNA, the TaqMan® MAP(Johne’s) Reagents kit (Life Technologies GmbH),performed on a 7500 fast real-time PCR cycler (LifeTechnologies GmbH), was used according to the man-ufacturer’s instructions.
Statistical data analysis
Results of bacterial culture and qPCR were recordedand descriptive statistics were generated using aMicrosoft Excel calculation spreadsheet (MicrosoftCorporation, USA). All other statistical analyses weredone using the statistical software package BMDP/Dynamic (release 8·1; W. J. Dixon, StatisticalSolutions Ltd, Ireland). At each step a statistical signifi-cance level of α= 0·05 was used.
To analyse the relationship between the WHPappand the colony growth score (FC) or the cycle thresh-old (Ct) value (qPCR) of environmental samples,
Herd level diagnosis of paratuberculosis 3

respectively, Spearman’s rank correlation coefficientswere calculated for each location and test method.
As environmental samples were collected twice,and WHPapp could be calculated only once for eachherd, additionally to the observation in spring, theFC and qPCR results were aggregated using the high-est colony growth score for FC and the lowest Ct
value for qPCR observed in spring or summer foreach location.
Concerning WHPapp of a certain herd as an influen-cing factor of interest (n= 20), its relationship to thedichotomized MAP findings (negative or positive) inthe environmental samples was assessed using a logis-tic regression model analysed with the asymptoticlogistic regression procedure BMDPLR [34].
Due to significant relationships for WHPapp in thelogistic regression model, two, three or five locationswere selected in order to combine their findings intoa single binary outcome, being positive if at leastone of these locations showed a positive result, andnegative if all locations were negatively tested.
Inversion of the logistic function yields a WHPappestimate associated with a given probability of detec-tion (Pd) of a MAP-positive herd. For practical rea-sons in a control programme or for prevalenceestimation, a high Pd is desirable. A value of Pd =0·9 was selected because on the one hand it is com-monly used in epidemiological problems and on theother, the slope of the logistic function is still risingsteeply enough to limit the uncertainty of WHPapp es-timation. Furthermore, Pd = 0·5 was selected becausethis is the inflexion point of the sigmoid logistic func-tion, and this is the point of maximal slope which mini-mizes the uncertainty ofWHPapp estimation. By meansof the program BMDPLE [34], which uses maximumlikelihood techniques, estimates as well as asymptoticstandard errors for these detection thresholds werefound. From this, approximate 95% confidence inter-vals for the thresholds of interest were computed.
The formula for the detection threshold is:
WHPapp(Pd) = (ln(Pd/(1− Pd) − a)/b,
where Pd = desired probability of detection;WHPapp(P) = apparent within-herd prevalence withdetection probability P; a= constant parameter inthe logistic function; b=model coefficient relating toWHPapp in the logistic regression; and ln = naturallogarithm.
In order to analyse the accordance between the FCand qPCR results, Cohen’s kappa coefficient was cal-culated. Additionally, McNemar’s procedure wasused to test for deviation of symmetry of differingresults in the fourfold table of the dichotomized FCand qPCR findings.
RESULTS
WHPapp
Out of a total of 5015 individual faecal samples, 270were MAP-positive and 4710 MAP-negative by FC(Table 1). The 20 study herds had a medianWHPapp of 4·6% (first quartile 2·0%, third quartile6·9%). In four herds none of the cows was positivelytested.
Environmental samples
Regarding the first sampling (cool season), FCresulted in 18 FC+ and 76 FC– environmental sam-ples. When qPCR was applied, 31 samples showed apositive (qPCR+) and 69 a negative (qPCR–) result.
Table 1. Determination of apparent within-herdprevalence (WHPapp)
HerdCows(n)
Known FCpositivecowsa (n)
Testedcows (n)
FCpos.b
(n)WHPapp(%)
1 253 253 0 02 417 417 0 03 204 204 1 0·494 211 211 0 05 224 224 0 06 198 198 7 3·547 301 4 297 9 4·328 465 465 32 6·889 380 2 378 14 4·2110 182 182 13 7·1411 322 4 318 15 5·9012 259 4 255 9 5·0213 538 9 529 17 4·8314 40 40 1 2·5015 150 150 9 6·0016 168 168 14 8·3317 236 236 10 4·2418 185 185 22 11·8919 195 195 66 33·8520 135 25 110 31 41·48
Total 5063 48 5015 270
FC, Faecal culture; MAP, Mycobacterium avium spp.paratuberculosis.a MAP-positive cows tested by FC in previous years and stillkept in the herd.b FC MAP-positive cows.
4 K. Donat and others
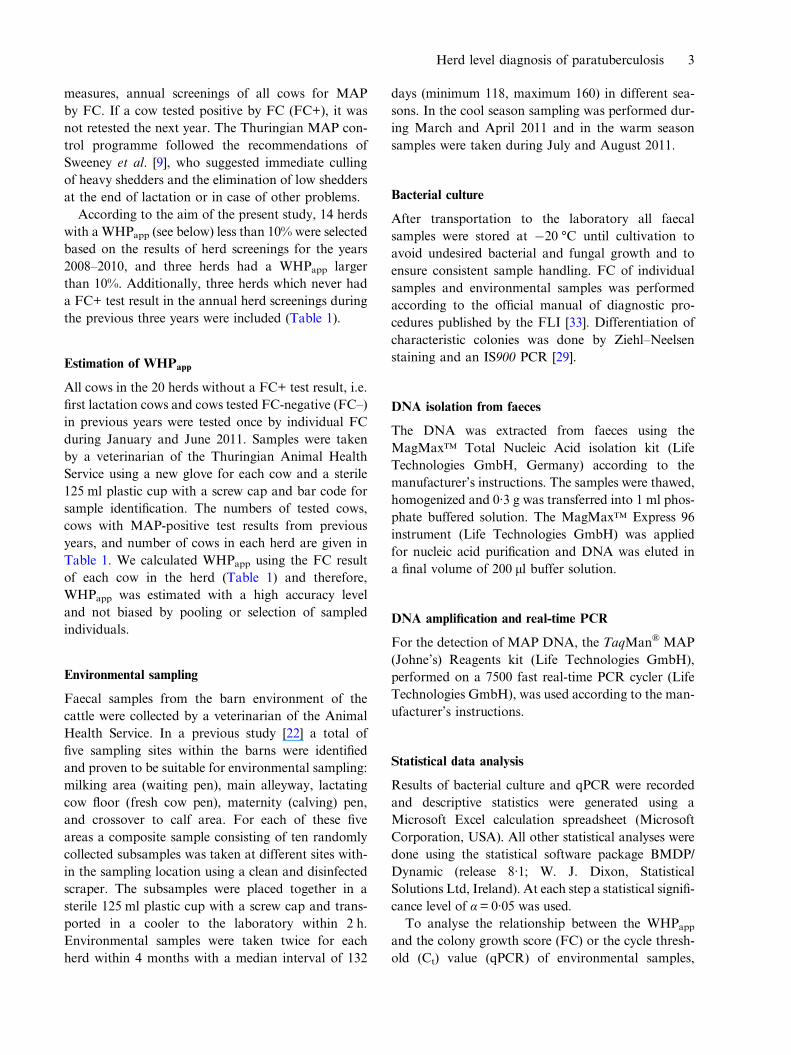
Due to fungal or bacterial contamination six sampleswere not assessable during the cool season and 22samples during the warm season, where 35 sampleswere qPCR+ and 65 qPCR–. Taken together, 33%of the environmental samples were qPCR+ and12·5% FC+ (Table 2). Based on the results of 172 en-vironmental samples with valid results by FC andqPCR, Cohen’s kappa was 0·334 indicating a moder-ate but significant (P < 0·001) association of FC andqPCR in environmental samples. McNemar’s testshowed a significant asymmetry of the differing testresults by FC and qPCR (P< 0·0001), where PCRresulted in a higher number of positive tests.
Association between WHPapp and FC or qPCR results
Spearman’s rank correlation coefficients (rs) for the re-lationship between WHPapp and colony growth score(FC) of environmental samples or the Ct values ofqPCR for each location are given in Table 3.Additionally, we calculated rs for combinations of twoor three locations which showed a significant associ-ation with WHPapp, and for a combination of all loca-tions. All combinations showed a significant correlationwith WHPapp gaining best results for the FC colonyscore using a combination of three samples (milkingarea, main alleyway, holding pen) or all samples.
Association between WHPapp and herds’ MAP statusas determined by FC or qPCR
When the single sampling strategy was implemented,the main alleyway was the only location where bothtechniques (FC and qPCR) and the combination ofboth were significantly associated with WHPapp. Forthe holding pen this was the case only when qPCRwas applied, and for the combination of bothmethods. Double sampling resulted in a significantassociation with WHPapp for the main alleyway testedby both methods and the combination of both.Additional significance was found for the maternityarea tested by qPCR and the combination of qPCRand FC. Despite two combinations in qPCR testingin the single sampling, all combinations of locationsresulted mostly in significant associations withWHPapp (Table 4).
Estimates of WHPapp associated with a givenprobability of detection
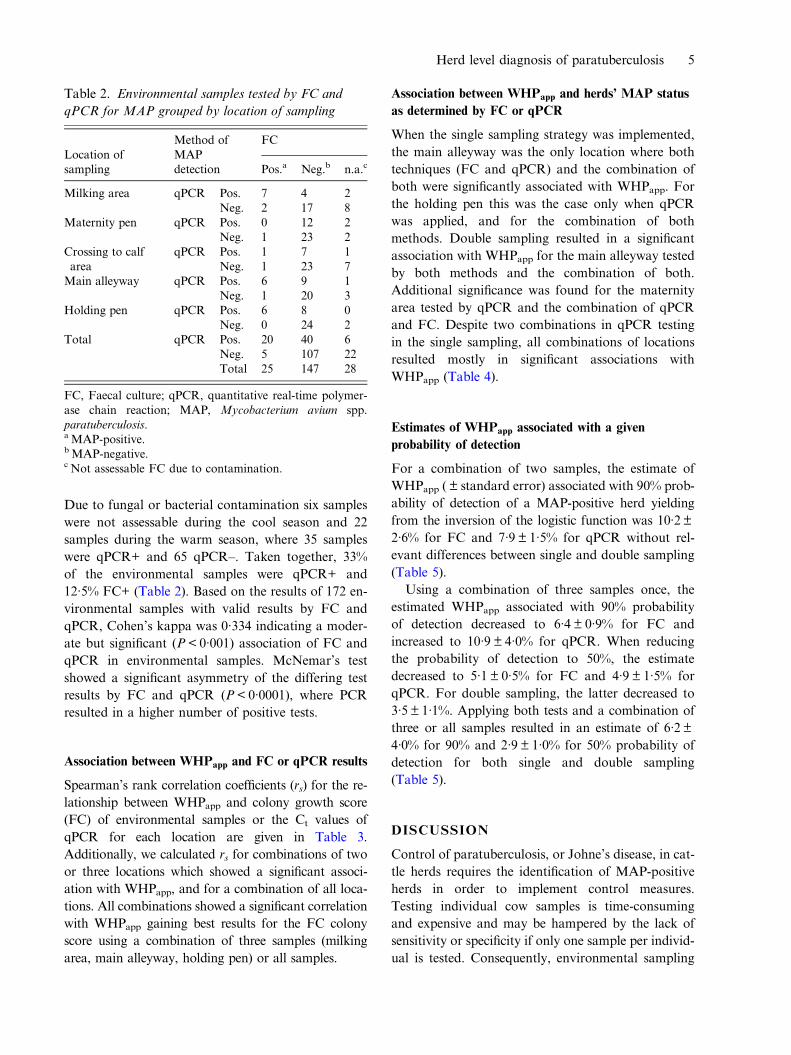
For a combination of two samples, the estimate ofWHPapp ( ± standard error) associated with 90% prob-ability of detection of a MAP-positive herd yieldingfrom the inversion of the logistic function was 10·2 ±2·6% for FC and 7·9 ± 1·5% for qPCR without rel-evant differences between single and double sampling(Table 5).
Using a combination of three samples once, theestimated WHPapp associated with 90% probabilityof detection decreased to 6·4 ± 0·9% for FC andincreased to 10·9 ± 4·0% for qPCR. When reducingthe probability of detection to 50%, the estimatedecreased to 5·1 ± 0·5% for FC and 4·9 ± 1·5% forqPCR. For double sampling, the latter decreased to3·5 ± 1·1%. Applying both tests and a combination ofthree or all samples resulted in an estimate of 6·2 ±4·0% for 90% and 2·9 ± 1·0% for 50% probability ofdetection for both single and double sampling(Table 5).
DISCUSSION
Control of paratuberculosis, or Johne’s disease, in cat-tle herds requires the identification of MAP-positiveherds in order to implement control measures.Testing individual cow samples is time-consumingand expensive and may be hampered by the lack ofsensitivity or specificity if only one sample per individ-ual is tested. Consequently, environmental sampling
Table 2. Environmental samples tested by FC andqPCR for MAP grouped by location of sampling
Location ofsampling
Method ofMAPdetection
FC
Pos.a Neg.b n.a.c
Milking area qPCR Pos. 7 4 2Neg. 2 17 8
Maternity pen qPCR Pos. 0 12 2Neg. 1 23 2
Crossing to calfarea
qPCR Pos. 1 7 1Neg. 1 23 7
Main alleyway qPCR Pos. 6 9 1Neg. 1 20 3
Holding pen qPCR Pos. 6 8 0Neg. 0 24 2
Total qPCR Pos. 20 40 6Neg. 5 107 22Total 25 147 28
FC, Faecal culture; qPCR, quantitative real-time polymer-ase chain reaction; MAP, Mycobacterium avium spp.paratuberculosis.a MAP-positive.bMAP-negative.c Not assessable FC due to contamination.
Herd level diagnosis of paratuberculosis 5

has been described as an easy and cost-effectiveherd-level screening method [14–17]. Although thereis controversy as to whether this approach is appropri-ate for herds with low MAP prevalence [21, 24, 25],herd-level sensitivity and specificity values have beenpublished [24] and, for a given WHPapp to be detected,found to be comparable or even better than serologi-cal testing [14]. Therefore, environmental samplestested by FC can be considered an alternative methodfor herd diagnosis in low-prevalence herds [24]. Usingtwo methods of MAP detection simultaneously,FC and qPCR, this prospective study was performedin well-characterized dairy herds with a low-levelWHPapp known from individual FC testing in pre-vious years. Thus, we were able to fill a gap in theknowledge regarding the benefit of using qPCR in-stead of, or simultaneously with, FC.
Compared to previous studies [14–17], the strengthof our study design is that we used the gold standardfor the determination of WHPapp, i.e. the individualtesting of all cows in the herd. Thus, the WHPapp weused in the model was not influenced by any bias ofpooling or selection of sampled individuals [9, 12,35] resulting in a WHPapp estimation with a high accu-racy level. Nonetheless, a certain level of uncertaintyremains in the estimation of WHPapp that results
from the use of an imperfect test. FC is highly specific(>99%) but has a sensitivity that is estimated to beapproximately 60% relative to necropsy [9]. Becausenecropsy is not a realistic option for field studies andfor diagnosis in the framework of control pro-grammes, we decided to refer to the FC-basedWHPapp. The estimation of WHPapp was animalbased with numerous animals per herd, and we cannotexclude that variability may be caused by fluctuatingshedding, which only becomes apparent by repeatedsampling. Because of the high cost of our approachbased on individual culture of each sample, the indi-vidual FC test was not repeated. Hence, this uncer-tainty cannot be excluded from the estimation of theWHPapp threshold.
Our results demonstrate the advantages and limita-tions of using a qPCR to detect MAP in environmen-tal samples. Contrary to the time-consuming FCmethod, qPCR allows MAP detection within a fewdays and detected a significantly higher number of en-vironmental samples as MAP-positive without specifi-city problems [36]. Environmental samples that testedMAP-positive originated from herds known to beMAP-positive, except for five samples from herd 2that was known to be MAP-negative for at least 5years. The herd was retested by individual FC of
Table 3. Spearman’s rank correlation coefficient (rs) for the correlation between within-herd prevalence and colonygrowth score of the FC or Ct value of the qPCR for single and double sampling and for each location sampled for thecombination of two, three or five samples
Single sampling Double sampling
Colony scorea Ct valueb Colony score Ct value
Location nc rsd P value n rs P value n rs P value n rs P value
Milking area 18 0·597 0·007 20 −0·581 0·007 18 0·597 0·009 20 −0·627 0·003Maternity 19 0·0 n.s. 20 −0·396 n.s. 20 0·260 n.s. 20 −0·730 <0·001Crossing to calf area 18 0·146 n.s. 20 −0·329 n.s. 20 0·181 n.s. 20 −0·547 0·012Main alleyway 19 0·695 <0·001 20 −0·704 <0·001 19 0·695 <0·001 20 −0·694 <0·001Holding pen 20 0·576 <0·001 20 −0·780 <0·001 20 0·579 0·007 20 −0·752 <0·0012 locations combinede 20 0·691 <0·001 20 −0·747 <0·001 20 0·700 <0·001 20 −0·767 <0·0013 locations combinedf 20 0·848 <0·001 20 −0·712 <0·001 20 0·858 <0·001 20 −0·780 <0·0015 locations combinedg 20 0·846 <0·001 20 −0·688 <0·001 20 0·860 <0·001 20 −0·758 <0·001
FC, Faecal culture; Ct, cycle threshold; qPCR, quantitative real-time polymerase chain reaction; n.s., not significant.a Colony score of environmental samples’ FC test (c.f.u.): +, 1–10; ++, 11–50; +++, 51–100; ++++, >100.b Ct value of environmental samples’ qPCR.c Number of herds with valid test results of environmental samples tested by either qPCR or FC.d Spearman’s rank correlation coefficient.e Combination of two locations (main alleyway, holding pen).f Combination of three locations (milking area, main alleyway, holding pen).g Combination of all five locations.
6 K. Donat and others

all cows the following year and 3 years after the studywithout any positive results. The samples wereretested using another PCR protocol targetingthe F57 locus with negative results. Although we sup-pose that the initial qPCR results of these samplesmight be false positive, another reason for the positiveresults could be a MAP shedder with low or intermit-tent shedding resulting in very low WHP. We did notexclude these samples from the model because in thepractical use of qPCR-tested environmental samples,these samples are regarded as positive which shouldbe represented by our model.
With respect to the locations of sampling, theqPCR performed much better for samples fromthe maternity pen and the crossing to calf area with20 samples qPCR MAP-positive compared to onlyfour samples with positive results by FC. Becauseall study herds are involved in the control pro-gramme, this may result from the activities of theherd managers to ensure a high hygienic standardby frequent disinfection in areas of critical import-ance (maternity pen, crossing to calf area), and conse-quently, MAP was not cultivable but detectable byPCR. Regarding the correlation of the Ct valuewith WHPapp, we observed a significant Spearman’srank correlation coefficient of −0·730 for the ma-ternity pen and −0·547 for the crossing to calf areafor double sampling (Table 3). In samples from themain alleyways, the holding pens of lactating cows
and the milking area, qPCR nearly doubles the num-ber of MAP-positive samples compared to FC; thecorrelation with WHPapp was significant for the Ct
values and the FC colony score as well indicatingthat these three locations are appropriate for environ-mental sampling and testing by FC as well as byqPCR. The best correlation with WHPapp (rs = 0·78)was achieved when samples from the holding penwere tested by qPCR. This corresponds to the corre-lation between Ct values and colony-forming units ina previous study with a non-standardized samplingprotocol [32]. The combination of three samples(holding pen, main alleyway, milking area) enhancedcorrelation markedly for colony scores, but not for Ct
values. The combination of all five sample locationsdid reduce and double sampling did not improvethe correlation compared to single sampling. Whenfocusing on cow concentration areas (lactating cowfloor, cows’ alleyway), our results are in line withthe results of previous studies [15, 21]. Although ma-nure storage areas were shown to be suitable loca-tions for MAP detection by environmental samplingin previous studies [15–17, 21] we excluded themfrom our study on health and safety grounds. As weintend to establish environmental sampling as asufficiently sensitive, cost-saving and easy-to-useapproach to identify MAP-positive dairy herds, weaim to avoid a hazardous situation for the personsampling.
Table 4. Results of the logistic regression to analyse the association betweenWHPapp and MAP status of herds (n =20) determined by FC, qPCR or the combination of both for different combinations of locations
Location
Single sampling Double sampling
FCa qPCRbFC andqPCRc FC qPCR
FC andqPCR
ORd Pe OR P OR P OR P OR P OR P
2 locations combinedf 2·07 0·044 2·73 0·030 2·48 0·030 2·07 0·044 1·74 0·041 1·74 0·0413 locations combinedg 5·76 0·016 1·44 0·094 1·96 0·026 5·76 0·016 1·74 0·041 1·96 0·0265 locations combinedh 5·76 0·016 1·48 0·078 1·96 0·026 5·76 0·016 1·96 0·026 1·96 0·026
WHPapp, apparent within-herd prevalence; MAP, Mycobacterium avium spp. paratuberculosis; FC, faecal culture; qPCR,quantitative real-time polymerase chain reaction; OR, odds ratio.a Herds classified as MAP-positive by testing the sample by FC.b Herds classified as MAP-positive by testing the sample by qPCR.c Herds classified as MAP-positive by testing the sample by FC or qPCR.d Odds ratio for the description of the association between WHPapp and MAP status.e P value for odds ratio.f Combination of two locations (main alleyway, holding pen).g Combination of three locations (milking area, main alleyway, holding pen).h Combination of all five locations.
Herd level diagnosis of paratuberculosis 7
Table 5. Estimates of WHPapp threshold value ± asymptotic S.E. and approximate 95% confidence intervals for the detection of a MAP-positive herd using acombination of two, three or five environmental locations tested by FC, qPCR or the combination of both, respectively, at different probabilities of detection
Single sampling Double sampling
FCa qPCRb FC and qPCRc FC qPCR FC and qPCR
Pdd (%) WHPapp ± S.Ee 95% CIapp
f WHPapp ± S.E. 95% CIapp WHPapp ± S.E. 95% CIapp WHPapp ± S.E. 95% CIapp WHPapp ± S.E. 95% CIapp WHPapp ± S.E. 95% CIapp
Combination of two environmental samples (main alleyway, holding pen)50 7·2 ± 1·2 4·7–9·6 5·7 ± 0·7 4·2–7·2 5·2 ± 0·8 3·7–6·7 7·2 ± 1·2 4·7–9·6 3·5 ± 1·1 1·3–5·7 3·5 ± 1·1 1·3–5·790 10·2 ± 2·6 4·9–15·4 7·9 ± 1·5 4·8–11·0 7·7 ± 1·6 4·5–10·8 10·2 ± 2·6 4·9–15·4 7·5 ± 2·0 3·4–11·5 7·5 ± 2·0 3·4–11·5Combination of three environmental samples (milking area, main alleyway, holding pen)50 5·1 ± 0·5 4·2–6·1 4·9 ± 1·5 1·9–7·9 2·9 ± 1·0 1·0–4·9 5·1 ± 0·5 4·2–6·1 3·5 ± 1·1 1·3–5·7 2·9 ± 1·0 1·0–4·990 6·4 ± 0·9 4·6–8·2 10·9 ± 4·0 3·0–18·9 6·2 ± 1·6 3·0–9·4 6·4 ± 0·9 4·6–8·2 7·5 ± 2·0 3·4–11·6 6·2 ± 1·6 3·0–9·4Combination of five environmental samples (milking area, maternity, crossing to calf area, main alleyway, holding pen)50 5·1 ± 0·5 4·2–6·1 4·1 ± 1·4 1·3–6·9 2·9 ± 1·0 1·0–4·9 5·1 ± 0·5 4·2–6·1 2·9 ± 1·0 1·0–4·9 2·9 ± 1·0 1·0–4·990 6·4 ± 0·9 4·6–8·2 9·9 ± 3·3 3·3–16·4 6·2 ± 1·6 3·0–9·4 6·4 ± 0·9 4·6–8·2 6·2 ± 1·6 3·0–9·4 6·2 ± 1·6 3·0–9·4
WHPapp, Apparent within-herd prevalence; S.E., standard error; MAP, Mycobacterium avium spp. paratuberculosis; FC, faecal culture; qPCR, quantitative real-timepolymerase chain reaction; CI, confidence interval.a Herds classified as MAP-positive by testing environmental samples by FC.b Herds classified as MAP-positive by testing environmental samples by qPCR.c Herds classified as MAP-positive by testing environmental samples by using both qPCR and FC.d Probability of detection MAP-positive herds as positive.e Estimated threshold value of the WHPapp ± approximate S.E. for the detection of a MAP-positive herd.f Approximate 95% CI of the estimated threshold value of the WHPapp for the detection of a MAP-positive herd.
8K.Donat
andothers
The estimation of the WHPapp threshold value fordetection of a MAP-positive herd using different com-binations of sampling and methods of testing showedthe lowest WHPapp percentage as 90% Pd for a combi-nation of three and five samples tested by FC andqPCR simultaneously. Relaxing Pd to 50% resulted ina lowering of this estimate from 6·2 ± 1·6% to 2·9 ±1·0% WHPapp. Our results are in line with previousstudies [24] using a set of six samples with a sensitivityapproaching 100% at moderate WHPapp levels of 8%,and 90% sensitivity at a WHPapp of ∼5%. This mayencourage the use of a set of two or three environmen-tal samples instead of six samples which is demandedby the Uniform Program Standards for the VoluntaryBovine Johne’s Disease Control Program publishedby the USAD [37]. Furthermore, in contrast to ourstudy, Lavers et al. [24] estimated the WHPapp of thestudy herds using initially a pooled FC consisting offive samples followed by individual culture of samplesfrom positive pools. This less elaborate approach low-ers the sensitivity of the FC method [13, 38] becausea sample from a single cow containing a low amountof MAP would not be detected by the pool FC due tothe dilution effect. Consequently, WHPapp could beunderestimated, as the individual FC was done onlyfrom MAP-positive pools. To a certain degree, ourresults confirm the limitations of detecting low-prevalence MAP-positive herds using only environ-mental samples, that have been postulated by otherstudies regardless of the detection methods used[21, 22, 25]. The WHPapp thresholds resulting fromour model refer to WHPapp calculated from individualFC results. Although FC is currently the most sensi-tive method to diagnose paratuberculosis in living ani-mals, its sensitivity is estimated to be about 60–70%relative to necropsy, with a specificity 599% [9, 39].If we had used the true prevalence in our model, theestimated threshold value would be even higher. Wewaived this option because necropsy is not a realisticoption. Nonetheless, for practical use in control pro-grammes, the 90% Pd WHPapp threshold is an orien-tation value of what can be expected from the use ofa single environmental sampling. In voluntary controlprogrammes it is important to identify herds with ahigh WHPapp because these herds account for thehighest risk of MAP shedding into the environmentand the food chain. These farms should be identifiedand given advice as a priority. Applying two testmethods on a set of three samples resulted in aWHPapp threshold of 6·2% and, therefore, meets therequirement necessary to identify these herds.
In our dataset double sampling did not reducethreshold value compared to single sampling by FCor the combination of FC and qPCR. This confirmsthe results of Lavers et al. [24] who stated onlyminimal improvement of sensitivity with a secondsampling. This may disprove the assumption that re-peated sampling, which is frequently used in controlprogrammes, will reduced the WHPapp thresholdthat allows the detection of a herd as MAP positive.By contrast, when only qPCR was applied, doublesampling lowered the estimated threshold calculatedfor single sampling. This may be due to the perceptibleinfluence of the positive qPCR results in herd 2. Thatwould, at least in part, explain the worse performanceof qPCR in the logistic regression model, particularlyin the single sampling approach. Because our model isbased on only 20 herds, it presumably reacts rathersensitively to misclassification causing a bias in thresh-old estimation. Although repeated sampling did notreduce the WHPapp threshold it enhances Pd at certainWHPapp levels. For example, using the calculatedWHPapp threshold of 2·9% at Pd = 0·5 for a set ofthree samples tested by both FC and qPCR and as-suming five statistical independent observations, theresulting Pd would be 0·969, which is an acceptablevalue even for a monitoring programme that aims todetect herds with a WHPapp >3% with a probabilityof >0·95. Obviously, limitations remain regardingthe use of environmental samples for monitoringherds not suspected of paratuberculosis in certificationprogrammes.
In our study the high number of unanalysable FCsfrom samples collected during the warm season(Table 2) might have limited the improvement whichwould be expected from repeated sampling. As inmost cases fungal contamination hampered the iden-tification of MAP cultures and we suspect that thehigher air temperature and humidity during the sum-mer facilitated the growth of mould in the faeceswhich accumulated in the barn. Therefore, the decon-tamination procedure was not able to inactivate themould spores completely, and consequently, more cul-ture tubes were affected by fungal overgrowth.
Taken together, our results favour a combinationof three environmental samples taken once per herdand tested simultaneously by FC and qPCR to bean option that is less laborious but similar insensitivity compared to a set of five environmentalsamples. Repeated sampling as well as the inclusionof more samples did not improve the probability ofidentifying a herd as MAP-positive. The set of three
Herd level diagnosis of paratuberculosis 9
environmental samples showed a similar probabilityof detecting a MAP-positive herd compared to a setof five samples.
If this easy-to-use approach were to be applied as afirst diagnostic step in a control programme, it wouldallow the detection of those herds that need to im-plement control measures as soon as possible becausethey are likely to have a relevant number of MAPshedders. This may advance the implementation ofcontrol measures and the entry into a paratuberculosiscontrol programme to reduce the spread of the diseasewithin the herd. On the other hand, our results showthat environmental sampling is not an adequate diag-nostic approach to detect MAP-positive dairy herdswith a WHPapp of less than ∼3%. Individual testingis still needed for the detection of herds with a verylow WHPapp as well as for control measures withina herd (e.g. specific hygienic measures, separationand culling of shedders). Further research is requiredfor the use of repeated environmental sampling tomonitor certified herds in order to detect a re-introduction of the infectious agent.
ACKNOWLEDGEMENTS
The present study was a part of the ‘Paratuberculosiscontrol programme in Thuringian dairy herds’ of theThuringian Ministry of Social Welfare and Health,which is financed by the Thuringian Animal DiseaseCompensation Fund. The work was supportedby ‘Landesvereinigung Thüringer Milch e.V.’. Theauthors thank Ute Schau and her team for performingthe faecal culture and Felix Häsler, Life TechnologiesGmbH, for the technical support concerning qPCR.
DECLARATION OF INTEREST
None.
REFERENCES
1. Tiwari A, et al. Johne’s disease in Canada Part I: clinicalsymptoms, pathophysiology, diagnosis, and prevalencein dairy herds. Canadian Veterinary Journal 2006; 47:874–882.
2. Whitlock RH, Hutchinson LT, Merkal RS. Prevalenceand economic consideration of Johne’s disease in thenortheastern U.S. Proceedings of the United StatesAnimal Health Association 1985; 89: 484–490.
3. Raizman EA, et al. The association between cullingdue to clinical Johne’s disease or the detection ofMycobacterium avium subsp. paratuberculosis faecal
shedding and the diagnosis of clinical or subclinical dis-eases in two dairy herds in Minnesota, USA. PreventiveVeterinary Medicine 2007; 80: 166–178.
4. Smith RL, et al. Effect of Johne’s disease status on re-production and culling in dairy cattle. Journal ofDairy Science 2010; 93: 3513–3524.
5. Raizman EA, et al. The association between Mycobac-terium avium subsp. paratuberculosis faecal sheddingor clinical Johne’s disease and lactation performanceon two Minnesota, USA dairy farms. Preventive Veter-inary Medicine 2007; 78: 179–195.
6. Beaudeau F, et al. Reduction in milk yield associatedwith Mycobacterium avium subspecies paratuberculosis(MAP) infection in dairy cows. Veterinary Research2008; 38: 625–634.
7. Raizman EA, Fetrow JP, Wells SJ. Loss of income fromcows shedding Mycobacterium avium subspecies paratu-berculosis prior to calving compared with cows notshedding the organism on two Minnesota dairy farms.Journal of Dairy Science 2009; 92: 4929–4936.
8. Smith RL, et al. A longitudinal study on the impact ofJohne’s disease status on milk production in individualcows. Journal of Dairy Science 2009; 92: 2653–2661.
9. Sweeney RW, et al. Paratuberculosis (Johne’s disease)in cattle and other susceptible species. Journal ofVeterinary Internal Medicine 2012; 26: 1239–1250.
10. Over K, et al. Current perspectives on Mycobacteriumavium subsp. paratuberculosis, Johne’s disease, andCrohn’s disease: a review. Critical Reviews in Micro-biology 2011; 37: 141–156.
11. Antognoli MC, et al. Characterization of Mycobacter-ium avium subspecies paratuberculosis disseminatedinfection in dairy cattle and its association with ante-mortem test results. Veterinary Microbiology 2008;127: 300–308.
12. Ayele WY, Machackova M, Pavlik I. The transmissionand impact of paratuberculosis infection in domesticand wild ruminants. Veterinary Medicine Czech 2001;46: 205–224.
13. Vialard J, et al. Detection of bovine paratuberculosis byculture of pooled faeces [in French]. Revue de MédecineVéterinaire 1993; 144: 527–533.
14. Donat K, et al. Herd prevalence studies of Myco-bacterium avium ssp. paratuberculosis (MAP) in cattleusing serological tests: opportunities, limitations andcosts [in German]. Berliner und Münchner TierärztlicheWochenschrift 2012; 125: 10–19.
15. Raizman EA, et al. The distribution of Mycobacteriumavium ssp. paratuberculosis in the environment sur-rounding Minnesota dairy farms. Journal of DairyScience 2004; 87: 2959–2966.
16. Berghaus RD, et al. Use of age and milk productiondata to improve the ability of enzyme-linked immuno-sorbent assay test results to predict Mycobacteriumavium ssp. paratuberculosis faecal culture status.Journal of Dairy Science 2006; 89: 963–970.
17. Lombard JE, et al. Evaluation of environmental sam-pling and culture to determine Mycobacterium aviumsubspecies paratuberculosis distribution and herd
10 K. Donat and others

infection status on US dairy operations. Journal ofDairy Science 2006; 89: 4163–4171.
18. Lovel R, Levi M, Francis J. Studies on the survival ofJohne’s bacilli. Journal of Comparative Pathology1944; 54: 120–129.
19. Jørgensen JB. Survival of Mycobacterium paratubercu-losis in slurry. Nordisk veterinaermedicin 1977, 29:267–270.
20. Gumber S, Whittington RJ. Analysis of the growthpattern, survival and proteome of Mycobacteriumavium subsp. paratuberculosis following exposure toheat. Veterinary Microbiology 2009; 136: 82–90.
21. Pillars RB, et al. Prevalence of Michigan dairyherds infected with Mycobacterium avium subspeciesparatuberculosis as determined by environmental sam-pling. Canadian Veterinary Journal 2009; 50: 1039–1046.
22. Donat K, Schau U, Soschinka A. Identification ofMycobacterium avium ssp. paratuberculosis infecteddairy herds by environmental sampling [in German].Berliner und Münchner Tierärztliche Wochenschrift2011; 124: 10–17.
23. Lombard JE, et al. Herd-level prevalence of Myco-bacterium avium subsp. paratuberculosis infection inUnited States dairy herds in 2007. Preventive VeterinaryMedicine 2013; 108: 234–238.
24. Lavers CJ, et al. Evaluation of environmental faecalculture for Mycobacterium avium subspecies paratuber-culosis detection in dairy herds and association with ap-parent within-herd prevalence. Canadian VeterinaryJournal 2013; 54: 1053–1060.
25. Smith RL, et al. Environmental contamination withMycobacterium avium subsp. paratuberculosis in en-demically infected dairy herds. Preventive VeterinaryMedicine 2011; 102: 1–9.
26. McKenna SL, et al. Johne’s disease in Canada part II:disease impact, risk factors, and control programs fordairy producers. Canadian Veterinary Journal 2006;47: 1089–1099.
27. Möbius P, et al. Comparison of 13 single-round and nestedPCR assays targeting IS900, ISMav2, f57 and locus 255for detection of Mycobacterium avium subsp. paratubercu-losis. Veterinary Microbiology 2008; 126: 324–33.
28. Pozzato N, et al. Evaluation of a rapid and inexpensiveliquid culture system for the detection ofMycobacteriumavium subsp. paratuberculosis in bovine faeces. Journalof Microbiological Methods 2011; 84: 413–417.
29. Englund S, et al. Single PCR and nested PCR with amimic molecule for detection of Mycobacterium aviumsubsp. paratuberculosis. Diagnostic Microbiology andInfectious Disease 1999; 33: 163–171.
30. Logar K, et al. Evaluation of combined high-efficiencyDNA extraction and real-time PCR for detection ofMycobacterium avium subsp. paratuberculosis in sub-clinically infected dairy cattle: comparison with faecalculture, milk real-time PCR and milk ELISA. BMCVeterinary Research 2012; 8: 49.
31. Rommel A. New diagnostic tool for detection of Johne’sdisease [in German]. Tierärztliche Umschau 2012; 67:257–259.
32. Aly SS, et al. Correlation between Herrold egg yolkmedium culture and real-time quantitative polymerasechain reaction results for Mycobacterium avium subspe-cies paratuberculosis in pooled faecal and environmentalsamples. Journal of Veterinary Diagnostic Investigation2010; 22: 677–683.
33. Friedrich-Loeffler-Institut (FLI) Federal Research In-stitute for Animal Health. Amtliche MethodensammlungStand: April 2012 (http://www.fli.bund.de/fileadmin/dam_uploads/Publikationen/Amtliche_Methodensammlung/Methodensammlung_201204.pdf). Assessed 15 August2013.
34. Dixon WJ (ed.). BMDP Statistical Software Manual,Volumes I and II. Berkeley, Los Angeles, London:University of California Press, 1993, pp. 775–794 and1105–1144.
35. Whittington RJ, Sergeant ES. Progress towards under-standing the spread, detection and control of Myco-bacterium avium subsp. paratuberculosis in animalpopulations. Australian Veterinary Journal 2001; 79:267–278.
36. Dressel J.Direct detection ofMycobacterium avium spp.paratuberculosis in bovine faeces – a comparative study(diploma thesis). Zwickau, Germany: HochschuleFresenius University of Applied Sciences, 2012, 71 pp.
37. United States Department of Agriculture (USDA).Animal and Plant Health Inspection Service, UniformProgram Standards for the Voluntary Bovine Johne’sDisease Control Program, effective 1 September 2010(http://www.aphis.usda.gov/animal_health/animal_diseases/johnes/downloads/johnes-ups.pdf). Assessed 27February 2014.
38. Raizman EA, et al. Estimated within-herd prevalence(WHP) of Mycobacterium avium subsp. paratuberculosisin a sample of Minnesota dairy herds using bacterialculture of pooled faecal samples. Canadian Journal ofVeterinary Research 2011; 75: 112–116.
39. Köhler H, et al. Evaluation of five ELISA test kits forthe measurement of antibodies against Mycobacteriumavium subspecies paratuberculosis in bovine serum.Berliner und Münchner Tierärztliche Wochenschrift2008; 121: 203–210.
Herd level diagnosis of paratuberculosis 11