
Detection of Lubrication State in a Field Operational Wind ...
22
lubricants Article Detection of Lubrication State in a Field Operational Wind Turbine Gearbox Bearing Using Ultrasonic Reflectometry G. Nicholas *, B. P. Clarke and R. S. Dwyer-Joyce Citation: Nicholas, G.; Clarke, B.P.; Dwyer-Joyce, R.S. Detection of Lubrication State in a Field Operational Wind Turbine Gearbox Bearing Using Ultrasonic Reflectometry. Lubricants 2021, 9, 6. https://doi.org/10.3390/lubricants9 010006 Received: 19 November 2020 Accepted: 4 January 2021 Published: 6 January 2021 Publisher’s Note: MDPI stays neu- tral with regard to jurisdictional clai- ms in published maps and institutio- nal affiliations. Copyright: © 2021 by the authors. Li- censee MDPI, Basel, Switzerland. This article is an open access article distributed under the terms and con- ditions of the Creative Commons At- tribution (CC BY) license (https:// creativecommons.org/licenses/by/ 4.0/). Leonardo Centre for Tribology, Department of Mechanical Engineering, The University of Sheffield, Sheffield S1 3JD, UK; bclarke2@sheffield.ac.uk (B.P.C.); r.dwyer-joyce@sheffield.ac.uk (R.S.D.-J.) * Correspondence: gnicholas1@sheffield.ac.uk Abstract: Fully flooded lubrication is the ideal state for a rolling bearing; this is especially true in the aggressive environment of a wind turbine transmission where bearings are subject to intermittent operation and highly variable loading. In this paper, a novel ultrasonic reflection method is used to detect the presence of oil between rollers in the bearing. Ultrasonic sensors were instrumented on the static inner (lab) and outer (field) bearing raceways and reflections were captured as the rollers travelled past the sensor. The proportion of the sound wave reflected (known as the reflection coefficient, R) is dependent on the acoustic mismatch of the materials either side of the interface. Changes in R indicate either a steel–air or steel–oil interface as R values transitioned from 1 to 0.95, respectively, and even lower for a steel–roller interface. Consequently, it was possible to detect the presence of lubricant on the raceway between roller passes. From the laboratory measurements, the recurring reflection coefficient patterns between roller passes were used to identify the lubrication condition of the raceway. An absence of these patterns between roller passes indicated the absence of lubricant on the bearing surface. For the field measurements, three bearing lubrication conditions (partial, insufficient, and fully lubricated) were observed. Partially and insufficiently lubricated datasets were found to occur mostly during transient operation. As transient operation is often accompanied by overloading and torque reversals, coupled with the lubrication issues, these all act to increase the risk of premature bearing failure. Keywords: wind turbine; bearing lubrication monitoring; in-situ measurement; ultrasound; rolling el- ement bearings 1. Introduction Wind turbine (WT) gearboxes rarely achieve their 20-year design life and often fail prematurely [1]. Despite a moderate failure rate, these failures can be catastrophic as they incur the costliest repairs [2,3] and result in the longest turbine downtime [4], which also add to losses for the operator as a result of reduced electricity output. Multiple failure modes exist for the gearbox, with most of these associated with bearing degradation [2,5], concentrated specifically at the high-speed shaft (HSS) stage [2]. Lubrication failure was identified as one of the typical faults in wind turbine bearings [2,6–8]. As such, monitor- ing of bearing lubrication is crucial for better understanding of lubrication failures with the aim of scheduling effective preventive maintenance in the hopes of improving the reliability of gearbox bearings. A bearing experiences various lubrication regimes during operation which is dictated by the lubricant viscosity, η, the bearing rotational speed, ω, and the nominal bearing pressure, p. The transient kinematics of the roller and raceway (rolling, sliding) were also found to influence the film thickness, friction, and subsequently its lubrication regime [9]. Figure 1 illustrates these lubrication regimes and their respective frictional coefficient, with the elasto-hydrodynamic lubrication (EHL) region highlighted in blue. The lambda ratio (Λ), which is the ratio between the minimum film thickness, h min , and the root mean Lubricants 2021, 9, 6. https://doi.org/10.3390/lubricants9010006 https://www.mdpi.com/journal/lubricants
-
Upload
khangminh22 -
Category
Documents
-
view
4 -
download
0
Transcript of Detection of Lubrication State in a Field Operational Wind ...
lubricants
Article
Detection of Lubrication State in a Field Operational WindTurbine Gearbox Bearing Using Ultrasonic Reflectometry
G. Nicholas *, B. P. Clarke and R. S. Dwyer-Joyce
�����������������
Citation: Nicholas, G.; Clarke, B.P.;
Dwyer-Joyce, R.S. Detection of
Lubrication State in a Field
Operational Wind Turbine Gearbox
Bearing Using Ultrasonic
Reflectometry. Lubricants 2021, 9, 6.
https://doi.org/10.3390/lubricants9
010006
Received: 19 November 2020
Accepted: 4 January 2021
Published: 6 January 2021
Publisher’s Note: MDPI stays neu-
tral with regard to jurisdictional clai-
ms in published maps and institutio-
nal affiliations.
Copyright: © 2021 by the authors. Li-
censee MDPI, Basel, Switzerland.
This article is an open access article
distributed under the terms and con-
ditions of the Creative Commons At-
tribution (CC BY) license (https://
creativecommons.org/licenses/by/
4.0/).
Leonardo Centre for Tribology, Department of Mechanical Engineering, The University of Sheffield,Sheffield S1 3JD, UK; [email protected] (B.P.C.); [email protected] (R.S.D.-J.)* Correspondence: [email protected]
Abstract: Fully flooded lubrication is the ideal state for a rolling bearing; this is especially true in theaggressive environment of a wind turbine transmission where bearings are subject to intermittentoperation and highly variable loading. In this paper, a novel ultrasonic reflection method is usedto detect the presence of oil between rollers in the bearing. Ultrasonic sensors were instrumentedon the static inner (lab) and outer (field) bearing raceways and reflections were captured as therollers travelled past the sensor. The proportion of the sound wave reflected (known as the reflectioncoefficient, R) is dependent on the acoustic mismatch of the materials either side of the interface.Changes in R indicate either a steel–air or steel–oil interface as R values transitioned from 1 to 0.95,respectively, and even lower for a steel–roller interface. Consequently, it was possible to detect thepresence of lubricant on the raceway between roller passes. From the laboratory measurements,the recurring reflection coefficient patterns between roller passes were used to identify the lubricationcondition of the raceway. An absence of these patterns between roller passes indicated the absence oflubricant on the bearing surface. For the field measurements, three bearing lubrication conditions(partial, insufficient, and fully lubricated) were observed. Partially and insufficiently lubricateddatasets were found to occur mostly during transient operation. As transient operation is oftenaccompanied by overloading and torque reversals, coupled with the lubrication issues, these all actto increase the risk of premature bearing failure.
Keywords: wind turbine; bearing lubrication monitoring; in-situ measurement; ultrasound; rolling el-ement bearings
1. Introduction
Wind turbine (WT) gearboxes rarely achieve their 20-year design life and often failprematurely [1]. Despite a moderate failure rate, these failures can be catastrophic as theyincur the costliest repairs [2,3] and result in the longest turbine downtime [4], which alsoadd to losses for the operator as a result of reduced electricity output. Multiple failuremodes exist for the gearbox, with most of these associated with bearing degradation [2,5],concentrated specifically at the high-speed shaft (HSS) stage [2]. Lubrication failure wasidentified as one of the typical faults in wind turbine bearings [2,6–8]. As such, monitor-ing of bearing lubrication is crucial for better understanding of lubrication failures withthe aim of scheduling effective preventive maintenance in the hopes of improving thereliability of gearbox bearings.
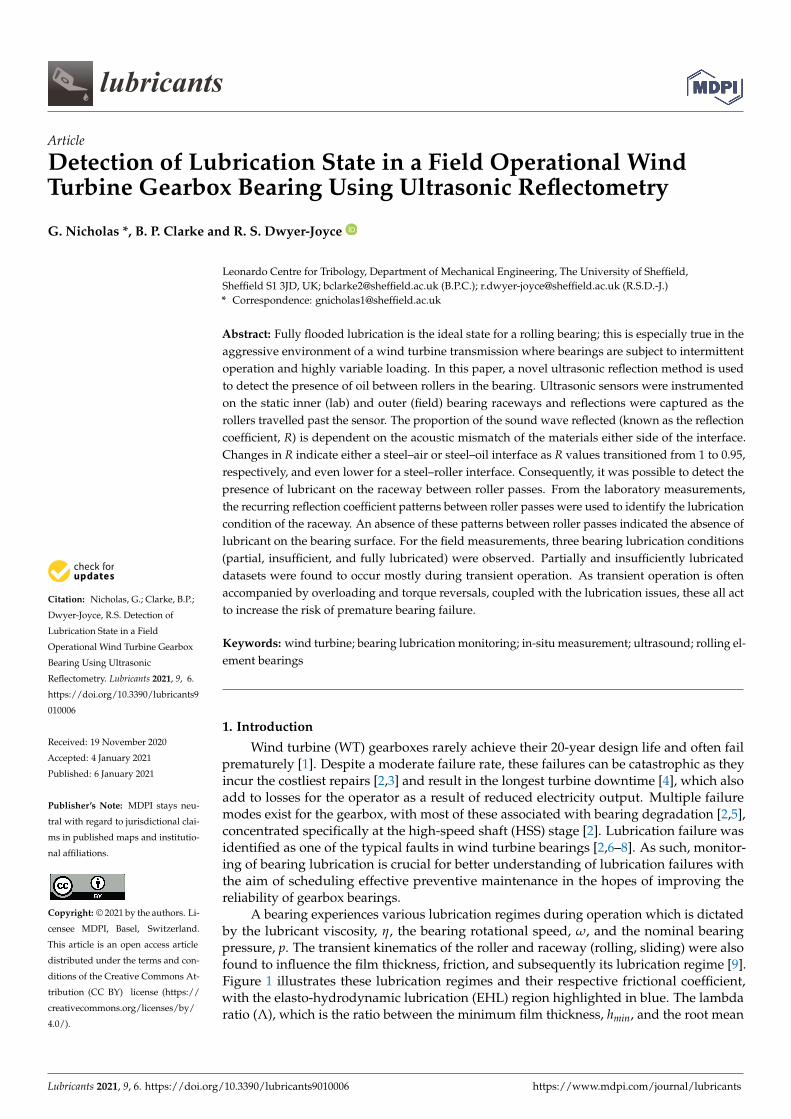
A bearing experiences various lubrication regimes during operation which is dictatedby the lubricant viscosity, η, the bearing rotational speed, ω, and the nominal bearingpressure, p. The transient kinematics of the roller and raceway (rolling, sliding) were alsofound to influence the film thickness, friction, and subsequently its lubrication regime [9].Figure 1 illustrates these lubrication regimes and their respective frictional coefficient,with the elasto-hydrodynamic lubrication (EHL) region highlighted in blue. The lambdaratio (Λ), which is the ratio between the minimum film thickness, hmin, and the root mean
Lubricants 2021, 9, 6. https://doi.org/10.3390/lubricants9010006 https://www.mdpi.com/journal/lubricants
Lubricants 2021, 9, 6 2 of 22
square (rms) roughness of the two sliding surfaces, Rq, for each lubrication regime was alsoincluded. During start-up, bearing operates within boundary lubrication, where Λ valuesare less than unity and majority of the load is supported by the asperities in contact,thus resulting in high friction. The frictional coefficient is dependent upon the pair ofmaterials under contact; a polyamide-steel pair would have less friction (CB route) than asteel-steel pair (DB route). With increasing rotational speed, the bearing subsequently entersmixed lubrication, where regions of both asperity–asperity contacts and full separationexist. The minimum frictional coefficient point where viscous shear forces is low and filmseparation is sufficient exists within this regime. The EHL regime is situated betweenmixed and hydrodynamic lubrication, where surface deformation and increase in lubricantviscosity [10,11] enable full film separation. This is what rolling element bearings operatewithin, ideally under fully flooded EHL. Calculations exist which allow for prediction ofstarved or fully flooded EHL regimes [12–14]. Failure in lubrication including insufficientlubrication, over lubrication, contaminated lubricant, and poor selection of lubricant allhave adverse consequences and result in premature bearing failure [15–17].
Lubricants 2021, 9, x FOR PEER REVIEW 2 of 23
square (rms) roughness of the two sliding surfaces, Rq, for each lubrication regime was also included. During start-up, bearing operates within boundary lubrication, where Λ values are less than unity and majority of the load is supported by the asperities in contact, thus resulting in high friction. The frictional coefficient is dependent upon the pair of ma-terials under contact; a polyamide-steel pair would have less friction (CB route) than a steel-steel pair (DB route). With increasing rotational speed, the bearing subsequently en-ters mixed lubrication, where regions of both asperity–asperity contacts and full separa-tion exist. The minimum frictional coefficient point where viscous shear forces is low and film separation is sufficient exists within this regime. The EHL regime is situated between mixed and hydrodynamic lubrication, where surface deformation and increase in lubri-cant viscosity [10,11] enable full film separation. This is what rolling element bearings operate within, ideally under fully flooded EHL. Calculations exist which allow for pre-diction of starved or fully flooded EHL regimes [12–14]. Failure in lubrication including insufficient lubrication, over lubrication, contaminated lubricant, and poor selection of lubricant all have adverse consequences and result in premature bearing failure [15–17].
Figure 1. Stribeck curve with a highlighted elasto-hydrodynamic lubrication (EHL) region where the rolling element bear-ing operates within (adapted from [10]).
Lubrication of gearbox bearings is not monitored in field applications and most methods for measuring bearing lubricant film thickness are restricted to laboratory con-ditions [18–20]. Instead, most operators prefer to monitor the lubricant condition through oil analysis. This is done through manual oil sampling, typically carried out in a period of six months or one year. Automated oil condition monitoring exists but is costly [21]. Lub-ricant properties such as viscosity, moisture, and debris content, as well as additive levels allow for evaluation of the oil condition and localization of potential components under-going wear. This, however, contains minimal information regarding the bearing condition [2].
Measurement of lubricant film thickness for hydrodynamic bearings can be carried out through methods such as electrical capacitance [19], conductivity [20], and ultrasound [21]. These methods, however, differ based on their ability for in-situ application, with the capability of ultrasound demonstrated on a piston-ring liner [22]. For bearings operating
Figure 1. Stribeck curve with a highlighted elasto-hydrodynamic lubrication (EHL) region where the rolling element bearingoperates within (adapted from [10]).
Lubrication of gearbox bearings is not monitored in field applications and mostmethods for measuring bearing lubricant film thickness are restricted to laboratory condi-tions [18–20]. Instead, most operators prefer to monitor the lubricant condition throughoil analysis. This is done through manual oil sampling, typically carried out in a periodof six months or one year. Automated oil condition monitoring exists but is costly [21].Lubricant properties such as viscosity, moisture, and debris content, as well as additivelevels allow for evaluation of the oil condition and localization of potential componentsundergoing wear. This, however, contains minimal information regarding the bearingcondition [2].
Measurement of lubricant film thickness for hydrodynamic bearings can be carried outthrough methods such as electrical capacitance [19], conductivity [20], and ultrasound [21].These methods, however, differ based on their ability for in-situ application, with thecapability of ultrasound demonstrated on a piston-ring liner [22]. For bearings operating inEHL, few methods exist. Among which includes optical interferometry [18] and ultrasonic

Lubricants 2021, 9, 6 3 of 22
techniques [23,24]. Optical interferometry, although excellent under laboratory conditions,is limited to such applications as it requires a transparent window where light is ableto shine onto the lubricated contact. Ultrasonic methods can be employed on the realunmodified components. However, one limitation is that the sensor size is relatively large(of the order of 1 mm and upwards). This means that to measure the oil film that formsin a small-sized EHL contact, focusing of the beam is necessary. This has been conductedsuccessfully in laboratory studies [25–29], but the need for a liquid-coupled focusing bathrenders the approach unsuitable for field applications. Since the purpose of this work is tostudy bearings under field conditions, simpler bonded-on sensors were used. These comewith the limitation of poor spatial resolution. Whilst they cannot image the contact well,they can effectively be used to study the regions between roller passages.
The present approach is initially validated through measurements obtained from afull-scale laboratory cylindrical roller bearing (CRB) test rig and trends within the mea-surements correlated with bearing operating parameters (load and speed) and lubricantviscosity. This is followed by analysis of data from a field operational HSS gearbox bearingfrom a Vestas V42 600 kW wind turbine. Ultrasonic trends within a single dataset from thelatter field operational bearing were previously presented in [30] to explore the detectableconditions of bearing load and lubrication. In this work, the full range of data covering awide range of turbine operating conditions has been examined to establish how bearinglubrication is affected.
2. Measurement Methodology
The measurement concept is shown schematically in Figure 2. An ultrasonic sensor isbonded onto the raceway outer bore. The sensor emits sound waves that travel throughthe raceway to the contact surface. Depending on body the wave meets at the surface (steel,air, or oil), some proportion of the wave amplitude is reflected back to the same sensor.
Lubricants 2021, 9, x FOR PEER REVIEW 3 of 23
in EHL, few methods exist. Among which includes optical interferometry [18] and ultra-sonic techniques [23,24]. Optical interferometry, although excellent under laboratory con-ditions, is limited to such applications as it requires a transparent window where light is able to shine onto the lubricated contact. Ultrasonic methods can be employed on the real unmodified components. However, one limitation is that the sensor size is relatively large (of the order of 1 mm and upwards). This means that to measure the oil film that forms in a small-sized EHL contact, focusing of the beam is necessary. This has been conducted successfully in laboratory studies [25–29], but the need for a liquid-coupled focusing bath renders the approach unsuitable for field applications. Since the purpose of this work is to study bearings under field conditions, simpler bonded-on sensors were used. These come with the limitation of poor spatial resolution. Whilst they cannot image the contact well, they can effectively be used to study the regions between roller passages.
The present approach is initially validated through measurements obtained from a full-scale laboratory cylindrical roller bearing (CRB) test rig and trends within the meas-urements correlated with bearing operating parameters (load and speed) and lubricant viscosity. This is followed by analysis of data from a field operational HSS gearbox bear-ing from a Vestas V42 600 kW wind turbine. Ultrasonic trends within a single dataset from the latter field operational bearing were previously presented in [30] to explore the detect-able conditions of bearing load and lubrication. In this work, the full range of data cover-ing a wide range of turbine operating conditions has been examined to establish how bearing lubrication is affected.
2. Measurement Methodology The measurement concept is shown schematically in Figure 2. An ultrasonic sensor
is bonded onto the raceway outer bore. The sensor emits sound waves that travel through the raceway to the contact surface. Depending on body the wave meets at the surface (steel, air, or oil), some proportion of the wave amplitude is reflected back to the same sensor.
Figure 2. Ultrasonic reflections from (a) steel–steel interface, (b) steel–oil–steel interface, (c) steel–air interface, and (d) steel–oil interface. Figure 2. Ultrasonic reflections from (a) steel–steel interface, (b) steel–oil–steel interface, (c) steel–air interface, and (d) steel–oil interface.

Lubricants 2021, 9, 6 4 of 22
The proportion of the wave reflected to the transmitted wave depends on the acousticsimilarity of the materials between the interface and is quantified through the reflectioncoefficient, R. This is given by Equation (1), where c and ρ denotes the sound speedand density and subscripts 1 and 2 refer to the materials either side of the interface.The calculated reflection coefficient values for each interface are included in Figure 2.
R =z2 − z1
z2 + z1, z = ρc (1)
For two identical materials perfectly bonded, where there exists no air gap betweenthem, all of the ultrasonic wave will be transmitted across the interface (Figure 2a). Conse-quently, the reflection coefficient, R, will be zero. This case is practically impossible as therewill always be some rough surface effects or thin surface contaminating layers. On theother hand, if the acoustic mismatch between the two materials is high, i.e., steel and air(Figure 2c), most of the ultrasonic wave will be reflected back and R will tend to unity.For a steel and free surface lubricant interface, existing between instances of roller pass asillustrated in Figure 2d, only around 5% of the ultrasonic energy is lost into the lubricantand the reflection coefficient would be 0.95.
Figure 2b depicts a thin lubricant film between two bodies, analogous to the oil filmpresent at the roller-raceway interface. Reflections occur at both interfaces of the lubricantfilm. For lubricant films greater than around 40 µm, time-of-flight and film resonance [31]can be utilized to compute the film thickness. For oil film less than around 20 µm, the re-flections superimpose and thus cannot be distinguished. In this case, multiple methodsexist for measurement of lubricant film thickness [27,32–34], of which the spring model isdescribed in detail. The spring model [32] treats the lubricant film as a distributed springwith stiffness, K. Consequently, the reflection coefficient, R will be dependent upon thestiffness by:
R =z1 − z2 + iω f
( z1z2K)
z1 + z2 + iω f( z1z2
K) , K =
Bh
(2)
where B and h are the oil film bulk modulus and oil film thickness, respectively, and ωf isthe angular frequency of the ultrasonic sensor (ωf = 2πf). Through substituting K into Rand rearranging for oil film thickness, h this yielded:
h =ρc2
ω f z1z2
√√√√ |R|2(z1 + z2)2 − (z1 − z2)
2
1− |R|2(3)
Measurements of lubricant film thickness in rolling element bearings under elastohy-drodynamic lubrication through ultrasonic reflectometry have been successfully conductedpreviously [24–29]. As a result of the small contact area of the raceway and rolling element,focusing of the ultrasonic waves is required to ensure that the ultrasonic beam falls withinthe contact dimensions. This necessitates considerable modifications to the raceway toaccommodate the use of a concave lens within a water bath. As such, this is currentlynot practical for field application. Moreover, bearings in a wind turbine operate underlow rotational speed, which results in operation within the boundary or mixed lubricationregime. The presence of a mixture of steel–steel and steel–oil asperity contacts within theinterface results in non-meaningful film measurements [35].
Consequently, in this work the reflection coefficient was not converted directly intofilm thickness. Instead, an alternate approach for assessing bearing lubrication is used.Measurements between roller passes were used to deduce the lubrication condition of theraceway at the inlet and outlet regions of a roller pass. This was subsequently used todeduce whether sufficient lubrication is present.
Lubricants 2021, 9, 6 5 of 22
3. Instrumentation and Methodology3.1. Full Scale Cylindrical Roller Bearing Test Rig
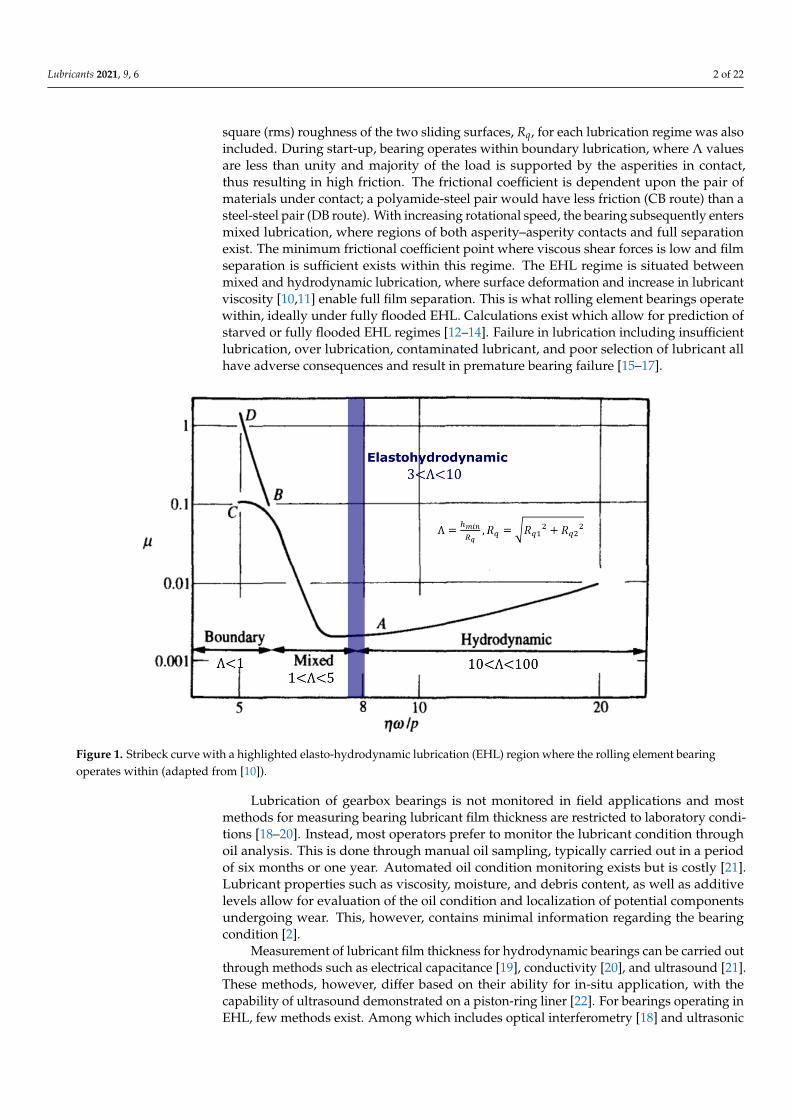
Figure 3 shows a schematic and photograph of the bearing test rig. The rig waspurposed designed and built by Ricardo plc for testing of wind turbine planetary gearboxbearings. The rig is capable of rotational speeds between 20 and 100 RPM with an appliedbearing radial load ranging from 0 to 1500 kN. The test bearing inner raceway (NU2244)was held stationary on the instrumentation sleeve which sits at the center of the rig. Its outerraceway and cage assembly was fitted onto the pulley wheels’ assembly and was rotated.The rotational motion was created through a motor and pulley belts assembly. Radial loadwas provided by a hydraulic actuator located at the base of the rig. The hydraulic actuatoris connected to the static shaft, which sits centrally within the instrumentation sleeve,through two load arms. As the actuator is initialized, the load arms are pulled downwhich in turn pull the shaft downwards, applying load onto the instrumented static innerraceway. Load cells installed on both sides of the loading arms provide a measure of theapplied load.
Lubricants 2021, 9, x FOR PEER REVIEW 5 of 23
Figure 3 shows a schematic and photograph of the bearing test rig. The rig was pur-posed designed and built by Ricardo plc for testing of wind turbine planetary gearbox bearings. The rig is capable of rotational speeds between 20 and 100 RPM with an applied bearing radial load ranging from 0 to 1500 kN. The test bearing inner raceway (NU2244) was held stationary on the instrumentation sleeve which sits at the center of the rig. Its outer raceway and cage assembly was fitted onto the pulley wheels’ assembly and was rotated. The rotational motion was created through a motor and pulley belts assembly. Radial load was provided by a hydraulic actuator located at the base of the rig. The hy-draulic actuator is connected to the static shaft, which sits centrally within the instrumen-tation sleeve, through two load arms. As the actuator is initialized, the load arms are pulled down which in turn pull the shaft downwards, applying load onto the instru-mented static inner raceway. Load cells installed on both sides of the loading arms provide a measure of the applied load.
Figure 3. (a) Schematic diagram and (b) photo of the front side of the assembled full-scale cylindrical roller bearing test rig.
A Hall effect sensor was installed to measure the bearing rotational speed during testing. Lubricant was supplied to the inner raceway test bearing through an assembly of lubrication hoses and pump (not visible in Figure 3). The lubricant was pumped through a 25-micron filter into a cooling radiator before lubricating the bearings through a single inlet port at a radius of 140 mm from the bearing center axis and 60° from the bearing bottom-dead-center (BDC), located on the back side of the rig. A pressure transducer ex-ists at the inlet port to ensure the lubricant is supplied to the rig during testing. Two outlet ports are located at the front and back side of the rig to draw lubricant back to the reser-voir. The rotational speed, load and lubrication of the bearing were all controlled through a LabVIEW interface.
3.2. Wind Turbine High-Speed Shaft Gearbox Bearing Field Test A HSS gearbox bearing of a Vestas V42 600 kW WT was instrumented with ultrasonic
sensors. The turbine was one of several in the Barnesmore wind farm in Donegal, Ireland, and selected due to its exposure to the harshest wind conditions and consequently higher propensity for failure. The instrumented wind turbine has a Hansen EH55G21S-BN-50 3-stage planetary gearbox with a gear ratio of 1:50 and maximum HSS speed of 1550 RPM. As explained in [30], bearing instrumentation was conducted alongside a scheduled gear-box maintenance which necessitates its removal and transportation off-site, allowing ac-cess to the HSS bearing.
The instrumented HSS bearing was a 32222 Tapered Roller bearing consisting of 20 rollers. Figure 4 illustrates the position of the bearing, marked as B within the gearbox. The bearing was selected as it was believed to be the higher loaded of the two Tapered
Figure 3. (a) Schematic diagram and (b) photo of the front side of the assembled full-scale cylindrical roller bearing test rig.
A Hall effect sensor was installed to measure the bearing rotational speed duringtesting. Lubricant was supplied to the inner raceway test bearing through an assembly oflubrication hoses and pump (not visible in Figure 3). The lubricant was pumped througha 25-micron filter into a cooling radiator before lubricating the bearings through a singleinlet port at a radius of 140 mm from the bearing center axis and 60◦ from the bearingbottom-dead-center (BDC), located on the back side of the rig. A pressure transducer existsat the inlet port to ensure the lubricant is supplied to the rig during testing. Two outletports are located at the front and back side of the rig to draw lubricant back to the reservoir.The rotational speed, load and lubrication of the bearing were all controlled through aLabVIEW interface.
3.2. Wind Turbine High-Speed Shaft Gearbox Bearing Field Test
A HSS gearbox bearing of a Vestas V42 600 kW WT was instrumented with ultrasonicsensors. The turbine was one of several in the Barnesmore wind farm in Donegal, Ireland,and selected due to its exposure to the harshest wind conditions and consequently higherpropensity for failure. The instrumented wind turbine has a Hansen EH55G21S-BN-503-stage planetary gearbox with a gear ratio of 1:50 and maximum HSS speed of 1550 RPM.As explained in [30], bearing instrumentation was conducted alongside a scheduled gear-box maintenance which necessitates its removal and transportation off-site, allowing accessto the HSS bearing.

Lubricants 2021, 9, 6 6 of 22
The instrumented HSS bearing was a 32222 Tapered Roller bearing consisting of20 rollers. Figure 4 illustrates the position of the bearing, marked as B within the gearbox.The bearing was selected as it was believed to be the higher loaded of the two TaperedRoller Bearings (TRBs). All the bearings within the gearbox were lubricated using VG320gear oil from the same source.
Lubricants 2021, 9, x FOR PEER REVIEW 6 of 23
Roller Bearings (TRBs). All the bearings within the gearbox were lubricated using VG320 gear oil from the same source.
Figure 4. High-speed shaft bearing configuration (adapted from [36]).
The pump which supplies lubricant to the gearbox bearings operates proportionally with the turbine shaft speed; more lubricant is pumped when the shaft speed is high and vice versa. As the turbine is operating, the lubrication system pumps lubricant through a single feed into the top of the gearbox. The lubricant then flows down through passive channels designed into the casing to ensure passage of lubricant to the gears and bearings. As a consequence, the volume flow of lubricant entering the gear and bearing components is not defined.
3.3. Sensor Instrumentation and Data Acquisition This section describes the procedure taken to bond the ultrasonic sensors onto the
two bearing raceways and the hardware to generate, acquire and digitize the ultrasonic measurements. Figure 5 shows an overview of the sensor instrumentation process imple-mented on both the cylindrical and tapered roller bearing.
Figure 5. Ultrasonic instrumentation process where a) bare piezo ceramic elements were trimmed into strips and bonded onto (a,b) NU2244 cylindrical roller bearing (CRB) and (c) 32222 TRB.
In this study, for both full-scale laboratory and field applications, bare 10 MHz piezo-ceramic elements of longitudinal polarization were used for ultrasonic wave generation and receiving. These piezo-ceramic elements, shown in Figure 5a, were supplied in a cir-cular shape with a diameter of 7.1 mm and a thickness of 0.2 mm. They were subsequently trimmed into rectangular strips of 5 mm × 1 mm to increase their spatial resolution
Figure 4. High-speed shaft bearing configuration (adapted from [36]).
The pump which supplies lubricant to the gearbox bearings operates proportionallywith the turbine shaft speed; more lubricant is pumped when the shaft speed is high andvice versa. As the turbine is operating, the lubrication system pumps lubricant througha single feed into the top of the gearbox. The lubricant then flows down through passivechannels designed into the casing to ensure passage of lubricant to the gears and bearings.As a consequence, the volume flow of lubricant entering the gear and bearing componentsis not defined.
3.3. Sensor Instrumentation and Data Acquisition
This section describes the procedure taken to bond the ultrasonic sensors onto the twobearing raceways and the hardware to generate, acquire and digitize the ultrasonic mea-surements. Figure 5 shows an overview of the sensor instrumentation process implementedon both the cylindrical and tapered roller bearing.
Lubricants 2021, 9, x FOR PEER REVIEW 6 of 23
Roller Bearings (TRBs). All the bearings within the gearbox were lubricated using VG320 gear oil from the same source.
Figure 4. High-speed shaft bearing configuration (adapted from [36]).
The pump which supplies lubricant to the gearbox bearings operates proportionally with the turbine shaft speed; more lubricant is pumped when the shaft speed is high and vice versa. As the turbine is operating, the lubrication system pumps lubricant through a single feed into the top of the gearbox. The lubricant then flows down through passive channels designed into the casing to ensure passage of lubricant to the gears and bearings. As a consequence, the volume flow of lubricant entering the gear and bearing components is not defined.
3.3. Sensor Instrumentation and Data Acquisition This section describes the procedure taken to bond the ultrasonic sensors onto the
two bearing raceways and the hardware to generate, acquire and digitize the ultrasonic measurements. Figure 5 shows an overview of the sensor instrumentation process imple-mented on both the cylindrical and tapered roller bearing.
Figure 5. Ultrasonic instrumentation process where a) bare piezo ceramic elements were trimmed into strips and bonded onto (a,b) NU2244 cylindrical roller bearing (CRB) and (c) 32222 TRB.
In this study, for both full-scale laboratory and field applications, bare 10 MHz piezo-ceramic elements of longitudinal polarization were used for ultrasonic wave generation and receiving. These piezo-ceramic elements, shown in Figure 5a, were supplied in a cir-cular shape with a diameter of 7.1 mm and a thickness of 0.2 mm. They were subsequently trimmed into rectangular strips of 5 mm × 1 mm to increase their spatial resolution
Figure 5. Ultrasonic instrumentation process where a) bare piezo ceramic elements were trimmed into strips and bondedonto (a,b) NU2244 cylindrical roller bearing (CRB) and (c) 32222 TRB.

Lubricants 2021, 9, 6 7 of 22
In this study, for both full-scale laboratory and field applications, bare 10 MHz piezo-ceramic elements of longitudinal polarization were used for ultrasonic wave generation andreceiving. These piezo-ceramic elements, shown in Figure 5a, were supplied in a circularshape with a diameter of 7.1 mm and a thickness of 0.2 mm. They were subsequentlytrimmed into rectangular strips of 5 mm × 1 mm to increase their spatial resolution(smaller sensors emit ultrasound over a smaller field). The trimmed rectangular stripswere subsequently bonded onto the raceway surface using a high-performance straingauge epoxy. Coaxial cables were soldered onto the terminals on the piezo elements and aprotective layer of epoxy was applied onto the piezo elements for added protection.
3.3.1. Full-Scale Cylindrical Roller Bearing
Figure 5b shows a photograph of the bonded sensor array on the inner raceway ofthe NU2244 CRB. The circumferential location of this array is shown in Figure 6a withrespect to the bearing loaded zone alongside the pulsing configuration used. An array of7 longitudinal and 7 shear sensors were bonded onto the inner bore of the inner raceway,directly at the center of the maximum loaded region. Only measurements obtained fromthe longitudinal sensors will be discussed here. The sensors were pulsed in pulse-echoconfiguration. To accommodate the sensors, a groove was machined onto the instrumenta-tion sleeve to which the raceway slides onto and is fastened in place. No machining wasrequired for the inner raceway as the sensors are directly incident with the roller-racewaycontact interface, as visible in Figure 5b.
Lubricants 2021, 9, x FOR PEER REVIEW 7 of 23
(smaller sensors emit ultrasound over a smaller field). The trimmed rectangular strips were subsequently bonded onto the raceway surface using a high-performance strain gauge epoxy. Coaxial cables were soldered onto the terminals on the piezo elements and a protective layer of epoxy was applied onto the piezo elements for added protection.
3.3.1. Full-Scale Cylindrical Roller Bearing Figure 5b shows a photograph of the bonded sensor array on the inner raceway of
the NU2244 CRB. The circumferential location of this array is shown in Figure 6a with respect to the bearing loaded zone alongside the pulsing configuration used. An array of 7 longitudinal and 7 shear sensors were bonded onto the inner bore of the inner raceway, directly at the center of the maximum loaded region. Only measurements obtained from the longitudinal sensors will be discussed here. The sensors were pulsed in pulse-echo configuration. To accommodate the sensors, a groove was machined onto the instrumen-tation sleeve to which the raceway slides onto and is fastened in place. No machining was required for the inner raceway as the sensors are directly incident with the roller-raceway contact interface, as visible in Figure 5b.
Figure 6. Schematic of sensor location and data acquisition hardware for the (a) full-scale CRB and (b) field high-speed shaft (HSS) gearbox TRB testing (adapted from [36]).
Due to the large number of sensors and cables present, a junction box was used to facilitate the connection between the cables and the PC-based data acquisition system. The data acquisition system consisted of an ultrasonic pulser and receiver and a digitizer, con-trolled through a LabVIEW interface. The ultrasonic pulser and receiver excites the piezo-electric sensor and receives the reflected waveforms which are subsequently digitized at 100 MHz and stored on the PC. A set of measurements over a duration of 10 s were taken across each of the 7 longitudinal sensors with a pulse repetition rate (PRR) of 70 kHz. Since the PRR is shared across all the 7 active channels, each sensor was pulsed at 10 kHz for 10 s durations.
Measurements were taken at bearing speeds from 20 to 100 RPM with 20 RPM incre-ment steps under constant load, and subsequently at 0–1000 kN with 100 kN increment steps under constant speed. This translated to 5 datasets of varying rotational speeds for
Figure 6. Schematic of sensor location and data acquisition hardware for the (a) full-scale CRB and(b) field high-speed shaft (HSS) gearbox TRB testing (adapted from [36]).
Due to the large number of sensors and cables present, a junction box was used tofacilitate the connection between the cables and the PC-based data acquisition system.The data acquisition system consisted of an ultrasonic pulser and receiver and a digitizer,controlled through a LabVIEW interface. The ultrasonic pulser and receiver excites thepiezoelectric sensor and receives the reflected waveforms which are subsequently digitizedat 100 MHz and stored on the PC. A set of measurements over a duration of 10 s were

Lubricants 2021, 9, 6 8 of 22
taken across each of the 7 longitudinal sensors with a pulse repetition rate (PRR) of 70 kHz.Since the PRR is shared across all the 7 active channels, each sensor was pulsed at 10 kHzfor 10 s durations.
Measurements were taken at bearing speeds from 20 to 100 RPM with 20 RPM incre-ment steps under constant load, and subsequently at 0–1000 kN with 100 kN incrementsteps under constant speed. This translated to 5 datasets of varying rotational speedsfor each load, which produced a total of 55 datasets. The testing was also repeated withand without lubricant. During the instances where lubricant was used, three differentviscosities of lubricant (VG32, VG150, and VG320) were tested. The maximum bearingload when testing under no lubrication was limited to short durations and 200 kN to avoidcatastrophic rig failure.
3.3.2. Field Tapered Roller Bearing
Figure 5c shows the positions of the piezo elements bonded onto the outer raceway ofthe 32222 TRB whilst Figure 6b illustrates their location with respect to the bearing loadedzone. The pulsing configuration used is also shown. Two sensors were bonded onto theouter bore of the outer raceway. Sensor CH2 was located at the center of the maximumloaded region whilst sensor CH1 was located at the edge of it. A groove parallel to therolling surface was machined into the outer raceway to accommodate the sensors andwiring. The parallel groove was necessary to ensure ultrasonic waves generated would beperpendicularly incident on the roller-raceway surface and consequently reflected straightback to the sensor. This is shown in the bottom right sketch of Figure 5.
The pulsing hardware used for the field measurements was the same as that used forthe laboratory testing. Excitation was provided by an ultrasonic pulse receiver and thereflected waves were digitized at a rate of 100 MHz and streamed into the data acquisitionPC for storage. In this case, as the TRB would be rotating at 1500 RPM during steady oper-ating conditions, it is desired to have the maximum pulse repetition rate (PRR) of 80 kHzfor each sensor to avoid aliasing. Consequently, the sensors were pulsed sequentially ratherthan simultaneously. For every 20 min, one second of ultrasonic pulses was captured fromboth the sensors at a PRR of 80 kHz. The 20 min wait time was assigned between capturesto limit the amount of data generated as one dataset is 50 MB. Consequently, for eachultrasonic sensor, 8 × 10⁶ data points were captured at an interval of 0.01 µs, for a fullsecond every 20 min of turbine operation.
4. Analysis Procedure
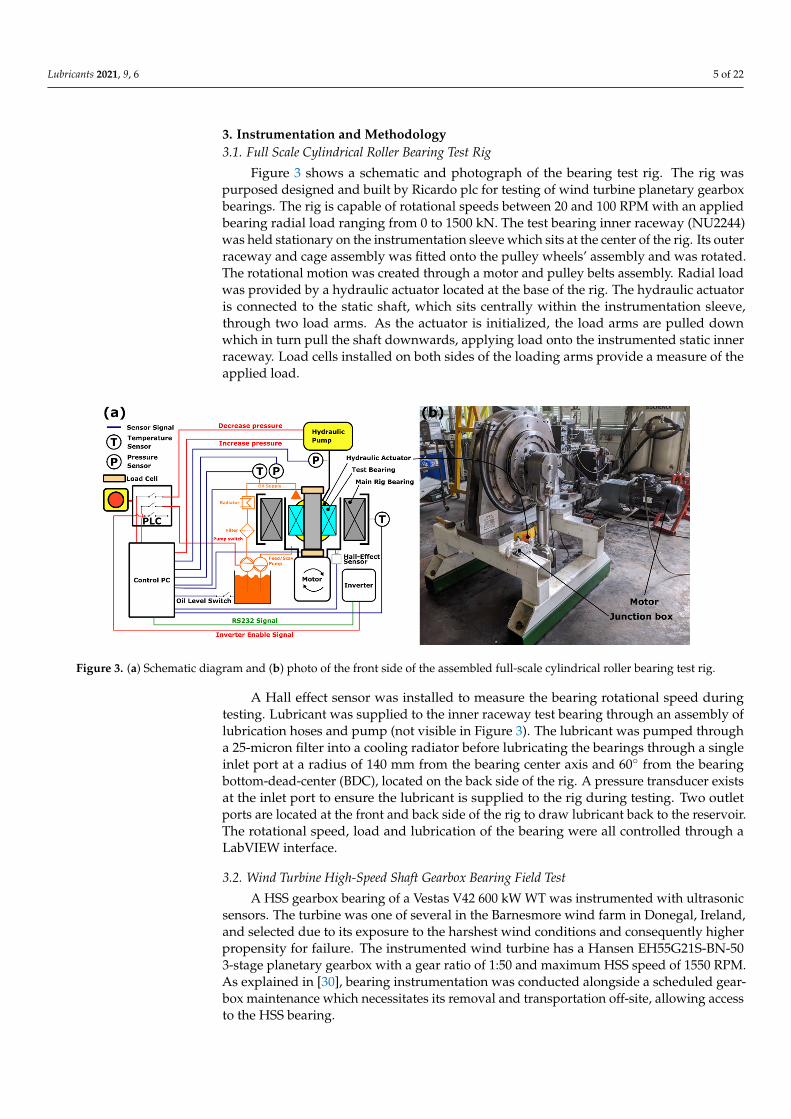
Data processing for reflection coefficient measurements is well documented in [22,30,37]and so will be explained only briefly here. Figure 7 shows raw ultrasonic reflections ob-tained from various interfaces within the bearing. The first waveform is the initial excitationpulse and subsequent waveforms are the first and second reflections from the racewayinterface. The blue signal corresponds to measurements taken when the sensor is notdirectly incident with a rolling element whilst the red signal corresponds to measurementstaken when a roller is directly present under the sensor. As the roller traverses across thesensor, part of the ultrasonic energy is transmitted through the roller which resulted in thereduction in the amplitudes of the first and second reflections. To maximize signal to noiseratio, the first reflection was selected for measurement and a capture window was assignedacross it.
Figure 8 summarizes the data processing procedure required to obtain reflectioncoefficient measurements, from which the information pertaining to bearing lubricationwas subsequently inferred.
After assigning a window across the first reflection from the raceway interface, the ref-erence signal which corresponds to a steel–air interface was subsequently extracted fromthe captured waveforms. After that, a Fast Fourier Transform was applied to the capturedpulse and the reflection coefficient was obtained by dividing the spectral amplitudes of thecaptured pulses, Am with that of the reference, Ar.
Lubricants 2021, 9, 6 9 of 22Lubricants 2021, 9, x FOR PEER REVIEW 9 of 23
Figure 7. Raw ultrasonic reflections from various interfaces within the bearing and the extraction of the first raceway/roller interface reflection.
Figure 8 summarizes the data processing procedure required to obtain reflection co-efficient measurements, from which the information pertaining to bearing lubrication was subsequently inferred.
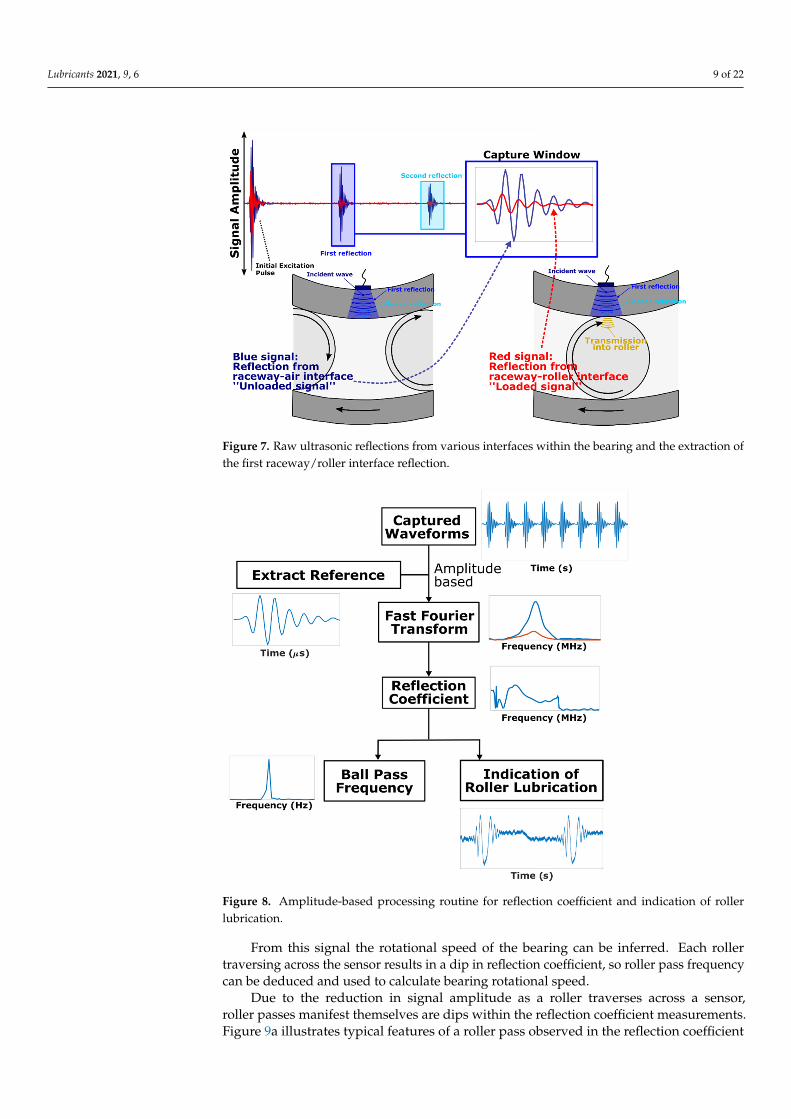
Figure 8. Amplitude-based processing routine for reflection coefficient and indication of roller lubrication.
After assigning a window across the first reflection from the raceway interface, the reference signal which corresponds to a steel–air interface was subsequently extracted from the captured waveforms. After that, a Fast Fourier Transform was applied to the
Figure 7. Raw ultrasonic reflections from various interfaces within the bearing and the extraction ofthe first raceway/roller interface reflection.
Lubricants 2021, 9, x FOR PEER REVIEW 9 of 23
Figure 7. Raw ultrasonic reflections from various interfaces within the bearing and the extraction of the first raceway/roller interface reflection.
Figure 8 summarizes the data processing procedure required to obtain reflection co-efficient measurements, from which the information pertaining to bearing lubrication was subsequently inferred.
Figure 8. Amplitude-based processing routine for reflection coefficient and indication of roller lubrication.
After assigning a window across the first reflection from the raceway interface, the reference signal which corresponds to a steel–air interface was subsequently extracted from the captured waveforms. After that, a Fast Fourier Transform was applied to the
Figure 8. Amplitude-based processing routine for reflection coefficient and indication of rollerlubrication.
From this signal the rotational speed of the bearing can be inferred. Each rollertraversing across the sensor results in a dip in reflection coefficient, so roller pass frequencycan be deduced and used to calculate bearing rotational speed.
Due to the reduction in signal amplitude as a roller traverses across a sensor,roller passes manifest themselves are dips within the reflection coefficient measurements.Figure 9a illustrates typical features of a roller pass observed in the reflection coefficient

Lubricants 2021, 9, 6 10 of 22
measurements. The regions highlighted in blue are inlet and outlet region of a roller passand show oscillations in the signal. A reflection coefficient exceeding unity means that asurplus of ultrasonic energy is present within the reflected signal. Figure 9b,c attempt toexplain the source of this energy surplus. Due to the divergence of the incident soundwave, the ultrasonic energy will be incident across a large segment of the rolling surface.When a rolling element approaches the periphery of the incident wave, small amounts ofultrasound is reflected back from the roller-raceway interface [36]. These reverberationsvary in arrival time depending on the location of the roller with respect to the center of thesensor as illustrated in Figure 9c. This results in either constructive of destructive interfer-ence between the main reflected pulse and the reverberations from the roller, subsequentlymanifesting as energy fluctuations within the inlet and outlet of the reflection coefficientmeasurements. These are termed “interference fringes” [36]. As a consequence, it is difficultto infer the start and end locations of the contact within the measurements. Attempts to takesome measurement of contact width yielded an over measure, indicating a wider sensorsensing region compared with the raceway-roller contact. As a consequence, conversionof reflection coefficient to film thickness in this contact zone is challenging—as the exactextent of the zone is not known.
Lubricants 2021, 9, x FOR PEER REVIEW 10 of 23
captured pulse and the reflection coefficient was obtained by dividing the spectral ampli-tudes of the captured pulses, Am with that of the reference, Ar.
From this signal the rotational speed of the bearing can be inferred. Each roller trav-ersing across the sensor results in a dip in reflection coefficient, so roller pass frequency can be deduced and used to calculate bearing rotational speed.
Due to the reduction in signal amplitude as a roller traverses across a sensor, roller passes manifest themselves are dips within the reflection coefficient measurements. Fig-ure 9a illustrates typical features of a roller pass observed in the reflection coefficient measurements. The regions highlighted in blue are inlet and outlet region of a roller pass and show oscillations in the signal. A reflection coefficient exceeding unity means that a surplus of ultrasonic energy is present within the reflected signal. Figure 9b,c attempt to explain the source of this energy surplus. Due to the divergence of the incident sound wave, the ultrasonic energy will be incident across a large segment of the rolling surface. When a rolling element approaches the periphery of the incident wave, small amounts of ultrasound is reflected back from the roller-raceway interface [36]. These reverberations vary in arrival time depending on the location of the roller with respect to the center of the sensor as illustrated in Figure 9c. This results in either constructive of destructive in-terference between the main reflected pulse and the reverberations from the roller, subse-quently manifesting as energy fluctuations within the inlet and outlet of the reflection coefficient measurements. These are termed “interference fringes” [36]. As a consequence, it is difficult to infer the start and end locations of the contact within the measurements. Attempts to take some measurement of contact width yielded an over measure, indicating a wider sensor sensing region compared with the raceway-roller contact. As a conse-quence, conversion of reflection coefficient to film thickness in this contact zone is chal-lenging—as the exact extent of the zone is not known.
Figure 9. (a) Features of a roller pass within the reflection coefficient measurements and (b,c) causes of the interference fringes.
Measurements of reflection coefficient between roller passes contains information on the lubrication condition of the raceway surface. Figure 10 shows reflection coefficient measurements for two roller passes, categorized as B. Prior to a roller pass, the reflection coefficient measurements remained at 0.95 (Case A) which corresponds to a steel–oil in-terface. Immediately after a roller pass, R values were recorded at unity (Case C), corre-sponding to a steel–air interface. After a period of time, the R values gradually transi-tioned from unity to 0.95 and remained at 0.95 until the subsequent roller traverses across the sensor. This transitional regime is categorized as D. The time at which the reflection coefficient transitioned from unity to 0.95 after a roller pass is termed “lubricant reflow time” [30]. This recurring “zig-zag” pattern captures the behavior of the lubricant within the bearing and forms the basis which the lubrication condition of the roller is inferred.
Figure 9. (a) Features of a roller pass within the reflection coefficient measurements and (b,c) causes of the interferencefringes.
Measurements of reflection coefficient between roller passes contains information onthe lubrication condition of the raceway surface. Figure 10 shows reflection coefficientmeasurements for two roller passes, categorized as B. Prior to a roller pass, the reflection co-efficient measurements remained at 0.95 (Case A) which corresponds to a steel–oil interface.Immediately after a roller pass, R values were recorded at unity (Case C), corresponding toa steel–air interface. After a period of time, the R values gradually transitioned fromunity to 0.95 and remained at 0.95 until the subsequent roller traverses across the sensor.This transitional regime is categorized as D. The time at which the reflection coefficienttransitioned from unity to 0.95 after a roller pass is termed “lubricant reflow time” [30].This recurring “zig-zag” pattern captures the behavior of the lubricant within the bearingand forms the basis which the lubrication condition of the roller is inferred.
As a roller traverses past the sensor, the lubricant present on the raceway surface isswept clean by the roller, resulting in R = 1. With time, the lubricant gradually reoccu-pies the region swept clean by the previous roller and R transitions from unity to 0.95.Subsequently, R remained at 0.95 until the next roller traverses across the sensor and thecycle repeats itself. It is subsequently assumed that if the raceway is lubricated (R = 0.95),the incoming roller would also be sufficiently lubricated.

Lubricants 2021, 9, 6 11 of 22Lubricants 2021, 9, x FOR PEER REVIEW 11 of 23
Figure 10. Patterns between roller passes within the reflection coefficient measurements.
As a roller traverses past the sensor, the lubricant present on the raceway surface is swept clean by the roller, resulting in R = 1. With time, the lubricant gradually reoccupies the region swept clean by the previous roller and R transitions from unity to 0.95. Subse-quently, R remained at 0.95 until the next roller traverses across the sensor and the cycle repeats itself. It is subsequently assumed that if the raceway is lubricated (R = 0.95), the incoming roller would also be sufficiently lubricated.
5. Results 5.1. Measurements from the Full-scale CRB Test Rig
Figure 11 shows the reflection coefficient measurements obtained at 20 RPM under a bearing load of 100 kN when the rig was operated for a short period of time with no oil present. Four roller passes can be observed within the measurements. As expected, since no lubricant is present on the raceway surface, no recurring pattern is observed within the reflection coefficient measurements between roller passes (highlighted in red) as the re-flection coefficient remained constant at unity. R is 1 before a roller passes; it dips down to 0.8 or so as the roller passes and some sound is transmitted into the roller (through the dry rough surface contact), and then returns to 1 once the roller has passed. This demon-strates that the recurring pattern between rollers in lubricated cases (e.g., Figure 10) is likely to be caused by the presence of residual oil on the raceway surface.
Figure 10. Patterns between roller passes within the reflection coefficient measurements.
5. Results5.1. Measurements from the Full-Scale CRB Test Rig
Figure 11 shows the reflection coefficient measurements obtained at 20 RPM undera bearing load of 100 kN when the rig was operated for a short period of time with nooil present. Four roller passes can be observed within the measurements. As expected,since no lubricant is present on the raceway surface, no recurring pattern is observed withinthe reflection coefficient measurements between roller passes (highlighted in red) as thereflection coefficient remained constant at unity. R is 1 before a roller passes; it dips down to0.8 or so as the roller passes and some sound is transmitted into the roller (through the dryrough surface contact), and then returns to 1 once the roller has passed. This demonstratesthat the recurring pattern between rollers in lubricated cases (e.g., Figure 10) is likely to becaused by the presence of residual oil on the raceway surface.
Figure 12 shows the reflection coefficient measurements captured for three lubricatedcases for oils of varying viscosities. Again, in each case, four roller passes can be seen.When each roller passes, the reflection falls to R ≈ 0.65. Note, this is lower than the drycase (R ≈ 0.8) as the load applied is higher and the interface now consists of a thin oil filmand some asperity contact; this reflects less ultrasound.
Distinct patterns between the roller passes are identifiable. For the dataset taken usingthe lowest oil viscosity (Figure 12a), the reflection coefficient between roller passes mostlyremains at unity, except for the roller inlet region where the measurements transitionedto 0.95. This zig-zag pattern before a roller pass as seen in Figures 8 and 10 indicatesthat the roller inlet region, and subsequently the roller contact is sufficiently lubricated.Such patterns are also apparent within the VG150 and VG320 lubricant results. The zig-zagpattern for the two thicker oils manifested much earlier compared to the VG32 oil, with thereflection coefficient of the thickest oil (VG320) transitioning from unity to 0.95 quickest.This indicates that the lubricant reflow time decreases with increasing lubricant viscosity.
The variation between lubricant reflow time with bearing load and rotational speedwere also investigated. Figure 13 shows the variation of lubricant reflow time with increas-ing load, rotational speed, and lubricant viscosity. For the load and speed investigation,measurements taken using VG320 oil were used.

Lubricants 2021, 9, 6 12 of 22Lubricants 2021, 9, x FOR PEER REVIEW 12 of 23
Figure 11. Reflection coefficient patterns for measurements taken at 20 RPM and 100 kN with no lubrication. Four roller passes are observed where R ≈ 0.8. The space in between the rollers (highlighted in red) show R ≈ 1 indicating a steel-air interface.
Figure 12 shows the reflection coefficient measurements captured for three lubricated cases for oils of varying viscosities. Again, in each case, four roller passes can be seen. When each roller passes, the reflection falls to R ≈ 0.65. Note, this is lower than the dry case (R ≈ 0.8) as the load applied is higher and the interface now consists of a thin oil film and some asperity contact; this reflects less ultrasound.
Figure 12. Reflection coefficient patterns for measurements taken at 20 RPM and 300 kN for (a) VG32, (b) VG 150, and (c) VG320 mineral oil. Four roller passes are observed where R ≈ 0.65. Between the roller, the black arrow indicates the zig-zag pattern corresponding to lubricant reflowing ahead of the next roller.
Distinct patterns between the roller passes are identifiable. For the dataset taken us-ing the lowest oil viscosity (Figure 12a), the reflection coefficient between roller passes mostly remains at unity, except for the roller inlet region where the measurements transi-tioned to 0.95. This zig-zag pattern before a roller pass as seen in Figures 8 and 10 indicates that the roller inlet region, and subsequently the roller contact is sufficiently lubricated. Such patterns are also apparent within the VG150 and VG320 lubricant results. The zig-zag pattern for the two thicker oils manifested much earlier compared to the VG32 oil, with the reflection coefficient of the thickest oil (VG320) transitioning from unity to 0.95 quickest. This indicates that the lubricant reflow time decreases with increasing lubricant viscosity.
Figure 11. Reflection coefficient patterns for measurements taken at 20 RPM and 100 kN with no lubrication. Four rollerpasses are observed where R ≈ 0.8. The space in between the rollers (highlighted in red) show R ≈ 1 indicating a steel-airinterface.
Lubricants 2021, 9, x FOR PEER REVIEW 12 of 23
Figure 11. Reflection coefficient patterns for measurements taken at 20 RPM and 100 kN with no lubrication. Four roller passes are observed where R ≈ 0.8. The space in between the rollers (highlighted in red) show R ≈ 1 indicating a steel-air interface.
Figure 12 shows the reflection coefficient measurements captured for three lubricated cases for oils of varying viscosities. Again, in each case, four roller passes can be seen. When each roller passes, the reflection falls to R ≈ 0.65. Note, this is lower than the dry case (R ≈ 0.8) as the load applied is higher and the interface now consists of a thin oil film and some asperity contact; this reflects less ultrasound.
Figure 12. Reflection coefficient patterns for measurements taken at 20 RPM and 300 kN for (a) VG32, (b) VG 150, and (c) VG320 mineral oil. Four roller passes are observed where R ≈ 0.65. Between the roller, the black arrow indicates the zig-zag pattern corresponding to lubricant reflowing ahead of the next roller.
Distinct patterns between the roller passes are identifiable. For the dataset taken us-ing the lowest oil viscosity (Figure 12a), the reflection coefficient between roller passes mostly remains at unity, except for the roller inlet region where the measurements transi-tioned to 0.95. This zig-zag pattern before a roller pass as seen in Figures 8 and 10 indicates that the roller inlet region, and subsequently the roller contact is sufficiently lubricated. Such patterns are also apparent within the VG150 and VG320 lubricant results. The zig-zag pattern for the two thicker oils manifested much earlier compared to the VG32 oil, with the reflection coefficient of the thickest oil (VG320) transitioning from unity to 0.95 quickest. This indicates that the lubricant reflow time decreases with increasing lubricant viscosity.
Figure 12. Reflection coefficient patterns for measurements taken at 20 RPM and 300 kN for (a) VG32, (b) VG 150,and (c) VG320 mineral oil. Four roller passes are observed where R ≈ 0.65. Between the roller, the black arrow indicates thezig-zag pattern corresponding to lubricant reflowing ahead of the next roller.
Lubricants 2021, 9, x FOR PEER REVIEW 13 of 23
The variation between lubricant reflow time with bearing load and rotational speed were also investigated. Figure 13 shows the variation of lubricant reflow time with in-creasing load, rotational speed, and lubricant viscosity. For the load and speed investiga-tion, measurements taken using VG320 oil were used.
Figure 13. Variation of lubricant reflow time with (a) applied load, (b) rotational speed, and (c) lubricant viscosity.
From Figure 13a, as the bearing load increases, a slight increase in lubricant reflow time can be seen. As the load increases, the amount of residual lubricant the roller shears off the surface also increases. This resulted in the slight increase in the lubricant reflow time as observed in Figure 13a. Conversely, the lubricant reflow time was seen to decrease significantly with increasing rotational speed (Figure 13b). As the rotational speed in-creases, the instances where the rollers traverse across the sensor also increases which aids in the distribution of lubricant, resulting in a decrease in reflow time. The viscosity of the lubricant could influence both adversely and favorably on the lubricant reflow time. The more viscous the lubricant, the slower it will flow to refill a voided region. However, a viscous lubricant will have a larger free surface film thickness compared to a less viscous one. From Figure 13c, it seems like the latter effect is more dominant, resulting in the re-duction in lubricant reflow time with increasing grades of lubricant viscosity. As rota-tional speed and oil viscosity typically influences positively, and load negatively on bear-ing lubrication, lubricant reflow time can potentially be viewed as a parameter which measures the extent of supply of lubricant to the bearing contacts.
5.2. Measurements from the Field Operational HSS Gearbox Bearing The following sections investigate the reflection coefficient patterns present across a
range of 3000 datasets obtained from the field turbine and correlates these newly identi-fied patterns with bearing rotational speed and temperature.
5.2.1. Identification of Bearing Lubrication Condition Figure 14 shows the four predominantly recurring patterns of reflection coefficient
observed from the field operational HSS bearing. These typical patterns observed have been selected as being characteristic from 3000 datasets obtained over a 3-month period of turbine operation.
Figure 13. Variation of lubricant reflow time with (a) applied load, (b) rotational speed, and (c) lubricant viscosity.

Lubricants 2021, 9, 6 13 of 22
From Figure 13a, as the bearing load increases, a slight increase in lubricant reflowtime can be seen. As the load increases, the amount of residual lubricant the roller shearsoff the surface also increases. This resulted in the slight increase in the lubricant reflowtime as observed in Figure 13a. Conversely, the lubricant reflow time was seen to decreasesignificantly with increasing rotational speed (Figure 13b). As the rotational speed increases,the instances where the rollers traverse across the sensor also increases which aids in thedistribution of lubricant, resulting in a decrease in reflow time. The viscosity of the lubricantcould influence both adversely and favorably on the lubricant reflow time. The moreviscous the lubricant, the slower it will flow to refill a voided region. However, a viscouslubricant will have a larger free surface film thickness compared to a less viscous one.From Figure 13c, it seems like the latter effect is more dominant, resulting in the reductionin lubricant reflow time with increasing grades of lubricant viscosity. As rotational speedand oil viscosity typically influences positively, and load negatively on bearing lubrication,lubricant reflow time can potentially be viewed as a parameter which measures the extentof supply of lubricant to the bearing contacts.
5.2. Measurements from the Field Operational HSS Gearbox Bearing
The following sections investigate the reflection coefficient patterns present across arange of 3000 datasets obtained from the field turbine and correlates these newly identifiedpatterns with bearing rotational speed and temperature.
5.2.1. Identification of Bearing Lubrication Condition
Figure 14 shows the four predominantly recurring patterns of reflection coefficientobserved from the field operational HSS bearing. These typical patterns observed havebeen selected as being characteristic from 3000 datasets obtained over a 3-month period ofturbine operation.
Lubricants 2021, 9, x FOR PEER REVIEW 14 of 23
Figure 14. Patterns of reflection coefficient measurements for (a) fully lubricated, slow rotation, and (b) partially lubri-cated, (c) fully lubricated, fast rotation, and (d) insufficiently lubricated conditions.
These patterns indicate that the bearing experiences multiple lubrication condition during operation, and can be categorized into: • Fully lubricated—slow rotation (Figure 14a). The alternating “zig-zag” pattern is
evident within all the measurements between roller passes. The reflection coefficient for each roller inlet region is 0.95, indicating the raceway surface is lubricated before a roller traverses across the region.
• Partially lubricated (Figure 14b). The alternating pattern is not evident within all the measurements between roller passes and a mixture of roller inlet reflection coefficient values exist, varying between unity and 0.95.
• Fully lubricated—fast rotation (Figure 14c). A quicker transition from unity to 0.95 at the roller outlet was observed. The roller inlet reflection coefficient is 0.95.
• Insufficiently lubricated (Figure 14d). The reflection coefficient between roller passes remained constant at unity, similar to that which was observed in Figure 11, indicating the presence of a steel–air interface before roller pass. Distinction between the lubrication conditions can be achieved by computing the his-
togram peaks of the respective datasets. This is illustrated in Figure 15. The bin width used to generate these histogram plots were 5 × 10⁻⁴, found through trial and error to be the most suitable. For the fully lubricated dataset under low bearing rotational speed (Fig-ure 15a), a dominant peak was observed around R = 0.95 with a minor peak at R = 1.00. This is juxtaposed for the partially lubricated dataset (Figure 15b), where the major peak was observed at R = 1.00.
0 0.5 1 1.5 2
0.8
0.9
1
1.1
1.2Fully Lubricated - Slow Rotation
0 0.5 1 1.5 2
0.8
0.9
1
1.1
1.2Partially Lubricated
0.2 0.21 0.22 0.23 0.24 0.25Time(s)
0.6
0.8
1
1.2Fully Lubricated - Fast Rotation
0 0.2 0.4 0.6 0.8Time(s)
0.7
0.8
0.9
1
1.1
1.2Fully Unlubricated
(a)
(c)
(b)
(d)
Figure 14. Patterns of reflection coefficient measurements for (a) fully lubricated, slow rotation, and (b) partially lubricated,(c) fully lubricated, fast rotation, and (d) insufficiently lubricated conditions.
Lubricants 2021, 9, 6 14 of 22
These patterns indicate that the bearing experiences multiple lubrication conditionduring operation, and can be categorized into:
• Fully lubricated—slow rotation (Figure 14a). The alternating “zig-zag” pattern isevident within all the measurements between roller passes. The reflection coefficientfor each roller inlet region is 0.95, indicating the raceway surface is lubricated before aroller traverses across the region.
• Partially lubricated (Figure 14b). The alternating pattern is not evident within all themeasurements between roller passes and a mixture of roller inlet reflection coefficientvalues exist, varying between unity and 0.95.
• Fully lubricated—fast rotation (Figure 14c). A quicker transition from unity to 0.95at the roller outlet was observed. The roller inlet reflection coefficient is 0.95.
• Insufficiently lubricated (Figure 14d). The reflection coefficient between roller passesremained constant at unity, similar to that which was observed in Figure 11, indicat-ing the presence of a steel–air interface before roller pass.
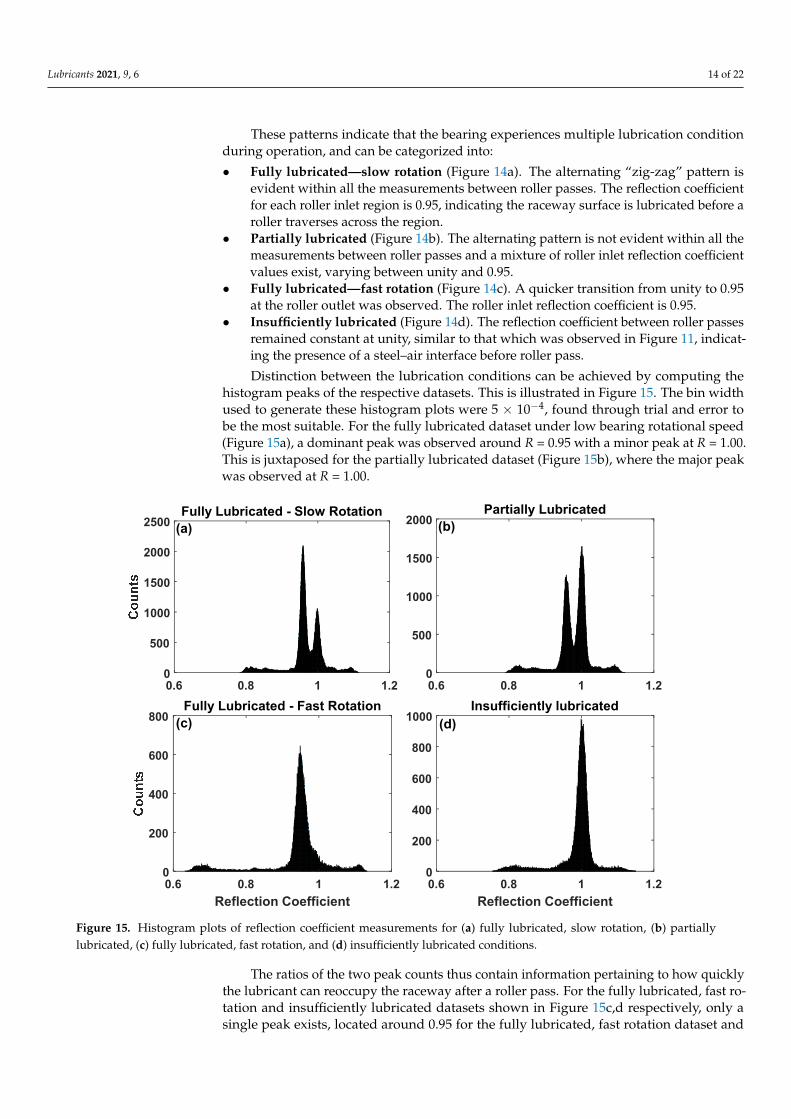
Distinction between the lubrication conditions can be achieved by computing thehistogram peaks of the respective datasets. This is illustrated in Figure 15. The bin widthused to generate these histogram plots were 5 × 10⁻⁴, found through trial and error tobe the most suitable. For the fully lubricated dataset under low bearing rotational speed(Figure 15a), a dominant peak was observed around R = 0.95 with a minor peak at R = 1.00.This is juxtaposed for the partially lubricated dataset (Figure 15b), where the major peakwas observed at R = 1.00.
Lubricants 2021, 9, x FOR PEER REVIEW 15 of 23
Figure 15. Histogram plots of reflection coefficient measurements for (a) fully lubricated, slow rotation, (b) partially lubri-cated, (c) fully lubricated, fast rotation, and (d) insufficiently lubricated conditions.
The ratios of the two peak counts thus contain information pertaining to how quickly the lubricant can reoccupy the raceway after a roller pass. For the fully lubricated, fast rotation and insufficiently lubricated datasets shown in Figure 15c, d respectively, only a single peak exists, located around 0.95 for the fully lubricated, fast rotation dataset and around unity for an insufficiently lubricated dataset. These distinct features are crucial in automatically categorizing datasets based on their lubrication condition, as manual sort-ing of around 3000 datasets is time consuming and impractical.
Figure 16 summarizes the procedure necessary to categorize each of the 3000 ultra-sonic datasets into the four lubricating conditions identified, namely: fully lubricated—fast rotation, insufficiently lubricated, fully lubricated—slow rotation, and partially lubri-cated. Initially, the raw ultrasonic dataset is processed using the amplitude-based routine detailed in Figure 8 to obtain reflection coefficient and ball pass frequency. A threshold was subsequently assigned to the ball pass frequency to filter out datasets where the bear-ing is not rotating or rotating very slowly. The histogram of the reflection coefficient meas-urements was subsequently computed. Finally, the number and locations of peaks within the histogram for each dataset was determined and the dataset was categorized accord-ingly.
Insufficiently lubricated
0.6 0.8 1 1.2Reflection Coefficient
0
200
400
600
800
1000
Fully Lubricated - Slow Rotation
0.6 0.8 1 1.20
500
1000
1500
2000
2500Partially Lubricated
0.6 0.8 1 1.20
500
1000
1500
2000
Fully Lubricated - Fast Rotation
0.6 0.8 1 1.2Reflection Coefficient
0
200
400
600
800
(a) (b)
(d)(c)
Figure 15. Histogram plots of reflection coefficient measurements for (a) fully lubricated, slow rotation, (b) partiallylubricated, (c) fully lubricated, fast rotation, and (d) insufficiently lubricated conditions.
The ratios of the two peak counts thus contain information pertaining to how quicklythe lubricant can reoccupy the raceway after a roller pass. For the fully lubricated, fast ro-tation and insufficiently lubricated datasets shown in Figure 15c,d respectively, only asingle peak exists, located around 0.95 for the fully lubricated, fast rotation dataset and

Lubricants 2021, 9, 6 15 of 22
around unity for an insufficiently lubricated dataset. These distinct features are crucial inautomatically categorizing datasets based on their lubrication condition, as manual sortingof around 3000 datasets is time consuming and impractical.
Figure 16 summarizes the procedure necessary to categorize each of the 3000 ultrasonicdatasets into the four lubricating conditions identified, namely: fully lubricated—fast ro-tation, insufficiently lubricated, fully lubricated—slow rotation, and partially lubricated.Initially, the raw ultrasonic dataset is processed using the amplitude-based routine detailedin Figure 8 to obtain reflection coefficient and ball pass frequency. A threshold was sub-sequently assigned to the ball pass frequency to filter out datasets where the bearing isnot rotating or rotating very slowly. The histogram of the reflection coefficient measure-ments was subsequently computed. Finally, the number and locations of peaks within thehistogram for each dataset was determined and the dataset was categorized accordingly.
Lubricants 2021, 9, x FOR PEER REVIEW 16 of 23
Figure 16. Data processing routine flowchart illustrating the steps taken to categorize datasets based on their lubrication condition.
5.2.2. Bearing Lubrication Condition Variation with Turbine Operation Figure 17 illustrates the variation of bearing rotational speed deduced from ball pass
frequency measurements from CH1 (as described in §4) across turbine operation for a complete month of data (September 2015). This month was selected as it contained the highest number of available datasets. Each point within the plot corresponds to a single ultrasonic dataset and the lubrication condition for each dataset is shown in color where red corresponds to an insufficiently lubricated condition, orange to a partially lubricated dataset, and green to a fully lubricated dataset.
Figure 17. Variation of bearing rotational speed with turbine operation across September 2015 with the bearing lubrication condition shown in color.
Figure 16. Data processing routine flowchart illustrating the steps taken to categorize datasets basedon their lubrication condition.
5.2.2. Bearing Lubrication Condition Variation with Turbine Operation
Figure 17 illustrates the variation of bearing rotational speed deduced from ball passfrequency measurements from CH1 (as described in §4) across turbine operation for acomplete month of data (September 2015). This month was selected as it contained thehighest number of available datasets. Each point within the plot corresponds to a singleultrasonic dataset and the lubrication condition for each dataset is shown in color wherered corresponds to an insufficiently lubricated condition, orange to a partially lubricateddataset, and green to a fully lubricated dataset.
Broadly comparing across the data, around 93% of the datasets were found to be fullylubricated (green) whilst around 4% are insufficiently lubricated (red). Only less than 1%of the datasets were partially lubricated (orange) with 2% of the measurement capturedduring idle conditions.
Most of the fully lubricated datasets occur at the turbine steady operating speedof 1550 RPM whilst the insufficiently and partially lubricated conditions occur duringtransient operation, concentrated at rotational speeds of less than 200 RPM. This is asexpected as the turbine is a fixed speed wind turbine and will operate at the rated speedof 1550 RPM regardless of wind speed, resulting in more measurements at rated speed.Since the lubricant pump operates proportionally with the turbine shaft speed, at the rated

Lubricants 2021, 9, 6 16 of 22
speed of 1550 RPM, lubricant is pumped at a consistent rate to the top of the gearbox,thus ensuring a constant flow of lubricant into the bearings.
Lubricants 2021, 9, x FOR PEER REVIEW 16 of 23
Figure 16. Data processing routine flowchart illustrating the steps taken to categorize datasets based on their lubrication condition.
5.2.2. Bearing Lubrication Condition Variation with Turbine Operation Figure 17 illustrates the variation of bearing rotational speed deduced from ball pass
frequency measurements from CH1 (as described in §4) across turbine operation for a complete month of data (September 2015). This month was selected as it contained the highest number of available datasets. Each point within the plot corresponds to a single ultrasonic dataset and the lubrication condition for each dataset is shown in color where red corresponds to an insufficiently lubricated condition, orange to a partially lubricated dataset, and green to a fully lubricated dataset.
Figure 17. Variation of bearing rotational speed with turbine operation across September 2015 with the bearing lubrication condition shown in color. Figure 17. Variation of bearing rotational speed with turbine operation across September 2015 with the bearing lubricationcondition shown in color.
During the transient operation phase (0–1549 RPM), the lubricant flow is at a lower rateand this is likely to be linked to instances of insufficient and partial lubrication. Instances ofnon-fully lubricated conditions also seemed to be clustered around each other and are notrandomly distributed.
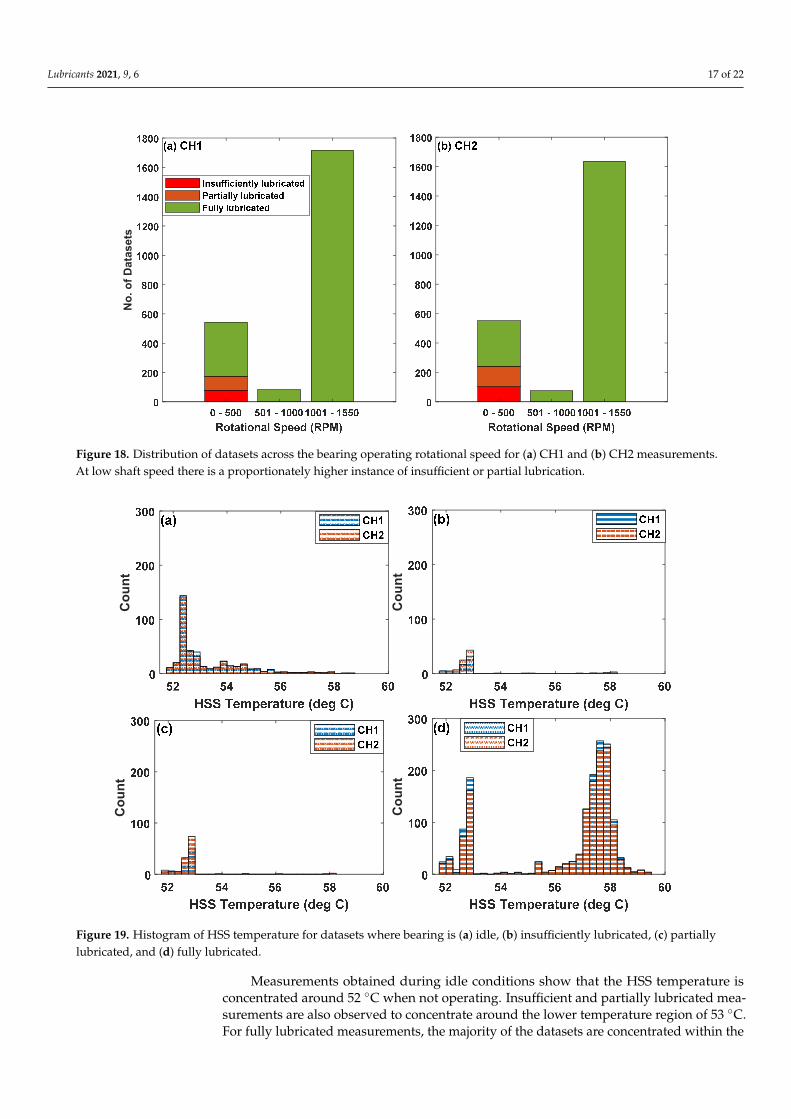
To better understand the distribution of bearing lubrication datasets across the ro-tational speed range, the datasets were sorted into 3 rotational speed groups of low(0–500 RPM), medium (501–1000 RPM), and high (1001–1550 RPM). This can be seenin Figure 18 where the 3 lubrication conditions were again color coded in red, orange,and green, respectively, to represent insufficiently lubricated, partially lubricated, and fullylubricated datasets for each rotational speed groups.
As predicted, insufficiently and partially lubricated bearing conditions occur exclu-sively at the low rotational speed group (0–500 RPM) whilst the medium and high-speedgroups were in majority fully lubricated datasets. Almost all (99.9% (CH1) and 100%(CH2)) of the high-speed data sets are fully lubricated with only 1 dataset attributed toan insufficiently lubricated condition. This value was reduced to 97.5% (CH1) and 97.4%(CH2) for the medium speed datasets with the minority occupied by partially lubricateddatasets. For the low speed group, measurements were distributed more with 67.6% fullylubricated, 17.6% partially, and 14.8% insufficiently lubricated datasets for CH1 whilst CH2measurements register 56% for fully lubricated, 25.2% for partially, and 18.8% for insuffi-ciently lubricated datasets. This again is expected as the lubrication system is activatedproportionally with the HSS rotation.
Figure 19 demonstrates the relationship between the bearing lubrication conditionand the HSS temperature, measured with a thermocouple on the gearbox casing, closest tothe HSS position.
Lubricants 2021, 9, 6 17 of 22
Lubricants 2021, 9, x FOR PEER REVIEW 17 of 23
Broadly comparing across the data, around 93% of the datasets were found to be fully lubricated (green) whilst around 4% are insufficiently lubricated (red). Only less than 1% of the datasets were partially lubricated (orange) with 2% of the measurement captured during idle conditions.
Most of the fully lubricated datasets occur at the turbine steady operating speed of 1550 RPM whilst the insufficiently and partially lubricated conditions occur during tran-sient operation, concentrated at rotational speeds of less than 200 RPM. This is as expected as the turbine is a fixed speed wind turbine and will operate at the rated speed of 1550 RPM regardless of wind speed, resulting in more measurements at rated speed. Since the lubricant pump operates proportionally with the turbine shaft speed, at the rated speed of 1550 RPM, lubricant is pumped at a consistent rate to the top of the gearbox, thus en-suring a constant flow of lubricant into the bearings.
During the transient operation phase (0–1549 RPM), the lubricant flow is at a lower rate and this is likely to be linked to instances of insufficient and partial lubrication. In-stances of non-fully lubricated conditions also seemed to be clustered around each other and are not randomly distributed.
To better understand the distribution of bearing lubrication datasets across the rota-tional speed range, the datasets were sorted into 3 rotational speed groups of low (0–500 RPM), medium (501–1000 RPM), and high (1001–1550 RPM). This can be seen in Figure 18 where the 3 lubrication conditions were again color coded in red, orange, and green, re-spectively, to represent insufficiently lubricated, partially lubricated, and fully lubricated datasets for each rotational speed groups.
Figure 18. Distribution of datasets across the bearing operating rotational speed for (a) CH1 and (b) CH2 measurements. At low shaft speed there is a proportionately higher instance of insufficient or partial lubrication.
As predicted, insufficiently and partially lubricated bearing conditions occur exclu-sively at the low rotational speed group (0–500 RPM) whilst the medium and high-speed groups were in majority fully lubricated datasets. Almost all (99.9% (CH1) and 100% (CH2)) of the high-speed data sets are fully lubricated with only 1 dataset attributed to an insufficiently lubricated condition. This value was reduced to 97.5% (CH1) and 97.4% (CH2) for the medium speed datasets with the minority occupied by partially lubricated datasets. For the low speed group, measurements were distributed more with 67.6% fully lubricated, 17.6% partially, and 14.8% insufficiently lubricated datasets for CH1 whilst CH2 measurements register 56% for fully lubricated, 25.2% for partially, and 18.8% for
No.
of D
atas
ets
Figure 18. Distribution of datasets across the bearing operating rotational speed for (a) CH1 and (b) CH2 measurements.At low shaft speed there is a proportionately higher instance of insufficient or partial lubrication.
Lubricants 2021, 9, x FOR PEER REVIEW 18 of 23
insufficiently lubricated datasets. This again is expected as the lubrication system is acti-vated proportionally with the HSS rotation.
Figure 19 demonstrates the relationship between the bearing lubrication condition and the HSS temperature, measured with a thermocouple on the gearbox casing, closest to the HSS position.
Figure 19. Histogram of HSS temperature for datasets where bearing is (a) idle, (b) insufficiently lubricated, (c) partially lubricated, and (d) fully lubricated.
Measurements obtained during idle conditions show that the HSS temperature is concentrated around 52 °C when not operating. Insufficient and partially lubricated meas-urements are also observed to concentrate around the lower temperature region of 53 °C. For fully lubricated measurements, the majority of the datasets are concentrated within the 57.5 °C region, with a portion at the lower temperature region of 53 °C. A low HSS temperature would indicate less turbine activity (turbine idling) whilst a higher tempera-ture would translate to steady, full-speed operation. The HSS temperature might also af-fect the lubricant viscosity and subsequently the flow of lubricant within the passive lu-bricating channels of the gearbox. At low temperatures, the lubricant is more viscous and thus flow is slower compared to higher temperature conditions. At higher temperature, lubricant flow through the systems of lubricating channels is potentially smoother, allow-ing the lubricant to refill the raceway region previously swept clean by the outgoing roller, ensuring lubricant is present on the raceway for the incoming roller. This, however, would adversely influence the film thickness in the contact as the lubricant viscosity is reduced.
5.2.3. Lubrication Condition at Edge and Centre of Bearing Loaded Region As the ultrasonic sensors were instrumented at two locations (edge, CH1 and center,
CH2—see Figure 6b) in the loaded region around the bearing circumference, the lubrica-tion condition inferred from the two locations can be compared. Figure 20 illustrates the
Cou
nt
Cou
nt
Cou
nt
Cou
nt
Figure 19. Histogram of HSS temperature for datasets where bearing is (a) idle, (b) insufficiently lubricated, (c) partiallylubricated, and (d) fully lubricated.
Measurements obtained during idle conditions show that the HSS temperature isconcentrated around 52 ◦C when not operating. Insufficient and partially lubricated mea-surements are also observed to concentrate around the lower temperature region of 53 ◦C.For fully lubricated measurements, the majority of the datasets are concentrated within the

Lubricants 2021, 9, 6 18 of 22
57.5 ◦C region, with a portion at the lower temperature region of 53 ◦C. A low HSS tem-perature would indicate less turbine activity (turbine idling) whilst a higher temperaturewould translate to steady, full-speed operation. The HSS temperature might also affect thelubricant viscosity and subsequently the flow of lubricant within the passive lubricatingchannels of the gearbox. At low temperatures, the lubricant is more viscous and thus flow isslower compared to higher temperature conditions. At higher temperature, lubricant flowthrough the systems of lubricating channels is potentially smoother, allowing the lubricantto refill the raceway region previously swept clean by the outgoing roller, ensuring lubri-cant is present on the raceway for the incoming roller. This, however, would adverselyinfluence the film thickness in the contact as the lubricant viscosity is reduced.
5.2.3. Lubrication Condition at Edge and Centre of Bearing Loaded Region
As the ultrasonic sensors were instrumented at two locations (edge, CH1 and center,CH2—see Figure 6b) in the loaded region around the bearing circumference, the lubricationcondition inferred from the two locations can be compared. Figure 20 illustrates thedifference in lubrication condition inferred from the two sensors, compared across the fulldataset range.
Lubricants 2021, 9, x FOR PEER REVIEW 19 of 23
difference in lubrication condition inferred from the two sensors, compared across the full dataset range.
Figure 20. Difference in lubrication condition inferred from measurements taken at the edge (CH1) and center (CH2) of the maximum loaded region.
Only around 6% of the datasets show different patterns of reflection coefficients be-tween roller passes, and subsequently varying bearing lubrication conditions for CH1 and CH2 measurements. In other words, if the sensor in the maximum loaded region recorded one particular lubrication condition, the sensors around the circumference in the less loaded region, was likely to detect the same condition.
For CH1, among the differing measurements, over half of these datasets (54%) rec-orded full lubrication, followed by 26% for partially lubricated, and finally the remaining 20% measured insufficiently lubricated conditions. For CH2 where the sensor is located at the maximum loaded region, only one-fifth of the measurements were of fully lubri-cated, with a majority (53%) partially lubricated and the remaining 27% insufficiently lu-bricated. As most of the partially lubricated and insufficiently lubricated measurements occur under transient operation (0–1549 RPM), it can be deduced that under such opera-tion, varying regions within the bearing loaded zone might experience a difference in lu-brication.
6. Discussion 6.1. Principal Findings
An amplitude-based ultrasonic method for in-situ detection of the flow of lubricant within a bearing has been developed. The method enables detection of lubricant within the inlet and outlet region of each individual rollers and was evaluated through laboratory tests under controlled load and lubrication conditions.
The full-scale laboratory testing without lubricant confirmed that the recurring pat-terns between roller passes were attributed to the presence and variation of lubricant on
Figure 20. Difference in lubrication condition inferred from measurements taken at the edge (CH1) and center (CH2) of themaximum loaded region.
Only around 6% of the datasets show different patterns of reflection coefficientsbetween roller passes, and subsequently varying bearing lubrication conditions for CH1and CH2 measurements. In other words, if the sensor in the maximum loaded regionrecorded one particular lubrication condition, the sensors around the circumference in theless loaded region, was likely to detect the same condition.
For CH1, among the differing measurements, over half of these datasets (54%) recordedfull lubrication, followed by 26% for partially lubricated, and finally the remaining 20%measured insufficiently lubricated conditions. For CH2 where the sensor is located at

Lubricants 2021, 9, 6 19 of 22
the maximum loaded region, only one-fifth of the measurements were of fully lubricated,with a majority (53%) partially lubricated and the remaining 27% insufficiently lubricated.As most of the partially lubricated and insufficiently lubricated measurements occur undertransient operation (0–1549 RPM), it can be deduced that under such operation, varying re-gions within the bearing loaded zone might experience a difference in lubrication.
6. Discussion6.1. Principal Findings
An amplitude-based ultrasonic method for in-situ detection of the flow of lubricantwithin a bearing has been developed. The method enables detection of lubricant within theinlet and outlet region of each individual rollers and was evaluated through laboratorytests under controlled load and lubrication conditions.
The full-scale laboratory testing without lubricant confirmed that the recurring pat-terns between roller passes were attributed to the presence and variation of lubricanton the raceway surface. Further investigation revealed that the duration taken for R totransition from unity to 0.95 or the lubricant reflow time is influenced by bearing load,speed, and lubricant viscosity and thus can be used as a parameter for evaluating the extentof bearing lubrication.
The method is subsequently implemented onto a HSS tapered roller bearing within awind turbine gearbox in the field to explore the variation of bearing lubrication conditionwith turbine operation. From the field measurements, all of the measurements taken atsteady turbine operation (1550 RPM) are fully lubricated. It was found that majority ofinsufficiently lubricated and partially lubricated conditions and also instances of variationin lubrication conditions within the bearing loaded zone occur during transient turbineoperation. Transient operation (0–1549 RPM) is a result of multiple turbine operatingevents such as generator-grid engagement [1], emergency turbine braking and pitching ofblades during cut-out wind conditions. It is thought to occur around 3000 times per yearfor a turbine [1] and such events are typically accompanied with torque fluctuations, rever-sals [1,38,39] and overloading [40] in gearbox bearings, theorized to result in prematurefailure through white etching crack [41]. With the addition of lubrication issues alongsideoverloading instances during transient conditions, the risk of premature failure throughother modes such as adhesive or abrasive wear, scuffing, and fretting also increased. Sub-sequently, adequate bearing lubrication at both transient and steady state operation isnecessary to prevent premature bearing degradation.
6.2. Limitations and Assumptions
The lubrication detection method has several limitations which are discussed here.The method is straightforward as it relies on the difference in reflection coefficient valuesbetween a lubricated (steel–oil interface, R = 0.95) and unlubricated raceway surface (steel–air interface, R = 1), easily calculated through Equation (1). The resolution is thus limited to0.05. In practice it just acts as an indicator as to whether there is oil present on the surfaceor not; i.e., only qualitative evaluation of lubrication condition is possible.
A proper selection of reference pulse is necessary to obtain the correct absolute re-flection coefficient measurements. As two raceway interface conditions exist, i.e., steel–airand steel–oil, this is potentially problematic. If a reference was taken in within a steel–oilinterface, the reflection coefficient will be offset. To alleviate this, the values will requiremultiplication of 0.95. The alternating patterns between the roller passes can be used forverification of the reflection coefficient values as they must exist between 0.95 and unity.
The minimum thickness of free surface lubricant film required to register a reflectioncoefficient of 0.95 is currently subject to further investigation. As explained in [30], it istheorized that with an increase in free surface film thickness, the reflection coefficient fora clean raceway surface will decrease from unity to 0.95. The frequency of the ultrasonicsensor will also have an effect as a free surface lubricant film smaller than one-tenth ofthe pulse wavelength (~60 microns) will not be registered and subsequently mirrors a

Lubricants 2021, 9, 6 20 of 22
steel-air condition (R = 1). The use of multiple longitudinal sensors of varying frequenciescould help with the determination the free surface film thickness through the resonancedip method [31]. The range of free surface film thickness currently observed within bothlaboratory and field bearings are outside of the resonance response of the bandwidth for a10 MHz sensor. By implementing multiple sensors, the free surface film thickness corre-sponding to the range of R values from unity to 0.95 can be quantified. This subsequentlyallows for quantitative determination of the lubricant film thickness inlet and outlet regionof each individual rollers within a bearing.
7. Conclusions
An ultrasonic reflection coefficient-based method has been used for in-situ detectionof bearing lubrication condition through qualitative means. The method was successfullyimplemented onto a full-scale laboratory planetary bearing test rig and also within a fieldoperational HSS gearbox bearing. Recurring reflection coefficient patterns between rollerpasses were used to identify the lubrication condition of the raceway, and the speed atwhich swept away oil reflowed back into place. An absence of these recurring patternsbetween roller passes indicated the absence of lubricant on the bearing surface. Key findingsof this investigation include:
• The lubricant reflow time was found to be positively influenced with increasingbearing rotational speed and lubricant viscosity and negatively with bearing load.
• Three bearing lubrication conditions were observed from the field measurements:fully, partially, and insufficiently lubricated.
• Unique features within the reflection coefficient histogram measurements for eachlubrication condition enabled automatic categorization of field datasets.
• For medium (500–1000 RPM) and high (1001–1550 RPM) rotational speeds, most datasetswere fully lubricated.
• Partially lubricated and insufficiently lubricated measurements were found to berecorded mostly during transient operation, with rotational speeds of ~200 RPM andHSS temperatures close to idle (53 ◦C, 0.5 ◦C higher than idle shaft temperature).
• As transient operation is often accompanied with overloading and torque reversals,issues with bearing lubrication could potentially risk premature failure through modessuch as adhesive or abrasive wear, scuffing, and fretting. Thus, it is crucial thatsufficient lubrication is provided to the bearings at both transient and steady-stateturbine operation to avoid premature bearing failure.
Author Contributions: G.N.: Conceptualization, Data curation, Formal analysis, Investigation,Methodology, Writing—original draft, Writing—review and editing, Visualization. B.P.C.: Conceptu-alization, Investigation, Methodology, Project administration, Resources. R.S.D.-J.: Funding acquisi-tion, Project administration, Resources, Supervision, Writing—review and editing. All authors haveread and agreed to the published version of the manuscript.
Funding: The authors would like to acknowledge the financial support of the Engineering and Physi-cal Sciences Research Council for part funding this research through RDJ’s fellowship on Tribo-AcousticSensors EP/N016483/1 and the Centre for Doctoral Training in Integrated Tribology EP/L01629X/1.This project has also been carried out within the Powertrain Research Hub, PTRH co-funded bythe Offshore Renewable Energy Catapult. The authors would also like to acknowledge their helpand support.
Institutional Review Board Statement: Not applicable.
Informed Consent Statement: Not applicable.
Acknowledgments: The laboratory gearbox bearing test is the property of Ricardo Plc., the authorsare grateful for the loan.
Conflicts of Interest: The authors declare no conflict of interest.

Lubricants 2021, 9, 6 21 of 22
References1. Evans, M. White structure flaking (WSF) in wind turbine gearbox bearings: Effects of ‘butterflies’ and white etching cracks
(WECs). J. Mater. Sci. Technol. 2012, 28, 3–22. [CrossRef]2. Sheng, S. Report on Wind Turbine Subsystem Reliability–A Survey of Various Databases: 2013. NREL/PR-5000–59111. Avail-
able online: https://www.nrel.gov/docs/fy13osti/59111.pdf (accessed on 5 January 2021).3. Kotzalas, M.; Doll, G. Tribological advancements for reliable wind turbine performance. Philos. Trans. R. Soc. A 2010, 368,
4829–4850. [CrossRef] [PubMed]4. Kim, K.; Parthasarathy, G.; Uluyol, O.; Foslien, W.; Sheng, S.; Fleming, P. Use of SCADA Data for Failure Detection in Wind
Turbines. In Proceedings of the ASME 2011 5th International Conference on Energy Sustainability, Washington, DC, USA,7–10 August 2011.
5. Musial, W.; Butterfield, S.; McNiff, B. Improving Wind Turbine Gearbox Reliability. In Proceedings of the European Wind EnergyConference, Milan, Italy, 7–10 May 2007.
6. Zepeng, L.; Long, Z. A review of failure modes, condition monitoring and fault diagnosis methods for large-scale wind turbinebearings. Measurement 2020, 149, 107002.
7. INA. Failure Analysis. INA Bearing Failure Mode Archive, Sach Nr. 009-694-480/TPI 109 GB-D 03012. Available online:https://www.schaeffler.de/content.schaeffler.de/en/news_media/media_library/downloadcenter-detail-page.jsp?id=98147 (ac-cessed on 5 January 2021).
8. FAG. Rolling Bearing Damage—Recognition of Damage and Bearing Inspection. Publication No. WL 82102/2 EA. Available on-line: https://rolling.hu/pdf/FAG/FAG_meghibasodas.pdf (accessed on 5 January 2021).
9. Ernesto, A.; Mazuyer, D.; Cayer-Barrioz, J. From Full-Film Lubrication to Boundary Regime in Transient Kinematics. Tribol. Lett.2015, 59, 23–33. [CrossRef]
10. Williams, J. Engineering Tribology; Cambridge University Press: Cambridge, UK, 2005.11. Stachowiak, G.; Batchelor, A. Engineering Tribology, 4th ed.; Butterworth-Heinemann: Oxford, UK, 2013.12. Chevalier, F.; Lubrecht, A.; Cann, P.; Colin, F.; Dalmaz, G. Film thickness in starved EHL point contacts. Trans. ASME 1998,
120, 126–133. [CrossRef]13. Cann, P.; Damiens, B.; Lubrecht, A. The transition between fully flooded and starved regimes in EHL. Tribol. Int. 2004, 37,
859–864. [CrossRef]14. Berthe, L.; Adams-Chaves, A.; Lubrecht, A. Friction measurement indicating the transition between fully flooded and starved
regimes in elasto-hydrodynamic lubrication. Proc. Inst. Mech. Eng. Part J 2014, 228, 1403–1409. [CrossRef]15. Litwin, W.; Dymarski, C. Experimental research on water-lubricated marine stern tube bearings in conditions of improper
lubrication and cooling causing rapid bush wear. Tribol. Int. 2016, 95, 449–455. [CrossRef]16. Bearing Failure: Causes and Cures. Available online: Shorturl.at/hpwyB (accessed on 22 December 2020).17. Bearing Failure Prevention Guide. Available online: Shorturl.at/fzJVY (accessed on 22 December 2020).18. Spikes, H.; Cann, P. The development and application of the spacer layer imaging method for measuring lubricant film thickness.
Proc. Inst. Mech. Eng. Part J 2001, 215, 261–277. [CrossRef]19. Astridge, D.; Longfield, M. Capacitance measurement and oil film thickness in a large radius disc and ring machine. Proc. Inst.
Mech. Eng. 1967, 182, 89–96. [CrossRef]20. El-Sisi, S.; Shawki, G. Measurement of oil-film thickness between disks by electrical conductivity. J. Fluids Eng. 1960, 82,
12–16. [CrossRef]21. Hameed, Z.; Hong, Y.; Cho, Y.; Ahn, S.; Song, C. Condition Monitoring and Fault Detection of Wind Turbines and Related
Algorithms: A Review. Renew. Sustain. Energy Rev. 2009, 13, 1–39. [CrossRef]22. Mills, R.; Avan, E.; Dwyer-Joyce, R. Piezoelectric sensors to monitor lubricant film thickness at piston-cylinder contacts in a fired
engine. Proc. Inst. Mech. Eng. Part J 2013, 227, 100–111. [CrossRef]23. Dwyer-Joyce, R.; Reddyhoff, T.; Drinkwater, B. Operating limits for acoustic measurement of rolling bearing oil film thickness.
Tribol. Trans. 2004, 47, 366–375. [CrossRef]24. Dwyer-Joyce, R.; Reddyhoff, T.; Zhu, J. Ultrasonic measurement for film thickness and solid contact in elastohydrodynamic
lubrication. J. Tribol. 2011, 133, 031501. [CrossRef]25. Zhang, J.; Drinkwater, B.; Dwyer-Joyce, R. Monitoring of lubricant film failure in a ball bearing using ultrasound. J. Tribol.
Trans. ASME 2006, 128, 612–618. [CrossRef]26. Zhang, J.; Drinkwater, B.; Dwyer-Joyce, R. Acoustic measurement of lubricant-film thickness distribution in ball bearings. J. Acoust.
Soc. Am. 2006, 119, 863–871. [CrossRef]27. Zhang, K.; Meng, Q.; Zhao, W. Measurement of oil film thickness in cylindrical roller bearing by ultrasound. In Proceedings of
the ASME 2014 12th Biennial Conference on Engineering Systems Design and Analysis, Copenhagen, Denmark, 25–27 July 2014.28. Li, M.; Jing, M.; Chen, Z.; Liu, H. An improved ultrasonic method for lubricant-film thickness measurement in cylindrical roller
bearings under light radial load. Tribol. Int. 2014, 78, 35–40. [CrossRef]29. Li, M.; Liu, H.; Xu, C.; Jing, M.; Dong, G. Ultrasonic Measurement of Cylindrical Roller-Bearing Lubricant Film Distribution with
Two Juxtaposed Transducers. Tribol. Trans. 2017, 60, 79–86. [CrossRef]30. Nicholas, G.; Howard, T.; Long, H.; Wheals, J.; Dwyer-Joyce, R. Measurement of roller load, load variation and lubrication in a
wind turbine gearbox high-speed shaft bearing in the field. Tribol. Int. 2020, 148, 106322. [CrossRef]

Lubricants 2021, 9, 6 22 of 22
31. Pialucha, T.; Guyott, C.; Cawley, P. Amplitude spectrum method for the measurement of phase velocity. Ultrasonics 1989,27, 270–279. [CrossRef]
32. Dwyer-Joyce, R.; Drinkwater, B.; Donohoe, C. The measurement of lubricant-film thickness using ultrasound. Proc. R. Soc. A 2003,459, 957–976. [CrossRef]
33. Reddyhoff, T.; Kasolang, S.; Dwyer-Joyce, R. The phase shift of an ultrasonic pulse at an oil layer and determination of filmthickness. Proc. Inst. Mech. Eng. 2005, 219, 387–400. [CrossRef]
34. Geng, T.; Meng, Q.; Chen, Z.; Wang, P. Ultrasonic monitoring of lubricating conditions of hydrodynamic bearings. J. Phys. 2011,305, 012065. [CrossRef]
35. Dwyer-Joyce, R.; Reddyhoff, T. Ultrasonic Measurement of EHL Oil Films in a Mixed Regime Contact. In Proceedings of theSTLE/ASME 2006 International Joint Tribology Conference, San Antonio, TX, USA, 23–25 October 2006.
36. Howard, T. Development of a Novel Bearing Concept for Improved Wind Turbine Gearbox Reliability. Ph.D. Thesis,The University of Sheffield, Sheffield, UK, 2016.
37. Hunter, A.; Dwyer-Joyce, R.; Harper, P. Calibration and validation of ultrasonic reflection methods for thin-film measurement intribology. Meas. Sci. Technol. 2012, 23, 105605. [CrossRef]
38. Troubleshooting Wind Gearbox Problems. Available online: Shorturl.at/rvCDQ (accessed on 17 September 2020).39. Heege, A.; Betran, J.; Radovcic, Y. Fatigue load computation of wind turbine gearboxes by coupled finite element, multi-
body system and aerodynamic analysis. Wind Energy 2007, 10, 395–413. [CrossRef]40. Bruce, T.; Long, H.; Dwyer-Joyce, R. Dynamic modelling of wind turbine gearbox bearing loading during transient events.
IET Renew. Power Gener. 2015, 9, 821–830. [CrossRef]41. Bruce, T.; Rounding, E.; Long, H.; Dwyer-Joyce, R. Characterisation of white etching crack damage in wind turbine gearbox
bearings. Wear 2015, 338, 164–177. [CrossRef]