Detection of human TNF-α mRNA by NASBA
10
JOURML OF I-ICAL METHODS Journal of Immunological Methods 2 I7 (I 998) 19-28 ELSEVIER Detection of human TNF-a! mRNA by NASBA’” B.M. Darke, S.K. Jackson, S.M. Hanna, J.D. Fox * Department of Medical Microhiolop, Uniwrsity of Wales Collegr ofMedicine. Heath Park. Curdiff CF4 4.YN. UK Received 24 July 1997; revised I6 October 1997; accepted 1 December 1997 Abstract A method to amplify and detect TNF-a mRNA from primed Mono Mac 6 cells is described. A silica-based extraction system was utilised for preparation of cell extracts and specific oligonucleotide primers were designed for amplification of TNF-(r mRNA by the NASBA process. Amplification products were detected using either a liquid hybridisation assay, with analysis by polyacrylamide gel electrophoresis, or a plate hybridisation system. The method has many potential applications for the study of inflammatory cytokines and cellular mRNAs in cell culture and clinical samples. 6 1998 Elsevier Science B.V. All rights reserved. Kgwords: Tumour necrosis factor-a: Nucleic acid sequence based amplification; Messenger ribonucleic acid detection 1. Introduction The pro-inflammatory cytokine TNF-(U has been implicated in the pathogenesis of many diseases, Abbreviations: TNF-u, tumour necrosis factor cy; mRNA, messenger ribonuclric acid; LPS, lipopolysaccharide; NASBA, nucleic acid sequence based amplification.; AMV. avian myeloblastosih virus; RT, reverse transcriptase; FCS, low mdo- toxin foetal calf serum: PMA, phorbol l2-myristate 13.acetate: PBS, phosphate-buffered saline; ELISA, enzyme-linked immuno- sorbent assay: HRP. horseradish peroxidase: TMB. tetramethyl- benzidine: dNTP. deoxynucleoside triphosphate: ATP. UTP, CTP. GTP, ITP, adenosine, uridine, cytidine. guanosine. inosine triphos- phates respectively; DTT. dithiothreitol; DMSO. dimethyl sulphoxide: BSA. bovine serum albumin: SSC, saline-sodium citrate buffer; SSPE. saline-sodium phosphate-EDTA buffer: SDS, sodium dodecyl sulfate Uauryl sulfate); DIG, digoxigenin; TBS. tris-buffered saline: ELGA, enzyme-linked gel assay; RT- PCR. reverse-transcribed polymerase chain reaction Corresponding author. Tel.: + 44-01222-743-583; fax: + 44- 01222.742. I6 I : e-mail: [email protected]. including septic shock, rheumatoid arthritis and cere- bral malaria (Beutler and Grau, 1993). It is central in the host response to infection, inflammation, injury and immunological challenge. Overexpression of TNF-a. and related cytokines, is deleterious due to excessive inflammatory reactions producing tissue injury. Anti-inflammatory cytokines. such as IL- 10 and IL- 13, and specific naturally occurring inhibitors of cytokines limit the severity of inflammation in- duced by pro-inflammatory cytokines. An individual’s net biological response of pro- and anti- inflammatory cytokines determines the outcome of a particular disease process (Romagnani. 1996). An important strategy in the investigation of in- flammatory disease is the measurement of the level of cytokines in peripheral blood (De Groote et al., 1992). Such measurement may be problematic since cytokines have a short half-life and may bind to cell surface or soluble receptors resulting in their effec- tive removal from the circulation. In addition. most 0022- 17.59/98/$19.00 0 I998 Elsevier Science B.V. All right& reserved. PIJ SOO22- I759(97)002 I I -I
Transcript of Detection of human TNF-α mRNA by NASBA

JOURML OF I-ICAL METHODS
Journal of Immunological Methods 2 I7 (I 998) 19-28 ELSEVIER
Detection of human TNF-a! mRNA by NASBA’”
B.M. Darke, S.K. Jackson, S.M. Hanna, J.D. Fox *
Department of Medical Microhiolop, Uniwrsity of Wales Collegr ofMedicine. Heath Park. Curdiff CF4 4.YN. UK
Received 24 July 1997; revised I6 October 1997; accepted 1 December 1997
Abstract
A method to amplify and detect TNF-a mRNA from primed Mono Mac 6 cells is described. A silica-based extraction system was utilised for preparation of cell extracts and specific oligonucleotide primers were designed for amplification of TNF-(r mRNA by the NASBA process. Amplification products were detected using either a liquid hybridisation assay, with analysis by polyacrylamide gel electrophoresis, or a plate hybridisation system. The method has many potential applications for the study of inflammatory cytokines and cellular mRNAs in cell culture and clinical samples. 6 1998 Elsevier Science B.V. All rights reserved.
Kgwords: Tumour necrosis factor-a: Nucleic acid sequence based amplification; Messenger ribonucleic acid detection
1. Introduction
The pro-inflammatory cytokine TNF-(U has been implicated in the pathogenesis of many diseases,
Abbreviations: TNF-u, tumour necrosis factor cy; mRNA,
messenger ribonuclric acid; LPS, lipopolysaccharide; NASBA,
nucleic acid sequence based amplification.; AMV. avian
myeloblastosih virus; RT, reverse transcriptase; FCS, low mdo-
toxin foetal calf serum: PMA, phorbol l2-myristate 13.acetate:
PBS, phosphate-buffered saline; ELISA, enzyme-linked immuno-
sorbent assay: HRP. horseradish peroxidase: TMB. tetramethyl-
benzidine: dNTP. deoxynucleoside triphosphate: ATP. UTP, CTP. GTP, ITP, adenosine, uridine, cytidine. guanosine. inosine triphos-
phates respectively; DTT. dithiothreitol; DMSO. dimethyl
sulphoxide: BSA. bovine serum albumin: SSC, saline-sodium
citrate buffer; SSPE. saline-sodium phosphate-EDTA buffer:
SDS, sodium dodecyl sulfate Uauryl sulfate); DIG, digoxigenin;
TBS. tris-buffered saline: ELGA, enzyme-linked gel assay; RT-
PCR. reverse-transcribed polymerase chain reaction
Corresponding author. Tel.: + 44-01222-743-583; fax: + 44-
01222.742. I6 I : e-mail: [email protected].
including septic shock, rheumatoid arthritis and cere-
bral malaria (Beutler and Grau, 1993). It is central in the host response to infection, inflammation, injury and immunological challenge. Overexpression of
TNF-a. and related cytokines, is deleterious due to excessive inflammatory reactions producing tissue injury. Anti-inflammatory cytokines. such as IL- 10 and IL- 13, and specific naturally occurring inhibitors of cytokines limit the severity of inflammation in- duced by pro-inflammatory cytokines. An individual’s net biological response of pro- and anti- inflammatory cytokines determines the outcome of a particular disease process (Romagnani. 1996).
An important strategy in the investigation of in- flammatory disease is the measurement of the level
of cytokines in peripheral blood (De Groote et al., 1992). Such measurement may be problematic since cytokines have a short half-life and may bind to cell surface or soluble receptors resulting in their effec- tive removal from the circulation. In addition. most
0022- 17.59/98/$19.00 0 I998 Elsevier Science B.V. All right& reserved.
PIJ SOO22- I759(97)002 I I -I

20 B.M. Dade et aL/Jourrd qf Immunological Methods 212 (1998) 19-28
cytokines are produced in the tissues and act locally. Circulating cytokines may reflect excessive local production of inflammatory mediators and their site of origin may be difficult to determine (Vassalli.
1992). An understanding of the factors which control
cytokine responses to infection will lead to the de- velopment of novel therapeutic regimens to treat septic shock. We have been investigating how mix- tures of bacterial products and host mediators can influence TNF-rw and other cytokine production in leukocytes (Jackson, 1994; Darmani et al., 1995). It is important to understand the level (transcription,
translation, secretion) at which such factors might influence the production of cytokines. We have used the human monocytic cell line Mono Mac 6 (Ziegler-Heitbrock et al., 1988) as a convenient model to study the production of inflammatory medi- ators following stimulation with bacterial LPS.
In order to understand the level at which cytokine synthesis is controlled it is important to assess the presence and level of specific mRNA in cells and tissues. A number of recent publications have de-
scribed nucleic acid extraction procedures together with RT-PCR for analysis of cytokine mRNA (e.g. Canque et al., 1996, Woo et al., 1996, Saghizadeh et al., 1996, Lo et al., 1997). These methods require extraction and purification of mRNA, cDNA synthe-
sis and then one or two rounds of PCR amplification prior to analysis. As an alternative to these proce- dures we have developed and evaluated the use of a simple silica-based extraction with a rapid method, based on the isothermal NASBA process, for mea- surement of TNF-u mRNA in cellular samples.
The NASBA reaction mixture contains two oligo- nucleotide primers and three enzymes: AMV-RT, RNase H and T7 RNA polymerase for target-specific
amplification of RNA (Guatelli et al., 1990, Kievets et al., 1991). This method has proved useful for the detection and quantification of viral RNA and viral and cellular mRNAs (Sooknanan et al.. 1993; Smits et al.. 1995; Sillekens, 1996) but has not previously been applied to the study of cytokine expression. The method utilises a single 90-min amplification step and does not require a thermocycler. Also total nucleic acid preparations can be utilised in the NASBA reaction as any contaminating DNA would not be amplified by this process. In our study we
have developed and optimised a method based on
NASBA for assessment of the presence and level of TNF-a in tissue culture cells. However, the method has potential application for the measurement of TNF-rr mRNA in clinical samples and a similar
strategy could be used for measurement of other mRNA species of interest in the investigation of the inflammatory disease process.
2. Materials and methods
2.1. Stimulation of Mono Mac 6 cells and collectioiz
oJ’ samples
Mono Mac 6 cells were plated at 1 ml per well (5 X 10’ cells/ml) in complete RPMI/lO% FCS in
24-well plates and 100 ng of E. coli 0111 B4 LPS and 50 ng PMA were added giving similar condi- tions to those recommended by Pradines-Figueres and Raetz (f992). After the appropriate incubation time (O-3 h), the cells and medium were harvested, centrifuged at 700 X g for 3 min and the super- natants stored at - 80°C for measurement of TNF-a protein. The cells were washed with excess PBS,
resuspended in 1 ml PBS, transferred to 9 ml of lysis buffer (50 mM Tris pH 6.4, 20 mM EDTA, 1.3% w/v Triton X-100 and 5.25 M guanidine thio- cyanate) and frozen at -80°C in aliquots, for nu-
cleic acid extraction.
2.2. Measurement of’ TNF-CY protein
A sandwich ELISA using a monoclonal capture antibody, biotinylated anti-TNF-cy (R&D Systems Europe, Abingdon, UK), streptavidin-HRP conju-
gate (Zymed Laboratories, San Francisco, USA) and TMB substrate (Kirkegaard and Perry Laboratories, Maryland, USA) was performed on cell-free tissue culture supernatants. Each 96-well plate was run with a set of standards using a range from 1000 pg/ml to 15.6 pg/ml rhTNF-a, (R and D Systems) and sample TNF-LU concentrations were determined from the respective standard curves.
2.3. Extraction of nucleic acids
Nucleic acid from the equivalent of 5 X 10J cells in lysis buffer was extracted using a silica-based
B.M. Duke et al. / Journal of Immunological Methods 212 (1998) 19-28
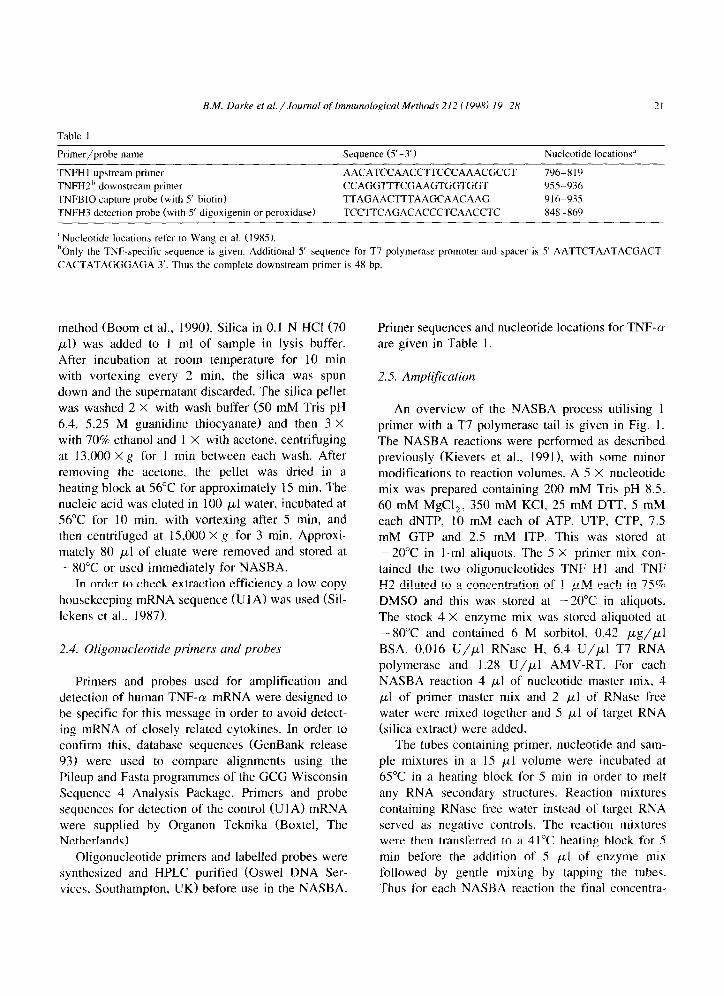
Table 1
Primer/probe name Sequence (S-3’)
TNFH I upstream primer AACATCCAACCTTCCCAAACGCCT
TNFHZh downstream primer CCAGGTTTCGAAGTGGTGGT
TNFBIO capture probe (with 5’ biotin) TTAGAACTTTAAGCAACAAG
TNFH3 detection probe (with 5’ digoxigenin or peroxidase) TCCTTCAGACACCCTCAACCTC
“Nucleotidr locations refer to Wang et al. (1985).
21
Nucleotide locations’
796-819
955-936
916-935
848-869
hOnly the TNF-specific sequence is given. Additional 5’ sequence for T7 polymerase promoter and spacer is 5’ AATTCTAATACGACT-
CACTATAGGGAGA 3’. Thus the complete downstream primer is 48 bp.
method (Boom et al., 1990). Silica in 0.1 N HCI (70 ~1) was added to 1 ml of sample in lysis buffer. After incubation at room temperature for 10 min with vortexing every 2 min, the silica was spun
down and the supernatant discarded. The silica pellet
was washed 2 X with wash buffer (50 mM Tris pH 6.4. 5.25 M guanidine thiocyanate) and then 3 X with 70% ethanol and 1 X with acetone, centrifuging at 13,000 X g for 1 min between each wash. After removing the acetone, the pellet was dried in a heating block at 56°C for approximately 15 min. The nucleic acid was eluted in 100 ~1 water. incubated at 56°C for 10 min, with vortexing after 5 min, and then centrifuged at 15,000 X s for 3 min. Approxi- mately 80 ~1 of eluate were removed and stored at - 80°C or used immediately for NASBA.
In order to check extraction efficiency a low copy housekeeping mRNA sequence (Ul A) was used (Sil-
lekens et al., 1987).
2.4. Oligo?lucleotide primers and probes
Primers and probes used for amplification and detection of human TNF-cr mRNA were designed to be specific for this message in order to avoid detect- ing mRNA of closely related cytokines. In order to confirm this, database sequences (GenBank release 93) were used to compare alignments using the Pileup and Fasta programmes of the GCG Wisconsin Sequence 4 Analysis Package. Primers and probe
sequences for detection of the control (UI A) mRNA were supplied by Organon Teknika (Boxtel, The Netherlands).
Oligonucleotide primers and labelled probes were synthesized and HPLC purified (Oswel DNA Ser- vices. Southampton, UK) before use in the NASBA.
Primer sequences and nucleotide locations for TNF-(U are given in Table 1.
2.5. Amplification
An overview of the NASBA process utilising 1 primer with a T7 polymerase tail is given in Fig. 1.
The NASBA reactions were performed as described previously (Kievets et al., 1991), with some minor modifications to reaction volumes. A 5 X nucleotide mix was prepared containing 200 mM Tris pH 8.5. 60 mM MgCl,, 350 mM KCl, 25 mM DTT, 5 mM each dNTP, 10 mM each of ATP, UTP, CTP. 7.5 mM GTP and 2.5 mM ITP. This was stored at - 20°C in l-ml aliquots. The 5 X primer mix con-
tained the two oligonucleotides TNF HI and TNF H2 diluted to a concentration of 1 PM each in 75% DMSO and this was stored at -20°C in aliquots.
The stock 4 X enzyme mix was stored aliquoted at -80°C and contained 6 M sorbitol, 0.42 pg/pl BSA, 0.016 U/p1 RNase H. 6.4 U/p1 T7 RNA polymerase and 1.28 U/p1 AMV-RT. For each NASBA reaction 4 ~1 of nucleotide master mix, 4 ~1 of primer master mix and 2 ~1 of RNase free water were mixed together and 5 ~1 of target RNA (silica extract) were added.
The tubes containing primer, nucleotide and sam- ple mixtures in a 15 ~1 volume were incubated at 65°C in a heating block for 5 min in order to melt
any RNA secondary structures. Reaction mixtures containing RNase free water instead of target RNA served as negative controls. The reaction mixtures were then transferred to a 41°C heating block for 5 min before the addition of 5 ~1 of enzyme mix followed by gentle mixing by tapping the tubes. Thus for each NASBA reaction the final concentra-

22 B.M. Durke et al./ Journal qf Immunological Methods 212 (1998) 19-28
ssRNA target
Ir primer 2 RNase H
Amplified transcripts
f ‘1’7 RNA pal “\
5’-----Y 5: --q
- 3’7 3’ Double-stranded 5 ’ DNA intermediate
Fig. I. Schematic overview of the NASBA process. The first stage in the reaction is primer-directed reverse transcription to create a cDNA
copy of the RNA target. The RNA strand is digested by the action of RNase H and a second target-specific primer hybridises to the cDNA.
The RT extends from this primer to produce a double-stranded DNA version of the original target sequence, including the T7 RNA
polymerase promoter sequence which is included as a ‘tail’ on the end of the first primer. A double-stranded version of the promoter is
created during this part of the reaction and T7 RNA polymerase is able to run off RNA transcripts of opposite sense to the original target.
The cyclic phase occurs because the amplified RNA will itself act as a target for primer 2 which, with the action of RNase H and RT, leads
to the production of additional copies of the double-stranded DNA intermediate.
tion of reactants was 40 mM Tris pH 8.5, 12 mM
MgCl,, 70 mM KCl, 5 mM DTT, 1 mM each dNTP, 2 mM each of ATP, UTP, CTP, 1.5 mM GTP, 0.5
mM ITP, 0.2 PM each primer, 1.5 M sorbitol, 2.1 pg BSA, 0.08 U RNase H, 32 U T7 RNA poly- merase and 6.4 U AMV-RT. Nucleoside triphos-
phates were obtained from Pharmacia Biotech. (St. Albans, UK) with the exception of ITP which was a gift from Organon Teknika. The T7 polymerase and RNase H were purchased from Pharmacia and the AMV-RT from Seikagaku America (Ijamsville, USA). The stock solution of 1 M MgCl? was pur- chased from Sigma-Aldrich (Poole, UK). BSA (20 mg/ml) was obtained from Boehringer Mannheim (Lewes, UK).
After transfer of the tubes to a water bath and
amplification at 41°C for 90 min the reaction was stopped by cooling on ice. The amplified products were either analysed immediately or stored at - 80°C for later study.
2.6. Enzyme-linked gel assay (ELGA)
ELGA, a rapid nonradioactive ‘in-solution’ hy- bridisation assay, was performed according to the method of van der Vliet et al. (1993) with some
modifications. The dilution of each batch of HRP-
probe for ELGA was pre-optimised. NASBA product (3 ~1) was mixed with an equal volume of HRP- labelled probe in a hybridisation solution (final con- centration of the hybridisation mix was 1 X SSC,
4.2% v/v glycerol, 1.7 mM sodium phosphate buffer pH 6.7, 0.01% w/v bromophenol blue and xylene cyan01 and approximately 10” copies of HRP- la- belled probe) and incubated at 41°C for 15 min to allow hybridisation to occur. Hybridisation reaction mixtures (3 ~1) were loaded onto a 7% acrylamide gel containing 0.04% w/v dextran sulphate. After electrophoresis with Tris/boric acid/EDTA buffer, the gel was stained in 1 component TMB substrate (Kirkegaard and Perry) until the blue colour devel- oped. Stained gels were dehydrated in
methanol/glycerol and then dried between sheets of cellophane overnight.
2.7. Plate detection of NASBA products
The optimum dilution of the biotinylated capture probe and the DIG detection probe was predeter- mined (approximately 1 in 2000 dilution of purified biotinylated oligonucleotide and 1 in 30 dilution of purified DIG oligonucleotide). The stock hybridisa-

B.M. Duke et nl./Journal of Imnwtological Methods 212 f IYWl 19-28
tion solution (HSI was made fresh each day (final
concentrations were 5 X SSPE, 0.1% w/v SDS, 0.1% w/v BSA, 10 /_&ml salmon testis DNA). The final concentration of the biotinylated probe was 0.2 pg/ml in HS. This capture hybridisation solu-
tion (CHS) was preheated at 45°C for 10 min and then 50 ~1 volumes were added to streptavidin coated strips (Boehringer Mannheim). NASBA product (5 ~1) was added to the CHS in the wells and incubated at 37°C overnight. After washing the wells 4 X with 2 X SSC/O.l% w/v BSA wash solution (WS), 50 ~1 of HS containing approximately 6.8 pg/ml of DIG-labelled detection probe, preheated to 45°C were added and incubated at 45°C for 30 min. The wells were then washed 2 X with WS and 2 X with
TBS/Tween pH 7.5 (TBST) and 50 ~1 of a 1 in 100 dilution of anti-DIG peroxidase conjugate (Boeh- ringer Mannheim) in TBST/l% w/v BSA were added and incubated for 30 min at 37°C. After
washing 4 X with TBST, 50 ~1 of TMB substrate (Kirkegaard and Perry) were added and incubated at room temperature for 20 min. The reaction was
stopped with 0.5 M sulphuric acid and the optical density read on a plate reader at a wavelength of 450 nm.
The stock solutions of 20 X SSPE, 10% SDS and 10 mg/ml salmon testis DNA were obtained from Sigma-Aldrich. BSA was purchased from Wilfrid
Smith (Edgware. UK).
3. Results
3.1. Experiment 1: Evaluation of methods for detec- tion qf NASBA products
Dilutions of TNF-a NASBA products were anal- ysed by plate hybridisation (Figs. 2 and 3) or ELGA (Fig. 4). The results for Fig. 2 and for Fig. 4 lanes l-7 are for dilutions of NASBA product amplified from in vitro transcribed RNA. The amount of am- plified sequence is high and the end-point detection is 2 I in 3200 or 1 in 800 for ELGA or plate detection, respectively. The results for Fig. 3 and for Fig. 4 lanes 8-l 1 are for an extract of RNA from Mono Mac 6 cells stimulated with PMA and E. coli LPS. The amount of amplified sequence is not as
Reciprocal dilution of NASBA product
ELGA lane (figure 4)
1 2 3 4 5 6 7
Fig. 2. Reciprocal dilutions of NASBA product amplified from in
vitro transcribed RNA (preparation I) analysed by plate hybridiza-
tion. The lane designations for the same product dilutions anal-
ysed by ELGA (Fig. 4) are given for comparison. Dotted line
gives the average background reading for the plate detection
system in this assay (no amplified product).
high as for the in vitro transcribed RNA but the correlation between results obtained by ELGA and those for the plate hybridisation method is good with the end-point detection 2 1 in 40 or 2 1 in 20, respectively. The end-point detection for amplified TNF-(U products indicated that ELGA was more sensitive than plate detection. The semiquantitative
nature of the amplification and both detection sys- tems was clear from the results of this experiment.
5 10 20 40
Reciprocal dilution of NASBA product
1 S ELyIane (fiy;re4) ,, 1
Fig. 3. Reciprocal dilutions of NASBA product amplified from
extract of stimulated (LPS and PMA) Mono Mac 6 cells (prepara-
tion 2) analysed by plate hybridization. The lane designations for
the same product dilutions analysed by ELGA (Fig. 4) are given
for comparison. The dotted line gives the average background
reading for the plate detection system in this assay (no amplified
product).

24 B.M. Duke et al. / Journal oj’hmunological Methods 212 (1998) 19-28
1 2 3 4 6 6 7 6 9101112 13
TNF a- amplified product
Fig. 4. Reciprocal dilutions of NASBA products analysed by ELGA (see Figs. 2 and 3 for more details). Lanes: l-7, doubling dilutions ( 1
in 50 to 1 in 3200) of preparation 1, lanes 8-11: Doubling dilutions (I in 5 to 1 in 40) of preparation 2. lane 12: TNF-a positive control
amplification product, lane 13: TNF-a peroxidase-labelled probe control (no amplified product).
3.2. Experiment 2: Assessment of the relationship between TNF-a mRNA input, amount of NASBA product and TNF-cr protein
In this time course experiment Mono Mac 6 cells
were incubated with 100 ng LPS/ml and 50 ng
PMA/ml. ELISA for TNF-(Y protein was under- taken on tissue culture supematants and nucleic acids were extracted from the cellular fraction. Extracts from the cell pellets contained detectable ‘housekeeping’ mRNA (Ul A) after amplification and
detection by ELGA and plate hybridization. There
1234567691011
UIA - amplified product
Fig. 5. Analysis of Mono Mac 6 cell extracts for ‘housekeeping’ UIA mRNA by NASBA. Amplified products were analysed undiluted by
ELGA. Lane 1: control (no LPS/PMA), lane 2: 5 min, lane 3: 30 min. lane 4: I h. lane 5: 2 h, lane 6: 3 h post simulation with LPS/PMA.
Lane 7-9: NASBA negative control products, lane 10: U I A peroxidase-labelled probe control (no amplified product). lane 11: U 1 A positive
control amplification product.

B.M. Darke et al./.Ioorrrnal of Immunological Methods 21-3 (1998) 19-X 1s
was no detectable difference in extraction efficiency
between all samples analysed in this experiment. Results for U 1 A amplification of mRNA with ELGA analysis are given in Fig. 5. Utilising plate detection for analysis of UlA amplified products the average absorbance value was 1.80 (range 1.4-2.0, compared with average water negative control of 0.14). The results for detection of UlA in these preparations confirmed that the LPS/PMA stimulation did not
effect the presence and level of this control mRNA. The cell pellet extracts were amplified using the
TNF-a-specific primers and undiluted products anal- ysed by ELGA and plate hybridization methods. Results for TNF-cz protein and TNF-(U mRNA anal- ysed by the plate detection method are given in Fig. 6. The results for undiluted TNF-cu products anal- ysed by ELGA are given in Fig. 7 lanes l-6.
As for experiment 1 the correlation between plate hybridization and ELGA methods for analysis of
2 4-11 I400
22
2.0 i 1 8-
16.
14. .E
0 20 40 60 80 100 120 140 160 180 200
Time Post LPSl PMA (minutes)
Fig. 6. Analysis of Mono Mac 6 cell extracts for TNF-cu mRNA
by NASBA with plate detection compared with analysis of extra-
cellular fluid for TNF-(U protein by ELISA after stimulation with
LPS/PMA (time course experiment). The dotted line gives the
average background reading for the amplified TNF-cu mRNA
plate detection system in this assay (no amplified product). The
lane designations for the same undiluted products (Fig. 7) and for
dilutions of the products (Fig. 8) analysed by ELGA are given for
comparison.
1 2 3 4 6 6 7 6 910 Ill2
Fig. 7. Analysis of Mono Mac 6 cell extracts for TNF-o mRNA
by NASBA with ELGA detection after stimulation with
LPS/PMA (time course experiment, see Fig. 6 for protein results).
NASBA products were analysed undiluted by ELGA. Lane I: control (no LPS/PMA), lane 2: 5 min. lane 3: 30 min, lane 4: I h.
lane 5: 2 h, lane 6: 3 h post simulation with LPS/PMA. Lane
7-10: NASBA negative control products, lane I I: TNF-o posi-
tive control amplification product. lane 12: TNF-o peroxidase-
labelled probe control (no amplified product).
amplified products was good but the latter method was more sensitive for detection of low-level TNF-(U sequences. Fig. 6 illustrates that TNF-a mRNA is detectable before protein and that the maximum value for both is obtained after 60-120 min stimulation. Results for TNF-(Y amplified product by ELGA indi- cate that low-level specific mRNA is detectable
without any stimulation but the amount of product increases rapidly with time post-stimulation. In order to assess the amount of TNF-a sequence in the amplified material, dilutions of TNF-cx products were analysed by ELGA and the results are given in Fig. 8. The control (no stimulation) and the 5-min post- stimulation amplified products were analysed at a 1 in 10 dilution and only a very weak band is visible by ELGA. In contrast, dilutions of amplified prod- ucts taken at 30 min, or later, post-stimulation were detectable at a dilution of 2 1 in 100. Those ampli- fied products from samples taken at 1 h, or later.

B.M. Darke et al. / Journal of Immunological Methods 212 (1998) 19-28
1 2 3 4 5 6 7 8 9 10 111213 1415 1617 1819 20 21 22 23
Fig. 8. Analysis of Mono Mac 6 cell extracts for TNF-a mRNA by NASBA with ELGA detection. This is a time course experiment after
stimulation with LPS/PMA (see Fig. 6 for protein results and Fig. 6Fig. 7 for analysis of undiluted products.). NASBA products were
analysed at the dilutions indicated in brackets. Lane 1: control (no LPS/PMA. 1 in lo), lane 2: 5 min stimulation (I in IO), lanes 3-6:
30 min stimulation, (1 in 10, 50, 100, 500) lanes 7-1 1: I h stimulation (1 in 10. 50, 100, 500, lOOO), lanes 12-16: 2 h stimulation (1 in 10.
50, 100, 500. lOOO), lanes 17-21: 3 h simulation (1 in 10. 50. 100. 500, 1000). Lane 22: TNF-a positive control amplification product
(undiluted). lane 23: TNF-o peroxidase-labelled probe control (no amplified product).
post-stimulation contained detectable TNF-(Y se- quences at a dilution of 2 1 in 500.
4. Discussion
The pleiotropic cytokine TNF-a plays a key role in inflammatory disease. The association of TNF-a with the pathogenesis of such diseases has largely been deduced from detection of this cytokine in the blood or other fluids employing immunoassays or
assays of TNF-a cytotoxicity (Matthews and Neale, 1987). However it is increasingly recognised that detection of cytokines in the circulation is difficult to interpret as the secreted proteins have a short half-life and may be bound to soluble receptors or other inactivators. In addition, it may be difficult to deduce the cellular sources of TNF-a from circulating, se- creted protein. Therefore, measurement of TNF-a transcription in the tissues during inflammatory dis- orders will yield a more direct correlation between cytokine production and disease progression.
Although a number of publications have reported the development and successful use of RT-PCR for detection of the presence and level of TNF-(r mRNA the methods are time-consuming and technically de- manding (Canque et al., 1996, Woo et al., 1996,
Saghizadeh et al., 1996, Lo et al., 1997). We have described a new method to amplify and detect TNF-a mRNA. Originally described for the detection and
quantification of viral RNA, we have adapted the NASBA technique for the detection of TNF-a mRNA in a human monocytic cell line (Mono Mac 6) stimulated with LPS. Potential advantages of the NASBA process above RT-PCR include the isother- mal nature of the amplification (no thermocycler is required), the time for the amplification to take place (a single step of 90 min). the selective amplification of RNA above DNA (primers need not span splice junctions in order to eliminate possible amplification from a DNA target) and production of single-stranded amplified products which are suitable for detection by liquid or solid-phase hybridisation protocols. Al- though there will be laboratory preferences for dif- ferent amplification protocols our study has demon- strated that NASBA is a suitable alternative to RT- PCR for the detection of mRNA.
In this study oligonucleotide primers and labelled probes were designed to amplify and detect human TNF-(Y sequences and not those of closely related cytokines (or TNF-a from murine or other animal sources). A similar strategy could be employed for design of oligonucleotides for other cellular and cytokine mRNAs. Our data from in vitro transcribed RNA and controls in our study confirm that the

B.M. Darke et al. / Journal of Immunological Methods 212 11998) 19-28 27
amplification and detection systems have the re-
quired specificity. The silica-based extraction method first described by Boom and colleagues (Boom et al., 1990) has proved useful for mRNA extraction from cellular samples, without the need for phenol and or chloroform extraction steps. The method is not selec- tive for TNF-(Y and offers the opportunity for analy- sis of other transcripts from the sample extracts.
Studies utilising NASBA for the detection of viral
RNA and mRNA have confirmed the exponential nature of the NASBA process but use different meth-
ods to those described in this study for analysis of amplified products. The first part of this study (ex-
periment 1) was undertaken to confirm that the detection signal obtained was related to the amount of TNF-u -specific amplified product. Results for the second part of the study (experiment 2) confirmed that the input copy of target TNF-a mRNA was related to the amount of amplified product. Although
the ELGA system for analysis of amplified products was useful and gave semiquantitative data in our
study, the plate detection method would be the most applicable to quantitative analysis of TNF-(r mRNA in large numbers of samples. The plate detection method is specific for the detection of TNF-a ampli-
fied products but the sensitivity requires some en- hancement, perhaps by use of chemiluminescent la- bels. A detection method, based on the strategy employed in this study but utilising such labelled
probes, is currently in preparation and will be as- sessed for analysis of NASBA products. A further modification of the procedure to control for any tube to tube variation in TNF-(r mRNA amplification will
include addition of known quantities of an internal control sequence. This will be modified such that it is amplified with the specific primers but is distin-
guishable from wild-type sequence by use of a dif- ferent detection probe in the hybridization procedure. Thus, in a similar way to that described for quantifi- cation of HIV genomic RNA (Sillekens, 1996) it will be possible to assess the presence and level of TNF-a mRNA, as well as carry out a quality-control check in a single amplification tube.
Although the study described utilised cell lines and in vitro stimulations, the method offers the
potential for the detection and quantification of TNF- 1y mRNA in extracts from cells and tissues from patients with inflammatory diseases such as septic
shock. The method described could also be used to
determine the mode of action of novel therapeutic agents or particular compounds which may affect activation or excretion of this important inflamma- tory cytokine.
Relatively few studies have described TNF-cu mRNA or protein detection in tissues from patients with infectious or inflammatory disease. Immunohis- tochemical detection of TNF-a protein in inflamma-
tory cells of patients with chronic inflammatory dis- orders (Di Girolamo et al., 1997) has been reported.
In one study, TNF-a mRNA was localised to partic- ular tissues by in situ hybridisation (Barnes et al.,
1990). In order to extend studies to analyse the intracellular activation of inflammatory cytokines, it will be important to detect and localise specific transcripts to particular tissues and cells with en- hanced sensitivity above in situ hybridisation alone. The thermocycling procedure required for RT-PCR
may result in loss of cell or tissue morphology but the isothermal nature of the NASBA process would
ensure that in situ amplification of target mRNA was undertaken with minimal damage to the cells. In future studies we will utilise the NASBA procedure described in this study to amplify TNF-(Y mRNA in
situ with detection of products using the labelled oligonucleotide probes we have detailed for the ELGA and plate hybridisation methods.
Acknowledgements
The authors would like to thank Organon Teknika for supply of silica and ITP and for technical advice
relating to the NASBA process.
References
Barnes, P.F.. Fong, S.J., Brennan, P.J., Twomey, P.E., Mazumder.
A., Modlin, R.L., 1990. Local production of tumour necrosis
factor and IFNy in tuberculous pleuritis. J. Immunol. 145.
149.
Beutler, B., Grau, G.E.. 1993. Tumor necrosis factor in the
pathogenesis of infectious diseases. Crit. Care Med. 21, S423.
Boom, R.. Sol, C.J.A., Salimans, M.M.M.. Jansen. C.L..
Wertheim-van Dillen, P.M.E., van der Noordaa. J., 1990.
Rapid and simple method for purification of nucleic acids. J.
Clin. Microbial. 28. 495.

28 B.M. Darke et al. / Journal of Immunological Methods 212 (1998) 19-28
Canque. B., Rosenzwajg, M., Gey, A., Tartour, E., Fridman,
W.H., Gluckman, J.C., 1996. Macrophage inflammatory pro-
tein- 1 o is induced by human immunodeficiency virus infec-
tion of monocyte-derived macrophages. Blood 87, 2011.
Darmani. H.. Harwood, J.L.. Jackson, SK., 1995. Differential
effects of interferon-y and $3 on fatty acid turnover, lipid
bilayer fluidity and TNF release in murine macrophage 5774.2
cells. Int. J. Exp. Pathol. 76, 331.
De Groote. D., Zangerle, P.F., Gevaert, Y., Fassotte. M.F., Be-
guin, Y., Noizat-Pirenne, F., Pirenne. J.. Gathy, R., Lopez, M.,
Dehart, I., Igot, D., Baudrihaye, M., Delacroix, D., Franchi-
mont, P., 1992. Direct stimulation of cytokines (IL-I p. TNF-(Y,
IL-6, IL-2, IFNy and GM-CSF) in whole blood: I. Compari-
son with isolated PBMC stimulation. Cytokine 4, 239.
Di Girolamo, N., Visvanathan, K., Lloyd, A., Wakefield. D..
1997. Expression of TNF-a by plasma cells in chronic inflam-
mation. J. Leukocyte Biol. 61, 667.
Guatelli, J.C., Whitfield. K.M., Kwoh, D.Y., Bar-ringer, K.J.,
Richman, D.D., Gingeras, T.R., 1990. Isothermal, in vitro
amplification of nucleic acids by a multienzyme reaction
modelled after retroviral replication. Proc. Natl. Acad. Sci.
U.S.A. 87, 1874.
Jackson, S.K., 1994. Endotoxin and the sepsis syndrome. Do we
cause more harm than good? Br. J. Intensive Care, Oct.
(suppl) 17.
Kievets, T., van Gemen, B., van Strijp, D., Schukkink, R., Dircks,
M.. Adriaanse, H., Malek, L., Sooknanan, R., Lens, P., 1991.
Nasba’” isothermal enzymatic in vitro nucleic acid amplifica-
tion optimised for the diagnosis of HIV-l infection. J. Virol.
Meth. 35, 273.
Lo, S.K., Golenbock, D.T., Sass, P.M., Maskati, A., Xu. H.,
Silverstein, R.L., 1997. Engagement of the Lewis X antigen
(CD151 results in monocyte activation. Blood 89, 307.
Matthews, N., Neale. M.L., 1987. Cytotoxicity assays for tumour
necrosis factor and lymphotoxin. In: Gearing, A.J.M., Morris,
A.G., Clemens, M.J. (Eds.), Lymphokines and Interferons: A
Practical Approach. IRL Press, Oxford. p. 221.
Pradines-Figueres, A., Raetz. C.R.H., 1992. Processing and secre-
tion of tumour necrosis factor (Y in endotoxin treated Mono
Mac 6 cells are dependent on phorbal myristate acetate. J.B.C.
267, 23261.
Romagnani, S., 1996. Understanding the role of Thl /Th2 cells in
infection, Trends Microbial. 4, 470.
Saghizadeh, M., Ong, J.M., Garvey, W.T., Henry, R.R., Kern,
P.A., 1996. The expression of TNF-o by human muscle. J.
Clin. Invest. 97, 1111,
Sillekens, P.G.T.. 1996. Qualitative and quantitative NASBA for
detection of human-immunodeficiency-virus type-l and hep-
atitis-C virus infection. Transplant, Proc. 28, 2941.
Sillekens, P.T., Habets. W.J.. Beijer, R.P., van Venrooij, W.J.,
1987. cDNA cloning of the human Ul snRNA-associated A
Protein: extensive homology between Ul and U2 snRNP-
specific proteins. EMBO J. 6, 3841.
Smits, H.L.. van Gemen, B., Schukkink, R.. van der Velden. J..
Tjong-A-Hung, S.P., Jebbink. M.F., ter Schegget, J., 1995.
Application of the NASBA nucleic acid amplification method
for the detection of human papilloma virus type 16 E6-E7
transcripts. J. Virol. Meth. 54, 75.
Sooknanan. R.. Malek. L.. Wang, X.-H., Siebert, T., Keating, A.,
1993. Detection and direct sequence identification of BCR-
ABL mRNA in Phf chronic myeloid leukemia. Exp. Hema-
tol. 21, 1719.
van der Vliet, G.M.E., Schukkink, R.A.F., van Gemen. B., Schep-
ers, P., Klatser, P.R., 1993. Nucleic acid sequence based
amplification (NASBAl for the identification of mycobacteria.
J. Gen. Microbial. 139. 2423.
Vassalli, P., 1992. The pathophysiology of tumour necrosis fac-
tors. Annu. Rev. Immunol. 10, 41 l-452.
Wang, A.M., Creasey. A.A.. Ladner. M.B., Lin, L.S., Strickler, J.,
Van Arsdell. J.N., Yamamoto, R., Mark. D.F., 1985. Molecu-
lar cloning of the complementary DNA for human tumor
necrosis factor. Science 228.
Woo, K.R., Shu. W.-P.. Kong, L., Liu. B.C.-S.. 1996. Tumour
necrosis factor mediates apoptosis via Ca’+/Mg*+ dependent
endonuclease with protein kinase C as a possible mechanism
for cytokine resistance in human renal carcinoma cells. J.
Urol. 155. 1779.
Ziegler-Heitbrock. H.W.L., Thiel, E.. Fitterer. A.. Hertzog, V..
Wirtz, A.. Riethmiiller, G.. 1988. Establishment of a human
cell line (Mono Mac 6) with characteristics of mature mono-
cytes. Int. J. Cancer 41, 456.