Detection of changes in flow variability of the upper Danube between 1876-2006
9
Detection of changes in flow variability of the upper Danube between 1876–2006 Pavla Pekarova 1 , Peter Skoda 2 , Pavol Miklanek 1 , Dana Halmova 1 , Jan Pekar 3 1 Institute of Hydrology SAS, Racianska 75, 831 02 Bratislava, Slovakia 2 Slovak Hydrometeorological Institute, Jeseniova 17, 833 15 Bratislava, Slovakia 3 Department of Applied Mathematics and Statistics, FMPI CU Bratislava, Mlynska dolina, 842 48 Bratislava, Slovakia E-mail: [email protected] Abstract. It is widely acknowledged that global warming will result in an increased extremality of hydrological phenomena. As for streamflow it is anticipated that duration of low–flow conditions and flood frequency will both increase. Approving this hypothesis by statistically evaluating daily runoff characteristics depends on the availability of long and homogeneous data series. The aim of this paper is to analyze the change of the average daily flows of the Danube at Bratislava for different subsets of the period 1876–2006. The statistical tests did not reveal any increase in the extremality of daily runoff over the period 1876–2006. On the contrary, variability of daily flows of the Danube River decreases. Over the last 30 years streamflows increased in the winter-spring season and decreased in the summertime, compared to the past periods. This can be explained by the higher air temperature in the headwaters. A warmer climate causes an earlier onset of snowmelt in the winter-spring season, thus less runoff is observed in the summer with higher rates of precipitation. 1. Introduction The impact of anthropogenic activity on runoff processes can be assessed by analyzing statistical characteristics of mean daily streamflows. In general, an opinion prevails that as the atmospheric temperature increases, precipitation and runoff extremality tend to rise as well – leading to higher peaks and lower minimum values. However, such an opinion can be either confirmed or disapproved through a detailed statistical analysis of the various runoff characteristics. Statistical analyses of observed data series are often hindered by short data series, non-homogeneity of observation series, gaps in data sets, etc. There is only one gauging station in the Slovakia’s part of the Danube (at Bratislava) with a continuous time series of discharge observations over the 130 years. Therefore an effort was made to find (through statistical methods) any long-term changes in the characteristics of the mean monthly flows, mean daily flows, and extremes (Qmax) in the historical record. This paper is organized to provide answers to the following issues: 1. Filling in gaps in the daily flow records of the Danube at the Bratislava station (1876–1890); 2. Analysis of changes in the distribution of daily flows in 1876–2005; 3. Analysis of changes in the temporal pattern of mean monthly flows; 4. Analysis of variability of the several flow characteristics and their long-term trends. XXIVth Conference of the Danubian Countries IOP Publishing IOP Conf. Series: Earth and Environmental Science 4 (2008) 012028 doi:10.1088/1755-1307/4/1/012028 c 2008 IOP Publishing Ltd 1
-
Upload
independent -
Category
Documents
-
view
1 -
download
0
Transcript of Detection of changes in flow variability of the upper Danube between 1876-2006
Detection of changes in flow variability of the upper Danube between 1876–2006
Pavla Pekarova1, Peter Skoda2, Pavol Miklanek1, Dana Halmova1, Jan Pekar3
1 Institute of Hydrology SAS, Racianska 75, 831 02 Bratislava, Slovakia2 Slovak Hydrometeorological Institute, Jeseniova 17, 833 15 Bratislava, Slovakia3 Department of Applied Mathematics and Statistics, FMPI CU Bratislava, Mlynska dolina, 842 48 Bratislava, Slovakia
E-mail: [email protected]
Abstract. It is widely acknowledged that global warming will result in an increased extremality of hydrological phenomena. As for streamflow it is anticipated that duration of low–flow conditions and flood frequency will both increase. Approving this hypothesis by statistically evaluating daily runoff characteristics depends on the availability of long and homogeneous data series. The aim of this paper is to analyze the change of the average daily flows of the Danube at Bratislava for different subsets of the period 1876–2006. The statistical tests did not reveal any increase in the extremality of daily runoff over the period 1876–2006. On the contrary, variability of daily flows of the Danube River decreases. Over the last 30 years streamflows increased in the winter-spring season and decreased in the summertime, compared to the past periods. This can be explained by the higher air temperature in the headwaters. A warmer climate causes an earlier onset of snowmelt in the winter-spring season, thus less runoff is observed in the summer with higher rates of precipitation.
1. IntroductionThe impact of anthropogenic activity on runoff processes can be assessed by analyzing statistical characteristics of mean daily streamflows. In general, an opinion prevails that as the atmospheric temperature increases, precipitation and runoff extremality tend to rise as well – leading to higher peaks and lower minimum values. However, such an opinion can be either confirmed or disapproved through a detailed statistical analysis of the various runoff characteristics. Statistical analyses of observed data series are often hindered by short data series, non-homogeneity of observation series, gaps in data sets, etc. There is only one gauging station in the Slovakia’s part of the Danube (at Bratislava) with a continuous time series of discharge observations over the 130 years. Therefore an effort was made to find (through statistical methods) any long-term changes in the characteristics of the mean monthly flows, mean daily flows, and extremes (Qmax) in the historical record.
This paper is organized to provide answers to the following issues:1. Filling in gaps in the daily flow records of the Danube at the Bratislava station (1876–1890);2. Analysis of changes in the distribution of daily flows in 1876–2005;3. Analysis of changes in the temporal pattern of mean monthly flows;4. Analysis of variability of the several flow characteristics and their long-term trends.
XXIVth Conference of the Danubian Countries IOP PublishingIOP Conf. Series: Earth and Environmental Science 4 (2008) 012028 doi:10.1088/1755-1307/4/1/012028
c© 2008 IOP Publishing Ltd 1

2. Results
2.1. Filling in gaps in the daily flow records of the Danube at the Bratislava stationWater stage measurements on the Danube River at Bratislava were first made in 1823. At that time the gauge datum was at 131.08 m J (Adria system). After 1876 the average daily stages were recorded in Hungarian yearbooks [13]. In 1942, the Bratislava gauge datum was lowered by two meters, down to 129.08 m J (Adria system). After 1964, the gauge datum was set at 128.46 m B.p.v (Baltic system).
First discharge observations on the Danube at Bratislava, based on measurements of flow velocities, were conducted as early as 1882 [9, 10]. These observations revealed that the river channel at Bratislava was subject to scouring long time before the river was dammed at the town of Cunovo due to construction of the Gabcikovo Hydro Project in 1992. Deepening of the river’s channel bottom can be readily seen in the shape of the rating curve (Fig. 1) [3, 4, 5].
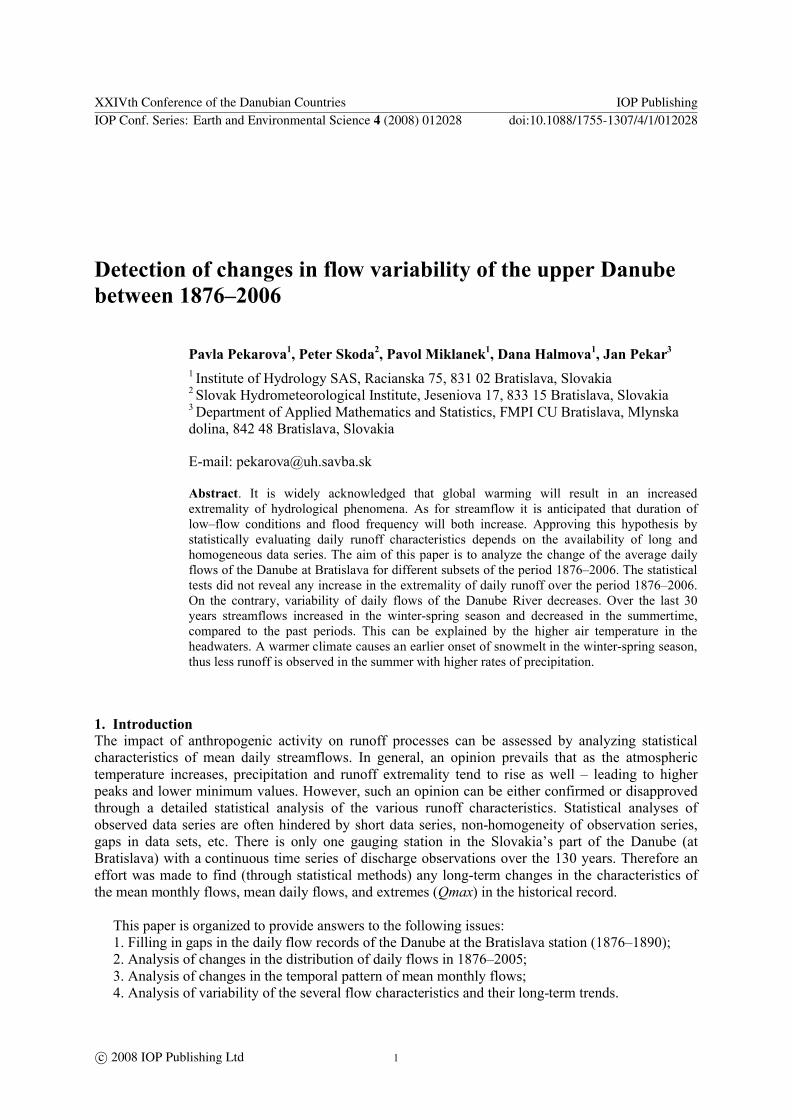
The historical rating curve, valid before 1903 (according to [6] and [15] was approximated by two third-order polynomials. Relations between discharge Q and water stages WS for the range of stages below 480 cm and above 480 cm, are shown in Figure 2. Using these two relationships, the average daily stages were converted into average daily flows for a period of fifteen years (1876–1890). Adding these data to the existing records allowed us to create a series of 130 years (Fig. 3) suitable for a thorough statistical analysis of changes in the runoff series [8].
100
200
300
400
500
600
700
800
900
1000
0 1500 3000 4500 6000 7500 9000 10500Q (m3s-1)
WS
(cm
)
Q5
0
before 1903 2002
1991
1965
Q1
00
I.
II.
III.
flood in 2002
1899
0
2000
4000
6000
8000
10000
12000
100 500 900WS [cm]
Q [
m3s
-1]
Q = -0.0000077 WS3
+ 0.02018 WS2
- 3.86 WS + 597.366
Q = 0.0000016 WS3
+ 0.0098.WS2
+ 0.0978 WS+
Figure 1. Changes of the Danube rating curve at Bratislava gauge (related to the present gauge zero level).
Figure 2. Relationship of the discharges Q to water stages WS, below and above the 480 cm level before 1903.
XXIVth Conference of the Danubian Countries IOP PublishingIOP Conf. Series: Earth and Environmental Science 4 (2008) 012028 doi:10.1088/1755-1307/4/1/012028
2
Year
0
2000
4000
6000
8000
10000
Da
ilyd
isc
ha
rge
[m3s
-1]
1876 1886 1896 1906 1916 1926 1936 1946 1956 1966 1976 1986 1996 2006
3rd
2d
flood activity level
1st
Figure 3. Mean daily flows of the Danube at Bratislava, flood activity level (1876–2006).
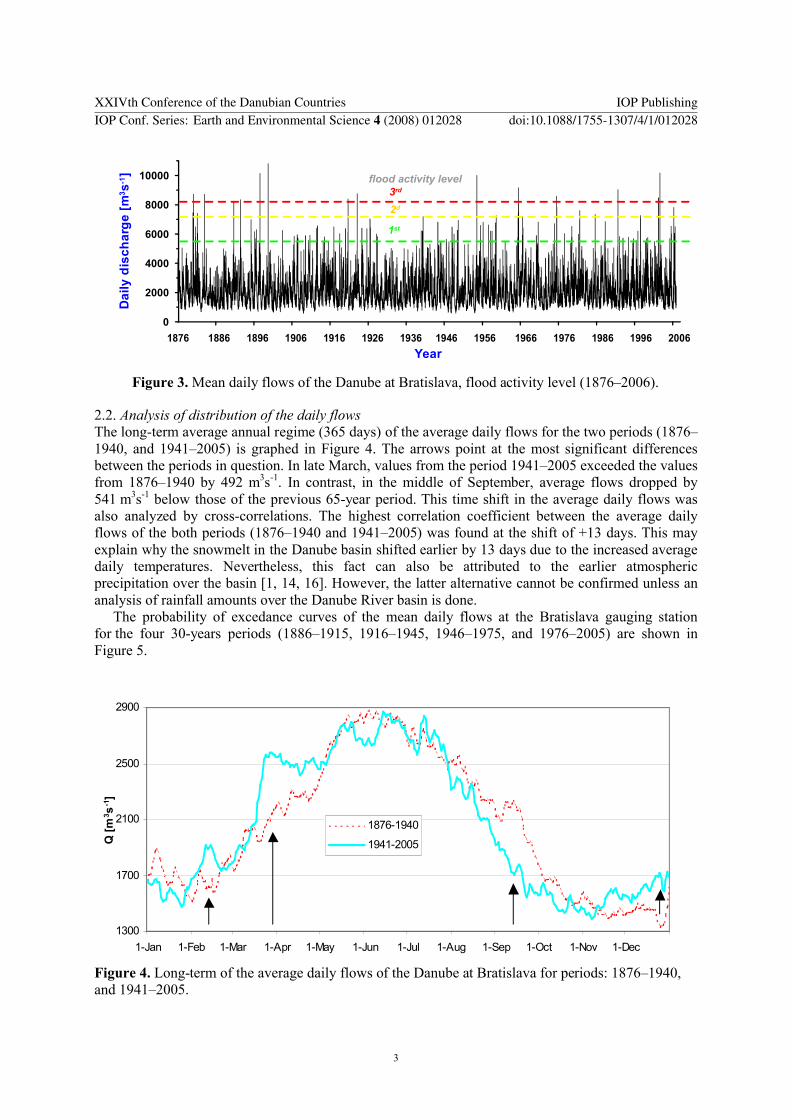
2.2. Analysis of distribution of the daily flowsThe long-term average annual regime (365 days) of the average daily flows for the two periods (1876–1940, and 1941–2005) is graphed in Figure 4. The arrows point at the most significant differences between the periods in question. In late March, values from the period 1941–2005 exceeded the values from 1876–1940 by 492 m3s-1. In contrast, in the middle of September, average flows dropped by 541 m3s-1 below those of the previous 65-year period. This time shift in the average daily flows was also analyzed by cross-correlations. The highest correlation coefficient between the average daily flows of the both periods (1876–1940 and 1941–2005) was found at the shift of +13 days. This may explain why the snowmelt in the Danube basin shifted earlier by 13 days due to the increased average daily temperatures. Nevertheless, this fact can also be attributed to the earlier atmospheric precipitation over the basin [1, 14, 16]. However, the latter alternative cannot be confirmed unless an analysis of rainfall amounts over the Danube River basin is done.
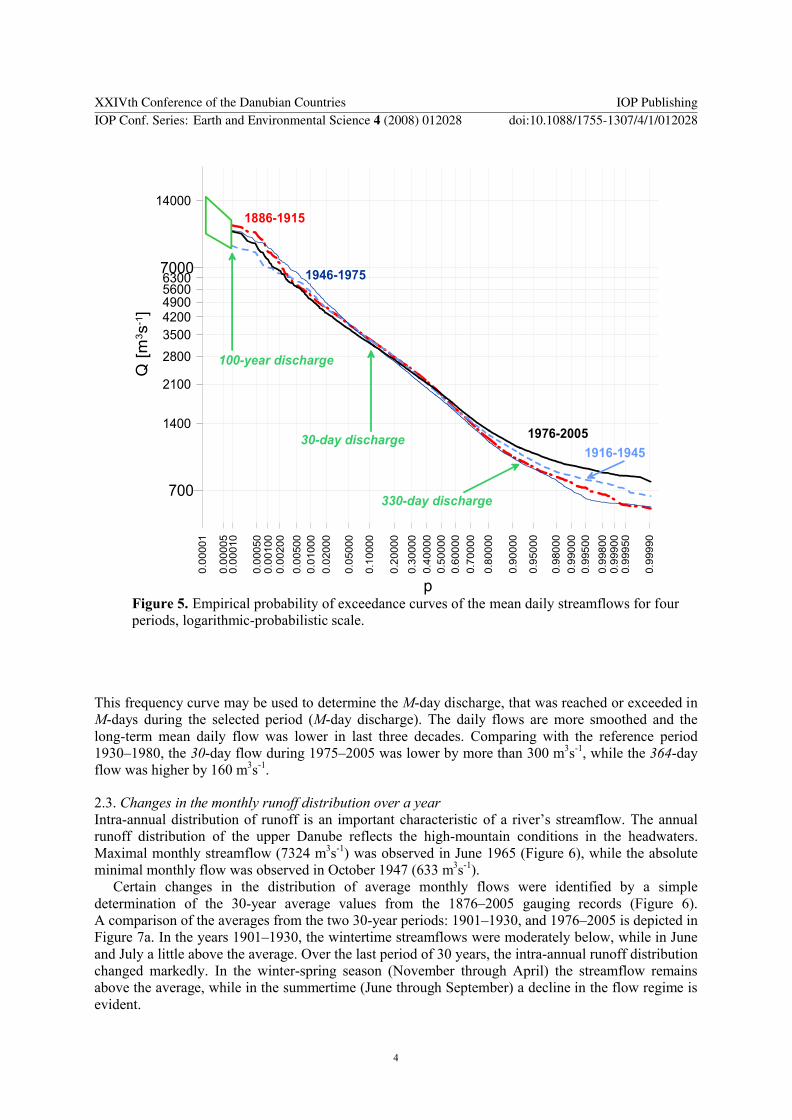
The probability of excedance curves of the mean daily flows at the Bratislava gauging station for the four 30-years periods (1886–1915, 1916–1945, 1946–1975, and 1976–2005) are shown in Figure 5.
1300
1700
2100
2500
2900
1-Jan 1-Feb 1-Mar 1-Apr 1-May 1-Jun 1-Jul 1-Aug 1-Sep 1-Oct 1-Nov 1-Dec
Q [
m3s
-1]
1876-1940
1941-2005
Figure 4. Long-term of the average daily flows of the Danube at Bratislava for periods: 1876–1940, and 1941–2005.
XXIVth Conference of the Danubian Countries IOP PublishingIOP Conf. Series: Earth and Environmental Science 4 (2008) 012028 doi:10.1088/1755-1307/4/1/012028
3
0.0
0001
0.0
0005
0.0
0010
0.0
0050
0.0
0100
0.0
0200
0.0
0500
0.0
1000
0.0
2000
0.0
5000
0.1
0000
0.2
0000
0.3
0000
0.4
00
00
0.5
00
00
0.6
00
00
0.7
00
00
0.8
00
00
0.9
00
00
0.9
50
00
0.9
80
00
0.9
90
00
0.9
95
00
0.9
98
00
0.9
99
00
0.9
99
50
0.9
99
90
p
700
7000
1400
2100
2800
35004200490056006300
14000
Q[m
3s-1
]
1976-2005
1886-1915
1946-1975
1916-194530-day discharge
330-day discharge
100-year discharge
Figure 5. Empirical probability of exceedance curves of the mean daily streamflows for four periods, logarithmic-probabilistic scale.
This frequency curve may be used to determine the M-day discharge, that was reached or exceeded in M-days during the selected period (M-day discharge). The daily flows are more smoothed and the long-term mean daily flow was lower in last three decades. Comparing with the reference period 1930–1980, the 30-day flow during 1975–2005 was lower by more than 300 m3s-1, while the 364-day flow was higher by 160 m3s-1.
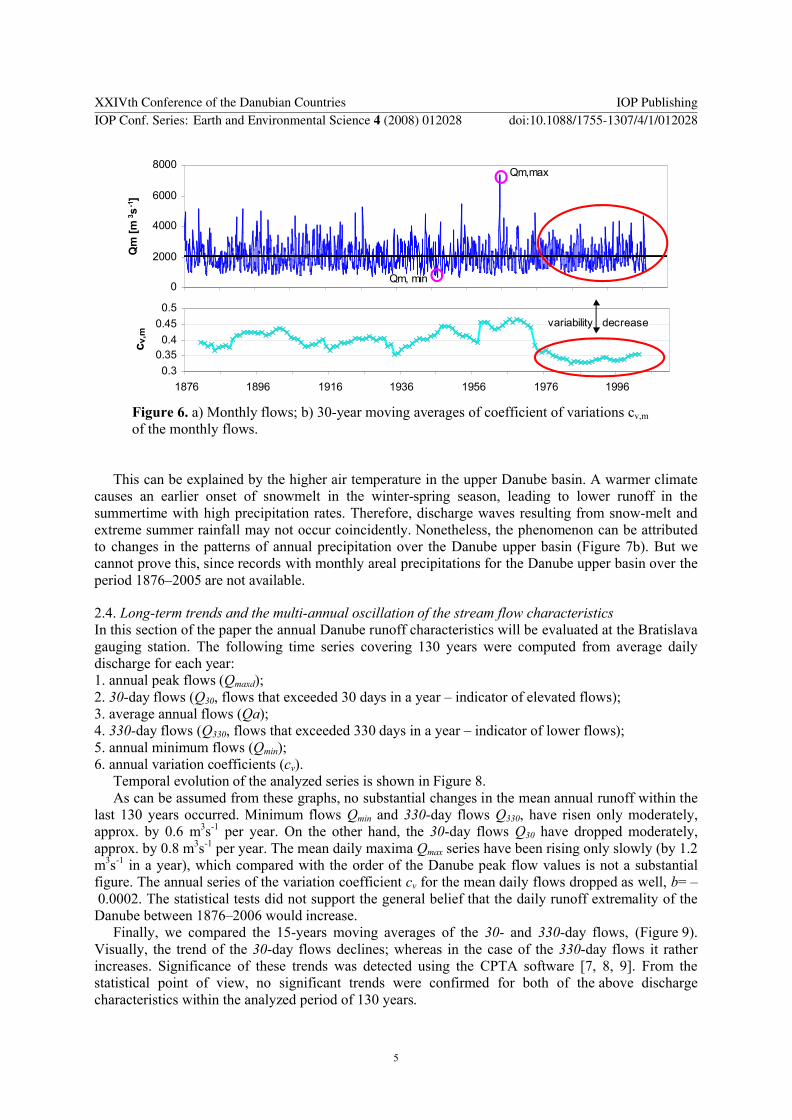
2.3. Changes in the monthly runoff distribution over a yearIntra-annual distribution of runoff is an important characteristic of a river’s streamflow. The annual runoff distribution of the upper Danube reflects the high-mountain conditions in the headwaters. Maximal monthly streamflow (7324 m3s-1) was observed in June 1965 (Figure 6), while the absolute minimal monthly flow was observed in October 1947 (633 m3s-1).
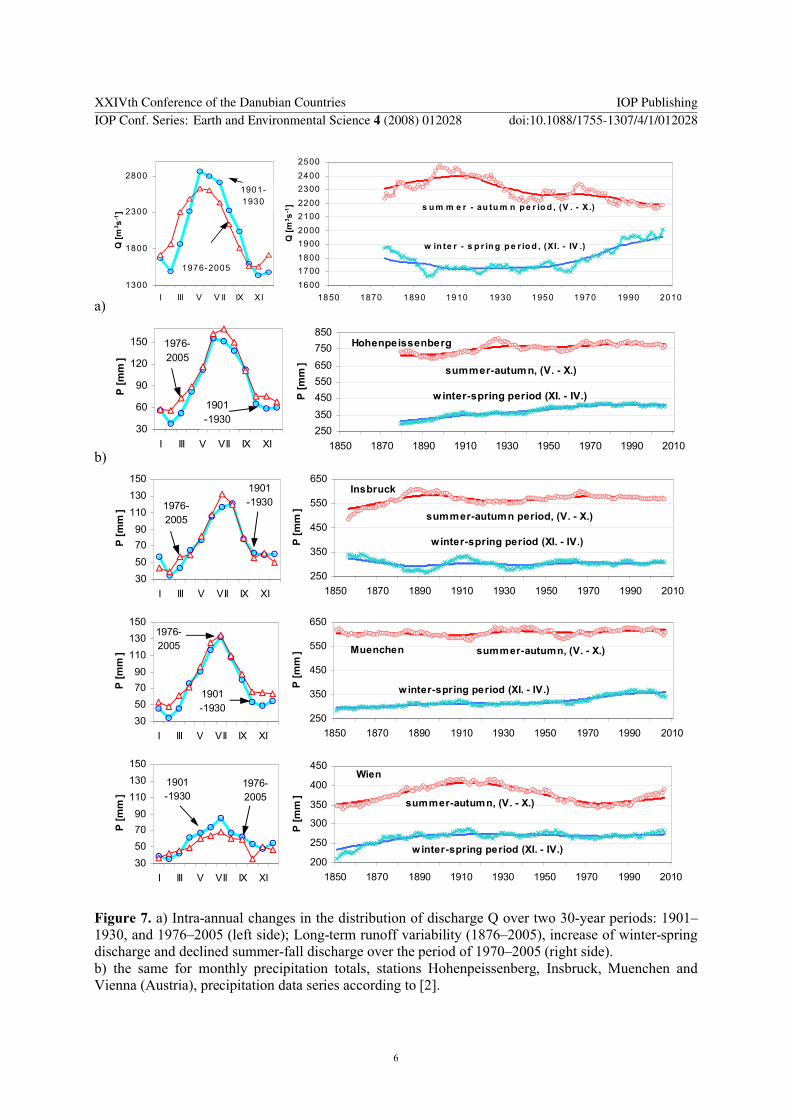
Certain changes in the distribution of average monthly flows were identified by a simple determination of the 30-year average values from the 1876–2005 gauging records (Figure 6). A comparison of the averages from the two 30-year periods: 1901–1930, and 1976–2005 is depicted in Figure 7a. In the years 1901–1930, the wintertime streamflows were moderately below, while in June and July a little above the average. Over the last period of 30 years, the intra-annual runoff distribution changed markedly. In the winter-spring season (November through April) the streamflow remains above the average, while in the summertime (June through September) a decline in the flow regime is evident.
XXIVth Conference of the Danubian Countries IOP PublishingIOP Conf. Series: Earth and Environmental Science 4 (2008) 012028 doi:10.1088/1755-1307/4/1/012028
4
0
2000
4000
6000
8000
Qm
[m
3s
-1]
Qm,max
Qm, min
0.3
0.350.4
0.45
0.5
1876 1896 1916 1936 1956 1976 1996
c v,m
variability decrease
Figure 6. a) Monthly flows; b) 30-year moving averages of coefficient of variations cv,m
of the monthly flows.
This can be explained by the higher air temperature in the upper Danube basin. A warmer climate causes an earlier onset of snowmelt in the winter-spring season, leading to lower runoff in the summertime with high precipitation rates. Therefore, discharge waves resulting from snow-melt and extreme summer rainfall may not occur coincidently. Nonetheless, the phenomenon can be attributed to changes in the patterns of annual precipitation over the Danube upper basin (Figure 7b). But we cannot prove this, since records with monthly areal precipitations for the Danube upper basin over the period 1876–2005 are not available.
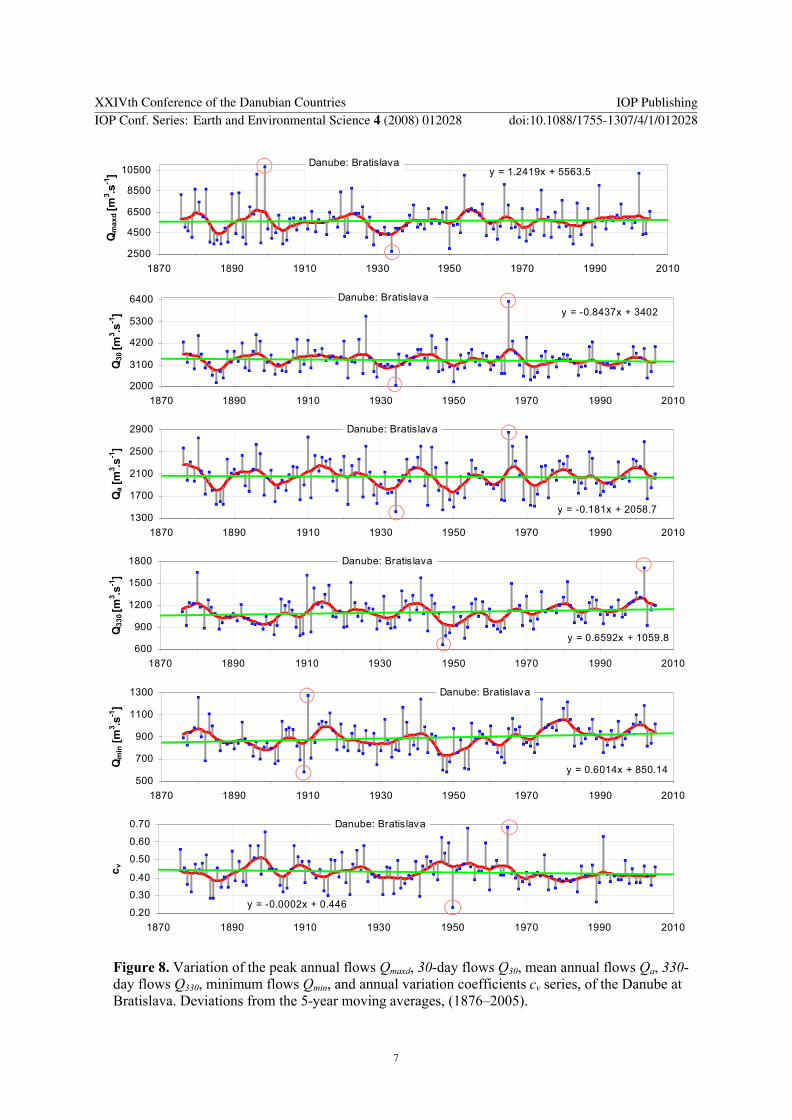
2.4. Long-term trends and the multi-annual oscillation of the stream flow characteristicsIn this section of the paper the annual Danube runoff characteristics will be evaluated at the Bratislava gauging station. The following time series covering 130 years were computed from average daily discharge for each year: 1. annual peak flows (Qmaxd); 2. 30-day flows (Q30, flows that exceeded 30 days in a year – indicator of elevated flows); 3. average annual flows (Qa); 4. 330-day flows (Q330, flows that exceeded 330 days in a year – indicator of lower flows); 5. annual minimum flows (Qmin); 6. annual variation coefficients (cv).
Temporal evolution of the analyzed series is shown in Figure 8. As can be assumed from these graphs, no substantial changes in the mean annual runoff within the
last 130 years occurred. Minimum flows Qmin and 330-day flows Q330, have risen only moderately, approx. by 0.6 m3s-1 per year. On the other hand, the 30-day flows Q30 have dropped moderately, approx. by 0.8 m3s-1 per year. The mean daily maxima Qmax series have been rising only slowly (by 1.2 m3s-1 in a year), which compared with the order of the Danube peak flow values is not a substantial figure. The annual series of the variation coefficient cv for the mean daily flows dropped as well, b= –0.0002. The statistical tests did not support the general belief that the daily runoff extremality of the Danube between 1876–2006 would increase.
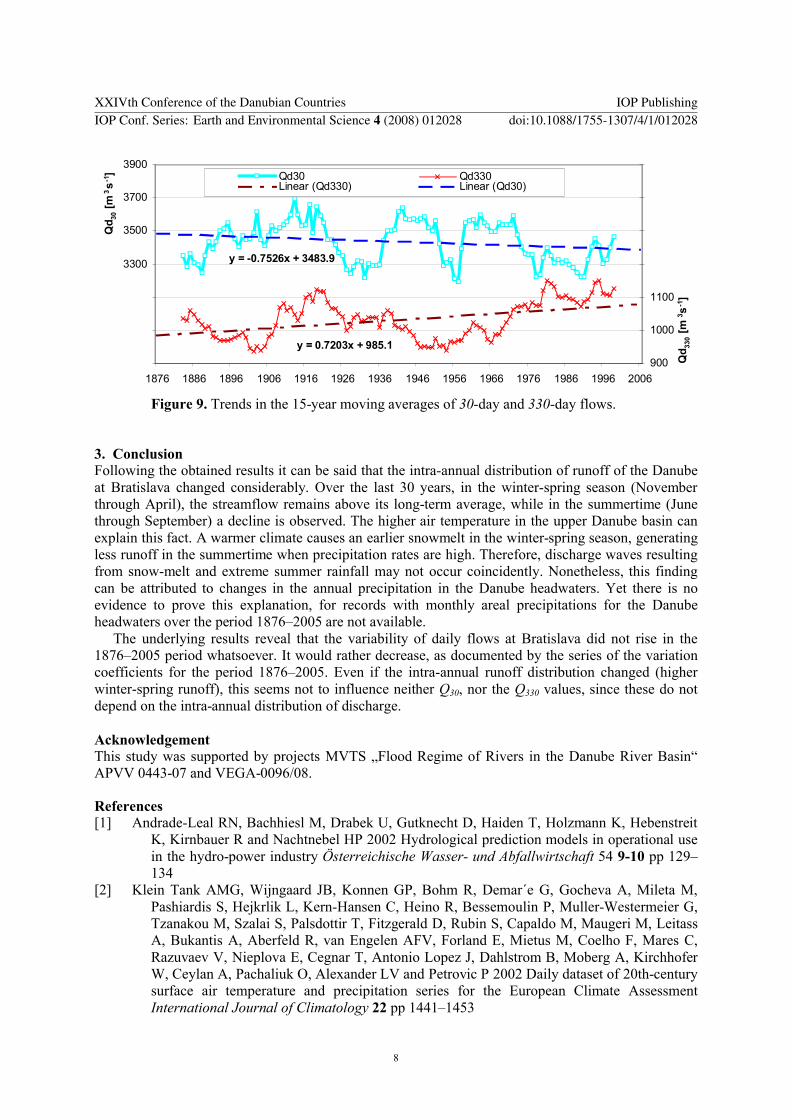
Finally, we compared the 15-years moving averages of the 30- and 330-day flows, (Figure 9). Visually, the trend of the 30-day flows declines; whereas in the case of the 330-day flows it rather increases. Significance of these trends was detected using the CPTA software [7, 8, 9]. From the statistical point of view, no significant trends were confirmed for both of the above discharge characteristics within the analyzed period of 130 years.
XXIVth Conference of the Danubian Countries IOP PublishingIOP Conf. Series: Earth and Environmental Science 4 (2008) 012028 doi:10.1088/1755-1307/4/1/012028
5
a)
1300
1800
2300
2800
I III V V II IX XI
Q [
m3 s
-1]
1901-1930
1976-2005
1600
1700
1800
1900
2000
2100
2200
2300
2400
2500
1850 1870 1890 1910 1930 1950 1970 1990 2010Q
[m
3 s-1
]
w in te r - s p r in g p e r io d , (XI. - IV .)
s u m m e r - au tu m n p e r io d , (V . - X.)
b)
30
60
90
120
150
I III V VII IX XI
P [
mm
]
1976-2005
1901-1930
250
350
450
550
650
750
850
1850 1870 1890 1910 1930 1950 1970 1990 2010
P [
mm
]
w inter-spring period (XI. - IV.)
summer-autumn, (V. - X.)
Hohenpeissenberg
30
50
70
90
110
130
150
I III V VII IX XI
P [
mm
] 1976-2005
1901-1930
250
350
450
550
650
1850 1870 1890 1910 1930 1950 1970 1990 2010
P [
mm
]
w inter-spring period (XI. - IV.)
summer-autumn period, (V. - X.)
Insbruck
30
50
70
90
110
130
150
I III V VII IX XI
P [
mm
]
1976-2005
1901-1930
250
350
450
550
650
1850 1870 1890 1910 1930 1950 1970 1990 2010
P [
mm
]
w inter-spring period (XI. - IV.)
summer-autumn, (V. - X.)Muenchen
200
250
300
350
400
450
1850 1870 1890 1910 1930 1950 1970 1990 2010
P [
mm
]
w inter-spring period (XI. - IV.)
summer-autumn, (V. - X.)
Wien
30
50
70
90
110
130
150
I III V VII IX XI
P [
mm
]
1976-2005
1901-1930
Figure 7. a) Intra-annual changes in the distribution of discharge Q over two 30-year periods: 1901–1930, and 1976–2005 (left side); Long-term runoff variability (1876–2005), increase of winter-spring discharge and declined summer-fall discharge over the period of 1970–2005 (right side).b) the same for monthly precipitation totals, stations Hohenpeissenberg, Insbruck, Muenchen and Vienna (Austria), precipitation data series according to [2].
XXIVth Conference of the Danubian Countries IOP PublishingIOP Conf. Series: Earth and Environmental Science 4 (2008) 012028 doi:10.1088/1755-1307/4/1/012028
6
y = 1.2419x + 5563.5
2500
4500
6500
8500
10500
1870 1890 1910 1930 1950 1970 1990 2010
Qm
axd
[m3 .s
-1]
Danube: Bratislava
y = -0.8437x + 3402
2000
3100
4200
5300
6400
1870 1890 1910 1930 1950 1970 1990 2010
Q3
0 [m
3 .s-1
]
Danube: Bratislava
y = -0.181x + 2058.71300
1700
2100
2500
2900
1870 1890 1910 1930 1950 1970 1990 2010
Qa
[m3 .s
-1]
Danube: Bratislava
y = 0.6592x + 1059.8600
900
1200
1500
1800
1870 1890 1910 1930 1950 1970 1990 2010
Q3
30 [
m3 .s
-1]
Danube: Bratis lava
y = 0.6014x + 850.14500
700
900
1100
1300
1870 1890 1910 1930 1950 1970 1990 2010
Qm
in [
m3 .s
-1]
Danube: Bratislava
y = -0.0002x + 0.4460.20
0.30
0.40
0.50
0.60
0.70
1870 1890 1910 1930 1950 1970 1990 2010
cv
Danube: Bratislava
Figure 8. Variation of the peak annual flows Qmaxd, 30-day flows Q30, mean annual flows Qa, 330-day flows Q330, minimum flows Qmin, and annual variation coefficients cv series, of the Danube at Bratislava. Deviations from the 5-year moving averages, (1876–2005).
XXIVth Conference of the Danubian Countries IOP PublishingIOP Conf. Series: Earth and Environmental Science 4 (2008) 012028 doi:10.1088/1755-1307/4/1/012028
7
y = 0.7203x + 985.1
y = -0.7526x + 3483.9
2700
2900
3100
3300
3500
3700
3900
1876 1886 1896 1906 1916 1926 1936 1946 1956 1966 1976 1986 1996 2006
Qd
30 [
m3s
-1]
900
1000
1100
1200
1300
1400
1500
Qd
330 [
m3s
-1]
Qd30 Qd330Linear (Qd330) Linear (Qd30)
Figure 9. Trends in the 15-year moving averages of 30-day and 330-day flows.
3. ConclusionFollowing the obtained results it can be said that the intra-annual distribution of runoff of the Danube at Bratislava changed considerably. Over the last 30 years, in the winter-spring season (November through April), the streamflow remains above its long-term average, while in the summertime (June through September) a decline is observed. The higher air temperature in the upper Danube basin can explain this fact. A warmer climate causes an earlier snowmelt in the winter-spring season, generating less runoff in the summertime when precipitation rates are high. Therefore, discharge waves resulting from snow-melt and extreme summer rainfall may not occur coincidently. Nonetheless, this finding can be attributed to changes in the annual precipitation in the Danube headwaters. Yet there is no evidence to prove this explanation, for records with monthly areal precipitations for the Danube headwaters over the period 1876–2005 are not available.
The underlying results reveal that the variability of daily flows at Bratislava did not rise in the 1876–2005 period whatsoever. It would rather decrease, as documented by the series of the variation coefficients for the period 1876–2005. Even if the intra-annual runoff distribution changed (higher winter-spring runoff), this seems not to influence neither Q30, nor the Q330 values, since these do not depend on the intra-annual distribution of discharge.
AcknowledgementThis study was supported by projects MVTS „Flood Regime of Rivers in the Danube River Basin“ APVV 0443-07 and VEGA-0096/08.
References[1] Andrade-Leal RN, Bachhiesl M, Drabek U, Gutknecht D, Haiden T, Holzmann K, Hebenstreit
K, Kirnbauer R and Nachtnebel HP 2002 Hydrological prediction models in operational use in the hydro-power industry Österreichische Wasser- und Abfallwirtschaft 54 9-10 pp 129–134
[2] Klein Tank AMG, Wijngaard JB, Konnen GP, Bohm R, Demar´e G, Gocheva A, Mileta M,Pashiardis S, Hejkrlik L, Kern-Hansen C, Heino R, Bessemoulin P, Muller-Westermeier G, Tzanakou M, Szalai S, Palsdottir T, Fitzgerald D, Rubin S, Capaldo M, Maugeri M, Leitass A, Bukantis A, Aberfeld R, van Engelen AFV, Forland E, Mietus M, Coelho F, Mares C, Razuvaev V, Nieplova E, Cegnar T, Antonio Lopez J, Dahlstrom B, Moberg A, Kirchhofer W, Ceylan A, Pachaliuk O, Alexander LV and Petrovic P 2002 Daily dataset of 20th-century surface air temperature and precipitation series for the European Climate Assessment International Journal of Climatology 22 pp 1441–1453
XXIVth Conference of the Danubian Countries IOP PublishingIOP Conf. Series: Earth and Environmental Science 4 (2008) 012028 doi:10.1088/1755-1307/4/1/012028
8

[3] Miklanek P, Mikulickova M, Mitkova V and Pekarova P 2002 Changes of floods travel times on upper Danube CD from XXI Conference of Danube countries Romania 12 pp
[4] Mitkova V 2002 Changes of the travel times of flood waves for Danube River (In Slovak) Acta Hydrologica Slovaca 3 1 pp 20–27
[5] Mitkova V, Pekarova P, Miklanek P and Pekar, J 2005 Analysis of flood propagation changes in the Kienstock–Bratislava reach of the Danube River Hydrological Sciences Journal 50 4 pp 665–668
[6] Pacl J 1955 Danube floods in July 1954 (In Slovak) Hydrological study HMI Praha 26 pp[7] Pekarova P, Miklanek P and Pekar J 2007 Long-term Danube monthly discharge prognosis for
the Bratislava station using stochastic models Meteorologický casopis 4 10 pp 211–218 [8] Pekarova P and Pekar J 2007 Multiannual variability of Danube runoff characteristics in
Bratislava gauge (In Slovak) Acta Hydrologica Slovaca 1 pp 12–21 [9] Prochazka M, Deyl M and Novicky O 2001 Technology for Detecting Trends and Changes in
Time Series of Hydrological and Meteorological Variables - Change and Trend Problem Analysis (CTPA) User’s Guide CHMI Prague 25 pp
[10] Skoda P and Turbek J 1995 Monitoring of the Hydrological Regime of Danube (In Slovak.) Proc Int Conf “Danube – the artery of Europe” ZSVTS Bratislava pp 194–206
[11] Svoboda A, Pekarova P and Miklanek P 2000 Flood hydrology of Danube between Devin and Nagymaros SVH – IH SAS 96 pp
[12] Svoboda A and Szolgay J 1988 Impact of Anthropogenic Activity upon the River Runoff (In Slovak.) Report of Phase KE 01 Determination of runoff regime changes in the abandoned river bed, using mathematical runoff model ÚHH SAV Bratislava
[13] Vizallasok 1890 Vizallasok a Dunaban Hornyanszky Viktor Könyvnyomdaja Budapest[14] Webb BW and Nobilis F 2007 Long-term changes in river temperature and the influence of
climatic and hydrological factors Hydrological Sciences Journal 52 1 pp 74–85[15] Zatkalik G 1965 The 1965 Danube Flood (In Slovak) Vodni hospodarstvi 12 pp 519–526[16] Zsufa I 1999 Impact of Austrian hydropower plants on the flood control safety of the Hungarian
Danube Hydrological Sciences Journal 44 3 pp 363–371
XXIVth Conference of the Danubian Countries IOP PublishingIOP Conf. Series: Earth and Environmental Science 4 (2008) 012028 doi:10.1088/1755-1307/4/1/012028
9