Detecting protein complexes in a PPI network: a gene ontology based multi-objective evolutionary...
13
3036 Mol. BioSyst., 2012, 8, 3036–3048 This journal is c The Royal Society of Chemistry 2012 Cite this: Mol. BioSyst., 2012, 8, 3036–3048 Detecting protein complexes in a PPI network: a gene ontology based multi-objective evolutionary approachw Anirban Mukhopadhyay, Sumanta Ray* and Moumita De Received 27th March 2012, Accepted 14th August 2012 DOI: 10.1039/c2mb25302j Protein complexes play an important role in cellular mechanism. Identification of protein complexes in protein–protein interaction (PPI) networks is the first step in understanding the organization and dynamics of cell function. Several high-throughput experimental techniques produce a large amount of protein interactions, which can be used to predict protein complexes in a PPI network. We have developed an algorithm PROCOMOSS (Protein Complex Detection using Multi-objective Evolutionary Approach based on Semantic Similarity) for partitioning the whole PPI network into clusters, which serve as predicted protein complexes. We consider both graphical properties of a PPI network as well as biological properties based on GO semantic similarity measure as objective functions. Here three different semantic similarity measures are used for grouping functionally similar proteins in the same clusters. We have applied the PROCOMOSS algorithm on two different datasets of Saccharomyces cerevisiae to find and predict protein complexes. A real-life application of the PROCOMOSS is also shown here by applying it in the human PPI network consisting of differentially expressed genes affected by gastric cancer. Gene ontology and pathway based analyses are also performed to investigate the biological importance of the extracted gene modules. 1 Introduction A PPI network can be described as a complex system of proteins linked by interactions. The simplest representation takes the form of an undirected graph consisting of nodes and edges, 1 where proteins are represented as nodes and the interaction of two proteins is represented as adjacent nodes connected by an edge. The protein complexes in a PPI network are assemblages of proteins that interact with each other at a given time and place, forming a dense region in the PPI networks. Several techniques based on graph clustering, finding dense regions, or clique finding have been proposed to discover protein complexes in PPI networks. 2–5 Molecular Complex Detection (MCODE), proposed by Bader et al., 6 detects densely connected regions in the PPI network by giving weight to each vertex, corresponding to its local neighborhood den- sity. Then, starting with the top weighted vertex (seed vertex), it includes the vertices whose weight is above a given threshold in the cluster, recursively. The Markov Cluster algorithm (MCL) proposed in ref. 7 converges toward a partitioning of the graph, with a set of high-flow regions (the clusters) separated by boundaries with no flow. In ref. 8 Restricted Neighborhood Search Clustering (RNSC), a cost-based local search algorithm is proposed that explores the solution space to minimize a cost function calculated according to the number of intra-cluster and inter-cluster edges. Starting from an initial random solution, RNSC iteratively moves a vertex from one cluster to another if this move reduces the general cost. Recently in ref. 9 a clustering with overlapping neighborhood expansion (ClusterONE) has been introduced for detecting potentially overlapping protein complexes from protein–protein interaction data. This algorithm consists of three major steps: first, starting from a single seed vertex, a greedy procedure adds or removes vertices to find groups with high cohesiveness. In the second step, merging between each pair of groups is done based on the extent of overlap between each pair of groups for which the overlap score is above a specified threshold. In the third step, a postprocessing is done by discarding complex candidates that contain less than three proteins or whose density is below a given threshold. In general it has been observed that the proteins constituting a complex are functionally similar and they carry out some common biological activity. Motivated by this observation, in this article a multi-objective algorithm PROCOMOSS (Protein Complex Detection using Multi-objective Evolutionary Approach based on Semantic Similarity) is developed. PROCOMOSS optimizes both graph based density metric and GO-semantic similarity based metric simultaneously to find dense protein Department of Computer Science and Engineering, University of Kalyani, Kalyani, India. E-mail: [email protected], sumanta_ray86@rediffmail.com, [email protected] w Electronic supplementary information (ESI) available: The code and other related materials are available at http://kucse.in/procomoss/. See DOI: 10.1039/c2mb25302j Molecular BioSystems Dynamic Article Links www.rsc.org/molecularbiosystems PAPER
Transcript of Detecting protein complexes in a PPI network: a gene ontology based multi-objective evolutionary...

3036 Mol. BioSyst., 2012, 8, 3036–3048 This journal is c The Royal Society of Chemistry 2012
Cite this: Mol. BioSyst., 2012, 8, 3036–3048
Detecting protein complexes in a PPI network: a gene ontology based
multi-objective evolutionary approachw
Anirban Mukhopadhyay, Sumanta Ray* and Moumita De
Received 27th March 2012, Accepted 14th August 2012
DOI: 10.1039/c2mb25302j
Protein complexes play an important role in cellular mechanism. Identification of protein
complexes in protein–protein interaction (PPI) networks is the first step in understanding the
organization and dynamics of cell function. Several high-throughput experimental techniques
produce a large amount of protein interactions, which can be used to predict protein complexes in
a PPI network. We have developed an algorithm PROCOMOSS (Protein Complex Detection
using Multi-objective Evolutionary Approach based on Semantic Similarity) for partitioning the
whole PPI network into clusters, which serve as predicted protein complexes. We consider both
graphical properties of a PPI network as well as biological properties based on GO semantic
similarity measure as objective functions. Here three different semantic similarity measures are
used for grouping functionally similar proteins in the same clusters. We have applied the
PROCOMOSS algorithm on two different datasets of Saccharomyces cerevisiae to find and
predict protein complexes. A real-life application of the PROCOMOSS is also shown here by
applying it in the human PPI network consisting of differentially expressed genes affected by
gastric cancer. Gene ontology and pathway based analyses are also performed to investigate the
biological importance of the extracted gene modules.
1 Introduction
A PPI network can be described as a complex system of proteins
linked by interactions. The simplest representation takes the form
of an undirected graph consisting of nodes and edges,1 where
proteins are represented as nodes and the interaction of two
proteins is represented as adjacent nodes connected by an edge.
The protein complexes in a PPI network are assemblages of
proteins that interact with each other at a given time and place,
forming a dense region in the PPI networks.
Several techniques based on graph clustering, finding dense
regions, or clique finding have been proposed to discover
protein complexes in PPI networks.2–5 Molecular Complex
Detection (MCODE), proposed by Bader et al.,6 detects
densely connected regions in the PPI network by giving weight
to each vertex, corresponding to its local neighborhood den-
sity. Then, starting with the top weighted vertex (seed vertex),
it includes the vertices whose weight is above a given threshold
in the cluster, recursively. The Markov Cluster algorithm
(MCL) proposed in ref. 7 converges toward a partitioning of
the graph, with a set of high-flow regions (the clusters)
separated by boundaries with no flow. In ref. 8 Restricted
Neighborhood Search Clustering (RNSC), a cost-based local
search algorithm is proposed that explores the solution space
to minimize a cost function calculated according to the
number of intra-cluster and inter-cluster edges. Starting from
an initial random solution, RNSC iteratively moves a vertex
from one cluster to another if this move reduces the general cost.
Recently in ref. 9 a clustering with overlapping neighborhood
expansion (ClusterONE) has been introduced for detecting
potentially overlapping protein complexes from protein–protein
interaction data. This algorithm consists of three major steps:
first, starting from a single seed vertex, a greedy procedure adds
or removes vertices to find groups with high cohesiveness. In the
second step, merging between each pair of groups is done based
on the extent of overlap between each pair of groups for which
the overlap score is above a specified threshold. In the third step,
a postprocessing is done by discarding complex candidates that
contain less than three proteins or whose density is below a given
threshold.
In general it has been observed that the proteins constituting
a complex are functionally similar and they carry out some
common biological activity. Motivated by this observation, in
this article a multi-objective algorithm PROCOMOSS (Protein
Complex Detection using Multi-objective Evolutionary Approach
based on Semantic Similarity) is developed. PROCOMOSS
optimizes both graph based density metric and GO-semantic
similarity based metric simultaneously to find dense protein
Department of Computer Science and Engineering, University ofKalyani, Kalyani, India. E-mail: [email protected],[email protected], [email protected] Electronic supplementary information (ESI) available: The code andother related materials are available at http://kucse.in/procomoss/. SeeDOI: 10.1039/c2mb25302j
MolecularBioSystems
Dynamic Article Links
www.rsc.org/molecularbiosystems PAPER

This journal is c The Royal Society of Chemistry 2012 Mol. BioSyst., 2012, 8, 3036–3048 3037
complexes containing functionally similar proteins. NSGA-II,10,11
a popular multi-objective GA,12 has been utilized as an under-
lying optimization tool.
The results are collected by applying PROCOMOSS in
the protein–protein interaction (PPI) data downloaded from
two different high throughput datasets DIP and MIPS. The
performance of PROCOMOSS is compared with that of other
methods such as MCODE,6 RNSC,8 MCL,7 and clusterONE9
and Affinity propagation.13 The different semantic similarity
measures we have used in our PROCOMOSS algorithm are
also have been utilized in the Affinity propagation for grouping
proteins into modules. We also perform a Gene Ontology and
pathway based analysis of the predicted modules identified by
PROCOMOSS in the differentially expressed genes extracted
from the gastric cancer dataset downloaded from www.biolab.
si/supp/bi-cancer/projections/info/GSE2685.htm.
2 Multi-objective optimization using GA
The multi-objective optimization problem can be stated as
follows:12,14–16 find the vector �x� ¼ ½x�1; x�2; . . . ; x�n�T of the
decision variables satisfying the m inequality constraints:
gi( %x) Z 0, i = 1,2,. . .,m, p equality constraints hi( %x) = 0,
i = 1,2,. . .,p that optimizes the vector function %f( %x) = [f1( %x),
f2( %x),. . ., fk( %x)]T. The constraints define the feasible region F
containing all the admissible solutions. The vector %x* denotes
an optimal solution in F.
The concept of Pareto optimality12,16 is useful in the domain
of multi-objective optimization. A formal definition for Pareto
optimality from the viewpoint of minimization problem may
be given as follows: a decision vector %x* is called Pareto
optimal if and only if there is no %x that dominates %x*, i.e.,
there is no %x such that 8i A {1,2,. . .,k}, fi( %x) r fi( %x) and (i A{1,2,. . .,k}, fi( %x) o fi( %x*). In words, %x* is Pareto optimal if
there exists no feasible vector %x which causes a reduction in
some criterion without a simultaneous increase in at least
another. The Pareto optimum usually admits a set of solutions
called non-dominated solutions. Here we use NSGA-II10,11 as
the underlying multi-objective algorithm.
3 Gene ontology based semantic similarity
The Gene Ontology (GO) project17 is a collaborative effort
to provide consistent description of genes and gene products.
GO provides a collection of well-defined and well-structured
biological terms, called GO terms that are shared across
different organisms. They comprise three categories as the most
general concepts: biological processes, molecular functions and
cellular components. The measurement of semantic similarity
between two concepts can be easily extended to measure the
degree of similarity between terms in the GO structures.18 The
GO terms are structured by the relationships to each other, such
as is-a that represents a specific-to-general relationship between
terms, and part-of that represents a part-to-whole relationship.
Two approaches to gene similarity computation are graph
structure-based (GS), which use the hierarchical structure of GO
in computing gene similarity and information content-based (IC)
measures which additionally consider the a priori probabilities, or
information contents, of GO terms in a reference gene set.19,20
For a detailed description see the ESIw website. Among the
various approaches for computing semantic similarity measure
we use three of them here: Lin,21 Jiang and Conrath22 and
Kappa’s measure23 (equation and a brief description can be
found in the ESIw website) to form the objective functions for
computing our clustering results.
Besides the semantic similarity measure between GO terms
annotating a protein pair, we also find some graphical properties
of a protein interaction network to be used as objectives.
4 Proposed method
Here we describe the PROCOMOSS algorithm for clustering
in a PPI network in detail.
4.1 Chromosome representation
A protein complex is a subgraph of the whole PPI graph. Here
a protein complex is encoded as a chromosome. So in the
resulting population a chromosome of the type: ni, i = 1,. . .,p
is an integer denoting the index of a protein in the unique
protein set, represents a protein complex consisting of p
number of nodes or proteins. All nodes in the chromosome
are not necessarily connected.
4.2 Population initialization
Initially the whole network is broken into several biclusters.24–26
Biclustering is done by applying K-means clustering from both
the dimensions of a PPI matrix and taking intersections of the
clusters formed in these two dimensions. Each bicluster represents
a densely connected region in the network. We sort these
biclusters on the basis of density and pick up first 50 biclusters
and encode these in the initial population. The subsequent
populations are created using the genetic operators of NSGA-II.
4.3 Representation of objective functions
Here we use two types of objective functions: one is totally
dependent on the graphical properties of the protein inter-
action network and another is based on Gene Ontological
annotations of proteins.
4.3.1 Graph based objective. All graph theoretic approaches
for finding protein complexes seek to identify dense subgraphs
by maximizing the density of each subgraph on the basis of
local network topology. The density of a graph is defined as a
ratio of the number of edges present in a graph to the possible
number of edges in a complete graph of the same size. As there
are a large number of interactions (or edges) between proteins
(or nodes) in a protein complex (or subgraph), the density of
each complex is generally very high. So using density as an
objective function and maximizing it for individual subgraphs
will yield much denser complexes.
For choosing the next objective we count the number of
interconnecting nodes for a chromosome that are not present in
the current chromosome/cluster. For example in Fig. 1, the
chromosome is represented as black nodes and the interconnecting
nodes of this chromosome (which are not present in the current
chromosome) are shown in yellow colored nodes. This may be

3038 Mol. BioSyst., 2012, 8, 3036–3048 This journal is c The Royal Society of Chemistry 2012
written as:
NðCÞ ¼ j [i2C
nij; ð1Þ
where C is any cluster in G and ni is the set of nodes which are
connected with node i in C, and are not present in C.
Minimizing this will result in clusters, which have a lesser
number of outward interaction partners and we get compact
clusters.
4.3.2 Semantic similarity based objective. The semantic
similarity measure between two GO terms can be directly
converted to a measurement of the similarity between two
proteins. Since a protein is annotated to multiple GO terms,
the similarity between two proteins can be represented as the
average similarity of the GO term cross pairs, which are
associated with both interacting proteins.18 The package
csbl.go (http://csbi.ltdk.helsinki.fi/csbl.go/) is used for calcu-
lating the similarity between protein pairs. We calculate the
similarity between all pairs of proteins and tabulate this as a
matrix form. For calculating the fitness of a chromosome, the
average similarity of each pair of proteins comprising the
chromosome is computed. For example to compute the fitness
of the chromosome: {n1 n2 . . . np} we compute a submatrix s
with rows and columns comprising these nodes from the
similarity matrix S. The average value of the matrix s serves
as the fitness of this chromosome. This may be written as:
simðsÞ ¼P
i2pP
j2p sði; jÞp
: ð2Þ
Fig. 1 Example of outward interconnecting nodes of a chromosome:
black nodes represent chromosome and yellow nodes are outward
interconnecting nodes to this chromosome.
Fig. 2 Illustration of the mutation process: black nodes represent
chromosome. In each iteration randomly select one node in the
chromosome, delete that node or add those which are direct neighbors
of that node with equal probability. (a) Represents the parent chro-
mosome. After one iteration a child chromosome (shown in (b) or (c))
is produced.
Table 1 Summary of the PPI network data sets used here
Data set # Proteins # Interactions Avg. degree Max. degree Density
DIP 4669 21 621 9.2305 241 0.0020MIPS 3950 11 119 5.5792 233 0.0014
Table 2 Comparisons of results with respect to sensitivity, Positive Predictive Value (PPV) and accuracy
Method
General sensitivity of clustering result General PPV of clustering result Accuracy
DIP MIPS DIP MIPS DIP MIPS
MCODE 0.1168 0.0742 0.4922 0.4709 0.2397 0.1869cluster ONE 0.2135 0.0999 0.4078 0.3890 0.2951 0.1971MCL 0.2605 0.1588 0.4464 0.4135 0.3486 0.2563RNSC 0.2909 0.1922 0.6608 0.6048 0.4384 0.3409PROCOMOSS_Lin_Mf 0.2490 0.1150 0.8186 0.7782 0.4515 0.2992PROCOMOSS_Lin_Bp 0.2726 0.1051 0.8141 0.9425 0.4711 0.3147PROCOMOSS_Lin_Cc 0.2321 0.1187 0.6891 0.7144 0.4000 0.2912Affinity_Lin_Mf 0.1624 0.1391 0.3473 0.3513 0.2375 0.2211Affinity_Lin_Bp 0.1443 0.1311 0.3524 0.3492 0.2255 0.2140Affinity_Lin_Cc 0.1565 0.1331 0.3761 0.3523 0.2426 0.2166PROCOMOSS_Jiang_Mf 0.2215 0.1185 0.7379 0.7643 0.4043 0.3010PROCOMOSS_Jiang_Bp 0.1972 0.1178 0.8596 0.7976 0.4117 0.3066PROCOMOSS_Jiang_Cc 0.2119 0.1095 0.8526 0.8952 0.4250 0.3131Affinity_Jiang_Mf 0.1535 0.1507 0.3668 0.3818 0.2373 0.2399Affinity_Jiang_Bp 0.1436 0.1610 0.3754 0.3861 0.2322 0.2493Affinity_Jiang_Cc 0.1512 0.1571 0.3650 0.3830 0.2349 0.2453PROCOMOSS_Kappa_Mf 0.1716 0.1242 0.6390 0.7763 0.3312 0.3105PROCOMOSS_Kappa_Bp 0.2398 0.1285 0.8261 0.7366 0.4450 0.3076PROCOMOSS_Kappa_Cc 0.1833 0.1141 0.5904 0.8113 0.3290 0.3043Affinity_Kappa_Mf 0.1390 0.1391 0.3494 0.3513 0.2204 0.2242Affinity_Kappa_Bp 0.1420 0.1611 0.3546 0.3887 0.2244 0.2503Affinity_Kappa_Cc 0.1487 0.1610 0.3552 0.3868 0.2298 0.2495
This journal is c The Royal Society of Chemistry 2012 Mol. BioSyst., 2012, 8, 3036–3048 3039
Here we use the semantic similarity measures proposed by Lin,
Jiang and Conrath, and Kappa to compute the similarity
matrices. By maximizing it we can group the functionally
similar proteins.
4.4 Selection and mutation
The popularly used genetic operations are selection, crossover,
and mutation. General crossover operation between two
chromosomes results in many disconnected subgraphs and
produces a large number of isolated nodes. So crossover is
not performed here and instead mutation is performed with
high probability (mutation probability = 0.9). The selection
operation used here is the crowded binary tournament selection
used in NSGA-II. If a chromosome is selected to be mutated
then addition or deletion of nodes in the chromosome is
performed in the following way: for a chromosome a random
node ni is selected and either of the two tasks is performed with
equal probability: delete that node or add the nodes which are
direct neighbors of node ni, and are not included in the parent
chromosome. Fig. 2 illustrates the process. Either of the child
chromosomes shown in Fig. 2(b) and (c) are produced from the
parent chromosome shown in Fig. 2(a). The whole operation is
performed five times to create a new diversified chromosome
from the parent chromosome.
5 Experimental results
We ran the proposed algorithm PROCOMOSS on the PPI
network of Saccharomyces cerevisiae (yeast) dataset downloaded
from the DIP27 and MIPS.28 PROCOMOSS takes 2290.93
seconds and 17 776.90 seconds for population initialization and
takes 492.32 seconds and 463.12 seconds to run on a Core 2 duo
2.26 GHz PC having 2 GB internal memory with Windows 7
installed on it, for the DIP and the MIPS dataset respectively.
For DIP out of 5000 S. cerevisiae proteins we used 4669 proteins
and for MIPS we used 3990 proteins out of 6190 due to the
availability of their annotation data. Subsequently we reduced
the interaction dataset which contains the annotated proteins
only. Our used dataset contains 11119 interactions forMIPS and
21621 interactions for DIP. Table 1 summarizes the PPI network
for DIP and MIPS. We match our clustering result with the
known protein complexes consisting of 491 complexes, down-
loaded from the site http://yeast-complexes.russelllab.org/.
The interaction datasets and the benchmark complexes can
be found in the ESIw website.
5.1 Performance comparisons with the existing method
For comparisons of PROCOMOSS clustering results with that
of some other existing algorithms we have employed some
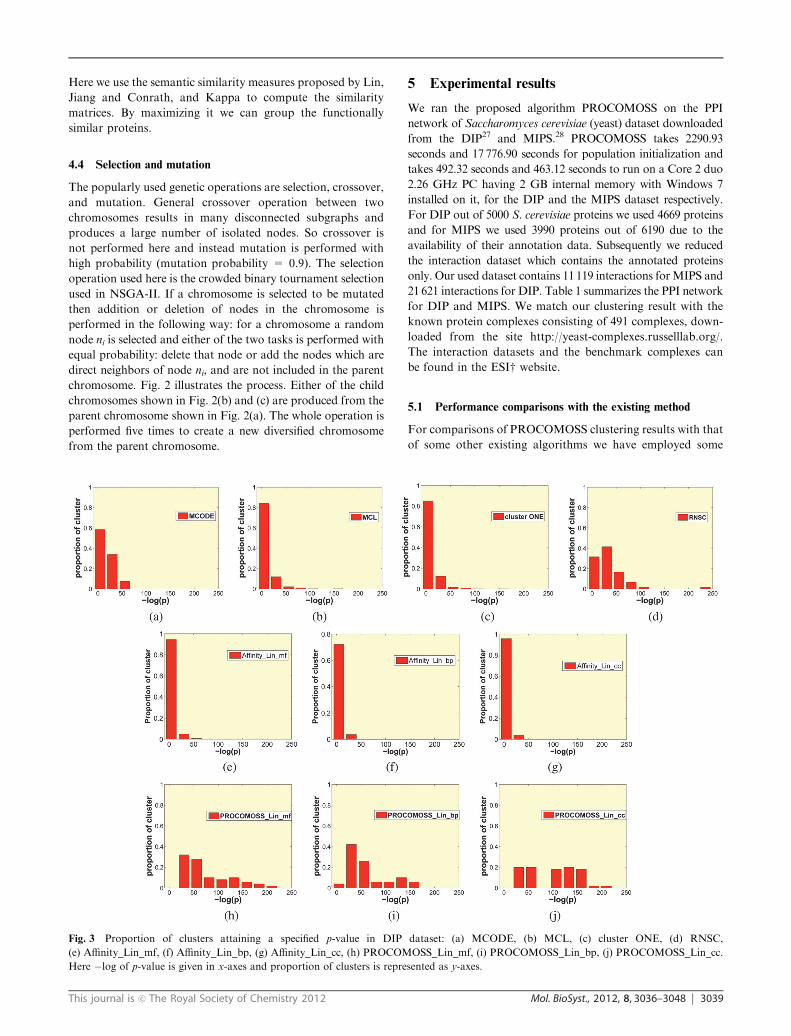
Fig. 3 Proportion of clusters attaining a specified p-value in DIP dataset: (a) MCODE, (b) MCL, (c) cluster ONE, (d) RNSC,
(e) Affinity_Lin_mf, (f) Affinity_Lin_bp, (g) Affinity_Lin_cc, (h) PROCOMOSS_Lin_mf, (i) PROCOMOSS_Lin_bp, (j) PROCOMOSS_Lin_cc.
Here �log of p-value is given in x-axes and proportion of clusters is represented as y-axes.
3040 Mol. BioSyst., 2012, 8, 3036–3048 This journal is c The Royal Society of Chemistry 2012
matching statistics including sensitivity, positive predictive
value (PPV) and accuracy.
We built a contingency table with rows as protein complexes
and columns as resulting clusters. So, the contingency table T
is an n � m matrix having n complexes and m resulting
clusters, where row i corresponds to the i-th annotated
complex, and column j to the j-th cluster. The value of a cell
Ti,j indicates the number of proteins found in common
between complex i and cluster j. Some proteins belong to
several complexes, and some proteins may be assigned to
multiple clusters or not assigned to any cluster.
5.1.1 Sensitivity. Sensitivity is the fraction of proteins of
complex i found in predicted cluster j: Sni;j ¼ Ti;j
Ni; where Ni is
the number of proteins belonging to complex i. A complex-
wise sensitivity Sncoi may be defined as: Sncoi ¼ maxmj¼1 Sni;j .
The general sensitivity (Sn) is the weighted average of Sncoiover all complexes and defined as:
Sn ¼Pn
i¼1 NiSncoiPni¼1 Ni
: ð3Þ
5.1.2 Positive predictive value. The positive predictive
value is the proportion of members of predicted cluster j which
belong to complex i, relative to the total number of members
of this cluster assigned to all complexes: PPVi;j ¼ Ti;jPn
i¼1 Ti;j¼
Ti;j
Tj; where Tj is the marginal sum of a column j. The cluster-
wise positive predictive value PPVcljrepresents the maximal
fraction of proteins of cluster j found in the same complex:
PPVclj ¼ maxni¼1 PPVi;j : The general PPV (PPV) of a clustering
result is the weighted average of clustering-wise-PPV (PPVclj)
over all predicted clusters:
PPV ¼Pm
j¼1 TjPPVcljPmj¼1 Tj
: ð4Þ
5.1.3 Accuracy. The geometric accuracy (Acc) represents a
tradeoff between sensitivity and the positive predictive value
and is defined as:
Acc ¼ffiffiffiffiffiffiffiffiffiffiffiffiffiffiffiffiffiffiffiffiSn � PPVp
: ð5Þ
It is the geometrical mean of the Sn and the PPV. The
advantage of taking the geometric mean is that it yields a
low score when either the Sn or the PPV metric is low. High
accuracy values thus require a high performance for both
criteria.
In Table 2 we list PROCOMOSS clustering results obtained
by using Lin, Jiang and Conrath, and Kappa’s similarity
measures based on each of the three orthogonal taxonomies
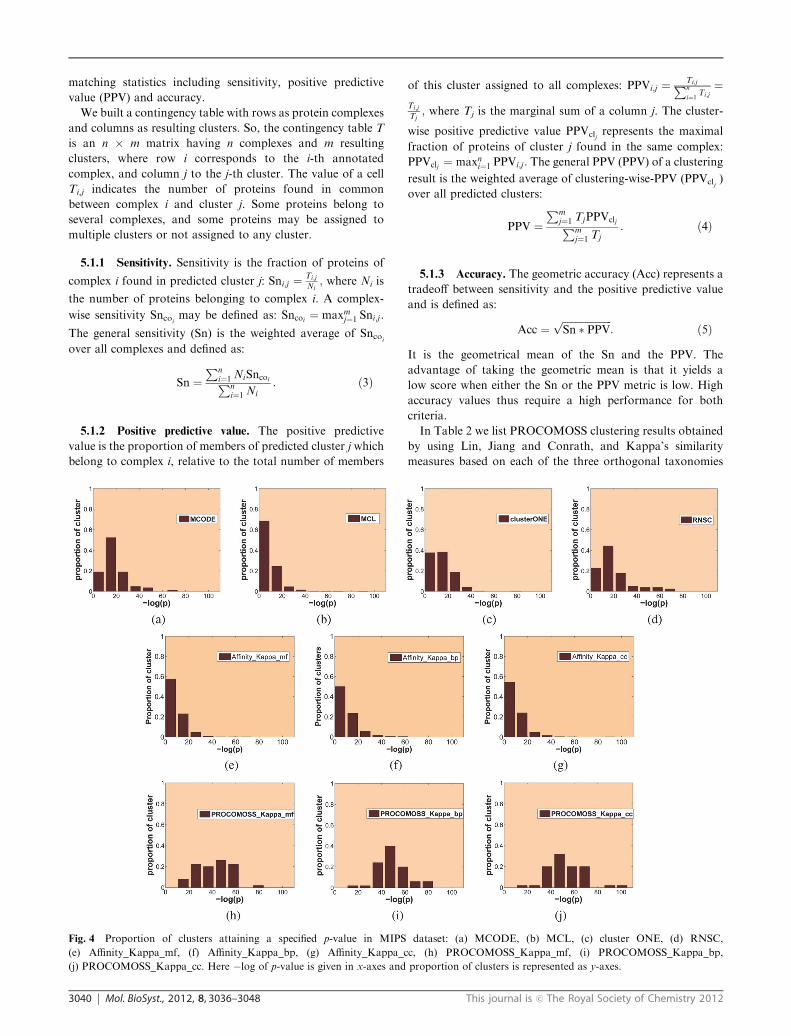
Fig. 4 Proportion of clusters attaining a specified p-value in MIPS dataset: (a) MCODE, (b) MCL, (c) cluster ONE, (d) RNSC,
(e) Affinity_Kappa_mf, (f) Affinity_Kappa_bp, (g) Affinity_Kappa_cc, (h) PROCOMOSS_Kappa_mf, (i) PROCOMOSS_Kappa_bp,
(j) PROCOMOSS_Kappa_cc. Here �log of p-value is given in x-axes and proportion of clusters is represented as y-axes.
This journal is c The Royal Society of Chemistry 2012 Mol. BioSyst., 2012, 8, 3036–3048 3041
or aspects that hold terms describing the molecular function
(mf), biological process (bp) and cellular component (cc) for a
gene product. We also compute the results integrating the
same similarity measures in the Affinity propagation algorithm in
the same network on both DIP and MIPS datasets. As Affinity
propagation groups data points based on the similarity between
each pair of data points, using a semantic similarity matrix in the
Affinity propagation is likely to produce protein modules which
consist of functionally homogeneous proteins. We see in
Table 2 that PROCOMOSS shows comparatively better results
than Affinity propagation for each of the similarity measures.
PROCOMOSS also performs comparatively well than other
algorithms with respect to sensitivity, PPV, and accuracy.
We also perform aGO-based study for comparing the predicted
clusters obtained by PROCOMOSS and other algorithms. We
use org.Sc.sgd.db and GOstats packages from R for computing
the p-values of predicted clusters. In Tables 3 and 4 we list
the most significant GO-terms and corresponding GO-id and
p-values under the biological process category for our clustering
results. It appears that PROCOMOSS shows a comparatively
better result when we use Lin measure as objective function in
the DIP dataset whereas in the MIPS dataset using Kappa’s
measure produces better accuracy values. So we built six tables,
three for Lin measure in the DIP dataset and other three for
Kappa measure in the MIPS dataset describing the most
significant GO-terms, GO-id and p-values of the resulting
clusters. We have given these in the ESIw website. We plotted a
bar diagram as depicted in Fig. 3 and 4 showing the proportion
of clusters attaining a specified p-value for the DIP and theMIPS
dataset respectively. The figures show that a large proportion of
clusters produced by other algorithms have higher p-values in
comparison with PROCOMOSS in which a significantly larger
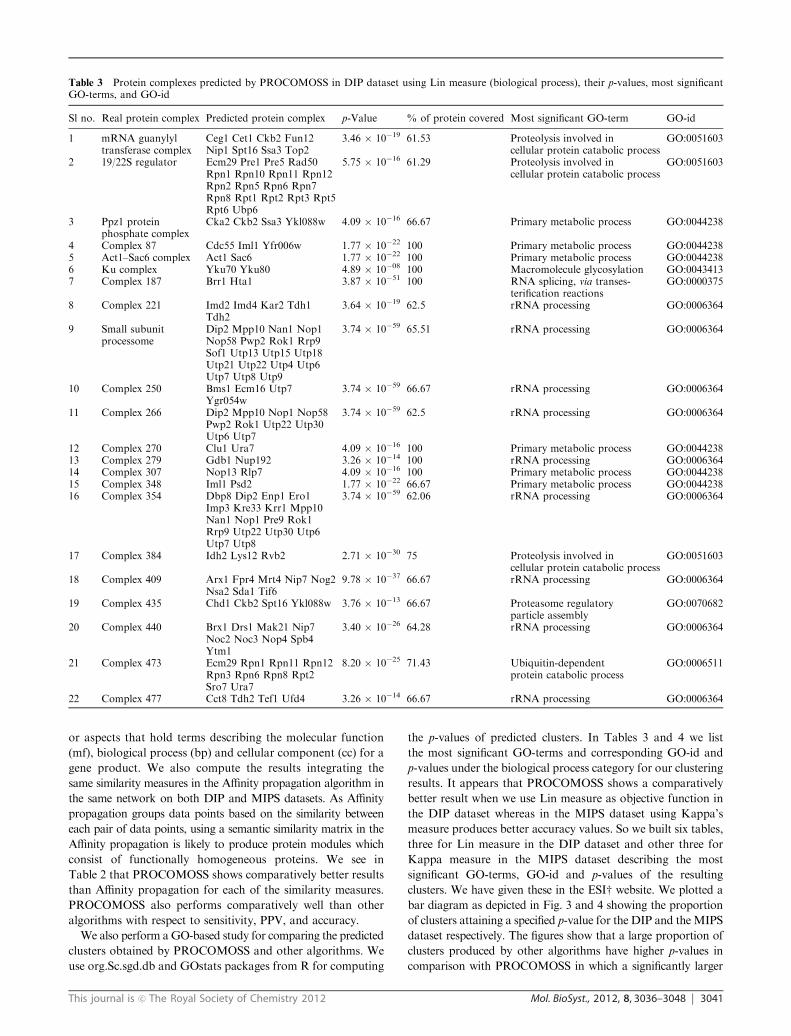
Table 3 Protein complexes predicted by PROCOMOSS in DIP dataset using Lin measure (biological process), their p-values, most significantGO-terms, and GO-id
Sl no. Real protein complex Predicted protein complex p-Value % of protein covered Most significant GO-term GO-id
1 mRNA guanylyltransferase complex
Ceg1 Cet1 Ckb2 Fun12Nip1 Spt16 Ssa3 Top2
3.46 � 10�19 61.53 Proteolysis involved incellular protein catabolic process
GO:0051603
2 19/22S regulator Ecm29 Pre1 Pre5 Rad50Rpn1 Rpn10 Rpn11 Rpn12Rpn2 Rpn5 Rpn6 Rpn7Rpn8 Rpt1 Rpt2 Rpt3 Rpt5Rpt6 Ubp6
5.75 � 10�16 61.29 Proteolysis involved incellular protein catabolic process
GO:0051603
3 Ppz1 proteinphosphate complex
Cka2 Ckb2 Ssa3 Ykl088w 4.09 � 10�16 66.67 Primary metabolic process GO:0044238
4 Complex 87 Cdc55 Iml1 Yfr006w 1.77 � 10�22 100 Primary metabolic process GO:00442385 Act1–Sac6 complex Act1 Sac6 1.77 � 10�22 100 Primary metabolic process GO:00442386 Ku complex Yku70 Yku80 4.89 � 10�08 100 Macromolecule glycosylation GO:00434137 Complex 187 Brr1 Hta1 3.87 � 10�51 100 RNA splicing, via transes-
terification reactionsGO:0000375
8 Complex 221 Imd2 Imd4 Kar2 Tdh1Tdh2
3.64 � 10�19 62.5 rRNA processing GO:0006364
9 Small subunitprocessome
Dip2 Mpp10 Nan1 Nop1Nop58 Pwp2 Rok1 Rrp9Sof1 Utp13 Utp15 Utp18Utp21 Utp22 Utp4 Utp6Utp7 Utp8 Utp9
3.74 � 10�59 65.51 rRNA processing GO:0006364
10 Complex 250 Bms1 Ecm16 Utp7Ygr054w
3.74 � 10�59 66.67 rRNA processing GO:0006364
11 Complex 266 Dip2 Mpp10 Nop1 Nop58Pwp2 Rok1 Utp22 Utp30Utp6 Utp7
3.74 � 10�59 62.5 rRNA processing GO:0006364
12 Complex 270 Clu1 Ura7 4.09 � 10�16 100 Primary metabolic process GO:004423813 Complex 279 Gdb1 Nup192 3.26 � 10�14 100 rRNA processing GO:000636414 Complex 307 Nop13 Rlp7 4.09 � 10�16 100 Primary metabolic process GO:004423815 Complex 348 Iml1 Psd2 1.77 � 10�22 66.67 Primary metabolic process GO:004423816 Complex 354 Dbp8 Dip2 Enp1 Ero1
Imp3 Kre33 Krr1 Mpp10Nan1 Nop1 Pre9 Rok1Rrp9 Utp22 Utp30 Utp6Utp7 Utp8
3.74 � 10�59 62.06 rRNA processing GO:0006364
17 Complex 384 Idh2 Lys12 Rvb2 2.71 � 10�30 75 Proteolysis involved incellular protein catabolic process
GO:0051603
18 Complex 409 Arx1 Fpr4 Mrt4 Nip7 Nog2Nsa2 Sda1 Tif6
9.78 � 10�37 66.67 rRNA processing GO:0006364
19 Complex 435 Chd1 Ckb2 Spt16 Ykl088w 3.76 � 10�13 66.67 Proteasome regulatoryparticle assembly
GO:0070682
20 Complex 440 Brx1 Drs1 Mak21 Nip7Noc2 Noc3 Nop4 Spb4Ytm1
3.40 � 10�26 64.28 rRNA processing GO:0006364
21 Complex 473 Ecm29 Rpn1 Rpn11 Rpn12Rpn3 Rpn6 Rpn8 Rpt2Sro7 Ura7
8.20 � 10�25 71.43 Ubiquitin-dependentprotein catabolic process
GO:0006511
22 Complex 477 Cct8 Tdh2 Tef1 Ufd4 3.26 � 10�14 66.67 rRNA processing GO:0006364
3042 Mol. BioSyst., 2012, 8, 3036–3048 This journal is c The Royal Society of Chemistry 2012
number of clusters tend to have smaller p-values (i.e.
larger �log(p)). This establishes that PROCOMOSS predicts
more functionally homogeneous complexes than the other
algorithms.
5.2 Predicted complexes
We found that some real complexes are recognized by our
PROCOMOSS algorithm. We filtered out those complexes
which have less than sixty percent common proteins with some
of our predicted clusters. Here we give two tables and others
can be found in the ESIw website. In Tables 3 and 4 we list the
protein complexes predicted by our PROCOMOSS algorithm
using Lin measure (biological process annotation) and Kappa’s
measure (molecular function annotation) as objective functions.
Table 3 is built by applying PROCOMOSS on DIP data
whereas Table 4 represents the details of complexes found in
MIPS data. The third column indicates the proteins that are
members of the real protein complex shown in the second
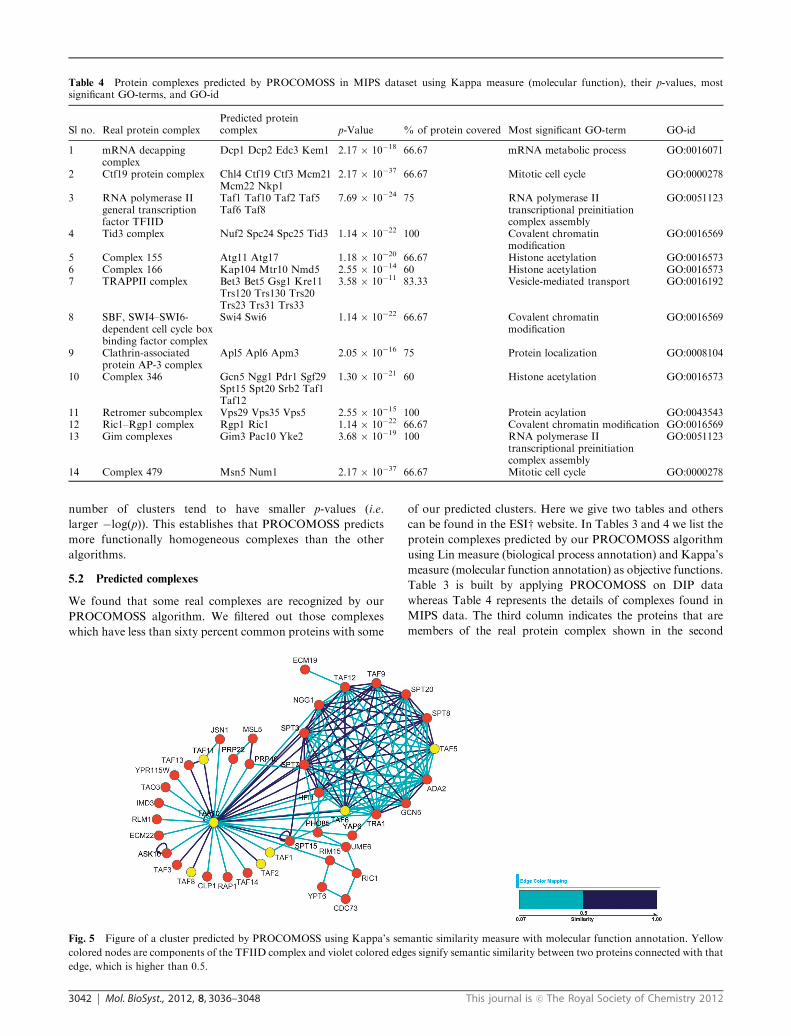
Table 4 Protein complexes predicted by PROCOMOSS in MIPS dataset using Kappa measure (molecular function), their p-values, mostsignificant GO-terms, and GO-id
Sl no. Real protein complexPredicted proteincomplex p-Value % of protein covered Most significant GO-term GO-id
1 mRNA decappingcomplex
Dcp1 Dcp2 Edc3 Kem1 2.17 � 10�18 66.67 mRNA metabolic process GO:0016071
2 Ctf19 protein complex Chl4 Ctf19 Ctf3 Mcm21Mcm22 Nkp1
2.17 � 10�37 66.67 Mitotic cell cycle GO:0000278
3 RNA polymerase IIgeneral transcriptionfactor TFIID
Taf1 Taf10 Taf2 Taf5Taf6 Taf8
7.69 � 10�24 75 RNA polymerase IItranscriptional preinitiationcomplex assembly
GO:0051123
4 Tid3 complex Nuf2 Spc24 Spc25 Tid3 1.14 � 10�22 100 Covalent chromatinmodification
GO:0016569
5 Complex 155 Atg11 Atg17 1.18 � 10�20 66.67 Histone acetylation GO:00165736 Complex 166 Kap104 Mtr10 Nmd5 2.55 � 10�14 60 Histone acetylation GO:00165737 TRAPPII complex Bet3 Bet5 Gsg1 Kre11
Trs120 Trs130 Trs20Trs23 Trs31 Trs33
3.58 � 10�11 83.33 Vesicle-mediated transport GO:0016192
8 SBF, SWI4–SWI6-dependent cell cycle boxbinding factor complex
Swi4 Swi6 1.14 � 10�22 66.67 Covalent chromatinmodification
GO:0016569
9 Clathrin-associatedprotein AP-3 complex
Apl5 Apl6 Apm3 2.05 � 10�16 75 Protein localization GO:0008104
10 Complex 346 Gcn5 Ngg1 Pdr1 Sgf29Spt15 Spt20 Srb2 Taf1Taf12
1.30 � 10�21 60 Histone acetylation GO:0016573
11 Retromer subcomplex Vps29 Vps35 Vps5 2.55 � 10�15 100 Protein acylation GO:004354312 Ric1–Rgp1 complex Rgp1 Ric1 1.14 � 10�22 66.67 Covalent chromatin modification GO:001656913 Gim complexes Gim3 Pac10 Yke2 3.68 � 10�19 100 RNA polymerase II
transcriptional preinitiationcomplex assembly
GO:0051123
14 Complex 479 Msn5 Num1 2.17 � 10�37 66.67 Mitotic cell cycle GO:0000278
Fig. 5 Figure of a cluster predicted by PROCOMOSS using Kappa’s semantic similarity measure with molecular function annotation. Yellow
colored nodes are components of the TFIID complex and violet colored edges signify semantic similarity between two proteins connected with that
edge, which is higher than 0.5.
This journal is c The Royal Society of Chemistry 2012 Mol. BioSyst., 2012, 8, 3036–3048 3043
column and are found in some predicted clusters. The fourth
column represents p-values of the corresponding predicted
clusters which have above 60 percent of common proteins in
real protein complexes. The p-value of a cluster is defined as
the lowest p-values of all the functional groups constituting the
cluster. In row 21 of Table 3 we see that PROCOMOSS_
Lin_bp predicts 10 proteins, of which Rpn1, Rpn11, Rpn12,
Rpn3, Rpn6, Rpn8, and Rpt2 are found in complex 473. These
proteins responsibly act as a regulatory subunit of the 26S
proteasome which is involved in the ATP-dependent degradation
of ubiquitinated proteins. The 26S proteasome is a multi-
subunit enzyme composed of a cylindrical catalytic core
(20S) and a regulatory particle (19S) that together perform the
essential degradation of cellular proteins tagged by ubiquitin.29
In row 9, 19 proteins out of 29 proteins that make the complex
small subunit processome are predicted. The small subunit (SSU)
processome is a ribosome biogenesis intermediate that assembles
from its subcomplexes onto the pre-18S rRNA with yet
unknown order and structure.30 The UtpB subcomplex of
the SSU processome consisting of Utp13, Utp15, Utp18,
Utp21, Utp22, Utp4, Utp6, Utp7, Utp8 and Utp9, which are
involved in nucleolar processing of pre-18S ribosomal RNA
and ribosome assembly, is also predicted.
In row 3 of Table 4, we see that using Kappa’s semantic
similarity measure with molecular function annotation
PROCOMOSS predicts proteins Taf1, Taf10, Taf2, Taf5, Taf6
and Taf8 which function as components of the DNA-binding
general transcription factor complex TFIID. TFIID plays a key
role in the regulation of gene expression by RNA polymerase II
through different activities. In row 4 the predicted four proteins
Nuf2, Spc24, Spc25 and Tid3 of the Tid3 complex act as
components of the essential kinetochore-associated NDC80
complex, which is involved in chromosome segregation and
spindle checkpoint activity. Out of 12 proteins in the TRAPP II
complex, 10 proteins: Bet3, Bet5, Gsg1, Kre11, Trs120, Trs130,
Trs20, Trs23, Trs31 and Trs33 are identified. TRAPP II seems to
play a role in intra-Golgi transport.
Fig. 5 shows a cluster predicted by PROCOMOSS using
Kappa’s semantic similaritymeasure withMF annotation, applying
on the MIPS dataset. Here the edges are colored corresponding
to the similarity between proteins connected by this edge.
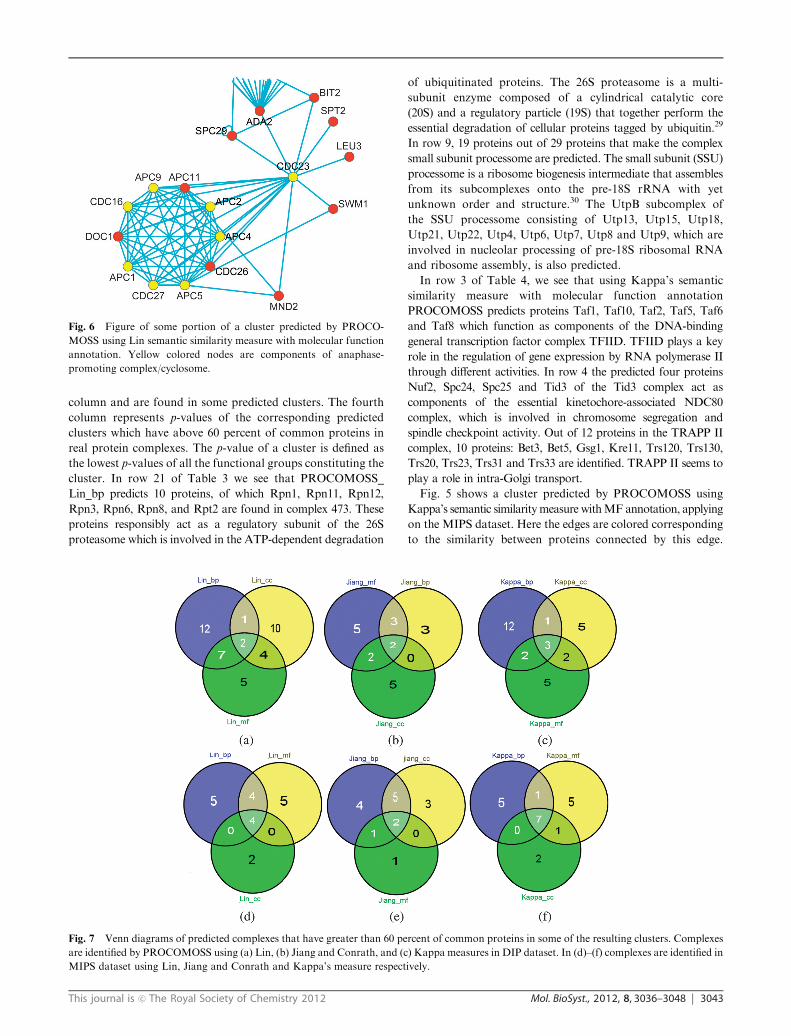
Fig. 6 Figure of some portion of a cluster predicted by PROCO-
MOSS using Lin semantic similarity measure with molecular function
annotation. Yellow colored nodes are components of anaphase-
promoting complex/cyclosome.
Fig. 7 Venn diagrams of predicted complexes that have greater than 60 percent of common proteins in some of the resulting clusters. Complexes
are identified by PROCOMOSS using (a) Lin, (b) Jiang and Conrath, and (c) Kappa measures in DIP dataset. In (d)–(f) complexes are identified in
MIPS dataset using Lin, Jiang and Conrath and Kappa’s measure respectively.
3044 Mol. BioSyst., 2012, 8, 3036–3048 This journal is c The Royal Society of Chemistry 2012
The proteins that are connected by light blue colored edge
have similarity less than 0.5 whereas the proteins that have
similarity greater than 0.5 are connected by violet colored
edges. Yellow colored nodes represent proteins that are the
components of the TFIID complex. Some portion of a cluster
predicted by PROCOMOSS using Lin semantic similarity
measure with molecular function annotation is shown in
Fig. 6. Proteins Apc1, Apc2, Apc4, Apc5, Apc9, Cdc16,
Cdc23 and Cdc27 that are components of the anaphase
promoting complex/cyclosome (APC/C) are shown as yellow
colored nodes. This cluster also captures some portion of the
TFIID complex and the GIM protein complex consisting of
prefoldin subunit 2, 3, 4, 5 (GIM2, GIM3, GIM4 and PAC10).
The figure of the whole cluster is given in the ESIw website.
We drew Venn diagrams to show the overlaps of complexes
predicted by our algorithm PROCOMOSS using three different
semantic similarity measures. Fig. 7(a)–(c) show the overlap of
predicted complexes identified by PROCOMOSS in the DIP
dataset whereas (d)–(f) show the same in the MIPS dataset using
Lin, Jiang and Conrath and Kappa’s semantic similarity measures
respectively. We retain those complexes which have 60 percent of
common proteins with some of the resulting clusters. We see that
in the DIP dataset using Lin measure, PROCOMOSS predicts
in total 41 complexes spanned in three different taxonomies:
biological process (bp), molecular function (mf) and cellular
component (cc), each of which is used to predict 22, 18, and 17
complexes with 9 overlaps between bp and mf, 6 overlaps
between cc and mf and 3 overlaps between cc and bp. We also
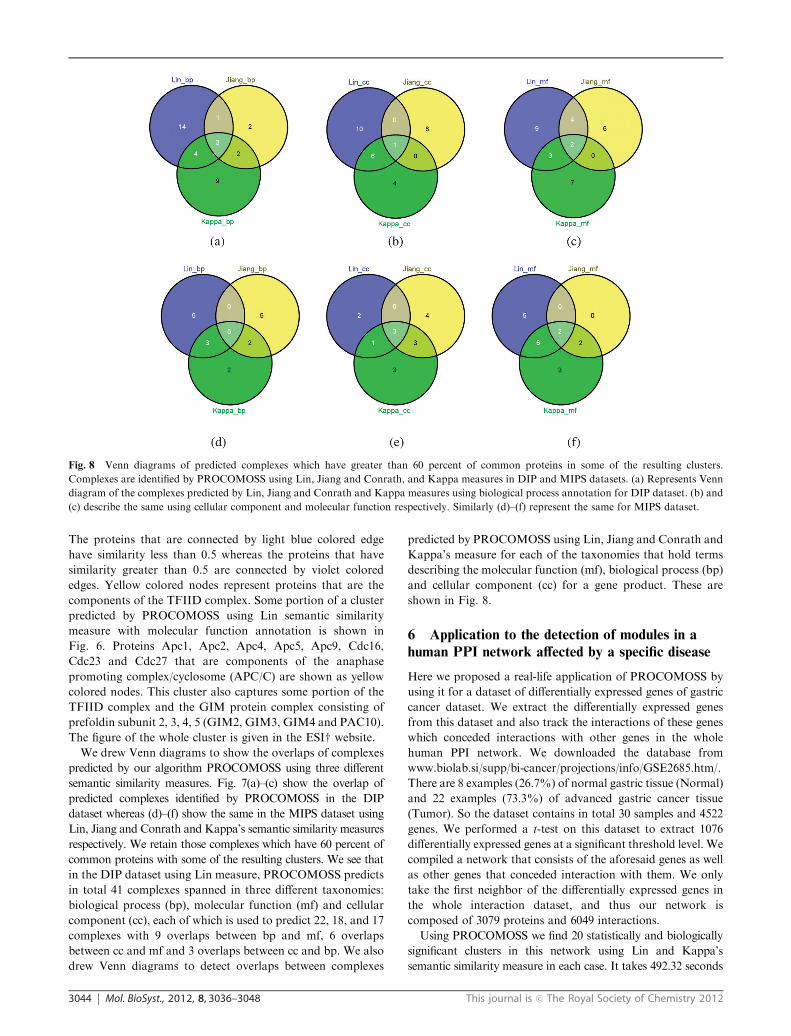
drew Venn diagrams to detect overlaps between complexes
predicted by PROCOMOSS using Lin, Jiang and Conrath and
Kappa’s measure for each of the taxonomies that hold terms
describing the molecular function (mf), biological process (bp)
and cellular component (cc) for a gene product. These are
shown in Fig. 8.
6 Application to the detection of modules in a
human PPI network affected by a specific disease
Here we proposed a real-life application of PROCOMOSS by
using it for a dataset of differentially expressed genes of gastric
cancer dataset. We extract the differentially expressed genes
from this dataset and also track the interactions of these genes
which conceded interactions with other genes in the whole
human PPI network. We downloaded the database from
www.biolab.si/supp/bi-cancer/projections/info/GSE2685.htm/.
There are 8 examples (26.7%) of normal gastric tissue (Normal)
and 22 examples (73.3%) of advanced gastric cancer tissue
(Tumor). So the dataset contains in total 30 samples and 4522
genes. We performed a t-test on this dataset to extract 1076
differentially expressed genes at a significant threshold level. We
compiled a network that consists of the aforesaid genes as well
as other genes that conceded interaction with them. We only
take the first neighbor of the differentially expressed genes in
the whole interaction dataset, and thus our network is
composed of 3079 proteins and 6049 interactions.
Using PROCOMOSS we find 20 statistically and biologically
significant clusters in this network using Lin and Kappa’s
semantic similarity measure in each case. It takes 492.32 seconds
Fig. 8 Venn diagrams of predicted complexes which have greater than 60 percent of common proteins in some of the resulting clusters.
Complexes are identified by PROCOMOSS using Lin, Jiang and Conrath, and Kappa measures in DIP and MIPS datasets. (a) Represents Venn
diagram of the complexes predicted by Lin, Jiang and Conrath and Kappa measures using biological process annotation for DIP dataset. (b) and
(c) describe the same using cellular component and molecular function respectively. Similarly (d)–(f) represent the same for MIPS dataset.
This journal is c The Royal Society of Chemistry 2012 Mol. BioSyst., 2012, 8, 3036–3048 3045
to initialize the population and 49.06 seconds to run for 5
generations and 50 population size on a Core 2 duo 2.26 GHz
PC having 2 GB internal memory with Windows 7 installed on
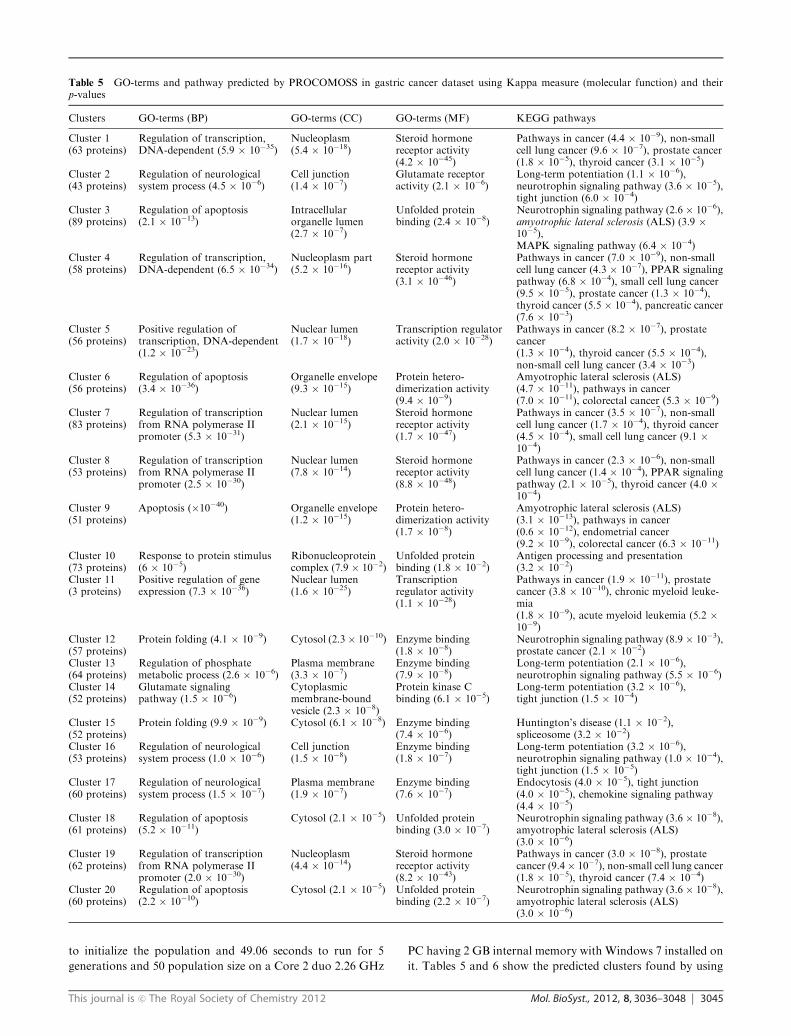
it. Tables 5 and 6 show the predicted clusters found by using
Table 5 GO-terms and pathway predicted by PROCOMOSS in gastric cancer dataset using Kappa measure (molecular function) and theirp-values
Clusters GO-terms (BP) GO-terms (CC) GO-terms (MF) KEGG pathways
Cluster 1(63 proteins)
Regulation of transcription,DNA-dependent (5.9 � 10�35)
Nucleoplasm(5.4 � 10�18)
Steroid hormonereceptor activity(4.2 � 10�45)
Pathways in cancer (4.4 � 10�9), non-smallcell lung cancer (9.6 � 10�7), prostate cancer(1.8 � 10�5), thyroid cancer (3.1 � 10�5)
Cluster 2(43 proteins)
Regulation of neurologicalsystem process (4.5 � 10�6)
Cell junction(1.4 � 10�7)
Glutamate receptoractivity (2.1 � 10�6)
Long-term potentiation (1.1 � 10�6),neurotrophin signaling pathway (3.6 � 10�5),tight junction (6.0 � 10�4)
Cluster 3(89 proteins)
Regulation of apoptosis(2.1 � 10�13)
Intracellularorganelle lumen(2.7 � 10�7)
Unfolded proteinbinding (2.4 � 10�8)
Neurotrophin signaling pathway (2.6 � 10�6),amyotrophic lateral sclerosis (ALS) (3.9 �10�5),MAPK signaling pathway (6.4 � 10�4)
Cluster 4(58 proteins)
Regulation of transcription,DNA-dependent (6.5 � 10�34)
Nucleoplasm part(5.2 � 10�16)
Steroid hormonereceptor activity(3.1 � 10�46)
Pathways in cancer (7.0 � 10�9), non-smallcell lung cancer (4.3 � 10�7), PPAR signalingpathway (6.8 � 10�4), small cell lung cancer(9.5 � 10�5), prostate cancer (1.3 � 10�4),thyroid cancer (5.5 � 10�4), pancreatic cancer(7.6 � 10�3)
Cluster 5(56 proteins)
Positive regulation oftranscription, DNA-dependent(1.2 � 10�23)
Nuclear lumen(1.7 � 10�18)
Transcription regulatoractivity (2.0 � 10�28)
Pathways in cancer (8.2 � 10�7), prostatecancer(1.3 � 10�4), thyroid cancer (5.5 � 10�4),non-small cell lung cancer (3.4 � 10�3)
Cluster 6(56 proteins)
Regulation of apoptosis(3.4 � 10�36)
Organelle envelope(9.3 � 10�15)
Protein hetero-dimerization activity(9.4 � 10�9)
Amyotrophic lateral sclerosis (ALS)(4.7 � 10�11), pathways in cancer(7.0 � 10�11), colorectal cancer (5.3 � 10�9)
Cluster 7(83 proteins)
Regulation of transcriptionfrom RNA polymerase IIpromoter (5.3 � 10�31)
Nuclear lumen(2.1 � 10�15)
Steroid hormonereceptor activity(1.7 � 10�47)
Pathways in cancer (3.5 � 10�7), non-smallcell lung cancer (1.7 � 10�4), thyroid cancer(4.5 � 10�4), small cell lung cancer (9.1 �10�4)
Cluster 8(53 proteins)
Regulation of transcriptionfrom RNA polymerase IIpromoter (2.5 � 10�30)
Nuclear lumen(7.8 � 10�14)
Steroid hormonereceptor activity(8.8 � 10�48)
Pathways in cancer (2.3 � 10�6), non-smallcell lung cancer (1.4 � 10�4), PPAR signalingpathway (2.1 � 10�5), thyroid cancer (4.0 �10�4)
Cluster 9(51 proteins)
Apoptosis (�10�40) Organelle envelope(1.2 � 10�15)
Protein hetero-dimerization activity(1.7 � 10�8)
Amyotrophic lateral sclerosis (ALS)(3.1 � 10�13), pathways in cancer(0.6 � 10�12), endometrial cancer(9.2 � 10�9), colorectal cancer (6.3 � 10�11)
Cluster 10(73 proteins)
Response to protein stimulus(6 � 10�5)
Ribonucleoproteincomplex (7.9 � 10�2)
Unfolded proteinbinding (1.8 � 10�2)
Antigen processing and presentation(3.2 � 10�2)
Cluster 11(3 proteins)
Positive regulation of geneexpression (7.3 � 10�36)
Nuclear lumen(1.6 � 10�25)
Transcriptionregulator activity(1.1 � 10�28)
Pathways in cancer (1.9 � 10�11), prostatecancer (3.8 � 10�10), chronic myeloid leuke-mia(1.8 � 10�9), acute myeloid leukemia (5.2 �10�9)
Cluster 12(57 proteins)
Protein folding (4.1 � 10�9) Cytosol (2.3� 10�10) Enzyme binding(1.8 � 10�8)
Neurotrophin signaling pathway (8.9 � 10�3),prostate cancer (2.1 � 10�2)
Cluster 13(64 proteins)
Regulation of phosphatemetabolic process (2.6 � 10�6)
Plasma membrane(3.3 � 10�7)
Enzyme binding(7.9 � 10�8)
Long-term potentiation (2.1 � 10�6),neurotrophin signaling pathway (5.5 � 10�6)
Cluster 14(52 proteins)
Glutamate signalingpathway (1.5 � 10�6)
Cytoplasmicmembrane-boundvesicle (2.3 � 10�8)
Protein kinase Cbinding (6.1 � 10�5)
Long-term potentiation (3.2 � 10�6),tight junction (1.5 � 10�4)
Cluster 15(52 proteins)
Protein folding (9.9 � 10�9) Cytosol (6.1 � 10�8) Enzyme binding(7.4 � 10�6)
Huntington’s disease (1.1 � 10�2),spliceosome (3.2 � 10�2)
Cluster 16(53 proteins)
Regulation of neurologicalsystem process (1.0 � 10�6)
Cell junction(1.5 � 10�8)
Enzyme binding(1.8 � 10�7)
Long-term potentiation (3.2 � 10�6),neurotrophin signaling pathway (1.0 � 10�4),tight junction (1.5 � 10�5)
Cluster 17(60 proteins)
Regulation of neurologicalsystem process (1.5 � 10�7)
Plasma membrane(1.9 � 10�7)
Enzyme binding(7.6 � 10�7)
Endocytosis (4.0 � 10�5), tight junction(4.0 � 10�5), chemokine signaling pathway(4.4 � 10�5)
Cluster 18(61 proteins)
Regulation of apoptosis(5.2 � 10�11)
Cytosol (2.1 � 10�5) Unfolded proteinbinding (3.0 � 10�7)
Neurotrophin signaling pathway (3.6 � 10�8),amyotrophic lateral sclerosis (ALS)(3.0 � 10�6)
Cluster 19(62 proteins)
Regulation of transcriptionfrom RNA polymerase IIpromoter (2.0 � 10�30)
Nucleoplasm(4.4 � 10�14)
Steroid hormonereceptor activity(8.2 � 10�43)
Pathways in cancer (3.0 � 10�8), prostatecancer (9.4� 10�7), non-small cell lung cancer(1.8 � 10�5), thyroid cancer (7.4 � 10�4)
Cluster 20(60 proteins)
Regulation of apoptosis(2.2 � 10�10)
Cytosol (2.1 � 10�5) Unfolded proteinbinding (2.2 � 10�7)
Neurotrophin signaling pathway (3.6 � 10�8),amyotrophic lateral sclerosis (ALS)(3.0 � 10�6)

3046 Mol. BioSyst., 2012, 8, 3036–3048 This journal is c The Royal Society of Chemistry 2012
Table 6 GO-terms and pathway predicted by PROCOMOSS in gastric cancer dataset using Lin measure (biological function) and their p-values
Cluster GO-terms (BP) GO-terms (CC) GO-terms (MF) KEGG pathway
Cluster 1(47 proteins)
Regulation of transcriptionfrom RNA polymerase IIpromoter (2.4 � 10�26)
Chromatinremodeling complex(9.8 � 10�12)
Ligand-dependentnuclear receptoractivity (1.2 � 10�37)
Pathways in cancer (5.7 � 10�9), notchsignaling pathway (5.9 � 10�5)
Cluster 2(153 proteins)
Cytoskeleton organization(4.2 � 10�20)
Intracellularnon-membrane-bound organelle(1.8 � 10�20)
Actin binding(3.5 � 10�29)
Fc gamma R-mediated phagocytosis(3.5 � 10�12), regulation of actin cytoskeleton(7.9 � 10�9)
Cluster 3(60 proteins)
Regulation of transcription,DNA-dependent(1.8 � 10�21)
Nuclear lumen(7.1 � 10�17)
Transcriptionregulator activity(8.1 � 10�22)
Prostate cancer (8.3 � 10�6), non-small celllung cancer (0.2 � 10�4), glioma (4.0 � 10�4)
Cluster 4(160 proteins)
Cytoskeleton organization(1.9 � 10�17)
Intracellularnon-membrane-bound organelle(7.6 � 10�11)
Actin binding(5.1 � 10�27)
Fc gamma R-mediated phagocytosis(4.2 � 10�10), regulation of actin cytoskeleton(3.0 � 10�8)
Cluster 5(46 proteins)
Positive regulation oftranscription from RNApolymerase II promoter(4.1 � 10�16)
Intracellularorganelle lumen(4.5 � 10�14)
Transcription factorbinding (2.1 � 10�15)
Pathways in cancer (1.5 � 10�10), renal cellcarcinoma (1.5 � 10�9), prostate cancer(8.7 � 10�5)
Cluster 6(98 proteins)
Regulation of RNAmetabolic process(6.8 � 10�34)
Nucleoplasm(2.7 � 10�20)
Transcriptionregulator activity(2.7 � 10�38)
Pathways in cancer (1.4 � 10�10), non-smallcell lung cancer (6.9 � 10�9), thyroid cancer(7.8 � 10�8), small cell lung cancer(3.7 � 10�6), prostate cancer (5.5 � 10�6)
Cluster 7(49 proteins)
Regulation of transcription(6.8 � 10�18)
Chromatinremodeling complex(5.2 � 10�17)
Transcription factorbinding (7.2 � 10�17)
Cell cycle (2.4 � 10�5), prostate cancer(5.9 � 10�5)
Cluster 8(97 proteins)
Regulation of transcriptionfrom RNA polymerase IIpromoter (4.3 � 10�27)
Nuclear lumen(1.8 � 10�15)
Transcriptionregulator activity(7.7 � 10�29)
Pathways in cancer (1.1 � 10�14), prostatecancer (8.1 � 10�8), renal cell carcinoma(1.8 � 10�7), pancreatic cancer (4.4 � 10�5)
Cluster 9(103 proteins)
Regulation of RNAmetabolic process(1.4 � 10�41)
Nuclear lumen(1.7 � 10�24)
Transcriptionregulator activity(2.0 � 10�43)
Pathways in cancer (2.5 � 10�11), prostatecancer (5.8 � 10�11), chronic myeloidleukemia (3.1 � 10�9)
Cluster 10(44 proteins)
Regulation of transcription,DNA-dependent(4.5 � 10�21)
Chromatinremodeling complex(2.6 � 10�20)
Transcriptionregulator activity(1.2 � 10�16)
Cell cycle (9.0 � 10�3), chronic myeloidleukemia (2.8 � 10�3)
Cluster 11(44 proteins)
Positive regulationof transcription from RNApolymerase II promoter(5.6 � 10�18)
Intracellularorganelle lumen(7.3 � 10�13)
Transcription factorbinding (5.0 � 10�17)
Pathways in cancer (7.8 � 10�11), renal cellcarcinoma (1.0 � 10�6), prostate cancer(7.2 � 10�5)
Cluster 12(78 proteins)
Regulation of transcriptionfrom RNA polymerase IIpromoter (2.3 � 10�22)
Nuclear lumen(5.5 � 10�20)
Ligand-dependentnuclear receptoractivity (8.2 � 10�30)
Pathways in cancer (5.4 � 10�9),non-homologous end-joining (5.5 � 10�6),chronic myeloid leukemia (6.9 � 10�6)
Cluster 13(45 proteins)
Regulation of transcriptionfrom RNA polymerase IIpromoter (3.7 � 10�24)
Chromatinremodeling complex(1.0 � 10�8)
Ligand-dependentnuclear receptoractivity (9.0 � 10�41)
Pathways in cancer (8.0 � 10�8), PPARsignaling pathway (1.4 � 10�5), notchsignaling pathway (5.9 � 10�5)
Cluster 14(43 proteins)
Regulation of transcriptionfrom RNA polymerase IIpromoter (5.3 � 10�15)
Nucleoplasm(4.9 � 10�11)
Transcription factorbinding (1.0 � 10�21)
Thyroid cancer (6.1 � 10�8), pathways incancer (1.1� 10�7), non-small cell lung cancer(1.1 � 10�7)
Cluster 15(59 proteins)
Regulation of apoptosis(1.3 � 10�9)
Cytosol (9.3 � 10�5) Unfolded proteinbinding (4.3 � 10�6)
Neurotrophin signaling pathway (3.6 � 10�6),amyotrophic lateral sclerosis (ALS)(3.0 � 10�6), MAPK signaling pathway(1.3 � 10�5)
Cluster 16(92 proteins)
Positive regulation of geneexpression (1.9 � 10�49)
Nuclear lumen(1.4 � 10�27)
Transcriptionregulator activity(4.8 � 10�49)
Pathways in cancer (3.9 � 10�19), chronicmyeloid leukemia (7.8� 10�13), acute myeloidleukemia (4.8 � 10�10), prostate cancer(2.4 � 10�9)
Cluster 17(65 proteins)
Positive regulationof transcription, DNA-dependent (1.4 � 10�15)
Nuclear lumen(6.6 � 10�16)
Transcriptionregulator activity(3.98 � 10�17)
Prostate cancer (1.8 � 10�6), pathways incancer (2.7 � 10�4)
Cluster 18(71 proteins)
Positive regulationof transcription, DNA-dependent (4.1 � 10�31)
Nucleoplasm(3.1 � 10�24)
Transcription factorbinding (4.2 � 10�40)
Pathways in cancer (2.7 � 10�11), cell cycle(8.8 � 10�7), thyroid cancer (8.9 � 10�7),non-small cell lung cancer (2.1 � 10�5)
Cluster 19(55 proteins)
Positive regulation ofnitrogen compoundmetabolic process(4.1 � 10�35)
Nuclear lumen(1.1 � 10�26)
Transcriptionregulator activity(2.0 � 10�28)
Pathways in cancer (1.4 � 10�10), prostatecancer (0.8 � 10�10), chronic myeloidleukemia (1.4 � 10�9), acute myeloidleukemia (4.1 � 10�9), pancreatic cancer(5.1 � 10�7)
Cluster 20(8 proteins)
Regulation of transcription,DNA-dependent(3.5 � 10�33)
Chromatinremodeling complex(8.9 � 10�24)
Transcriptionregulator activity(2.0 � 10�36)
Pathways in cancer (1.7 � 10�7), chronicmyeloid leukemia (3.4 � 10�4), cell cycle(5.0 � 10�4), small cell lung cancer(5.7 � 10�4)
This journal is c The Royal Society of Chemistry 2012 Mol. BioSyst., 2012, 8, 3036–3048 3047
Lin and Kappa’s semantic similarity measures respectively.
Here we have listed the most significant GO-terms, GO-id and
the corresponding p-value of three broadly classified GO
categories: biological process, molecular function and cellular
component. We also find significant KEGG pathway for the
human proteins participating in each cluster. In Table 5, the first
cluster consists of 63 proteins which are involved in several
cancer pathways including lung cancer, prostate cancer, and
thyroid cancer. In cluster 2 the 43 proteins belong to the long-
term potentiation (1.1 � 10�6), neurotrophin signaling pathway
(3.6 � 10�5). Hippocampal long-term potentiation (LTP), a
long-lasting increase in synaptic efficacy, is the molecular basis
for learning and memory. Neurotrophins are a family of trophic
factors involved in differentiation and survival of neural cells.
The neurotrophin family consists of nerve growth factor (NGF),
brain derived neurotrophic factor (BDNF), neurotrophin 3
(NT-3), and neurotrophin 4 (NT-4). Neurotrophin/Trk signaling
is regulated by connecting a variety of intracellular signaling
cascades, which include MAPK pathway, PI-3 kinase pathway,
and PLC pathway, transmitting positive signals like enhanced
survival and growth (http://www.genome.jp/kegg/pathway/hsa/
hsa04722.html). On the other hand, p75NTR transmits both
positive and negative signals. These signals play an important
role in neural development and additional higher-order activities
such as learning and memory.
We see that the proteins in a significant number of predicted
clusters are involved in different types of pathways in cancer
viz., small cell and non-small cell lung cancer, prostate cancer,
thyroid cancer, pancreatic cancer, colorectal cancer, endome-
trial cancer, chronic myeloid leukemia and acute myeloid
leukemia.
In Table 6 we see that 47 proteins in cluster 1 belong to
cancer pathways and the notch signaling pathway. The notch
signaling pathway is an evolutionarily conserved, intercellular
signaling mechanism essential for proper embryonic development
in all metazoan organisms in the animal kingdom. Proteins in
cluster 2 belong to the Fc gamma R-mediated phagocytosis and
regulation of the actin cytoskeleton pathway. Phagocytosis plays
an essential role in host-defense mechanisms through the uptake
and destruction of infectious pathogens. Specialized cell types
including macrophages, neutrophils, and monocytes take
part in this process in higher organisms. After opsonization
with antibodies (IgG), foreign extracellular materials are recognized
by Fc gamma receptors. Cross-linking of Fc gamma receptors
initiates a variety of signals mediated by tyrosine phosphorylation
of multiple proteins, which lead through the actin cytoskeleton
rearrangements and membrane remodeling to the formation of
phagosomes (http://www.genome.jp/kegg/pathway/hsa/hsa04666.
html). Besides the different pathways here also the proteins of our
predicted clusters are involved in a significant number of cancerous
pathways. This implies that the protein complexes identified by
PROCOMOSS are highly involved in cancer progression and thus
are possible candidates for further validation.
In Tables 5 and 6 low p-values of the GO-terms signify that
the clusters are statistically significant and the occurrence of
proteins in those clusters is not merely by chance. Hence we
conclude that PROCOMOSS provides statistically and biologically
significant clusters from a human PPI network consisting of
proteins that are affected by some specific disease.
7 Conclusion
In this article we present a Multiobjective Gene Ontology
based Genetic Algorithm for finding protein complexes in the
protein–protein interaction network. Here we were able to
group functionally similar proteins in a cluster by using
semantic similarity measure of GO terms between protein
pairs as an objective function whereas the density of the cluster
is controlled by graph based objective function. Here we use
the similarity measure proposed by Lin, Jiang and Conrath
and Kappa to compute the similarity matrix. PROCOMOSS
shows better performance in the DIP dataset when we use Lin
measure for building the similarity matrix, compared to the other
measures. But for theMIPS dataset using Kappa’s and Jiang and
Conrath measure PROCOMOSS performs comparatively well.
Irrespective of the similarity measure used, it has been found that
the PROCOMOSS provides a greater number of functionally
homogeneous clusters (lower p-values). Moreover the PPV and
accuracy values are consistently better for the clusters provided
by PROCOMOSS compared to the other algorithms.
We observed that the density of a protein interaction network
built from the MIPS dataset is much lower than that of the DIP
dataset. The number of predicted complexes in MIPS is also
much lower than that in the DIP reference dataset. All the
algorithms including PROCOMOSS have higher sensitivity and
accuracy on the DIP dataset than that on the MIPS dataset.
From this we can conclude that it is more difficult to discover
complexes in a low density network.
We have also applied PROCOMOSS in a human PPI
network consisting of differentially expressed genes in gastric cancer
and have been able to extract statistically and biologically significant
gene modules. Gene ontology based study and pathway analysis
of these modules reveal wider applicability of PROCOMOSS
algorithm.
As a future work we plan to use other semantic similarity
measures as objective functions for predicting protein complexes.
PROCOMOSS can also be applied to the protein interaction
network of other species to predict protein complexes.
References
1 A. Wagner, Proc. R. Soc. London, Ser. B, 2004, 457–466.2 L. Mirny and V. Spirin, Proc. Natl. Acad. Sci. U. S. A., 2003,100(21), 12123–12128.
3 M. Altaf-Ul-Amin, Y. Shinbo, K. Mihara, K. Kurokawa andS. Kanaya, BMC Bioinf., 2006, 7, 207.
4 S. Brohe and J. van Helden, BMC Bioinf., 2006, 7, 471–488.5 J. Pereira-Leal, A. Enright and C. Ouzounis, Proteins, 2004, 54,49–57.
6 G. Bader and C. Hogue, BMC Bioinf., 2003, 4, 1471–2105.7 S. Van Dongen, ‘A new cluster algorithm for graphs,’ Center forMathematics and Computer Science (CWI), Amsterdam technicalreport, 2000.
8 N. Przulj and D. Wigle, Bioinformatics, 2003, 20, 340–348.9 T. Nepusz, H. Yu and A. Paccanaro, Nat. Methods, 2012, 9,471–472.
10 K. Deb, A. Pratap, S. Agrawal and T. Meyarivan, IEEE Trans.Evol. Comput., 2002, 6, 182–197.
11 K. Deb, Multi-objective Optimization Using Evolutionary Algorithms,John Wiley and Sons, Ltd., England, 2001.
12 S. Bandyopadhyay, A. Mukhopadhyay and U.Maullik,MultiobjectiveGenetic Algorithms for Clustering, Springer-Verlag, Berlin, Heidelberg,2011.
13 B. J. Frey and D. Dueck, Science, 2007, 315, 972–976.
3048 Mol. BioSyst., 2012, 8, 3036–3048 This journal is c The Royal Society of Chemistry 2012
14 C. A. Coello, Knowl. Inf. Syst., 1999, 1, 129–156.15 C. Coello Coello, D. V. Veldhuizen and G. Lamont, Evolutionary
Algorithms for Solving Multi-Objective Problems, Kluwer Aca-demic Publishers, 2002.
16 C. Coello Coello, IEEE Comput. Intell. Mag., 2006, 1, 28–36.17 M. Ashburner, C. Ball, J. Blake, D. Botstein, H. Butler, J. Cherry,
A. Davis, K. Dolinski and S. Dwight et al.,Nat. Genet, 2000, 25, 25–29.18 H. Wang, F. Azuaje, O. Bodenreider and J. Dopazo, Proc. IEEE
Symp. Comput. Intell. Bioinf. Comput. Biol., 2004, 25–31.19 F. M. Couto, M. J. Silva and P. M. Coutinho, Data Knowl. Eng.,
2007, 61, 137–152.20 P. Lord, R. Stevens, A. Brass and C. Goble, Bioinformatics, 2003,
19, 1275–1283.21 D. Lin, Proceedings of the 15th International Conference on Machine
Learning, 1998, pp. 296–304.22 J. J. Jiang and D. W. Conrath, Proceedings of the International
Conference Research on Computational Linguistics, 1997.
23 D. Huang, B. Sherman, Q. Tan, J. Collins, W. Alvord, J. Roayaei,R. Stephens, M. Baseler, H. Lane and R. Lempicki, Genome Biol.,2007, 8, R183.
24 U. Maulik, A. Mukhopadhyay and S. Bandyopadhyay, IEEETrans. Inf. Technol. Biomed., 2009, 13, 969–975.
25 A. Mukhopadhyay, U. Maulik and S. Bandyopadhyay, PLoS One,2012, 7, e32289.
26 U. Maulik, M. Bhattacharyya, A. Mukhopadhyay andS. Bandyopadhyay, Mol. BioSyst., 2011, 7, 1842–1851.
27 I. Xenarios, L. Salwinski, X. Duan, P. Higney, S. Kim andD. Eisenberg, Nucleic Acids Res., 2002, 30, 303–305.
28 U. Guldener, M. Munsterktter, M. Oesterheld, P. Pagel, A. Ruepp,H. Mewes and V. Stumpflen,Nucleic Acids Res., 2006, 34, 436–441.
29 R. Rosenzweig, P. A. Osmulski, M. Gaczynska and M. H. Glickman,Nat. Struct. Mol. Biol., 2008, 15, 573–580.
30 E. Champion, B. Lane, M. Jackrel, L. Regan and S. Baserga, Mol.Cell. Biol., 2008, 21, 6547–6556.