ARTIFICIAL NEURAL NETWORK MODEL FOR RAINFALL-RUNOFF RELATIONSHIP
Upload
independentCategory
view
0download
0
DETECTING OF RUNOFF VARIABILITY CHANGES IN DANUBE DAILY DISCHARGE TIME SERIES 1876–2006
Pavla Pekarova1, Peter Skoda2, Pavol Miklanek1, Dana Halmova1, Jan Pekar3
1Institute of Hydrology SAS, Racianska 75 831 02 Bratislava, Slovakia
2Slovak Hydrometeorological Institute, Jeseniova 17 833 15 Bratislava, Slovakia
3Department of Applied Mathematics and Statistics, FMPI, CU Bratislava, Mlynska dolina, 842 48 Bratislava, Slovakia
Abstract
It is generally supposed that the global warming will result in increasing of the hydrological phenomena extremality. In case of discharges it is expected that both low flows duration and flood frequency will increase. Approval of this hypothesis by statistical evaluation of the daily runoff characteristics depends on availability of high quality homogeneous data series of long periods. The aim of this paper is to analyze the mean daily discharge of Danube in Bratislava in different sub-periods of the period 1876–2006. We compared the moving averages of 30-years and 15-years periods. The statistical tests did not confirm the increase of daily runoff extremality of the Danube River in 1876–2006. On the contrary, the daily discharges variability decreases. In last 30 years the discharge increased in winter-spring season and decreased in summer season compared to previous periods. It can be explained by the higher air temperature in the upper Danube basin. A warmer climate causes an early snowmelt in winter-spring period, and thus less runoff in summer, when the precipitation totals are maximal. In 130-years time series of mean daily discharge of Danube in Bratislava we did not detect any important change of the basic statistical runoff characteristics in one direction (discharge increase or decrease). Keywords: Danube River, daily discharge variability, statistical analysis. 1 INTRODUCTION Impact of the anthropogenic activity upon the runoff changes can be assessed by analysis of the mean daily discharge characteristics. In general, an opinion prevails that with the atmospheric temperature increase, the precipitation and therefore the runoff extremality is also rising – the peaks rise and the minimum values drop down. It is possible to confirm or to question this opinion only through a detailed statistical analysis of the various runoff characteristics. In such analysis, it is necessary to involve as long as possible time series of the observed daily discharge data, at least 100-years long. It is also necessary to analyse both periods: the one before the atmospheric temperature increase, and the one following it. The only station with a continuous time series of the discharge observations over 130 years in Slovakia is the one on the river Danube at the Bratislava gauge. Therefore in the presented study we tried to find (through statistical methods) the long-term changes in the characteristics of the mean monthly as well as of the mean daily flows, and also of the extremes (Qmax) of this precious runoff series.
The aims of the contribution are: 1. Completion of the missing mean daily discharge data of Danube at Bratislava
station (1876–1890); 2. Analysis of the daily discharge distribution changes; 3. Analysis of the mean monthly discharge regime changes; 4. Analysis of the long-term trends and long-term variability of the mean daily
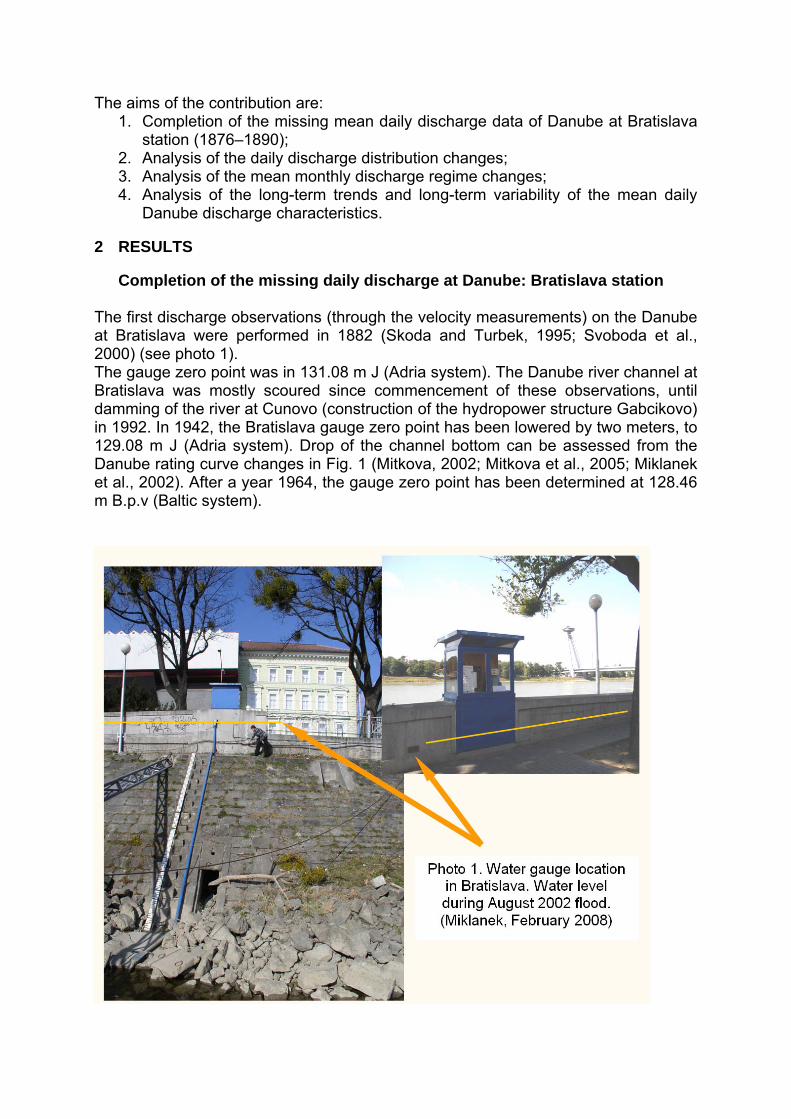
Danube discharge characteristics. 2 RESULTS Completion of the missing daily discharge at Danube: Bratislava station The first discharge observations (through the velocity measurements) on the Danube at Bratislava were performed in 1882 (Skoda and Turbek, 1995; Svoboda et al., 2000) (see photo 1). The gauge zero point was in 131.08 m J (Adria system). The Danube river channel at Bratislava was mostly scoured since commencement of these observations, until damming of the river at Cunovo (construction of the hydropower structure Gabcikovo) in 1992. In 1942, the Bratislava gauge zero point has been lowered by two meters, to 129.08 m J (Adria system). Drop of the channel bottom can be assessed from the Danube rating curve changes in Fig. 1 (Mitkova, 2002; Mitkova et al., 2005; Miklanek et al., 2002). After a year 1964, the gauge zero point has been determined at 128.46 m B.p.v (Baltic system).
1.
100
200
300
400
500
600
700
800
900
1000
0 2000 4000 6000 8000 10000
Q [m 3s -1]
WS
[cm
]
Q50before 1903
2002
1991
1965
Q10
0
I.
II.
III.
2002
1899
1954
2.
0
2000
4000
6000
8000
10000
12000
100 500 900WS [cm]
Q [m
3 s-1]
Q = -0.0000077 VS3
+ 0.02018 VS2
- 3.86 VS + 597.366
Q = 0.0000016 VS3
+ 0.0098.VS2
+ 0.0978 VS+ 52.69
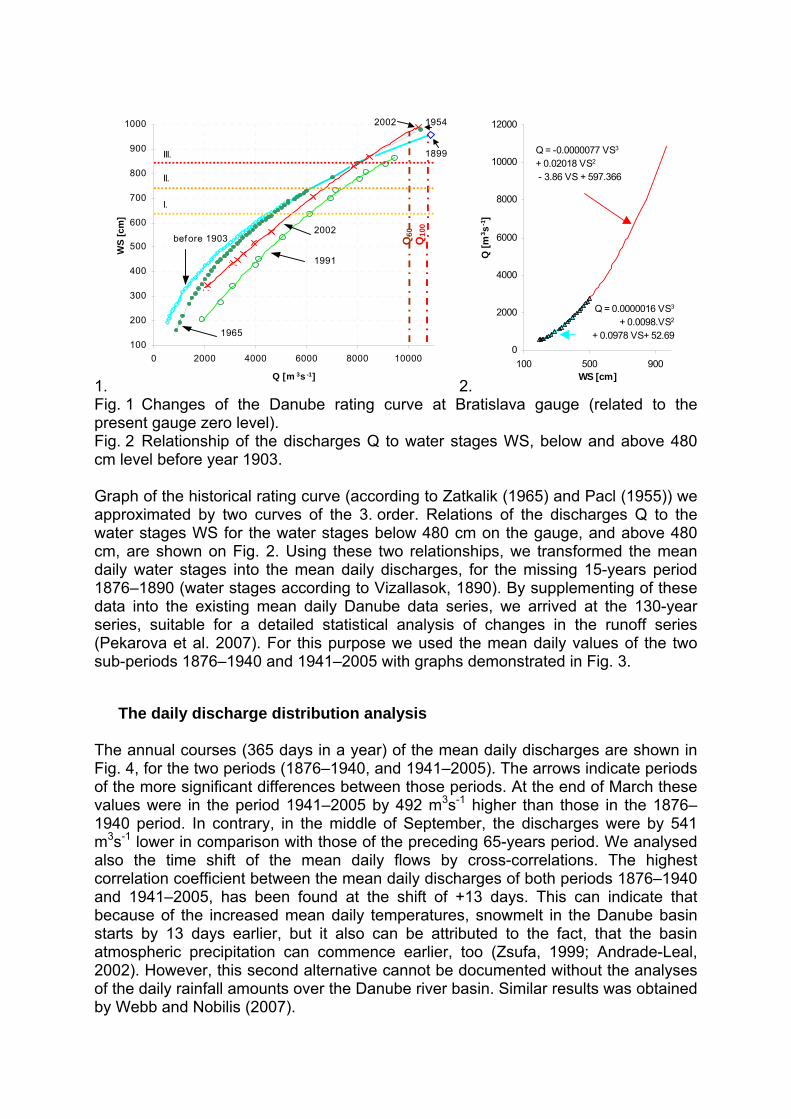
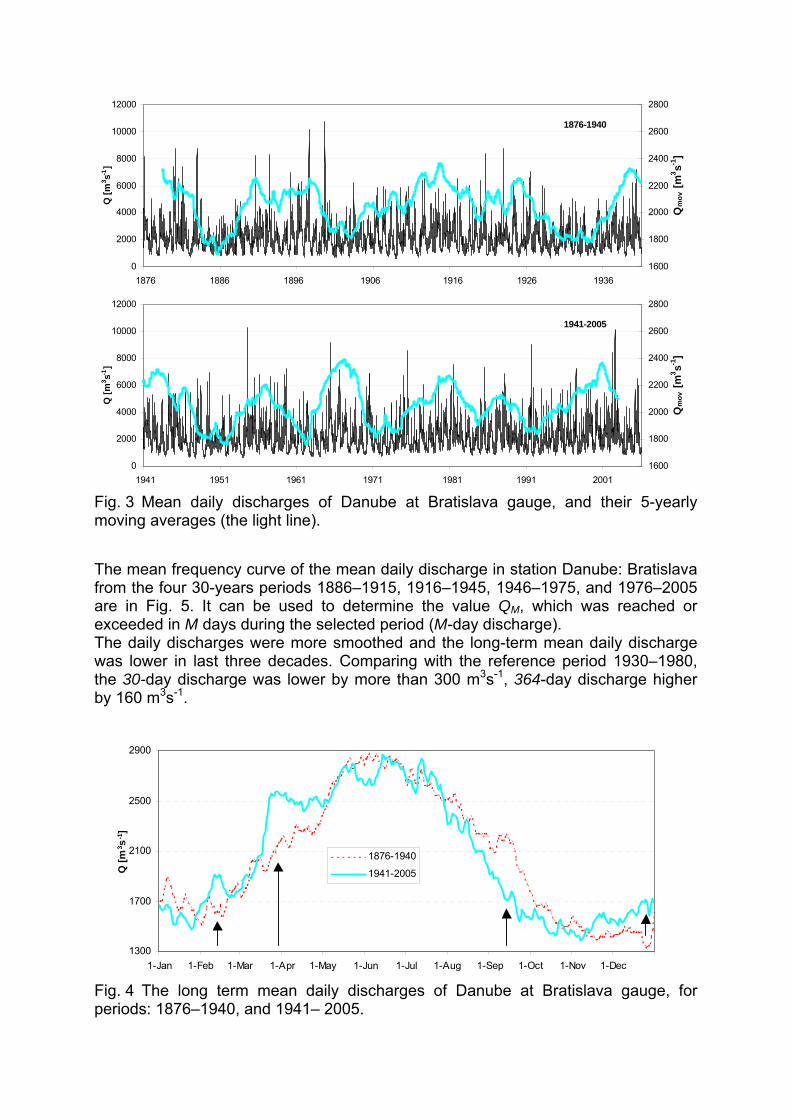
Fig. 1 Changes of the Danube rating curve at Bratislava gauge (related to the present gauge zero level). Fig. 2 Relationship of the discharges Q to water stages WS, below and above 480 cm level before year 1903. Graph of the historical rating curve (according to Zatkalik (1965) and Pacl (1955)) we approximated by two curves of the 3. order. Relations of the discharges Q to the water stages WS for the water stages below 480 cm on the gauge, and above 480 cm, are shown on Fig. 2. Using these two relationships, we transformed the mean daily water stages into the mean daily discharges, for the missing 15-years period 1876–1890 (water stages according to Vizallasok, 1890). By supplementing of these data into the existing mean daily Danube data series, we arrived at the 130-year series, suitable for a detailed statistical analysis of changes in the runoff series (Pekarova et al. 2007). For this purpose we used the mean daily values of the two sub-periods 1876–1940 and 1941–2005 with graphs demonstrated in Fig. 3. The daily discharge distribution analysis The annual courses (365 days in a year) of the mean daily discharges are shown in Fig. 4, for the two periods (1876–1940, and 1941–2005). The arrows indicate periods of the more significant differences between those periods. At the end of March these values were in the period 1941–2005 by 492 m3s-1 higher than those in the 1876–1940 period. In contrary, in the middle of September, the discharges were by 541 m3s-1 lower in comparison with those of the preceding 65-years period. We analysed also the time shift of the mean daily flows by cross-correlations. The highest correlation coefficient between the mean daily discharges of both periods 1876–1940 and 1941–2005, has been found at the shift of +13 days. This can indicate that because of the increased mean daily temperatures, snowmelt in the Danube basin starts by 13 days earlier, but it also can be attributed to the fact, that the basin atmospheric precipitation can commence earlier, too (Zsufa, 1999; Andrade-Leal, 2002). However, this second alternative cannot be documented without the analyses of the daily rainfall amounts over the Danube river basin. Similar results was obtained by Webb and Nobilis (2007).
0
2000
4000
6000
8000
10000
12000Q
[m3 s-1
]
1600
1800
2000
2200
2400
2600
2800
Qm
ov [m
3 s-1]
1876-1940
1876 1886 1896 1906 1916 1926 1936
0
2000
4000
6000
8000
10000
12000
Q [m
3 s-1]
1600
1800
2000
2200
2400
2600
2800
Qm
ov [m
3 s-1]
1941-2005
1941 1951 1961 1971 1981 1991 2001 Fig. 3 Mean daily discharges of Danube at Bratislava gauge, and their 5-yearly moving averages (the light line). The mean frequency curve of the mean daily discharge in station Danube: Bratislava from the four 30-years periods 1886–1915, 1916–1945, 1946–1975, and 1976–2005 are in Fig. 5. It can be used to determine the value QM, which was reached or exceeded in M days during the selected period (M-day discharge). The daily discharges were more smoothed and the long-term mean daily discharge was lower in last three decades. Comparing with the reference period 1930–1980, the 30-day discharge was lower by more than 300 m3s-1, 364-day discharge higher by 160 m3s-1.
1300
1700
2100
2500
2900
1-Jan 1-Feb 1-Mar 1-Apr 1-May 1-Jun 1-Jul 1-Aug 1-Sep 1-Oct 1-Nov 1-Dec
Q [m
3 s-1]
1876-1940
1941-2005
Fig. 4 The long term mean daily discharges of Danube at Bratislava gauge, for periods: 1876–1940, and 1941– 2005.
0.00
01
0.00
050.
0010
0.00
20
0.00
500.
0100
0.02
00
0.05
00
0.10
00
0.20
00
0.30
00
0.40
000.
5000
0.60
00
0.70
00
0.80
00
0.90
00
0.95
00
0.98
00
0.99
000.
9950
0.99
800.
9990
0.99
95
0.99
99
p [%]
1000
10000
2000
3000
4000
50006000700080009000
Q [m
3 s-1]
1976-2005
1886-1915
1946-1975
1916-1945
30-daily discharge
330-daily discharge
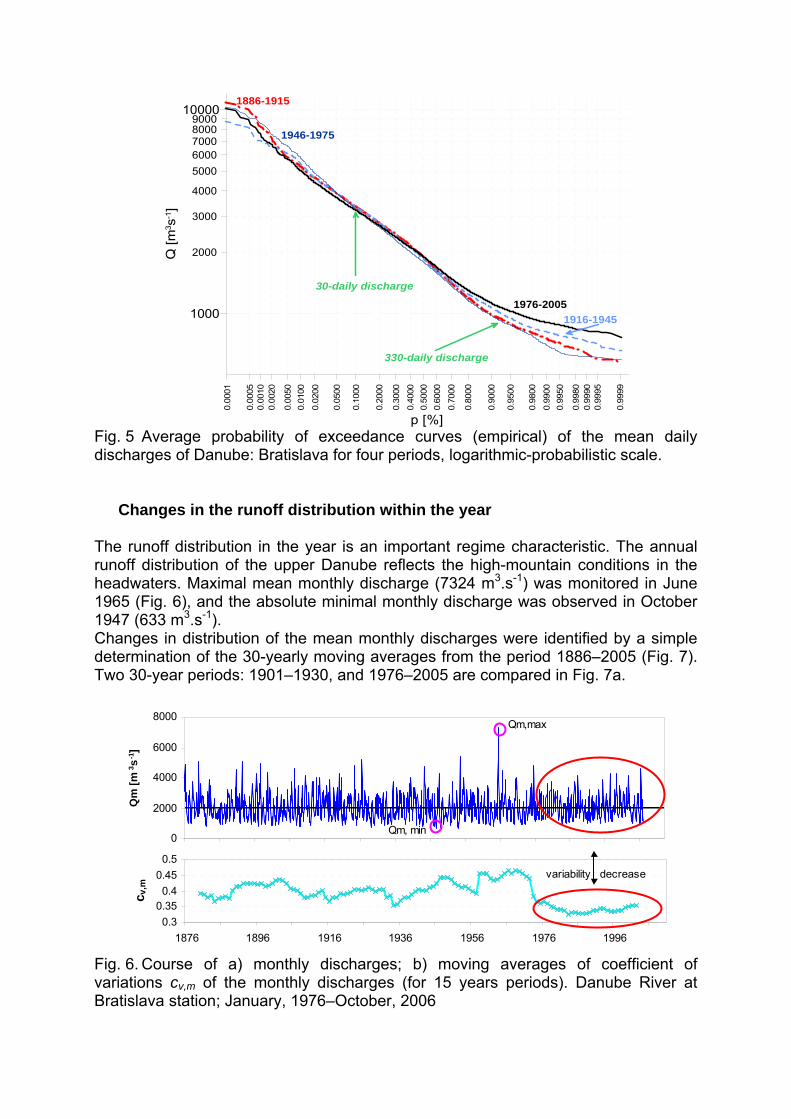
Fig. 5 Average probability of exceedance curves (empirical) of the mean daily discharges of Danube: Bratislava for four periods, logarithmic-probabilistic scale. Changes in the runoff distribution within the year The runoff distribution in the year is an important regime characteristic. The annual runoff distribution of the upper Danube reflects the high-mountain conditions in the headwaters. Maximal mean monthly discharge (7324 m3.s-1) was monitored in June 1965 (Fig. 6), and the absolute minimal monthly discharge was observed in October 1947 (633 m3.s-1). Changes in distribution of the mean monthly discharges were identified by a simple determination of the 30-yearly moving averages from the period 1886–2005 (Fig. 7). Two 30-year periods: 1901–1930, and 1976–2005 are compared in Fig. 7a.
0
2000
4000
6000
8000
Qm
[m3 s
-1]
Qm,max
Qm, min
0.30.350.4
0.450.5
1876 1896 1916 1936 1956 1976 1996
c v,m
variability decrease
Fig. 6. Course of a) monthly discharges; b) moving averages of coefficient of variations cv,m of the monthly discharges (for 15 years periods). Danube River at Bratislava station; January, 1976–October, 2006
a)
1300
1800
2300
2800
I III V VII IX XI
Q [m
3 s-1
]1901-1930
1976-2005
1600170018001900200021002200230024002500
1850 1870 1890 1910 1930 1950 1970 1990 2010
Q [m
3 s-1
]
w inter - spring period, (XI. - IV.)
summer - autumn period, (V. - X.)
b)
30
60
90
120
150
I III V VII IX XI
P [m
m]
1976-2005
1901-1930
250350450550650750850
1850 1870 1890 1910 1930 1950 1970 1990 2010
P [m
m]
w inter-spring period (XI. - IV.)
summer-autumn, (V. - X.)
Hohenpeissenberg
30507090
110130150
I III V VII IX XI
P [m
m] 1976-
2005
1901-1930
250
350
450
550
650
1850 1870 1890 1910 1930 1950 1970 1990 2010
P [m
m]
w inter-spring period (XI. - IV.)
summer-autumn period, (V. - X.)
Insbruck
30507090
110130150
I III V VII IX XI
P [m
m]
1976-2005
1901-1930
250
350
450
550
650
1850 1870 1890 1910 1930 1950 1970 1990 2010
P [m
m]
w inter-spring period (XI. - IV.)
summer-autumn, (V. - X.)Muenchen
200
250
300
350
400
450
1850 1870 1890 1910 1930 1950 1970 1990 2010
P [m
m]
w inter-spring period (XI. - IV.)
summer-autumn, (V. - X.)
Wien
30507090
110130150
I III V VII IX XI
P [m
m]
1976-2005
1901-1930
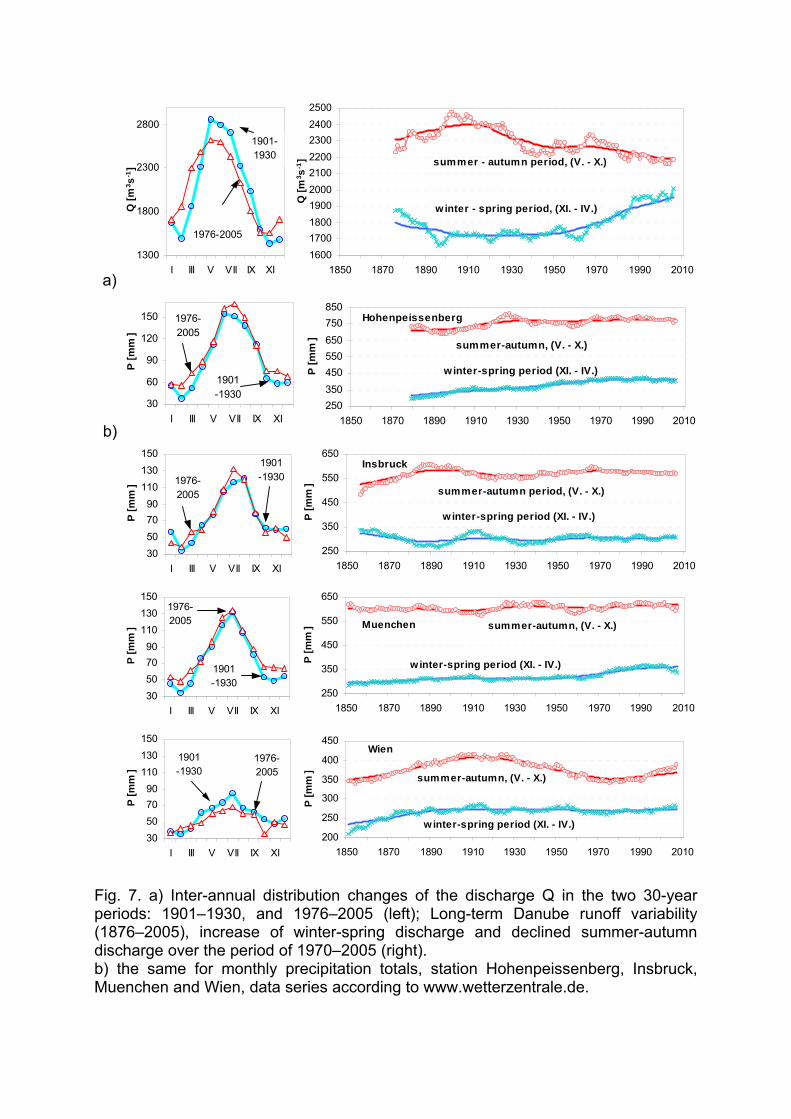
Fig. 7. a) Inter-annual distribution changes of the discharge Q in the two 30-year periods: 1901–1930, and 1976–2005 (left); Long-term Danube runoff variability (1876–2005), increase of winter-spring discharge and declined summer-autumn discharge over the period of 1970–2005 (right). b) the same for monthly precipitation totals, station Hohenpeissenberg, Insbruck, Muenchen and Wien, data series according to www.wetterzentrale.de.
In the years 1901–1930, the winter discharges were moderately below, and the June–July discharges above the average. In the last 30-yearly period, the within-the-year runoff distribution shows expressive changes. In the winter-spring season (November through April) the discharges are above the average, in summer (June through August) they are below. This can be explained by the higher air temperature in the upper Danube basin. A warmer climate causes an early snowmelt in the winter-spring period, and thus less runoff is observed in summer when the precipitation totals are maximal. Therefore, waves resulting from snow-melt and extreme summer rainfall may not occur coincidently. Nevertheless, the reason can be attributed to changes in annual precipitation totals in the Danube upper basin (Fig 7b). But we cannot prove this, since records with monthly areal precipitations for the Danube upper basin over the period 1876–2005 are not available. The flattened yearly discharge may be caused by altered land-use practices and construction of numerous water reservoirs throughout the basin. The long-term trends and the multi-annual oscillation of the stream flow characteristics In this part of the study, we concentrate over evaluation of the yearly Danube runoff characteristics at Bratislava site. The following 130-yearly time series were computed (from average daily discharge for each year):
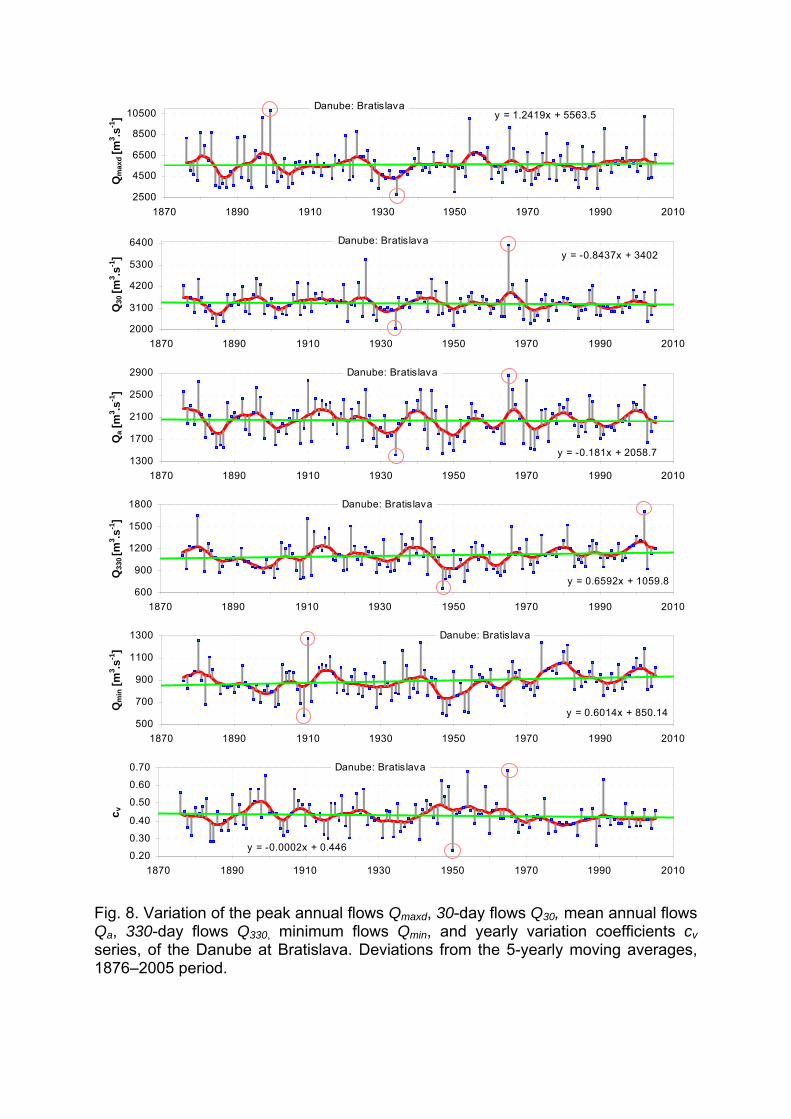
1. the annual peak flows (Qmaxd); 2. the 30-day flows (Q30, flows exceeded 30 days in a year – indicator of higher
flows, not maxima); 3. the average annual flows (Qa); 4. the 330-day flows (Q330, flows exceeded 330 days in a year – indicator of the
lower flows, not minima); 5. the annual minimum flows (Qmin); 6. the annual variation coefficients (cv).
Time courses of the analyzed series are shown in Fig. 8. It could be seen from these graphs, that the expressive changes in the mean annual Danube runoff within the last 130-years probably did not occur. Minimum discharges Qmin and 330-day discharge Q330, rise moderately, approx. by 0.6 m3s-1 per a year. On the other hand, the 30-day discharge Q30 drop moderately, approx. by 0.8 m3s-1 per a year. The yearly series of variation coefficient cv of the Danube mean daily discharges also fairly drop, b= – 0.0002. The mean daily maxima Qmax series rise slowly (by 1.2 m3s-1 in a year), which compared with the order of the Danube peak flow values is not a substantial figure. The statistical tests did not confirm the increase of daily runoff extremality of the Danube River in 1876–2006. Finally, we compared the moving averages of 15-years periods of 30- and 330-day flows of Danube at Bratislava (Fig. 9). Evaluating significance of the trends, of the 30-daily flows drop, and of the 330-daily flows rise, we used the CPTA software (Prochazka, et al., 2001; Pekarova and Pekar; 2007). From the statistical point of view, no significant trends were confirmed for both of the above discharge characteristics, within the used 130-yearly period.
y = 1.2419x + 5563.5
2500
4500
6500
8500
10500
1870 1890 1910 1930 1950 1970 1990 2010
Qm
axd [
m3 .s
-1]
Danube: Bratislava
y = -0.8437x + 3402
2000
3100
4200
5300
6400
1870 1890 1910 1930 1950 1970 1990 2010
Q30
[m3 .s
-1]
Danube: Bratislava
y = -0.181x + 2058.71300
1700
2100
2500
2900
1870 1890 1910 1930 1950 1970 1990 2010
Qa [
m3 .s
-1]
Danube: Bratislava
y = 0.6592x + 1059.8600
900
1200
1500
1800
1870 1890 1910 1930 1950 1970 1990 2010
Q33
0 [m
3 .s-1
]
Danube: Bratis lava
y = 0.6014x + 850.14500
700
900
1100
1300
1870 1890 1910 1930 1950 1970 1990 2010
Qm
in [m
3 .s-1
]
Danube: Bratislava
y = -0.0002x + 0.4460.20
0.30
0.40
0.50
0.60
0.70
1870 1890 1910 1930 1950 1970 1990 2010
c v
Danube: Bratislava
Fig. 8. Variation of the peak annual flows Qmaxd, 30-day flows Q30, mean annual flows Qa, 330-day flows Q330, minimum flows Qmin, and yearly variation coefficients cv series, of the Danube at Bratislava. Deviations from the 5-yearly moving averages, 1876–2005 period.
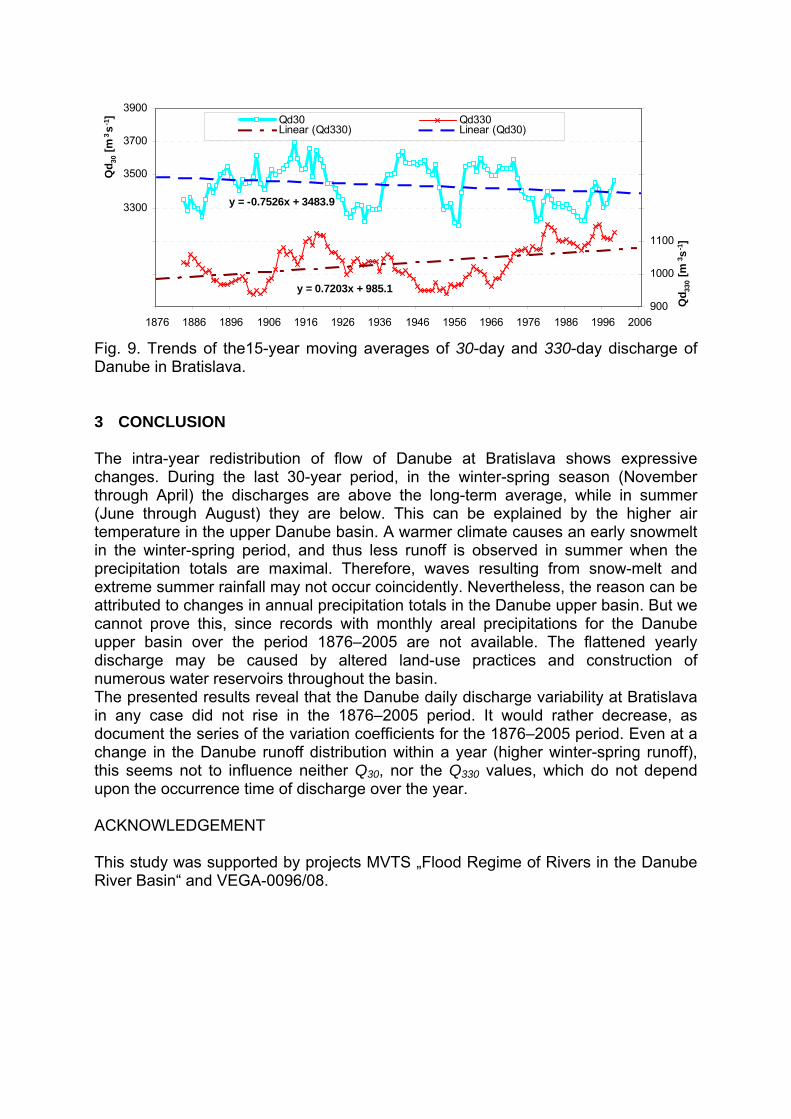
y = 0.7203x + 985.1
y = -0.7526x + 3483.9
2700
2900
3100
3300
3500
3700
3900
1876 1886 1896 1906 1916 1926 1936 1946 1956 1966 1976 1986 1996 2006
Qd 30
[m3s-1
]
900
1000
1100
1200
1300
1400
1500
Qd 33
0 [m
3 s-1]
Qd30 Qd330Linear (Qd330) Linear (Qd30)
Fig. 9. Trends of the15-year moving averages of 30-day and 330-day discharge of Danube in Bratislava. 3 CONCLUSION The intra-year redistribution of flow of Danube at Bratislava shows expressive changes. During the last 30-year period, in the winter-spring season (November through April) the discharges are above the long-term average, while in summer (June through August) they are below. This can be explained by the higher air temperature in the upper Danube basin. A warmer climate causes an early snowmelt in the winter-spring period, and thus less runoff is observed in summer when the precipitation totals are maximal. Therefore, waves resulting from snow-melt and extreme summer rainfall may not occur coincidently. Nevertheless, the reason can be attributed to changes in annual precipitation totals in the Danube upper basin. But we cannot prove this, since records with monthly areal precipitations for the Danube upper basin over the period 1876–2005 are not available. The flattened yearly discharge may be caused by altered land-use practices and construction of numerous water reservoirs throughout the basin. The presented results reveal that the Danube daily discharge variability at Bratislava in any case did not rise in the 1876–2005 period. It would rather decrease, as document the series of the variation coefficients for the 1876–2005 period. Even at a change in the Danube runoff distribution within a year (higher winter-spring runoff), this seems not to influence neither Q30, nor the Q330 values, which do not depend upon the occurrence time of discharge over the year. ACKNOWLEDGEMENT This study was supported by projects MVTS „Flood Regime of Rivers in the Danube River Basin“ and VEGA-0096/08.
References
Andrade-Leal, R., N., Bachhiesl, M., Drabek, U., Gutknecht, D., Haiden, T., Holzmann, K., Hebenstreit, K., Kirnbauer, R. & Nachtnebel, H. P. (2002): Hydrological prediction models in operational use in the hydro-power industry. Österreichische Wasser- und Abfallwirtschaft 54, 9-10, 129–134. Maravall, A, Ana Del Rio (2001): Time aggregation and the Hodrick-Prescott filter. Documento de Trabajo No. 0108, Banco de Espana, 43 p. Miklanek, P., Mikulickova, M., Mitkova, V., Pekarova, P. (2002): Changes of floods travel times on upper Danube. CD from XXI. Conference of Danube countries, Romania, 12 p. Mitkova, V. (2002): Changes of the travel times of flood waves for Danube River. (In Slovak). Acta Hydrologica Slovaca, 3, 1, 20–27. Mitkova, V., Pekarova, P., Miklanek, P., Pekar, J. (2005): Analysis of flood propagation changes in the Kienstock–Bratislava reach of the Danube River. Hydrological Sciences Journal, 50, 4, 665–668. Pacl, J. (1955): Danube floods in July 1954. (In Slovak). Hydrological study HMI, Praha, 26 p. Pekarova, P., Miklanek, P., Pekar, J. (2007): Long-term Danube monthly discharge prognosis for the Bratislava station using stochastic models. Meteorologický casopis, ISSN 1335-339X,10, 211–218. Pekarova, P., Pekar, J. (2007): Multiannual variability of Danube runoff characteristics in Bratislava gauge. (In Slovak). Acta Hydrologica Slovaca, ISSN 1335-6291, 1, 12–21. Prochazka M, Deyl M, Novicky O. (2001): Technology for Detecting Trends and Changes in Time Series of Hydrological and Meteorological Variables - Change and Trend Problem Analysis (CTPA). User’s Guide. CHMI, Prague; 25 p. Skoda, P., Turbek, J. (1995): Monitoring of the Hydrological Regime of Danube. (In Slovak.) Proc. Int. Conf. “Danube – the artery of Europe”. ZSVTS, Bratislava, 194–206. Svoboda, A, Pekarova, P., Miklanek, P. (2000): Flood hydrology of Danube between Devin and Nagymaros. SVH – IH SAS, 96. Svoboda, A., Szolgay,J. (1988) Impact of Anthropogenic Activity upon the River Runoff. (In Slovak.) Report of Phase KE 01: Determination of runoff regime changes in the abandoned river bed, using mathematical runoff model. ÚHH SAV, Bratislava. Vizallasok 1890: Vizallasok a Dunaban. Hornyanszky Viktor Könyvnyomdaja, Budapest. Webb, B., W., Nobilis, F. (2007): Long-term changes in river temperature and the influence of climatic and hydrological factors. Hydrological Sciences–Journal, 52, 1, 74–85. Zatkalik, G. (1965) The 1965 Danube Flood. (In Slovak.) Vodni hospodařstvi, 12, 519–526. Zsufa, I. (1999): Impact of Austrian hydropower plants on the flood control safety of the Hungarian Danube. Hydrological Sciences Journal, 44, 3, 363–371.
Copyright © 2022 FDOKUMEN