Detailed kinetic analysis of the interaction between the FOXO4–DNA-binding domain and DNA
11
Detailed kinetic analysis of the interaction between the FOXO4–DNA-binding domain and DNA Petr Vacha a , Iva Zuskova a,b , Ladislav Bumba c , Petr Herman d , Jaroslav Vecer d , Veronika Obsilova b , Tomas Obsil a,b, ⁎ a Department of Physical and Macromolecular Chemistry, Faculty of Science, Charles University in Prague, 12843 Prague, Czech Republic b Institute of Physiology, Academy of Sciences of the Czech Republic, 14220 Prague, Czech Republic c Institute of Microbiology, Academy of Sciences of the Czech Republic, 14220 Prague, Czech Republic d Faculty of Mathematics and Physics, Institute of Physics, Charles University in Prague, 12116 Prague, Czech Republic HIGHLIGHTS • Interaction between FOXO4 and DNA is described using a conformational change model. • FOXO4–DBD undergoes a conformational change upon binding to the DNA. • Segmental dynamics of FOXO4–DBD is reduced upon binding to the DNA. • Non-specific contacts are important for binding affinity and specificity of FOXO4. GRAPHICAL ABSTRACT abstract article info Article history: Received 26 July 2013 Received in revised form 5 September 2013 Accepted 5 September 2013 Available online 15 September 2013 Keywords: FOXO4 forkhead transcription factor DNA-binding domain Binding kinetics Surface plasmon resonance Time-resolved fluorescence Segmental dynamics The FOXO forkhead transcription factors are potent transcriptional activators involved in a wide range of key bio- logical processes. In this work, the real-time kinetics of the interaction between the FOXO4–DNA binding domain (FOXO4–DBD) and the DNA was studied by using surface plasmon resonance (SPR). SPR analysis revealed that the interaction between FOXO4–DBD and the double stranded DNA containing either the insulin-responsive or the Daf-16 family member-binding element is preferably described by using a conformational change model which suggests a structural change of FOXO4–DBD upon binding to the DNA. This was further confirmed by using the time-resolved tryptophan fluorescence anisotropy decay measurements which revealed profound reduc- tion of segmental dynamics of FOXO4–DBD upon the complex formation. Alanine scanning of amino acid residues engaged in polar contacts with the DNA showed that certain non-specific contacts with the DNA backbone are very important for both the binding affinity and the binding specificity of FOXO4–DBD. © 2013 Elsevier B.V. All rights reserved. 1. Introduction The FOXO transcription factors (FOXO1, FOXO3, FOXO4 and FOXO6) are potent transcriptional activators involved in a wide range of processes including energy metabolism control, DNA damage repair, cellular Biophysical Chemistry 184 (2013) 68–78 ⁎ Corresponding author at: Department of Physical and Macromolecular Chemistry, Faculty of Science, Charles University in Prague, 12843 Prague, Czech Republic. Tel.: +420 221951303; fax: +420 224919752. E-mail address: [email protected] (T. Obsil). 0301-4622/$ – see front matter © 2013 Elsevier B.V. All rights reserved. http://dx.doi.org/10.1016/j.bpc.2013.09.002 Contents lists available at ScienceDirect Biophysical Chemistry journal homepage: http://www.elsevier.com/locate/biophyschem
Transcript of Detailed kinetic analysis of the interaction between the FOXO4–DNA-binding domain and DNA
Biophysical Chemistry 184 (2013) 68–78
Contents lists available at ScienceDirect
Biophysical Chemistry
j ourna l homepage: ht tp : / /www.e lsev ie r .com/ locate /b iophyschem
Detailed kinetic analysis of the interaction between theFOXO4–DNA-binding domain and DNA
Petr Vacha a, Iva Zuskova a,b, Ladislav Bumba c, Petr Herman d, Jaroslav Vecer d,Veronika Obsilova b, Tomas Obsil a,b,⁎a Department of Physical and Macromolecular Chemistry, Faculty of Science, Charles University in Prague, 12843 Prague, Czech Republicb Institute of Physiology, Academy of Sciences of the Czech Republic, 14220 Prague, Czech Republicc Institute of Microbiology, Academy of Sciences of the Czech Republic, 14220 Prague, Czech Republicd Faculty of Mathematics and Physics, Institute of Physics, Charles University in Prague, 12116 Prague, Czech Republic
H I G H L I G H T S G R A P H I C A L A B S T R A C T
• Interaction between FOXO4 and DNA isdescribed using a conformational changemodel.
• FOXO4–DBDundergoes a conformationalchange upon binding to the DNA.
• Segmental dynamics of FOXO4–DBD isreduced upon binding to the DNA.
• Non-specific contacts are important forbinding affinity and specificity of FOXO4.
⁎ Corresponding author at: Department of Physical aFaculty of Science, Charles University in Prague, 12843+420 221951303; fax: +420 224919752.
E-mail address: [email protected] (T. Obsil).
0301-4622/$ – see front matter © 2013 Elsevier B.V. All rihttp://dx.doi.org/10.1016/j.bpc.2013.09.002
a b s t r a c t
a r t i c l e i n f oArticle history:Received 26 July 2013Received in revised form 5 September 2013Accepted 5 September 2013Available online 15 September 2013
Keywords:FOXO4 forkhead transcription factorDNA-binding domainBinding kineticsSurface plasmon resonanceTime-resolved fluorescenceSegmental dynamics
The FOXO forkhead transcription factors are potent transcriptional activators involved in a wide range of key bio-logical processes. In this work, the real-time kinetics of the interaction between the FOXO4–DNA binding domain(FOXO4–DBD) and the DNA was studied by using surface plasmon resonance (SPR). SPR analysis revealed thatthe interaction between FOXO4–DBD and the double stranded DNA containing either the insulin-responsive orthe Daf-16 family member-binding element is preferably described by using a conformational change modelwhich suggests a structural change of FOXO4–DBD upon binding to the DNA. This was further confirmed byusing the time-resolved tryptophan fluorescence anisotropy decaymeasurementswhich revealed profound reduc-tion of segmental dynamics of FOXO4–DBD upon the complex formation. Alanine scanning of amino acid residuesengaged in polar contacts with the DNA showed that certain non-specific contacts with the DNA backbone are veryimportant for both the binding affinity and the binding specificity of FOXO4–DBD.
© 2013 Elsevier B.V. All rights reserved.
nd Macromolecular Chemistry,Prague, Czech Republic. Tel.:
ghts reserved.
1. Introduction
The FOXO transcription factors (FOXO1, FOXO3, FOXO4 and FOXO6)are potent transcriptional activators involved in awide range of processesincluding energy metabolism control, DNA damage repair, cellular
69P. Vacha et al. / Biophysical Chemistry 184 (2013) 68–78
proliferation, cell survival and stress resistance [1]. The FOXO pro-teins are members of the “O” subclass of the forkhead protein family(FOX) that comprises more than 100 proteins that are further classi-fied into 17 subclasses (designated A–Q). All FOX proteins share ahighly conserved DNA-binding domain (DBD), also known as theforkhead box or winged-helix domain, that possesses a compact α/βfold and recognizes sequences containing the core motif 5′-(A/C)AA(C/T)A-3′ through a combination of direct and water-mediated sidechain-base contacts [2,3]. The high conservation of forkhead DNA-binding domains as well as their binding motifs together with thelarge diversity of the biological processes the FOX proteins are involvedin suggest the existence of a high degree of binding specificity [4]. Finevariations in binding affinity for different DNA response elementsmightbe an important factor involved in the regulation of target gene expres-sion by FOX proteins. Such mode of regulation has been shown, forexample, for FoxA protein in the control of organogenesis [5]. However,factors underlying intrinsic variations in binding affinity of forkheaddomains for different but very similar binding motifs are still not fullyunderstood.
The most important part of the DNA-binding interface of forkheaddomain is the helix H3, which binds into the major groove roughly per-pendicular to the DNA axis and provides the principal contact surfacewith the core motif [3]. Residues involved in these interactions are con-served among all forkhead proteins and make a combination of direct
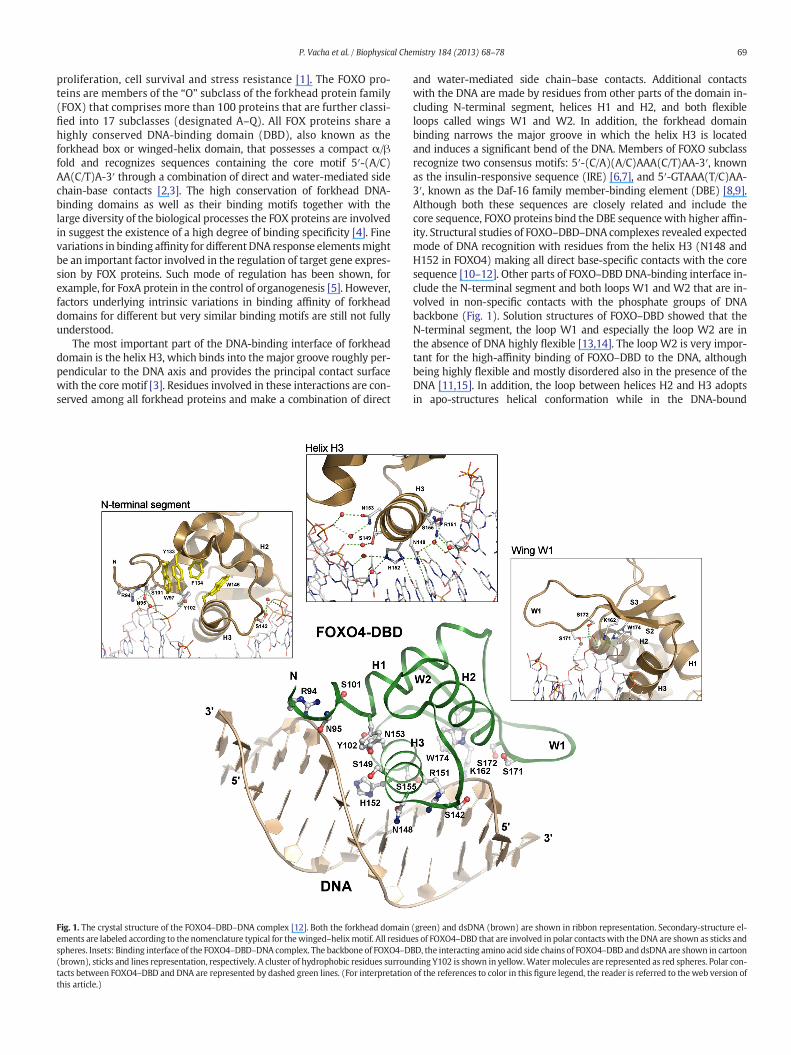
Fig. 1. The crystal structure of the FOXO4–DBD–DNA complex [12]. Both the forkhead domainements are labeled according to the nomenclature typical for thewinged–helixmotif. All residuspheres. Insets: Binding interface of the FOXO4–DBD–DNA complex. The backbone of FOXO4–D(brown), sticks and lines representation, respectively. A cluster of hydrophobic residues surrountacts between FOXO4–DBD and DNA are represented by dashed green lines. (For interpretationthis article.)
and water-mediated side chain–base contacts. Additional contactswith the DNA are made by residues from other parts of the domain in-cluding N-terminal segment, helices H1 and H2, and both flexibleloops called wings W1 and W2. In addition, the forkhead domainbinding narrows the major groove in which the helix H3 is locatedand induces a significant bend of the DNA. Members of FOXO subclassrecognize two consensus motifs: 5′-(C/A)(A/C)AAA(C/T)AA-3′, knownas the insulin-responsive sequence (IRE) [6,7], and 5′-GTAAA(T/C)AA-3′, known as the Daf-16 family member-binding element (DBE) [8,9].Although both these sequences are closely related and include thecore sequence, FOXO proteins bind the DBE sequence with higher affin-ity. Structural studies of FOXO–DBD–DNA complexes revealed expectedmode of DNA recognition with residues from the helix H3 (N148 andH152 in FOXO4) making all direct base-specific contacts with the coresequence [10–12]. Other parts of FOXO–DBD DNA-binding interface in-clude the N-terminal segment and both loops W1 and W2 that are in-volved in non-specific contacts with the phosphate groups of DNAbackbone (Fig. 1). Solution structures of FOXO–DBD showed that theN-terminal segment, the loop W1 and especially the loop W2 are inthe absence of DNA highly flexible [13,14]. The loop W2 is very impor-tant for the high-affinity binding of FOXO–DBD to the DNA, althoughbeing highly flexible and mostly disordered also in the presence of theDNA [11,15]. In addition, the loop between helices H2 and H3 adoptsin apo-structures helical conformation while in the DNA-bound
(green) and dsDNA (brown) are shown in ribbon representation. Secondary-structure el-es of FOXO4–DBD that are involved in polar contacts with the DNA are shown as sticks andBD, the interacting amino acid side chains of FOXO4–DBD and dsDNA are shown in cartoonding Y102 is shown in yellow.Watermolecules are represented as red spheres. Polar con-of the references to color in this figure legend, the reader is referred to the web version of
70 P. Vacha et al. / Biophysical Chemistry 184 (2013) 68–78
complexes is unstructured. All these indicate that FOXO–DBD un-dergoes a structural transition during the binding to the DNA.
The FOXO–DBD–DNA interaction studies were focused so far mostlyon base-specific contacts and sites of post-translational modificationswithin the DNA-binding interface [10,11,15–17]. However, it has beenshown that non-DNA contact regions and non-specific contacts mightaffect the binding specificity and affinity of forkhead proteins throughthe repositioning of regions containing recognition elements (helixH3) and/or through the modulation of the dissociation rate of theprotein–DNA complexes [18–21]. In order to better understand factorsunderlying FOXO's variations in affinity for different but closely relatedDNA sequences and especially the possible role of non-specific contacts,we performed alanine scanningmutagenesis of FOXO4–DBD amino acidresidues engaged in polar contacts with the DNA followed by surfaceplasmon resonance (SPR) analysis. The real-time kinetics data revealedthat the interaction between FOXO4–DBD and the double strandedDNAcontaining either IRE or DBE motif is preferably described by using aconformational change model which suggests a structural change ofFOXO4–DBD upon binding to the DNA. Our SPR data show that allparts of the DNA-binding surface of FOXO4–DBD are important for theoverall stability of the FOXO4–DBD–DNA complex and that certainnon-specific contacts with the DNA backbone are very important forboth the binding affinity and the binding specificity of FOXO4–DBD.The predominantmechanism that contributes to the decreased bindingaffinity upon the disruption of these contacts is the faster dissociationrate of the encounter complex compared to the wild-type.
2. Materials and methods
2.1. Expression and purification of FOXO4–DBD
The human FOXO4–DBD (sequence 82–207) and all its mutantversions were expressed as described previously [12,15]. Briefly,FOXO4–DBD was expressed as N-terminal 6 × His-tag fusion proteinsby IPTG induction for 20 h at 20 °C and purified from Escherichia coliBL21 (DE3) cells using Chelating Sepharose Fast Flow (GE HealthcareLife Sciences) according to the standard protocol. Eluted FOXO4–DBDwas dialyzed against the buffer containing 50 mM sodium citrate(pH 6.3), 1 mM EDTA, 2 mM DTT and purified using cation-exchangechromatography on SP-Sepharose column (GE Healthcare Life Sciences).The final step, size-exclusion chromatography on Superdex 200 column(GE Healthcare Life Sciences), was performed in buffer containing20 mM Tris–HCl (pH 7.5), 100 mM NaCl, 1 mM EDTA, 2 mM DTT, and10% (w/v) glycerol. All mutants were generated by using the QuikChangekit (Stratagene) and mutations were confirmed by sequencing.
2.2. Surface plasmon resonance (SPR)
All SPR measurements were performed at 25 °C using a double-stranded DNA-coated LCP sensor chip mounted on a ProteOn XPR36Protein Interaction Array System (Bio-Rad, Hercules, CA, USA). Thedouble stranded DNA (dsDNA) was prepared by mixing of twocomplementary oligonucleotides in a molar ratio of 1:1 at 70 °C for10 min and slowly (~20 min) cooled down to room temperature.The oligonucleotides were purchased from VBC Biotech (Vienna,Austria), and for dsDNA carrying IRE motif (underlined), oligonucle-otides 5′-GACTATCAAAACAACGC-3′ modified at 5′ end by biotinand 5′-GCGTTGTTTTGATAGTC-3′; for dsDNA carrying DBE sequence(underlined), oligonucleotides 5′-GACTATGTAAACAACGC-3′ modifiedat 5′ end by biotin and 5′-GCGTTGTTTACATAGTC-3′; and for a control(random) dsDNA, oligonucleotides 5′-AACGTATGCTCTAGCCA-3′ modi-fied at 5′ end by biotin and 5′-TGGCTAGAGCATACGTT-3′ were used,respectively. Biotinylated dsDNA was diluted to a final concentration of100 nM in PBS buffer containing 0.05% Tween 20 and captured to aneutravidin-functionalized LCP chip at a flow rate of 30 μl/min for2 min. Loosely attached material was removed from the chip surface by
two injections of 60 μl of 2 M NaCl. All SPR measurements were carriedout in running buffer containing 20 mM Tris–HCl (pH 7.5), 150 mMNaCl, 0.1 mM EDTA, 2 mM DTT and 0.005% Tween-20 at the flow rateranging from 25 to 75 μl/min for both association and dissociationphase of sensograms. The proteinswere serially diluted in running bufferto indicated concentrations (200, 100, 50, 25 and 12.5 nM), andinjected in parallel (“one-shot kinetics”) over the immobilizeddsDNA surface. Surfaces were typically regenerated with 100 μl of2 M NaCl. The sensograms were corrected for sensor backgroundby interspot referencing (the sites within the 6 × 6 array which arenot exposed to ligand immobilization but are exposed to analyteflow), and double referenced by subtraction of analyte (channels1–5) using a “blank” injection (channel 6).
The data were analyzed globally by fitting both the association andthe dissociation phases simultaneously for five different FOXO4–DBDconcentrations using both a 1:1 Langmuir-type binding model and theconformational change model to determine the kinetics associationand dissociation rate constants. The Langmuir-type model assumesthe interaction between protein (A) and DNA (B) resulting in a directformation of the final complex (AB):
Aþ B⇄ka
kdAB; ð1Þ
where ka and kd are the association and the dissociation rate constants,respectively. The conformational change model assumes the two-stepassociation process:
Aþ B⇄ka1
kd1AB½ � � ⇄
ka2
kd2AB; ð2Þ
where [AB]* and AB represent encounter complex (transition state)and final docked state, respectively [22–24]. Parameters ka1 and kd1are the association and the dissociation rate constants for the firststep (encounter complex formation), while ka2 and kd2 are forwardand reverse rate constants for the second step (conformationalchange). An apparent equilibrium dissociation constant, KD, for the1:1 Langmuir-type binding was determined as
KD ¼ kd=ka; ð3Þ
and for the conformational change binding model as
KD ¼ 1= ka1=kd1ð Þ� 1þ ka2=kd2ð Þ½ �: ð4Þ
Detailed description of both bindingmodels including the rate equa-tions and the description of thefitting procedure is shown in the supple-mentary material.
2.3. Time-resolved fluorescence measurements
Fluorescence intensity and anisotropy decays weremeasured ona time-correlated single photon counting apparatus, as describedpreviously [25]. Tryptophan emission was excited at 298 nm bythe third harmonic of the Ti:Sapphire laser emitting at 894 nm.Tryptophan fluorescence was collected at 355 nm using a mono-chromator equipped with a stack of UG1and BG40 glass filters(Thorlabs) placed in front of its input slit. Typically, the decayswere accumulated in 1024 channels with time resolution of 50 psper channel until 107 counts per decay were reached. Sampleswere placed in a thermostatic holder, and all experiments wereperformed at 23 °C in a buffer containing 20 mM Tris–HCl (pH 7.5),150 mM NaCl, 0.1 mM EDTA, and 2 mM DTT. The FOXO4–DBD concen-tration was 5 μM, and the dsDNA concentration was 15 μM. The follow-ing oligonucleotides containing consensus IRE motif (underlined) wereused to prepare samples of dsDNA: 5′-GACTATCAAAACAACGC-3′ and5′-GCGTTGTTTTGATAGTC-3′. The fluorescence decays were acquired
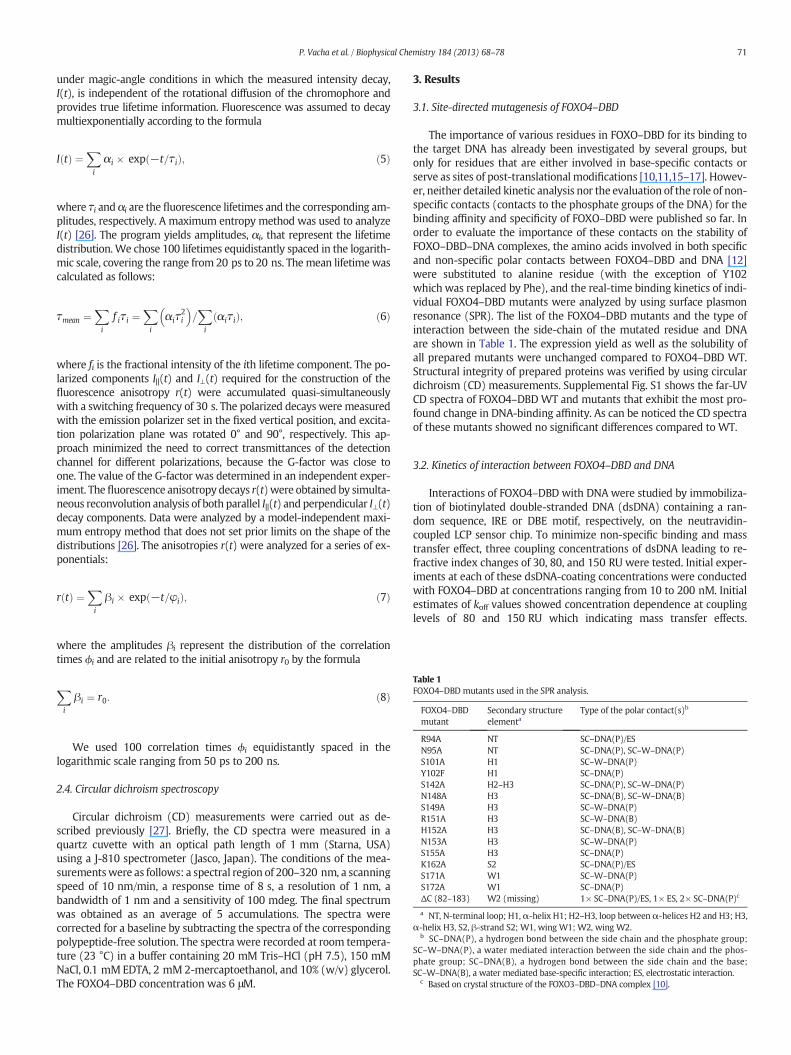
Table 1FOXO4–DBD mutants used in the SPR analysis.
FOXO4–DBDmutant
Secondary structureelementa
Type of the polar contact(s)b
R94A NT SC–DNA(P)/ESN95A NT SC–DNA(P), SC–W–DNA(P)S101A H1 SC–W–DNA(P)Y102F H1 SC–DNA(P)S142A H2–H3 SC–DNA(P), SC–W–DNA(P)N148A H3 SC–DNA(B), SC–W–DNA(B)S149A H3 SC–W–DNA(P)R151A H3 SC–W–DNA(B)H152A H3 SC–DNA(B), SC–W–DNA(B)N153A H3 SC–W–DNA(P)S155A H3 SC–DNA(P)K162A S2 SC–DNA(P)/ESS171A W1 SC–W–DNA(P)S172A W1 SC–DNA(P)ΔC (82–183) W2 (missing) 1× SC–DNA(P)/ES, 1× ES, 2× SC–DNA(P)c
a NT, N-terminal loop; H1,α-helix H1; H2–H3, loop between α-helices H2 and H3; H3,α-helix H3, S2, β-strand S2; W1, wing W1; W2, wing W2.
b SC–DNA(P), a hydrogen bond between the side chain and the phosphate group;SC–W–DNA(P), a water mediated interaction between the side chain and the phos-phate group; SC–DNA(B), a hydrogen bond between the side chain and the base;SC–W–DNA(B), a water mediated base-specific interaction; ES, electrostatic interaction.
c Based on crystal structure of the FOXO3–DBD–DNA complex [10].
71P. Vacha et al. / Biophysical Chemistry 184 (2013) 68–78
under magic-angle conditions in which the measured intensity decay,I(t), is independent of the rotational diffusion of the chromophore andprovides true lifetime information. Fluorescence was assumed to decaymultiexponentially according to the formula
I tð Þ ¼Xi
αi � exp −t=τið Þ; ð5Þ
where τi and αi are the fluorescence lifetimes and the corresponding am-plitudes, respectively. A maximum entropy method was used to analyzeI(t) [26]. The program yields amplitudes, αi, that represent the lifetimedistribution.We chose 100 lifetimes equidistantly spaced in the logarith-mic scale, covering the range from 20 ps to 20 ns. Themean lifetimewascalculated as follows:
τmean ¼Xi
f iτi ¼Xi
αiτ2i
� �=Xi
αiτið Þ; ð6Þ
where fi is the fractional intensity of the ith lifetime component. The po-larized components I||(t) and I⊥(t) required for the construction of thefluorescence anisotropy r(t) were accumulated quasi-simultaneouslywith a switching frequency of 30 s. The polarized decays were measuredwith the emission polarizer set in the fixed vertical position, and excita-tion polarization plane was rotated 0° and 90°, respectively. This ap-proach minimized the need to correct transmittances of the detectionchannel for different polarizations, because the G-factor was close toone. The value of the G-factor was determined in an independent exper-iment. The fluorescence anisotropy decays r(t)were obtained by simulta-neous reconvolution analysis of both parallel I||(t) and perpendicular I⊥(t)decay components. Data were analyzed by a model-independent maxi-mum entropy method that does not set prior limits on the shape of thedistributions [26]. The anisotropies r(t) were analyzed for a series of ex-ponentials:
r tð Þ ¼Xi
βi � exp −t=φið Þ; ð7Þ
where the amplitudes βi represent the distribution of the correlationtimes ϕi and are related to the initial anisotropy r0 by the formula
Xi
βi ¼ r0: ð8Þ
We used 100 correlation times ϕi equidistantly spaced in thelogarithmic scale ranging from 50 ps to 200 ns.
2.4. Circular dichroism spectroscopy
Circular dichroism (CD) measurements were carried out as de-scribed previously [27]. Briefly, the CD spectra were measured in aquartz cuvette with an optical path length of 1 mm (Starna, USA)using a J-810 spectrometer (Jasco, Japan). The conditions of the mea-surementswere as follows: a spectral region of 200–320 nm, a scanningspeed of 10 nm/min, a response time of 8 s, a resolution of 1 nm, abandwidth of 1 nm and a sensitivity of 100 mdeg. The final spectrumwas obtained as an average of 5 accumulations. The spectra werecorrected for a baseline by subtracting the spectra of the correspondingpolypeptide-free solution. The spectra were recorded at room tempera-ture (23 °C) in a buffer containing 20 mM Tris–HCl (pH 7.5), 150 mMNaCl, 0.1 mM EDTA, 2 mM 2-mercaptoethanol, and 10% (w/v) glycerol.The FOXO4–DBD concentration was 6 μM.
3. Results
3.1. Site-directed mutagenesis of FOXO4–DBD
The importance of various residues in FOXO–DBD for its binding tothe target DNA has already been investigated by several groups, butonly for residues that are either involved in base-specific contacts orserve as sites of post-translational modifications [10,11,15–17]. Howev-er, neither detailed kinetic analysis nor the evaluation of the role of non-specific contacts (contacts to the phosphate groups of the DNA) for thebinding affinity and specificity of FOXO–DBD were published so far. Inorder to evaluate the importance of these contacts on the stability ofFOXO–DBD–DNA complexes, the amino acids involved in both specificand non-specific polar contacts between FOXO4–DBD and DNA [12]were substituted to alanine residue (with the exception of Y102which was replaced by Phe), and the real-time binding kinetics of indi-vidual FOXO4–DBD mutants were analyzed by using surface plasmonresonance (SPR). The list of the FOXO4–DBD mutants and the type ofinteraction between the side-chain of the mutated residue and DNAare shown in Table 1. The expression yield as well as the solubility ofall prepared mutants were unchanged compared to FOXO4–DBD WT.Structural integrity of prepared proteins was verified by using circulardichroism (CD) measurements. Supplemental Fig. S1 shows the far-UVCD spectra of FOXO4–DBD WT and mutants that exhibit the most pro-found change in DNA-binding affinity. As can be noticed the CD spectraof these mutants showed no significant differences compared to WT.
3.2. Kinetics of interaction between FOXO4–DBD and DNA
Interactions of FOXO4–DBD with DNA were studied by immobiliza-tion of biotinylated double-stranded DNA (dsDNA) containing a ran-dom sequence, IRE or DBE motif, respectively, on the neutravidin-coupled LCP sensor chip. To minimize non-specific binding and masstransfer effect, three coupling concentrations of dsDNA leading to re-fractive index changes of 30, 80, and 150 RU were tested. Initial exper-iments at each of these dsDNA-coating concentrations were conductedwith FOXO4–DBD at concentrations ranging from 10 to 200 nM. Initialestimates of koff values showed concentration dependence at couplinglevels of 80 and 150 RU which indicating mass transfer effects.
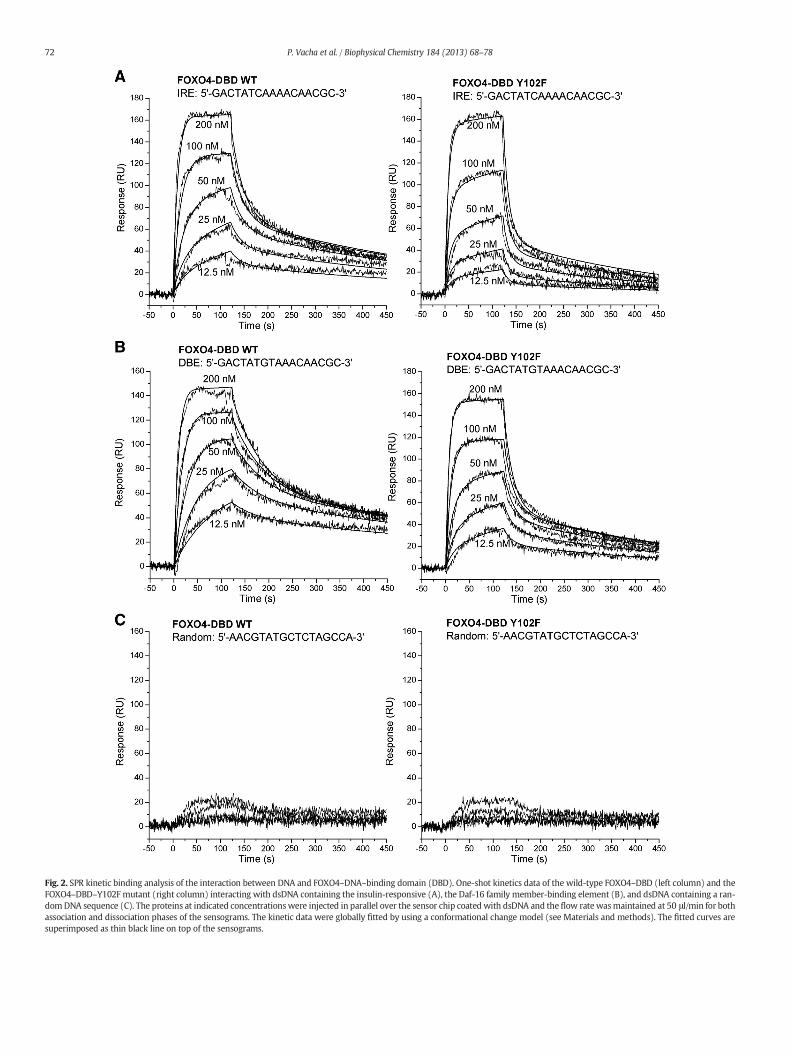
Fig. 2. SPR kinetic binding analysis of the interaction between DNA and FOXO4–DNA–binding domain (DBD). One-shot kinetics data of the wild-type FOXO4–DBD (left column) and theFOXO4–DBD–Y102F mutant (right column) interacting with dsDNA containing the insulin-responsive (A), the Daf-16 family member-binding element (B), and dsDNA containing a ran-domDNA sequence (C). The proteins at indicated concentrationswere injected in parallel over the sensor chip coated with dsDNA and the flow rate wasmaintained at 50 μl/min for bothassociation and dissociation phases of the sensograms. The kinetic data were globally fitted by using a conformational change model (see Materials and methods). The fitted curves aresuperimposed as thin black line on top of the sensograms.
72 P. Vacha et al. / Biophysical Chemistry 184 (2013) 68–78
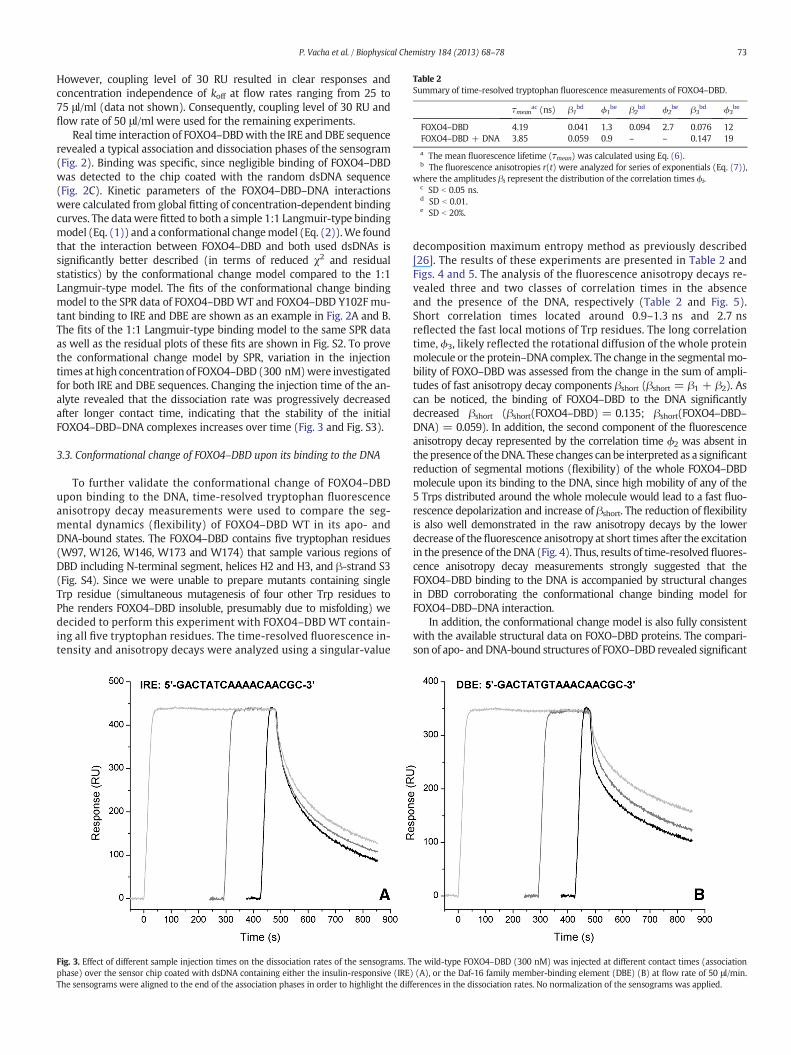
Table 2Summary of time-resolved tryptophan fluorescence measurements of FOXO4–DBD.
τmeanac (ns) β1
bd ϕ1be β2
bd ϕ2be β3
bd ϕ3be
FOXO4–DBD 4.19 0.041 1.3 0.094 2.7 0.076 12FOXO4–DBD + DNA 3.85 0.059 0.9 – – 0.147 19
a The mean fluorescence lifetime (τmean) was calculated using Eq. (6).b The fluorescence anisotropies r(t) were analyzed for series of exponentials (Eq. (7)),
where the amplitudes βi represent the distribution of the correlation times ϕi.c SD b 0.05 ns.d SD b 0.01.e SD b 20%.
73P. Vacha et al. / Biophysical Chemistry 184 (2013) 68–78
However, coupling level of 30 RU resulted in clear responses andconcentration independence of koff at flow rates ranging from 25 to75 μl/ml (data not shown). Consequently, coupling level of 30 RU andflow rate of 50 μl/ml were used for the remaining experiments.
Real time interaction of FOXO4–DBDwith the IRE and DBE sequencerevealed a typical association and dissociation phases of the sensogram(Fig. 2). Binding was specific, since negligible binding of FOXO4–DBDwas detected to the chip coated with the random dsDNA sequence(Fig. 2C). Kinetic parameters of the FOXO4–DBD–DNA interactionswere calculated from global fitting of concentration-dependent bindingcurves. The data were fitted to both a simple 1:1 Langmuir-type bindingmodel (Eq. (1)) and a conformational changemodel (Eq. (2)).We foundthat the interaction between FOXO4–DBD and both used dsDNAs issignificantly better described (in terms of reduced χ2 and residualstatistics) by the conformational change model compared to the 1:1Langmuir-type model. The fits of the conformational change bindingmodel to the SPR data of FOXO4–DBDWT and FOXO4–DBD Y102F mu-tant binding to IRE and DBE are shown as an example in Fig. 2A and B.The fits of the 1:1 Langmuir-type binding model to the same SPR dataas well as the residual plots of these fits are shown in Fig. S2. To provethe conformational change model by SPR, variation in the injectiontimes at high concentration of FOXO4–DBD (300 nM)were investigatedfor both IRE and DBE sequences. Changing the injection time of the an-alyte revealed that the dissociation rate was progressively decreasedafter longer contact time, indicating that the stability of the initialFOXO4–DBD–DNA complexes increases over time (Fig. 3 and Fig. S3).
3.3. Conformational change of FOXO4–DBD upon its binding to the DNA
To further validate the conformational change of FOXO4–DBDupon binding to the DNA, time-resolved tryptophan fluorescenceanisotropy decay measurements were used to compare the seg-mental dynamics (flexibility) of FOXO4–DBD WT in its apo- andDNA-bound states. The FOXO4–DBD contains five tryptophan residues(W97, W126, W146, W173 and W174) that sample various regions ofDBD including N-terminal segment, helices H2 and H3, and β-strand S3(Fig. S4). Since we were unable to prepare mutants containing singleTrp residue (simultaneous mutagenesis of four other Trp residues toPhe renders FOXO4–DBD insoluble, presumably due to misfolding) wedecided to perform this experiment with FOXO4–DBD WT contain-ing all five tryptophan residues. The time-resolved fluorescence in-tensity and anisotropy decays were analyzed using a singular-value
Fig. 3. Effect of different sample injection times on the dissociation rates of the sensograms. Tphase) over the sensor chip coated with dsDNA containing either the insulin-responsive (IRE)The sensograms were aligned to the end of the association phases in order to highlight the diff
decomposition maximum entropy method as previously described[26]. The results of these experiments are presented in Table 2 andFigs. 4 and 5. The analysis of the fluorescence anisotropy decays re-vealed three and two classes of correlation times in the absenceand the presence of the DNA, respectively (Table 2 and Fig. 5).Short correlation times located around 0.9–1.3 ns and 2.7 nsreflected the fast local motions of Trp residues. The long correlationtime, ϕ3, likely reflected the rotational diffusion of the whole proteinmolecule or the protein–DNA complex. The change in the segmentalmo-bility of FOXO–DBD was assessed from the change in the sum of ampli-tudes of fast anisotropy decay components βshort (βshort = β1 + β2). Ascan be noticed, the binding of FOXO4–DBD to the DNA significantlydecreased βshort (βshort(FOXO4–DBD) = 0.135; βshort(FOXO4–DBD–DNA) = 0.059). In addition, the second component of the fluorescenceanisotropy decay represented by the correlation time ϕ2 was absent inthe presence of theDNA. These changes canbe interpreted as a significantreduction of segmental motions (flexibility) of the whole FOXO4–DBDmolecule upon its binding to the DNA, since high mobility of any of the5 Trps distributed around the whole molecule would lead to a fast fluo-rescence depolarization and increase of βshort. The reduction of flexibilityis also well demonstrated in the raw anisotropy decays by the lowerdecrease of thefluorescence anisotropy at short times after the excitationin the presence of the DNA (Fig. 4). Thus, results of time-resolved fluores-cence anisotropy decay measurements strongly suggested that theFOXO4–DBD binding to the DNA is accompanied by structural changesin DBD corroborating the conformational change binding model forFOXO4–DBD–DNA interaction.
In addition, the conformational change model is also fully consistentwith the available structural data on FOXO–DBD proteins. The compari-son of apo- andDNA-bound structures of FOXO–DBD revealed significant
he wild-type FOXO4–DBD (300 nM) was injected at different contact times (association(A), or the Daf-16 family member-binding element (DBE) (B) at flow rate of 50 μl/min.erences in the dissociation rates. No normalization of the sensograms was applied.
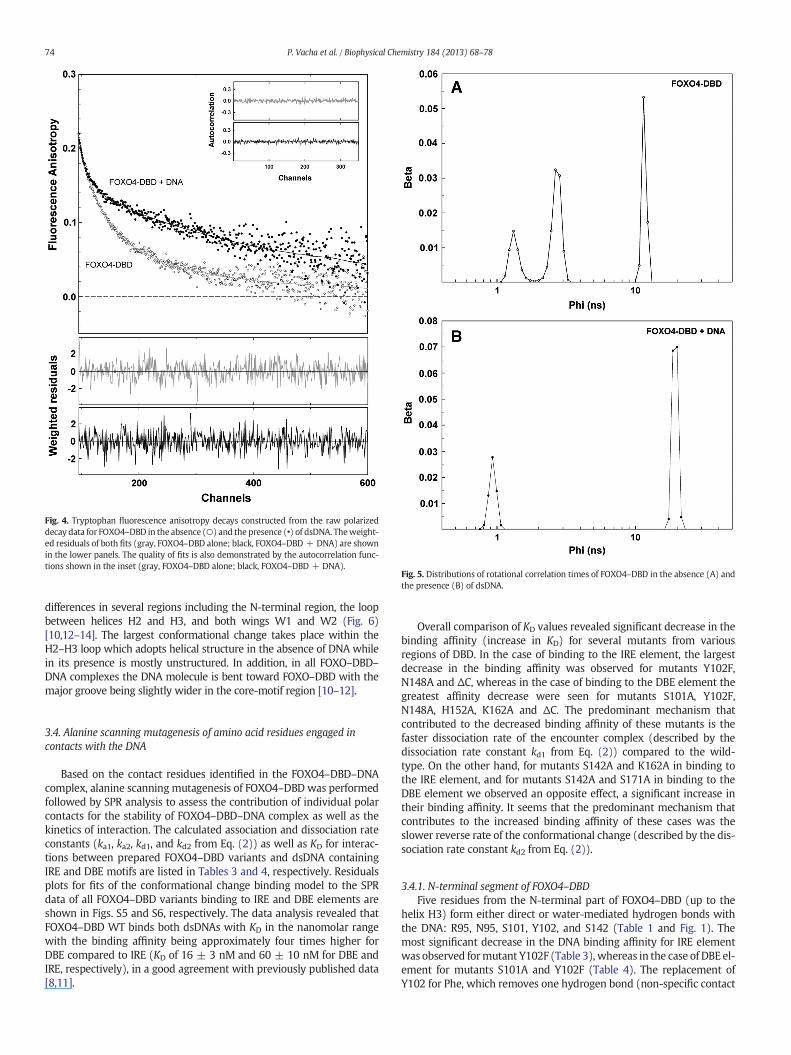
Fig. 4. Tryptophan fluorescence anisotropy decays constructed from the raw polarizeddecay data for FOXO4–DBD in the absence (○) and the presence (•) of dsDNA. Theweight-ed residuals of both fits (gray, FOXO4–DBD alone; black, FOXO4–DBD + DNA) are shownin the lower panels. The quality of fits is also demonstrated by the autocorrelation func-tions shown in the inset (gray, FOXO4–DBD alone; black, FOXO4–DBD + DNA).
Fig. 5. Distributions of rotational correlation times of FOXO4–DBD in the absence (A) andthe presence (B) of dsDNA.
74 P. Vacha et al. / Biophysical Chemistry 184 (2013) 68–78
differences in several regions including the N-terminal region, the loopbetween helices H2 and H3, and both wings W1 and W2 (Fig. 6)[10,12–14]. The largest conformational change takes place within theH2–H3 loop which adopts helical structure in the absence of DNA whilein its presence is mostly unstructured. In addition, in all FOXO–DBD–DNA complexes the DNA molecule is bent toward FOXO–DBD with themajor groove being slightly wider in the core-motif region [10–12].
3.4. Alanine scanning mutagenesis of amino acid residues engaged incontacts with the DNA
Based on the contact residues identified in the FOXO4–DBD–DNAcomplex, alanine scanning mutagenesis of FOXO4–DBD was performedfollowed by SPR analysis to assess the contribution of individual polarcontacts for the stability of FOXO4–DBD–DNA complex as well as thekinetics of interaction. The calculated association and dissociation rateconstants (ka1, ka2, kd1, and kd2 from Eq. (2)) as well as KD for interac-tions between prepared FOXO4–DBD variants and dsDNA containingIRE and DBE motifs are listed in Tables 3 and 4, respectively. Residualsplots for fits of the conformational change binding model to the SPRdata of all FOXO4–DBD variants binding to IRE and DBE elements areshown in Figs. S5 and S6, respectively. The data analysis revealed thatFOXO4–DBD WT binds both dsDNAs with KD in the nanomolar rangewith the binding affinity being approximately four times higher forDBE compared to IRE (KD of 16 ± 3 nM and 60 ± 10 nM for DBE andIRE, respectively), in a good agreement with previously published data[8,11].
Overall comparison of KD values revealed significant decrease in thebinding affinity (increase in KD) for several mutants from variousregions of DBD. In the case of binding to the IRE element, the largestdecrease in the binding affinity was observed for mutants Y102F,N148A and ΔC, whereas in the case of binding to the DBE element thegreatest affinity decrease were seen for mutants S101A, Y102F,N148A, H152A, K162A and ΔC. The predominant mechanism thatcontributed to the decreased binding affinity of these mutants is thefaster dissociation rate of the encounter complex (described by thedissociation rate constant kd1 from Eq. (2)) compared to the wild-type. On the other hand, for mutants S142A and K162A in binding tothe IRE element, and for mutants S142A and S171A in binding to theDBE element we observed an opposite effect, a significant increase intheir binding affinity. It seems that the predominant mechanism thatcontributes to the increased binding affinity of these cases was theslower reverse rate of the conformational change (described by the dis-sociation rate constant kd2 from Eq. (2)).
3.4.1. N-terminal segment of FOXO4–DBDFive residues from the N-terminal part of FOXO4–DBD (up to the
helix H3) form either direct or water-mediated hydrogen bonds withthe DNA: R95, N95, S101, Y102, and S142 (Table 1 and Fig. 1). Themost significant decrease in the DNA binding affinity for IRE elementwas observed formutant Y102F (Table 3), whereas in the case of DBE el-ement for mutants S101A and Y102F (Table 4). The replacement ofY102 for Phe, which removes one hydrogen bond (non-specific contact
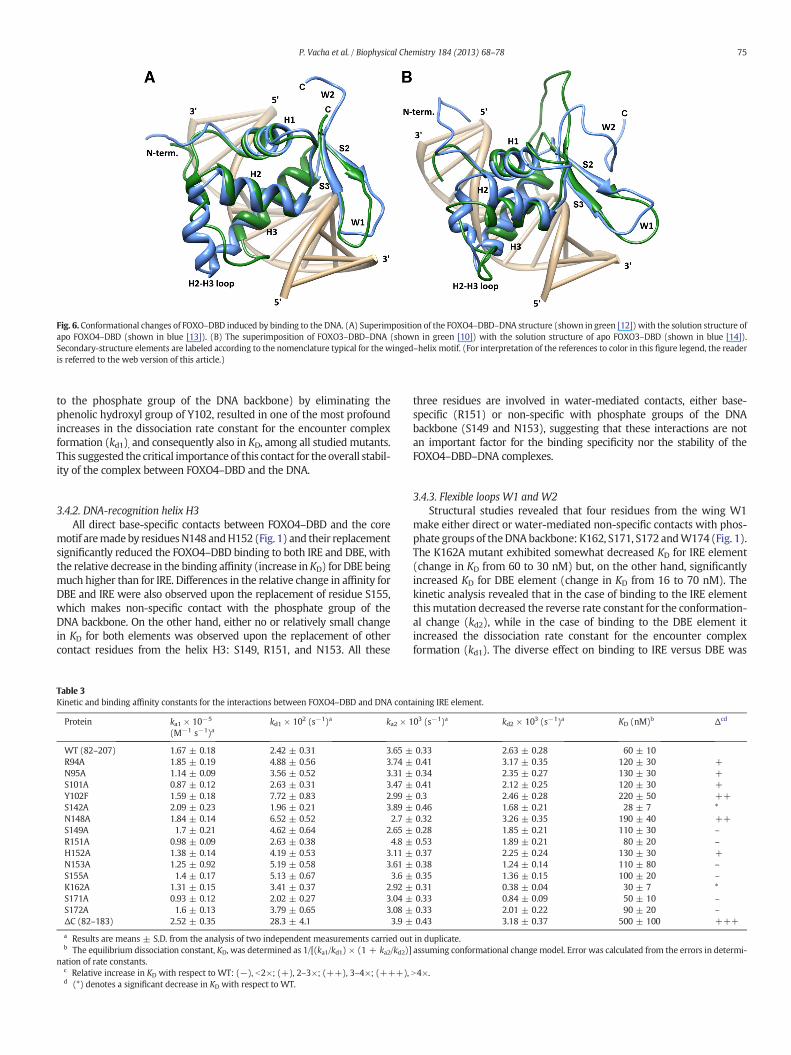
Fig. 6. Conformational changes of FOXO–DBD induced by binding to the DNA. (A) Superimposition of the FOXO4–DBD–DNA structure (shown in green [12]) with the solution structure ofapo FOXO4–DBD (shown in blue [13]). (B) The superimposition of FOXO3–DBD–DNA (shown in green [10]) with the solution structure of apo FOXO3–DBD (shown in blue [14]).Secondary-structure elements are labeled according to the nomenclature typical for the winged–helix motif. (For interpretation of the references to color in this figure legend, the readeris referred to the web version of this article.)
75P. Vacha et al. / Biophysical Chemistry 184 (2013) 68–78
to the phosphate group of the DNA backbone) by eliminating thephenolic hydroxyl group of Y102, resulted in one of the most profoundincreases in the dissociation rate constant for the encounter complexformation (kd1), and consequently also in KD, among all studied mutants.This suggested the critical importance of this contact for the overall stabil-ity of the complex between FOXO4–DBD and the DNA.
3.4.2. DNA-recognition helix H3All direct base-specific contacts between FOXO4–DBD and the core
motif aremade by residuesN148 andH152 (Fig. 1) and their replacementsignificantly reduced the FOXO4–DBD binding to both IRE and DBE, withthe relative decrease in the binding affinity (increase in KD) for DBE beingmuch higher than for IRE. Differences in the relative change in affinity forDBE and IRE were also observed upon the replacement of residue S155,which makes non-specific contact with the phosphate group of theDNA backbone. On the other hand, either no or relatively small changein KD for both elements was observed upon the replacement of othercontact residues from the helix H3: S149, R151, and N153. All these
Table 3Kinetic and binding affinity constants for the interactions between FOXO4–DBD and DNA cont
Protein ka1 × 10−5
(M−1 s−1)akd1 × 102 (s−1)a ka2 × 1
WT (82–207) 1.67 ± 0.18 2.42 ± 0.31 3.65 ±R94A 1.85 ± 0.19 4.88 ± 0.56 3.74 ±N95A 1.14 ± 0.09 3.56 ± 0.52 3.31 ±S101A 0.87 ± 0.12 2.63 ± 0.31 3.47 ±Y102F 1.59 ± 0.18 7.72 ± 0.83 2.99 ±S142A 2.09 ± 0.23 1.96 ± 0.21 3.89 ±N148A 1.84 ± 0.14 6.52 ± 0.52 2.7 ±S149A 1.7 ± 0.21 4.62 ± 0.64 2.65 ±R151A 0.98 ± 0.09 2.63 ± 0.38 4.8 ±H152A 1.38 ± 0.14 4.19 ± 0.53 3.11 ±N153A 1.25 ± 0.92 5.19 ± 0.58 3.61 ±S155A 1.4 ± 0.17 5.13 ± 0.67 3.6 ±K162A 1.31 ± 0.15 3.41 ± 0.37 2.92 ±S171A 0.93 ± 0.12 2.02 ± 0.27 3.04 ±S172A 1.6 ± 0.13 3.79 ± 0.65 3.08 ±ΔC (82–183) 2.52 ± 0.35 28.3 ± 4.1 3.9 ±
a Results are means ± S.D. from the analysis of two independent measurements carried outb The equilibrium dissociation constant, KD, was determined as 1/[(ka1/kd1) × (1 + ka2/kd2)]
nation of rate constants.c Relative increase in KD with respect to WT: (−), b2×; (+), 2–3×; (++), 3–4×; (+++),d (*) denotes a significant decrease in KD with respect to WT.
three residues are involved in water-mediated contacts, either base-specific (R151) or non-specific with phosphate groups of the DNAbackbone (S149 and N153), suggesting that these interactions are notan important factor for the binding specificity nor the stability of theFOXO4–DBD–DNA complexes.
3.4.3. Flexible loops W1 and W2Structural studies revealed that four residues from the wing W1
make either direct or water-mediated non-specific contacts with phos-phate groups of theDNAbackbone: K162, S171, S172 andW174 (Fig. 1).The K162A mutant exhibited somewhat decreased KD for IRE element(change in KD from 60 to 30 nM) but, on the other hand, significantlyincreased KD for DBE element (change in KD from 16 to 70 nM). Thekinetic analysis revealed that in the case of binding to the IRE elementthis mutation decreased the reverse rate constant for the conformation-al change (kd2), while in the case of binding to the DBE element itincreased the dissociation rate constant for the encounter complexformation (kd1). The diverse effect on binding to IRE versus DBE was
aining IRE element.
03 (s−1)a kd2 × 103 (s−1)a KD (nM)b Δcd
0.33 2.63 ± 0.28 60 ± 100.41 3.17 ± 0.35 120 ± 30 +0.34 2.35 ± 0.27 130 ± 30 +0.41 2.12 ± 0.25 120 ± 30 +0.3 2.46 ± 0.28 220 ± 50 ++0.46 1.68 ± 0.21 28 ± 7 *0.32 3.26 ± 0.35 190 ± 40 ++0.28 1.85 ± 0.21 110 ± 30 –
0.53 1.89 ± 0.21 80 ± 20 –
0.37 2.25 ± 0.24 130 ± 30 +0.38 1.24 ± 0.14 110 ± 80 –
0.35 1.36 ± 0.15 100 ± 20 –
0.31 0.38 ± 0.04 30 ± 7 *0.33 0.84 ± 0.09 50 ± 10 –
0.33 2.01 ± 0.22 90 ± 20 –
0.43 3.18 ± 0.37 500 ± 100 +++
in duplicate.assuming conformational change model. Error was calculated from the errors in determi-
N4×.
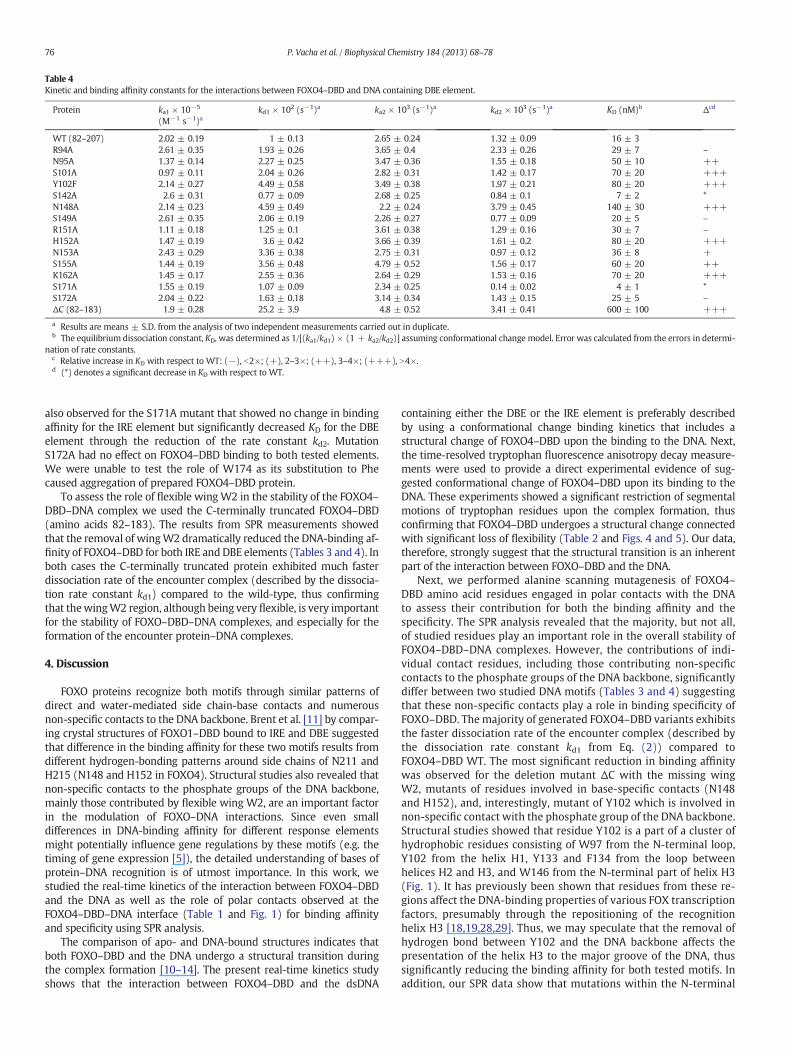
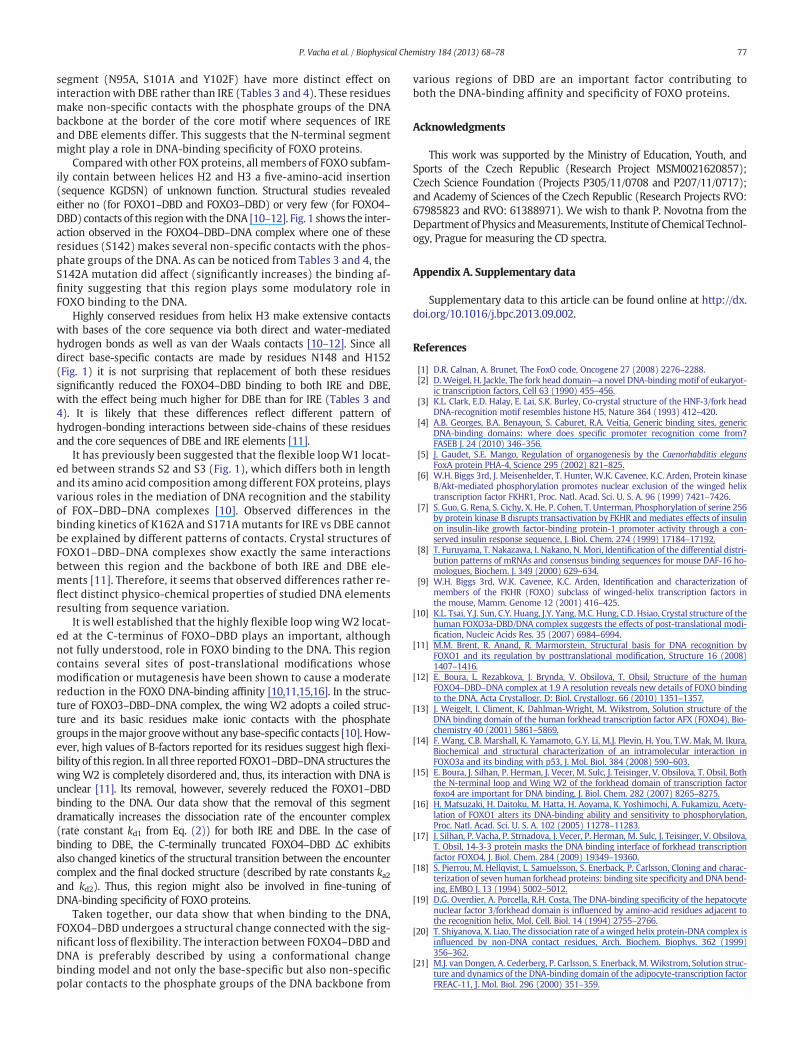
Table 4Kinetic and binding affinity constants for the interactions between FOXO4–DBD and DNA containing DBE element.
Protein ka1 × 10−5
(M−1 s−1)akd1 × 102 (s−1)a ka2 × 103 (s−1)a kd2 × 103 (s−1)a KD (nM)b Δcd
WT (82–207) 2.02 ± 0.19 1 ± 0.13 2.65 ± 0.24 1.32 ± 0.09 16 ± 3R94A 2.61 ± 0.35 1.93 ± 0.26 3.65 ± 0.4 2.33 ± 0.26 29 ± 7 –
N95A 1.37 ± 0.14 2.27 ± 0.25 3.47 ± 0.36 1.55 ± 0.18 50 ± 10 ++S101A 0.97 ± 0.11 2.04 ± 0.26 2.82 ± 0.31 1.42 ± 0.17 70 ± 20 +++Y102F 2.14 ± 0.27 4.49 ± 0.58 3.49 ± 0.38 1.97 ± 0.21 80 ± 20 +++S142A 2.6 ± 0.31 0.77 ± 0.09 2.68 ± 0.25 0.84 ± 0.1 7 ± 2 *N148A 2.14 ± 0.23 4.59 ± 0.49 2.2 ± 0.24 3.79 ± 0.45 140 ± 30 +++S149A 2.61 ± 0.35 2.06 ± 0.19 2.26 ± 0.27 0.77 ± 0.09 20 ± 5 –
R151A 1.11 ± 0.18 1.25 ± 0.1 3.61 ± 0.38 1.29 ± 0.16 30 ± 7 –
H152A 1.47 ± 0.19 3.6 ± 0.42 3.66 ± 0.39 1.61 ± 0.2 80 ± 20 +++N153A 2.43 ± 0.29 3.36 ± 0.38 2.75 ± 0.31 0.97 ± 0.12 36 ± 8 +S155A 1.44 ± 0.19 3.56 ± 0.48 4.79 ± 0.52 1.56 ± 0.17 60 ± 20 ++K162A 1.45 ± 0.17 2.55 ± 0.36 2.64 ± 0.29 1.53 ± 0.16 70 ± 20 +++S171A 1.55 ± 0.19 1.07 ± 0.09 2.34 ± 0.25 0.14 ± 0.02 4 ± 1 *S172A 2.04 ± 0.22 1.63 ± 0.18 3.14 ± 0.34 1.43 ± 0.15 25 ± 5 –
ΔC (82–183) 1.9 ± 0.28 25.2 ± 3.9 4.8 ± 0.52 3.41 ± 0.41 600 ± 100 +++
a Results are means ± S.D. from the analysis of two independent measurements carried out in duplicate.b The equilibrium dissociation constant, KD, was determined as 1/[(ka1/kd1) × (1 + ka2/kd2)] assuming conformational change model. Error was calculated from the errors in determi-
nation of rate constants.c Relative increase in KD with respect to WT: (−), b2×; (+), 2–3×; (++), 3–4×; (+++), N4×.d (*) denotes a significant decrease in KD with respect to WT.
76 P. Vacha et al. / Biophysical Chemistry 184 (2013) 68–78
also observed for the S171A mutant that showed no change in bindingaffinity for the IRE element but significantly decreased KD for the DBEelement through the reduction of the rate constant kd2. MutationS172A had no effect on FOXO4–DBD binding to both tested elements.We were unable to test the role of W174 as its substitution to Phecaused aggregation of prepared FOXO4–DBD protein.
To assess the role of flexible wingW2 in the stability of the FOXO4–DBD–DNA complex we used the C-terminally truncated FOXO4–DBD(amino acids 82–183). The results from SPR measurements showedthat the removal of wingW2 dramatically reduced the DNA-binding af-finity of FOXO4–DBD for both IRE and DBE elements (Tables 3 and 4). Inboth cases the C-terminally truncated protein exhibited much fasterdissociation rate of the encounter complex (described by the dissocia-tion rate constant kd1) compared to the wild-type, thus confirmingthat thewingW2 region, although being very flexible, is very importantfor the stability of FOXO–DBD–DNA complexes, and especially for theformation of the encounter protein–DNA complexes.
4. Discussion
FOXO proteins recognize both motifs through similar patterns ofdirect and water-mediated side chain-base contacts and numerousnon-specific contacts to the DNA backbone. Brent et al. [11] by compar-ing crystal structures of FOXO1–DBD bound to IRE and DBE suggestedthat difference in the binding affinity for these two motifs results fromdifferent hydrogen-bonding patterns around side chains of N211 andH215 (N148 and H152 in FOXO4). Structural studies also revealed thatnon-specific contacts to the phosphate groups of the DNA backbone,mainly those contributed by flexible wing W2, are an important factorin the modulation of FOXO–DNA interactions. Since even smalldifferences in DNA-binding affinity for different response elementsmight potentially influence gene regulations by these motifs (e.g. thetiming of gene expression [5]), the detailed understanding of bases ofprotein–DNA recognition is of utmost importance. In this work, westudied the real-time kinetics of the interaction between FOXO4–DBDand the DNA as well as the role of polar contacts observed at theFOXO4–DBD–DNA interface (Table 1 and Fig. 1) for binding affinityand specificity using SPR analysis.
The comparison of apo- and DNA-bound structures indicates thatboth FOXO–DBD and the DNA undergo a structural transition duringthe complex formation [10–14]. The present real-time kinetics studyshows that the interaction between FOXO4–DBD and the dsDNA
containing either the DBE or the IRE element is preferably describedby using a conformational change binding kinetics that includes astructural change of FOXO4–DBD upon the binding to the DNA. Next,the time-resolved tryptophan fluorescence anisotropy decay measure-ments were used to provide a direct experimental evidence of sug-gested conformational change of FOXO4–DBD upon its binding to theDNA. These experiments showed a significant restriction of segmentalmotions of tryptophan residues upon the complex formation, thusconfirming that FOXO4–DBD undergoes a structural change connectedwith significant loss of flexibility (Table 2 and Figs. 4 and 5). Our data,therefore, strongly suggest that the structural transition is an inherentpart of the interaction between FOXO–DBD and the DNA.
Next, we performed alanine scanning mutagenesis of FOXO4–DBD amino acid residues engaged in polar contacts with the DNAto assess their contribution for both the binding affinity and thespecificity. The SPR analysis revealed that the majority, but not all,of studied residues play an important role in the overall stability ofFOXO4–DBD–DNA complexes. However, the contributions of indi-vidual contact residues, including those contributing non-specificcontacts to the phosphate groups of the DNA backbone, significantlydiffer between two studied DNA motifs (Tables 3 and 4) suggestingthat these non-specific contacts play a role in binding specificity ofFOXO–DBD. The majority of generated FOXO4–DBD variants exhibitsthe faster dissociation rate of the encounter complex (described bythe dissociation rate constant kd1 from Eq. (2)) compared toFOXO4–DBD WT. The most significant reduction in binding affinitywas observed for the deletion mutant ΔC with the missing wingW2, mutants of residues involved in base-specific contacts (N148and H152), and, interestingly, mutant of Y102 which is involved innon-specific contact with the phosphate group of the DNA backbone.Structural studies showed that residue Y102 is a part of a cluster ofhydrophobic residues consisting of W97 from the N-terminal loop,Y102 from the helix H1, Y133 and F134 from the loop betweenhelices H2 and H3, and W146 from the N-terminal part of helix H3(Fig. 1). It has previously been shown that residues from these re-gions affect the DNA-binding properties of various FOX transcriptionfactors, presumably through the repositioning of the recognitionhelix H3 [18,19,28,29]. Thus, we may speculate that the removal ofhydrogen bond between Y102 and the DNA backbone affects thepresentation of the helix H3 to the major groove of the DNA, thussignificantly reducing the binding affinity for both tested motifs. Inaddition, our SPR data show that mutations within the N-terminal
77P. Vacha et al. / Biophysical Chemistry 184 (2013) 68–78
segment (N95A, S101A and Y102F) have more distinct effect oninteraction with DBE rather than IRE (Tables 3 and 4). These residuesmake non-specific contacts with the phosphate groups of the DNAbackbone at the border of the core motif where sequences of IREand DBE elements differ. This suggests that the N-terminal segmentmight play a role in DNA-binding specificity of FOXO proteins.
Comparedwith other FOX proteins, all members of FOXO subfam-ily contain between helices H2 and H3 a five-amino-acid insertion(sequence KGDSN) of unknown function. Structural studies revealedeither no (for FOXO1–DBD and FOXO3–DBD) or very few (for FOXO4–DBD) contacts of this regionwith theDNA [10–12]. Fig. 1 shows the inter-action observed in the FOXO4–DBD–DNA complex where one of theseresidues (S142) makes several non-specific contacts with the phos-phate groups of the DNA. As can be noticed from Tables 3 and 4, theS142A mutation did affect (significantly increases) the binding af-finity suggesting that this region plays some modulatory role inFOXO binding to the DNA.
Highly conserved residues from helix H3 make extensive contactswith bases of the core sequence via both direct and water-mediatedhydrogen bonds as well as van der Waals contacts [10–12]. Since alldirect base-specific contacts are made by residues N148 and H152(Fig. 1) it is not surprising that replacement of both these residuessignificantly reduced the FOXO4–DBD binding to both IRE and DBE,with the effect being much higher for DBE than for IRE (Tables 3 and4). It is likely that these differences reflect different pattern ofhydrogen-bonding interactions between side-chains of these residuesand the core sequences of DBE and IRE elements [11].
It has previously been suggested that the flexible loopW1 locat-ed between strands S2 and S3 (Fig. 1), which differs both in lengthand its amino acid composition among different FOX proteins, playsvarious roles in the mediation of DNA recognition and the stabilityof FOX–DBD–DNA complexes [10]. Observed differences in thebinding kinetics of K162A and S171A mutants for IRE vs DBE cannotbe explained by different patterns of contacts. Crystal structures ofFOXO1–DBD–DNA complexes show exactly the same interactionsbetween this region and the backbone of both IRE and DBE ele-ments [11]. Therefore, it seems that observed differences rather re-flect distinct physico-chemical properties of studied DNA elementsresulting from sequence variation.
It is well established that the highly flexible loop wingW2 locat-ed at the C-terminus of FOXO–DBD plays an important, althoughnot fully understood, role in FOXO binding to the DNA. This regioncontains several sites of post-translational modifications whosemodification or mutagenesis have been shown to cause a moderatereduction in the FOXO DNA-binding affinity [10,11,15,16]. In the struc-ture of FOXO3–DBD–DNA complex, the wing W2 adopts a coiled struc-ture and its basic residues make ionic contacts with the phosphategroups in themajor groovewithout any base-specific contacts [10]. How-ever, high values of B-factors reported for its residues suggest high flexi-bility of this region. In all three reported FOXO1–DBD–DNA structures thewing W2 is completely disordered and, thus, its interaction with DNA isunclear [11]. Its removal, however, severely reduced the FOXO1–DBDbinding to the DNA. Our data show that the removal of this segmentdramatically increases the dissociation rate of the encounter complex(rate constant kd1 from Eq. (2)) for both IRE and DBE. In the case ofbinding to DBE, the C-terminally truncated FOXO4–DBD ΔC exhibitsalso changed kinetics of the structural transition between the encountercomplex and the final docked structure (described by rate constants ka2and kd2). Thus, this region might also be involved in fine-tuning ofDNA-binding specificity of FOXO proteins.
Taken together, our data show that when binding to the DNA,FOXO4–DBD undergoes a structural change connected with the sig-nificant loss of flexibility. The interaction between FOXO4–DBD andDNA is preferably described by using a conformational changebinding model and not only the base-specific but also non-specificpolar contacts to the phosphate groups of the DNA backbone from
various regions of DBD are an important factor contributing toboth the DNA-binding affinity and specificity of FOXO proteins.
Acknowledgments
This work was supported by the Ministry of Education, Youth, andSports of the Czech Republic (Research Project MSM0021620857);Czech Science Foundation (Projects P305/11/0708 and P207/11/0717);and Academy of Sciences of the Czech Republic (Research Projects RVO:67985823 and RVO: 61388971). We wish to thank P. Novotna from theDepartment of Physics andMeasurements, Institute of Chemical Technol-ogy, Prague for measuring the CD spectra.
Appendix A. Supplementary data
Supplementary data to this article can be found online at http://dx.doi.org/10.1016/j.bpc.2013.09.002.
References
[1] D.R. Calnan, A. Brunet, The FoxO code, Oncogene 27 (2008) 2276–2288.[2] D.Weigel, H. Jackle, The fork head domain—a novel DNA-binding motif of eukaryot-
ic transcription factors, Cell 63 (1990) 455–456.[3] K.L. Clark, E.D. Halay, E. Lai, S.K. Burley, Co-crystal structure of the HNF-3/fork head
DNA-recognition motif resembles histone H5, Nature 364 (1993) 412–420.[4] A.B. Georges, B.A. Benayoun, S. Caburet, R.A. Veitia, Generic binding sites, generic
DNA-binding domains: where does specific promoter recognition come from?FASEB J. 24 (2010) 346–356.
[5] J. Gaudet, S.E. Mango, Regulation of organogenesis by the Caenorhabditis elegansFoxA protein PHA-4, Science 295 (2002) 821–825.
[6] W.H. Biggs 3rd, J. Meisenhelder, T. Hunter, W.K. Cavenee, K.C. Arden, Protein kinaseB/Akt-mediated phosphorylation promotes nuclear exclusion of the winged helixtranscription factor FKHR1, Proc. Natl. Acad. Sci. U. S. A. 96 (1999) 7421–7426.
[7] S. Guo, G. Rena, S. Cichy, X. He, P. Cohen, T. Unterman, Phosphorylation of serine 256by protein kinase B disrupts transactivation by FKHR and mediates effects of insulinon insulin-like growth factor-binding protein-1 promoter activity through a con-served insulin response sequence, J. Biol. Chem. 274 (1999) 17184–17192.
[8] T. Furuyama, T. Nakazawa, I. Nakano, N. Mori, Identification of the differential distri-bution patterns of mRNAs and consensus binding sequences for mouse DAF-16 ho-mologues, Biochem. J. 349 (2000) 629–634.
[9] W.H. Biggs 3rd, W.K. Cavenee, K.C. Arden, Identification and characterization ofmembers of the FKHR (FOXO) subclass of winged-helix transcription factors inthe mouse, Mamm. Genome 12 (2001) 416–425.
[10] K.L. Tsai, Y.J. Sun, C.Y. Huang, J.Y. Yang, M.C. Hung, C.D. Hsiao, Crystal structure of thehuman FOXO3a-DBD/DNA complex suggests the effects of post-translational modi-fication, Nucleic Acids Res. 35 (2007) 6984–6994.
[11] M.M. Brent, R. Anand, R. Marmorstein, Structural basis for DNA recognition byFOXO1 and its regulation by posttranslational modification, Structure 16 (2008)1407–1416.
[12] E. Boura, L. Rezabkova, J. Brynda, V. Obsilova, T. Obsil, Structure of the humanFOXO4–DBD–DNA complex at 1.9 A resolution reveals new details of FOXO bindingto the DNA, Acta Crystallogr. D: Biol. Crystallogr. 66 (2010) 1351–1357.
[13] J. Weigelt, I. Climent, K. Dahlman-Wright, M. Wikstrom, Solution structure of theDNA binding domain of the human forkhead transcription factor AFX (FOXO4), Bio-chemistry 40 (2001) 5861–5869.
[14] F. Wang, C.B. Marshall, K. Yamamoto, G.Y. Li, M.J. Plevin, H. You, T.W. Mak, M. Ikura,Biochemical and structural characterization of an intramolecular interaction inFOXO3a and its binding with p53, J. Mol. Biol. 384 (2008) 590–603.
[15] E. Boura, J. Silhan, P. Herman, J. Vecer, M. Sulc, J. Teisinger, V. Obsilova, T. Obsil, Boththe N-terminal loop and Wing W2 of the forkhead domain of transcription factorfoxo4 are important for DNA binding, J. Biol. Chem. 282 (2007) 8265–8275.
[16] H. Matsuzaki, H. Daitoku, M. Hatta, H. Aoyama, K. Yoshimochi, A. Fukamizu, Acety-lation of FOXO1 alters its DNA-binding ability and sensitivity to phosphorylation,Proc. Natl. Acad. Sci. U. S. A. 102 (2005) 11278–11283.
[17] J. Silhan, P. Vacha, P. Strnadova, J. Vecer, P. Herman, M. Sulc, J. Teisinger, V. Obsilova,T. Obsil, 14-3-3 protein masks the DNA binding interface of forkhead transcriptionfactor FOXO4, J. Biol. Chem. 284 (2009) 19349–19360.
[18] S. Pierrou, M. Hellqvist, L. Samuelsson, S. Enerback, P. Carlsson, Cloning and charac-terization of seven human forkhead proteins: binding site specificity and DNA bend-ing, EMBO J. 13 (1994) 5002–5012.
[19] D.G. Overdier, A. Porcella, R.H. Costa, The DNA-binding specificity of the hepatocytenuclear factor 3/forkhead domain is influenced by amino-acid residues adjacent tothe recognition helix, Mol. Cell. Biol. 14 (1994) 2755–2766.
[20] T. Shiyanova, X. Liao, The dissociation rate of a winged helix protein-DNA complex isinfluenced by non-DNA contact residues, Arch. Biochem. Biophys. 362 (1999)356–362.
[21] M.J. van Dongen, A. Cederberg, P. Carlsson, S. Enerback, M.Wikstrom, Solution struc-ture and dynamics of the DNA-binding domain of the adipocyte-transcription factorFREAC-11, J. Mol. Biol. 296 (2000) 351–359.

78 P. Vacha et al. / Biophysical Chemistry 184 (2013) 68–78
[22] G. Krauss, D. Riesner, G. Maass, Mechanism of discrimination between cognate andnon-cognate tRNAs by phenylalanyl-tRNA synthetase from yeast, Eur. J. Biochem. 68(1976) 81–93.
[23] D. Riesner, A. Pingoud, D. Boehme, F. Peters, G. Maass, Distinct steps in the specificbinding of tRNA to aminoacyl-tRNA synthetase. Temperature-jump studies on theserine-specific system from yeast and the tyrosine-specific system from Escherichiacoli, Eur. J. Biochem. 68 (1976) 71–80.
[24] C.A. Lipschultz, Y. Li, S. Smith-Gill, Experimental design for analysis of com-plex kinetics using surface plasmon resonance, Methods 20 (2000)310–318.
[25] L. Rezabkova, M. Kacirova, M. Sulc, P. Herman, J. Vecer, M. Stepanek, V. Obsilova, T.Obsil, Structural modulation of phosducin by phosphorylation and 14-3-3 proteinbinding, Biophys. J. 103 (2012) 1960–1969.
[26] J. Vecer, P. Herman, Maximum entropy analysis of analytically simulated complexfluorescence decays, J. Fluoresc. 21 (2011) 873–881.
[27] D. Veisova, L. Rezabkova, M. Stepanek, P. Novotna, P. Herman, J. Vecer, T. Obsil, V.Obsilova, The C-terminal segment of yeast BMH proteins exhibits different structurecompared to other 14-3-3 protein isoforms, Biochemistry 49 (2010) 3853–3861.
[28] I. Marsden, Y. Chen, C. Jin, X. Liao, Evidence that the DNA binding specificity ofwinged helix proteins is mediated by a structural change in the amino acid se-quence adjacent to the principal DNA binding helix, Biochemistry 36 (1997)13248–13255.
[29] I. Marsden, C. Jin, X. Liao, Structural changes in the region directly adjacent to theDNA-binding helix highlight a possible mechanism to explain the observed changesin the sequence-specific binding of winged helix proteins, J. Mol. Biol. 278 (1998)293–299.