DETAILED PROJECT REPORT COOKIES MAKING UNIT ...
25
PM FME- Detailed Project Report of Cookies Making Business 1 DETAILED PROJECT REPORT COOKIES MAKING UNIT UNDER PMFME SCHEME National Institute of Food Technology Entrepreneurship and Management Ministry of Food Processing Industries Plot No.97, Sector-56, HSIIDC, Industrial Estate, Kundli, Sonipat, Haryana-131028 Website: http://www.niftem.ac.in Email: [email protected] Call: 0130-2281089
-
Upload
khangminh22 -
Category
Documents
-
view
5 -
download
0
Transcript of DETAILED PROJECT REPORT COOKIES MAKING UNIT ...

PM FME- Detailed Project Report of Cookies Making Business
1
DETAILED PROJECT REPORT
COOKIES MAKING UNIT
UNDER PMFME SCHEME
National Institute of Food Technology Entrepreneurship and Management
Ministry of Food Processing Industries
Plot No.97, Sector-56, HSIIDC, Industrial Estate, Kundli, Sonipat, Haryana-131028
Website: http://www.niftem.ac.in
Email: [email protected]
Call: 0130-2281089

PM FME- Detailed Project Report of Cookies Making Business
2
TABLE OF CONTENTS
S No. Topic Page Number
1. Project Summary 3
2. About the Product 4-5
3. Process Flow Chart 6-7
4. Economics of the Project 8-25
4.1. Basis & Presumptions 8
4.2. Capacity , Utilisation, Production & Output 9-10
4.3. Premises/Infrastructure 11
4.4. Machinery & Equipments 11-12
4.5. Misc. Fixed Assets 13
4.6. Total Cost of Project 13
4.7. Means of Finance 14
4.8 Term Loan 14
4.9. Term Loan repayment & interest schedule 14-17
4.10. Working Capital Calculations 18
4.11. Salaries/Wages 19
4.12. Power Requirement 19
4.13. Depreciation Calculation 20
4.14. Repairs & Maintenance 20
4.15. Projections of Profitability Analysis 21
4.16. Break Even Point Analysis 22
4.17. Projected Balance Sheet 23
4.18. Cash- Flow Statement 24
4.19. Debt-Service Coverage Ratio 25

PM FME- Detailed Project Report of Cookies Making Business
3
1. PROJECT SUMMARY
1. Name of the proposed project : Cookies Making Unit
2. Nature of proposed project : Proprietorship/Company/Partnership
3. Proposed project capacity : 116400 Kg/annum(55,60,65,70,&75% capacity utilization in 1st to 5th Year respectively)
4. Raw materials : Wheat Flour, Sugar, Oil, Chemicals, Flavours
5. Major product outputs : Cookies
6. Total project cost : Rs.16.79 Lakh
• Land development, building & Civil Construction
: Nil
• Machinery and equipment’s : Rs.11.35 Lakh
• Miscellaneous Fixed Assets : Rs.1.00 Lakh
• Working capital : Rs. 4.44 Lakh
8. Means of Finance • Subsidy (max 10lakhs) : Rs.4.32 Lakh
• Promoter’s contribution (min10%) : Rs.1.67 Lakh
• Term loan : Rs.6.79 Lakh
• Working Capital Requirement : Rs.4.00 Lakh
9. Profit after Depreciation, Interest & Tax
• 1styear : Rs.1.18 Lakh
• 2ndyear : Rs.2.30 Lakh
• 3rd year : Rs.3.37 Lakh
• 4th year : Rs.5.25 Lakh
• 5th year : Rs.7.17 Lakh
11. Average DSCR : 3.24
12. Term loan repayment : 5 Years with 6 months grace period

PM FME- Detailed Project Report of Cookies Making Business
4
2. ABOUT THE PRODUCT
2.1. PRODUCT INTRODUCTION:
A cookie is a baked or cooked food that is typically small, flat and sweet. It usually contains
flour, sugar and some type of oil or fat. It may include other ingredients such as raisins, oats,
chocolate chips, nuts, etc.
Cookies are often served with beverages such as milk, coffee or tea and sometimes "dunked", an
approach which releases more flavour from confections by dissolving the sugars, while also
softening their texture.
Cookies are most commonly baked until crisp or just long enough that they remain soft, but
some kinds of cookies are not baked at all. Cookies are made in a wide variety of styles, using an
array of ingredients including sugars, spices, chocolate, butter, peanut butter, nuts, or dried fruits.
The softness of the cookie may depend on how long it is baked
2.2 MARKET POTENTIAL:
India biscuit market stood at $ 3.9 billion in 2016, and is projected to grow at a CAGR of 11.27%,
in value terms, during 2017-2022, to reach $ 7.25 billion by 2022. Rising number of health-
conscious consumers, expanding working population and increasing urbanization are boosting the
country’s biscuit market. Moreover, augmenting disposable income along with changing lifestyle,
increasing awareness regarding healthy diet and change in food consumption pattern are some of
the other factors expected to propel demand for biscuits over the course of next five years.

PM FME- Detailed Project Report of Cookies Making Business
5
The global cookies market size was valued at USD 30.62 billion in 2018 and is projected to expand
at a CAGR of 5.3% from 2019 to 2025. Growing product popularity, especially in emerging
regions, is expected to be the key factor fueling the market growth. Moreover, high demand for
chocolate cookies in developed economies like U.S., Germany, and U.K. will boost the market
further. Bakery manufacturers attract customers with innovative packaging solutions and by
launching new flavor variants, such as pineapple.
2.2. RAW MATERIAL DESCRIPTION:
Following raw material is required as the major raw material for the manufacturing of cookies.
• Wheat Flour • Sugar • Flavours • Oil • Chemicals

PM FME- Detailed Project Report of Cookies Making Business
6
3. PROCESS FLOW CHART
• First of all, as a raw material bakery shortening is kept at a temperature of 8 degree Celsius
to 10 degree Celsius to Colden its raw material, so that there will be no lumps issue arise at
the time of mixing.
• After that sugar is grinded with the help of Sugar grinder.
• Then mix well the grinded sugar and bakery shortening together & for mixing use filtered
water according to the season type.
• After preparation of mixture add refined wheat flour and flavours as required in it.
• Then keep ready mixture near dropping machine, where cookies are designed according to
size, type by the operator.
• Trays are then loaded to the back of machine, in which cookies start coming on the conveyor
drop by drop.
• After that these trays are loaded on trolley and cookies are kept in the open for baking
process at 180 degree Celsius for 25 minutes.
• After baking process cookies are send to packaging department.

PM FME- Detailed Project Report of Cookies Making Business
7
FLOW CHART OF COOKIES MAKING PROCESS
Pre Mixing
Mixing Forming
Baking Cooling
Packaging

PM FME- Detailed Project Report of Cookies Making Business
8
4. ECONOMICS OF THE PROJECT
4.1. BASIS & PRESUMPTIONS
1. Production Capacity of Cookies taken is 400 Kgs per day. First year, Capacity has been
taken @ 55%.
2. Working shift of 8 hours per day has been considered.
3. Raw Material stock is for 15 days and Finished goods Closing Stock has
been taken for 10 days.
4. Credit period to Sundry Debtors has been given for 10 days.
5. Credit period by the Sundry Creditors has been provided for 8 days.
6. Depreciation and Income tax has been taken as per the Income tax Act,
1961.
7. Interest on working Capital Loan and Term loan has been taken at 11%.
8. Salary and wages rates are taken as per the Current Market Scenario.
9. Power Consumption has been taken at 8 KW.
10. Selling Prices & Raw material costing has been increased by 5% & 5% respectively in the
subsequent years.

PM FME- Detailed Project Report of Cookies Making Business
9
4.2. CAPACITY, UTILIZATION, PRODUCTION & OUTPUT
COMPUTATION OF PRODUCTION OF COOKIES Items to be Manufactured Cookies
Machine capacity Per hour 50 Kg Total working Hours 8 Machine capacity Per Day 400 Kg
Working days in a month 25
Days Working days per annum 300 Wastage Considered 3% Raw material requirement 120000 Kg Final Output per annum after wastage 116400 Kg Final Product to be packed in 1 kg Packet Number of Packets per annum 116400 Kg
Production of Cookies
Production Capacity KG
1st year 55%
64,020
2nd year 60%
69,840
3rd year 65%
75,660
4th year 70%
81,480
5th year 75%
87,300

PM FME- Detailed Project Report of Cookies Making Business
10
Raw Material Cost
Year Capacity Rate Amount Utilisation (per Kg) (Rs. in lacs)
1st year 55%
60.00 39.60
2nd year 60%
63.00 45.36
3rd year 65%
66.00 51.48
4th year 70%
69.00 57.96
5th year 75%
72.00 64.80
COMPUTATION OF SALE Particulars 1st year 2nd year 3rd year 4th year 5th year
Op Stock -
2,134
2,328
2,522
2,716
Production
64,020
69,840
75,660
81,480
87,300 Less : Closing Stock
2,134
2,328
2,522
2,716
2,910
Net Sale
61,886
69,646
75,466
81,286
87,106 sale price per packet 100.00 105.00 110.00 116.00 122.00
Sales (in Lacs) 61.89 73.13 83.01 94.29 106.27

PM FME- Detailed Project Report of Cookies Making Business
11
4.3. PREMISES/INFRASTRUCTURE
The approximate total area required for complete factory setup is 1200-1500 Sq. ft. for smooth
production including storage area. It is expected that the premises will be on rental.
4.4. MACHINERY & EQUIPMENTS
S.N. Item Description Image
1 Planetary mixture
2 Baking Oven
3 Dropping machine

PM FME- Detailed Project Report of Cookies Making Business
12
4 Sugar mixture
Machine Unit Rate Price
Planetary mixture (Bowl Capacity – 30 Kg)
2 85,000 1,70,000
Baking Oven (40-50 kg/hr)
1 5,00,000 5,00,000
Dropping machine (40-50 kg/hr)
1 3,90,000 3,90,000
Sugar Mixture Grinder (100 kg/hr)
1 75,000 75,000
Note: cost of the machinery is approx. Rs. 11.35 lakhs excluding GST and other transportation cost.

PM FME- Detailed Project Report of Cookies Making Business
13
4.5. MISCELLANEOUS FIXED ASSETS
• Electricity connection • Other equipment’s & fixture • Storage tank etc.
4.6. TOTAL COST OF PROJECT
COST OF PROJECT (in Lacs)
PARTICULARS Amount Land & Building Owned/Rented Plant & Machinery 11.35
Miscellaneous Assets 1.00 Working capital 4.44 Total 16.79

PM FME- Detailed Project Report of Cookies Making Business
14
4.7. MEANS OF FINANCE
MEANS OF FINANCE
PARTICULARS AMOUNT Own Contribution (min 10%) 1.67 Subsidy @35%(Max. Rs 10 Lac) 4.32
Term Loan @ 55% 6.79
Working Capital (Bank Finance) 4.00
Total 16.79
4.8. TERM LOAN: Term loan of Rs. 6.79 Lakh is required for project cost of Rs. 16.79 Lakh
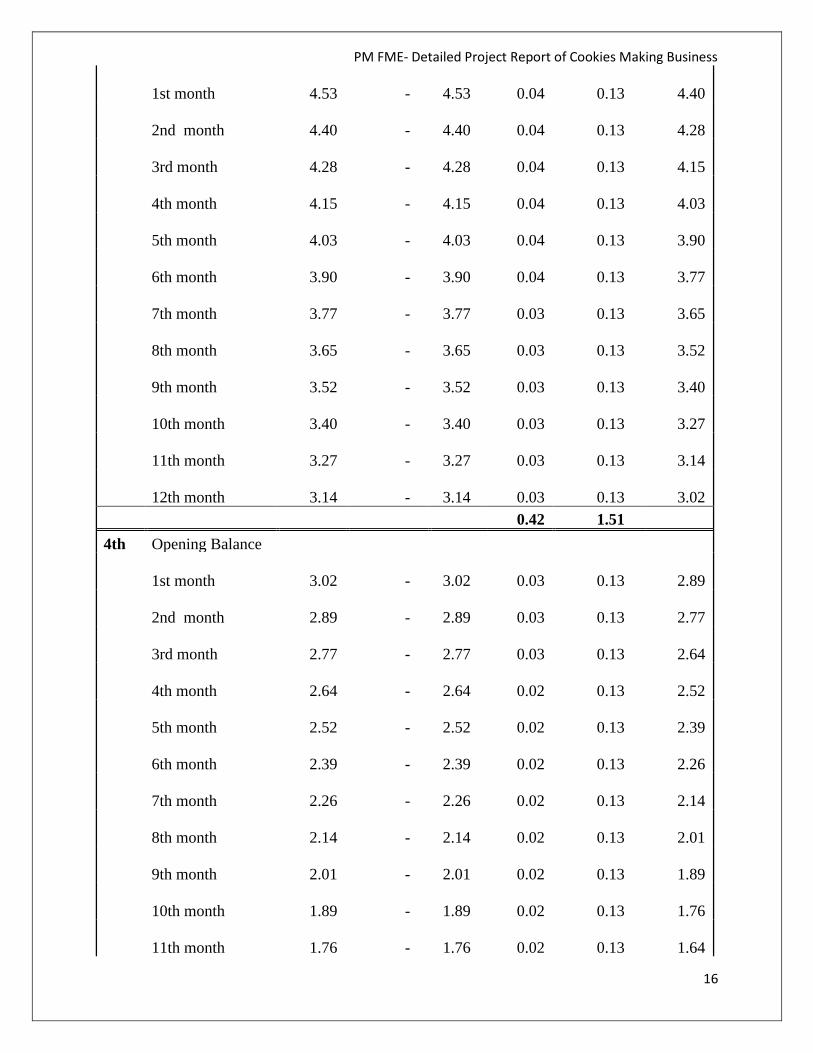
4.9. TERM LOAN REPAYMENT & INTEREST SCHEDULE
REPAYMENT SCHEDULE OF TERM LOAN Interest 11.00%
Year Particulars Amount Addition Total Interest
Repayment Closing Balance
1st Opening Balance
1st month - 6.79
6.79 - - 6.79
2nd month 6.79 -
6.79 0.06 - 6.79
3rd month 6.79 -
6.79 0.06 - 6.79

PM FME- Detailed Project Report of Cookies Making Business
15
4th month 6.79 -
6.79 0.06 6.79
5th month 6.79 -
6.79 0.06 6.79
6th month 6.79 -
6.79 0.06 6.79
7th month 6.79 -
6.79 0.06 0.13 6.67
8th month 6.67 -
6.67 0.06 0.13 6.54
9th month 6.54 -
6.54 0.06 0.13 6.42
10th month 6.42 -
6.42 0.06 0.13 6.29
11th month 6.29 -
6.29 0.06 0.13 6.16
12th month 6.16 -
6.16 0.06 0.13 6.04 0.67 0.75 2nd Opening Balance
1st month 6.04 -
6.04 0.06 0.13 5.91
2nd month 5.91 -
5.91 0.05 0.13 5.79
3rd month 5.79 -
5.79 0.05 0.13 5.66
4th month 5.66 -
5.66 0.05 0.13 5.53
5th month 5.53 -
5.53 0.05 0.13 5.41
6th month 5.41 -
5.41 0.05 0.13 5.28
7th month 5.28 -
5.28 0.05 0.13 5.16
8th month 5.16 -
5.16 0.05 0.13 5.03
9th month 5.03 -
5.03 0.05 0.13 4.91
10th month 4.91 -
4.91 0.04 0.13 4.78
11th month 4.78 -
4.78 0.04 0.13 4.65
12th month 4.65 -
4.65 0.04 0.13 4.53 0.59 1.51 3rd Opening Balance
PM FME- Detailed Project Report of Cookies Making Business
16
1st month 4.53 -
4.53 0.04 0.13 4.40
2nd month 4.40 -
4.40 0.04 0.13 4.28
3rd month 4.28 -
4.28 0.04 0.13 4.15
4th month 4.15 -
4.15 0.04 0.13 4.03
5th month 4.03 -
4.03 0.04 0.13 3.90
6th month 3.90 -
3.90 0.04 0.13 3.77
7th month 3.77 -
3.77 0.03 0.13 3.65
8th month 3.65 -
3.65 0.03 0.13 3.52
9th month 3.52 -
3.52 0.03 0.13 3.40
10th month 3.40 -
3.40 0.03 0.13 3.27
11th month 3.27 -
3.27 0.03 0.13 3.14
12th month 3.14 -
3.14 0.03 0.13 3.02 0.42 1.51 4th Opening Balance
1st month 3.02 -
3.02 0.03 0.13 2.89
2nd month 2.89 -
2.89 0.03 0.13 2.77
3rd month 2.77 -
2.77 0.03 0.13 2.64
4th month 2.64 -
2.64 0.02 0.13 2.52
5th month 2.52 -
2.52 0.02 0.13 2.39
6th month 2.39 -
2.39 0.02 0.13 2.26
7th month 2.26 -
2.26 0.02 0.13 2.14
8th month 2.14 -
2.14 0.02 0.13 2.01
9th month 2.01 -
2.01 0.02 0.13 1.89
10th month 1.89 -
1.89 0.02 0.13 1.76
11th month 1.76 -
1.76 0.02 0.13 1.64

PM FME- Detailed Project Report of Cookies Making Business
17
12th month 1.64 -
1.64 0.01 0.13 1.51 0.26 1.51 5th Opening Balance
1st month 1.51 -
1.51 0.01 0.13 1.38
2nd month 1.38 -
1.38 0.01 0.13 1.26
3rd month 1.26 -
1.26 0.01 0.13 1.13
4th month 1.13 -
1.13 0.01 0.13 1.01
5th month 1.01 -
1.01 0.01 0.13 0.88
6th month 0.88 -
0.88 0.01 0.13 0.75
7th month 0.75 -
0.75 0.01 0.13 0.63
8th month 0.63 -
0.63 0.01 0.13 0.50
9th month 0.50 -
0.50 0.00 0.13 0.38
10th month 0.38 -
0.38 0.00 0.13 0.25
11th month 0.25 -
0.25 0.00 0.13 0.13
12th month 0.13 -
0.13 0.00 0.13 - 0.09 1.51
DOOR TO DOOR 60 MONTHS MORATORIUM
PERIOD 6 MONTHS REPAYMENT PERIOD 54 MONTHS

PM FME- Detailed Project Report of Cookies Making Business
18
4.10. WORKING CAPITAL CALCULATIONS
COMPUTATION OF CLOSING STOCK & WORKING CAPITAL (in Lacs)
PARTICULARS 1st year 2nd year 3rd year 4th year 5th year Finished Goods
1.81 2.07 2.33 2.60 2.89
Raw Material 1.98 2.27 2.57 2.90 3.24 Closing Stock 3.79 4.34 4.90 5.50 6.13
COMPUTATION OF WORKING CAPITAL REQUIREMENT TRADITIONAL METHOD (in Lacs) Particulars Amount Own Margin Bank Finance Finished Goods & Raw Material 3.79 Less : Creditors 1.06
Paid stock 2.73 10% 0.27 90% 2.46
Sundry Debtors 2.06 10% 0.21 90% 1.86
4.80 0.48 4.32
MPBF 4.32 WORKING CAPITAL LIMIT DEMAND ( from Bank) 4.00 Working Capital Margin 0.44

PM FME- Detailed Project Report of Cookies Making Business
19
4.11. SALARY & WAGES
BREAK UP OF LABOUR CHARGES Particulars Wages No of Total Rs. per Month Employees Salary
Skilled (in thousand rupees) 14,000 2
28,000
Unskilled (in thousand rupees) 8,500 2
17,000
Total salary per month
45,000 Total annual labour charges (in lacs) 5.40
BREAK UP OF STAFF SALARY CHARGES Particulars Salary No of Total Rs. per Month Employees Salary Helper 7,000 1 7,000
Accountant 12,000 1 12,000
Total salary per month 19,000
Total annual Staff charges (in lacs) 2.28
4.12 POWER REQUIREMENT
Utility Charges (per month) Particulars value Description Power connection required 8 KWH consumption per day 64 units
Consumption per month 1,600 units Rate per Unit 10 Rs. power Bill per month 16,000 Rs.

PM FME- Detailed Project Report of Cookies Making Business
20
4.13. DEPRECIATION CALCULATION
COMPUTATION OF DEPRECIATION (in Lacs)
Description Plant & Machinery Miss. Assets
TOTAL
Rate of Depreciation 15.00% 10.00% Opening Balance - - -
Addition 11.35 1.00 12.35 Total 11.35 1.00 12.35 Less : Depreciation 1.70 0.10 1.80 WDV at end of Year 9.65 0.90 10.55
Additions During The Year - - - Total 9.65 0.90 10.55 Less : Depreciation 1.45 0.09 1.54 WDV at end of Year 8.20 0.81 9.01 Additions During The Year - - - Total 8.20 0.81 9.01 Less : Depreciation 1.23 0.08 1.31 WDV at end of Year 6.97 0.73 7.70
Additions During The Year - - - Total 6.97 0.73 7.70
Less : Depreciation 1.05 0.07 1.12
WDV at end of Year 5.92 0.66 6.58 Additions During The Year - - - Total 5.92 0.66 6.58 Less : Depreciation 0.89 0.07 0.95
WDV at end of Year 5.04 0.59 5.63
4.14. REPAIR & MAINTENANCE: Repair & Maintenance is 2.5% of Gross Sale.

PM FME- Detailed Project Report of Cookies Making Business
21
4.15. PROJECTIONS OF PROFITABILITY ANALYSIS
PROJECTED PROFITABILITY STATEMENT (in Lacs)
PARTICULARS 1st year 2nd year
3rd year
4th year 5th year
Capacity Utilisation % 55% 60% 65% 70% 75%
SALES Gross Sale Cookies 61.89 73.13 83.01 94.29 106.27 Total 61.89 73.13 83.01 94.29 106.27 COST OF SALES Raw Material Consumed 39.60 45.36 51.48 57.96 64.80 Electricity Expenses 1.92 2.21 2.54 2.92 3.21 Depreciation 1.80 1.54 1.31 1.12 0.95 Wages & labour 5.40 5.94 6.53 7.06 7.62 Repair & maintenance 1.55 1.83 2.08 2.36 2.66 Packaging 4.02 5.27 5.81 6.60 7.44
Cost of Production 54.29 62.14 69.75 78.01 86.68 Add: Opening Stock /WIP - 1.81 2.07 2.33 2.60
Less: Closing Stock /WIP 1.81 2.07 2.33 2.60 2.89
Cost of Sales 52.48 61.88 69.50 77.74 86.39 GROSS PROFIT 9.40 11.25 13.52 16.55 19.88 15.19% 15.39% 16.28% 17.56% 18.70% Salary to Staff 2.28 2.64 3.23 3.71 4.08 Interest on Term Loan 0.67 0.59 0.42 0.26 0.09 Interest on working Capital 0.44 0.44 0.44 0.44 0.44 Rent 3.60 3.96 4.36 4.79 5.27 selling & adm exp 1.24 1.32 1.66 1.89 2.13 TOTAL 8.23 8.95 10.10 11.08 12.01 NET PROFIT 1.18 2.30 3.41 5.47 7.87 1.90% 3.15% 4.11% 5.80% 7.40% Taxation - - 0.05 0.22 0.70 PROFIT (After Tax) 1.18 2.30 3.37 5.25 7.17

PM FME- Detailed Project Report of Cookies Making Business
22
4.16. BREAK EVEN POINT ANALYSIS
BREAK EVEN POINT ANALYSIS Year I II III IV V Net Sales & Other Income 61.89 73.13 83.01 94.29 106.27 Less : Op. WIP Goods - 1.81 2.07 2.33 2.60 Add : Cl. WIP Goods 1.81 2.07 2.33 2.60 2.89 Total Sales 63.70 73.39 83.27 94.57 106.56 Variable & Semi Variable Exp. Raw Material Consumed 39.60 45.36 51.48 57.96 64.80 Electricity Exp/Coal Consumption at 85% 1.63 1.88 2.16 2.48 2.73 Wages & Salary at 60% 4.61 5.15 5.86 6.46 7.02 Selling & adminstrative Expenses 80% 0.99 1.05 1.33 1.51 1.70 Interest on working Capital 0.44 0.44 0.44 0.44 0.44 Repair & maintenance 1.55 1.83 2.08 2.36 2.66 Packaging 4.02 5.27 5.81 6.60 7.44 Total Variable & Semi Variable Exp 52.84 60.97 69.15 77.81 86.79 Contribution 10.86 12.42 14.12 16.76 19.77 Fixed & Semi Fixed Expenses Electricity Exp/Coal Consumption at 15% 0.29 0.33 0.38 0.44 0.48 Wages & Salary at 40% 3.07 3.43 3.90 4.31 4.68 Interest on Term Loan 0.67 0.59 0.42 0.26 0.09 Depreciation 1.80 1.54 1.31 1.12 0.95 Selling & adminstrative Expenses 20% 0.25 0.26 0.33 0.38 0.43 Rent 3.60 3.96 4.36 4.79 5.27 Total Fixed Expenses 9.68 10.11 10.71 11.29 11.90 Capacity Utilization 55% 60% 65% 70% 75% OPERATING PROFIT 1.18 2.30 3.41 5.47 7.87 BREAK EVEN POINT 49% 49% 49% 47% 45% BREAK EVEN SALES 56.78 59.78 63.15 63.70 64.16

PM FME- Detailed Project Report of Cookies Making Business
23
4.17. PROJECTED BALANCE SHEET
PROJECTED BALANCE SHEET (in Lacs)
PARTICULARS 1st year 2nd year 3rd year 4th year 5th year Liabilities
Capital opening balance 7.17 8.97 10.84 14.09 Add:- Own Capital 1.67 Add:- Retained Profit 1.18 2.30 3.37 5.25 7.17
Less:- Drawings - 0.50 1.50 2.00 3.50 Subsidy/grant 4.32 Closing Balance 7.17 8.97 10.84 14.09 17.76 Term Loan 6.04 4.53 3.02 1.51 - Working Capital Limit 4.00 4.00 4.00 4.00 4.00 Sundry Creditors 1.06 1.21 1.37 1.55 1.73 Provisions & Other Liab 0.40 0.50 0.60 0.72 0.86 TOTAL : 18.66 19.21 19.83 21.86 24.35
Assets Fixed Assets ( Gross) 12.35 12.35 12.35 12.35 12.35
Gross Dep. 1.80 3.34 4.65 5.77 6.72
Net Fixed Assets 10.55 9.01 7.70 6.58 5.63 Current Assets Sundry Debtors 2.06 2.44 2.77 3.14 3.54 Stock in Hand 3.79 4.34 4.90 5.50 6.13 Cash and Bank 2.26 3.42 4.46 6.64 9.05 TOTAL : 18.66 19.21 19.83 21.86 24.35

PM FME- Detailed Project Report of Cookies Making Business
24
4.18. CASH FLOW STATEMENT
PROJECTED CASH FLOW STATEMENT (in Lacs)
PARTICULARS 1st year
2nd year
3rd year
4th year 5th year
SOURCES OF FUND
Own Margin 1.67 Net Profit 1.18 2.30 3.41 5.47 7.87 Depriciation & Exp. W/off 1.80 1.54 1.31 1.12 0.95 Increase in Cash Credit 4.00 - - - -
Increase In Term Loan 6.79 - - - - Increase in Creditors 1.06 0.15 0.16 0.17 0.18 Increase in Provisions & Oth lib 0.40 0.10 0.10 0.12 0.14 Sunsidy/grant 4.32 TOTAL : 21.22 4.09 4.99 6.88 9.15 APPLICATION OF FUND Increase in Fixed Assets 12.35 Increase in Stock 3.79 0.55 0.56 0.60 0.63
Increase in Debtors 2.06 0.37 0.33 0.38 0.40 Repayment of Term Loan 0.75 1.51 1.51 1.51 1.51
Drawings - 0.50 1.50 2.00 3.50 Taxation - - 0.05 0.22 0.70 TOTAL : 18.96 2.93 3.94 4.70 6.74 Opening Cash & Bank Balance - 2.26 3.42 4.46 6.64 Add : Surplus 2.26 1.16 1.04 2.18 2.41 Closing Cash & Bank Balance 2.26 3.42 4.46 6.64 9.05

PM FME- Detailed Project Report of Cookies Making Business
25
4.19. DEBT SERVICE COVERAGE RATIO
CALCULATION OF D.S.C.R
PARTICULARS 1st year
2nd year
3rd year
4th year
5th year
CASH ACCRUALS
2.98
3.84
4.68
6.37
8.12
Interest on Term Loan
0.67
0.59
0.42
0.26
0.09
Total
3.65
4.43
5.10
6.63
8.21
REPAYMENT
Instalment of Term Loan
0.75
1.51
1.51
1.51
1.51
Interest on Term Loan
0.67
0.59
0.42
0.26
0.09
Total
1.42
2.10
1.93
1.77
1.60 DEBT SERVICE COVERAGE RATIO 2.56 2.11 2.64 3.75 5.14 AVERAGE D.S.C.R. 3.24