Acetylcholine release from proteoliposomes equipped with synaptosomal membrane constituents

Design of wideband acoustic detectors of gravitational waves equippedwith displacement concentrators
Paola Leaci,1,2,* Andrea Vinante,1,3 Michele Bonaldi,1,3 Paolo Falferi,1,3 Antonio Pontin,3
Giovanni A. Prodi,1,2 and Jean Pierre Zendri41INFN, Gruppo Collegato di Trento, Sezione di Padova, I-38100 Povo, Trento, Italy
2Dipartimento di Fisica, Universita di Trento, I-38100 Povo, Trento, Italy3Istituto di Fotonica e Nanotecnologie, CNR-Fondazione Bruno Kessler, I-38100 Povo, Trento, Italy
4INFN, Sezione di Padova, Via Marzolo 8, I-35131 Padova, Italy(Received 7 November 2007; published 7 March 2008)
We present the concept design of a new class of acoustic detectors of gravitational waves (GWs), whichfeature a wideband sensitivity. The main novelty relies in the geometry of the test mass, which is equippedwith integrated whips. This tapering provides more resonant modes with favorable cross-section to GWsto achieve a large bandwidth. Moreover, the whips act as displacement concentrators and ensure a highmechanical gain at the sensing surfaces. The resulting decrease in mechanical stiffness allows us toachieve the noise matching condition with reasonable operating parameters of the displacement trans-ducer. The performances of the detector are modeled taking into account the quantum and thermal noisesources in the case of a capacitive transducer with a SQUID amplifier. This class of detectors can bedesigned to target GWs in the frequency range above 1 kHz at a sensitivity comparable to that predictedfor future long baseline interferometric detectors. After showing how to scale the design for differentconstructing materials and target frequencies, we discuss the predicted sensitivity to specific astrophysicalsignal waveforms.
DOI: 10.1103/PhysRevD.77.062001 PACS numbers: 04.80.Nn, 07.07.Mp, 95.55.Ym
I. INTRODUCTION
The search for gravitational waves (GWs) is being pur-sued by networks of laser interferometric detectors andresonant detectors. The operating long arm interferometers[1,2] are the GW detectors with the best potential ofdiscovery today, in particular, for GW signals in the lowerpart of the acoustic frequency band, say �50� 2000� Hz.In fact, these detectors, which show the best strain sensi-tivity, are performing coordinated long-term observationsand have working plans for near future improvements[3,4].
The operating resonant bar detectors are projects ofmuch smaller size and have been in long-term operationfor many years [5,6]. Their sensitivity is limited in anarrow frequency range around 900 Hz. This is a conse-quence of their conventional detection design, where alighter mechanical resonator is coupled and tuned to aresonant mode of the larger test mass sensitive to GWs.The lighter resonator provides a mechanical amplificationof the deformation of the test mass around its resonancefrequency. This amplification is necessary to overcome theadditive noise contributed by the electrical signal amplifierand, if possible, to achieve the noise matching condition[7]. Unavoidably, the lighter resonator produces also addi-tional thermal noise, which dominates the performances ofthe detectors out from its resonance. This conventionalscheme of resonant detection can be improved by using achain of tuned resonators with decreasing masses [8], but
the additional thermal noise limits in practice the band-width to & 0:1 of the resonance frequency. The state-of-the-art is represented by the AURIGA bar detector, whichimplements a chain of two lighter resonators tuned to thefirst longitudinal mode of the cylindrical bar [9]. Thecurrent designs of spherical resonant detectors are affectedas well by this limitation [10].
New concept designs of acoustic detectors have beenproposed to overcome the bandwidth limitations of con-ventional resonant detectors: the DUAL detectors [11,12]are sensitive over a wide frequency bandwidth between thefundamental quadrupolar resonant modes of the two nestedtest masses. To preserve the wide frequency band and tominimize the thermal noise, the DUAL detectors need ageometrically selective readout, which senses the quadru-polar deformations, as those produced by GWs, whilerejecting deformations with different symmetry [12].More recently, the same operating principle has been dem-onstrated also in the case of a hollow cylindrical test mass,called single-mass DUAL detector [13]. It has been provedthat the latter can offer all the advantages of a DUALdetector, but with easier detector realization. Both thesedesigns, however, set too strict requirements on the noisestiffness of the motion sensors. In fact, it is well known inlinear system theory that the limiting performances can beachieved only if the measuring device has a noise imped-ance matched to the impedance of its load (see, e.g.,Ref. [14]). The noise stiffness required to optimize theperformance of the single-mass DUAL proposed inRef. [13] is 2-3 orders of magnitude larger than the onewhich could be achieved by realistic readouts, both elec-*Corresponding author: [email protected]
PHYSICAL REVIEW D 77, 062001 (2008)
1550-7998=2008=77(6)=062001(19) 062001-1 © 2008 The American Physical Society

tromechanical and optomechanical. Therefore, also theDUAL detectors require a wideband mechanical amplifi-cation of displacement, which cannot be of the traditionalresonant type, as above mentioned.
In this article, we propose a new design of single hollowtest mass which allows us to achieve the noise matchingcondition with realistic displacement transducers. In thisdesign, the test mass is equipped with displacement con-centrators made by properly tapered whips [15], whichprovide wideband mechanical amplification at the sensingsurfaces. Moreover, the test mass design is optimized sothat five resonant modes with favorable cross-section toGWs contribute to its wideband sensitivity, as comparedwith the two modes contributing to the sensitivity of thesingle-mass DUAL detector. As in former DUAL designs,also the new ones exploit the back-action reduction atfrequencies between adjacent resonant modes. The result-ing main advantage of the new design is the reduction ofthe mechanical stiffness at the sensing surfaces by almost 3orders of magnitude. This allows us to achieve the noisematching condition, while keeping a standard quantumlimit (SQL) performance comparable to the DUAL detec-tors, in terms of noise spectra. The development of this newdesign was based on the systematic use of three-dimensional dynamical simulations by means of finiteelement method (FEM).
The paper is organized as follows. In Sec. II, we brieflyreview the model of a generic acoustic detector made by asingle test mass equipped with an ideal SQL readout or arealistic capacitive transducer. Section III describes thenew concept design, namely, the design of the test mass,the design of the capacitive displacement transducer andamplification chain, and the resulting design sensitivity.Section IV is devoted to the discussion of a few sciencecases, based on two detector configurations targeted todifferent frequency bandwidths: ��1:1� 2:6� kHz and��2� 5� kHz. Conclusions are summarized in Sec. V.
II. GENERAL PROPERTIES OF ACOUSTIC GWDETECTORS
The fundamental driving forces on the test mass of anacoustic GW detector are the tidal force field of the GW,the readout back-action force and the thermal noise. In thefollowing subsections we recall the system response on thebasis of the guidelines of Refs. [12,13], and we discuss thenoise matching condition to a capacitive readout. We alsoreview the general scaling properties of the mechanicaldesign of the cylindrical test mass in terms of its dimen-sions and related operating frequencies.
A. Response of the test mass to the fundamental drivingforces
The deformation u�r; t� of the test mass is read at theselected sensing surfaces and the output displacement canbe expressed as
X�t� �ZSdsP�r�u�r; t�; (1)
where P�r� is a suitable weight function, used to select thedeformations that can be produced by the quadrupolar GWfield and to reject deformations of different geometricalsymmetry.
As usual, in the following h�t� is the time varyingamplitude of metric perturbation related to GW. The de-tector responses to h�t� and to an input back-action forceFBA�t� are described in the frequency domain by
~X�!� � ~h�!�HGW�!� (2)
and
~X�!� � ~FBA�!�TBA�!�; (3)
where a tilde denotes a Fourier transform. The back-actionforce acts on the sensing surfaces and it is basically deter-mined by the readout. The function jTBA�!�j�1 is themechanical stiffness k�!� of the readout port of the testmass.
The expressions of the transfer functions, in terms of thesuperposition of the resonant modes of the test mass, are
HGW�!�
�1
2V
Xm
�!2�RV dVW�r� � wm�r���
RS dsP�r� � wm�r��
�!2m �!2� i!2
m�m�!�
(4)
and
TBA�!� �1
M
Xm
�RS dsP�r� � wm�r��2
�!2m �!2� i!2
m�m�!�; (5)
where the integrals are performed on the volume V andsensing surfaces S of the test mass. Here W�r� is the spatialcomponent of the GW field, M is the mass of the detector,! the angular frequency, wm�r� and !m the displacementfield and the resonance angular frequency of the normalmode m, respectively. For frequency-independent losses,the phase lag �m�!� is equal to the inverse of the materialquality factor Q [16].
For a system at equilibrium with a bath at temperature T,the fluctuation-dissipation theorem [17] predicts the fol-lowing single sided power spectrum of the thermal noise onthe output variable X,
SXX�!; T� ��4KBT!
=m�TBA�!��; (6)
where KB is the Boltzmann constant.
B. Noise matching and mechanical amplification
The test mass has to be equipped with a readout system.The noise power spectral densities contributed by the read-out are Sxx�!� (m2=Hz) and Sff�!� (N2=Hz), that repre-sent the additive noise in terms of equivalent displacement
PAOLA LEACI et al. PHYSICAL REVIEW D 77, 062001 (2008)
062001-2

and the back-action force disturbance on the test mass,respectively. Then, the noise on the measured observable Xdue to the readout can be simply expressed by
SRXX�!� � Sxx�!� jTBA�!�j2Sff�!�: (7)
It is convenient to introduce also the energy resolution,expressed as number of energy quanta,
�R�!� �
����������������������������Sxx�!�Sff�!�
q@
(8)
and the readout noise stiffness:
kR�!� �
���������������Sff�!�
Sxx�!�
s: (9)
Then, it is straightforward to show [13] that the mini-mum readout noise, for given �R�!� and TBA�!�, isachieved when
kR�!� � k�!�; (10)
where k�!� � jTBA�!�j�1. According to Eq. (10), we
optimize the coupling between the test mass and its trans-ducer by matching the readout noise stiffness kR to themechanical stiffness k of the test mass. For instance, in thecase of a capacitive transducer, kR is of the order of E2
0C(for detailed calculations see Appendix A), where C is thecapacitance of the transducer and E0 is the bias electricfield. Therefore, the noise stiffness can be tuned in princi-ple by acting on E0. Unfortunately, the breakdown fieldsets an upper limit to the maximum achievable E0, which isof the order of 3 108 V=m [18]. An ordinary single-massDUAL [13] would require a noise stiffness of 1:71011 N=m: even if a readout with a capacitance as largeas 10�7 F was built, the needed field would be�109 V=m,clearly out of reach.
The straightforward way to relax the requirement on thereadout noise stiffness is to increase the mechanical defor-mation on the sensing surfaces. The surface integral inEqs. (4) and (5),
�m �ZSdsP�r� � wm�r�; (11)
can be interpreted as an estimate of the displacementconcentration relative to the mth mode over the sensingsurface. Close to the resonant frequencies of the test mass,the readout noise stiffness required to achieve the noisematching is reduced by the square of the displacementconcentration �m. In fact, near !m, the transfer functionsHGW�!� and TBA�!� are dominated by the response of themth mode so that jHGWj / �m and jTBAj / �2
m; therefore,according to Eq. (10), we have kR�!� / 1=�2
m. However, inorder to increase the coefficients �m, one needs to changethe detector geometry, for instance by adding some kind ofembedded mechanical amplification stage.
The best achievable sensitivity is affected by the testmass geometry: whenever this geometry is changed, oneneeds to check that the sensitivity is preserved. To discussthis point, let us consider the detector noise in terms of GWstrain at input,
Shh�!; T� � SRhh�!� SXX�!; T�
jHGW�!�j2 ; (12)
where
SRhh�!� �@�R�!�
jHGW�!�j2
�1
kR�!� jTBA�!�j
2kR�!��
(13)
is the detector noise obtained when the thermal noise isneglected. In this approximation, assuming the readoutoptimally matched �kR�!� � jTBA�!�j�1� and with quan-tum limit energy resolution ��R�!� � 1� [19], Eq. (13)gives the so-called SQL sensitivity of the detector:
SSQLhh �!� � 2@
TBA�!�
jHGW�!�j2 : (14)
According to Eqs. (4) and (5), around !m, the SQL sensi-tivity does not depend on the change of the displacementconcentration �m. This happens because the term repre-senting the displacement concentration dominates at reso-nance both in the numerator and denominator of Eq. (14).However, this is not the case of a wideband detector, whichworks in-between resonances. Thus one has always tocheck a posteriori if the detector SQL sensitivity is pre-served when a mechanical amplification stage is imple-mented. For instance, it has been demonstrated that theimplementation of leverage type amplifiers [20], suitable tosolve the noise matching, can strongly degrade the SQLsensitivity of the ordinary single-mass DUAL detector[21].
C. Scaling formulas
The scaling formulas will be used throughout the paperto evaluate the sensitivity of detectors made by differentmaterials and with scaled dimensions. The scaling of thevibrational spectrum of a three-dimensional body, when itssize and/or material are changed, can be obtained by study-ing the Rayleigh quotient R of the system [22]. TheRayleigh quotient, based on the principle that a conserva-tive system vibrating at a natural frequency has maximumsystem kinetic energy equal to the maximum system po-tential energy, is a popular means of estimating frequenciesin linear undamped vibratory systems. A detailed treatmentshows that R has stationary points at the system eigen-functions wm, and these stationary values are the systemeigenvalues R�wm� � !2
m [23].Let us show now as the Rayleigh quotient is defined on a
free harmonic vibration of a three-dimensional elasticbody, with displacement modal function w�r� and naturalangular frequency !. The solution is expressed as a space xand time t dependent displacement function w�r�ei!t, and
DESIGN OF WIDEBAND ACOUSTIC DETECTORS OF . . . PHYSICAL REVIEW D 77, 062001 (2008)
062001-3
the maximum stored potential energy is
V �1
2
ZV�ij"ijdV; (15)
where the strain tensor " is defined as
"ij �1
2
�@wi@xj@wj@xi
�: (16)
If the body is made of a material isotropic and homoge-neous, the stress components�ij are given by Hooke’s law:
�ij � �"kk�ij 2�"ij; (17)
where the Lame coefficients � and � depend on thePoisson’s ratio �p and on the Young’s modulus Y of thematerial:
� �Y�p
�1 �p��1� 2�p�� �
Y2�1 �p�
: (18)
The kinetic energy associated with the displacementfunction w�r�ei!t is simply:
! 2T � !2 �2
ZV�wiwi�dV; (19)
where T is the so-called ‘‘kinetic energy functional’’ and� is the mass density. The Rayleigh quotient is defined asR � V =T and, if w�r� is a normal mode, has a stationarypoint in w�r� over the space of the possible solutions. Inother words, any function w0 obtained from a small varia-tion of w will give the same value of R at the first order.This value is exactly the eigenvalue of the mode !2:
! 2 �R �Y�
RV�
�p"kk�1�p��1�2�p�
�ij 1
�1�p�"ij�"ijdVR
V�wiwi�dV;
(20)
where Eq. (17) has been used to remove any dependence onthe stress �ij. The volume integrals in Eq. (20) are notmodified by the choice of Y and/or �, then the eigensolu-tion w�r� remains a stationary point of the Rayleigh quo-tient whatever the value of Y and/or �. On the contrary, thefunctional dependence on the Poisson’s ratio is more com-plex and there is no guarantee that the solution w�r�remains a stationary point if �p is changed. Moreover wecan see that, as the value of R simply scales as Y=�, thecorresponding natural frequency will scale as
���������Y=�
p.
The relation expressed by Eq. (20) is also useful toevaluate the effect of the scaling of the elastic body. Thesolution w��r� � w�r=a� describes a body uniformly ex-panded by a factor a. By changing the integration variablein Eq. (20), it can be shown that w��r� is a stationary pointof R with a natural frequency !� � !=a.
In the case of a solution with cylindrical symmetry, it isalso easy to show that R is independent of the length of thecylinder. Then, in our cylindrical detectors, the angularfrequencies of the modes with cylindrical symmetry scale
according to the simple relation
!�m!m�v�svs
1
ar; (21)
where !m, vs, and !�m, v�s are the original and the scaledvalues of the angular frequency and of the material’s soundvelocity, respectively. Here ar is the radial scaling factor.
On the basis of these relations, it is straightforward toevaluate the scaling law for the transfer functions [Eqs. (4)and (5)], in the hypothesis of constant value of thePoisson’s ratio and loss angle independent of the fre-quency. The transfer functions for the scaled system aregiven as:
H�GW�!� � arHGW
�!arvsv�s
�(22)
and
T�BA�!� �YY�
1
aLTBA
�!arvsv�s
�; (23)
where aL is the scaling factor of the cylinder length L.According to Eq. (14), the power spectrum density at theSQL is
S�hh�!� �YY�
1
aLa2rShh
�!arvsv�s
�; (24)
while the scaled optimal value for the readout noise stiff-ness is
k��!� �aLY
�
Yk�!arvsv�s
�: (25)
D. Test mass coupled to a capacitive-SQUID readout
In this section we describe how the sensitivity of anacoustic GW detector is affected by a realistic readout,made by a capacitive transducer followed by a SQUIDamplifier. A basic scheme of such kind of readout is shownin Fig. 1. The capacitive transducer must be designed inorder to implement a selective readout, defined by a prop-erly chosen weight function P�r� [13]. The coordinate X ofthe test mass is assumed to be equal to the average gap ofthe capacitive transducer over the sensing region. This istrue in the case of parallel plates. The basic linear equa-tions which describe the coupling between a mechanicaland an electrical system through a capacitive transducer,biased with static electric field E0, are [24]
V�t� � E0X�t� (26)
and
FBA�t� � E0Q�t�: (27)
Equation (26) represents the voltage induced in the elec-trical circuit by a mechanical displacement X, whileEq. (27) represents the back-action force acting on the
PAOLA LEACI et al. PHYSICAL REVIEW D 77, 062001 (2008)
062001-4

mechanical system due to a charge Q induced on thecapacitor by the electrical circuit (for more details seeAppendix A).
Following the method of the normal mode expansion,we write down the equations of motion of the test massnormal modes in the frequency domain, taking into ac-count through Eq. (27) the coupling to the electrical circuit:
M��!2 !2m i!
2m�m�!��~qm�!�
� �12�!
2�m~h�!� �mE0
~Q�!� ~Fth�m�!�: (28)
Here, qm represents the amplitude of the mth normalcoordinate. In the right-hand side of Eq. (28) there are 3driving terms. The first one is the GW effect, with thecoefficients �m defined by
�m �ZVdVW�r� � wm�r�: (29)
The second one is the back-action term, proportional toE0
~Q�!� and to the coupling coefficient �m between themth mode and the readout, i.e., the displacement concen-tration [see Eq. (11)]. We note that �m and �m depend onlyon the geometry of the test mass and on the choice of thesensing surface, but not on the electrical circuit parameters.The third driving term is the thermal noise force Fth�macting on the coordinate qm. Its power spectral density ispredicted by the fluctuation-dissipation theorem to be
SFth�m�!� � 4kBTM!2
m�m�!�!
: (30)
Let us discuss the electrical part of the system. Theforward (mechanical to electrical) coupling, expressed byEq. (26), can be rewritten in terms of the normal coordi-nates qm as
V�t� � E0
Xm
�mqm�t�: (31)
In general, if the electrical circuit is read by a SQUIDcurrent amplifier, it is convenient to exploit the LC reso-nance formed by the transducer capacitor C and the in-ductive part of the circuit. In particular, in order tomaximize the noise stiffness of the readout, it is necessaryto move the LC resonance frequency close to the designsensitivity band [9]. Because of the small value of thetypical input inductance Li of practical dc SQUIDs, thetuning can be achieved only by interposing a low-losssuperconducting matching transformer, as shown inFig. 1. The effective inductance of the circuit is given byLr � Lp �M2
tr=Lt, where Lt � Ls Li and the inductan-ces Lp, Ls, Mtr, and Li are shown in Fig. 1. The effectiveelectrical resonance frequency is given by �el �!el=�2� � �2
���������LrCp
��1, and the electrical quality factoris Qel � !elLr=R. The equations of motion of the electri-cal circuit with the intermediate transformer can be written,in the frequency domain, as
8>>>><>>>>:��!2Lp i!R
1C�
~Q�!2Mtr~Qs � E0
Pm
�m~qm ~V th
�!2Mtr~Q�!2Lt ~Qs � ~Vn
~I � ~In i! ~Qs:
(32)
The independent variables are the AC charge on the ca-pacitor Q, the charge on the secondary circuit Qs and thetotal current I measured by the amplifier, which is the sumof the physical current Is � _Qs and the additive equivalentnoise current In, with spectral density SIn . In addition to themechanical signal and noise, coupled to the electricalcircuit through E0, we have two electrical noise drivingterms: the voltage thermal noise of the electrical circuit Vth,with power spectral density SVth
� 4kBTR and the voltageback-action noise of the SQUID amplifier Vn, with spectraldensity SVn .
Equations (28) and (32) constitute a set of linear sto-chastic differential equations, which can be solved to yieldthe total measured SQUID input current I, as function ofthe different signal and noise driving terms. To obtain thesensitivity of the system as detector of GWs, one has todivide the total measured current noise by the transferfunction IGW�!� � ~I�!�=~h�!�, which converts an inputGW of amplitude ~h�!� to a SQUID input current ~I�!�.Equations (28) and (32) constitute an extremely large set ofequations, that can be numerically solved only on a finitesubset of normal modes. An approximate solution at lowfrequency can be obtained by considering the first Nmodes, with N properly chosen in order to achieve asatisfying convergence. Thanks to the selective readout,the transfer functions are well reproduced by taking intoaccount only the normal modes up to the maximum fre-
Vn
In
C,E0X
Vth QsMtr
Ls
Li
R SQUID
Lp
Q
FIG. 1. Electrical scheme of a displacement sensor based on acapacitive transducer and a SQUID amplifier. A displacement Xmodifies the capacitance C of the transducer, charged with astatic field E0. The induced electrical current is finally measuredby the SQUID current amplifier. The intermediate transformer,with primary, secondary, and mutual inductance Lp, Ls, and Mtr,is required to match the low input inductance Li of a dc SQUIDto the large output impedance of the capacitive transducer. _Q and_Qs are the currents in the primary and secondary coils, and the
resistor R represents the total dissipation of the circuit. Theelectrical noise sources are the additive current noise, In, theback-action voltage noise Vn of the SQUID amplifier, and thethermal voltage noise Vth related with the dissipation of theelectrical circuit.
DESIGN OF WIDEBAND ACOUSTIC DETECTORS OF . . . PHYSICAL REVIEW D 77, 062001 (2008)
062001-5
quency of interest, plus a few higher order modes amongthose geometrically selected by the readout.
III. DETECTOR DESIGN
The test mass of an acoustic detector can be suitablyshaped to achieve the noise matching condition with apractical readout. In this section we propose a new designof a cylindrical detector in which the noise matchingcondition is achieved by means of displacement concen-trators integrated in the test mass. We show that the result-ing sensitivity is comparable to that of an ordinary single-mass DUAL detector. Moreover, the SQL sensitivity of thenew design can be closely approached by using practicalreadout configurations. We demonstrate this by using acapacitive-SQUID readout, evolution of those currentlyunder development for resonant detectors [25].
A. Displacement concentrators and selective readout
The test mass design we propose is a substantialprogress over the single-mass DUAL detector [13] in twofundamental aspects. In particular, wideband mechanicalamplifiers are integrated in the test mass and the dynamicsis optimized in order to exploit more modes with favorablecross-section to GWs.
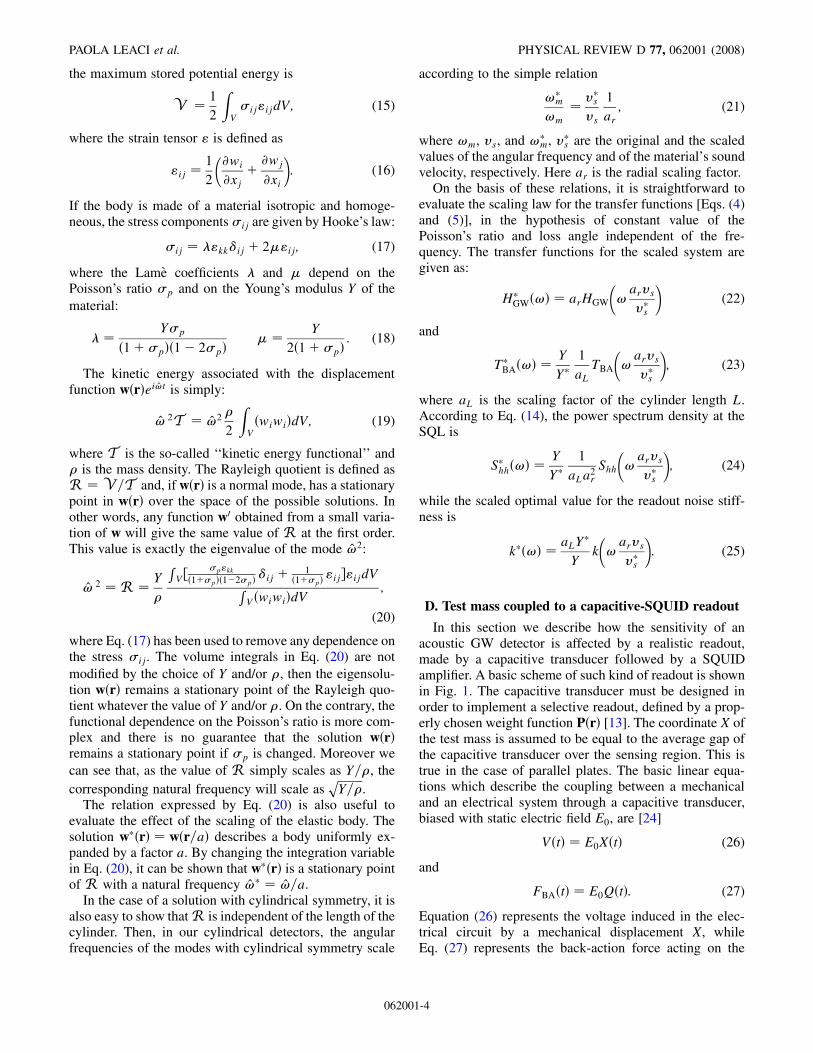
In order to achieve the noise matching, the neededmechanical amplification of the deformation at the sensingsurface is about a factor 15–30 with respect to the con-figuration proposed in Ref. [13]. In a conventional resonantdetector this is usually done by means of a resonant trans-ducer with mass much smaller than the one of the test mass[7,26]. This approach however cannot ensure the widebandamplification needed here. An alternative solution toachieve wideband mechanical amplification was proposedlong time ago [15], and consists in using tapered elements,the so-called whips. In a whip, the section is progressively(linearly in the simplest version) decreased moving to-wards its end [see Fig. 2(a)]. A whip behaves as a trans-verse displacement concentrator. The large base ofthickness h1 is attached to the test body, whose motion isto be amplified, while the other end, of smaller thicknessh2, is left free to move.
The numerical solution of a simple model of the system,based on the Euler-Bernoulli equation [15], shows thatsuch an element provides a conventional resonant amplifi-cation in correspondence of the whip transverse standingwaves, plus a wideband amplification exclusively due tothe geometrical tapering [see Fig. 2(b)]. The latter effect isa consequence of the decrease of the linear mass densitymoving towards the whip end. In particular, the minimumgain between two consecutive resonances is proportional tothe whip-ratio �h1=h2�
3=4. Therefore, a suitable use of awhip element can provide a wideband mechanical ampli-fication between two consecutive whip modes.
As the whips can easily provide a transverse amplifica-tion with respect to their base, we developed test mass
configurations with external tangential sensing, instead ofthe internal radial sensing required by the ordinary single-mass DUAL [13]. Two representative configurations areshown in Figs. 3(b) and 3(c). Four main grooves are carriedout in the external surface to allow tangential motion incorrespondence of the four sensing regions. The profile ofthe test mass in correspondence of the four main grooves isthen tapered to form four pairs of faced whips, whichprovide mechanical amplification of the cylinder tangentialmotion. The 8 additional secondary grooves have the onlypurpose of tuning the frequency of the quadrupolar modesof interest. The whips are designed in order to place thefrequencies of the quadrupolar modes of interest of themain body between the frequencies of the first and secondmode of the whips. The resulting overall mechanical am-plification, with respect to the internal radial deformation,is of about 15 and 30 for the configurations in Figs. 3(b)and 3(c), respectively.
The readout senses the differential motion of the ends ofthe four pairs of whips (see Fig. 4). The signals from the 4sensing gaps are combined with quadrupolar symmetry tomaximize the response to GW sensitive modes and toreject the effect of other modes. To achieve this condition,the readout has to measure the combination X�t� � d1;2 d3;4 � d5;6 � d7;8, where di;j is the distance between the ithand jth surfaces (shown by the black segments on the tip ofeach whip in Fig. 4). As a comparison, Fig. 4 shows also
h1h2
LW
Y1 Y2
(a)
0 2000 4000 6000 80001
10
100
1000
|Y2/Y
1|
Frequency (A.U.)
(b)
FIG. 2. (a) Simple whip element with linear profile and basicoperation principle as mechanical amplification stage. If thebase, of thickness h1, is moved transversely by Y1, the freeend, of smaller thickness h2, will move by Y2. (b) The mechani-cal gain jY2=Y1j, as function of the frequency, exhibits conven-tional resonances, corresponding to the standing transversewaves, plus a wideband gain between two consecutive reso-nances. The resonance frequencies scale as the ratio h1=L
2W ,
while the minimum value of the off-resonance gain is roughlygiven by �h1=h2�
3=4 [15].
PAOLA LEACI et al. PHYSICAL REVIEW D 77, 062001 (2008)
062001-6

the sensing areas on the inner hole originally proposed inRef. [13] for the ordinary single-mass DUAL.
The resulting weight function P�r� is normal to thereading surface. We chose to normalize P�r� on a singlereading surface S. Therefore, the weight function has thevalue 1=S for the surfaces 1, 2, 3, 4, and �1=S for thesurfaces 5, 6, 7, 8. Outside this domain it goes to zero, sincethe border effects can be neglected [27].
By simulating gravitational signals propagating alongthe symmetry axis of the cylinders shown in Fig. 3, weevaluated their responses and calculated the strain noisepower spectral densities, following the guidelines ofSec. II. In particular, in order to simulate the transferfunction HGW�!�, the GW equivalent force, correspondingto an optimal polarization, was applied on the volume ofbody. The transfer function TBA�!� was evaluated byapplying an external force on the readout surfaces. Allthe simulations were performed by a three-dimensionalFEM harmonic analysis by using the ANSYS code [28].The FEM solver evaluates the transfer functions from thedisplacement averaged over the readout surfaces accordingto the weight function used for our measurement strategyand detection scheme. Here we assume, for simplicity, areadout with frequency independent noise properties: �0,the noise energy, and k0, the readout noise stiffness thatmust be properly matched to the detector mechanical stiff-ness. This is achieved selecting, by visual inspection, the k0
which makes the flattest sensitivity within the entirebandwidth.
The assumption of a constant noise stiffness is a goodapproximation of wideband real world transducers. Theresulting spectral sensitivity depends on the k0 value and itoccurs that a different choice of k0 can improve the sensi-tivity at some frequencies at the cost of a deterioration atother frequencies. Actually, the true SQL spectral sensi-tivity would be achieved by using a quantum limited read-out with a frequency dependent noise stiffness describedby Eq. (10), i.e., optimized to the back-action transferfunction at each frequency.
In Table I we report the cylinder geometrical parametersand the used material. We will explain our choices of L inAppendix B, where different cylinder lengths arecompared.
1 2
3
57
4
8
1d
2d 6
FIG. 4. Measurement readouts that geometrically select thequadrupolar modes of the cylindrical detector. The internalreadout (d1 � d2) was proposed for the single-mass DUALconfiguration [see Fig. 3(a)]. The external readout, exploitingthe displacement amplification provided by the whips, is used forthe tapered configurations in Figs. 3(b) and 3(c). The sensingsurfaces are indicated by the black segments on the tip of eachwhip (1-8). The readout measures X�t� � d1;2 d3;4 � d5;6 �
d7;8, where di;j is the distance between the ith and jth tips.
(a) (b)
(c)
FIG. 3. Different configurations of a hollow cylindrical detec-tor: (a) ordinary single-mass DUAL [13] which is sensitivebetween the first two quadrupolar modes of the hollow cylinder;(b) cylinder with grooves and whips ensuring a mechanical gainof 15 with respect to the configuration in the panel (a). Itssensitivity bandwidth is determined by the first two quadrupolarmodes and the first two whip transverse modes, but its resultingbandwidth is narrower than that of a single-mass DUAL;(c) cylinder with grooves and whips ensuring a mechanicalgain of 30 with respect to the configuration in the panel (a). Itexploits one additional mode with good cross-section to GWwith respect to the configuration in the panel (b) and its resultingbandwidth is as wide as that of a single-mass DUAL. Thedrawings are not in scale and the geometrical parameters usedfor the simulations in Sec. III are reported in Table I.
TABLE I. Geometrical parameters used for the FEM simula-tions of the molybdenum (Mo) cylinders in Fig. 3. We indicatethe cylinder outer and inner radii, its length and mass with rext,rint, L and M, respectively; rext does not include the displace-ment concentrators. The resulting noise stiffness required tomatch the readout (k0) is also reported. The material qualityfactor is assumed Q � 107 [29].
rext (m) rint (m) L (m) M (ton) k0 (N/m)
panel (a) 0.5 0.15 3 22 1:7 1011
panel (b) 0.5 0.08 1.7 13.4 5:0 108
panel (c) 0.35 0.091 1.19 4.4 5:6 107
DESIGN OF WIDEBAND ACOUSTIC DETECTORS OF . . . PHYSICAL REVIEW D 77, 062001 (2008)
062001-7
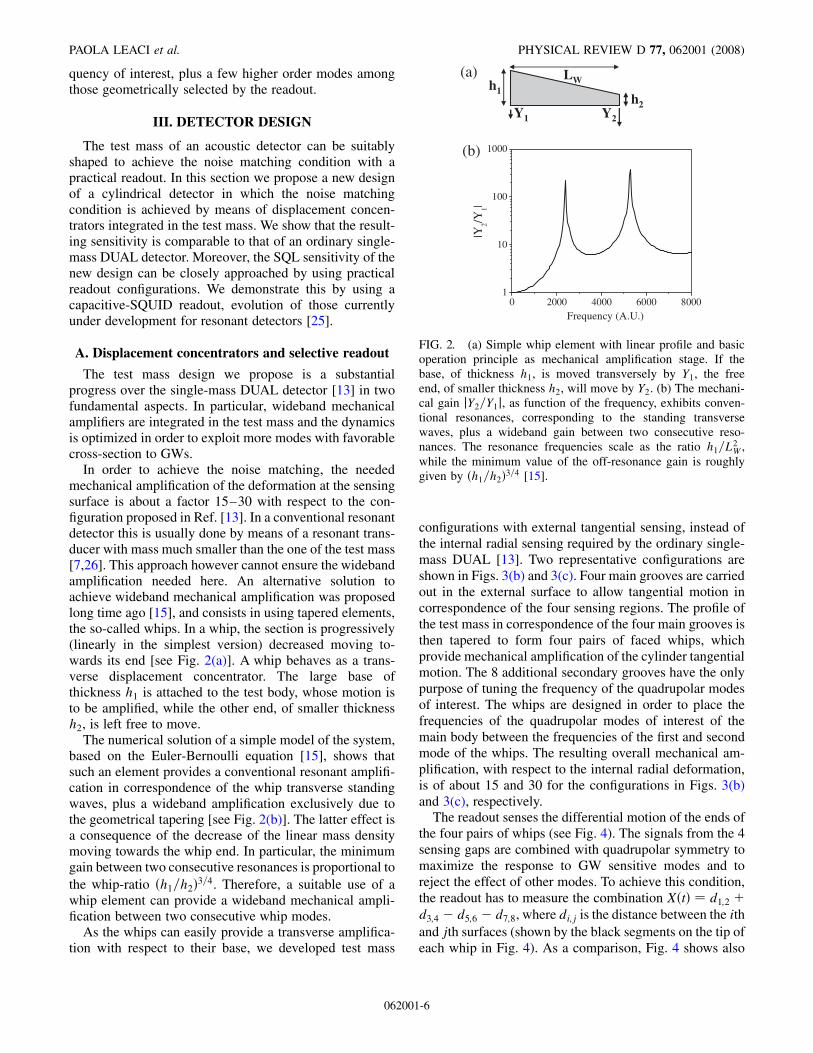
B. Design of tapered cylindrical test masses
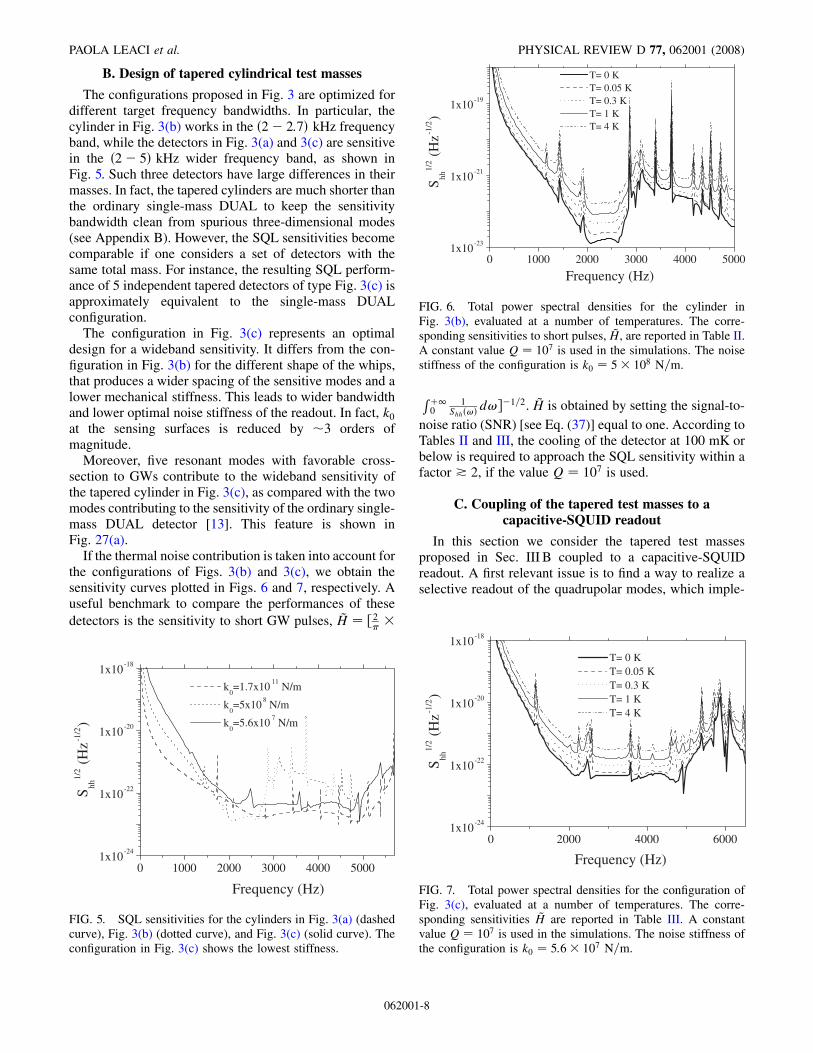
The configurations proposed in Fig. 3 are optimized fordifferent target frequency bandwidths. In particular, thecylinder in Fig. 3(b) works in the �2� 2:7� kHz frequencyband, while the detectors in Fig. 3(a) and 3(c) are sensitivein the �2� 5� kHz wider frequency band, as shown inFig. 5. Such three detectors have large differences in theirmasses. In fact, the tapered cylinders are much shorter thanthe ordinary single-mass DUAL to keep the sensitivitybandwidth clean from spurious three-dimensional modes(see Appendix B). However, the SQL sensitivities becomecomparable if one considers a set of detectors with thesame total mass. For instance, the resulting SQL perform-ance of 5 independent tapered detectors of type Fig. 3(c) isapproximately equivalent to the single-mass DUALconfiguration.
The configuration in Fig. 3(c) represents an optimaldesign for a wideband sensitivity. It differs from the con-figuration in Fig. 3(b) for the different shape of the whips,that produces a wider spacing of the sensitive modes and alower mechanical stiffness. This leads to wider bandwidthand lower optimal noise stiffness of the readout. In fact, k0
at the sensing surfaces is reduced by �3 orders ofmagnitude.
Moreover, five resonant modes with favorable cross-section to GWs contribute to the wideband sensitivity ofthe tapered cylinder in Fig. 3(c), as compared with the twomodes contributing to the sensitivity of the ordinary single-mass DUAL detector [13]. This feature is shown inFig. 27(a).
If the thermal noise contribution is taken into account forthe configurations of Figs. 3(b) and 3(c), we obtain thesensitivity curves plotted in Figs. 6 and 7, respectively. Auseful benchmark to compare the performances of thesedetectors is the sensitivity to short GW pulses, ~H � �2
R10
1Shh�!�
d!��1=2. ~H is obtained by setting the signal-to-noise ratio (SNR) [see Eq. (37)] equal to one. According toTables II and III, the cooling of the detector at 100 mK orbelow is required to approach the SQL sensitivity within afactor * 2, if the value Q � 107 is used.
C. Coupling of the tapered test masses to acapacitive-SQUID readout
In this section we consider the tapered test massesproposed in Sec. III B coupled to a capacitive-SQUIDreadout. A first relevant issue is to find a way to realize aselective readout of the quadrupolar modes, which imple-
0 1000 2000 3000 4000 50001x10
-24
1x10-22
1x10-20
1x10-18
Frequency (Hz)
Shh
1/2 (
Hz-1
/2)
k0=1.7x10
11 N/m
k0=5x10
8 N/m
k0=5.6x10
7 N/m
FIG. 5. SQL sensitivities for the cylinders in Fig. 3(a) (dashedcurve), Fig. 3(b) (dotted curve), and Fig. 3(c) (solid curve). Theconfiguration in Fig. 3(c) shows the lowest stiffness.
0 1000 2000 3000 4000 50001x10
-23
1x10-21
1x10-19
T= 0 K T= 0.05 K T= 0.3 K T= 1 K T= 4 K
Shh
1/2 (
Hz-1
/2)
Frequency (Hz)
FIG. 6. Total power spectral densities for the cylinder inFig. 3(b), evaluated at a number of temperatures. The corre-sponding sensitivities to short pulses, ~H, are reported in Table II.A constant value Q � 107 is used in the simulations. The noisestiffness of the configuration is k0 � 5 108 N=m.
0 2000 4000 60001x10
-24
1x10-22
1x10-20
1x10-18
T= 0 K T= 0.05 K T= 0.3 K T= 1 K T= 4 K
Shh
1/2 (
Hz-1
/2)
Frequency (Hz)
FIG. 7. Total power spectral densities for the configuration ofFig. 3(c), evaluated at a number of temperatures. The corre-sponding sensitivities ~H are reported in Table III. A constantvalue Q � 107 is used in the simulations. The noise stiffness ofthe configuration is k0 � 5:6 107 N=m.
PAOLA LEACI et al. PHYSICAL REVIEW D 77, 062001 (2008)
062001-8

ments the weight function P�r� introduced in Sec. III A. Apossible solution is shown in Fig. 8, and consists in a seriesconnection of four identical capacitors, each one of capaci-tance 4C. The capacitor plates are placed at the end of twofaced whips, and the variable gap of each capacitor isconstituted by the distance between the plates. The capaci-
tors must be alternately charged with a static bias fieldE0
or �E0, where the sign corresponds to the voltage dropacross the capacitor measured in the direction of the arrowin Fig. 8. In principle, this can be achieved without anyadditional component, because each capacitor acts as adecoupling capacitor for the following or precedingcapacitor.
The AC voltage signal across the series of the fourcapacitors is given, at first order in the capacitor averagedgap variation di;j, by
V�t� � E0�d1;2 d3;4� � E0�d5;6 d7;8� � E0X�t�: (33)
At the same time, if an AC charge Q�t� is induced by theelectrical circuit on the series-connected capacitors, thesame charge Q will appear on each single capacitor. Thisgenerates a force F � �E0Q onto the plates of the capaci-tor, where the sign holds for the capacitor 1, 2, 3, 4, andthe sign � for the capacitor 5, 6, 7, 8. More precisely, theback-action force acting on the test mass can be written inthe following compact form:
F BA�r; t� � E0Q�t�P�r�: (34)
Therefore we can identify E0Q�t� as the scalar back-actionforce FBA�t� [see Eq. (27)].
Now we can make explicit calculations of the sensitivityof the test mass–readout system for some test mass con-figurations by using the method described in Sec. II D. Weuse a set of fixed parameters, listed in Table IV. Moreover,for a given test mass, we modify two parameters, theelectrical bias field E0 and the electrical circuit resonancefrequency �el, which fixes the value of the primary induc-tance Lp. This allows us to make a rough sensitivityoptimization; �el is placed roughly at the midpoint of thesensitivity band. However, the sensitivity curve dependsquite weakly on �el, at least for variations up to 20%. E0 isset to the lowest value required to make the final sensitivitycurve reasonably flat. The corresponding approximatednoise stiffness E2
0C (see Appendix A) is roughly half theoptimum noise stiffness obtained by using the generic idealreadout.
TABLE III. Pulse amplitude ~H obtained with unitary SNR forthe sensitivity curves shown in Fig. 7.
Temperature (K) ~H (Hz�1)
0 3:6 10�25
0.05 5:7 10�25
0.3 1:0 10�24
1 1:7 10�24
4 3:3 10�24
TABLE II. Pulse amplitude ~H detected with unitary SNR forthe sensitivity curves plotted in Fig. 6.
Temperature (K) ~H (Hz�1)
0 2:7 10�25
0.05 4:5 10�25
0.3 9:1 10�25
1 1:6 10�24
4 3:1 10�24
+-
-+
+-+-
8
SQUID
1 2
3 4
6
7 5
FIG. 8 (color online). Possible reading scheme of the taperedcylinder by means of a capacitive transducer. There are 4 sensingregions, each one in correspondence to the end of a pair ofwhips. A capacitor is formed in each sensing region, and the 4capacitors are connected in series. Assuming equal average gaps,the same static bias field E0 can be stored in each capacitor, withalternate sign. This scheme allows a selective readout of thequadrupolar modes of the test mass implementing the optimalweight function P�r�.
TABLE IV. Common parameters used for the electromechani-cal numerical simulations. See Fig. 1 for the description ofelectrical components.
Parameter Value
T 50 mK�m 10�7
C 5 10�9 FQel 2 106
Ls 5:1 10�6 HMtr=
�����������LpLs
p0.9
Li 1:6 10�6 H�In LiSIn=2 1 @
�Vn SVn=�2!2Li� 1 @
DESIGN OF WIDEBAND ACOUSTIC DETECTORS OF . . . PHYSICAL REVIEW D 77, 062001 (2008)
062001-9

The sensitivities of the test masses described inFigs. 3(b) and 3(c), equipped with a capacitive-SQUIDreadout, are comparable with the analogous configurationsequipped with a quantum limit readout (see Figs. 9 and 10,respectively). In particular, even though the resulting noisespectrum is not so much flat over the bandwidth, thesensitivity to short GW bursts is only about
���2p
higher.As shown in Figs. 9 and 10, it occurs that at some
frequencies the noise spectrum of a tapered cylinderequipped with a capacitive-SQUID readout is lower thanthe quoted SQL noise. This is not a paradox because thequoted SQL refers to a quantum limited readout with theconstraint of a constant noise stiffness k0, which makes itworse than the true quantum limit. Therefore, a readoutwith a different noise stiffness might perform better atsome frequencies and worse at others.
The most critical parameters are the energy sensitivity ofthe SQUID amplifier (�In ; �Vn) at 1 @, close to the quantumlimit value, the electrical quality factor Qel � 2 106 andthe bias field E0 � 1 108 V=m. The last two values areclose to those achieved by state-of-the-art technology,while a factor 10 improvement is required on the energysensitivity of the SQUID amplifier demonstrated in astrongly coupled configuration. However, no one of thesegoals is out of reach within current R&D programs. Greatervalues of E0 produce flatter sensitivity curves, but they arenot potentially achievable. The thermal noise is computedassuming T=Q � 5 10�9 K (which can be achievedwith a low-loss material at T < 1 K), an effective electricalfrequency �el � 2420 Hz in Fig. 9, and equal to 3630 Hz inFig. 10.
For comparison, we show in Fig. 11 the sensitivities ofthe ordinary single-mass DUAL depicted in Fig. 3(a),
equipped with a quantum limit readout and with acapacitive-SQUID readout. For the latter case we considerboth a realistic readout configuration as in Fig. 10 and anunrealistic one with a bias field E0 � 3 109 V=m. Acomparison of Figs. 9 and 10 with Fig. 11 clearly showsthe most relevant advantage of the new tapered conceptdesign with displacement concentrators: the requirementson the readout parameters are much more relaxed, so thatthe SQL sensitivity can be approached with the state-of-the-art transducers.
0 1000 2000 3000 4000 5000 60001x10
-23
1x10-21
1x10-19
Frequency (Hz)
S
hh
1/2 (
Hz-1
/2)
FIG. 10. Sensitivities for the detector in Fig. 3(c). Solid curve:the detector is equipped with a capacitive-SQUID readout, E0 �6:5 107 V=m, �el � 3630 Hz and the other parameters as inTable IV; ~H � 8:2 10�25 Hz�1. Dotted curve: the detector isequipped with a quantum limited readout, k0 � 5:6 107 N=m;~H � 5:7 10�25 Hz�1.
0 1000 2000 3000 4000 50001x10
-23
1x10-21
1x10-19
1x10-17
S
hh
1/2 (
Hz-1
/2)
Frequency (Hz)
FIG. 9. Sensitivities for the cylinder in Fig. 3(b). Solid curve:the cylinder is equipped with a capacitive-SQUID readout, E0 �1:4 108 V=m, �el � 2420 Hz and the other parameters as inTable IV; ~H � 6 10�25 Hz�1. Dotted curve: the cylinder isequipped with a quantum limited readout, k0 � 5 108 N=m;~H � 4:5 10�25 Hz�1.
0 1000 2000 3000 4000 5000 60001x10
-24
1x10-22
1x10-20
1x10-18
Frequency (Hz)
S
hh
1/2 (
Hz-1
/2)
FIG. 11. Sensitivities for the ordinary single-mass DUAL[Fig. 3(a)]. Solid curve: capacitive-SQUID with same realisticparameters as in Fig. 10; ~H � 1:7 10�24 Hz�1. Dotted curve:capacitive-SQUID with same parameters, but with an unrealisticelectrical field �3 109 V=m; ~H � 2:8 10�25 Hz�1. Dashedcurve: quantum limited readout, k0 � 1:7 1011 N=m; ~H �1:3 10�25 Hz�1.
PAOLA LEACI et al. PHYSICAL REVIEW D 77, 062001 (2008)
062001-10

IV. SELECTED SCIENCE CASES
In the following we discuss a few different detectorconfigurations, targeted to different science cases. Thedirectional response of tapered cylinders to GWs resultsidentical to that of an interferometric detector with two 90�
arms. We focus on the optimal design of tapered detectorsfor two different frequency bandwidths and estimate theSNR for GW sources as merging binary neutron stars(NSs) and black holes (BHs).
A. Directional response
We computed the transfer function HGW�!� of the ta-pered detector by three-dimensional FEM evaluations, as-suming that a plane gravitational wave is arriving from thedirection �; ’� with an arbitrary polarization . The de-pendence of HGW�!� from the wave direction and polar-ization is usually described by the antenna pattern. This isa function of , ’, , computed for each frequency as
F�; ’; � �jHGW�!�j
maxfjHGW�!�jg; (35)
where maxfjHGW�!�jg indicates the maximum value of themodulus of HGW�!� over , ’, .
The detector antenna patterns to the two independentpolarization components of the GW (plus � 0 and cross � =4) are shown in Figs. 12 and 13, respectively. Bothresponses are equal to those of an interferometric GWdetector, with arms oriented along the X and Y axes.
The angles and ’ are the usual spherical-polar coor-dinates, representing the wave travelling direction, as mea-sured in the detector reference frame, where is the anglewith the axis of the cylinder and ’ � 0 is a semiplane
cutting between two faced whips. Figures 12 and 13 showthe antenna pattern also in terms of Cartesian coordinates,
8><>:X � F sin�� cos�’�
Y � F sin�� sin�’�
Z � F cos��;
(36)
where the symbol F represents the modulus of F�; ’; �.In particular, it is indicated as jFj and jFj for the pluspolarization component (see Fig. 12) and for the crosspolarization component (see Fig. 13), respectively.Similarly, a tapered cylinder, rotated by 45� in the XYplane with respect to the first detector, will exhibit analo-gous response functions, F and F, but rotated along ’by =4.
To improve the antenna pattern characteristics, it isconvenient to consider a composite detector made by twocolocated tapered detectors with parallel cylindrical axesand rotated in the XY plane by =4 with respect to eachother. This composite detector would need a housing largerby just a few cubic meters. The advantages of such combi-nation include the fact that no blind directions are presentfor circularly polarized signals, as can be seen by quadrati-cally averaging the responses to � 0 and � =4, withthe resulting antenna patterns shown in Figs. 14(a) and14(b), respectively. The composite detector is blind only tothe cross polarization component of the GW propagating inthe XY plane ( � =2) [see Fig. 14(c)].
These features of the antenna pattern are the same of theordinary single-mass DUAL [13].
B. Optimal tapered configurations
In Sec. III we considered as standard material the Mo,for which the low dissipation factor and the good cross-section to GWs are well characterized [29]. However, there
FIG. 13. As in Fig. 12, but for cross polarized GWs.
FIG. 12. Detector response function: (a) in Cartesian coordi-nates and (b) in spherical-polar coordinates, for cylindersequipped with whips [see Figs. 3(b) and 3(c)]. In the panel (a),the distance from a point of the plot surface to the center of thebox is just a measure for the GW sensitivity in this direction [seeEqs. (36)]. This plot refers to plus polarized waves.
DESIGN OF WIDEBAND ACOUSTIC DETECTORS OF . . . PHYSICAL REVIEW D 77, 062001 (2008)
062001-11

are several known materials with a cross-section to GWsconsiderably higher than that of Mo. Most of them, like forinstance diamond, sapphire, or monocrystal SiC, are not arealistic alternative because they cannot be manufacturedin large samples using existing technology at reasonablecost. A more realistic choice is C/SiC. This material is aspecial form of SiC ceramic, that offers design freedomsince it can be manufactured in monoblocks of relativelycomplex shapes [30]. A possible critical issue of C/SiC isits intrinsic dissipation at ultralow temperature, which iscurrently under investigation. In the following we assumean optimistic value Q � 107.
The sensitivities for C/SiC tapered cylinders were ob-tained by scaling (see Sec. II C) the sensitivity curves of theMo tapered configuration in Fig. 3(c) [31]. We considered2 detector configurations sensitive in different frequencyranges: a high frequency range [HF� �2� 5� kHz], and alower frequency range [LF� �1:1� 2:6� kHz]. The HFand LF configurations are targeted to sources such as the
NS-NS merger or the BH-BH merger, as discussed in thefollowing section. The resulting spectral sensitivities areshown in Fig. 15 for different operating temperatures. Thedetector parameters are reported in Table V. The gain insensitivity of the C/SiC material with respect to Mo is afactor �1:5 in the strain sensitivity.
As results from Fig. 15, the LF massive configurationsproduce spectral sensitivities in terms of strain better thanthose of the HF detectors. However, the mass of these HFdetectors is�4 ton, a figure which would allow us to housemany such detectors in small research infrastructures atdifferent locations. Then, a proper joint data analysis fromsuch potentially independent detectors would allow us toobtain a more reliable identification of gravitational signalswith respect to a single massive detector.
C. Selected GW sources
Predicted h�t� waveforms have recently become avail-able for some potential sources of GWs in the frequencyrange of the proposed detectors: in particular, the merger ofNS binaries [33,34] and of BH binaries [35]. For bothsources we used the predicted numerical h�t� to computetheir SNR for the proposed detector configurations, assum-ing a source distance of 19 Mpc (Virgo cluster) and anincoming direction along the axis of the tapered cylinder.
We report here the optimal SNR, i.e., the one achievablewith a Wiener matched filter:
SNR �
����������������������������������������2
Z 10
j~h�!�j2
Shh�!�d!
s: (37)
The proposed configuration of a pair of identical taperedcylinders, rotated by 45� with respect to each other, allows
FIG. 14. (a) Antenna pattern jF;j obtained by quadraticallyaveraging the responses to � 0 waves of two tapered detec-tors, rotated by 45�. (b) Antenna pattern jF;j given by thequadratic average of the responses to � =4 waves of twotapered detectors, 45� apart. (c) Antenna patterns jF;j (solidline) and jF;j (dotted line) as functions of the angle.
0 1000 2000 3000 4000 5000 60001x10
-24
1x10-22
1x10-20
Shh
1/2 (
Hz-1
/2)
Frequency (Hz)
C/SiC; HF; T= 0 K Mo; HF; T= 0 K C/SiC; HF; T= 0.05 K C/SiC; LF; T= 0 K C/SiC; LF; T= 0.05 K
FIG. 15. Comparison among the sensitivity curves of taperedcylinders [see Fig. 3(c)], made of (i) Mo in the higher frequencyband (HF), (ii) C/SiC in a HF band, and (iii) C/SiC in a lowerband (LF). The effect of thermal noise is also shown.
PAOLA LEACI et al. PHYSICAL REVIEW D 77, 062001 (2008)
062001-12

us to measure both GW polarization components.Therefore, the resulting combined SNR is �SNR2
h
SNR2h�1=2, where SNRh; represents the SNR calculated
by considering only one wave polarization (plus or cross).Since all the considered sources give almost circularlypolarized signals, the combined SNR results greater thanthe SNRh; by a factor �
���2p
.
1. Merger of binary NSs
The main scientific interest on such sources relies in themerger and post-merger phases, which carry the informa-tion on the equation of state of the NS; therefore, weexcluded from our SNR computations the h�t� of thepreceding inspiral phase. In the following we considerthree models for the NS-NS merger.
According to Ref. [33], a hypermassive NS of ellipsoidalshape can be formed after the merger of two NSs of 1.3solar masses each (model APR1313 [33]). As a conse-quence, a long transient of GWs with an approximatelyconstant frequency of about 3.2 kHz is released [33]. Theamplitudes for plus and cross polarized GWs, observed at adistance of 100 Mpc from this source, are plotted inFig. 16, assuming that the angular momentum of the sourceis aligned with the line of sight.
The resulting SNRs for circularly polarized GWs emit-ted from the APR1313 model, at an assumed distance of
19 Mpc, are shown in Fig. 17. They refer to the HF C/SiCsensitivity curves of Fig. 15, since the merger frequency of3.2 kHz is included in the frequency band of this configu-ration. In order to take into account the merger phase, butnot the inspiral, we used the plotted plus and cross compo-nents for APR1313 starting from 1.7 ms and 1.8 ms, re-spectively. According to Ref. [33], since the signal isexpected to last for 50 ms, significantly larger than thetime window of the available h�t� (see Fig. 16), we in-cluded in the reported SNR an improvement of a factor 2(� 51=2) with respect to the shorter waveform plotted inFig. 16.
We also consider different numerical predictions for themerger of NSs of 1.4 solar masses: A21414 and S1414[34], with a post-merger signal frequency of�2:7 kHz and�1:7 kHz, respectively. The amplitudes for plus and crosspolarized GWs, observed at a distance 100 Mpc from theA21414 and S1414 sources, are plotted in Figs. 18 and 19,respectively. According to Ref. [34], the merger phasestarts from 7.5 ms and 4.5 ms, respectively, and thereforewe considered the following part of their waveforms forour SNR computation. In addition, the authors report thatthe wave amplitude is underestimated by 40% in the post-merger phase. So, we included this suggested correction inour SNR estimate. The resulting SNRs are plotted inFig. 20.
For the A21414 source, the SNRs are calculated byconsidering the HF C/SiC sensitivity curves of Fig. 15,since the post-merger frequency of �2:7 kHz is includedin their frequency band. Similarly, for the S1414 source,the SNRs are estimated by using the LF C/SiC sensitivitycurves of Fig. 15, given the post-merger frequency of�1:7 kHz.
TABLE V. Geometrical parameters, mass and noise stiffnessof tapered Mo and C/SiC cylinders, relative to the sensitivitycurves of Fig. 15.
rext (m) rint (m) L (m) M (ton) k0 (N/m)
Mo; HF 0.35 0.091 1.19 4.4 5:6 107
C/SiC; HF 0.54 0.14 1.83 4.1 5:2 107
C/SiC; LF 1.02 0.26 3.47 28 1:0 108
0 2 4 6 8 10
-2,0x10⁻²²
-1,0x10⁻²²
0,0
1,0x10⁻²²
2,0x10⁻²²
h+
hx
h (t
)
APR1313
t (ms)
FIG. 16 (color online). Gravitational waveforms plus (h,solid line) and cross (h, dashed line) for the APR1313 model[33].
10-8
10-7
1
2
3
4
5
APR1313
SNR
at 1
9 M
pc
T/Q (K)
C/SiC; HF
FIG. 17. SNR for circularly polarized GWs emitted byAPR1313 source during the merger and post-merger phases, ata distance of 19 Mpc, for the HF C/SiC sensitivities of Fig. 15versus the thermal noise factor T=Q. The horizontal line, atSNR� 4:2, indicates the SNR achievable at the SQL, i.e.,neglecting the thermal noise contribution.
DESIGN OF WIDEBAND ACOUSTIC DETECTORS OF . . . PHYSICAL REVIEW D 77, 062001 (2008)
062001-13

In summary, a pair of HF C/SiC tapered cylinders,rotated by 45� (M � 4:1 ton each, T=Q� 5 10�9 K,dashed-dotted-dotted curve in Fig. 15), gives SNR� 3:2and �1:7 for the APR1313 and A21414 sources, respec-tively, at distance of 19 Mpc. Two LF C/SiC taperedcylinders at 45� (M� 28 ton each, T=Q� 5 10�9 K,dotted curve in Fig. 15), give SNR� 3:5 for the S1414source at 19 Mpc. These figures are comparable to thosecomputed for Advanced LIGO in Refs. [33,34]. To reachSNR� 6 [36] we would need 4, 12, and 3 pairs of suchtapered detectors for the APR1313, A21414, and S1414sources, respectively.
2. Merger of binary BHs
The GWs emitted by a merger of binary equal mass BHsare described in Ref. [35] (see Fig. 21). By scaling these
waveforms at the distance of 19 Mpc, we obtain a graph ofthe SNR for configurations of tapered C/SiC cylindersversus the two BHs total mass (see Fig. 22).
0 2 4 6 8 10 12 14 16 18-2,0x10
-22
-1,0x10⁻²²
0,0
1,0x10⁻²²
2,0x10⁻²²
h+
hx
S1414
h (t
)
t (ms)
FIG. 19 (color online). Gravitational waveforms plus (h,solid line) and cross (h, dashed line) for the S1414 model [34].
2 4 6 8 10 12-2,0x10
-22
-1,0x10⁻²²
0,0
1,0x10⁻²²
2,0x10⁻²²
A21414
h (t
) h
+
hx
t (ms)
FIG. 18 (color online). Gravitational waveforms plus (h,solid line) and cross (h, dashed line) for the A21414 model[34].
10-8
10-7
0
1
2
3
4
5
6
A21414
S1414
SN
R a
t 19
Mpc
T/Q (K)
CSiC; HF CSiC; LF
FIG. 20. The solid line refers to the SNRs for circularlypolarized GWs emitted by S1414 source at a distance of19 Mpc, for the LF C/SiC sensitivity curves of Fig. 15 versusthe thermal noise factor T=Q; the corresponding horizontal solidline, at about 5.2, indicates the SNR obtained neglecting thethermal noise contribution. The dashed line represents the SNRsfor circularly polarized GWs emitted by A21414 source at adistance of 19 Mpc, for the HF C/SiC sensitivity curves ofFig. 15 versus the thermal noise factor T=Q; the correspondinghorizontal dashed line, at �2:4, indicates the SNR obtainedwithout considering the thermal noise contribution. All SNRsare computed taking into account only the merger and post-merger phases.
0,0 0,2 0,4 0,6 0,8 1,0
-2,0x10⁻²²
-1,0x10⁻²²
0,0
1,0x10⁻²²
2,0x10⁻²²
h (t
)
t (ms)
h+
hx
FIG. 21 (color online). Gravitational waveforms plus (h,solid line) and cross (h, dashed line) for the merger of twoBHs at a distance of 100 Mpc: each BH has a mass of 0.5 solarmasses [35]. The waveforms can be considered reliable startingfrom 0.3 ms and consist of the chirp, merger, and ringdownphases.
PAOLA LEACI et al. PHYSICAL REVIEW D 77, 062001 (2008)
062001-14

For two merging BHs of total mass 12 solar masses, weobtain SNR ’ 33:5 for the LF C/SiC detector at SQL (solidcurve in Fig. 15). When a temperature of 0.05 K is con-sidered, the best SNR is equal to 18.5 for two merging BHsof total mass 10 solar masses. These values refer to pairs ofdetectors, rotated by =4 with respect to each other, M �28 ton each. For the HF C/SiC detectors of M � 4:1 ton,the highest SNR is 3.3 for binary BHs of total mass 6 solarmasses, neglecting the thermal noise contribution. When athermal noise factor T=Q� 5 10�9 K is considered, theSNR decreases to 2.1 for the same BH mass. Then, in orderto reach for this last case a SNR� 6, we need 8 couples ofsuch detectors.
V. CONCLUSIONS
The new design of the GW detectors described heresolves the problem of the noise mismatch between testmass and readout while keeping the wideband spectralperformances of the previous designs of single-massDUAL detectors of similar mass and material [13]. Thetapering of the test mass makes possible to exploit 5resonant modes at suitably spaced frequencies, all contrib-uting to the GW cross-section. Moreover, the whips am-plify the transverse displacement of the tapered detectorquadrupolar modes at the sensing surfaces by a factor 15–30 with respect to the single-mass DUAL model. Thisallows us to achieve the noise matching with a capacitivetransducer with realistic values of bias field and capaci-tance, �1 108 V=m and 5 10�9 F, respectively. Forthe first time the model of a wideband acoustic detector hasbeen completed by including a transducer system.
The dynamics of the detectors was simulated on thebasis of three-dimensional FEM numerical analyses, bycomputing the transfer functions to GW and back-actionforce. In particular, we demonstrated that the SQL sensi-tivity is not degraded by the decrease in noise stiffness, in
fact it is very close to the SQL curve obtained for theordinary single-mass DUAL configuration, having samedimensions and material.
In this work we also described how the configuration ofthe detector can be optimized as a function of the targetbandwidth of sensitivity. In particular, we considered twocase studies of tapered detectors: one operating in the��1:1� 2:6� kHz band and the other in ��2� 5� kHzband (see Fig. 15). For these configurations, the SQLsensitivity level is at �1:2 10�23 Hz�1=2 and �310�23 Hz�1=2, respectively.
We pointed out the advantages of considering a com-posite configuration made by twin detectors with parallelaxis but rotated by 45�: in fact such a configuration doesnot have blind directions. We also presented selected sci-ence cases for GW sources at the distance of the Virgocluster: NSs and BHs mergers. Above 2 kHz, the predictedperformances of such twin configurations are comparableto those of advanced interferometers. A further opportunityis to consider a small network of such detectors, so toincrease the reach, to improve the reliability of the observ-atory and help the rejection of local disturbances. Thisshould be easier for the target band at higher frequency,since each detector has smaller mass (� 4 ton). However,both for the proposed detectors and advanced interferome-ters, the expected detection rate is still very low. The NS-NS mergers are expected to occur �0:02 yr�1 within theVirgo cluster range [34] and the predictions for BH-BHmergers are even more rare than the binary NS events [37].Additional sources of GWs in the frequency band above1 kHz include quasinormal modes in newly born NSs [38].Despite the low detection rate, the interest on high fre-quency GWs is very high since they are a clue to theequation of state of matter at extreme densities.
Experimental investigations are in progress to demon-strate the feasibility on small scale prototypes and tocharacterize the mechanical dissipations of constructionmaterials at low temperatures.
ACKNOWLEDGMENTS
We are grateful to Massimo Cerdonio for fruitful andstimulating discussions. This work was supported byEuropean Community (project ILIAS, Contract No. RII3-CT-2004-506222), Provincia Autonoma di Trento (projectQL-Readout), European Gravitational Observatory (R&Dgrant ‘‘Wideband transducer for DUAL detector’’).
APPENDIX A: EQUIVALENT FORCE ANDDISPLACEMENT NOISE OF A CAPACITIVE
TRANSDUCER COUPLED TO A SQUIDAMPLIFIER
Let us consider a generic elastic test mass, whose de-formation is sensed by a readout composed of a capacitivetransducer followed by a dc SQUID as current amplifier.
2 4 6 8 10 12 14 16 18 20
1
10
LF; T=0 K LF; T=0.05 K HF; T=0 K HF; T=0.05 K
SN
R a
t 19
Mpc
Total Mass (solar masses)
FIG. 22. SNR at 19 Mpc for pairs of the C/SiC detectors(Fig. 15, Q � 107) versus the total mass of a two BHs system.
DESIGN OF WIDEBAND ACOUSTIC DETECTORS OF . . . PHYSICAL REVIEW D 77, 062001 (2008)
062001-15

The deformation of the test mass is described by theobservable X, according to Eq. (1). The back-action re-sponse of the test mass, as seen from the sensing port, isdescribed by the transfer function TBA�!� or by its inverse,the dynamical stiffness k�!�. In general, any linear dis-placement sensor, based on some kind of intermediatetransducer, can be replaced by an equivalent displacementamplifier, characterized by an additive displacement noisesource, xn, and a force noise source, fn. In addition, thetransducer modifies the effective response of the test massto an external force. In this section we derive an explicitexpression of ~xn, ~fn and of the modified stiffness k0�!�, forthe case of a capacitive transducer with a SQUID amplifier.
The circuit that we wish to analyze is shown in Fig. 23.As we are interested in determining the general propertiesof the capacitive-SQUID readout, we characterize the testmass with a generic dynamic stiffness k�!�, without anyother specification. Then, we rewrite the equation of mo-tion of the electromechanical system in the frequencydomain, without projecting on to the normal modes as inSec. II D:
k�!� �E0 0 0
�E0 �!2Lp i!R 1=C �!2Mtr 0
0 �!2Mtr �!2Lt 0
0 0 �i! 1
0BBBBB@
1CCCCCA �~X~Q~Qs
~I
0BBBBB@
1CCCCCA
�
~Fe~Vth
~Vn~In
0BBBBB@
1CCCCCA: (A1)
Here, the first equation in the system (A1) comes directlyfrom Eq. (27). Since we are only interested in finding theproperties of the readout, we include in the term ~Fe allexternal or internal forces acting on the test mass other thanthe transducer back-action. The other three equations in thesystem (A1) are directly derived from Eqs. (32).
Solving the system of linear Eqs. (A1) for the displace-ment ~X, we obtain
~X �1
k0� ~Fe ~fn�; (A2)
where we defined the modified stiffness k0�!� as
k0�!� � k�!� �E2
0
�!2Lr i!R 1=C; (A3)
the equivalent force noise
~f n � �� ~Vni!�
LtMtr
~V th
i!
�; (A4)
and the parameter ��!� as
��!� ��i!E0Mtr=Lt
�!2Lr i!R 1=C: (A5)
Solving Eqs. (A1) for the measured current ~I, we find
~I � �� ~X ~xn�; (A6)
where the equivalent displacement noise ~xn is defined by
~x n �1
�
�In
Vni!Lt
�!2Lp i!R 1=C
�!2Lr i!R 1=C
�i!VthMtr=Lt
�!2Lr i!R 1=C
�: (A7)
It is straightforward to verify that Eqs. (A2)–(A6) definethe sources xn and fn, and the modified stiffness k0 con-sistently with the equivalent circuit shown in Fig. 23.Moreover, we can interpret � as a transducer efficiency,as it represents the ratio of the measured current ~I to theeffective displacement ~X. We discuss briefly the details ofthe expressions of �, k0, ~fn, and ~xn. As regards k0, weobserve that the presence of the transducer loads the testmass with an additional stiffness, that becomes huge at theunloaded electrical resonance !el � �LrC��1=2, togetherwith the transducer efficiency �. In other words, for ! ’!el the coupling between the test mass and the SQUIDbecomes very large, but at the same time the transducer‘‘freezes’’ the motion of the test mass. As regards the forcenoise ~fn, it is composed of a term proportional to theSQUID voltage noise ~Vn, and a term proportional to theelectric thermal noise ~V th. Finally, the displacement addi-tive noise ~xn, besides a term coming from the SQUIDadditive noise, features also two terms deriving from thecurrent induced in the electrical circuit by the SQUIDvoltage noise ~Vn and by electrical thermal noise ~V th.These terms introduce an unavoidable correlation between
Vn
In
C,E0X
fn
xnX
Vth Qs
Q
Mtr
Ls
Li
k
k´
Fe
Fe
R SQUID
Displacementsensor
Lp
FIG. 23. Scheme of a displacement sensor based on a capaci-tive transducer and a SQUID amplifier, and equivalent circuit.The noise sources of the equivalent displacement sensor, theadditive displacement noise, xn, and back-action force noise fn,are functions of In,Vn, and Vth. The presence of the transducerhas the further important effect of loading the test mass to bemeasured, modifying its dynamical stiffness k into k0. For detailson the other parameters see Fig. 1.
PAOLA LEACI et al. PHYSICAL REVIEW D 77, 062001 (2008)
062001-16
the displacement and force noise, even if the amplifiernoise sources were uncorrelated.
The exact expression of the power spectral density offorce and displacement noise, as well their cross-correlation, can be computed by using Eqs. (A4) and(A7). It is possible to show that, under reasonable assump-tions, the noise stiffness kR, defined by Eq. (9), is of theorder of E2
0C over a given bandwidth around the electricalresonance frequency. For instance, let us assume an ideal-ized mechanical system with constant mechanical stiffnessk, and the specific set of transducer parameters listed inTable IV. For the determination of the effective noise stiff-ness of the readout, one must take into account the trans-ducer loading on the test mass. Therefore, the noisematching condition [see Eq. (10)] must be slightly modi-fied by replacing k with k0, as given by Eq. (A3). The ratiojkR=k
0j is then numerically calculated for a transducer withbias field such that E2
0C � k (Fig. 24). It is found that theratio is of the order of 1 over a 2 kHz bandwidth around theelectrical resonance frequency, meaning that the noisematching condition jkRj � jk0j is achieved. Therefore,the transducer is matched to the mechanical system whenthe quantity E2
0C is equal to the unloaded stiffness k. Inother words, the transducer behaves roughly as if it had aneffective noise stiffness of the order of E2
0C without load-ing the test mass.
APPENDIX B: OPTIMIZATION OF TAPEREDCYLINDER LENGTH
In this appendix we discuss the choice of the length ofthe cylindrical detectors proposed in Sec. III. The relevant
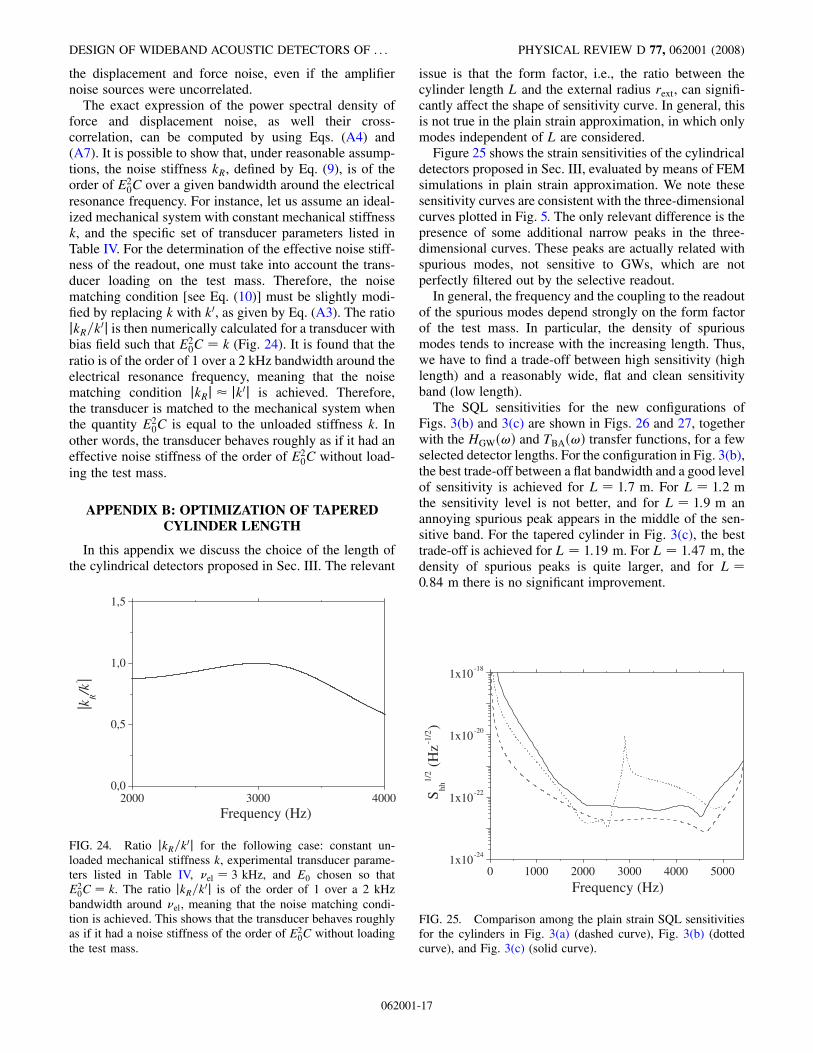
issue is that the form factor, i.e., the ratio between thecylinder length L and the external radius rext, can signifi-cantly affect the shape of sensitivity curve. In general, thisis not true in the plain strain approximation, in which onlymodes independent of L are considered.
Figure 25 shows the strain sensitivities of the cylindricaldetectors proposed in Sec. III, evaluated by means of FEMsimulations in plain strain approximation. We note thesesensitivity curves are consistent with the three-dimensionalcurves plotted in Fig. 5. The only relevant difference is thepresence of some additional narrow peaks in the three-dimensional curves. These peaks are actually related withspurious modes, not sensitive to GWs, which are notperfectly filtered out by the selective readout.
In general, the frequency and the coupling to the readoutof the spurious modes depend strongly on the form factorof the test mass. In particular, the density of spuriousmodes tends to increase with the increasing length. Thus,we have to find a trade-off between high sensitivity (highlength) and a reasonably wide, flat and clean sensitivityband (low length).
The SQL sensitivities for the new configurations ofFigs. 3(b) and 3(c) are shown in Figs. 26 and 27, togetherwith the HGW�!� and TBA�!� transfer functions, for a fewselected detector lengths. For the configuration in Fig. 3(b),the best trade-off between a flat bandwidth and a good levelof sensitivity is achieved for L � 1:7 m. For L � 1:2 mthe sensitivity level is not better, and for L � 1:9 m anannoying spurious peak appears in the middle of the sen-sitive band. For the tapered cylinder in Fig. 3(c), the besttrade-off is achieved for L � 1:19 m. For L � 1:47 m, thedensity of spurious peaks is quite larger, and for L �0:84 m there is no significant improvement.
2000 3000 40000,0
0,5
1,0
1,5
|kR/k
' |
Frequency (Hz)
FIG. 24. Ratio jkR=k0j for the following case: constant un-loaded mechanical stiffness k, experimental transducer parame-ters listed in Table IV, �el � 3 kHz, and E0 chosen so thatE2
0C � k. The ratio jkR=k0j is of the order of 1 over a 2 kHzbandwidth around �el, meaning that the noise matching condi-tion is achieved. This shows that the transducer behaves roughlyas if it had a noise stiffness of the order of E2
0C without loadingthe test mass.
0 1000 2000 3000 4000 50001x10
-24
1x10-22
1x10-20
1x10-18
Frequency (Hz)
Shh
1/2 (
Hz-1
/2)
FIG. 25. Comparison among the plain strain SQL sensitivitiesfor the cylinders in Fig. 3(a) (dashed curve), Fig. 3(b) (dottedcurve), and Fig. 3(c) (solid curve).
DESIGN OF WIDEBAND ACOUSTIC DETECTORS OF . . . PHYSICAL REVIEW D 77, 062001 (2008)
062001-17

[1] LIGO, http://www.ligo.caltech.edu.[2] VIRGO, http://www.virgo.infn.it.[3] B. Abbott et al., Classical Quantum Gravity 24, 5343
(2007).[4] B. Abbott et al., arXiv:0704.3368 [Phys. Rev. D (to be
published)].[5] P. Astone et al., Phys. Rev. D 68, 022001 (2003).[6] P. Astone et al., Phys. Rev. D 76, 102001 (2007).[7] H. J. Paik, in Experimental Gravitation, edited by B.
Bertotti (Academic, New York, 1974), p. 515.[8] J.-P. Richard, Phys. Rev. Lett. 52, 165 (1984).[9] L. Baggio et al., Phys. Rev. Lett. 94, 241101 (2005).
[10] L. Gottardi, Phys. Rev. D 75, 022002 (2007).[11] M. Cerdonio, L. Conti, J. A. Lobo, A. Ortolan, L.
Taffarello, and J. P. Zendri, Phys. Rev. Lett. 87, 031101
(2001).[12] M. Bonaldi, M. Cerdonio, L. Conti, M. Pinard, G. A.
Prodi, L. Taffarello, and J. P. Zendri, Phys. Rev. D 68,102004 (2003).
[13] M. Bonaldi, M. Cerdonio, L. Conti, P. Falferi, P. Leaci, S.Odorizzi, G. A. Prodi, M. Saraceni, E. Serra, and J. P.Zendri, Phys. Rev. D 74, 022003 (2006).
[14] F. N. H. Robinson, Noise and Fluctuations in ElectronicDevices and Circuits (Clarendon Press, Oxford, 1974).
[15] D. G. Blair, A. Giles, and M. Zeng, J. Phys. D 20, 162(1987).
[16] P. Saulson, Fundamentals of Interferometric GravitationalWave Detectors (World Scientific, Singapore, 1994).
[17] H. B. Callen and T. A. Welton, Phys. Rev. 83, 34 (1951).[18] S. Kobayashi, IEEE Trans. Dielectr. Electr. Insul. 4, 841
0 1000 2000 3000 4000 50001x10
-23
1x10-21
L=1.9 m L=1.7 m L=1.2 m
Frequency (Hz)
Shh
1/2 (
Hz-1
/2)
1x10⁻¹⁰
1x10⁻⁸
|TB
A| (
m/N
)
1x100
1x10²
(c)
(b)
(a)
|HG
W| (
m)
FIG. 26. (a) GW transfer function jHGW�!�j, (b) back-actiontransfer function jTBA�!�j, and (c) SQL sensitivities for acylinder equipped with whips as the one in Fig. 3(b), with rext �0:5 m, rint � 0:08 m, but for different lengths L. The detectormechanical stiffness and the sensitivity obtained with unity SNRare: (i) k0 � 5:3 108 N=m and ~H � 2:5 10�25 Hz�1 for thedashed curve, (ii) k0 � 5 108 N=m and ~H � 2:710�25 Hz�1 for the solid curve, (iii) k0 � 3 108 N=m and~H � 2:8 10�25 Hz�1 for the dotted curve.
0 2000 4000 60001x10
-23
1x10-21
L=1.47 m L=1.19 m L=0.84 m
(c)
Frequency (Hz)
S
hh
1/2 (
Hz-1
/2)
1x10⁻⁸
1x10⁻⁶
|TB
A| (
m/N
)
1x100
1x10²
1x10⁴
(b)
(a)
|HG
W| (
m)
FIG. 27. (a) GW transfer function jHGW�!�j, (b) back-actiontransfer function jTBA�!�j, and (c) SQL sensitivities for atapered cylinder as the one in Fig. 3(c), with rext � 0:35 m,rint � 0:091 m, but for different lengths L; k0 � 7 107 N=mand ~H � 3:4 10�25 Hz�1 for the dashed curve, k0 � 5:6107 N=m and ~H � 3:6 10�25 Hz�1 for the solid curve, k0 �4:2 107 N=m and ~H � 4:6 10�25 Hz�1 for the dotted one.
PAOLA LEACI et al. PHYSICAL REVIEW D 77, 062001 (2008)
062001-18

(1997).[19] V. B. Braginsky and F. Y. Khalili, Quantum Measurement
(Cambridge University Press, Cambridge, 1992).[20] M. Bonaldi, M. Saraceni, and E. Serra, J. Mech. Des. 130,
042302 (2008).[21] M. Bonaldi (private communication).[22] R. J. Duffin, SIAM J. Appl. Math. 17, 179 (1969).[23] L. Meirovitch, Principles and Techniques of vibrations
(Prentice-Hall, London, 1996).[24] P. Rapagnani, Nuovo Cimento Soc. Ital. Fis. C 5, 385
(1982).[25] P. Falferi, M. Bonaldi, M. Cerdonio, A. Vinante, R.
Mezzena, G. A. Prodi, and S. Vitale, Appl. Phys. Lett.88, 062505 (2006).
[26] A. Vinante, Classical Quantum Gravity 23, S103 (2006).[27] A. Marin et al., Classical Quantum Gravity 19, 1991
(2002).[28] ANSYS, Inc., Southpointe, 275 Technology Drive,
Canonsburg, PA 15317, http://www.ansys.com.[29] W. Duffy, Jr., J. Appl. Phys. 72, 5628 (1992).[30] B. Harnisch, B. Kunkel, M. Deyerler, S. Bauereisen, and
U. Papenburg, ESA Bull. 95, 107 (1998).[31] In order to check the validity of the scaling formulas in the
case of different Poisson’s ratios, we performed three-dimensional FEM simulations of two tapered detectorsof identical dimensions and material, but with differentPoisson’s ratios, of 0.31 and 0.17 [32], corresponding tothe Mo and C/SiC materials, respectively. The discrepancybetween the resulting sensitivity curves appears almost
negligible. This suggests that the scaling formulas areapproximately valid also in the case of materials withsignificantly different Poisson’s ratio.
[32] Cesic by ECM, http://www.cesic.de.[33] M. Shibata and K. Taniguchi, Phys. Rev. D 73, 064027
(2006).[34] R. Oechslin and H.-T. Janka, Phys. Rev. Lett. 99, 121102
(2007).[35] M. Campanelli, C. O. Lousto, and Y. Zlochower, Phys.
Rev. D 73, 061501(R) (2006).[36] From the previous experiences of the network of bar
detectors [5,6], the SNR thresholds used to search candi-date GW signals with high confidence can be slightlylower than SNR � 6. The same would hold for any net-work of detectors showing pure Gaussian noise statistics.In practice however, it is extremely difficult to give arealistic estimate of the detection threshold of futuredetector networks, since the balance between false alarmrates and false dismissal probability can be determinedonly keeping into account a realistic statistics of the noiseexcesses from the Gaussian model. This task is wellbeyond the scope of this paper and therefore we willkeep SNR� 6 as an indication of what is likely to bedetectable with high confidence by a network of taperedcylinders.
[37] K. Belczynski, R. E. Taam, V. Kalogera, F. A. Rasio, andT. Bulik, Astrophys. J. 662, 504 (2007).
[38] V. Ferrari, G. Miniutti, and J. A. Pons, Mon. Not. R.Astron. Soc. 342, 629 (2003).
DESIGN OF WIDEBAND ACOUSTIC DETECTORS OF . . . PHYSICAL REVIEW D 77, 062001 (2008)
062001-19
Copyright © 2022 FDOKUMEN