Design of an Electromagnetic Vibration Energy Harvester for Structural Health Monitoring of Bridges...
191
Copyright by Eric Carl Dierks 2011
Transcript of Design of an Electromagnetic Vibration Energy Harvester for Structural Health Monitoring of Bridges...

Copyright
by
Eric Carl Dierks
2011


Design of an Electromagnetic Vibration Energy Harvester for
Structural Health Monitoring of Bridges Employing Wireless Sensor
Networks
by
Eric Carl Dierks, BSME
Thesis
Presented to the Faculty of the Graduate School of
The University of Texas at Austin
in Partial Fulfillment
of the Requirements
for the Degree of
Master of Science in Engineering
The University of Texas at Austin
August 2011

iv
Acknowledgements
I would like to thank Dr. Kris Wood, Dr. Dan Jensen, Dr. Sharon Wood, and Dr.
Rich Crawford for providing me this great research opportunity, financial support and for
their guidance and advice over the past year and a half. I am grateful of the institutions
responsible for the creation of the project: the Office of the Secretary of Defense:
Corrosion Policy, the National Institute for Standards and Technology: Technology
Innovation Program, the Department of Mechanical Engineering at The University of
Texas at Austin, and the Department of Engineering Mechanics at the United States Air
Force Academy. The Civil and Electrical Engineering professors and students who
continue to participate in the project were also a great resource: Dr. Todd Helwig,
Jeremiah Fasl, Matt Riechenbach, Vasilis Vasamaras, Dr. Dean Niekirk, and Dr. Praveen
Pasupathy. I am also very thankful for Dr. Preston Wilson and Dr. Eric Farenthold, who
gave technical advice and lent lab equipment in his free time. Mark Phillips was very
helpful in lending additional electronic lab equipment and overseeing SLS printing, and
Danny Jares always provided great machining advice throughout the prototype
development. Scott Allen was also very helpful in procuring raw materials for the
prototype. I would also like to thank my fellow Mechanical Engineering students:
Sumedh Inamdar, Jason Weaver, Scott Dale, Katie Carpenter, Mikko Ponkala, Jorge
Flores and Travis McEvoy, who contributed in various ways. Finally, I would like to
thank my parents for graciously helping every time I needed them, supporting my
decision to attend graduate school and their contribution to my understanding and
enjoyment of the way things work.
August 12, 2011

v
Abstract
Design of an Electromagnetic Vibration Energy Harvester for
Structural Health Monitoring of Bridges Employing Wireless Sensor
Networks
Eric Carl Dierks, MSE
The University of Texas at Austin, 2011
Supervisor: Kristin L. Wood
Energy harvesting is playing an increasingly important role in supplying power to
monitoring and automation systems such as structural health monitoring using wireless
sensor networks. This importance is most notable when the structures to be monitored are
in rural, hazardous, or limited access environments such as busy highway bridges where
traffic would be greatly disrupted during maintenance, inspection, or battery replacement.
This thesis provides an overview of energy harvesting technologies and details the
design, prototyping, testing, and simulation of an energy harvester which converts the
vibrations of steel highway bridges into stored electrical energy through the use of a
translational electromagnetic generator, to power a wireless sensor network for bridge
structural health monitoring. An analysis of bridge vibrations, the use of nonlinear and
linear harvester compliance, resonant frequency tuning, and bandwidth widening to
maximize the energy harvested is presented. The design approach follows broad and

vi
focused background research, functional analysis, broad and focused concept generation
and selection, early prototyping, parametric modeling and simulation, rapid prototyping
with selective laser sintering, and laboratory testing with replicated bridge vibration. The
key outcomes of the work are: a breadth of conceptual designs, extensive literature
review, a prototype which harvests an average of 80µW under bridge vibration, a
prototype which provides quick assembly, mounting and tuning, and the conclusion that a
linear harvester out performs a nonlinear harvester with stiffening magnetic compliance
for aperiodic vibrations such as those from highway bridges.

vii
Table of Contents
List of Tables ...........................................................................................................x
List of Figures ........................................................................................................ xi
Chapter 1: Introduction ...........................................................................................1
1.1: Need For the Project ................................................................................1
1.2: Project Description ..................................................................................6
1.2.1: Bridge Types ................................................................................7
1.2.2: Monitoring System Description ...................................................8
1.2.3: Energy and Power Requirements .................................................8
1.2.4: Energy Harvester Customer Needs ..............................................9
1.3: Challenges and Opportunities ................................................................11
1.4: Hypothesis and Research Objectives .....................................................12
1.5: Thesis Organization ...............................................................................13
Chapter 2: Review of Energy Harvesting .............................................................14
2.1: Energy Sources ......................................................................................15
2.2: Energy Conversion ................................................................................18
2.2.1: Solar Energy Harvesting ............................................................19
2.2.2: Wind Energy Harvesting ...........................................................21
2.2.3: Vibration Energy Harvesting .....................................................23
2.3: Energy Storage .......................................................................................27
2.4: Future Innovations .................................................................................30
2.5: Chapter Summary ..................................................................................32
Chapter 3: Broad Conceptual Design and Field Measurements ...........................33
3.1: Concept Generation ...............................................................................33
3.1.1: Harvester Concepts ....................................................................33
3.1.2: Mounting Concepts ....................................................................39
3.1.3: Relevant Patents .........................................................................41
3.2: Concept Selection ..................................................................................42

viii
3.3: Field Measurements ...............................................................................44
3.4: Chapter Summary ..................................................................................50
Chapter 4: Review of Electromagnetic Vibration Energy Harvesting..................51
4.1: What are the fundamental works in the field? .......................................51
4.2: How can the harvester’s resonant frequency be tuned? .........................56
4.3: How can a wide bandwidth harvester be achieved? ..............................61
4.4: What circuitry is needed for high efficiency? ........................................66
4.5: What works are specific to low frequency applications? ......................71
4.6: Chapter Summary ..................................................................................75
Chapter 5: Focused Conceptual and Embodiment Design ...................................77
5.1: Focused Concept Generation .................................................................77
5.2: Focused Concept Selection ....................................................................82
5.3: Analytical Model ...................................................................................84
5.3.1: Electromagnetic Components ....................................................84
5.3.2: Mechanical Components............................................................87
5.3.3: System ........................................................................................91
5.4: Numerical Model ...................................................................................94
5.5: Component Layout and Parameter Selection.........................................95
5.5.1: Translating Magnet Assembly and Linear Spring .....................98
5.5.2: Spring Magnets ..........................................................................99
5.5.3: Coil...........................................................................................100
5.6: Predicted Performance .........................................................................102
5.6.1: Linear Case ..............................................................................102
5.6.2: Nonlinear Case .........................................................................105
5.7: Embodiment .........................................................................................109
5.8: Chapter Summary ................................................................................111
Chapter 6: Prototype Fabrication and Experimentation ......................................112
6.1: Prototype Fabrication ...........................................................................112
6.2: Experimentation ...................................................................................114

ix
6.2.1: Laboratory Setup......................................................................114
6.2.2: Parameter Measurement ..........................................................117
6.2.3: Linear Case ..............................................................................120
6.2.4: Nonlinear Case .........................................................................128
6.3: Comparison to Simulation and Other Works .......................................130
6.4: Chapter Summary ................................................................................132
Chapter 7: Design Evolution ................................................................................134
7.1: Conceptual and Embodiment Design ..................................................134
7.2: Prototype Fabrication and Experimentation ........................................142
7.3: Chapter Summary ................................................................................144
Chapter 8: Conclusions .......................................................................................146
8.1: Summary and Conclusions ..................................................................146
8.2: Future Work .........................................................................................151
Appendix A: Customer Needs Interview .............................................................153
Appendix B: Specification Sheet .........................................................................154
Appendix C: Generated Concepts Mind Map ......................................................157
Bibliography ........................................................................................................158
Vita …………………………………………………………………………… 173

x
List of Tables
Table 1. WSN node average power consumption and duration by function. ..........9
Table 2. Functional requirements of successful energy harvester. ........................11
Table 3. Power densities of several energy harvesting sources. ............................18
Table 4. Battery Performance Comparison. ...........................................................30
Table 5. Electromagnetic harvester properties. ......................................................55
Table 6. Optimized geometry relations from (von Büren & Tröster, 2007). .........98
Table 7. Desired mechanical parameters. ..............................................................99
Table 8. Spring magnet properties. ........................................................................99
Table 9. Magnetic stiffness polynomial fit coefficients, used in Equation 5.20 to
calculate the magnetic stiffness for the given initial magnet separation.
.........................................................................................................100
Table 10. Desired coil parameters. ......................................................................102
Table 11. Damping values used to predict harvester performance. .....................102
Table 12. Actual coil parameters. ........................................................................112
Table 13. Results of damping measurement. .......................................................120
Table 14. Summary of linear harvester test results. .............................................122
Table 15. Quantitative prototype comparison. .....................................................145
Table B-1. Functional requirements. ...................................................................154
Table B-2. Design constraints: Geometry, forces, material, and signals. ............155
Table B-3. Design constraints: Safety, ergonomics, assembly, operation, maintenance,
and costs. .........................................................................................156

xi
List of Figures
Figure 1. Distribution of structurally deficient bridges across the U.S.. .................1
Figure 2. Equipment in use during manual bridge inspection. ................................2
Figure 3. Example wireless sensor network configuration for remote monitoring. 3
Figure 4. Relevant research trends over the past sixty years. ..................................4
Figure 5 External (a) and internal (b) views of a typical box girder bridge. ...........7
Figure 6. Underside of a typical I-Girder bridge (a), and typical truss bridge (b). ..7
Figure 7. Schematic of wireless monitoring system. ...............................................9
Figure 8. Average power requirements of WSN node for various sample rates. ..10
Figure 9. Mind map of energy sources organized by energy domain. ...................16
Figure 10. A map of transduction mechanisms and processes for converting between
energy domains. ................................................................................19
Figure 11. Examples of some commercially available wind turbines. ..................22
Figure 12. Examples of electromagnetic vibration harvesting, including (a) motion
powered flashlights, (b) kinetic watches (such as (b’) the ETA
Autoquartz design and (b") the Seiko AGS generator), (c) commercial
inductive energy harvester, and (d) concept of an inductive energy
harvester. ...........................................................................................25
Figure 13. Bimorph cantilever piezoelectric harvester. .........................................26
Figure 14. Electrostatic (a) and magnetostrictive-piezoelectric (b) harvester
schematics. ........................................................................................27
Figure 15. Mind map of energy storage methods by energy domain. ...................28
Figure 16. Power density of various energy storage methods . .............................29
Figure 17. Comparison of capacitors and batteries. ...............................................31

xii
Figure 18. Road hose concept. ...............................................................................35
Figure 19. Aeroelastic “windbelt” concept. ...........................................................35
Figure 20. Reflected solar concept (a), and expansion joint concept (b). ..............36
Figure 21. Electromagnetic vibration concept (a), and impact piezoelectric concept
(b). .....................................................................................................37
Figure 22. Concept of an active coupled-spring tuning system for an electromagnetic
vibration energy harvester. ................................................................38
Figure 23. Box-girder mounting concepts. ............................................................40
Figure 24. I-girder mounting concepts...................................................................41
Figure 25. Accelerometer locations in first two spans of IH-35N-US-290E direct
connector. ..........................................................................................45
Figure 26. 60 second acceleration waveforms at each sensor location showing three
passing trucks. ...................................................................................45
Figure 27. Minimum, maximum, and RMS acceleration by sensor location on box-
girder bridge. .....................................................................................46
Figure 28. Acceleration power spectrum of span 1, showing variability of frequencies
with sensor location. .........................................................................47
Figure 29. Acceleration power spectrum of span 2, showing variability of frequencies
with sensor location. .........................................................................48
Figure 30. Spectrogram and power spectrum of accelerometer 2 of span 1, showing
the stability of dominant frequencies over approximately 4.5 hours.49
Figure 31. First concept (a), schematic of first prototype (b). .............................53
Figure 32. Increasing magnetic flux gradient by utilizing two sets of magnets rather
than one. ............................................................................................53

xiii
Figure 33. Patented tuning by changing clamped length via actuator (a), and variation
of resonant frequency with change in beam length (b). ...................57
Figure 34. Change in normalized resonant frequency with normalized center of
gravity (a), and axial preload (b),......................................................58
Figure 35. Concept to add tensile preload using magnets. ....................................59
Figure 36. Adjustment of compliance through magnetic forces for (a) piezoelectric
cantilever with magnetic tip mass, (b) permanent magnet linear
generator, and (c) permanent magnet generator. .............................60
Figure 37. Power from a coupled two-mass system and equivalent one-mass system
(a), and coupled harvester utilizing the first three modes of a beam (b).
...........................................................................................................63
Figure 38. Increasing nonlinear response with increasing excitation amplitude (from
top to bottom) (a), and hysteresis for a typical nonlinear harvester (b).
...........................................................................................................64
Figure 39. Coupled harvester with magnetic compliance to achieve wide bandwidth.
...........................................................................................................65
Figure 40. Bistable potential field (a), and bistable EM harvester (b). ..................67
Figure 41. System block diagram (a) and state diagram (b). .................................70
Figure 42. Clarkson University’s bridge-specific harvesters: single phase horizontal
axis coil, flux concentrating teeth, and three phase vertical axis coils72
Figure 43. System schematic (left), rotor topology (middle), and coil topology (right).
...........................................................................................................73
Figure 44. Prototype and cross-section schematic of salient pole harvester. .........74
Figure 45. Wearable flexible hinge harvester. .......................................................74

xiv
Figure 46. Focused concept A: Tensile axial load tuning (a), using two-pole magnet
and coil topology (b). ........................................................................78
Figure 47. Focused concept B: Tunable bistable cantilever. .................................79
Figure 48. Focused concept C: Modular array with magnetic levitation tunability.81
Figure 49. Focused concept D: Magnetically coupled with flux concentration and
tunability. ..........................................................................................82
Figure 50. Equivalent circuit model of electrical system. .....................................86
Figure 51. Equivalent circuit model of mechanical system. ..................................88
Figure 52. Schematic of mechanical components..................................................89
Figure 53. Detailed friction model. ........................................................................92
Figure 54. Equivalent circuit model of the electromechanical system. .................93
Figure 55. Diagram of the Simulink and SimScape portion of the numerical model.
...........................................................................................................96
Figure 56. FEA model of magnetic assembly and coil. .........................................97
Figure 57. Magnetic repulsion force measurement results with corresponding 3rd
order polynomial fits. ......................................................................100
Figure 58. Peak harvested power for load resistance sweep under 50 seconds of
replicated IH-35N-US-290E direct connector acceleration for the linear
case. .................................................................................................103
Figure 59. Peak harvested power for load resistance sweep with sine wave excitation
of 0.01g and 2.2Hz for the linear case. ...........................................104
Figure 60. Peak harvested power for an excitation acceleration sweep for the linear
case under sinusoidal excitation at 2.2Hz and a load of 2.9kΩ. .....104

xv
Figure 61. Peak harvested power under increasing swept sine wave over 120 seconds
at amplitude of 0.05g and load of 2.9kΩ. .......................................105
Figure 62. Bridge acceleration, relative displacement (between magnet and coil), peak
harvested power, and harvested energy for 300 seconds of IH-35N-US-
290E direct connector acceleration for the linear case. ..................106
Figure 63. Tunable frequency range of nonlinear harvester using the small magnets.
.........................................................................................................106
Figure 64. Peak harvested power under increasing swept sine wave over 120 seconds
at amplitude of 0.05g and load of 2.9kΩ, for the nonlinear case. ...107
Figure 65. Peak harvested power under increasing swept sine wave over 120 seconds
at amplitude of 0.05g and load of 14kΩ, for the nonlinear case. ....107
Figure 66. Bridge acceleration, relative displacement (between magnet and coil), peak
harvested power, and harvested energy for 300 seconds of IH-35N-US-
290E direct connector acceleration for the nonlinear case. ............108
Figure 67. Solid model of test prototype. ............................................................110
Figure 68. Magnet assembly and coil sectional view, rotated horizontally. The iron
disks at each end must be removed if repelling magnets are to be used in
place of a spring, as the iron disks would attract the repelling magnets.
.........................................................................................................111
Figure 69. Completed prototype (left), magnet, shaft, spring, and mounts (right).113
Figure 70. Coil bobbin before windings are added (a), and small spring magnet with
mount (b). ........................................................................................114
Figure 71. Laboratory test setup for measurement of harvester performance. ....115

xvi
Figure 72. Transient response of open-circuit voltage to an impulse response for the
measurement of mechanical damping. ............................................118
Figure 73. Transient response of closed-circuit voltage to an impulse response for the
measurement of total damping. .......................................................119
Figure 74. Peak harvested power as a function of load resistance for the linear case
under sinusoidal excitation with peak acceleration amplitude of 0.01 g
and frequency of 2.2 Hz. .................................................................123
Figure 75. Peak harvested power as a function of peak acceleration amplitude for the
linear case under sinusoidal excitation with frequency of 2.2 Hz and load
resistance of 14kΩ. .........................................................................124
Figure 76. Peak harvested power as a function of excitation frequency for the linear
case with increasing and decreasing sinusoidal frequencies, acceleration
amplitude of 0.01 g, and load resistance of 14 kΩ. ........................125
Figure 77. Peak harvested power as a function of excitation frequency for the linear
case with increasing and decreasing sinusoidal frequencies, acceleration
amplitude of 0.05 g, and load resistance of 14 kΩ. ........................126
Figure 78. Peak harvested power as excited by a replicated IH-35N over Medina
River acceleration profile, for the linear case with load resistance of 14
kΩ. ..................................................................................................127
Figure 79. Peak harvested power as a function of excitation frequency for the
nonlinear case with increasing sinusoidal frequency, acceleration
amplitude of 0.05 g, and load resistance of 14 kΩ. ........................128

xvii
Figure 80. Peak harvested power as excited by a replicated IH-35N over Medina
River acceleration profile, for the nonlinear case with load resistance of
14 kΩ. .............................................................................................129
Figure 81. Bridge acceleration, relative displacement (between magnet and coil), peak
harvested power, and harvested energy for 300 seconds of IH-35N-US-
290E direct connector acceleration for the linear case with actual
measured parameters. ......................................................................131
Figure 82. Bridge acceleration, relative displacement (between magnet and coil), peak
harvested power, and harvested energy for 300 seconds of IH-35N-US-
290E direct connector acceleration for parameters inferred from the
harvester of (Li, 2008). ...................................................................132
Figure 83. Assembly/disassembly concept sketches, showing vertical and horizontal
housing separation. .........................................................................136
Figure 84. Bridge mounting concept sketches, showing mounting to the web stiffener
plate and cross-frame, as well as 0, 1, and 2 degree of freedom
adjustment for mounting to both locations. ....................................137
Figure 85. Circuit board enclosure concept sketches...........................................137
Figure 87. Finished CAD model isometric view. ................................................138
Figure 88. Finished CAD model exploded view. ................................................139
Figure 89. Cross-sectional view of energy harvester, showing threads, bearing,
magnet, and circuit mounting. ........................................................140
Figure 90. Harvester mounted to cross-frame and web stiffener plate ................140
Figure 91. Detail view of the clamp rotation mechanism (top), and cross-sectional
view (bottom). .................................................................................141

xviii
Figure 92. FEA deflection results for the loaded return spring. ..........................141
Figure 93. Finished harvester front isometric view (a), rear isometric view (b). 142
Figure 94. Disassembled components..................................................................143
Figure 95. , mesh as viewed in the mesh analysis tool Rhinosceros. ..................143
Figure 96. Measurement of force needed to disengage teeth to allow clamp rotation.
.........................................................................................................144
Figure C-1. Mind map of all generated concepts organized and colored by energy
source. .............................................................................................157

1
Chapter 1: Introduction
1.1: NEED FOR THE PROJECT
The structural integrity of our nation’s infrastructure is constantly decreasing due
to fatigue and corrosion, with a direct impact on the public’s safety and their pocket
book. According to the Federal Highway Administration (FHA), 146,633 (24.2%) of the
604,474 total bridges in the United States are structurally deficient as of December 2010
(Federal Highway Administration, 2010). Figure 1 shows the distribution of a portion of
these bridges. The current strategy in Texas is to manually inspect the bridges that are
deemed fracture critical every five years, with the inspection interval decreasing to every
two years in the near future. This approach may sound acceptable, but recent failures and
collapses of bridges which were serviced within this interval provide evidence to the
contrary. For instance, the I-35W Mississippi River Bridge in Minnesota which collapsed
in 2007, only one year after manual inspection (National Transportation Safety Board,
2007).
Figure 1. Distribution of structurally deficient bridges across the U.S. (RITA, 2007).

2
Inspections of bridges, new and old, every two years take large budgetary and
human resources. The manual inspections often require closing off traffic to allow
inspection trucks access to the bridge structure using what are called Snoopers, as shown
in Figure 2 (Missouri Department of Transportation, 2011). Additionally, the FHA has
reported that manual inspections following the National Bridge Inspection Standard often
result in unreliable and subjective assessment, and that more detailed inspection of
deficient bridges are not likely to deliver a more concrete assessment using current
methods (Turner-Fairbank Highway Research Center: Federal Highway Administration,
2001).
Figure 2. Equipment in use during manual bridge inspection (Missouri Department of
Transportation, 2011).
These challenges may be mitigated with the use of a structural health monitoring
system employing sensors and wireless communications to relay measurements to offsite
operators. Monitoring may then be performed frequently and with higher precision than
manual inspections while limiting human-related errors and investment of human
resources. Such a system could eventually pay for itself with a reduction of manual
inspections as the reliability and safety of monitoring is proven over long-term use. A

3
basic schematic of a wireless structural health monitoring system is shown in Figure 3,
where wireless sensor network (WSN) nodes collect, pre-process, and transmit data to a
WSN gateway (aka receiver unit) through either a structured network utilizing dedicated
WSN routers (aka relays), or in an unstructured, ad-hoc network where the sensor nodes
relay data from other nodes to the gateway. The gateway performs additional data
processing before transmitting to the host computer through an Ethernet cable or long-
range wireless network.
Figure 3. Example wireless sensor network configuration for remote monitoring
(National Instruments, 2011).
There is an ever-growing need for monitoring and automating processes and
structures throughout many industrial domains, with strong progress in the past ten years
as shown in Figure 4 (Google, 2010). In combination, these factors produce an area of
great need and promise for future expansion as government and industry wish to increase
safety and efficiency while adding precision and reducing human-related error
(Duderstadt, 2005; Pisano & Shih, 2009).

4
Figure 4. Relevant research trends over the past sixty years (Google, 2010).
Five approaches may be considered for a power source: grid electricity, pre-
charged batteries, generative power sources such as combustion-based generators,
continuous energy harvesting without storage, and energy harvesting with storage. Hard
wiring power from the grid to each component of the network for thousands of bridges
would incur large installation costs in addition to the cost to power the system for several
decades. Rural bridges would incur additional costs as connection to the electrical grid is
not convenient. For these reasons wireless power sources are preferred. Pre-charged
batteries are the next logical step but batteries powering each WSN component may have
to be replaced frequently depending upon the respective power consumption.
Replacement of batteries every few years in each monitoring component on thousands of
bridges would be very labor and cost intensive (Weaver, Crawford, & K. L. Wood,
2010). Additionally, monitoring of remote or hazardous locations make batteries even
less attractive. Gas generators could similarly take the place of the grid for each bridge
but with similar problems faced by batteries, as a constant fuel supply is needed.

5
Energy harvesting power supplies able to operate for decades at a time, dependent
only upon ambient energy sources such as light, wind, heat, water, or vibration could give
these wireless systems true and far-reaching potential. Energy harvesters may be
connected directly to the load to deliver power in a continuous fashion or may charge a
storage system which delivers power to the load. A continuous system would likely be
simpler and cheaper but at the cost of limited harvesters which can supply adequate
power continuously. Most harvesters utilize a storage system such as a battery to
accumulate the harvested energy and deliver it to the load often at higher power levels
than the harvester can supply directly. This allows a broader range of energy sources and
harvesting techniques to be used which harvest at low power over long periods of time,
then deliver at high power over short periods of time. The benefits of energy harvesting
power supplies is evident in the rapid increase of work in industry and academia on
energy harvesting over the past ten years, as was shown in Figure 4. This figure was
generated using Google Labs’ Ngram Viewer, which is a free tool that plots the
percentage of all websites and books in Google’s index containing the given search terms
over time. The figure shows increasing work on energy harvesting is likely in response to
the growth of process automation and structural health monitoring, and possibly the
slowing of growth in lithium-ion battery related work.
Finally, it is interesting to note here that the automation of structural health
monitoring through wireless networks and energy harvesting is just one of many
examples of Altshuller’s laws concerning the evolution of technical systems (Altshuller,
1984). One such law is the law of increasing the idealness of the system, which is
represented by the desire for the bridge itself to notify operators when a problem arises,
provide the operators with data to explain the problem, and do so under its own power. A
second relevant law is the law of increasing the S-Field involvement, which describes the

6
evolution of systems from mechanical to electro-magnetic components often with
increased interlinking between components and increased system responsiveness.
1.2: PROJECT DESCRIPTION
The National Institute for Standards and Technology’s (NIST) Technology
Innovation Program (TIP) has funded a five year research project to address the need for
energy harvesting wireless structural health monitoring of highway bridges. NIST has
deemed structural health monitoring of failing infrastructure an area of critical need with
nation-wide societal impact (NIST Technology Innovation Program, 2008). The Office of
the Secretary of Defense: Office of Corrosion Policy and Oversight has also provided
some funding through collaboration of the author with cadets in the senior design course
at the United States Air Force Academy.
The NIST project group is an interdisciplinary team composed of professors and
graduate students in the Civil, Electrical, and Mechanical Engineering departments at The
University of Texas at Austin (UT), as well as National Instruments (NI) and Wiss,
Janney, Elstner Associates (WJE). NI is contributing the wireless communications
system, while WJE is contributing advice on structural instrumentation from their
experience in industry. The Electrical Engineering group is developing passive corrosion
sensors which are not connected to the wireless system and are powered by a passing
inspection vehicle, while the Mechanical Engineering group is developing energy
harvesting solutions. The Civil Engineering group provides instrumentation of bridges,
sensor selection and testing, sensor data processing, and serves as overall project
management.

7
1.2.1: Bridge Types
Three types of bridges are targeted for inspections by the project: Box Girder, I-
Girder, and Truss. An example of each is given in Figures 5 and 6 with desired sensor
locations indicated. A successful system will consider all three types, but priority will be
given to I-Girder bridges as the box girder design’s status as fracture critical is under
debate, and truss bridges are much less common.
(a)
(b)
Figure 5 External (a) and internal (b) views of a typical box girder bridge.
(a)
(b)
Figure 6. Underside of a typical I-Girder bridge (a), and typical truss bridge (b).

8
1.2.2: Monitoring System Description
The monitoring system proposed is represented by the schematic shown in Figure
7. Several strain gages and crack propagation gages are wired to each NI Wireless Sensor
Network node. These nodes contain a LabVIEW Real-Time target (Field Programmable
Gate Array) to perform data acquisition and initial processing using LabVIEW (National
Instruments, 2011). The coded system will regulate the power usage, such as sleep mode
to reduce power demand, as well as data transmission to the WSN router. The router is
identical to a node but does not enter sleep mode such that all incoming transmissions
may be relayed to the WSN gateway. The gateway is very similar to an NI CompactRIO,
and is used to process and send the data to the host computer (aka host controller) offsite
through a cellular telephone network. The gateway is located at one end of the bridge,
where hard-wire access is easiest. An energy harvester will power one to several nodes,
while one to several harvesters may be needed to power the router. The gateway will be
powered by solar panels due to its high power demand and location at the bridge end
away from under-passing traffic. The collected data will be processed to determine the
state of stress of the girders (S. L. Wood & Dean, 2007).
1.2.3: Energy and Power Requirements
Calculation of average power usage by the WSN node and router were presented
in Weaver, Crawford, & Wood, 2010 as part of this project. The major results are shown
in Table 1 and Figure 8. In summary, the long-term average power usage of the WSN
node is about 0.5 mW, while the router and gateway require about 200 mW and 5-10 W
respectively. These values were calculated based upon the current commercially available
NI WSN system components, but future generations under development are likely to
require less power as the efficiencies, algorithms, and protocols are improved.

9
Figure 7. Schematic of wireless monitoring system.
Table 1. WSN node average power consumption and duration by function (Weaver et al.,
2010).
Function Power (mW) Δt (ms)
Power-up 200 12.4
Settle power 52.5 14.5
Measure analog 73.4 13.0
Prepare data 37.9 12.0
Radio activity 207 29.0
Total – active period 154 (average) 81
Sleep period 0.3 variable
1.2.4: Energy Harvester Customer Needs
A detailed specification sheet was created to define the properties a successful energy
harvester must have to satisfy the customers, which for now are the Civil Engineers
involved in the project. They were interviewed to gain an understanding of their
preferences, and a portion of the questions and responses of this interview is available in
Appendix A. The specification sheet was split into two components which define the
functional requirements and constraints, respectively. The most significant functional
requirements are noted with a star and concern the average energy generation per year,
instantaneous power level during continuous sampling, and the DC output voltage

10
required to power a WSN node. The third and fourth requirements listed concern the
router and gateway, respectively. Ideally a single harvester will be designed to meet the
energy needs of the node, router, and gateway while upholding the constraints, but is not
likely in the initial phase of this project. The first step is to meet the requirements of the
node, then progress to the other, higher power components. Noteworthy constraints are
also starred in Tables B2 and B3 of Appendix B, and include prohibited traffic
interference, damage and theft protection, ease and speed of installation, allowable bridge
alterations, installation locations, and long lifespan between maintenance.
Figure 8. Average power requirements of WSN node for various sample rates (Weaver et
al., 2010).

11
Table 2. Functional requirements of successful energy harvester.
1.3: CHALLENGES AND OPPORTUNITIES
The specification sheet points out several challenges and opportunities concerning
the development of energy harvesters for this application. Many solutions may be
infeasible because traffic cannot be interrupted or disturbed, and the harvester may not
hang below girders where traffic passes beneath. Damage from hail, vandalism, theft, and
birds, as well as corrosion push the harvesters to be self-contained, strongly attached, and
possibly disguised into the bridge environment. At this time the alteration of the bridge
structure is prohibited, restricting welding, bolting, and potentially unsafe mounting via
epoxy or magnets. Of greatest importance is the relatively high average power levels the
harvesters must provide to the monitoring system. Previous work at Clarkson University
showed a low power sensor node could be powered from bridge vibrations, but the
Demand
or WishTest / Verification
DGenerate long-term energy
level of
> 104 Wh/year (375
kJ/year)
analytical models, field
testing
DProvide power level
continuously for 2 weeks of> 61 mW
analytical models, field
testing
WProvide continuous power
for router of
> 207 mW
(1.8 kWh/year,
6.5 MJ/year)
analytical models, field
testing
WProvide continuous power
to gateway like CompactRio
> 10 W
(88 kWh/year,
315 MJ/year)
analytical models, field
testing
D
Store enough energy to go
two weeks with no
harvesting input
> 20 Wh
(75 kJ)
analytical models, field
testing
D Provide DC voltage 6 V DC, constantanalytical models, field
testing
D Provide DC current 200 mA, max pulseanalytical models, field
testing
WCommunicate to central
node
*lack of power,
*malfunction
analytical models, field
testing
Specification
Functional Requirements

12
current project’s requirements take the demand to a new level (Sazonov, Curry, & P.
Pillay, 2009).
If bridge vibration is considered as a viable energy source, careful study of its
characteristics is important as harvesting ambient vibration is more complex than
harvesting constant, small frequency range vibrations common in vibration harvesting
research (Beeby, M J Tudor, & N M White, 2006). The challenges and opportunities are
caused by the low acceleration amplitude (peaks less than +-0.2g), low frequency, and
multi-frequency vibrations which are dependent upon location, temperature, traffic load
and speed, and bridge age. Technically, the bridge vibration is classified as aperiodic,
non-stationary, and non-ergodic, meaning the vibration is relatively random with a shift
in frequencies over time, and measurements recorded at different times do not have equal
RMS values. The real challenge appears in interpreting this data to make decisions for the
successful design of robust yet powerful vibration energy harvesters.
1.4: HYPOTHESIS AND RESEARCH OBJECTIVES
The hypothesis of this thesis is as follows:
A vibration energy harvester using electromagnetic induction is capable of
powering an NI WSN node with the functional requirements and constraints
stated in the specification sheet.
The objectives of this research are as follows:
Generate concepts of electromagnetic vibration energy harvesters for bridge
applications
Create a lumped-parameter model of the selected harvester
Perform numerical simulations of the model to predict performance
Design and build a prototype of the selected concept

13
Test the prototype to evaluate power generation and compare results with the
simulations
Suggest a next generation design using the insights gained from the process
1.5: THESIS ORGANIZATION
The remainder of this thesis begins with a review of energy harvesting technologies
in chapter 2. Chapter 3 presents the results of concept generation of several types of
energy harvesters for the given application, the decision to pursue vibration harvesting
using induction, and the subsequent measurement and analysis of bridge vibrations to
define the scope for further design. Chapter 4 then provides a focused literature review on
electromagnetic vibration energy harvesting, amassing the required information for
focused conceptual design in chapter 5. This chapter first presents generated concepts, the
selection of one to prototype, an analytical model of the harvester, its embodiment and
numerical model. The prototype fabrication, initial parameter measurement, testing, and
comparison with simulation follow in chapter 6. Chapter 7 then presents a refined
prototype with added functionality. The thesis concludes with a summary and discussion
of future work to be carried by another graduate student on the project.

14
Chapter 2: Review of Energy Harvesting
Energy harvesting is an emerging technological field with potential to find its way
into the everyday life of the public, across markets, socioeconomic backgrounds, and
geographical locations. It is a broad field, defined by IDTechEx’s report for the Energy
Harvesting Journal as “the use of ambient energy to provide electrical power for small
electronic and electrical devices making them self-sufficient – often for decades. The
technologies employed variously convert human power, body fluids, heat differences,
vibration or other movement, dirt, vegetation, ultraviolet, visible light or infrared to
electricity” (Harrop, 2009)1.
Some of the prominent energy harvesting technologies include capturing solar
radiation through photovoltaic cells and heat engines, wind and water flow through
turbines and aeroelastic flutter, mechanical vibration through piezoelectric, electrostatic,
and electromagnetic transducers, heat through thermoelectric ceramics, turbines, and
Stirling engines, human power through hand cranks and vibration methods, and ambient
radio waves acquired by antennae. A sub-category of energy harvesting is energy
scavenging, which involves capturing ambient energy that is either not regularly
predictable with ease, only available in short emissions over long time periods, or would
otherwise be lost as waste heat or noise (Priya & Inman, 2008). An example of energy
scavenging is the concept of a vehicle detection system in a rural or military environment
where wireless communications are powered by the vibrations of the passing vehicles.
These scavengers could lie dormant for years until activated, consuming no energy until
needed.
1 This chapter contains many figures from the sources under review, with citations to the original source.
The author of this thesis does not claim copyright on any figures or tables with a citation in the caption.

15
Energy harvesting has grown in popularity as the demand for more information in
more locations with less human involvement has increased (Google, 2010). This growth
is shown by the following needs for energy harvesting (Dierks, 2011; Weaver, 2010):
Manufacturers desire to reduce downtime caused by machine failure without
cluttering the building with wires.
Oil and gas pipeline operators wish to reduce inspections on remote locations.
Infrastructure and aerospace structures need to be monitored for structural
weakness.
The shipping industry desires higher resolution tracking of trucks, packages, and
equipment.
Users demand laptops with longer battery life.
Facility owners wish to reduce lighting installation costs.
Militaries desire long distance tracking of unconventional, mobile threats.
Rural undeveloped communities need light at night.
Cities desire lower costs by picking up trash only when it is full.
The increasing prominence of smart electronic devices and low power wireless networks
coupled with the ever-decreasing energy usage of CPUs, actuators, circuitry, and
software is enabling even further application diversity.
2.1: ENERGY SOURCES
Many energy sources exist for a given application. A visualization of many found
in a search of literature and commercial products is given in Figure 9 in the form of a
mind map (Dierks, 2011; Weaver, 2010). In this mind map, the energy domain is given as
a node and the sub-domains and their energy sources are given as branches from the
node. The sources are grouped into four main energy domains: mechanical, chemical,

16
electromagnetic, and thermal, with mechanical being subdivided into solid, liquid, and
gas motion. Biological sources form a subdivision of the chemical domain since a
chemical process is at the heart of every biological system. In a similar manner, nuclear
energy sources contribute to the thermal and electromagnetic domains. Although the
figure does represent a comprehensive survey-identifying every possible source of energy
for harvesting—it does span a large segment of the available energy sources pertaining to
energy harvesting. This mind map, and those found throughout this thesis, serve to give a
broad overview of the possibilities that may be chosen for investigation as a solution to a
given application.
Figure 9. Mind map of energy sources organized by energy domain.

17
Some of the sources may require additional explanation for clarity, such as
Particle Stream, under Solid Motion. A harvester exists which uses radiated atomic
particles building up on a cantilevered beam, deflecting the beam until dislodging,
causing the beam to spring upward and oscillate (Beeby et al., 2006). Additionally,
Metabolic/Parasitic refers to extracting metabolic energy from living matter, such as
plants or animals, in a parasitic manner but without killing the organism. A commercially
available harvester exists which claims to be powered from tree roots for forest fire
monitoring (Voltree Power, 2009).
To narrow the scope of possible solutions, it is necessary to determine which, if
any, of the categories of harvesters are feasible given current technology and the
operating conditions of the application. One area of feasibility determination is the
harvester’s ability to provide sufficient power for a given application load. The first step
in determining power feasibility is an understanding of the environmental energy
available for harvesting. Because energy harvesters may be scaled up or down to match
the required power, a useful metric for comparison is power density. This metric is the
power the system can provide, normalized by area, volume, or mass depending upon the
system and information available. The theoretical maximum power density can be
determined from the fundamental equations or models describing each environmental
process. These theoretical maximums must also be compared to the actual power
densities observed in baseline commercial and experimental energy harvesters to be fully
reliable. A brief summary of the power densities of some energy harvesting technologies
was created by Weaver, et al., and is presented in Table 3. The simplified calculations are
based upon the primary power equations for each domain, which are used to predict
theoretical and practical maximums with common parameters. Several more possibilities
of harvesters exist than are given in Table 3. For example, studies of energy harvesting

18
from the human body are not included, but are available in the following sources
(Annalisa Bonfiglio & Danilo De Rossi, 2010; Saez, 2004; Starner, 1996).
Table 3. Power densities of several energy harvesting sources (Roundy, Wright, &
Rabaey, 2004).
2.2: ENERGY CONVERSION
Figure 10 provides a mind map of energy conversions between domains. The
domains are represented as nodes and the mechanisms or processes for converting
between domains are represented as lines linking the nodes. The choice of conversion
mechanism will affect the power density for the harvester, so a careful study of the
advantages and disadvantages particular to the application should be included when
considering energy-conversion choices. A brief introduction to most of these conversions
as well as the energy sources of Figure 9 follows, with emphasis on those most
commonly used today. Links to manufacturers of many kinds of energy harvesters and
accessories, as well as more detailed information may be found in the Energy Harvesting

19
Forum and Energy Harvesting Journal (Energy Harvesting Forum, 2011; IDTechEx,
2011).
Figure 10. A map of transduction mechanisms and processes for converting between
energy domains.
2.2.1: Solar Energy Harvesting
As shown in Table 3, photovoltaic (PV) solar power is by far the most power
dense, surpassing wind and vibration by an order of magnitude. The power available
from solar irradiation is governed by the relationship:
P EAcell (2.1)
where P is the power output (W), is the efficiency, E is the solar irradiation (W/m2),
and Acell is the area of the photovoltaic cell (m2). The current maximum efficiencies for
PV technologies are 25% for single-crystal silicon, 20% for thin-film silicon, and claims
of more than 40% for multiple-junction cells (Solar Panel Center, 2011). Most
economical PV panels use poly-crystalline, thin-film, or amorphous silicon and exhibit
efficiencies ranging from 5% to 15%. Recently, flexible photovoltaic cells have been

20
developed and are now commercially available, allowing a decrease in required storage
volume (Silicon Solar, 2011). One advantage of photovoltaic cells, besides the high
power density, is no rectification circuit is needed as the voltage out is DC.
The most significant parameter in characterizing a solar energy source is solar
irradiance, measured in watts per square meter. Long-term levels of solar energy are
described by comparing the total irradiance per day to an equivalent number of hours at a
constant irradiance of 1,000 W/m2. This relationship is called the solar insolation. Solar
irradiance is commonly measured with a lux meter. Long-term average insolation is
available in the literature for most major U.S. cities for both summer and winter
(Sundance Power Systems Inc., 2011). Levels of solar irradiation vary in the short-term
due to weather patterns and seasonal variation, but long-term average levels are
reasonably consistent and well documented (Sundance Power Systems Inc., 2011). This
makes sizing a system for a given power output a straightforward process of gathering
data on irradiation in the area, determining voltage and current needs, and specifying the
appropriate size of solar panels and battery.
Solar technology does have several shortcomings concerning some applications.
A first concern is maintenance. Solar panels designed for outdoor use often have
estimated lives of twenty years or more, but they may require periodic cleaning or other
maintenance. In many circumstances occasional rain is sufficient to remove dust, but
panels may be subject to much higher levels of debris ranging from grease and dirt to
animal droppings, bird nests, and litter. Precaution should also be used in environments
where hail occurs regularly. A second concern is the need for direct sunlight to operate at
peak capacity. In the shade, both the available irradiation and the panel efficiency itself
drastically decrease. For example, measurements taken as part of this research showed
irradiation levels of 1,132 W/m2 in direct sunlight, but only 3-15 W/m
2 in the shade.

21
Because of this result, the use of solar panels is largely confined to locations where direct
sunlight is regularly available.
A solar nantenna is a nanometer-scale antenna and rectifier array which captures
light in a manner similar to reception of radio waves by a car’s antenna. Light delivers
more energy than radio waves since the energy contained in an electromagnetic wave
increases with the frequency of the wave. At this time, this device is not practical as
diodes for rectification have not yet been able to operate at such high frequencies (Kotter,
Novack, Slafer, & Pinhero, 2008). Future implementations of nantennas are expected to
be very power dense, and continuing research is progressing to make them a reality.
2.2.2: Wind Energy Harvesting
Small-scale wind-turbines have not yet found widespread use compared to large
power generation turbines. The power available from the kinetic energy of wind is
governed by the relationship
pCvSP 3
21 (2.2)
where P is the power output (W), is the density of the air (kg/m3), S is the effective
cross-sectional area of the turbine (m2), v is the initial velocity of the air entering the
turbine (m/s), and Cp is the efficiency of the system. Betz’s Law limits this efficiency to a
maximum of 59.3%, with large-scale turbines often operating in the range of 30-50%
(Khaligh & Onar, 2009). Small-scale turbines usually have much lower efficiencies,
usually around 5-10% (Khaligh & Onar, 2009). Since wind is often intermittent, the
average power harvested by a wind turbine should be adjusted for its environment. The
capacity factor is a common way to evaluate the level at which the turbine is performing
in its environment, and is defined as the ratio of actual output power to output power at
full capacity, over a set time period. Typical wind farms have capacity factors ranging

22
from 20-40% (Renewable Energy Research Laboratory: University of Massachusetts at
Amherst, 2011).
Rotational turbines are available in two main categories: horizontal axis wind
turbines (HAWTs) and vertical axis wind turbines (VAWTs) (Khaligh & Onar, 2009;
New Energy Watch, 2011). HAWTs rotate about axes parallel to the airflow. They are
more efficient, but only operate in one direction without a yaw mechanism to turn the
blades towards the wind, as shown on the left of Figure 11. VAWTs rotate about axes
perpendicular to the airflow. Such turbines are slightly less efficient, but they are
omnidirectional; their effectiveness is not dependent on wind direction so they are
therefore better suited for variable wind directions. In addition, many can operate at
lower wind speeds than HAWTs. VAWTs come in many varieties, such as those shown
on the right of Figure 11. In addition to these two turbine types, an airfoil may be used
which flutters in the wind, allowing vibration harvesting methods to be used to further
capture the energy in a compact volume (Humdinger Wind Energy LLC, 2011).
(a)
(b)
(c)
(d)
Figure 11. Examples of some commercially available wind turbines (Helix Wind, 2011;
Sunforce Products Inc., 2011; Wikipedia Contributors, 2005; Windspire
Energy, 2011).

23
The potential limitations of using wind turbines are similar to those presented by
photovoltaic panels. Maintenance is a key issue, even more so than with solar panels as
turbines have exposed moving parts which can easily be damaged or clogged. Designing
a small, inexpensive turbine that can reliably last many years without maintenance may
be difficult. Also, like solar panels, wind turbines are dependent on the predictable
availability of power. Some may be in locations where wind is channeled in predictable
and relatively constant patterns but others may only sporadically encounter wind. Ducting
may be used to guide the wind through the turbine, but usually at the cost of becoming
more directional. Power derived from the wind is proportional to the velocity cubed, so
brief but powerful gusts may be preferable over constant but weak breezes. Thus, the
feasibility of using wind power must be evaluated on a location-by-location basis by
evaluating wind speeds with experimentation, such as extended data collection using an
anemometer. Hourly, daily, and long-term average wind velocities are also available for
many geographic locations in the literature (National Climatic Data Center, 2011).
2.2.3: Vibration Energy Harvesting
The conversion between mechanical vibration and electricity has been used for
some time in microphones, speakers, accelerometers, geophones, and seismographs;
however synthesis and optimization of this technology for energy harvesting is a
relatively recent development. The fundamental relationship describing the theoretical
power available in a vibration harvesting system with a simple sinusoidal input
acceleration at mechanical resonance is
2
2
4 ME
E amP
(2.3)
where P is the power output, m is the vibrating mass in the harvester, a is the magnitude
of acceleration experienced by the mass, is the frequency of the acceleration (with the

24
harvester designed to vibrate at the same natural frequency), and E and M are the
electrical and mechanical damping coefficients. This equation shows the general need to
maximize mass and amplitude, minimize the difference between the harvester natural
frequency and the lowest excitation frequency with appreciable amplitude, and minimize
mechanical damping (Beeby et al., 2006).
The three most common methods of vibration energy harvesting are
electromagnetic, piezoelectric, and electrostatic. Electromagnetic harvesting operates
using Faraday’s Law of Induction: a changing magnetic flux will induce a voltage in a
closed loop of conductor. In practice, this is usually accomplished by moving a magnet
and coil relative to each other to produce an AC voltage in the coil. This technology is
currently used with great success in motion-powered flashlights and watches, as well as
commercially available and research vibration harvesters as shown in Figure 12.
Inductive transducers are preferred in low frequency applications as the impedance of
inertial/inductive systems is directly proportional to frequency. This translates to
relatively low voltage and high current outputs, compared to piezoelectric and
electrostatic transducers.
In a piezoelectric harvester, an applied mechanical strain in the piezoelectric
material separates electric charges in the material, producing a voltage across its electric
terminals. The typical embodiment is a cantilever beam with a mass at the tip and
piezoelectric ceramic or polymer film attached to the upper and lower faces of the beam
such as in Figure 13 (Mide, 2011). As the beam vibrates, the films undergo cyclical
tension and compression, generating a relatively high AC voltage and low current due to
the capacitive impedance – inversely proportional to frequency. Piezoelectric energy

25
(a)
(b)
(c)
(d)
(b’) (b”)
Figure 12. Examples of electromagnetic vibration harvesting, including (a) motion
powered flashlights, (b) kinetic watches (such as (b’) the ETA Autoquartz
design and (b") the Seiko AGS generator), (c) commercial inductive energy
harvester, and (d) concept of an inductive energy harvester (Beeby et al.,
2007; Joseph A. Paradiso, 2005; Perpetuum, 2011; Seiko, 2011; ToolStore,
2011).
harvesters are often used instead of inductive harvesters when one of the following
conditions is true:
The application is too small to economically manufacture an electromagnetic
system.
(b’) (b’’)

26
The input vibration frequency is in the hundreds or thousands of Hz (piezoelectric
systems are difficult to design to resonate at low frequencies due to their high
stiffness and high impedance at low frequencies).
The vibrations are intermittent such as isolated impacts or shocks (which give
high strain rates).
The environmental conditions may be matched as an input to high impedance
performance of a piezoelectric system.
Figure 13. Bimorph cantilever piezoelectric harvester.
Electrostatic harvesters are capacitors which change either the gap distance or
normal area of opposite electrically charged plates as shown in the schematic of Figure
14a (Beeby et al., 2006). The output is similar to a piezoelectric transducer, with
impedance inversely proportional to frequency, giving relatively high voltages and low
currents. Most require a polarization voltage to be applied to the plates before energy
may be harvested, which is a significant disadvantage, but electrets may be used to
supply this voltage without an external source. The electret substance is deposited upon
the plates during manufacture and provides the polarization voltage eliminating this
disadvantage (Baxter, 1996). Electret microphones have existed for some time but
application to energy harvesting has not yet been found as part of this research.

27
Other less common methods of vibration harvesting are the use of
magnetostrictive and electrostrictive materials as well as magnetostrictive-piezoelectric
hybrids. Magnetostrictive and electrostrictive materials strain when exposed to varying
magnetic or electric fields, respectively (Z. L. Wang & Kang, 1998). A simple
magnetostrictive harvester contains a bar of Terfenol-D surrounded by a coil across
which a voltage is induced when the straining bar changes the magnetic field in the coil
(Ueno, Summers, Wun-Fogle, & Higuchi, 2008). In a slight alteration a magnetostrictive-
piezoelectric hybrid delivers a voltage from a piezoelectric crystal which is strained by
the magnetostrictive material when it is exposed to a moving magnet such as shown in
the schematic of Figure 14b (Beeby et al., 2006). These devices are not typically used in
low frequency applications due to their impedance characteristics which are similar to
piezoelectrics.
(a)
(b)
Figure 14. Electrostatic (a) and magnetostrictive-piezoelectric (b) harvester schematics
(Beeby et al., 2006).
2.3: ENERGY STORAGE
The harvested energy may be stored in a number of ways. A visualization of
results from a search of literature and available commercial products is given in Figure 15

28
in the form of a mind map. After considering the many possible methods to store the
harvested energy, the best choice must be made by considering the power and energy
required by the load as well as the maximum allowable volume. A storage method may
be energy dense, but if that energy cannot be delivered at the desired power level then the
method cannot be successfully used. An appropriate approach to determine which
methods are suitable is to compare their power and energy densities, which will allow the
user to estimate the volume that will be required. Figure 16 presents both values for
common storage methods. The values for compressed air are lacking in Figure 16 but
may be found in the literature (Paloheimo & Omidiora, 2009).
Figure 15. Mind map of energy storage methods by energy domain.
An extensive study of energy storage methods may be found in the text by
Huggins (Huggins, 2010). The most commonly used method is the liquid electrolyte
battery such as the typical Lithium-ion or Nickel Metal-Hydride battery available from

29
Figure 16. Power density of various energy storage methods (Rutman, 2004).
SAFT (SAFT, 2007) or A123 (A123 Systems, 2007). Table 4 provides a comparison
between the various types of batteries currently on the market. Lead acid batteries are
used in gasoline-powered cars, while Ni-MH and Li-ion are more common in consumer
electronics. Lithium-ion batteries necessitate protection circuitry because they can be
ruined and no longer hold a charge if they are either discharged completely or over-
heated the battery could be ruined and no longer hold a charge (Pistoia, 2005). Therefore
an additional chip must be used to manage the charge and temperature of the battery, but
these are often included with the battery system. Solid state lithium ion batteries—which
are not included in any of the figures of this chapter—have a solid electrolyte and offer
significantly longer life but are still fairly small in capacity. Infinite Power Solutions

30
(Infinitie Power Solutions, 2010) and Cymbet (Cymbet, 2011) sell the new batteries
utilizing nanometer-scale channels which prevent the cathode and anode from contacting
via dendrites which build up over time, rendering a battery unable to hold charge.
Table 4. Battery Performance Comparison (Electric-Auto, 2011).
Figure 17 compares the energy densities and power densities of additional battery
types to those of regular electrolytic capacitors and double layer ultracapacitors (aka
supercapacitors), which are missing from Table 4. Ultracapacitors are attractive because
they charge and discharge quickly and have a longer cycle life. Maxwell is one
manufacturer of ultracapacitors for all uses (Burke, 2000).
2.4: FUTURE INNOVATIONS
Future innovations may be in the hybrid use of several energy
harvesting/scavenging technologies collaboratively in one package, as well as systems of
harvesters in separate packages which network to capture energy in a more efficient,
strategic, or constant manner. Solar cells and wind turbines may supply energy when it is
available with electromagnetic generators supplying a continuous flow. Solutions which
include new functions like pre-harvesting preparation, adaptation to changes in the

31
Figure 17. Comparison of capacitors and batteries (Gerl, 2007).
source, robust handling of uncertainty, built-in sensing, and protection would have
significant impact on the field. Solar cells may be fitted with concentrating lenses, sun-
tracking equipment, and adaptive protection while vibration harvesters may be fitted with
self-tuning and bandwidth widening capabilities (Zhu, Michael J Tudor, & Beeby, 2010).
With core technologies being developed to increasingly optimized levels, significant
innovations will occur in the system-level design and its customization for particular
applications. It’s not all about reinventing the wheel. The novel use of technology and
supporting functions are innovations, beyond discovering the next revolutionary material
or technology.

32
2.5: CHAPTER SUMMARY
Energy harvesting and scavenging is a field with great potential for future mobile,
quick-install, and remote applications, enabling growth in wireless sensing applications.
There are many energy sources and types of harvesters to consider for any application,
and the number is growing rapidly. Solar, wind, and vibration harvesters possess the
highest power densities of those reviewed, with solar being most attractive with a power
density one order of magnitude above wind and vibration. Vibration harvesting possesses
one very important trait—the ability to be sealed from the environment and protected
from intentional or accidental damage—whereas solar and wind harvesters must interact
with the elements directly. Properly matching the impedance characteristics of the energy
conversion mechanism to those of the energy source must not be overlooked, and this
requires careful study of the ambient energy source. Furthermore, conditioning and
storing the harvested electrical energy are as important to the overall success of the
harvester as capturing and converting the energy, so care must be taken in the design of
these subsystems. The average number of lifecycles, operating conditions, and self-
discharge of storage devices must be considered for successful delivery to the load.
Capacitors, ultracapacitors, and lithium-ion batteries are at the top of the storage options,
due to their high energy density, easy electrical monitoring, and growing research focus.
Ultracapacitors may be used to rapidly collect bursts of energy, and then deliver this
energy to a more efficient long-term storage source, such as ceramic capacitors or
lithium-ion batteries. The near future will see solid-electrolyte lithium-ion batteries with
increased storage capacity, allowing implementation in energy harvesting applications
where their 100,000+ cycle life will help maintenance-free operation for decades.

33
Chapter 3: Broad Conceptual Design and Field Measurements
This chapter begins with conceptual design of energy harvesters of various types
in a broad sense with no imposed limitations on the concept generation process. This is
followed with the selection of one with which to focus in all future chapters. The energy
source specific to this harvester type is then quantified by measurements in the field and
analyzed in order to gain an understanding of its characteristics. With this information, a
focused literature review is performed in Chapter 4 with a better-defined scope in attempt
to generate superior conceptual designs in Chapter 5.
3.1: CONCEPT GENERATION
The conceptual design process began with unconstrained concept generation open
to all energy harvesters, regardless of the functional requirements and constraints listed in
the specification sheet. This approach was taken to generate a breadth of ideas and to be
sure that an innovative solution was not overlooked. Concepts were sketched and a mind
map was formed of all generated concepts. Mounting concepts were also generated for
the fastening of a generic harvester to a Box-girder and I-girder bridge. These concepts
were constrained to the requirements set by the project, as high importance was placed
upon mounting-specific requirements. Following this, a patent search was performed to
identify idea generators as well as to discover what has already been done. A qualitative
evaluation of the advantages and disadvantages of each harvester type resulted in the
selection of harvester type for focused concept generation.
3.1.1: Harvester Concepts
Concept generation focused on a set of key functions, which a generic energy
harvester should perform:

34
Interface with environment
Direct energy from environment
Separate energy
Transform energy
Convert energy
Store energy short term
Store electrical energy long term
Supply energy to electric load
Interface with user
Divert debris, theft, vandalism
Adapt to changing environment
Detailed functional modeling of energy harvesters and the insights gained from the
critical functions was performed by fellow graduate student on this project, Jason
Weaver, and are included in his publication (Weaver, K. L. Wood, & Crawford, 2011).
Sketches of some of the generated concepts are given in Figures 18-22. Figure 18
shows a design by analogy concept which is based upon the road hose counters that are
currently used to track vehicle traffic. A vehicle would drive over the elastomer hose,
causing hydraulic fluid inside the hose to flow through a nozzle to increase the velocity.
The motion would be converted to electricity by either a permanent magnet in a solenoid
coil or a turbine attached to an alternator. The turbine could be driven continuously by
rectifying the fluid flow through one way valves, or could be driven in an oscillatory
manner similar to the solenoid. A wire mesh could be embedded in the hose to prevent
pinching.
The “windbelt” uses aeroelastic flutter to convert wind into vibrations, as shown
in Figure 19. In this concept, strips of piezoelectric ceramic or polymer are attached to
the top and bottom surfaces of an elastic fabric in a cross-hatch pattern. The fabric is
tensioned with turnbuckles attached to a structural member. Turbulent wind causes the
fabric to flutter, straining the piezoelectric elements which generate a voltage to an
electric load. This type of wind harvester is thought to be better suited for the bridge
application than a HAWT or VAWT as it does not need to hang below the girders, which

35
Figure 18. Road hose concept.
Figure 19. Aeroelastic “windbelt” concept.
is a particularly limiting design constraint for other turbines. The windbelt could actually
benefit from the turbulence caused by the girders obstructing the airflow, whereas other

36
turbines are hindered by this obstruction. The harvester would be mounted by extending
threaded rods between girders. The rods could be tightened using a power drill with an
extension so the operator could install the system from the ground.
In an attempt to eliminate some of the disadvantages of photovoltaic panels, a
concept was generated in which panels are mounted facing down between two girders
while mirrors direct sunlight underneath the bridge2, as shown in Figure 20. In this
manner the panels would not be exposed to all of the elements, and the mirrors could
possibly be positioned such that minimal surface extends beyond the side of the bridge.
Given that photovoltaics have a power density an order of magnitude higher than wind
turbines, sufficient power might still be harvested without direct exposure. Also shown in
Figure 20 is the basic idea of using piezoelectric ceramics in the bridge’s preexisting
expansion joints. The joints are exposed to very large forces which could theoretically be
harvested, but the expansion and contraction is at a very slow rate. This makes it very
difficult to harvest energy with either vibration method.
(a)
(b)
Figure 20. Reflected solar concept (a), and expansion joint concept (b).
Two vibration harvester concepts are shown in Figure 21: a
geophone/seismometer type electromagnetic harvester, and a spring loaded impact
2 This exploits the Direct energy from environment and Divert debris, theft, and vandalism functions.

37
piezoelectric harvester. The electromagnetic harvester uses an iron structure suspended
from a helical extension spring to concentrate magnetic flux across a coil. The
piezoelectric harvester makes use of the piezoelectric material’s strain-rate dependent
voltage and poor performance at low frequency by periodically impacting the ceramic
with a spring loaded slug. The spring is compressed by the relative motion of the chassis
and weighted arm during vibration through a simple clutch and rack and pinion.
Frictional losses would have to be a focus in detailed design.
(a)
(b)
Figure 21. Electromagnetic vibration concept (a), and impact piezoelectric concept (b).
Since a vibration harvester delivers the greatest power when its resonant
frequency matches the excitation frequency, tuning is an important function which may
be included to ensure high power output3. The previous electromagnetic vibration
harvester concept was expanded to include an active measurement and tuning system,
Figure 22. The extension spring is attached to a disk which has static pin supports to
allow the disk to bend easily, with small stiffness. The disk is held in place by a
3 Tuning is covered by the Adapt to changing environment function in the previous bulleted list.

38
piezoelectric clamp and teeth to increase its stiffness similar to the way a snare drum is
tuned. As part of this concept, a comparator circuit would be contained in the harvester to
activate the piezoelectric clamps when the output voltage of the coil is below a threshold.
The teeth would hold the disk in place allowing the piezoelectric clamps to be used only
to increase or decrease the clamping force, so to minimize power usage. An additional
feature is a magnet at the bottom of the harvester to act as a soft alternative to a
mechanical stop in limiting the displacement of the translating magnet structure. The
concept’s main drawback is the low sensitivity of the coupled springs; doubling the disk
stiffness results in only a 15% increase in the combined, equivalent stiffness. As with any
harvester which tunes by changing the spring stiffness, the increase must be by a factor of
four to double the resonant frequency.
Figure 22. Concept of an active coupled-spring tuning system for an electromagnetic
vibration energy harvester.

39
Several other concepts which were generated in less detail are illustrated in
Appendix C as a mind map, sorted by energy source.
3.1.2: Mounting Concepts
Some concepts for mounting a generic energy harvester to I-girder and box-girder
bridges were generated by referring to the specification sheet discussed in Chapter 1 as
well as the requirements and desires listed below4. These requirements and desires stem
from conversations with Civil Engineers at The University of Texas at Austin.
Requirements:
Mount inside of box-girder(s) at several locations along length of bridge.
Mount on I-girder(s) at several locations along length of bridge.
Desires:
Mount outside of box-girder(s) at several locations along length of bridge.
Possible to mount without need of a man-lift truck.
Possible to mount without stopping traffic under or over bridge.
Mount with common tools and common skills.
Single mounting design for all harvester designs.
Alteration of the bridge structure is restricted in this project, which prohibits
welding, drilling, cutting, gluing, and magnetic fastening. The first three methods are
prohibited as they may deteriorate the structural integrity of an already weakened
structure. The last two methods are restricted because secure, long-term connection
cannot be fully guaranteed, and the liability of public injury from falling objects onto
roadways would be an unnecessary risk. Fastening using magnets to the steel girders
4 Mounting concentrates upon the Interface with environment, Direct energy from environment, Interface
with user, and Divert debris, theft, and vandalism functions.

40
seems, at least to the author, to be an excellent choice as extremely high pull neodymium
magnets may be purchased commercially which are rated to high temperatures, and
installation time could be minimized.
Figures 24-23 show some of the generated fastening concepts. Clamping to the
web stiffeners and cross-frames of I-girders are the easiest solution, and since several
such structures exist along the spans of the bridges, harvesters may be mounted in many
locations. A web stiffener is a vertical plate, 0.5-0.625” thick, extending between the top
and bottom flanges of the I-girder, as shown in Figure 24b. Cross-frames are truss-
structures constructed of angled steel, 0.25-0.5” thick, which span between I-girders, as
shown in Figure 24a,b. For the box-girder bridge, vibration harvesters could be housed
inside of the girder as shown in Figure 23b. Mounting an energy harvester between two
box-girders is fairly difficult due to the trapezoidal shape of the girders, and the very
small (~0.5”) flange at the bottom of the girders. Therefore a concept was generated to
mount a harvester to the outside of a girder by extending threaded rods with footpads
between the bottom of the deck and the top of a support column. Since this concept relies
on a support column, harvesters may not be placed at many locations along the bridge
span.
(a)
(b)
Figure 23. Box-girder mounting concepts.

41
(a)
(b)
(c)
(d)
Figure 24. I-girder mounting concepts.
3.1.3: Relevant Patents
Patents expressly including energy harvesting on bridges and roadways were
reviewed to understand approaches which have already been pursued. The patent search
was performed following the broad concept generation in order to avoid fixation on
designs similar to those in the patents. Many energy harvesting patents exist which do not
focus on bridges or roadways, but the scope of this search was limited to this application.
Of the patents found, a few relied upon vehicles driving over rollers, spring-loaded plates,

42
and spring loaded pistons to turn electric generators (Martinez, 1978; Smith, 1978;
Toberman, 1975). These solutions would likely give high power but violate the constraint
that no part of the harvester may be placed on top of the road surface or interfere with
traffic. Another patent proposed placing piezoelectric cylinders in airport runways and
roads to be compressed by the tires directly (Abramovich, Harash, Milgrom, & Amit,
2009). This patent seems to discuss only the general idea, not a detailed design. Another
general idea (Retti, 2007), proposes solar or thermoelectric panels on the road surface
which would capture electricity to inductively charge passing electric vehicles.
Surprisingly, a patent exists proposing the harvesting of bridge expansion joints
(Bradford & Pabst, 2009). The system uses a transmission to amplify the vertical
displacement between two bridge sections caused by vehicles passing over the joint. The
transmission drives an electric generator to convert the energy into usable form. A basic
calculation presented in the patent predicts an average power of 10 W for one truck
passing every nine seconds, based upon one set of measured displacement and traffic
data. The design requires the harvester to be implanted in the joint during bridge
construction or retrofitting, making monitoring of existing bridges very expensive. It is
concluded from this patent search that the field of energy harvesters for bridge
application is far from saturated.
3.2: CONCEPT SELECTION
After review, the most feasible energy harvesting sources for bridge monitoring
were identified by The University of Texas Mechanical Engineering Energy Harvesting
design team as:
Solar radiation using photovoltaic cells
Wind flow from the environment and traffic

43
Vibration of the bridge from traffic
Solar cells are of highest power density by an order of magnitude (Weaver et al.,
2010), but concerns by bridge engineers over mounting above or to the side of the bridge
as well as obstruction by dirt and bird waste, damage by vehicles, hail and vandals, and
theft raise some doubt. Of next highest power density is wind (Weaver et al., 2010),
which inherits similar concerns unless located on the underside of the bridge which
introduces obstruction to the airflow. Vibration harvesters have lower power densities but
can be sealed from the environment or placed inside box-girders. Piezoelectric ceramics
are naturally stiff, resulting in high natural frequencies and thus are typically used in
applications where dominant frequencies are above 40 Hz (Priya & Inman, 2008).
Dominant frequencies measured from local bridges are below 15 Hz and typically less
than 5 Hz, increasing the difficulty of using piezoelectric harvesters. The details of this
data analysis are discussed in Chapter 4. Electrostatic harvesters could work but there is a
strong concern about robustness, given that the harvester would cease to produce power if
the polarization voltage was ever lost. Electromagnetic harvesters are more robust
because they rely upon a permanent magnetic field, and are naturally suited for low
frequency vibration as the large mass of a permanent magnet works to decrease the
natural frequency of the harvester. (Beeby & O’Donnell, 2008) performed a detailed
study of micro vs. macro-scale generators finding that efficiency is much lower in micro
systems due to the scaling of coil resistance and inductance. Piezoelectric harvesters are
used most often in commercial applications because they are low in mass and may be
incorporated in MEMS structures easily as laminates. As there is room for macro scale
systems on a highway bridge, the focus for this design effort was on macro-scale systems.
After review the energy harvesting team decided to pursue an electromagnetic vibration
harvester for the author’s thesis, and a piezoelectric vibration harvester and a vertical axis

44
wind turbine to be pursued by two other graduate students. A solar photovoltaic harvester
was developed by an undergraduate research assistant with collaborative effort from each
of the graduate students. In this way the energy harvesting team explored several options
in parallel with possibilities to expand or consolidate as the project progresses.
3.3: FIELD MEASUREMENTS
With the decision to pursue vibration harvesting, the next step is to gain an
understanding of the vibrations present in highway bridges. To assess this vibration, low
frequency, high resolution Crossbow CXL02LF1Z accelerometers were placed on the
box girders of the IH-35N-US-290E direct connector and the I-girders and cross-frames
of the SH-71E bridge over US-183 and the IH-35N bridge over the Medina River. For the
box girder bridge, accelerometers were placed longitudinally along one girder over two
spans of a four-span, twin box-girder bridge to evaluate the variation of amplitude and
frequency at various distances along the bridge axis. The two spans were 210 and 230
feet long, respectively, with sensors distributed evenly along the spans. Samples were
recorded at 100 Hz for approximately one week.
The layout of the sensors may be seen in Figure 25 and Figure 26, along with 60
second samples in which a fuel truck, garbage truck, and moving truck passed over each
sensor. The maximum and minimum accelerations, relative to gravity, measured during
these samples are also included. Minimum, maximum and RMS acceleration amplitudes
for each sensor over approximately one day are shown in Figure 27, following the same
trend as the previous figure but with slightly larger peak amplitudes. The first span
experiences its highest acceleration half way through the span and its lowest at its right,
eastern end, which is expected. The relatively high acceleration at the abutment is likely
due to the energy transferred from the vehicles as they traverse the expansion joint at the

45
beginning of the bridge. Smaller accelerations are found on the second span, likely due to
the increased flexibility and damping of the straddle bent support at its furthest end. The
increased damping likely caused the reduction in sharpness of the peaks corresponding to
each vehicle, as compared to those on span 1.
Figure 25. Accelerometer locations in first two spans of IH-35N-US-290E direct
connector.
Figure 26. 60 second acceleration waveforms at each sensor location showing three
passing trucks.

46
Figure 27. Minimum, maximum, and RMS acceleration by sensor location on box-girder
bridge.
The frequencies also varied with sensor location along the bridge. Figure 28
shows the power spectrum of each sensor on span 1, and Figure 29 shows the same for
span 2. The spectrograms are on a logarithmic vertical scale with each subplot having the
same range to aid in comparison. The high wideband noise present from sensors 3 and 4
were due to defective accelerometers, as was verified in a later experiment. For both
spans, the frequencies of highest power are around 1.8, 2, 4.1, and 5.3 Hz.

47
Figure 28. Acceleration power spectrum of span 1, showing variability of frequencies
with sensor location.
The dependability of the frequencies of interest may be observed by a
Spectrogram, which is a plot composed of a series of power spectrums over consecutive
time spans. A spectrogram of approximately 4.5 hours of data from sensor 2 on span 1 is
given in Figure 30 with a power spectrum of the entire time period underneath. Regions
of highest power are colored in red, with lowest intensity colored in green. This
spectrogram shows good stability of the frequencies of interest since the lines are vertical,
at least in this time frame. A comprehensive analysis would encompass a much longer
time span. The variability with the seasons of the year may be seen by combining
spectrograms of each season after acquisition of additional bridge data. Also included in
the spectrogram are thin horizontal lines—such as the one at 6000 seconds—representing

48
short excitations across all frequencies in range. These are likely the result of impacts
caused by the heaviest vehicles traversing the expansion joint as they enter the bridge.
Figure 29. Acceleration power spectrum of span 2, showing variability of frequencies
with sensor location.
The amplitude levels were similar for the three bridges instrumented, but each
bridge was found to have a different frequency range, which was observed via a power
spectrum. The stiff box-girder bridge was dominated by 1-10 Hz vibrations, while the
short-span I-girder bridge occupied the 10-20 Hz range. The second I-girder bridge was a
half-century older and vibrated between 5 and 25 Hz, depending upon traffic. The bridge
vibration is mostly induced by heavy vehicle traffic such as trucks and buses, which
indicates some dependence on the amount of traffic and speed. This dependency rapidly
increases the complexity of predicting available energy for harvesting. Even so, there

49
exist some models of bridge vibrations excited by traffic, showing vibration patterns
predominantly in the 1-15 Hz range (Cheung, Au, Zheng, & Cheng, 1999; B. T.-lo Wang,
Huang, & Shahawy, 1992; Yin, Fang, Cai, & Deng, 2010). Each bridge has different
geometry, supports and traffic loads, which have varying effects on the bridge response.
Data were recorded at levels of both high and low traffic, where shifts in frequencies
were observed, but further data analysis is needed to decouple the effects of added
vehicle mass from the effects of temperature on the response of the bridge. This effort is
ongoing with the significant portion of work being performed by the Civil Engineers
involved in this project.
Figure 30. Spectrogram and power spectrum of accelerometer 2 of span 1, showing the
stability of dominant frequencies over approximately 4.5 hours.

50
3.4: CHAPTER SUMMARY
The key functions a fully evolved energy harvester should perform were
identified as: interface with environment, direct energy from environment, separate
energy, transform energy, convert energy, store energy in short term, store electrical
energy in long term, supply energy to electric load, interface with user, divert debris,
theft, vandalism, and adapt to changing environment. Considering these functions, many
concepts were generated and organized into a mind-map. Several of these were further
developed and sketched, including road hose, wind-belt, reflected solar, expansion joint,
electromagnetic vibration, and piezoelectric impact concepts. A few concepts were
generated for mounting a generic harvester to the two most-common bridge types: I-
girder and box-girder, with a focus on meeting the limiting design constraints set by the
project. Patents relating to energy harvesting from bridges and roadways were briefly
presented, with the most developed invention harvesting the motions of expansion joints
from within the bridge. After review, the author selected vibration harvesting using
induction for further development. Harvesting vibrations requires more sophisticated
design, incurring larger risk than solar or wind harvesters, but with greater satisfaction of
the project requirements and constraints if successful. To counter this, other students on
the project are pursuing solar and wind harvesters in parallel efforts. To characterize the
bridge vibrations, accelerations were measured at various positions and times and
analyzed in the frequency and time domains. Further measurement and analysis is being
performed by a Civil Engineering graduate student on the project, with a focus on
temperature and traffic effects. The data presented thus-far shows stable, dominant
frequencies in the 1.5-16 Hz range which may be harvested by tuned linear harvesters.

51
Chapter 4: Review of Electromagnetic Vibration Energy Harvesting
A literature review was performed to identify areas of opportunity, resulting in a
discussion of important research work, review article, associated circuitry, and
applications of electromagnetic vibration energy harvesting. Various functions and
topologies utilized are discussed, emphasizing their contribution to improved energy
harvesting in their environment. Two such functions are resonant frequency tuning and
bandwidth widening. The review is presented by answering the following questions:
1. What are the fundamental works in the field?
2. How can the harvester’s resonant frequency be tuned?
3. How can a wide bandwidth harvester be achieved?
4. What circuitry is needed for high efficiency?
5. What works are specific to low frequency applications?
4.1: WHAT ARE THE FUNDAMENTAL WORKS IN THE FIELD?
The seminal paper concerning harvesting vibrations is by (Williams & Yates,
1996)5 at the University of Sheffield, U.K. The paper serves as a feasibility study where
the performance of a simple mass, spring, electric and mechanical damper model,
utilizing a generic electromechanical transducer is predicted analytically. Equation 4.1
shows the key governing equation of harvested power (P) in terms of mass (m),
excitation frequency (ω), natural frequency (ωn), excitation displacement amplitude (Yo),
electrical damping ratio (ξe), and mechanical damping ratio (ξm).
(
)
[ (
) ]
[ ( )
] (4.1)
5 This chapter contains many figures from the sources under review, with citations to the original source.
The author of this thesis does not claim copyright on any figures or tables with a citation in the caption.

52
The analytical model is used to gain insight into the relation of each of these
variables to increased harvested power. The first insight is the harvester’s natural
frequency should be designed to match the highest excitation frequency with adequate
displacement amplitude, as the generated power increases with the cube of the frequency
and the square of the displacement amplitude. Second, an increase in seismic mass is
desired, at least much as is permitted by the design constraints. Third, it is desired to
reduce total damping (electrical + mechanical) for high peak power if the excitation is of
a constant frequency, or increase total damping for wider bandwidth and average power
at the cost of peak power if the excitation frequency shifts or is broadband. Finally, the
parasitic mechanical damping should be reduced as much as possible while the electrical
damping should also be reduced but remain significantly higher than the mechanical
damping. Geometric constraints place a limit on the minimum allowed electrical damping
ratio, since the maximum displacement increases with total damping. Given a specified
maximum displacement (Zmax), the maximum generated power is expressed by Equation
4.2, which assumes the harvester is operating at resonance (ω=ωn).
( ) (4.2)
The first published concept that applies this specific theory was a MEMS
generator with a magnet suspended from a diaphragm above a coil as shown in Figure
31a, one year later at the same university, (Shearwood & Yates, 1997). The first
prototyped harvester powered a Digital Signal Processing chip by a spring suspended coil
near a permanent magnet as shown in Figure 31b. A static magnet rather than coil
necessitates flexible or sliding electrical contacts, but specific reasons for this decision
were not given. It could be because the system is likely inspired by loudspeakers, which
use a moving coil to achieve relatively high frequency voice representation. The

53
prototype was intended to harvest human walking, but quickly shifted focus to higher
frequency vibration.
(a)
(b)
Figure 31. First concept (Shearwood & Yates, 1997) (a), schematic of first prototype
(Amirtharajah & Chandrakasan, 1998) (b).
(El-hami et al., 2001) and (El-hami, Glynne-Jones, N. M. White, & Beeby, 2000)
at the University of Southampton, U.K. replaced the spring by a cantilevered beam, and
used soft ferromagnetic iron plates to concentrate the magnetic flux density through the
coil, resulting in increased power density. (Glynne-Jones, M J Tudor, Beeby, & N M
White, 2004) further increased power density by using two magnetic poles rather than
one, therefore increasing the magnetic flux gradient, as shown in Figure 32.
(a)
(b)
Figure 32. Increasing magnetic flux gradient by utilizing two sets of magnets rather than
one (Glynne-Jones et al., 2004).

54
(Stephen, 2006) introduced the concept of tuning resonant frequency to the
excitation frequency to maximize generated power. He proved analytically that for
maximum generated power, harvesting of a variable excitation frequency should begin at
the lowest excitation frequency with adequate power. The harvester should then be tuned
as the excitation frequency increases. He also presented an expression for optimal power
transfer from a harvester to its load by impedance matching, shown by Equation 4.3. This
equation relates the electrical load impedance (left side) to the total (electrical +
mechanical) harvester impedance (right side).
(4.3)
where Rl is the load resistance, Rc is the resistance of the coil, K is the electromechanical
conversion coefficient relating the coil electromotive force (EMF) to magnet velocity (or
conversely the coil current to the force imposed on the magnet), and cm is the mechanical
viscous damping coefficient.
Four papers found during this literature review provide a fairly comprehensive
review of work done in electromagnetic vibration harvesters: (Beeby & O’Donnell,
2008), (Beeby et al., 2006), (Arnold, 2007), and(Zhu et al., 2010). (Beeby & O’Donnell,
2008) tabulated many electromagnetic vibration harvesters giving author, location, date,
maximum output power P, center vibration frequency F, peak vibration amplitude A,
volume, normalized power NP (normalized at A=1m/s2) and normalized power density
NPD (normalized by volume). Additional works were added to this table resulting in
Table 5.
Most vibration energy harvesters are second order systems with a resonant peak at
the natural frequency and attenuation at either high or low frequencies depending upon
system parameters. The total damping dictates how sharp (high Q-factor) the resonant
peak is. A harvester with little damping has a sharp resonant peak which covers a very

55
narrow frequency band (Williams & Yates, 1996). Deviations of the excitation frequency
from the harvester’s resonant frequency will result in significant loss of harvested power,
especially if the harvester’s damping is low. Damping may be increased to make the
harvester more robust to a dynamic excitation source, but at the loss of peak harvested
power (Williams & Yates, 1996). An ideal vibration harvester would be implemented on
several bridges of each type, regardless of the bridge’s vibration characteristics. For this
to be possible the harvester should be capable of tuning its resonant frequency and/or
have a wide bandwidth. Methods for achieving both, with examples, are investigated by
the next two questions.
Table 5. Electromagnetic harvester properties (Beeby & O'Donnell, 2008).
Reference Year P ( µW) F (Hz) A (ms-2) Volume (cm3) NP NPD
Shearwood 1997, Sheffield University (UK) 1997 0.3 4400 382 0.025 2 x 10⁻⁶ 8 x 10⁻⁵
Amarithajah 1998, MIT (US) 1998 400 94 - - - -
Li, Hong Kong University (China) 2000 10 64 16.16 1 0.04 0.04
El-hami, University of Southampton (UK) 2001 530 322 102 0.24 0.05 0.21
Ching, Hong Kong University (China) 2002 830 110 95.5 1 0.09 0.09
Mizuno, Warwick University (UK) 2003 0.0004 700 12.4 2.1* 3 x 10-6 1 x 10⁻⁶
Huang, Tsing Hua University (Taiwan) 2003 1.4 100 19.7 0.03* 0.004 0.12
Glynne-Jones (2001), University of Southampton (UK) 2004 2800 106 13 3.66 16.6 4.5
Kulah, Michigan University (US) 2004 0.004 25 - 2 - -
Perez-Rodrfguez, Univerity of Barcelona (Spain) 2005 1.44 400 63 0.25 4 x 10⁻⁴ 1 x 10⁻³
Beeby, University of Southampton (UK) 2005 0.021 9500 1.92 0.3 5 x 10⁻³ 0.02
Scherrer, Boise State University (US) 2005 7000** 35 - 9 - -
Beeby, University of Southampton (UK) 2007 58 52 0.59 0.15 166 1110
Wang, Shanghai Jiao Tong University 2007 - 121 14.7 0.1* - -
Hadas, Brno University of Technology (Czech Republic) 2007 3500 34.5 3.1 45 364 8.1
Sari, Middle East Technical University (Turkey) 2007 0.5 3300-3600 - 1.4 - -
Serrer, University of Barcelona (Spain) 2008 55 380 29 0.8* 0.07 0.08
Perpetuum PMG-17, UK company 2008 1000 100 0.25 135 16000 118
Ferro Solutions VEH-360, US Company 2008 430 60 0.25 250 6880 28
Lumedyne Technologies, US Company 2008 1000 53 1 27 1000 37
*Estimated value from literature
**Simulated value

56
4.2: HOW CAN THE HARVESTER’S RESONANT FREQUENCY BE TUNED?
A harvester’s resonant frequency can be tuned mechanically or electrically. Most
EM harvesters utilize mechanical methods, as the dominant electrical method is through
the use of piezoelectric ceramics. In electrical tuning, an applied voltage or capacitance is
used to control the stiffness of a piezoelectric material, effectively changing the resonant
frequency. The capacitance is changed by switching in/out capacitors connected in
parallel to the piezoelectric ceramic (Charnegie, 2007). This method is not as efficient as
some mechanical methods, but is straight-forward to implement in situ to adapt to rapidly
changing excitations. The method could be adapted to an inductive system by adding
piezoelectric material to a cantilever beam then increasing or decreasing that beam’s
stiffness.
Mechanical tuning methods are generally more efficient but typically add more
mass and volume than electrical methods, reducing power density. Mechanical systems
cannot tune as fast as electrical methods, making them less suitable for in situ tuning
(although it is still possible). Common mechanical methods include changing stiffness
through geometry or magnetic fields, altering axial preloading, or shifting the center of
gravity.
The most commonly changed dimension is the length of a cantilevered beam.
This method is applied manually by (Beeby et al., 2007) who uses a simple clamp, and
actively in a patent by (Gieras, Oh, Huzmezan, & Sane, 2005) which uses a linear
actuator to adjust the clamping position as shown in Figure 33a. Higher frequency
sensitivity is achieved by decreasing beam length rather than increasing, especially if
reduced more than 60%, Figure 33b. This method does not introduce extra damping so
long as the clamp is tight, but is relatively difficult to implement in an energy efficient
manner.

57
(a)
(b)
Figure 33. Patented tuning by changing clamped length via actuator (Gieras et al., 2005)
(a), and variation of resonant frequency with change in beam length (Zhu et
al., 2010) (b).
The method of changing the center of gravity (CG) also introduces no damping
and has been successfully used in one prototype where a bolt was threaded in/out through
a proof mass at the free end of a cantilever (Wu et al., 2008). The variation of resonant
frequency with change in center of gravity is shown in Figure 34a, with highest

58
sensitivity when the CG is close to the beam’s base. This method is fairly difficult to
perform in situ as the mass to be shifted is vibrating with the beam, although it would be
possible to automate.
The utilization of compressive and tensile axial loading has also been successfully
implemented with cantilevers. Compressive loading is more common as it has greater
sensitivity than tensile loading (Figure 34b), but at the cost of additional mechanical
damping (Zhu, Roberts, Michael J Tudor, & Beeby, 2008). One concept actively changes
the tensile preload of a cantilever using magnetic attraction to prevent the addition of
damping, as shown in Figure 35. One magnet is fixed to the free end of the cantilever and
the other to a linear actuator. To maintain a constant tensile force and prevent
introduction of other magnetic forces, concave and convex magnets are used to maintain
the gap distance constant throughout the full range of travel. Implementation of the axial
loading method is relatively straight-forward and in situ adjustment may be performed,
but energy consumption would be high due to large forces.
(a)
(b)
Figure 34. Change in normalized resonant frequency with normalized center of gravity
(a), and axial preload (b), (Zhu et al., 2008).

59
Figure 35. Concept to add tensile preload using magnets (Zhu et al., 2008).
Magnetic forces have also been used to alter the compliance of a harvester. Figure
36a shows a piezoelectric cantilever whose frequency is tuned by translating the beam
vertically with a power screw to change the initial spacing between magnets on the
housing and tip of the beam. The effective stiffness is reduced when the beam is closer to
the top attracting magnet, and increased when closer to the bottom repulsive magnet. A
disadvantage to this tuning method is the introduction of damping at all but the untuned
natural frequency (Challa, Prasad, Shi, & Fisher, 2008). Adjustment of the prototype is
performed manually, but the authors suggest adding an actuator to automate tuning. The
two other concepts shown in Figure 36 rely completely upon magnets as the compliant
member rather than a spring or cantilever. This approach allows easy tuning by threading
the spring magnets relative to the translating magnet. Both methods were prototyped with
tuning performed manually although in situ adjustment would likely be easier than other
mechanical methods. The use of magnetic compliance in this manner does not introduce
damping unless the force is larger than the inertial force of the moving mass, inhibiting
its motion (Zhu et al., 2008).

60
(a)
(b)
(c)
Figure 36. Adjustment of compliance through magnetic forces for (a) piezoelectric
cantilever with magnetic tip mass, (b) permanent magnet linear generator,
and (c) permanent magnet generator, (Challa et al., 2008), (Mann & Sims,
2009), (Spreeman, Folkmer, Maurath, & Manoli, 2006).
A breadth of tuning methods exist including electrical, mechanical, passive,
active, intermittent, and continuous, each with advantages and disadvantages. The
advantages and disadvantages of electrical and each type of mechanical have been
presented in context. Active tuning, either intermittent or continuous, comes at the cost of
energy as the actuators require power to tune the harvester, but with potential to net more
energy capture. Calculations must be performed to validate the required energy usage and
potential gain particular to the harvester, actuator, and excitation. Excitations which shift
quickly would benefit most from continuous tuning, but the required energy would be too
great for most other applications. Bridge vibration harvesting is an application which
could use passive tuning to set the frequency to a specific location on a specific bridge,
but a return trip to alter the tuning at a later time would likely not be worthwhile. It is
possible that an intermittent, active tuning system could be successfully designed for the
bridge application, but a more robust solution would be to increase the bandwidth of the

61
harvester to cover all frequencies it will experience throughout its use. For other
applications tuning will likely grow in popularity as the harvesters evolve into smart
structures in order to maximize energy harvesting from sources characterized by fewer
simultaneous frequencies.
4.3: HOW CAN A WIDE BANDWIDTH HARVESTER BE ACHIEVED?
Wide bandwidth harvesters are capable of capturing energy from multiple
frequencies simultaneously over a large range. Many harvesters employ a bandwidth
widening technique to increase the robustness for non-stationary and/or aperiodic
excitations, where tuning becomes complex. Wide bandwidth systems can harvest from
rapidly changing frequencies as they do not require time to adapt like tunable harvesters.
Common methods include the use of arrays of harvesters, coupled harvesters, high
damping, and nonlinearities such as mechanical stops, bistable structures, magnetic
fields, and nonlinear compliance.
The most basic method to widen bandwidth is to increase damping (either
mechanical or electrical). This method reduces peak power output but increases average
power output across its bandwidth. This method therefore works best when ample
acceleration is available but at unpredictable frequencies (Beeby et al., 2006). The
resistance of the electric load could be changed to alter the electric damping to widen the
bandwidth intermittently, although an example of this being used in vibration harvesting
has not been found.
If ample volume is available and the harvesters are not too expensive, using an
array of harvesters tuned to different frequencies is a viable option that is not as complex
as many others. With an array, peak power is not diminished by the widening technique
and additional damping is not introduced. (Xue, Hu, & Q.-M. Wang, 2008) demonstrated

62
how bandwidth is widened by increasing the number of piezoelectric cantilevers in series
and how the bandwidth may be shifted by changing the number in parallel. The use of
arrays is not as common since much vibration harvesting applications require small
packages. The bridge application has room for an array, so the cost of each harvester and
the total number required become the driving factors.
Another method utilizing nonlinearity is to add a mechanical stop along the length
of a cantilever beam. This method effectively changes the beam length upon impact,
increasing the frequency of oscillation of the portion between the stop and beam end. The
nonlinearity is not seen until high amplitude vibration is caused by adequate energy in the
excitation, such as an impact. The disadvantages of this approach are the introduction of
fatigue and the reduction of peak output power.
Bandwidth has also been widened by mechanically coupling multiple harvesters.
Two examples are given in Figure 37, the first of which uses two masses (magnets)
connected in series with springs. Each coil is mounted to the housing to harvest the total
motion of both masses rather than the relative motion between the masses. Additional
masses could be used to increase the bandwidth further. The second example uses
multiple masses (magnets) distributed along a supported beam. The beam is designed to
harvest the beam’s first three modes of vibration, which may be designed by changing the
beam geometry and mass locations. Mechanically coupled harvesters are simple to design
and build, but produce reduced peak output power, a common disadvantage.
Another strategy is to include nonlinear compliance such as nonlinear springs or
repelling/attracting magnets. The frequency response of the harvester is identical to a
linear system when excited at low amplitudes, and then becomes increasingly nonlinear
as excitation amplitudes increase, as shown in Figure 38a. The nonlinear system delivers
higher power output at frequencies higher than its equivalent linear resonant frequency,

63
so long as sufficient excitation is present to maintain the large oscillations. When this is
no longer true, the oscillation transfers to a lower amplitude state. This is shown in Figure
38a as the solid line to the right of the dashed line. The load resistance may be tuned to
maintain high amplitude oscillation for higher power levels (Mann & Sims, 2009). An
inherent trait is the hysteresis between response to increasing and decreasing frequencies,
as shown in Figure 38b. When the harvester is exposed to decreasing frequencies, it
remains in a low-amplitude oscillation state, whereas increasing frequencies allow a high-
amplitude state. Further work needs to be carried out to evaluate the performance of
nonlinear harvesting of sources with many frequencies, like that of a highway bridge. The
three harvesters previously discussed and shown in Figure 36 utilize nonlinear magnetic
compliance to widen bandwidth as well as provide a tuning mechanism.
(a)
(b)
Figure 37. Power from a coupled two-mass system and equivalent one-mass system (a)
(Zhu et al., 2010), and coupled harvester utilizing the first three modes of a
beam (b) (B. Yang et al., 2009).

64
(a)
(b)
Figure 38. Increasing nonlinear response with increasing excitation amplitude (from top
to bottom) (a), and hysteresis for a typical nonlinear harvester (b) (Mann &
Sims, 2009) (Beeby et al., 2007).
One interesting patented harvester design by (Dick, Fralick, Jazo, Kerber, Brewer,
et al., 2009)combines coupled harvesters with nonlinear compliance for harvesting of

65
wideband ambient vibrations. In this device, a magnet is suspended from an extension
spring above a coil, with an opposing magnet resting on a compression spring below the
coil, as shown in Figure 39. The magnets repel each other, thus making them
magnetically coupled. As the magnets move close to each other, the field intensifies
through the coil generating a voltage. The nonlinear compliance results in wide
bandwidth and provides tunability by switching the springs for others with higher or
lower spring rates.
Figure 39. Coupled harvester with magnetic compliance to achieve wide bandwidth
(Dick, Fralick, Jazo, Kerber, Brewer, et al., 2009).
It is also possible to exploit bistable behavior to widen bandwidth. Bistable
structures are characterized by two regions of low potential energy separated by a region
of higher potential energy. This “double well” potential as it is often called is exemplified
by Figure 40a, which shows varying degrees of potential wells resulting from different
parameter values. These systems perform better than linear harvesters at excitation
frequencies significantly lower than the resonant frequency (Zhu et al., 2010), provided
the excitation contains enough energy to transition the system between low potential
states. (Cottone, Vocca, & Gammaitoni, 2009) designed and tested a bistable
piezoelectric cantilever which used axially repelling magnets at the tip to achieve

66
approximately 600% increase in power compared to the harvester without bistability. The
degree of bistability was controlled by the distance between the repelling magnets, with
increasing bistability as the gap was reduced (see Figure 40a). An interesting bistable EM
vibration harvester was developed by (Xing et al., 2009) which used magnetic attraction
between a highly permeable cantilever and static magnets located at the limits of
deflection, as illustrated in Figure 40b. The iron-based high permeability material allows
the cantilever to be easily magnetized and attracted to the magnets, giving “wells” of low
potential energy at the limits. The elasticity of the cantilever acts to restore the beam to
its neutral position which is of higher potential than either limit. Since the magnets are
oppositely polarized, the coil sees a moving magnetic field of varying intensity, resulting
in higher induced voltage than just a moving field of constant intensity.
Several bandwidth widening methods were found with examples, advantages, and
disadvantages of each. The bridge monitoring application seems to favor a wideband
harvester over a tunable harvester, given the wideband excitation. The application is not
constrained by the volume required by a harvester array or mechanically coupled system,
making them worthy of further pursuit. The potential for nonlinear, amplitude limited,
and bistable methods is dependent upon adequate excitation to maintain the high energy
state, so more investigation is required to evaluate the feasibility of successful
implementation of these methods to the bridge application.
4.4: WHAT CIRCUITRY IS NEEDED FOR HIGH EFFICIENCY?
To power the project’s wireless system as it is designed, a vibration harvester
must store the harvested energy between uses, as the power density is too small for direct
power usage. The power generated by a vibration harvester is AC which must be rectified
before it can be stored in a capacitor, ultracapacitor, or battery. For an efficient system

67
the impedance of the load must match the harvester (Stephen, 2006), leading to the use of
voltage regulators between rectification and storage circuits. For these reasons the typical
system is composed of subcomponents to perform the functions of rectify, regulate, store,
and deliver upon need.
(a)
(b)
Figure 40. Bistable potential field (a), and bistable EM harvester (b) (Cottone et al., 2009)
(Xing et al., 2009).
A basic system for these functions is composed of a full-wave rectifier with
smoothing capacitor, DC-DC voltage regulator (buck-converter if decreasing voltage,

68
boost-converter if increasing voltage and buck-boost converter both are desired), storage
capacitor or lithium-ion battery with charge controller, and switching circuitry to deliver
the stored energy to the load (Priya & Inman, 2008). An impedance matching circuit
could also be added between the storage and load. The most important property of the
storage device is leakage, or self-discharge, which is minimized in tantalum and ceramic
capacitors as well as solid-state lithium-ion batteries (Dick, Fralick, Jazo, Kerber,
Brewer, et al., 2009), (Infinitie Power Solutions, 2010). The downside of using lithium
batteries is the additional power needed to monitor an over/under voltage protection
circuit.
Research to increase the efficiency of rectifiers has led to three solutions: passive,
low forward threshold voltage diodes, switching converters, and a switching inductor in
parallel with the rectifier. Standard diodes have a threshold voltage of 0.7 V, blocking
current until the voltage rises above the threshold. Schottky diodes may be used to boost
efficiency as they have low leakage, low on-resistance, and low forward threshold
voltage of 0.375 V (Dick, Fralick, Jazo, Kerber, Brewer, et al., 2009).
Much work has been developed in the piezoelectric domain, as this domain is by
far the most prominent in vibration harvesting. A common method is Synchronized
Switch Harvesting on Inductor (SSHI), which uses a switch and inductor in parallel with
the rectifier to change the voltage shape into a square-wave synchronized with the strain-
rate of the piezoelectric. The result is drastically increased efficiency, but the method
only works for transducers with low electromechanical coupling like piezoelectrics, so
EM harvesters require an alternative. The frequency and output voltage from an EM
harvester is usually lower than a piezoelectric or electrostatic harvester and the circuitry
must accommodate. (Rincon-Mora, 2009) discusses methods which may be used with
EM harvesters, including switching AC-DC converters (rectifiers) and switching DC-DC

69
converters. In these methods, triggered MOSFETs are used to conduct when the voltage
is above 0 V and block when negative to give a very low effective threshold voltage.
Some commercial devices are available from Advanced Linear Devices (Advanced
Linear Devices, 2011). In addition, the triggering may be used to match impedance to
further boost efficiency.
(Curry, 2008) developed a system with four times the efficiency of a basic passive
system which is now offered commercially as the Ambiosystems AmbiomoteTM
(AmbioSystems, 2011). The circuit, designed for a low frequency EM harvester, uses a
full-wave rectifier and actively triggered DC-DC buck converter composed of BJT
MOSFETs, operating in Discontinuous Conduction Mode. The converter requires a
timing signal which is supplied by an embedded microcontroller’s pulse-width
modulation function which is software-timed (allowing for adaptation of timing to
different bridges). The Texas Instruments MSP 430TM
is an excellent low power
microcontroller for this purpose. The harvester first charges a small capacitor which
enables the microcontroller to power on, allowing efficient charging of a larger capacitor
for storage. A general block diagram of the system is presented in Figure 41a. The system
enables the WSN node to record a measurement and transmit whenever enough energy is
stored in the large capacitor, following the state diagram shown in Figure 41b. Similar
but more general and less advanced circuits and transmitters are offered by Texas
Instruments, Crossbow, MEMSIC, and Microstrain (Dick, Fralick, Jazo, Kerber, &
Waters, 2009). Many of the components for these devices may be purchased from Linear
Technology (Linear Technology, 2011).
There is much more to be reviewed in the field of vibration energy harvesting
circuitry, but the scope of this thesis is set upon the electromechanical design and detailed
circuitry will follow after successful implementation. For now, knowledge of the

70
existence of a specialized, high-efficiency EM harvesting circuit available commercially
suffices.
(a)
(b)
Figure 41. System block diagram (a) and state diagram (b) (Sazonov et al., 2009).

71
4.5: WHAT WORKS ARE SPECIFIC TO LOW FREQUENCY APPLICATIONS?
It is interesting to note that the majority of published research does not discuss
why a specific topology or method was selected, as more effort is spent on the
development of the specific system. Each harvester topology, tuning method, and
bandwidth widening method has advantages and disadvantages promoting their use in
one application over another. An exploration of EM harvesters for low frequency
excitations is presented here.
Clarkson University used EM vibration harvesters to power a wireless sensor on a
highway bridge in 2008 as a proof of concept. The three harvesters are shown in Figure
42, and were designed to 10, 10, and 3 Hz, respectively (Li, 2008; Li & Pragasen Pillay,
2008; Sazonov et al., 2009). The specific reasons for each harvester choice are not given,
so it is likely a result of exploration. The first is similar to (El-hami et al., 2000),
discussed in section 4.1, where an iron “mover” was used to connect two magnets to
increase the field intensity. The second design utilized iron “teeth” to concentrate the
field on the coil windings, which introduced “ripple” or “cogging” forces. These forces
result from magnetic attraction between the moving magnets and teeth, and required
additional design and extensive finite element analysis to refine. The third design used
iron disks, called pole pieces, between opposing magnets to concentrate the magnetic
field over the coil. This topology required less iron than the first and second designs, and
generated a three-phase voltage in an attempt to boost circuitry efficiency by delivering a
more constant voltage.
In a similar application, tidal waves were harvested using a linear generator on the
sea floor connected to a buoy by a rope (Danielsson, 2003), as shown in Figure 43. The
topology is very similar to the second design by Clarkson University, but places the
magnets in the interior and the coils on the exterior. Similar flux concentrating teeth are
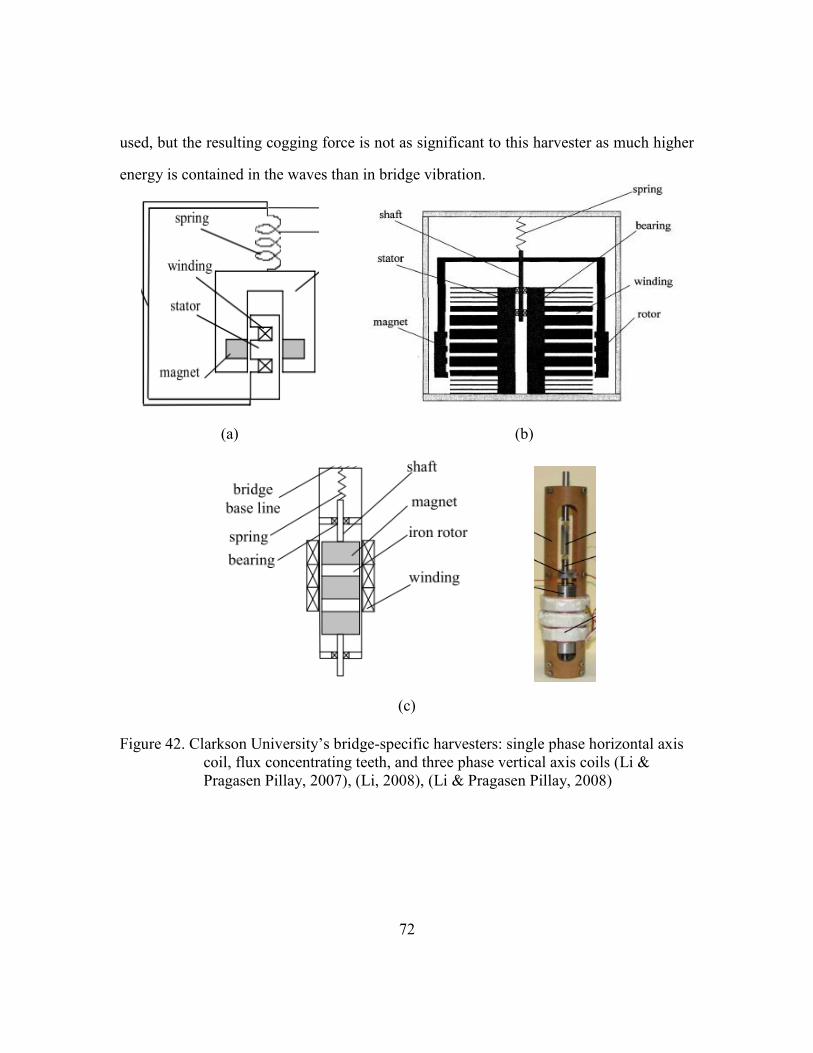
72
used, but the resulting cogging force is not as significant to this harvester as much higher
energy is contained in the waves than in bridge vibration.
(a)
(b)
(c)
Figure 42. Clarkson University’s bridge-specific harvesters: single phase horizontal axis
coil, flux concentrating teeth, and three phase vertical axis coils (Li &
Pragasen Pillay, 2007), (Li, 2008), (Li & Pragasen Pillay, 2008)

73
(a)
(b)
Figure 43. System schematic (left), rotor topology (middle), and coil topology (right)
(Danielsson, 2003).
A prototype of a human-powered lock for a safe was developed by (Jewell &
Howe, 2002), as seen in Figure 44. The user pushes the shaft inward, generating a voltage
from the changing reluctance of the shaft. The shaft is referred to as a salient-pole
armature, similar to salient-pole electric motors which also use changing reluctance to
induce a voltage. This type of harvester is acceptable at very low frequencies, but
performs poorly at high frequencies where eddy current losses become significant in
systems using changing reluctance. Using this topology for a bridge harvester could
introduce additional losses compared to others.
The final harvester to be discussed was designed to be worn by a user and was
built to power motion capture accelerometers in movie production, where the design
focuses on capturing energy at an excitation frequency of 2 Hz and amplitude of up to
0.5g (von Büren & Tröster, 2007). The harvester, shown in Figure 45, used a magnetic
structure identical to that of Clarkson’s third design. An aluminum four-bar mechanism
with living hinges was used as the compliant member for longevity, as the author states.

74
The four-bar mechanism allows the translator to move vertically only over a short
distance before contact with the coils, so the harvester is not ideal for large
displacements. Of most importance is the author’s parametric optimization of the magnet,
coil, and pole piece geometry for maximum average power output. The optimization
results are given in terms of ratios of magnet radius/coil outer radius, magnet height/coil
height, and magnet assembly height/coil outer radius, such that scaling to a larger
harvester is possible.
(a)
(b)
Figure 44. Prototype and cross-section schematic of salient pole harvester (Jewell &
Howe, 2002).
(a)
(b)
Figure 45. Wearable flexible hinge harvester (von Büren & Tröster, 2007).

75
From this review it seems that cogging forces and variable reluctance should be
avoided to minimize parasitic losses and maximize translator displacement from small
bridge excitations. Also, the use of pole pieces between opposing magnets seems to be a
topology worthy of further investigation as it is used in two low frequency applications
(one at 2 Hz and the other at 3 Hz).
4.6: CHAPTER SUMMARY
The harvesters found thus far utilized a breadth of compliant members such as
helical springs, cantilevered beams, supported beams, and flexible hinges on rigid beams.
Others use soft ferromagnetic material such as iron to concentrate the magnetic flux in
the region of the coils to give higher induced voltages. A common trend amongst almost
all published research in the field is a lack of discussion or justification for the concept
selection. Regardless, the key findings of this literature review are:
(1) For high peak power output:
a. High seismic mass is desired.
b. Target high acceleration amplitudes.
c. Target high frequencies with sufficient acceleration amplitudes.
d. Match harvester and load impedance.
e. Use Schottky diodes if reverse breakdown voltage is acceptable.
f. Use a tantalum or ceramic-type capacitor for storage.
g. If significant benefit, use a switching AC-DC or switching DC-DC converter.
i. Use a commercially available system.
h. Omit cogging/ripple forces and variable reluctance to reduce losses.
(2) For high average power output (robustness):
a. Desire wide bandwidth for simultaneous harvesting of multiple frequencies

76
i. Mechanically coupled, nonlinear, arrays, or bistable harvesters seem
good for ambient vibration.
1. Individual harvesters in an array should be rectified
independently to avoid destructive interference.
b. Desire passively tunable bandwidth to match specific bridge during
installation.
i. Tune without introduction of damping by changing length, center of
gravity, or tensile axial loading.
ii. Design for lowest frequency with capability of tuning to higher
frequencies.
In the end, the vibration source’s characteristics, the risk vs. reward preferences and
budget of the project heavily influence the type of harvester and circuitry which should
be used.

77
Chapter 5: Focused Conceptual and Embodiment Design
Conclusions from the literature review of works on electromagnetic energy
harvesting, resonant frequency tuning methods, bandwidth widening methods, and
associated circuitry were used to drive the focused generation of electromagnetic
vibration energy harvester concepts. One concept was then selected and embodied in the
form of two designs: an alpha design for the sole purpose of lab testing and verification
with predicted performance, with no emphasis on end user-interaction (presented in this
chapter), and a beta design which includes this emphasis (presented in Chapter 7).
5.1: FOCUSED CONCEPT GENERATION
The first generated concept is inspired by the harvester presented by (Zhu et al.,
2008) which uses tensile axial preload to tune without the addition of damping. The
concept in Figure 46 uses a two-pole magnet topology developed by (Glynne-Jones et al.,
2004) for the electromagnetic transducer not disclosed by Zhu. The concept replaces the
linear actuator for tuning with a manually adjusted bolt as a simplified, less-expensive
alternative.
The concept shown in Figure 46 was expanded into a bistable harvester to achieve
wide bandwidth as inspired by the design developed by (Cottone et al., 2009), mentioned
previously6. Figure 47 shows this concept, which uses an EM transducer rather than the
piezoelectric bimorph of the original. Two more coils were added in addition to the
center coil to harvest the oscillations when the magnets are in the two potential “wells”,
with the center coil harvesting the transitions between these wells. A higher number of
coils of potentially varying design may also be included, allowing the damping as a
6 Bistable harvesters are particularly useful for random vibrations and make use of the function Adapt to
changing environment with minimal user interaction.

78
function of displacement to be designed as desired. For instance, the coils in the potential
wells may have low electrical damping to allow larger oscillations in this region, while
the coil(s) in the potential barrier may have high electrical damping to extract more
energy as the beam “snaps through” to the lower potential well. The bistability is created
by repelling magnets – one at the beam’s free end and the other attached to the housing –
just as by (Cottone et al., 2009), but the magnets are convex to provide a gradual force on
the beam as it nears the center position. The force experienced is proportional to the
spatial derivative of magnetic field being traversed, which is high for sharp-cornered
magnets like those used by (Cottone et al., 2009). Making the fields more gradual will
reduce this force as well as potentially increase the probability of travel between wells.
Simulation of this concept would have to be performed to fully evaluate how the barrier’s
sharpness affects the power output.
(a)
(b)
Figure 46. Focused concept A: Tensile axial load tuning (a), using two-pole magnet and
coil topology (b).

79
Figure 47. Focused concept B: Tunable bistable cantilever.
The third concept utilizes magnetic levitation instead of springs to achieve a
nonlinear response which may be tuned by adjusting the distance between the tuning and
translating magnets, as illustrated in Figure 48a. The basic concept was inspired by
(Mann & Sims, 2009), presented in Figure 36. One addition is flux concentration with the
use of high permeability pole pieces in the translating magnet structure to achieve higher
induced voltage in the coils. Another is the optional placement of coils in the region
between the tuning and translating magnets, similar to the harvester of (Dick, Fralick,
Jazo, Kerber, Brewer, et al., 2009) presented in Figure 39. In this case the coils between
these magnets have the same orientation as the other coils, as a design around the patent.
The major advancement of this concept is its optional modularity for use in a harvester
array, as the harvester may be joined to adjacent harvesters, as suggested in Figure 48b.
Each harvester could be tuned to a specific frequency range, and then connected into an
array. The bandwidth of the array may then be shifted by adjusting the tuning bolts at

80
either end of the array, which would alter each harvester’s frequency by the same
amount. The frequency of each harvester could be adjusted by threading the top tuning
magnet relative to the connecting member. With this harvester array, the bandwidth may
be shifted to match the specific bridge fairly easily. Newer, stiffer bridges could require
the array to operate at higher frequencies, while older fatigued bridges could require
lower frequencies. If a given bridge contains significant power at both high and low
frequencies the individual harvesters may be adjusted to match during installation.
The final concept is composed of two magnetically coupled harvesters in a
topology inspired by (Dick, Fralick, Jazo, Kerber, Brewer, et al., 2009), but with the use
of flux concentrating structures to increase power output, Figure 49. Additional magnets
repel each other to magnetically couple the two harvesters, while also concentrating the
magnetic flux in the coil regions. Wave springs are also used to reduce system volume.
The resonant frequency is tunable by threading the top and bottom portions relative to
each other to change the magnet spacing.

81
(a)
(b)
Figure 48. Focused concept C: Modular array with magnetic levitation tunability.

82
Figure 49. Focused concept D: Magnetically coupled with flux concentration and
tunability.
5.2: FOCUSED CONCEPT SELECTION
Concept C, Modular array with magnetic levitation tunability, was selected for
embodiment, prototyping, and testing for several reasons. First, the relatively large
dimensions needed for cantilever beam harvesters, such as in concepts A and B,
operating at low frequencies (1-15 Hz) are a concern for large-scale implementation
across many bridges. Concept A, Tensile axial load tuning using two-pole magnet and
coil topology uses attracting magnets to tune the resonant frequency with tensile force
along the beam’s axis. This method is desirable for tuning as it does not introduce
damping, but the method also does not add bistability to the system and therefore remains
linear. This design results in a narrow bandwidth linear harvester which must be tuned to

83
resonate at a specific bridge frequency. This response is acceptable as long as the bridge
the harvester is mounted on contains stable dominant frequencies. This particular design
would benefit most from an active tuning system capable of measuring and adapting to
any changing bridge frequencies. At the early stage of this project, efforts are being
concentrated on exploring systems which do not require active control. Designs which
exploit active control will not be ruled out, though, and are suggested to be revisited at a
later stage in the project. For these same reasons, the actively tuned vibration harvester
concept detailed in Section 3.1, Figure 22 is left for future consideration.
Concerning Concept B—which exploits bistability through axially repelling
magnets—early experiments by fellow graduate student Jason Weaver suggest that
increasing the bistability of the system by decreasing the distance between the repelling
magnets adds considerable damping, significantly reducing the ability of the beams to
“snap through” the potential barrier. More detailed investigation into this bandwidth
widening method is needed for a final conclusion, though, so the design is also left for
future consideration if the selected concept is not successful.
Concept D is a fairly complex design for a first generation prototype in this
project, although the author feels it is worth further investigation. A more basic version of
this design is being used by the British vibration harvesting company Perpetuum, but
only at frequencies above 20 Hz, which raises some concern (Arnold, 2007; Beeby et al.,
2007; Field, Energy, Begins, & Ripen, n d; Perpetuum, 2011). This concept provides high
magnetic flux in a similar fashion as the common loudspeaker. This configuration
provides higher flux per unit magnet mass than Concept C, but uses more core iron to
guide the magnetic field. Concept C uses magnetic components on the inside of the coil
only, allowing larger displacements without colliding with the coil.

84
Concept C provides the option of a modular harvester which is tunable and of
wider bandwidth than an equivalent linear harvester, and easily formed into an array of
adjustable bandwidth. The design exploits recommendations 1b and 1c listed in Section
4.6: Target high acceleration amplitudes, and Target high frequencies with significant
acceleration amplitudes, respectively. The nonlinear stiffening compliance created by the
repelling magnets harvests the most energy from high acceleration amplitudes and
frequencies, while occupying a relatively small volume compared to concepts A and B.
This concept is not without risk, though, as no literature has been found which tests such
a harvester with random vibrations. Exciting this design with replicated bridge vibration
will certainly fill a gap in the research literature, and could find potential benefits.
5.3: ANALYTICAL MODEL
The first step to develop the selected concept is to understand its physics through
first principles. The following sections present an analytical model of the design
separated into its electromagnetic and mechanical components, followed by the combined
system equations. These equations then serve in the construction of a numerical model of
the harvester to parametrically design its components and predict performance.
5.3.1: Electromagnetic Components
Electromagnetic vibration energy harvesters use induction to convert kinetic
energy into electrical energy. Faraday’s law of induction, Equation 5.1, states that the
electromotive force (EMF) is equal to the time derivative of total magnetic flux ( )
experienced by the coil, with opposite polarity so to induce a current which will produce
a magnetic force to oppose the change in magnetic flux (Lenz’ Law). The EMF is the
potential difference, or voltage, across the ends of the open-circuited coil. The total
magnetic flux is equal to the product of the total number of coil turns (N) and the average

85
flux through each turn ( ), Equation 5.2, where is calculated as the area surface
integral of magnetic flux density (B) over the coil area (A). The EMF may therefore be
represented by the product of the flux gradient and the velocity as in Equation 5.3. The
average flux gradient of each turn is calculated as the product of the average flux density
( ) and the length of the wire in the coil ( ) to form Equation 5.4, where this
product is termed the average electromechanical coupling coefficient (K).
(5.1)
∑ ∫
(5.2)
(5.3)
(5.4)
The EMF induces a current (i) in the coil and electric load given by Equation 5.6
which was obtained using Kirchhoff’s Voltage Law, Equation 5.5, where , , and
are coil resistance, coil inductance, and load resistance, respectively (see Figure 50). The
magnetic force this current creates, Equation 5.7, acts to oppose the motion of the
translating magnets through the coil. This force may be represented mechanically as a
velocity-dependent damping force with electric damping coefficient ( ), whose value is
given by Equation 5.8. The total electrical power ( ) in the coil and load is driven by
this damping action, Equation 5.9, where the portion delivered to the load may be
represented by the load electric damping coefficient ( ), Equation 5.10, and the
remaining portion being lost as heat by , Equation 5.11. The model of Figure 50,
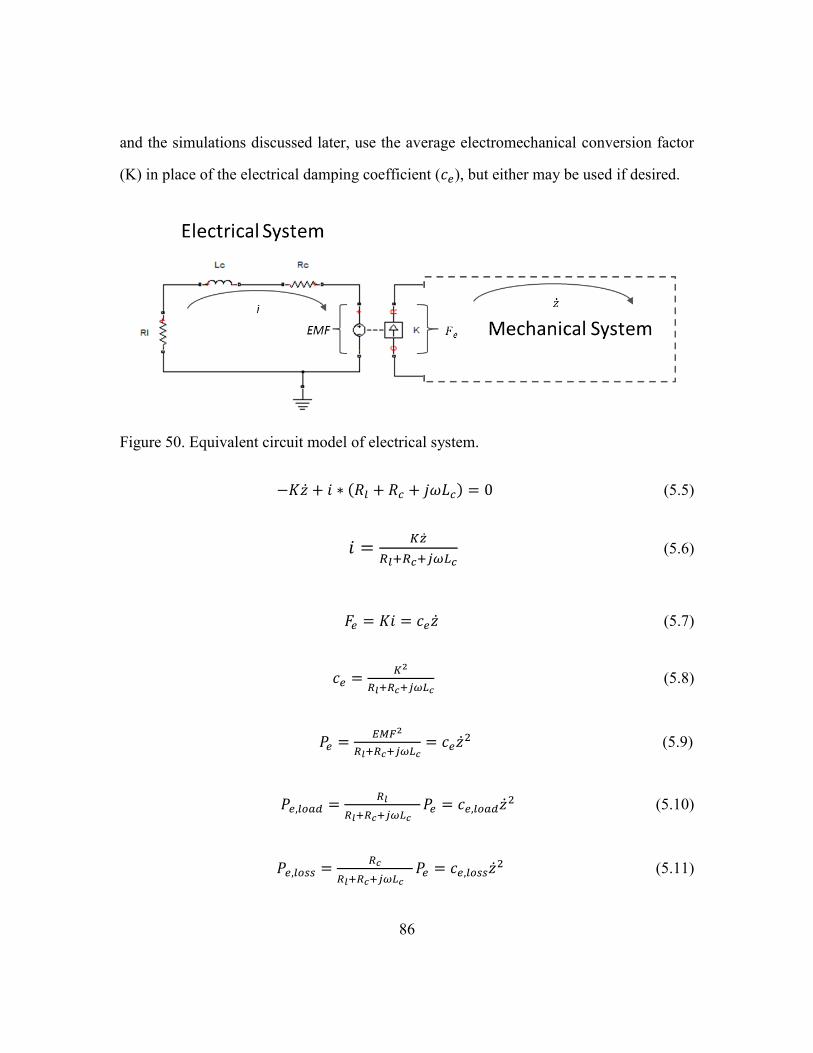
86
and the simulations discussed later, use the average electromechanical conversion factor
(K) in place of the electrical damping coefficient ( ), but either may be used if desired.
Figure 50. Equivalent circuit model of electrical system.
( ) (5.5)
(5.6)
(5.7)
(5.8)
(5.9)
(5.10)
(5.11)

87
Maximum power is transferred from the energy harvester to its load when the
impedances of each are equal. From (Stephen, 2006), the load resistance for optimum
impedance matching is found by equating the electrical load impedance to the total
(electrical + mechanical) harvester impedance as shown in Equation 5.12, where is
the mechanical viscous damping coefficient. The inductance of the coil itself, with
magnets removed from its center, may be calculated using Equation 5.13, where is the
coil inductance (in µH), is the mean coil radius (in cm), is the total coil height (in
cm), and is the coil thickness (in cm) (American Radio Relay League, 2011). As the
impedance from the inductor is low at low frequencies, is often omitted unless is
of the same order of magnitude as . This omission may also apply to Equations 5.5-
5.11.
(5.12)
(5.13)
5.3.2: Mechanical Components
If a linear spring is used, the vibration harvester may be modeled as a second
order system of translating mass (m), total damping coefficient ( ), and spring stiffness
( ), Equation 5.14. The total damping and spring forces are driven by the relative motion
(z=x-y) between the mass (x) and harvester housing, which moves with the bridge (y) (see
Figure 51).
( ) ( ) (5.14)
where is the sum of the mechanical and electrical damping coefficients
(5.15)
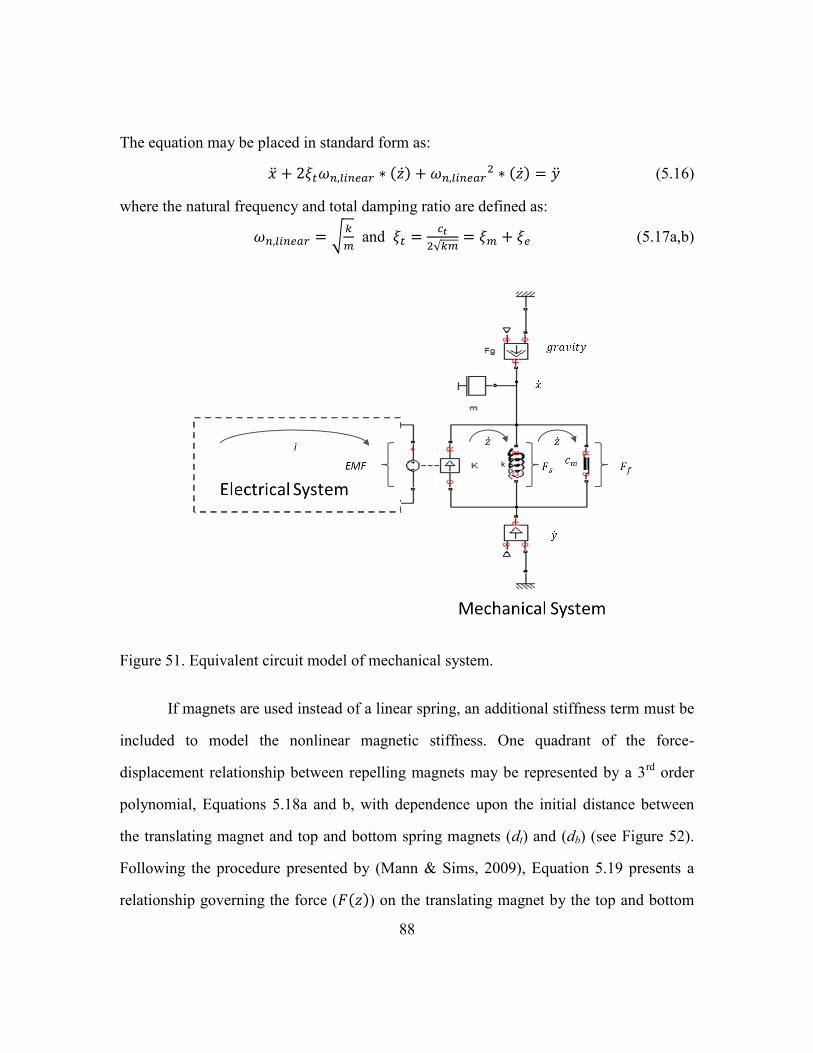
88
The equation may be placed in standard form as:
( ) ( ) (5.16)
where the natural frequency and total damping ratio are defined as:
√
and
√ (5.17a,b)
Figure 51. Equivalent circuit model of mechanical system.
If magnets are used instead of a linear spring, an additional stiffness term must be
included to model the nonlinear magnetic stiffness. One quadrant of the force-
displacement relationship between repelling magnets may be represented by a 3rd
order
polynomial, Equations 5.18a and b, with dependence upon the initial distance between
the translating magnet and top and bottom spring magnets (dt) and (db) (see Figure 52).
Following the procedure presented by (Mann & Sims, 2009), Equation 5.19 presents a
relationship governing the force ( ( )) on the translating magnet by the top and bottom

89
spring magnets ( ( ) ( )) which may be obtained in terms of the relative position
between the translating magnet and harvester housing (z) and four stiffness coefficients,
Equations 5.20a-d.
Figure 52. Schematic of mechanical components.
( ) ∑ ( )
(5.18a)
( ) ∑ ( )
(5.18b)
( ) ( ) ( )
(5.19)
(
) (
) ( ) (5.20a)
(
) ( ) (5.20b)

90
( ) (5.20c)
(5.20d)
If the top and bottom repulsive magnets are of equal initial distance from the
translating magnet, and become zero, simplifying the model. Assuming the initial
distances are equal, the mechanical system equation becomes
(5.21)
or in standard form:
(5.22a)
where
√
(5.22b)
Following (Mann & Sims, 2009), the natural frequency for this nonlinear system may be
calculated as
√
(
) (5.23)
where zeq is the position of the mass in static equilibrium under the influence of gravity,
which may be calculated by solving for the real root of the force-balance equation
between gravity and the spring force. The tunability of the natural frequency is made
possible by adjusting the magnet spacing which alters k, but not k3, as it remains
independent of dt and db. This results in a linear relationship between separation distance
and natural frequency, allowing straight-forward tuning.
As the energy harvester is being designed to harvest the vibrations of highway
bridges which are small in amplitude, as shown in Chapter 3, minimizing friction and
especially static friction will be very important in maximizing the energy captured. In
what has been discussed so far, friction is represented by the mechanical damping
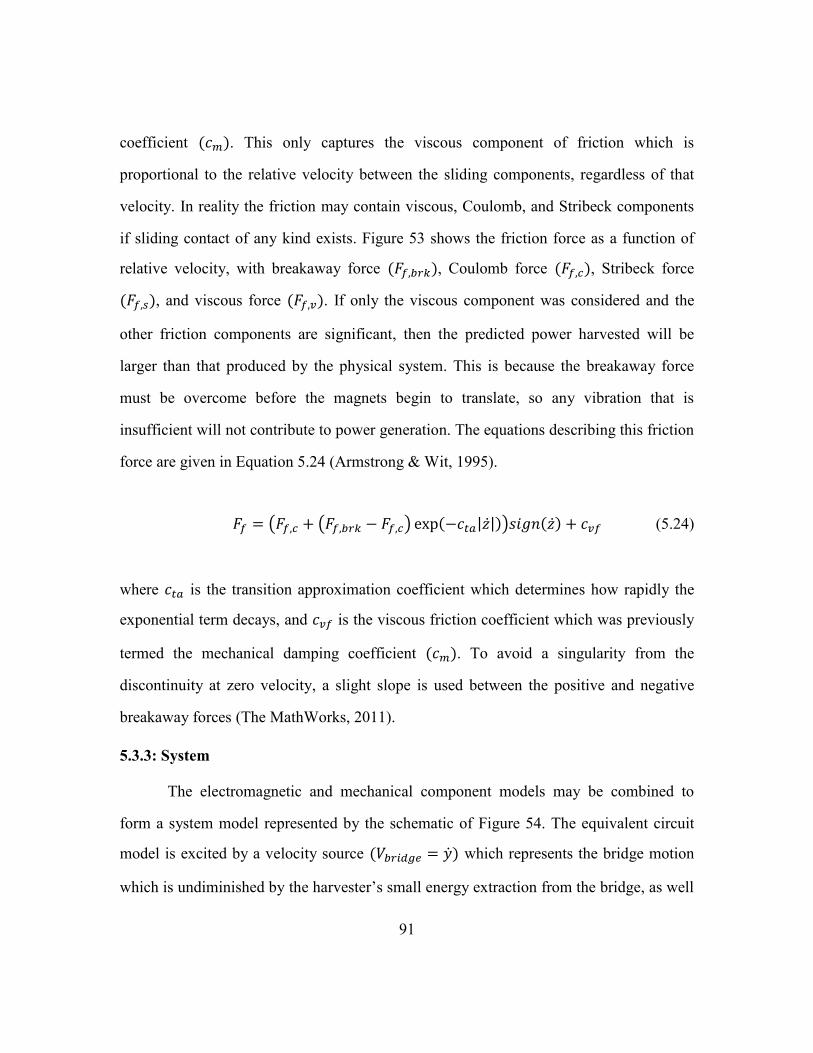
91
coefficient ( ). This only captures the viscous component of friction which is
proportional to the relative velocity between the sliding components, regardless of that
velocity. In reality the friction may contain viscous, Coulomb, and Stribeck components
if sliding contact of any kind exists. Figure 53 shows the friction force as a function of
relative velocity, with breakaway force ( ), Coulomb force ( ), Stribeck force
( ), and viscous force ( ). If only the viscous component was considered and the
other friction components are significant, then the predicted power harvested will be
larger than that produced by the physical system. This is because the breakaway force
must be overcome before the magnets begin to translate, so any vibration that is
insufficient will not contribute to power generation. The equations describing this friction
force are given in Equation 5.24 (Armstrong & Wit, 1995).
( ( ) ( | |)) ( ) (5.24)
where is the transition approximation coefficient which determines how rapidly the
exponential term decays, and is the viscous friction coefficient which was previously
termed the mechanical damping coefficient ( ). To avoid a singularity from the
discontinuity at zero velocity, a slight slope is used between the positive and negative
breakaway forces (The MathWorks, 2011).
5.3.3: System
The electromagnetic and mechanical component models may be combined to
form a system model represented by the schematic of Figure 54. The equivalent circuit
model is excited by a velocity source ( ) which represents the bridge motion
which is undiminished by the harvester’s small energy extraction from the bridge, as well

92
as the constant force of gravity (Fg). This motion is imparted on the harvester’s housing
which is directly connected to the coil and indirectly connected to the translating magnet
mass ( ) through compliance ( ) and friction ( ). The translating mass’ inertia causes
relative motion between it and the housing. This relative velocity determines the
frictional, compliant, and electromagnetic forces applied to the translating mass. The
electromechanical conversion is represented by a gyrator which prescribes an in the
coil which is proportional to the relative velocity, and a magnetic force on the mass
proportional to the current flowing through the coil and load.
Figure 53. Detailed friction model (The MathWorks, 2011).
Performing a force balance and a sum of loop voltages results in the system
equations, Equations 5.25 and 5.26, where ( ) is the spring force as a function of
relative displacement (z)—from either a linear spring or repulsive magnets—and ( ) is
the friction force as a function of relative velocity ( ). The friction force may be

93
composed of only viscous or all friction components based upon measured response and
the physical layout (bearings, bushings, sufficient lubrication, etc.). These equations are
of the most general form to include all effects but may be placed in various simplified
forms using the equations listed previously in this chapter, such electrical and mechanical
damping coefficients, for example.
( ) ( ) (5.25)
( ) (5.26)
Figure 54. Equivalent circuit model of the electromechanical system.

94
5.4: NUMERICAL MODEL
The analytical model was transformed into a numerical model using MATLAB,
Simulink, and the plugin SimScape to help size components and simulate performance.
SimScape allows icon-based, acausal7 physical modeling of multi-domain dynamic
systems, allowing straight-forward visualization and debugging, as well as eases model
refinement to include more detail as the research evolves. The Simulink/SimScape block
diagram is shown in Figure 55, which is an expanded version of the model shown in
Figure 54 that includes excitation by sine wave, swept sine wave, and measured bridge
acceleration, as well as processing. To perform a simulation, a MATLAB .m file is
executed, which calculates the system parameters from user-supplied inputs. These inputs
include:
1. Excitation acceleration of sine wave, swept sine wave, or measured bridge
acceleration (with 3 available bridge datasets).
2. Selection to use linear spring or nonlinear magnetic spring.
3. Dimensions and properties of magnets, coils, spring, etc.
4. Damping coefficients.
5. Selection to perform load resistance parameter sweep on any of the
excitations.
6. Selection to perform initial magnet separation parameter sweep on any of the
excitations.
7. Selection to perform resonant frequency parameter sweep for sine wave or
measured bridge acceleration excitation.
7 Acausal physical modeling refers to the simultaneous solution of systems of differential algebraic
equations, without need to prescribe inputs and outputs needed by causal physical modeling.

95
8. Selection to use inferred parameters of the harvesters from (von Büren &
Tröster, 2007) and (Li, 2008).
The Simulink/SimScape block diagram is called from within the .m file and the
parameters are loaded into the diagram and simulated. The excitation acceleration is
integrated to velocity, and then prescribed as the harvester housing velocity (illustrated in
blue in Figure 55). Sensor blocks (illustrated in red in Figure 55) measure absolute and
relative position and velocity, open circuit or load voltage, and current, sending the
measurements to a processing block (illustrated in green in Figure 55) which calculates
power and energy. The processing block then returns the measurements to the .m file
where they may be post-processed and plotted.
Before meaningful simulations could be performed, more details about the
harvester are needed in order to quantify the parameters. The following section describes
this process.
5.5: COMPONENT LAYOUT AND PARAMETER SELECTION
As discussed in the focused concept selection, the translating magnet structure
consists of opposing magnets squeezed together with iron alloy disks between them to
concentrate the magnetic flux outward across the coil, as shown in Figure 56. As a first
approximation, the dimensions were selected following the recommendations of (von
Büren & Tröster, 2007). This work provided nondimensionalized geometry ratios for the
magnets, disks, and coils from detailed optimization of an FEA coupled lumped
parameter model. Their model was developed for a significantly smaller energy
harvester, so extrapolation to larger geometries is assumed but not guaranteed to be
correct. Future refinement of these dimensions should consider modeling through the use
of an electromagnetic FEA software package. Optimizing the magnet assembly and coil

96
is very important to achieve the most power, which is exemplified by (Dick, Fralick,
Jazo, Kerber, Brewer, et al., 2009) who showed over five-fold increase in peak output
power by optimizing the coil inner and outer diameters for their type of harvester.
Figure 55. Diagram of the Simulink and SimScape portion of the numerical model.
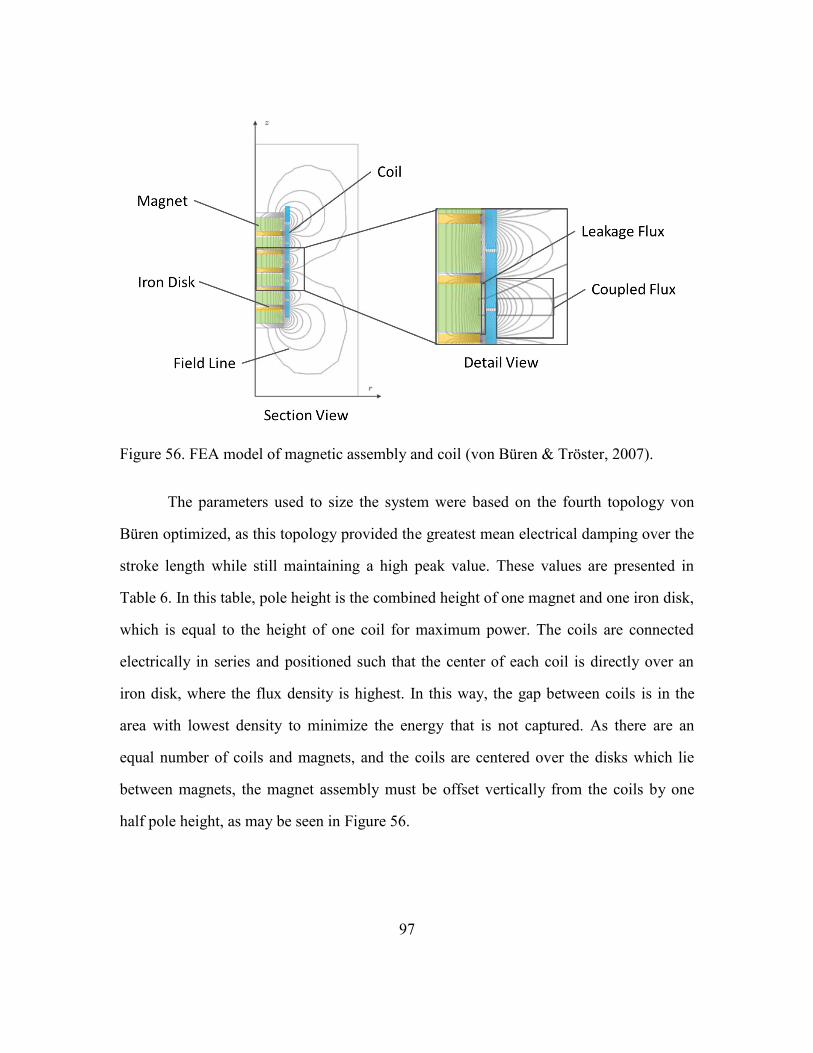
97
Figure 56. FEA model of magnetic assembly and coil (von Büren & Tröster, 2007).
The parameters used to size the system were based on the fourth topology von
Büren optimized, as this topology provided the greatest mean electrical damping over the
stroke length while still maintaining a high peak value. These values are presented in
Table 6. In this table, pole height is the combined height of one magnet and one iron disk,
which is equal to the height of one coil for maximum power. The coils are connected
electrically in series and positioned such that the center of each coil is directly over an
iron disk, where the flux density is highest. In this way, the gap between coils is in the
area with lowest density to minimize the energy that is not captured. As there are an
equal number of coils and magnets, and the coils are centered over the disks which lie
between magnets, the magnet assembly must be offset vertically from the coils by one
half pole height, as may be seen in Figure 56.

98
Table 6. Optimized geometry relations from (von Büren & Tröster, 2007).
5.5.1: Translating Magnet Assembly and Linear Spring
The parameters of Table 6 were used to calculate the magnet height to radius ratio
to be 1.4169. This calculation included dividing the assembly height to coil radius ratio
by the magnet radius to coil radius ratio, then dividing by the number magnets and
compensating for one more iron disk. Magnets with a diameter of 37mm and height of
12mm were selected for use, where two magnets would be stacked in order to satisfy the
height to radius ratio. The fields of the two stacked magnets add constructively to act as
one magnet, but likely with slightly less strength as a single, congruent magnet of the
final dimensions. The mass of the translating magnet assembly was calculated using the
density and geometry of the magnets and iron disks. This value was used to calculate the
necessary spring stiffness of a linear helical extension spring so that the harvester
resonates at 1.8 Hz, which is the measured dominant frequency of the instrumented box-
girder bridge (see Figure 28 in Section 3.3). The required spring stiffness was found to be
184.05 N/m for a mass of 1.439 kg. This stiffness value is low but may be purchased
from a number of suppliers. Checking this value was important to verify that the
harvester was capable of linear and nonlinear resonance for comparison. Spring fatigue
calculations were used to assure the spring would last 10 years without failure. A
MATLAB optimization resulted in the conclusion that wide diameter springs will provide
low spring constants with minimal height. This property is exploited by the wave spring
Parameter Value
Magnet outer radius / Coil outer radius 0.73
Single magnet height / single pole height 0.86
Magnet assembly height / Coil outer radius 7.35
Number of magnets 6
Number of coils 6

99
which is recommended in a future version. A summary of the parameters set thus far is
presented in Table 7.
Table 7. Desired mechanical parameters.
5.5.2: Spring Magnets
To predict the performance of the nonlinear harvester and determine the position
of the spring magnets for tuning, it is essential to know the effective magnetic stiffness
between the translating and spring magnets. In this measurement two sizes of spring
magnet were used, with parameters stated in Table 8. A set of N38 Neodymium magnets
were acquired with the dimensions of Table 7 to serve as the translating magnets. The
experimental set-up was composed of a digital scale, nonmagnetic ruler, adjustable slide-
mount, translating magnets, and spring magnet held in place with a plastic housing
surrounding a shaft for guidance. The force from the scale was recorded for a range of
measured distances between the magnets, providing force to distance relationship, as
shown in Figure 57. This information was used to fit the magnetic stiffness polynomial
described in Equations 5.19-20, with coefficients given in Table 9.
Table 8. Spring magnet properties.
Parameter Value
Translating Magnet Assembly Mass 1.439 kg
Desired Linear Natural Frequency 1.8 Hz
Linear Spring Stiffness 184.05 N/m
Number of Iron Disks 5
Height of Iron Disk 3.9 mm
Magnet Diameter 37 mm
Height of Magnet Pair 24 mm

100
Figure 57. Magnetic repulsion force measurement results with corresponding 3rd
order
polynomial fits.
Table 9. Magnetic stiffness polynomial fit coefficients, used in Equation 5.20 to calculate
the magnetic stiffness for the given initial magnet separation.
5.5.3: Coil
When the translating magnet dimensions were prescribed in Section 5.5.1, the
outer radius of the coil was defined, as the two are related by the ratios of Table 6. The
inner radius should be as close to the magnets as possible to minimize the leaked flux, as
shown in Figure 56. With the inner and outer coil radii set, the optimal wire gage may be
found. Selecting a small wire gage (diameter) will allow more turns in the coil which will
Large Spring Magnet Small Spring Magnet
a0 87.936 20.821
a1 -3371.776 -984.18
a2 43761.002 14181
a3 -187780.044 -2185

101
in turn produce a larger EMF (see Equation 5.4). At the same time more turns requires a
longer wire length and smaller area which result in higher coil resistance. There is an
optimal gage in which the highest EMF is achieved with lowest possible coil resistance,
while staying under the gage’s maximum permissible current.
As a first approximation, the optimal wire gage was extracted from the
information supplied by von Büren’s optimization. The first step was to find which
packing factor was used to verify the legitimacy of the parameters. The packing factor is
dependent upon the winding type and tightness of winding, and is the ratio of area
available in one coil to the area that is filled with insulated wire. The packing factor was
found to be 90%, which is the value used for orthocyclic winding in which the wire lies
in the valley created by two previous windings (Beeby & O’Donnell, 2008). This value
assumes perfect orthocyclic winding, which may be obtained with care but to be safe a
slightly lower value should be used. Next, a relationship between the insulated wire
diameter and coil outer radius was determined, using other parameters stated in the paper.
This resulted in the suggested insulated wire diameter of 330 µm, which lies between the
diameters for AWG 29 and 28 magnet wire (MWS Industries, 2011). For a slightly more
conservative winding, a smaller wire diameter (AWG 30) with single-build insulation
was selected, with the number of turns kept the same. The insulation build is a measure of
the insulation thickness, with single-build being the most common. The result was a coil
with the parameters shown in Table 10. Future refinement should consider the use of an
electromagnetic FEA software package.

102
Table 10. Desired coil parameters.
5.6: PREDICTED PERFORMANCE
The parameters were loaded into the numerical model to allow simulation. As the
prototype was not yet constructed and electromagnetic FEA tools were unavailable,
damping values were borrowed from harvesters with similar construction (von Büren &
Tröster, 2007) and (Li, 2008), with these values presented in Table 11.
Table 11. Damping values used to predict harvester performance8.
5.6.1: Linear Case
The first step was to evaluate the predicted harvested power of the linear harvester
with varying load resistance for a sine wave compared to a sample bridge excitation.
8 * Values from by (von Büren & Tröster, 2007). ** Values from by (Li, 2008).
Parameter Value
Wire gage AWG 30
Wire diameter with insulation 277 µm
Wire diameter without insulation 254 µm
Single Coil Height 2.79 cm
Number of coils 6
Total number of turns 9618
Outer Diameter 5.07 cm
Inner Diameter 4.3 cm
Resistance 476 Ω
Inductance 954.6 mH
Parameter Value Unit
Load Resistance Rl 10500* Ω
Mechanical Damping Coeff cm 0.006** Nm/s
Electrical Damping Coeff ce 0.2* Nm/s
Total Damping Coeff ct 0.206 Nm/s
EM Conversion Coefficient K 25.6125* Vs/m

103
Figures 58-59 show the bridge excitation benefits from an increased load resistance as the
acceleration levels of the bridge are less than that of the sine wave, on average. In the
final application, the load will change impedance dynamically to harvest the most energy
possible. For the rest of the tests, the load value from the sine test at 0.01g was used,
which is 2.9kΩ.
Following this, the predicted harvested power for a range of acceleration
amplitudes was evaluated under sinusoidal excitation. Figure 60 presents the result,
plotted with a logarithmic vertical axis to allow visualization of the power at low
amplitude levels. To gain an understanding of the frequency response of the linear
harvester, a swept sine excitation was applied, resulting in Figure 61. A wider bandwidth
may be achieved at the compromise of peak power by increasing the load resistance. The
linear harvester was then excited by a 50 second sample IH-35N-US-290E direct
connector (a box-girder bridge) acceleration for the linear case, as presented in Figure 62.
Figure 58. Peak harvested power for load resistance sweep under 50 seconds of replicated
IH-35N-US-290E direct connector acceleration for the linear case.

104
Figure 59. Peak harvested power for load resistance sweep with sine wave excitation of
0.01g and 2.2Hz for the linear case.
Figure 60. Peak harvested power for an excitation acceleration sweep for the linear case
under sinusoidal excitation at 2.2Hz and a load of 2.9kΩ.

105
Figure 61. Peak harvested power under increasing swept sine wave over 120 seconds at
amplitude of 0.05g and load of 2.9kΩ.
5.6.2: Nonlinear Case
To evaluate the predicted resonant frequency tuning range, a simulation was
performed in which the separation distance between the translating and small spring
magnets was varied, with result shown in Figure 63. This gives a relatively large linear
tuning range in the field.
A frequency sweep was performed for comparison of bandwidth with the linear
case. As with the linear case, the load resistance has a large effect on bandwidth, with a
larger value resulting in larger bandwidth but lower peak power. The two following
figures demonstrate this, with loads of 2.9 and 14kΩ, respectively.

106
Figure 62. Bridge acceleration, relative displacement (between magnet and coil), peak
harvested power, and harvested energy for 300 seconds of IH-35N-US-290E
direct connector acceleration for the linear case.
Figure 63. Tunable frequency range of nonlinear harvester using the small magnets.

107
Figure 64. Peak harvested power under increasing swept sine wave over 120 seconds at
amplitude of 0.05g and load of 2.9kΩ, for the nonlinear case.
Figure 65. Peak harvested power under increasing swept sine wave over 120 seconds at
amplitude of 0.05g and load of 14kΩ, for the nonlinear case.

108
Figure 66. Bridge acceleration, relative displacement (between magnet and coil), peak
harvested power, and harvested energy for 300 seconds of IH-35N-US-290E
direct connector acceleration for the nonlinear case.
Simulation results suggest that the linear case will significantly outperform the
nonlinear case for bridge vibration harvesting by a factor of 100 for this specific test. This
is because the bridge vibration is fairly random and intermittent, and the nonlinear
harvester excels with consistent excitation. This is a major find in this thesis as much
literature favors this type of nonlinear harvester for other applications. Research papers
which support nonlinear harvesters over linear harvesters always evaluate the two with a

109
sinusoidal frequency sweep. The nonlinear harvester performs better for this excitation,
but when it comes to random vibrations which are intermittent, the linear case is
preferred.
5.7: EMBODIMENT
An alpha prototype of concept C (first presented in Figure 48) was designed with
convenient experimental testing in mind. This harvester is sized to be convenient to
manipulate and include a removable linear helical extension spring for comparison of the
nonlinear and linear response of the harvester. The spring magnets may be removed for
linear testing, and are adjustable to evaluate the tunability of the device, as illustrated in
the solid models of Figure 67. The translating magnet structure is guided by a precision
ground shaft with linear ball bearings to maintain alignment within the coil. This was
chosen over relying on the coil bobbin for this function because a smooth surface would
be difficult to attain with the magnet structure’s layered surface and difficult-to-machine
magnets. This decision was reinvestigated for a final design, though. A cylindrical
housing is well suited to align and mount the internal components in a vertical, top-down
construction. The outer shell of this prototype consists of a polycarbonate tube such that
the internal components can be viewed in demonstration. Vertical slots in the housing
allow the spring magnets, bearings, and linear spring to be adjusted vertically for
adaptability in testing and tuning.

110
Figure 67. Solid model of test prototype.
Cylindrical ring magnets were selected to allow a central 316 Stainless Steel
threaded rod to squeeze the opposing magnets to the iron disks, with 316 Stainless Steel
nuts on each end to secure them in place. 316 Stainless Steel was used for the rod and
nuts instead of ferromagnetic material to avoid guiding a portion of the magnetic field
away from the coil and reducing the power output. Vim Var Core Iron alloy from Ed
Fagan, Inc. was selected as the iron disk material (Ed Fagan Inc., 2011). This material has
very high saturation induction9 (2.15 T) as well as high relative magnetic permeability10
9 Saturation induction is the maximum magnetic flux density permissible in a given material. 10 Magnetic permeability is analogous to electrical conductivity for a magnetic flux.

111
(10,000), allowing a high magnetic flux density to exist in the material easily. To create
the magnetic field, high strength N38 Neodymium magnets were used, with a diameter of
37mm and height of 24mm in order to satisfy the suggested ratios of Table 6.
Figure 68. Magnet assembly and coil sectional view, rotated horizontally. The iron disks
at each end must be removed if repelling magnets are to be used in place of
a spring, as the iron disks would attract the repelling magnets.
5.8: CHAPTER SUMMARY
Four electromagnetic vibration energy harvester concepts were generated which
include resonant frequency tuning and bandwidth widening methods. The concept
including stiffening magnetic stiffness was selected, modeled analytically and
numerically, and then designed parametrically. Simulations were performed to predict the
performance of the harvester using the numerical model. More work is needed to expand
the capabilities of the numerical model, but preliminary results favor the linear case for
bridge vibration as it has better performance under random vibrations. The harvester was
then embodied for construction and testing to follow in the next chapter.

112
Chapter 6: Prototype Fabrication and Experimentation
6.1: PROTOTYPE FABRICATION
The test prototype was constructed by the author beginning with the translating
magnet assembly, followed by the coil, then the housing and supporting components. The
iron disks were turned on a lathe from a solid cylinder of Vim Var Core Iron, and then
squeezed between the opposing magnets on a brass threaded rod, using nuts at each end
to hold the assembly together. Coupling nuts were used which allowed the shafts to be
attached to the assembly. These shafts translate with the assembly, supported by self-
aligning linear ball bearings which are lubricated with oil. The shafts are nonmagnetic
316 Stainless Steel for strength and diamagnetism. The coil bobbin was turned on a lathe
from a PVC pipe and then taken to an electric motor repair shop to be wound with AWG
30 magnet wire. The coil parameters differed from ideal because the PVC pipe used for
the bobbin had a larger inner diameter. The top-most coil was damaged during
construction so this portion of wire was removed, leaving a 5 section coil rather than 6.
These differences resulted in the coil parameters of Table 12.
Table 12. Actual coil parameters11.
11 *Calculated from measured values
Parameter Value
Wire gage AWG 30
Wire diameter with insulation 277 µm
Wire diameter without insulation 254 µm
Single Coil Height 2.59 cm
Number of coils 5
Total number of turns 7192*
Outer Diameter 4.83 cm
Inner Diameter 4.18 cm
Resistance 465 Ω
Inductance 1.62 H*

113
A 3” ID, 0.25” thick polycarbonate tube was used as the housing and the disks
needed to support the bobbin, spring, spring magnets, and bearings to the housing were
turned on a lathe from High Density Polyethylene (HDPE). The completed prototype and
some internal components are shown in Figure 69. This prototype can accommodate
different spring magnets. The parameters of the two magnets sizes used in testing were
given in Table 8 of Section 5.5.
Figure 69. Completed prototype (left), magnet, shaft, spring, and mounts (right).

114
(a)
(b)
Figure 70. Coil bobbin before windings are added (a), and small spring magnet with
mount (b).
6.2: EXPERIMENTATION
6.2.1: Laboratory Setup
A test setup was constructed to excite the harvesters via a shaker table and
measure performance, as outlined in Figure 71. A laptop computer running NI LabVIEW
sent the desired excitation signal to a NI CompactDAQ, which output the appropriate
voltage through a NI 9269 Voltage Output Module. A Crown DC 300A amplifier was
used as a pre-amplifier to boost the current of the signal12, which was then sent to a
Labworks CP-123 Amplifier Control Panel and Labworks PA-123-500 Power Amplifier
(Crown Audio, 2011; Labworks, 2011). The regulated signal then drove the Labworks
ET-127 Electromagnetic Shaker Table, exciting the attached harvester with acceleration
proportional to the current flowing through the shaker’s armature coil and velocity
proportional to the voltage sent to the table. To ensure the harvester was excited at the
proper acceleration, a Crossbow CXL04GP1Z low frequency, single axis accelerometer
was mounted to the base of the harvester, sending measurements to the computer via a NI
9219 Sensor Input Module connected to the CompactDAQ (Moog Crossbow, 2011). The
gain settings of the LabVIEW Virtual Instrument (VI), pre-amplifier, shaker table
12 Without this pre-amplifier, the 9269’s voltage output is diminished from the desired value.

115
amplifier, and control panel were adjusted to match the measured acceleration to that
prescribed by the user. For proper signal replication, the desired acceleration signal was
integrated to velocity within the VI. The harvester’s load voltage and current were
recorded through two channels of the 9219 module, with the current measured in series
with the load through the module’s internal shunt resistor13.
Figure 71. Laboratory test setup for measurement of harvester performance.
This setup in conjunction with the LabVIEW VI provided the following testing
capabilities:
Excite harvester with:
o Sine wave(s) with customizable frequency and amplitude.
o Swept sine wave with customizable starting/stopping frequencies/times
and amplitude. Sweep frequencies may be increasing, decreasing, or a
13 This configuration is accurate for currents up to +/- 25 mA. The minimum current necessary for accurate
measurement depends upon the measurement range set by the user in software.

116
combination. Maintain constant acceleration amplitude throughout sweep
(within 5%) via software compensation (in the VI) for hardware drift
o Measured bridge acceleration waveform.
Measure:
o Acceleration of harvester housing.
o Peak open and closed circuit voltage, and current under different loads.
Calculate from measured data:
o Power spectrum.
o Spectrogram.
o RMS and average power and energy.
o Frequency of accelerometer and voltage signals.
Filter out measured signal noise (mostly from shaker table field coil) and monitor
all signals between all hardware components.
Save, view, and post-process recorded data.
The setup would ideally include a two laser vibrometer to measure the position of
the translating magnet and the position of the harvester’s housing throughout excitation.
This would boost accuracy of the following measurements greatly. One laser position
sensor was purchased after this realization and will be used in future work. If the sensor
is adequate, a second will be purchased to complete accurate measurements.
Additionally, a closed-loop control system would ensure the harvester is excited with the
desired waveform, further increasing accuracy and eliminating the tedious adjustments
necessary to account for the shaker table’s nonlinearity at low frequency and high
displacement. A NI CompactRIOTM
was purchased following this realization, and is
being used to control the shaker in real-time for future tests.

117
6.2.2: Parameter Measurement
Before testing the completed prototype, its key parameters were measured to
complete the numerical model and allow comparison of simulation to testing. The
mechanical and electrical damping ratios and damping coefficients were measured first.
The mechanical damping ratio ( ) may be compared with other published research to
determine how well the energy harvester is constructed in terms of losses, such as
friction. The electrical damping ratio ( ) may be used to calculate the average
electromagnetic coupling coefficient (K) of the magnet/coil system, and may be
compared with other published values to determine the relative magnetic field strength.
The mechanical damping coefficient ( ), present in the system ODEs, was measured
first by recording the induced coil voltage, Figure 72. Mechanical damping was measured
with no electrical load, i.e., an open-circuit. The amplitudes of two peaks were used in
conjunction with the Logarithmic Decrement Method to measure the damping ratio,
Equations 6.1 and 6.2 (Silva, 2000). The mechanical damping coefficient was then
calculated using Equation 6.3. The measured values are given in . There is a great deal of
variation in the damping ratio and coefficient, depending upon which portion of the
recorded data is used in the calculation (up to a 300% difference). This greatly reduces
the author’s confidence in the Logarithmic Decrement Method, yet the method is
commonly used for calculation of these parameters.
To complete the calculation of the mechanical damping coefficient, the natural
frequency and mass were needed. The mass was weighed on a digital scale, and the
natural frequency was calculated using this mass value and the spring stiffness. The
spring stiffness was measured by placing various weights on the end of the mass, which
was suspended from the spring and measuring the deflection. The data points were
averaged, resulting in the value included in Table 13.

118
Figure 72. Transient response of open-circuit voltage to an impulse response for the
measurement of mechanical damping.
√ (6.1)
(
( )
( )) (6.2)
(6.3)
The damping measurement process was repeated with a resistive load to measure
the total damping ratio (mechanical + electrical), Figure 73. The electrical damping ratio
was then calculated by taking the difference between the total and mechanical damping
ratios. The measured values are given in Table 13. Like the mechanical damping
measurements, there is a great deal of variation in the damping ratio and coefficient
depending upon the portion of data that is used in the calculation. There is even greater

119
variation in the electrical damping, compared to mechanical damping, which results from
the dependence of electrical damping with respect to the position of the translating
magnet assembly within the coil. At one position more magnetic flux is linked by the coil
than at another, resulting in a different measured damping value. Without the use of
electromagnetic FEA, the exact damping profile cannot be known with a great deal of
accuracy. One work-around to this is to use a two-laser vibrometer to help measure
electrical damping at numerous magnet positions, and then construct a profile over the
full range of motion. This work is left until the proper equipment is available.
Figure 73. Transient response of closed-circuit voltage to an impulse response for the
measurement of total damping.
The average14 electromechanical conversion factor ( ) was calculated from the
measured electrical damping coefficient ( ) by rearranging Equation 5.8 to obtain
Equation 6.5.
14 The averaging in the measurement of electrical damping is transferred to this calculation.

120
√ ( ) (6.5)
Table 13. Results of damping measurement.
6.2.3: Linear Case
The lab setup was used to perform the following tests for the linear helical
extension spring and nonlinear repelling magnet cases15:
1. Measure power as function of load at fixed acceleration and frequency, to find the
optimum load resistance for maximum power transfer.
2. Measure power as function of acceleration amplitude at fixed frequency, with
matching load, to predict performance with amplitude and to measure the
breakaway friction force.
15 Tests 1-3 adhere to the standard suggested by the First Draft of a Standard for Vibration Energy Harvesting, presented in Appendix
A of (Priya & Inman, 2008).

121
3. Measure power as function of increasing and decreasing vibration frequency, at
fixed acceleration amplitude, with matching load, to predict performance with
frequency and to measure bandwidth and resonant frequency.
4. Measure load voltage, current, and power for bridge acceleration excitation.
The first test was performed by varying the load resistance with a potentiometer
then exciting the harvester with a sinusoidal excitation of peak (half of peak-to-peak)
acceleration amplitude of 0.01g and frequency of 2.2 Hz. This frequency was used for
this test as it was close to the resonant frequency. The peak harvested power was
recorded at 1.32 mW for the optimal load resistance of 14 kΩ, Figure 74. The load
resistance was set to the optimal value for the remaining tests.
The second test was performed by varying the peak acceleration amplitude in the
VI then exciting the harvester with a sinusoidal excitation at a frequency of 2.2 Hz. This
was repeated for increasing amplitude, resulting in Figure 75.
The third test was performed by continuously increasing the excitation frequency
linearly with time, while continuously decreasing the software amplitude gain to maintain
constant excitation amplitude. This was necessary to remove a bias towards high
frequencies, as the acceleration increases with the square of frequency (when measured in
m/s2 and rad/s, respectively). The algorithm used maintains constant amplitude across a
1-20 Hz sweep to within 5%. Figure 76 shows the results of this test, in which increasing
and decreasing sweeps were performed. The shaker table was not physically capable of
operating below 1.25 Hz for the acceleration level desired, so the sweeps are constrained
to this lower limit. Both have a bandwidth of around 0.8 Hz for this load resistance
(which was set for highest power rather than highest bandwidth).

122
The fourth test excited the harvester under replicated bridge acceleration from the
middle span of the IH-35N bridge over the Medina River for a period of 50 seconds. The
average power over this time was measured to be 80µW, which is around 6 times less
than desired to power one WSN node (with an average power consumption of 0.5 mW
under the current node design).
Table 14. Summary of linear harvester test results.
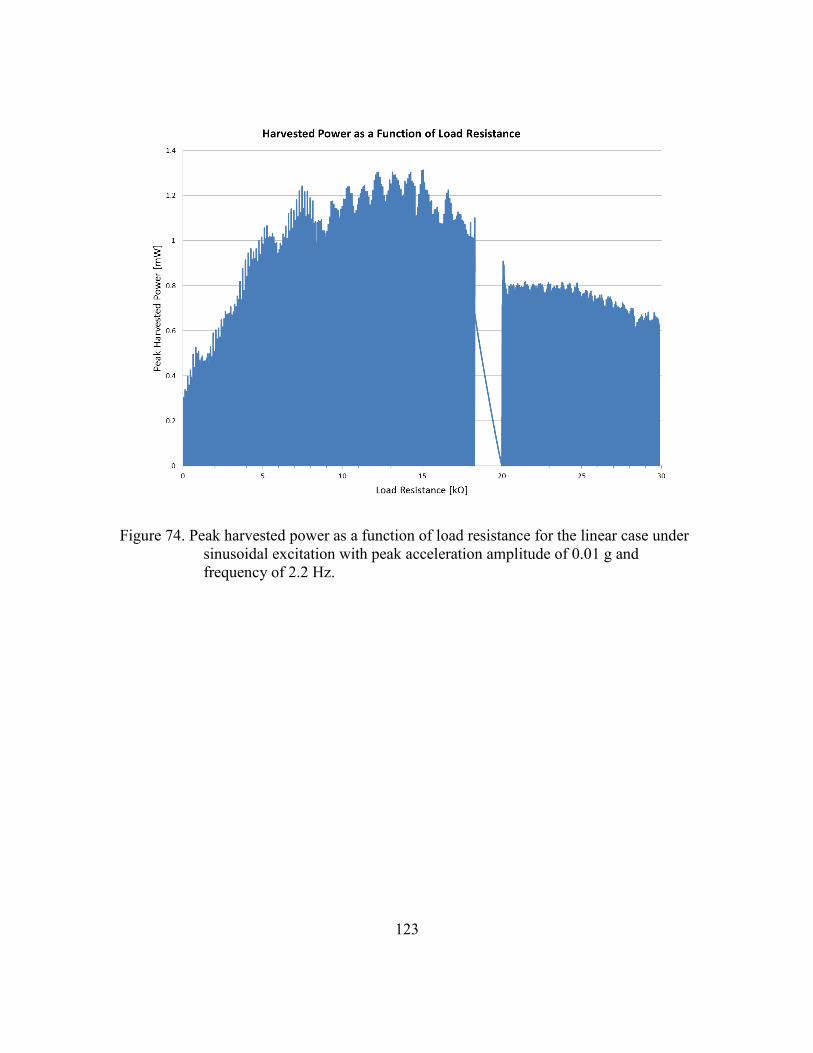
123
Figure 74. Peak harvested power as a function of load resistance for the linear case under
sinusoidal excitation with peak acceleration amplitude of 0.01 g and
frequency of 2.2 Hz.

124
Figure 75. Peak harvested power as a function of peak acceleration amplitude for the
linear case under sinusoidal excitation with frequency of 2.2 Hz and load
resistance of 14kΩ.

125
Figure 76. Peak harvested power as a function of excitation frequency for the linear case
with increasing and decreasing sinusoidal frequencies, acceleration
amplitude of 0.01 g, and load resistance of 14 kΩ.

126
Figure 77. Peak harvested power as a function of excitation frequency for the linear case
with increasing and decreasing sinusoidal frequencies, acceleration
amplitude of 0.05 g, and load resistance of 14 kΩ.

127
Figure 78. Peak harvested power as excited by a replicated IH-35N over Medina River
acceleration profile, for the linear case with load resistance of 14 kΩ.

128
6.2.4: Nonlinear Case
The same series of tests were performed for the nonlinear case as were for the
linear case entailed in the previous section. Unfortunately, some of the results were lost to
a catastrophic failure of the hard drive in the laboratory computer. Only a portion of the
data had been backed up, so the results are not fully exhaustive. The increasing frequency
sweep and replicated bridge excitation are presented in the following figures, using the
same load resistance as was found in the linear case.
Figure 79. Peak harvested power as a function of excitation frequency for the nonlinear
case with increasing sinusoidal frequency, acceleration amplitude of 0.05 g,
and load resistance of 14 kΩ.

129
Figure 80. Peak harvested power as excited by a replicated IH-35N over Medina River
acceleration profile, for the nonlinear case with load resistance of 14 kΩ.

130
These results show significantly wider bandwidth for the nonlinear case under
swept sinusoidal excitation, as predicted from the literature. The performance under
bridge excitation is significantly (1/3rd
) less than the linear case for the same data sample.
This confirms the simulation results of Chapter 5, suggesting the linear case is preferable
for bridge vibrations.
6.3: COMPARISON TO SIMULATION AND OTHER WORKS
To gain some preliminary perspective of the previous testing results, simulations
were performed with the measured parameters of the constructed prototype, as shown in
Figure 81. This simulation uses the measured bridge data from the IH-35N-US-290E
direct connector rather than the IH-35N bridge over Medina River, which was used for
the laboratory tests. The capability to compare the two with the same dataset is near
completion, and will be included in future work to be continued by another student on the
team. The average power of the experiment was measured to be 80µW, while the
simulated average power of Figure 81 is near 30µW. The long-term average of the
harvester presented by (Li, 2008) over 24 hours of bridge excitation is near 53µW. The
acceleration levels are much higher for the bridge (Li, 2008) used, but at the same time
the power is after rectification and storage by an active system. Although the harvester
used in Li’s test was designed for 3.11Hz and larger bridge amplitudes, a simulation with
the published harvester parameters was performed to gain a rough estimate of the
performance on the IH-35N-US-290E bridge (see Figure 82). The average power from
this simulation is 2 µW, but without further details of this harvester, the results included
in the figure should be considered as unconfirmed. More detailed benchmarking of the
harvester prototyped in this thesis to other published works is recommended for future
work.
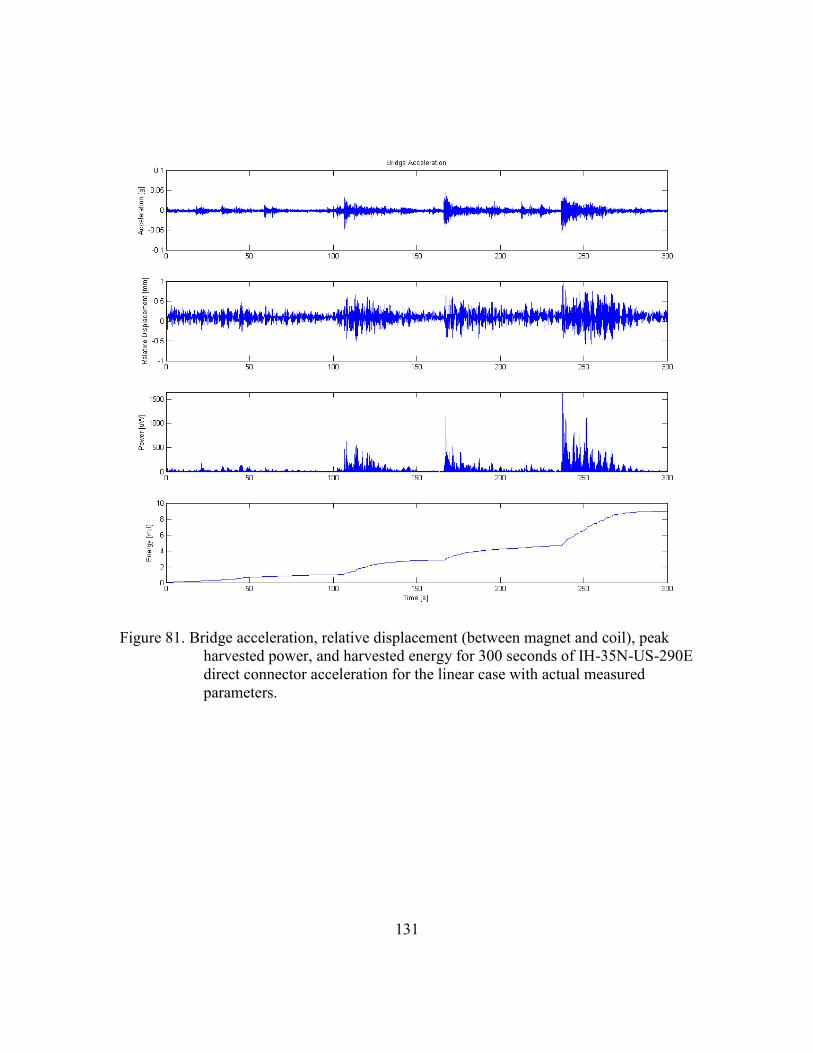
131
Figure 81. Bridge acceleration, relative displacement (between magnet and coil), peak
harvested power, and harvested energy for 300 seconds of IH-35N-US-290E
direct connector acceleration for the linear case with actual measured
parameters.

132
Figure 82. Bridge acceleration, relative displacement (between magnet and coil), peak
harvested power, and harvested energy for 300 seconds of IH-35N-US-290E
direct connector acceleration for parameters inferred from the harvester of
(Li, 2008).
6.4: CHAPTER SUMMARY
The embodied design was constructed by the author and upon completion; the
mechanical and electrical damping coefficients, undamped and damped natural
frequencies, and spring stiffness were measured. The laboratory setup which was
constructed by the author was detailed and then used to perform dynamic testing on the
prototype. The significant result is confirmation that the linear case outperforms the
nonlinear case for bridge vibration, though by only a factor of 3 rather than 100, as

133
predicted with the numerical model. The average power harvested by the linear case for
the bridge data tested was found to be 80µW. The data used was in the mid-range of
acceleration levels, so higher power is attainable even without changes to the harvester.
Regardless, this power level is below the target value of 0.5 mW as stated in Chapter 1.
For a first round prototype, with many approximations, this is fairly reasonable. The
energy harvesting team believes the target value may be reached with refined design and
improved equipment, software, and manufacturing capabilities. The harvesting of energy
from bridge vibrations, thought to be waste energy, is worthy of further investigation.
This investigation should proceed and with the right improvements, is possible to
successfully power a WSN node.

134
Chapter 7: Design Evolution
A beta prototype was designed to use identical internal components as the testing
prototype, for the most part, but in a smaller package with added functionality to ease
use. Four features pertaining to the harvester enclosure were identified for improvement.
They were:
Quick assembly and disassembly with minimal tooling
Bridge attachment in two locations with minimal tooling
Circuit enclosure with easy access
Quick frequency tuning with minimal tooling
This design is capable of using springs or spring magnets, as it was designed in
parallel with the testing of the alpha prototype, before conclusions of the performance
were made.
7.1: CONCEPTUAL AND EMBODIMENT DESIGN
Concept sketches for each option considered are shown in Figures 83-86. For
now, the features allowing the harvester to form part of an array of harvesters were not
designed and are left for future work. The first prototype is designed for top down
assembly by which internal components are inserted into the housing tube and fastened in
place from the outside. This proved to be much more time consuming than expected. For
the refined prototype the housing is composed of two halves which join along a vertical
seam. The two vertical halves are then held together by top and bottom caps. This allows
quick access to any internal part while greatly reducing part quantity by incorporating the
bearing, coil, and magnet mounting features into the housing as one part. Mounting is
eased via integrated clamps which pivot to allow attachment to various bridge
dimensions. The customer preferred mounting to the bridge’s web stiffener plates and

135
cross-frames. This is achieved with two clamps which may be oriented to match the
bridge’s dimensions without the use of any tools, and then tightened. The use of clamps
was largely prescribed by the customer requirement that structural modifications to the
bridge, adhesives, or magnetic clamps must be avoided. It should be noted that the
features allowing the harvester to form part of an array of harvesters were not designed
and are left for future work.
The circuit board is desired to be embedded in the back side of the harvester,
between the two mounting clamps, with a removable cover plate to protect against debris.
The top and bottom end caps serve to mount the bearings and spring magnets, and
facilitate adjustment to tune the resonant frequency. The bearing is housed inside of a
central post within each cap and held in place by a steel plate. This plate, being
ferromagnetic, also serves to hold the spring magnets in place. If desired, the spring
magnets may be replaced by helical springs, which would slide over the central post and
be compressed between the cap and translating magnet. Internal threads on the caps and
external threads on the two housing halves allow the user to tune the frequency up and
down by threading the caps in and out, respectively. This feature moves the spring or
magnets closer to or further from the translating magnet, changing the stiffness. The
threads allow the tuning to be performed easily without tools. In addition, a visual guide
could be printed on the housing to allow the user to thread to the desired frequency. The
design allows the harvester to be used with the linear or nonlinear case with minimal
steps required to change.
The final design is presented in Figures 87-89. A honeycomb structure was added
to the front of the housing to allow the project sponsors to see the internal components in
motion. In addition, ridges were added to the caps for added grip. Figure 90 shows the
harvester in two possible mounting orientations, attached to a cross-frame and web
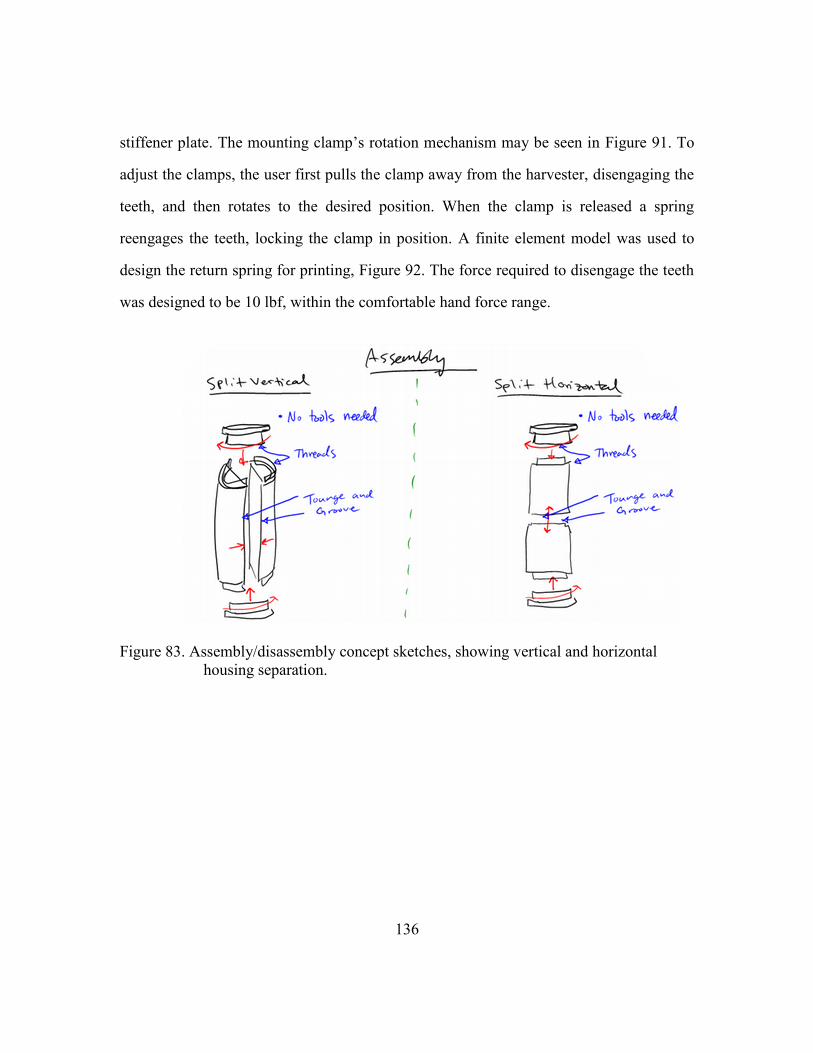
136
stiffener plate. The mounting clamp’s rotation mechanism may be seen in Figure 91. To
adjust the clamps, the user first pulls the clamp away from the harvester, disengaging the
teeth, and then rotates to the desired position. When the clamp is released a spring
reengages the teeth, locking the clamp in position. A finite element model was used to
design the return spring for printing, Figure 92. The force required to disengage the teeth
was designed to be 10 lbf, within the comfortable hand force range.
Figure 83. Assembly/disassembly concept sketches, showing vertical and horizontal
housing separation.

137
Figure 84. Bridge mounting concept sketches, showing mounting to the web stiffener
plate and cross-frame, as well as 0, 1, and 2 degree of freedom adjustment
for mounting to both locations.
Figure 85. Circuit board enclosure concept sketches.

138
Figure 86. Frequency tuning and magnet/spring interchangeability concept sketches.
Figure 87. Finished CAD model isometric view.

139
Figure 88. Finished CAD model exploded view.

140
Figure 89. Cross-sectional view of energy harvester, showing threads, bearing, magnet,
and circuit mounting.
Figure 90. Harvester mounted to cross-frame and web stiffener plate

141
Figure 91. Detail view of the clamp rotation mechanism (top), and cross-sectional view
(bottom).
Figure 92. FEA deflection results for the loaded return spring.
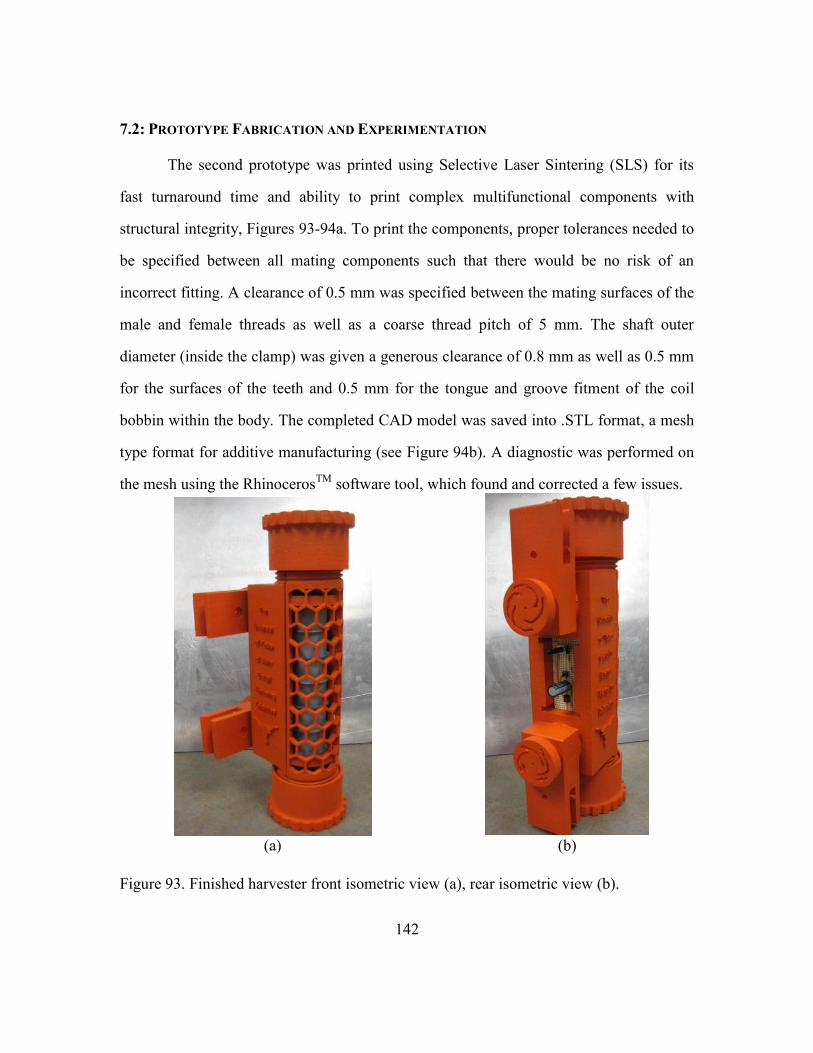
142
7.2: PROTOTYPE FABRICATION AND EXPERIMENTATION
The second prototype was printed using Selective Laser Sintering (SLS) for its
fast turnaround time and ability to print complex multifunctional components with
structural integrity, Figures 93-94a. To print the components, proper tolerances needed to
be specified between all mating components such that there would be no risk of an
incorrect fitting. A clearance of 0.5 mm was specified between the mating surfaces of the
male and female threads as well as a coarse thread pitch of 5 mm. The shaft outer
diameter (inside the clamp) was given a generous clearance of 0.8 mm as well as 0.5 mm
for the surfaces of the teeth and 0.5 mm for the tongue and groove fitment of the coil
bobbin within the body. The completed CAD model was saved into .STL format, a mesh
type format for additive manufacturing (see Figure 94b). A diagnostic was performed on
the mesh using the RhinocerosTM
software tool, which found and corrected a few issues.
(a)
(b)
Figure 93. Finished harvester front isometric view (a), rear isometric view (b).

143
Figure 94. Disassembled components.
Figure 95. , mesh as viewed in the mesh analysis tool RhinoscerosTM
(Robert McNeel &
Associates, 2011).

144
Tolerances are a large hindrance in design for SLS. While traditional
manufacturing techniques may achieve linear tolerances, for example, of .05 mm if
required, SLS will have considerable difficulty achieving 0.2 mm accuracy. This resulted
in excessive clearance in the mounting clamp’s interlocking teeth, which would hinder
the transfer of kinetic energy from the bridge to the harvester and reduce power output.
The force to disengage the mounting clamp of the refined prototype was measured
by attaching two springs and measuring the deflection once the clip was able to be
adjusted. The measured force was 11 lbf, close to the model’s prediction of 10 lbf. The
smooth surface of the clamp caused poor grip, so any future iteration should include a
recessed slot for ergonomics. Foam inserts were added to compensate by providing added
stiffness to the clamp’s spring.
Figure 96. Measurement of force needed to disengage teeth to allow clamp rotation.
7.3: CHAPTER SUMMARY
A beta design was completed which focused on the aspects of bridge mounting,
user interaction, tuning of resonant frequency, volume and part reduction, and housing of

145
circuitry. The effort was completed in parallel with the testing entailed in the previous
chapter, before results favoring the linear case were found. To guarantee this effort would
not be in vain, the design accommodates the use of springs or spring magnets to satisfy
either case. The design was constructed using SLS, and resulted in less than half the total
volume of the first prototype, as well as a part reduction of 86% (about half being
fasteners), assembly and tuning steps, and added mounting capability, as quantified in
Table 15.
Table 15. Quantitative prototype comparison.
The use of SLS was primarily to reduce construction time. If this design were to
be manufactured, injection molded plastic would replace the SLS parts with minor
changes, which would be considered in a design for manufacturing and assembly process.
Parameter Refined Prototype Testing Prototype
Volume ~200 in3
~450 in3
Unique Parts 7 51
Assembly Steps 7 36
Tuning Steps 2 10
Mounting Steps 2-4 Steps (1-5 mins) No mounting

146
Chapter 8: Conclusions
8.1: SUMMARY AND CONCLUSIONS
This thesis began with a description of the need for the project and its
organization and purpose. A review of energy harvesting was conducted to understand
the technologies available for investigation. A summary of this review is as follows:
Energy harvesting and scavenging is a field with great potential for future mobile,
quick-install, and remote applications, enabling growth in wireless sensing applications.
There are many energy sources and types of harvesters to consider for any application,
and the number is growing rapidly. Solar, wind, and vibration harvesters possess the
highest power densities of those reviewed, with solar being most attractive with a power
density one order of magnitude above wind and vibration. Vibration harvesting possesses
one very important trait—the ability to be sealed from the environment and protected
from intentional or accidental damage—whereas solar and wind harvesters must interact
with the elements directly. Properly matching the impedance characteristics of the energy
conversion mechanism to those of the energy source must not be overlooked, and this
requires careful study of the ambient energy source. Furthermore, conditioning and
storing the harvested electrical energy are as important to the overall success of the
harvester as capturing and converting the energy, so care must be taken in the design of
these subsystems. The average number of lifecycles, operating conditions, and self-
discharge of storage devices must be considered for successful delivery to the load.
Capacitors, ultracapacitors, and lithium-ion batteries are at the top of the storage options,
due to their high energy density, easy electrical monitoring, and growing research focus.
Ultracapacitors may be used to rapidly collect bursts of energy, and then deliver this
energy to a more efficient long-term storage source, such as ceramic capacitors or

147
lithium-ion batteries. The near future will see solid-electrolyte lithium-ion batteries with
increased storage capacity, allowing implementation in energy harvesting applications
where their 100,000+ cycle life will help maintenance-free operation for decades.
Several concepts of various types of harvesters were generated following this review
and narrowed down to vibration energy harvesting. Within vibration harvesting, the
selection of an electromagnetic conversion mechanism was made for its inherent benefits
for the application at hand. With this selection, the acceleration time histories of three
bridges were recorded and analyzed for spectral content. A summary of the concept
generation, selection, and field measurements is as follows:
The key functions a fully evolved energy harvester should perform were
identified as: interface with environment, direct energy from environment, separate
energy, transform energy, convert energy, store energy in short term, store electrical
energy in long term, supply energy to electric load, interface with user, divert debris,
theft, vandalism, and adapt to changing environment. Considering these functions, many
concepts were generated and organized into a mind-map. Several of these were further
developed and sketched, including road hose, wind-belt, reflected solar, expansion joint,
electromagnetic vibration, and piezoelectric impact concepts. A few concepts were
generated for mounting a generic harvester to the two most-common bridge types: I-
girder and box-girder, with a focus on meeting the limiting design constraints set by the
project. Patents relating to energy harvesting from bridges and roadways were briefly
presented, with the most developed invention harvesting the motions of expansion joints
from within the bridge. After review, the author selected vibration harvesting using
induction for further development. Harvesting vibrations requires more sophisticated

148
design, incurring larger risk than solar or wind harvesters, but with greater satisfaction of
the project requirements and constraints if successful. To counter this, other students on
the project are pursuing solar and wind harvesters in parallel efforts. To characterize the
bridge vibrations, accelerations were measured at various positions and times and
analyzed in the frequency and time domains. Further measurement and analysis is being
performed by a Civil Engineering graduate student on the project, with a focus on
temperature and traffic effects. The data presented thus-far shows stable, dominant
frequencies in the 1.5-16 Hz range which may be harvested by tuned linear harvesters.
Following this, a detailed literature review of electromagnetic vibration energy
harvesters was performed, including methods for tuning resonant frequency, widening
bandwidth, and efficiently rectifying, conditioning, and storing the harvested electrical
energy. The key points of this review being as follows:
The harvesters found thus far utilized a breadth of compliant members such as
helical springs, cantilevered beams, supported beams, and flexible hinges on rigid beams.
Others use soft ferromagnetic material such as iron to concentrate the magnetic flux in
the region of the coils to give higher induced voltages. A common trend amongst almost
all published research in the field is a lack of discussion or justification for the concept
selection. Regardless, the key findings of this literature review are:
For high peak power output:
o High seismic mass is desired.
o Target high acceleration amplitudes.
o Target high frequencies with sufficient acceleration amplitudes.
o Match harvester and load impedance.

149
o Use Schottky diodes if reverse breakdown voltage is acceptable.
o Use a tantalum or ceramic-type capacitor for storage.
o If significant benefit, use a switching AC-DC or switching DC-DC converter.
Use a commercially available system.
o Omit cogging/ripple forces and variable reluctance to reduce losses.
For high average power output (robustness):
o Desire wide bandwidth for simultaneous harvesting of multiple frequencies
Mechanically coupled, nonlinear, arrays, or bistable harvesters seem
good for ambient vibration.
Individual harvesters in an array should be rectified
independently to avoid destructive interference.
o Desire passively tunable bandwidth to match specific bridge during
installation.
Tune without introduction of damping by changing length, center of
gravity, or tensile axial loading.
Design for lowest frequency with capability of tuning to higher
frequencies.
In the end, the vibration source’s characteristics, the risk vs. reward preferences and
budget of the project heavily influence the type of harvester and circuitry which should
be used.
Drawing from this review, four electromagnetic vibration energy harvester
concepts were generated which include resonant frequency tuning and bandwidth
widening methods. The concept including stiffening magnetic stiffness was selected,
modeled analytically and numerically, and then designed parametrically. Simulations

150
were performed to predict the performance of the harvester using the numerical model.
More work is needed to expand the capabilities of the numerical model, but preliminary
results favor the linear case for bridge vibration as it has better performance under
random vibrations. This model was used to size the system and predict its performance,
leading to its embodiment.
The embodied design was constructed by the author and upon completion; the
mechanical and electrical damping coefficients, undamped and damped natural
frequencies, and spring stiffness were measured. The laboratory setup which was
constructed by the author was detailed and then used to perform dynamic testing on the
prototype, including replicated bridge excitation. The significant result is confirmation
that the linear case outperforms the nonlinear case for bridge vibration, though by only a
factor of 3 rather than 100, as predicted with the numerical model. The average power
harvested by the linear case for the bridge data tested was found to be 80µW. The data
used was in the mid-range of acceleration levels, so higher power is attainable even
without changes to the harvester. Regardless, this power level is below the target value of
0.5 mW as stated in Chapter 1. For a first round prototype, with many approximations,
this is fairly reasonable. The energy harvesting team believes the target value may be
reached with refined design and improved equipment, software, and manufacturing
capabilities. The harvesting of energy from bridge vibrations, thought to be waste energy,
is worthy of further investigation. This investigation should proceed and with the right
improvements, is possible to successfully power a WSN node. The harvester performance
was then compared to a similar harvester from Clarkson University.
Finally, a beta design was completed which focused on the aspects of bridge
mounting, user interaction, tuning of resonant frequency, volume and part reduction, and

151
housing of circuitry. The effort was completed in parallel with the testing of the first
prototype, before results favoring the linear case were found. To guarantee this effort
would not be in vain, the design accommodates the use of springs or spring magnets to
satisfy either case. The design was constructed using Selective Laser Sintering, and
resulted in less than half the total volume of the first prototype, as well as a part reduction
of 86% (about half being fasteners), assembly and tuning steps, and added mounting
capability.
8.2: FUTURE WORK
The work begun in this thesis will be carried on by another graduate student in the
energy harvesting team. Refinements to the numerical model, laboratory setup, and
prototype will be conducted to improve the performance of the constructed harvester.
These refinements include the installation and use of at least one laser position sensor for
accurate measurement of the translating magnet assembly’s position and velocity, as well
as the electromechanical conversion relationship between this velocity and the coil’s
open-circuit voltage. Another refinement will include the replacement of the NI
CompactDAQ with a NI CompactRIO to make use of its real-time controller. This will
allow the precise control of the shaker table acceleration, ensuring that the harvester is
excited as desired. With these changes made, it is desirable to test the harvester with a
sample of each bridge to fully understand its performance. This will coincide with the
refinement of the numerical model to include the more accurately measured parameters,
which will then be used to perform further testing without physical experimentation. An
improved numerical model will also aide in the refinement of the design to include lower
friction and higher electromagnetic coupling. Upon these changes, a prototype should be

152
fabricated with increased precision to ensure better matching of actual and desired
parameters. Rapid prototyping should be used to reduce manufacturing time and
complexity, with higher precision bushings or the like used in areas requiring close
tolerances. Any areas of potential sliding contact should be coated with a long-lasting
lubricant such as Tungsten Disulfide, from a coating service like Boca Bearing (“Boca
Bearing,” 2011). The coating achieves longer lifetime and lower friction than Teflon, and
is ideal for applications where liquid lubricant cannot be reapplied.
Before a large amount of effort is placed in refining the current designs, the
generated focused concepts should be reinvestigated and could include renewed focus on
bistable harvesters. These perform well for low frequency, random vibrations such as
those found on highway bridges, and could lead to significantly higher average power
output under real bridge excitation. In this reinvestigation, it would be very beneficial to
better understand the customer preferences of peak power vs. average power
(robustness), through utility functions, for example.
Finally, the electrical circuitry must be finalized with suggestions made in
Chapter 4 serving as inputs. A basic version would include: a Schottky diode full-wave
rectifier, a DC-DC voltage regulator, a Tantalum capacitor for long-term, low loss
storage, complimented by an ultracapacitor or lithium-ion battery. An improved version
would include a switching DC-DC regulator. Some off the shelf products exist from
Microstrain (Microstrain, 2011) and AmbioSystems (AmbioSystems, 2011), or can be
constructed using integrated circuits from a company such as Linear Technology (Linear
Technology, 2011).

153
Appendix A: Customer Needs Interview
Interviewee(s): Dr. Sharon Wood, Dr. Todd Helwig, Jeremiah Fasl, Matt Reichenbach
1. Concerning the energy harvester, what do you consider the most important aspect of
the system? Power WSN node for 2 week measurement interval w/ samples @ 30Hz for power =
60mW.
2. What do you think the second most important aspect of the energy harvester should
be? No altering bridge for mounting. Prefer mounting to web stiffeners and cross frames.
3. On a scale of 1 to 10, with 10 being the most important, rate the importance of being
wear-resistant to environmental factors. 7
4. On a scale of 1 to 10, with 10 being most important, rate the importance of ease of
installation. 6
5. On a scale of 1 to 10, with 10 being most important, rate the importance of the cost of
the product. 4
6. On a scale of 1 to 10, with 10 being the most important, rate the importance of the life
span of the product. 9, has to be better than current batteries.
7. How long do you think a product like this should last? Minimum of 10 years.
8. How much would you spend to purchase an energy harvesting system such as the one
being developed? For harvester: $600 max, $200 ideal.
9. How often would you be willing to do maintenance on the product? 10 years or more preferred.
10. How often do you expect vandalism/theft to be a problem? What measures need to
be taken to prevent vandalism/theft? If harvester mounted underneath bridge away from the abutments, not much. Mount in
location where man-lift is needed for access.

154
Appendix B: Specification Sheet
Table B-1. Functional requirements.
Demand
or WishTest / Verification
DGenerate long-term energy
level of
> 104 Wh/year (375
kJ/year)
analytical models, field
testing
DProvide power level
continuously for 2 weeks of> 61 mW
analytical models, field
testing
WProvide continuous power
for router of
> 207 mW
(1.8 kWh/year,
6.5 MJ/year)
analytical models, field
testing
WProvide continuous power
to gateway like CompactRio
> 10 W
(88 kWh/year,
315 MJ/year)
analytical models, field
testing
D
Store enough energy to go
two weeks with no
harvesting input
> 20 Wh
(75 kJ)
analytical models, field
testing
D Provide DC voltage 6 V DC, constantanalytical models, field
testing
D Provide DC current 200 mA, max pulseanalytical models, field
testing
WCommunicate to central
node
*lack of power,
*malfunction
analytical models, field
testing
Specification
Functional Requirements

155
Table B-2. Design constraints: Geometry, forces, material, and signals.
Demand
or WishTest / Verification
D Dimensions: Volume < 1 ft3 Engineering drawings
DDimensions: Area of largest
surface< 4 ft2 Engineering drawings
WWidth of any module sitting
on bottom flange of I-beam< 5 inches Engineering drawings
D
Clearance of bottom of
system above bottom of
bridge structure
> 0 inches Engineering drawings
DMaximum length of wiring
connecting system modules< 10 ft / node Engineering drawings
DForce needed to detach
from bridge> 100 lb field testing
DTorque needed to detach
from bridge> 200 ft-lb field testing
DProtected from forces,
impact, and chewing by
ice, hail, gravel,
debris, rats/mice and
squirrels, birds and
bats, bird nests, bird
and bat excrement
analytical models, field
testing
DResistant to humidity and
moisture for> 10 years accelerated testing
DResistant to damage from
temperatures-20° F - 120° F manufacturer specs
D
Resistant to corrosion from
moisture and acidic
substances (bird
excrement, pollution) for
> 10 years accelerated testing
DResistant to deterioration
from UV rays for> 10 years accelerated testing
W
EM interference with WSN
and other systems from
energy harvester
nonemanufacturer specs, field
testing
Constraints
Geometry
Specification
Forces
Material
Signals
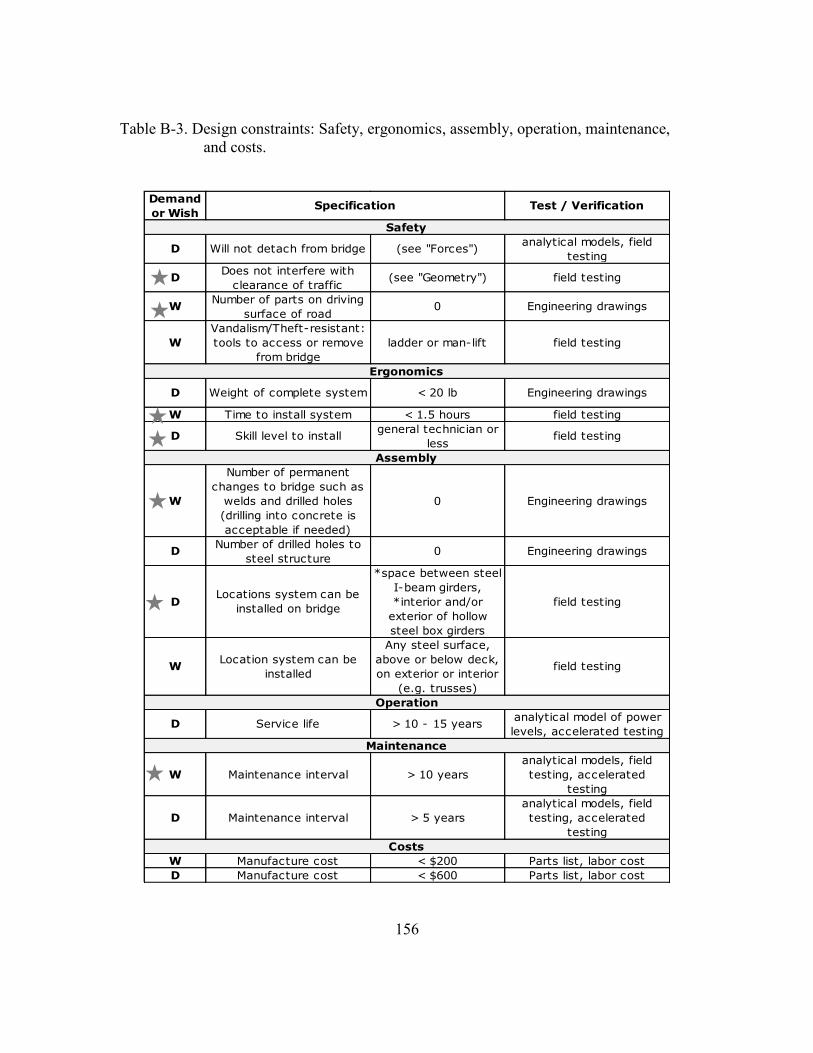
156
Table B-3. Design constraints: Safety, ergonomics, assembly, operation, maintenance,
and costs.
Demand
or WishTest / Verification
D Will not detach from bridge (see "Forces")analytical models, field
testing
DDoes not interfere with
clearance of traffic(see "Geometry") field testing
WNumber of parts on driving
surface of road0 Engineering drawings
W
Vandalism/Theft-resistant:
tools to access or remove
from bridge
ladder or man-lift field testing
D Weight of complete system < 20 lb Engineering drawings
W Time to install system < 1.5 hours field testing
D Skill level to installgeneral technician or
lessfield testing
W
Number of permanent
changes to bridge such as
welds and drilled holes
(drilling into concrete is
acceptable if needed)
0 Engineering drawings
DNumber of drilled holes to
steel structure0 Engineering drawings
DLocations system can be
installed on bridge
*space between steel
I-beam girders,
*interior and/or
exterior of hollow
steel box girders
field testing
WLocation system can be
installed
Any steel surface,
above or below deck,
on exterior or interior
(e.g. trusses)
field testing
D Service life > 10 - 15 yearsanalytical model of power
levels, accelerated testing
W Maintenance interval > 10 years
analytical models, field
testing, accelerated
testing
D Maintenance interval > 5 years
analytical models, field
testing, accelerated
testing
W Manufacture cost < $200 Parts list, labor cost
D Manufacture cost < $600 Parts list, labor cost
Costs
Assembly
Operation
Maintenance
Safety
Ergonomics
Specification

157
Appendix C: Generated Concepts Mind Map
Figure C-1. Mind map of all generated concepts organized and colored by energy source.

158
Bibliography
A123 Systems. (2007). A123 Systems. Retrieved January 19, 2011, from
http://www.a123systems.com/
Abramovich, H., Harash, E., Milgrom, C., & Amit, U. (2009). Energy Harvesting From
Airport Runway.
Advanced Linear Devices. (2011). Advanced Linear Devices. Retrieved April 6, 2011,
from http://www.aldinc.com/
Altshuller, G. S. (1984). Creativity As An Exact Science. Luxembourg: Gordon and
Breach.
AmbioSystems. (2011). AmbioSystems LLC | Home. Retrieved March 28, 2011, from
http://www.ambiosystems.com/
American Radio Relay League. (2011). The ARRL Handbook for Radio Communications.
(American Radio Relay, Ed.) (6th ed.). ARRL.
Amirtharajah, R., & Chandrakasan, a P. (1998). Self-powered signal processing using
vibration-based power generation. IEEE Journal of Solid-State Circuits, 33(5), 687-
695. doi:10.1109/4.668982
Annalisa Bonfiglio, & Danilo De Rossi (Eds.). (2010). Wearable Monitoring Systems.
Springer.
Armstrong, B., & Wit, C. C. de. (1995). Friction Modeling and Compensation. The
Control Handbook. CRC Press.

159
Arnold, D. P. (2007). Review of Microscale Magnetic Power Generation. IEEE
Transactions on Magnetics, 43(11), 3940-3951. doi:10.1109/TMAG.2007.906150
Baxter, L. K. (1996). Capacitive Sensors: Design and Applications (p. 320). John Wiley
and Sons.
Beeby, S. P., & O’Donnell, T. (2008). Electromagnetic Energy Harvesting. In D. J. Priya,
Shashank And Inman (Ed.), Energy Harvesting Technologies (pp. 129-161).
Springer Publishing Company, Incorporated. doi:10.1007/978-0-387-76464-1
Beeby, S. P., Torah, R. N., Tudor, M J, Glynne-Jones, P., O’Donnell, T., Saha, C. R., &
Roy, S. (2007). A micro electromagnetic generator for vibration energy harvesting.
Journal of Micromechanics and Microengineering, 17(7), 1257-1265.
doi:10.1088/0960-1317/17/7/007
Beeby, S. P., Tudor, M J, & White, N M. (2006). Energy harvesting vibration sources for
microsystems applications. Measurement Science and Technology, 17(12), R175-
R195. doi:10.1088/0957-0233/17/12/R01
Boca Bearing. (2011). . Retrieved August 26, 2011, from http://www.bocabearings.com/
Bradford, P., & Pabst, S. (2009). Energy Generating Expansion Joint.
Burke, A. (2000). Ultracapacitors: why, how, and where is the technology. Journal of
Power Sources, 91(1), 37-50. doi:10.1016/S0378-7753(00)00485-7

160
von Büren, T., & Tröster, G. (2007). Design and optimization of a linear vibration-driven
electromagnetic micro-power generator. Sensors and Actuators A: Physical, 135(2),
765-775. doi:10.1016/j.sna.2006.08.009
Challa, V. R., Prasad, M. G., Shi, Y., & Fisher, F. T. (2008). A vibration energy
harvesting device with bidirectional resonance frequency tunability. Smart Materials
and Structures, 17(1), 015035. doi:10.1088/0964-1726/17/01/015035
Charnegie, D. (2007). Frequency Tuning Concpets For Piezoelectric Cantilever Beams
and Plates for Energy Harvesting. Work. University of Pittsburgh.
Cheung, Y. K., Au, F. T. K., Zheng, D. Y., & Cheng, Y. S. (1999). Vibration of Multi-
Span Non-Uniform Bridges Under Moving Vehicles and Trains By Using Modified
Beam Vibration Functions. Journal of Sound and Vibration, 228(3), 611-628.
doi:10.1006/jsvi.1999.2423
Cottone, F., Vocca, H., & Gammaitoni, L. (2009). Nonlinear Energy Harvesting.
Physical Review Letters, 102(8), 1-4. doi:10.1103/PhysRevLett.102.080601
Crown Audio. (2011). Crown Amplifiers. Retrieved August 8, 2011, from
http://www.crownaudio.com/amps.htm
Curry, D. (2008). Energy Harvesting for Bridge Monitoring. Clarkson University.
Cymbet. (2011). Cymbet EnerChip Solid State Energy Storage for Thin Film Batteries
and Power Management. Retrieved January 19, 2011, from http://cymbet.com/

161
Danielsson, O. (2003). Design of a Linear Generator for Wave Energy Plant. Office,
(January).
Dick, B., Fralick, M., Jazo, H., Kerber, M., & Waters, R. (2009). Powering of wireless
sensors through the exclusive use of kinetic energy. 2009 IEEE Sensors (pp. 1406-
1409). Christchurch: IEEE. doi:10.1109/ICSENS.2009.5398431
Dick, B., Fralick, M., Jazo, H., Kerber, M., Brewer, J., & Waters, R. (2009). Optimization
of kinetic energy harvester for low amplitude vibration. 2009 IEEE Sensors (pp.
1840-1843). IEEE. doi:10.1109/ICSENS.2009.5398420
Dierks, E. C. (2011). Xmarks Shared Bookmarks Folder, Literature Review B. Retrieved
January 19, 2011, from http://share.xmarks.com/folder/bookmarks/iaJ2yLUUbD
Duderstadt, J. J. (chair). (2005). Committee to Assess the Capacity of the United States
Engineering Research Enterprise, Engineering Research and America’s Future:
Meeting the Challenge of a Global Economy. Washington, D.C.: National
Academies Press.
Ed Fagan Inc. (2011). Special Purpose Metals and Alloys for High Technology Industries
from Ed Fagan Inc. Retrieved August 8, 2011, from http://www.edfagan.com/
El-hami, M., Glynne-Jones, P., White, N. M., & Beeby, S. P. (2000). Design analysis of a
self-powered micro-renewable power supply. International Conference on Electrical
Machines 2000 (ICEM).

162
El-hami, M., Glynne-Jones, P., White, N.M., Hill, M., Beeby, S. P., James, E., Brown, A.
D., et al. (2001). Design and fabrication of a new vibration-based electromechanical
power generator. Sensors and Actuators A: Physical, 92(1-3), 335-342.
doi:10.1016/S0924-4247(01)00569-6
Electric-Auto. (2011). Comparison of Different Battery Technologies. Retrieved January
2, 2011, from http://electric-auto.org
Energy Harvesting Forum. (2011). List of Manufacturers. Retrieved January 2, 2011,
from http://www.energyharvesting.net/
Federal Highway Administration. (2010). Deficient Bridges by State and Highway
System. Retrieved February 14, 2011, from
http://www.fhwa.dot.gov/bridge/nbi/defbr10.cfm
Field, T., Energy, O., Begins, H., & Ripen, T. (n.d.). The Field Of Energy Harvesting
Begins To Ripen. Electronic Design.
Gerl, B. (2007). Piggybanks for Power. Pictures of the Future: Materials for the
Environment: Energy Storage. Retrieved from
http://www.siemens.com/innovation/en/publikationen/publications_pof/pof_fall_200
7/materials_for_the_environment/energy_storage.htm
Gieras, J., Oh, J.-H., Huzmezan, M., & Sane, H. (2005). Electromechanical Energy
Harvesting System.
163
Glynne-Jones, P., Tudor, M J, Beeby, S. P., & White, N M. (2004). An electromagnetic,
vibration-powered generator for intelligent sensor systems. Sensors and Actuators
A: Physical, 110(1-3), 344-349. doi:10.1016/j.sna.2003.09.045
Google. (2010). Google Labs Books Ngram Viewer. Retrieved 2010, from
http://ngrams.googlelabs.com/
Harrop, P. (2009). An Introduction to Energy Harvesting. IDTechEX Report. IDTechEX.
Retrieved from http://www.energyharvestingjournal.com
Helix Wind. (2011). S322 Turbine. Retrieved December 1, 2011, from
http://www.helixwind.com
Huggins, R. A. (2010). Energy Storage. Media (p. 406). Springer.
Humdinger Wind Energy LLC. (2011). Windbelt Innovation: Overview. Retrieved March
7, 2011, from http://www.humdingerwind.com
IDTechEx. (2011). Energy Harvesting Journal. Retrieved March 20, 2011, from
http://www.energyharvestingjournal.com
Infinitie Power Solutions. (2010). Infinite Power Solutions. Retrieved January 19, 2011,
from http://www.infinitepowersolutions.com/
Jewell, G. W., & Howe, D. (2002). A low-power, linear, permanent-magnet
generator/energy storage system. IEEE Transactions on Industrial Electronics,
49(3), 640-648. doi:10.1109/TIE.2002.1005391

164
Joseph A. Paradiso, T. S. (2005). Energy Scavenging for Mobile and Wireless
Electronics. PERVASIVE Computing, 18-27. IEEE CS and IEEE Com/Soc.
Khaligh, A., & Onar, O. C. (2009). Energy Harvesting: Solar, Wind, and Ocean Energy
Conversion Systems (p. 350). Taylor and Francis.
Kotter, D. K., Novack, S. D., Slafer, W. D., & Pinhero, P. (2008). Solar Nantenna
Electromagnetic Collectors. 2nd International Conference on Energy Sustainability,
ASME (pp. 1-7).
Labworks. (2011). Labworks Inc.- Vibration Test Products. Retrieved August 8, 2011,
from http://www.labworks-inc.com/
Li, H. (2008). A linear generator powered from bridge vibrations for wireless networks.
Clarkson University.
Li, H., & Pillay, Pragasen. (2007). A Linear Generator Powered from Bridge Vibrations
for Wireless Sensors. 2007 IEEE Industry Applications Annual Meeting, 523-529.
Ieee. doi:10.1109/07IAS.2007.85
Li, H., & Pillay, Pragasen. (2008). A Methodology to Design Linear Generators for
Energy Conversion of Ambient Vibrations. 2008 IEEE Industry Applications Society
Annual Meeting, 1-8. Ieee. doi:10.1109/08IAS.2008.72
Linear Technology. (2011). Linear Technology - Home Page. Retrieved April 6, 2011,
from http://www.linear.com/

165
MWS Industries. (2011). Copper Magnet Wire Data. Retrieved May 26, 2011, from
http://www.mwswire.com/pdf_files/mws_tech_book/copper_magnet_wire_data.pdf
Mann, B. P., & Sims, N. (2009). Energy harvesting from the nonlinear oscillations of
magnetic levitation. Journal of Sound and Vibration, 319(1-2), 515-530.
doi:10.1016/j.jsv.2008.06.011
Martinez, S. (1978). Highway Turbine.
Microstrain. (2011). Microstrain: Wireless Systems -EH-LinkTM
Energy Harvesting
Wireless Sensor Node. Retrieved March 28, 2011, from
http://www.microstrain.com/eh-link.aspx
Mide. (2011). Volture Vibration Energy Harvesters. Retrieved December 1, 2011, from
http://www.mide.com
Missouri Department of Transportation. (2011). Bridge Inspection with Snooper.
Retrieved March 16, 2011, from
http://www.modot.gov/newsroom/archives/2007.htm
Moog Crossbow. (2011). Moog Crossbow: The Smart Sensors Company. Retrieved
August 8, 2011, from http://www.xbow.com/
NIST Technology Innovation Program. (2008). Advanced Sensing Technologies for the
Infrastructure: Roads, Highways, Bridges and Water. Environmental Protection (pp.
1-8). Gaithersburg, MD.

166
National Climatic Data Center. (2011). Online Climate Data Directory. Retrieved March
6, 2011, from http://lwf.ncdc.noaa.gov/oa/climate/climatedata.html
National Instruments. (2011). What is a Wireless Sensor Network? Retrieved March 16,
2011, from http://sine.ni.com
National Transportation Safety Board. (2007). Highway Accident Report: Collapse of I-
35W Highway Bridge Minneapolis, Minnesota August 1, 2007. Transportation.
Retrieved from http://www.dot.state.mn.us/i35wbridge/
New Energy Watch. (2011). VAWT Versus HAWT Wind Power. Retrieved January 12,
2011, from http://www.newenergywatch.com
Paloheimo, H., & Omidiora, M. (2009). A Feasibility Study on Compressed Air Energy
Storage System for Portable Electrical and Electronic Devices. 2009 International
Conference on Clean Electrical Power, 355-362. Ieee.
doi:10.1109/ICCEP.2009.5212029
Perpetuum. (2011). Perpetuum PMG37 Micro-generator. Retrieved December 1, 2011,
from http://www.perpetuum.com
Pisano, G. P., & Shih, W. C. (2009). Restoring American Competitiveness. Harvard
Business Review, (July-August), 114-125.
Pistoia, G. (2005). Batteries for portable devices (p. 296). Elsevier.
Priya, S., & Inman, D. J. (Eds.). (2008). Energy Harvesting Technologies (1st ed.).
Springer. doi:10.1007/978-0-387-76464-1

167
RITA. (2007). Maps of Structurally Deficient Bridges on the National Highway System.
Retrieved March 16, 2011, from
http://www.bts.gov/programs/geographic_information_services/maps
Renewable Energy Research Laboratory: University of Massachusetts at Amherst.
(2011). Wind Power: Capacity Factor, Intermittency, and what happens when the
wind doesn’t blow? Amherst. Retrieved from http://www.ceere.org/rerl/about_wind
Retti, K. L. (2007). Multiple Layer Solar Energy Harvesting Composition and Method.
Rincon-Mora, G. A. (2009). Harvesting Microelectronic Circuits. In S. Priya & Daniel J.
Inman (Eds.), Energy Harvesting Technologies (pp. 287-321). Springer.
doi:10.1007/978-0-387-76464-1
Robert McNeel & Associates. (2011). Rhinoceros: NURBS modeling tools for designers.
Retrieved August 8, 2011, from http://www.rhino3d.com/rp.htm
Roundy, S., Wright, P. K., & Rabaey, J. M. (2004). Energy scavenging for wireless
sensor networks: with special focus on vibrations (p. 212). Springer.
Rutman, J. (2004). Magnetic Bearings: Theory and Practice, More or Less... Retrieved
January 2, 2011, from http://physics.technion.ac.il/~rutman/jeremy’s seminar.html
SAFT. (2007). Saft Batteries. Retrieved January 19, 2011, from
http://www.saftbatteries.com/
Saez, M. L. M. (2004). Energy Harvesting from Passive Human Power. Wearable
Computers.

168
Sazonov, E., Curry, D., & Pillay, P. (2009). Self-Powered Sensors for Monitoring of
Highway Bridges. IEEE Sensors Journal, 9(11), 1422-1429.
doi:10.1109/JSEN.2009.2019333
Seiko. (2011). Kinetic Watch. Retrieved December 1, 2011, from
http://www.seikowatches.com
Shearwood, C., & Yates, R. B. (1997). Development of an electromagnetic
microgenerator. Electronics Letters, 33(22), 1883-1884.
Silicon Solar. (2011). Flexible Solar Panels - Consumer Ready Modules - OEM.
Retrieved November 1, 2011, from http://www.siliconsolar.com
Silva, C. W. D. (2000). Vibration: Fundamentals and Practice (Vol. 0, p. 943). CRC
Press.
Smith, R. L. (1978). Road Vehicle-Actuated Air Compressor and System Therefor.
Solar Panel Center. (2011). Types of Solar Panels. Retrieved March 7, 2011, from
http://www.solarpanelcenter.net
Spreeman, D., Folkmer, B., Maurath, D., & Manoli, Y. (2006). Tunable Transducer for
low frequency vibrational energy scavenging. Proceedings, EurosensorsXX
(Goteborg, Sweeden).
Starner, T. (1996). Human-powered wearable computing. IBM Systems Journal, 35(3),
618-629. doi:10.1147/sj.353.0618

169
Stephen, N. (2006). On energy harvesting from ambient vibration. Journal of Sound and
Vibration, 293(1-2), 409-425. doi:10.1016/j.jsv.2005.10.003
Sundance Power Systems Inc. (2011). Solar Insolation for U.S. Major Cities. Retrieved
March 7, 2011, from http://www.sundancepower.com
Sunforce Products Inc. (2011). Sunforce 400-Watt Wind Generator. Retrieved December
1, 2011, from http://www.sunforceproducts.com
The MathWorks. (2011). Translational Friction: Simulate friction in contact between
moving bodies. Retrieved May 25, 2011, from
http://www.mathworks.com/help/toolbox/physmod/simscape/ref/translationalfriction
.html
Toberman, C. E. (1975). Expressway Power Generating System.
ToolStore. (2011). Faraday Flashlight. Retrieved December 1, 2011, from
http://homebuildshoptools.com
Turner-Fairbank Highway Research Center: Federal Highway Administration. (2001).
Reliability of Visual Bridge Inspection. Retrieved from
http://www.tfhrc.gov/pubrds/marapr01/bridge.htm
Ueno, T., Summers, E., Wun-Fogle, M., & Higuchi, T. (2008). Micro-magnetostrictive
Vibrator Using Iron-Gallium Alloy. Sensors and Actuators A: Physical, 148(1), 280-
284. doi:10.1016/j.sna.2008.08.017

170
Voltree Power. (2009). Bioenergy Harvester. Retrieved January 12, 2011, from
http://voltreepower.com
Wang, B. T.-lo, Huang, D., & Shahawy, M. (1992). Dynamic Response of Multigirder
Bridges. Structural Engineering, 118(8), 2222-2238.
Wang, Z. L., & Kang, Z. C. (1998). Functional and Smart Materials: Structural
Evolution and Structure Analysis (p. 514). Springer.
Weaver, J. M. (2010). Xmarks Shared Bookmarks Folder: Literature Review A.
Retrieved January 19, 2011, from
http://share.xmarks.com/folder/bookmarks/xAUnqum8uE
Weaver, J. M., Crawford, R. H., & Wood, K. L. (2010). Design of Energy Harvesting
Technology: Feasibility For Low-Power Wireless Sensor Networks. ASME 2010
International Design Engineering Technical Conferences & Computers and
Information in Engineering Conference (pp. 1-10). Montreal: ASME.
Weaver, J. M., Wood, K. L., & Crawford, R. H. (2011). Exploring Innovation
Opportunities in Energy Harvesting Using Functional Modeling Approaches. ASME
2011 International Design Engineering Technical Conferences. Washington, D.C.
Wikipedia Contributors. (2005). Darrieus Wind Turbine. Wikipedia, The Free
Encyclopedia. Retrieved March 6, 2011, from
http://en.wikipedia.org/wiki/File:Darrieus-windmill.jpg

171
Williams, C. B., & Yates, R. B. (1996). Analysis of a micro-electric generator for
microsystems. Sensors and Actuators A: Physical, 52, 8-11.
Windspire Energy. (2011). Windspire Wind Turbine. Retrieved December 1, 2011, from
http://www.windspireenergy.com
Wood, S. L., & Dean, P. K. (2007). Methodology for the Quantitative Evaluation of the
Remaining Fatigue Life of Fracture Critical Bridges. Austin.
Wu, X., Lin, J., Kato, S., Zhang, K., Ren, T., & Liu, L. (2008). A frequency adjustable
vibration energy harvester. PowerMEMS 2008+ microEMS 2008 (pp. 245-248).
Sendai.
Xing, X., Lou, J., Yang, G. M., Obi, O., Driscoll, C., & Sun, N. X. (2009). Wideband
vibration energy harvester with high permeability magnetic material. Applied
Physics Letters, 95(13), 134103. doi:10.1063/1.3238319
Xue, H., Hu, Y., & Wang, Q.-M. (2008). Broadband piezoelectric energy harvesting
devices using multiple bimorphs with different operating frequencies. IEEE
transactions on ultrasonics, ferroelectrics, and frequency control, 55(9), 2104-8.
doi:10.1109/TUFFC.903
Yang, B., Lee, C., Xiang, W., Xie, J., Han He, J., Kotlanka, R. K., Low, S. P., et al.
(2009). Electromagnetic energy harvesting from vibrations of multiple frequencies.
Journal of Micromechanics and Microengineering, 19(3), 035001.
doi:10.1088/0960-1317/19/3/035001

172
Yin, X., Fang, Z., Cai, C. S., & Deng, L. (2010). Non-stationary random vibration of
bridges under vehicles with variable speed. Engineering Structures, 32(8), 2166-
2174. Elsevier Ltd. doi:10.1016/j.engstruct.2010.03.019
Zhu, D., Roberts, S., Tudor, Michael J, & Beeby, S. P. (2008). Closed Loop Frequency
Tuning of a Vibration-Based Micro-Generator. PowerMEMS 2008+ microEMS
2008 (pp. 229-232). Sendai.
Zhu, D., Tudor, Michael J, & Beeby, S. P. (2010). Strategies for increasing the operating
frequency range of vibration energy harvesters: a review. Measurement Science and
Technology, 21(2). doi:10.1088/0957-0233/21/2/022001

173
Vita
Eric Carl Dierks was born and raised in Round Rock, Texas and earned his
Bachelor of Science in Mechanical Engineering from the University of Texas at Austin in
December 2008. Following this he worked for the Institute for Advanced Technology in
Austin modeling, simulating, optimizing, and testing battery-inductor pulsed power
supplies for electromagnetic rail guns for the United States Army and Navy. There, he
also briefly served as a reviewer for Carnegie Mellon's Autonomous Platform
Demonstrator robotic program. Upon completion of this thesis he plans to begin work in
the engineering design, energy harvesting, or automation fields.
Email: [email protected]
Phone: (512) 630-6634
Permanent Address: 300 Gladeview Dr. Round Rock, Texas 78681
Online Resume: www.linkedin.com/pub/eric-dierks/a/9a7/9b9
This thesis was typed by Eric Carl Dierks.