
DESIGN OF A FOILING OPTIMIST - OnePetro
24
1 Journal of Sailboat Technology, Article 2018-06 © 2018, The Society of Naval Architects and Marine Engineers. DESIGN OF A FOILING OPTIMIST A. Andersson, A. Barreng, E. Bohnsack, L. Larsson, L. Lundin, G. Olander, R. Sahlberg and E. Werner Chalmers University of Technology, Sweden C. Finnsgård and A. Persson Chalmers University of Technology and SSPA Sweden AB, Sweden M. Brown and J McVeagh SSPA Sweden AB, Sweden Manuscript received January 16, 2018; accepted September 11, 2018. Abstract: Because of the successful application of hydrofoils on the America's Cup catamarans in the past two campaigns the interest in foiling sailing craft has boosted. Foils have been fitted to a large number of yachts with great success, ranging from dinghies to ocean racers. An interesting question is whether one of the slowest racing boats in the world, the Optimist dinghy, can foil, and if so, at what minimum wind speed. The present paper presents a comprehensive design campaign to answer the two questions. The campaign includes a newly developed Velocity Prediction Program (VPP) for foiling/non-foiling conditions, a wind tunnel test of sail aerodynamics, a towing tank test of hull hydrodynamics and a large number of numerical predictions of foil characteristics. An optimum foil configuration is developed and towing tank tested with satisfactory results. The final proof of the concept is a successful on the water test with stable foiling at a speed of 12 knots. Keywords: Sailing, Foiling, Optimist dinghy, Wind tunnel, Towing tank, VPP NOMENCLATURE " Frontal area [m 2 ] # Projected area [m 2 ] $ Sail area [m 2 ] Chord length [m] ’ Drag coefficient ’( Bluff body drag coefficient ’) Junction drag coefficient ’* Wave drag coefficient ’*+ Wave and spray drag coefficient , Lift coefficient - Mean chord length [m] ( Aerodynamic drag (windage) [N] ) Junction drag [N] * Wave drag [N] *+ Wave and spray drag [N] Wing span [m] Section thickness [m] - Mean section thickness [m] Boat speed [m/s] Downloaded from http://onepetro.org/JST/article-pdf/3/01/1/2205397/sname-jst-2018-06.pdf by guest on 29 January 2022
-
Upload
khangminh22 -
Category
Documents
-
view
1 -
download
0
Transcript of DESIGN OF A FOILING OPTIMIST - OnePetro

1
Journal of Sailboat Technology, Article 2018-06 © 2018, The Society of Naval Architects and Marine Engineers.
DESIGN OF A FOILING OPTIMIST A. Andersson, A. Barreng, E. Bohnsack, L. Larsson, L. Lundin, G. Olander, R. Sahlberg and E. Werner Chalmers University of Technology, Sweden C. Finnsgård and A. Persson Chalmers University of Technology and SSPA Sweden AB, Sweden M. Brown and J McVeagh SSPA Sweden AB, Sweden Manuscript received January 16, 2018; accepted September 11, 2018.
Abstract: Because of the successful application of hydrofoils on the America's Cup catamarans in the past two campaigns the interest in foiling sailing craft has boosted. Foils have been fitted to a large number of yachts with great success, ranging from dinghies to ocean racers. An interesting question is whether one of the slowest racing boats in the world, the Optimist dinghy, can foil, and if so, at what minimum wind speed. The present paper presents a comprehensive design campaign to answer the two questions. The campaign includes a newly developed Velocity Prediction Program (VPP) for foiling/non-foiling conditions, a wind tunnel test of sail aerodynamics, a towing tank test of hull hydrodynamics and a large number of numerical predictions of foil characteristics. An optimum foil configuration is developed and towing tank tested with satisfactory results. The final proof of the concept is a successful on the water test with stable foiling at a speed of 12 knots.
Keywords: Sailing, Foiling, Optimist dinghy, Wind tunnel, Towing tank, VPP
NOMENCLATURE 𝐴" Frontal area [m2] 𝐴# Projected area [m2] 𝐴$ Sail area [m2] 𝑐 Chord length [m] 𝐶' Drag coefficient 𝐶'( Bluff body drag coefficient 𝐶') Junction drag coefficient 𝐶'* Wave drag coefficient 𝐶'*+ Wave and spray drag coefficient 𝐶, Lift coefficient 𝑐- Mean chord length [m] 𝐷( Aerodynamic drag (windage) [N] 𝐷) Junction drag [N] 𝐷* Wave drag [N] 𝐷*+ Wave and spray drag [N] 𝑠 Wing span [m] 𝑡 Section thickness [m] 𝑡- Mean section thickness [m] 𝑉 Boat speed [m/s]
Dow
nloaded from http://onepetro.org/JST/article-pdf/3/01/1/2205397/snam
e-jst-2018-06.pdf by guest on 29 January 2022
2
𝑉( Apparent wind speed [m/s] 𝜌 Water density [kg/m3] 𝜌( Air density [kg/m3] AR Aspect ratio
GRP Glass fibre reinforced plastics LOA Length overall LWL Length of waterline
INTRODUCTION The hottest trend in sailing at present is foiling. Since the appearance of the foiling catamarans in the 34th America’s Cup in 2013, the interest has boosted and foils are now used on a large number of boats, ranging from dinghies, like the Laser, to large racing yachts, like the Vendee Globe IMOCA 60s. The most sophisticated foiling class is probably the Moth (Boegle et al, 2012), which has used foils since around 2000. The relatively recent interest in foiling yachts is in fact a bit surprising, since the technique has been known for about a century (Hoerner, 1957), and has been used for high-speed ferries (Faltinsen, 2005) for a long time. Nevertheless, the relative ease by which the technique has been applied to contemporary yachts and dinghies may have come as a surprise. The purpose of the present project is to take the ultimate step, and apply the technique to one of the slowest, but most popular boats in the world: the Optimist dinghy. The question is: can it foil; and if so, at what minimum wind speed?
THE OPTIMIST The Optimist is the largest racing class in the world. It is raced in 120 countries. Most top-level sailors have started their career in the Optimist. However, it is also the slowest dinghy in the Portsmouth Yardstick, a handicapping system handled by the Royal Yachting Association in the UK. Table 1 lists the main dimensions of the dinghy, according to the International Optimist Dinghy Association (2017)
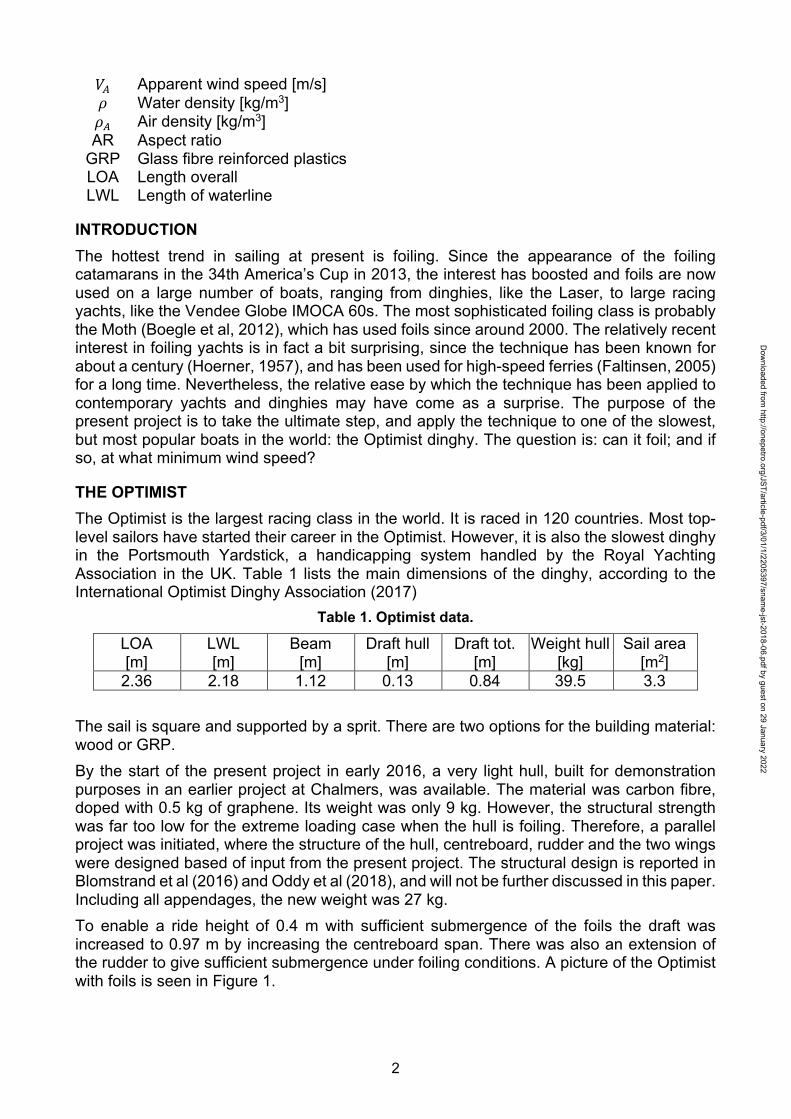
Table 1. Optimist data.
LOA [m]
LWL [m]
Beam [m]
Draft hull [m]
Draft tot. [m]
Weight hull [kg]
Sail area [m2]
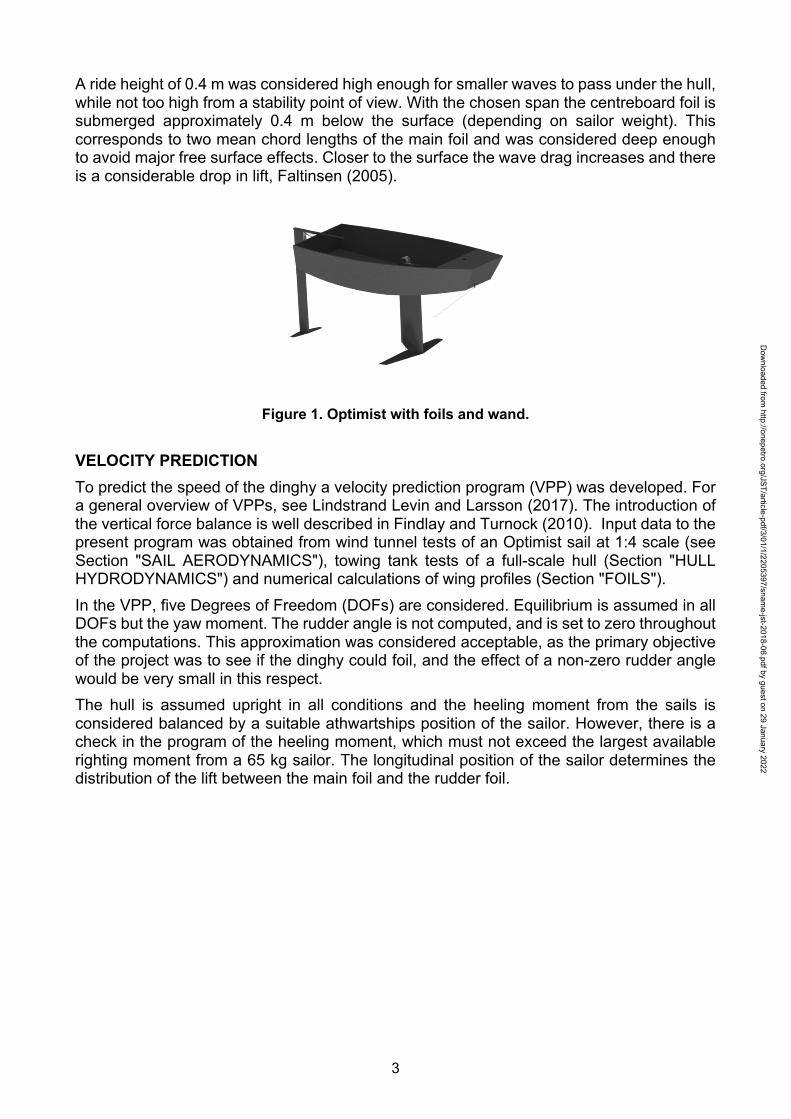
2.36 2.18 1.12 0.13 0.84 39.5 3.3 The sail is square and supported by a sprit. There are two options for the building material: wood or GRP. By the start of the present project in early 2016, a very light hull, built for demonstration purposes in an earlier project at Chalmers, was available. The material was carbon fibre, doped with 0.5 kg of graphene. Its weight was only 9 kg. However, the structural strength was far too low for the extreme loading case when the hull is foiling. Therefore, a parallel project was initiated, where the structure of the hull, centreboard, rudder and the two wings were designed based of input from the present project. The structural design is reported in Blomstrand et al (2016) and Oddy et al (2018), and will not be further discussed in this paper. Including all appendages, the new weight was 27 kg. To enable a ride height of 0.4 m with sufficient submergence of the foils the draft was increased to 0.97 m by increasing the centreboard span. There was also an extension of the rudder to give sufficient submergence under foiling conditions. A picture of the Optimist with foils is seen in Figure 1.
Dow
nloaded from http://onepetro.org/JST/article-pdf/3/01/1/2205397/snam
e-jst-2018-06.pdf by guest on 29 January 2022
3
A ride height of 0.4 m was considered high enough for smaller waves to pass under the hull, while not too high from a stability point of view. With the chosen span the centreboard foil is submerged approximately 0.4 m below the surface (depending on sailor weight). This corresponds to two mean chord lengths of the main foil and was considered deep enough to avoid major free surface effects. Closer to the surface the wave drag increases and there is a considerable drop in lift, Faltinsen (2005).
Figure 1. Optimist with foils and wand.
VELOCITY PREDICTION To predict the speed of the dinghy a velocity prediction program (VPP) was developed. For a general overview of VPPs, see Lindstrand Levin and Larsson (2017). The introduction of the vertical force balance is well described in Findlay and Turnock (2010). Input data to the present program was obtained from wind tunnel tests of an Optimist sail at 1:4 scale (see Section "SAIL AERODYNAMICS"), towing tank tests of a full-scale hull (Section "HULL HYDRODYNAMICS") and numerical calculations of wing profiles (Section "FOILS"). In the VPP, five Degrees of Freedom (DOFs) are considered. Equilibrium is assumed in all DOFs but the yaw moment. The rudder angle is not computed, and is set to zero throughout the computations. This approximation was considered acceptable, as the primary objective of the project was to see if the dinghy could foil, and the effect of a non-zero rudder angle would be very small in this respect. The hull is assumed upright in all conditions and the heeling moment from the sails is considered balanced by a suitable athwartships position of the sailor. However, there is a check in the program of the heeling moment, which must not exceed the largest available righting moment from a 65 kg sailor. The longitudinal position of the sailor determines the distribution of the lift between the main foil and the rudder foil.
Dow
nloaded from http://onepetro.org/JST/article-pdf/3/01/1/2205397/snam
e-jst-2018-06.pdf by guest on 29 January 2022
4
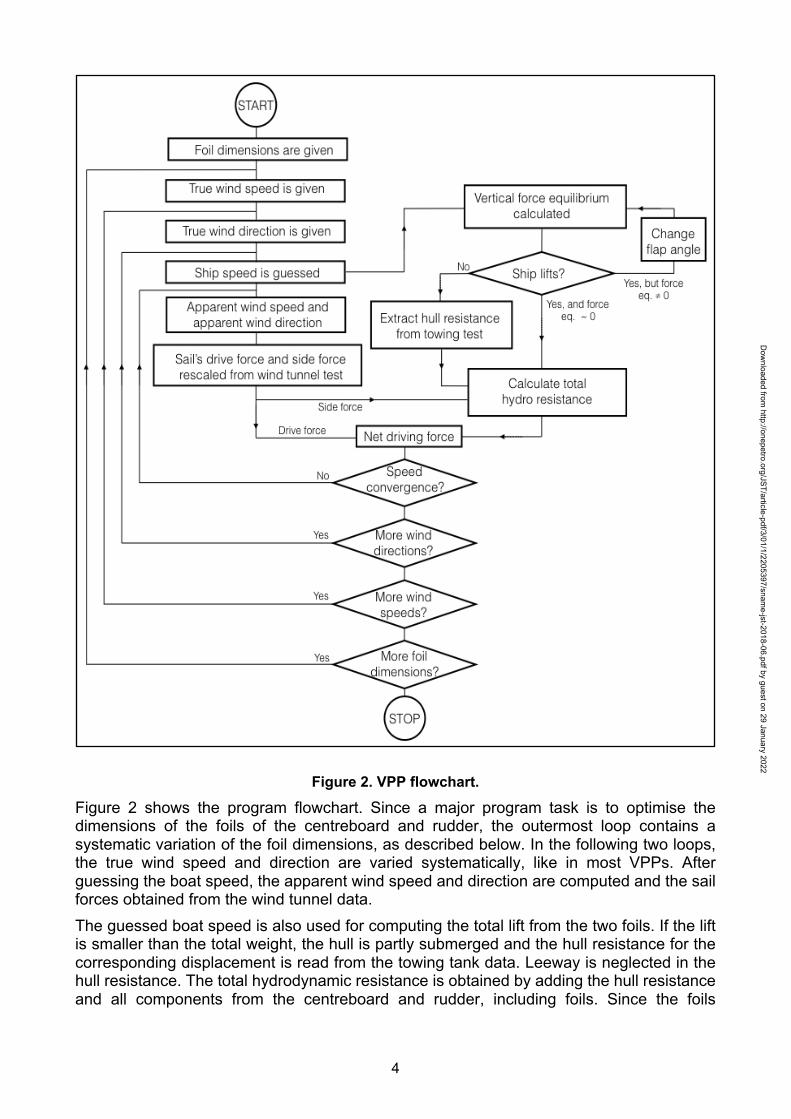
Figure 2. VPP flowchart.
Figure 2 shows the program flowchart. Since a major program task is to optimise the dimensions of the foils of the centreboard and rudder, the outermost loop contains a systematic variation of the foil dimensions, as described below. In the following two loops, the true wind speed and direction are varied systematically, like in most VPPs. After guessing the boat speed, the apparent wind speed and direction are computed and the sail forces obtained from the wind tunnel data. The guessed boat speed is also used for computing the total lift from the two foils. If the lift is smaller than the total weight, the hull is partly submerged and the hull resistance for the corresponding displacement is read from the towing tank data. Leeway is neglected in the hull resistance. The total hydrodynamic resistance is obtained by adding the hull resistance and all components from the centreboard and rudder, including foils. Since the foils
Dow
nloaded from http://onepetro.org/JST/article-pdf/3/01/1/2205397/snam
e-jst-2018-06.pdf by guest on 29 January 2022
5
effectively prevent the overflow from the pressure to the suction sides on the centreboard and rudder the flow may be considered two-dimensional with zero induced resistance due to leeway. However, the profile drag depends on the leeway, so this is determined from the force balance at right angles to the direction of motion. The assumption of zero induced resistance for the centreboard and rudder may appear optimistic, but the component is very small compared to the other resistance components. The computed leeway angle is 4 to 5 degrees just before take-off at the higher wind speeds. At take off the boat speed is more than doubled and the leeway angles are reduced to between 1 and 2 degrees. Sufficient side force is developed at these small angles, even though there is a reduction in the lateral area, since the side force is proportional to speed squared. The centreboard and rudder are very lightly loaded when flying and the induced resistance negligible. Just before take-off the induced resistance can be estimated to 5% of the total resistance without endplate effects. With the foils it should be considerably smaller. The longitudinal force balance is checked next, and the speed adjusted accordingly for a new loop. If the lift computed in the uppermost box to the right is larger than the total weight, the flap angle is reduced, and this loop continues until the lift is equal to the gravity force within a certain limit.
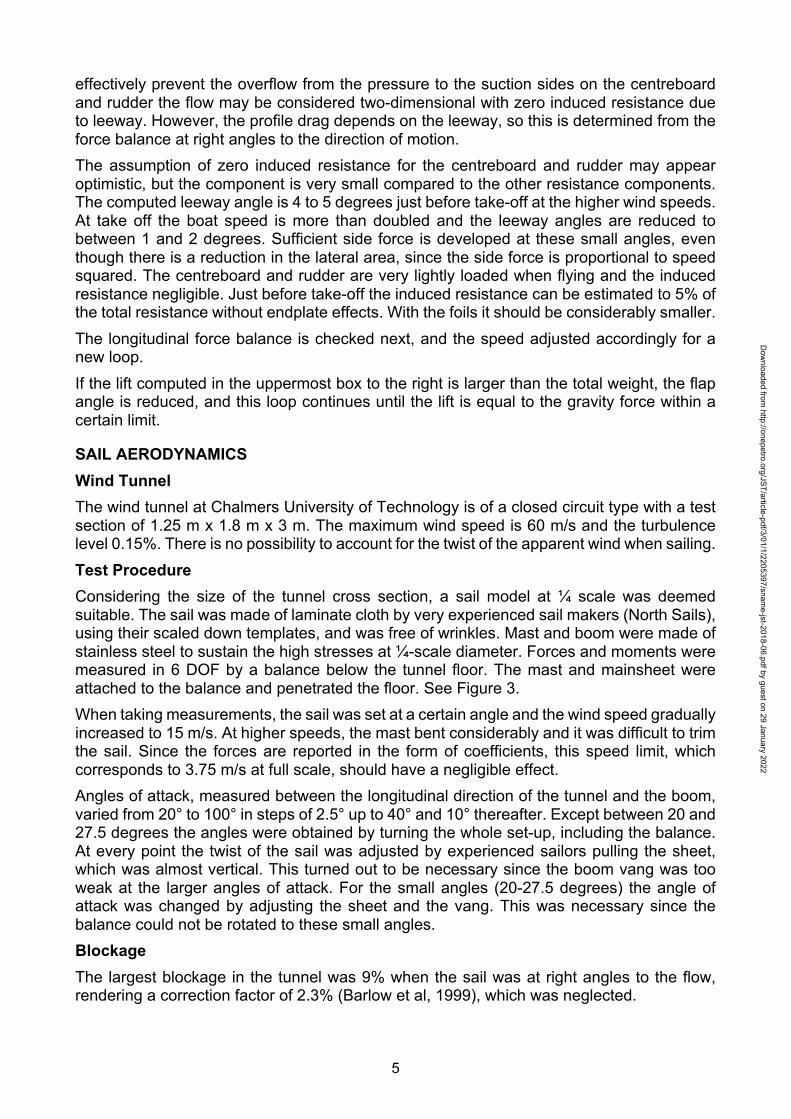
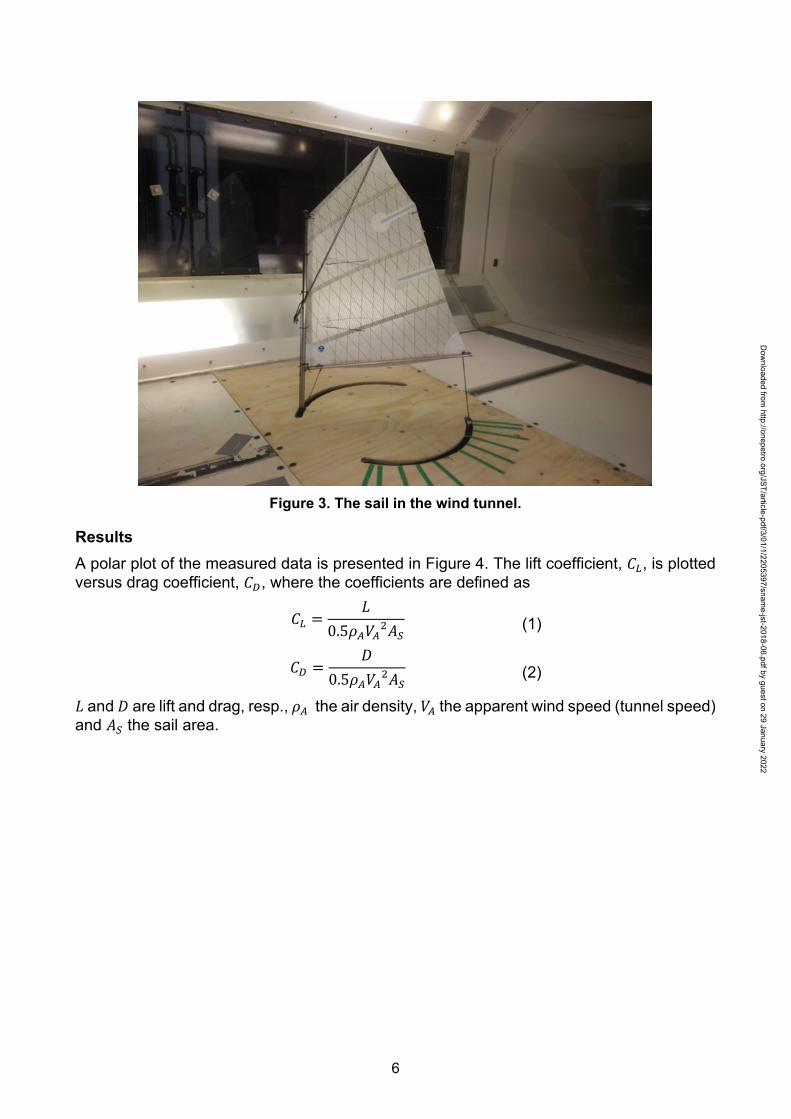
SAIL AERODYNAMICS Wind Tunnel The wind tunnel at Chalmers University of Technology is of a closed circuit type with a test section of 1.25 m x 1.8 m x 3 m. The maximum wind speed is 60 m/s and the turbulence level 0.15%. There is no possibility to account for the twist of the apparent wind when sailing. Test Procedure Considering the size of the tunnel cross section, a sail model at ¼ scale was deemed suitable. The sail was made of laminate cloth by very experienced sail makers (North Sails), using their scaled down templates, and was free of wrinkles. Mast and boom were made of stainless steel to sustain the high stresses at ¼-scale diameter. Forces and moments were measured in 6 DOF by a balance below the tunnel floor. The mast and mainsheet were attached to the balance and penetrated the floor. See Figure 3. When taking measurements, the sail was set at a certain angle and the wind speed gradually increased to 15 m/s. At higher speeds, the mast bent considerably and it was difficult to trim the sail. Since the forces are reported in the form of coefficients, this speed limit, which corresponds to 3.75 m/s at full scale, should have a negligible effect. Angles of attack, measured between the longitudinal direction of the tunnel and the boom, varied from 20° to 100° in steps of 2.5° up to 40° and 10° thereafter. Except between 20 and 27.5 degrees the angles were obtained by turning the whole set-up, including the balance. At every point the twist of the sail was adjusted by experienced sailors pulling the sheet, which was almost vertical. This turned out to be necessary since the boom vang was too weak at the larger angles of attack. For the small angles (20-27.5 degrees) the angle of attack was changed by adjusting the sheet and the vang. This was necessary since the balance could not be rotated to these small angles. Blockage The largest blockage in the tunnel was 9% when the sail was at right angles to the flow, rendering a correction factor of 2.3% (Barlow et al, 1999), which was neglected.
Dow
nloaded from http://onepetro.org/JST/article-pdf/3/01/1/2205397/snam
e-jst-2018-06.pdf by guest on 29 January 2022
6
Figure 3. The sail in the wind tunnel.
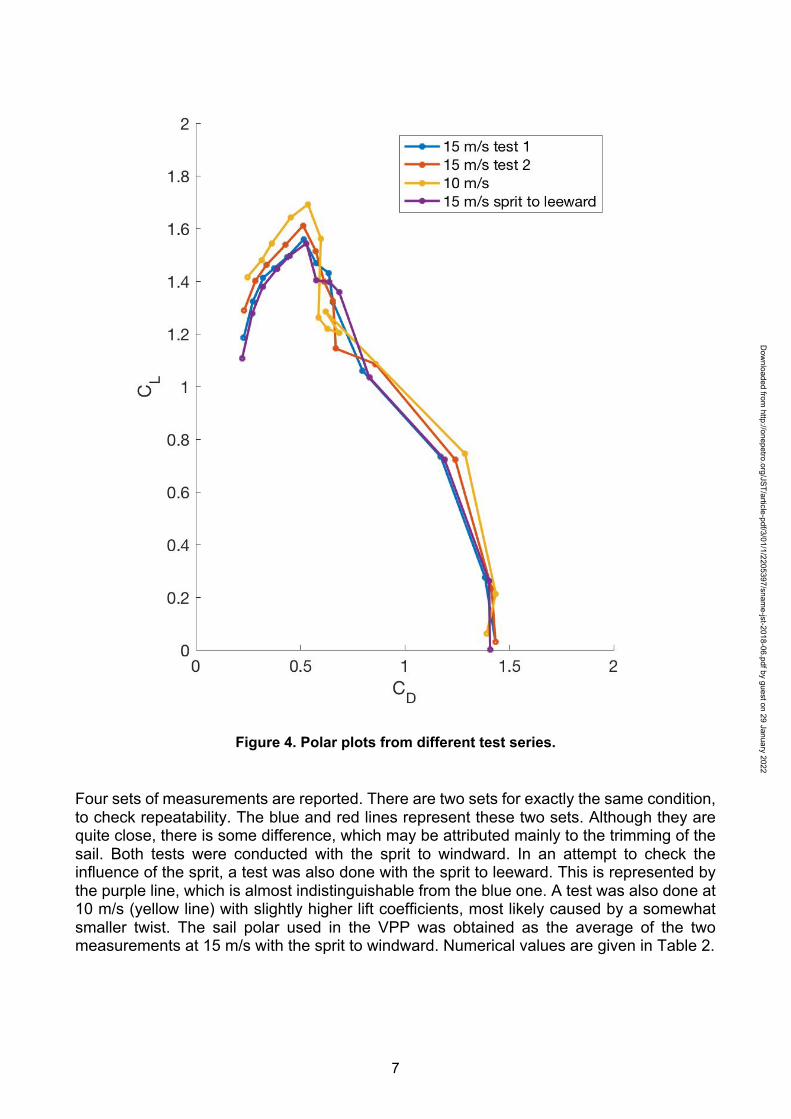
Results A polar plot of the measured data is presented in Figure 4. The lift coefficient, 𝐶,, is plotted versus drag coefficient, 𝐶', where the coefficients are defined as
𝐶, =𝐿
0.5𝜌(𝑉(8𝐴$ (1)
𝐶' =𝐷
0.5𝜌(𝑉(8𝐴$ (2)
𝐿 and𝐷 are lift and drag, resp., 𝜌(the air density, 𝑉( the apparent wind speed (tunnel speed) and 𝐴$ the sail area.
Dow
nloaded from http://onepetro.org/JST/article-pdf/3/01/1/2205397/snam
e-jst-2018-06.pdf by guest on 29 January 2022
7
Figure 4. Polar plots from different test series.
Four sets of measurements are reported. There are two sets for exactly the same condition, to check repeatability. The blue and red lines represent these two sets. Although they are quite close, there is some difference, which may be attributed mainly to the trimming of the sail. Both tests were conducted with the sprit to windward. In an attempt to check the influence of the sprit, a test was also done with the sprit to leeward. This is represented by the purple line, which is almost indistinguishable from the blue one. A test was also done at 10 m/s (yellow line) with slightly higher lift coefficients, most likely caused by a somewhat smaller twist. The sail polar used in the VPP was obtained as the average of the two measurements at 15 m/s with the sprit to windward. Numerical values are given in Table 2.
Dow
nloaded from http://onepetro.org/JST/article-pdf/3/01/1/2205397/snam
e-jst-2018-06.pdf by guest on 29 January 2022
8
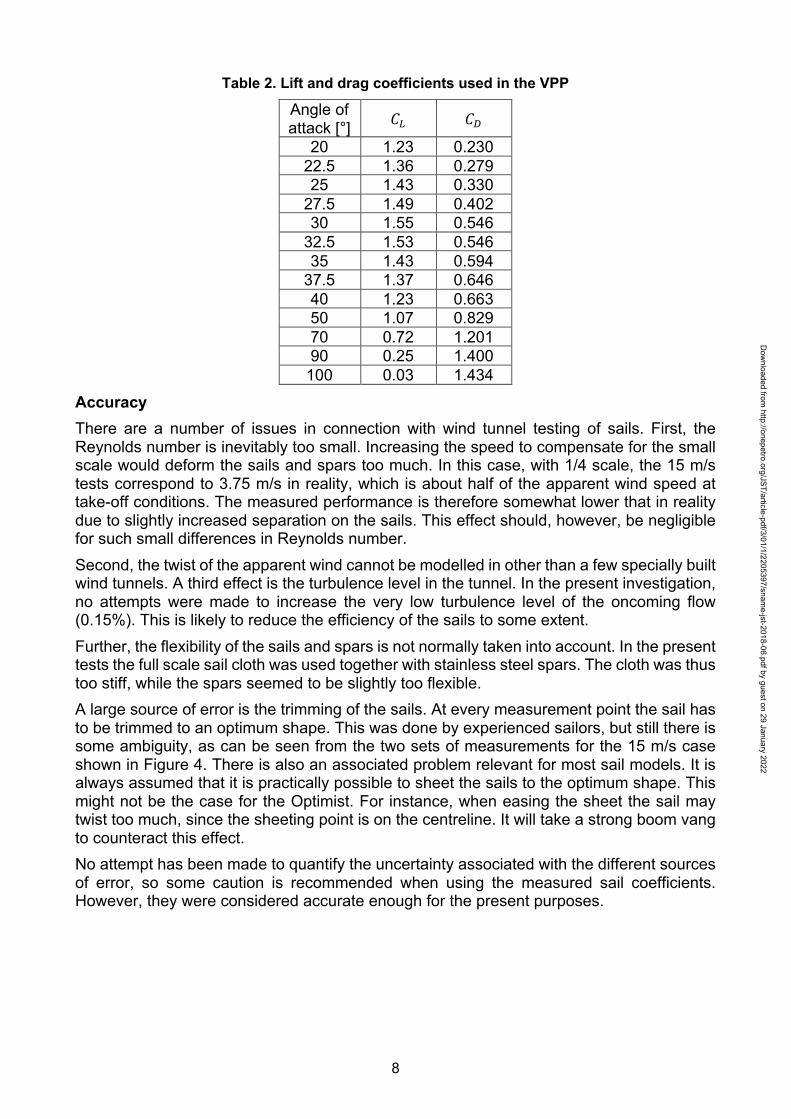
Table 2. Lift and drag coefficients used in the VPP
Angle of attack [°] 𝐶, 𝐶'
20 1.23 0.230 22.5 1.36 0.279 25 1.43 0.330
27.5 1.49 0.402 30 1.55 0.546
32.5 1.53 0.546 35 1.43 0.594
37.5 1.37 0.646 40 1.23 0.663 50 1.07 0.829 70 0.72 1.201 90 0.25 1.400
100 0.03 1.434 Accuracy There are a number of issues in connection with wind tunnel testing of sails. First, the Reynolds number is inevitably too small. Increasing the speed to compensate for the small scale would deform the sails and spars too much. In this case, with 1/4 scale, the 15 m/s tests correspond to 3.75 m/s in reality, which is about half of the apparent wind speed at take-off conditions. The measured performance is therefore somewhat lower that in reality due to slightly increased separation on the sails. This effect should, however, be negligible for such small differences in Reynolds number. Second, the twist of the apparent wind cannot be modelled in other than a few specially built wind tunnels. A third effect is the turbulence level in the tunnel. In the present investigation, no attempts were made to increase the very low turbulence level of the oncoming flow (0.15%). This is likely to reduce the efficiency of the sails to some extent. Further, the flexibility of the sails and spars is not normally taken into account. In the present tests the full scale sail cloth was used together with stainless steel spars. The cloth was thus too stiff, while the spars seemed to be slightly too flexible. A large source of error is the trimming of the sails. At every measurement point the sail has to be trimmed to an optimum shape. This was done by experienced sailors, but still there is some ambiguity, as can be seen from the two sets of measurements for the 15 m/s case shown in Figure 4. There is also an associated problem relevant for most sail models. It is always assumed that it is practically possible to sheet the sails to the optimum shape. This might not be the case for the Optimist. For instance, when easing the sheet the sail may twist too much, since the sheeting point is on the centreline. It will take a strong boom vang to counteract this effect. No attempt has been made to quantify the uncertainty associated with the different sources of error, so some caution is recommended when using the measured sail coefficients. However, they were considered accurate enough for the present purposes.
Dow
nloaded from http://onepetro.org/JST/article-pdf/3/01/1/2205397/snam
e-jst-2018-06.pdf by guest on 29 January 2022
9
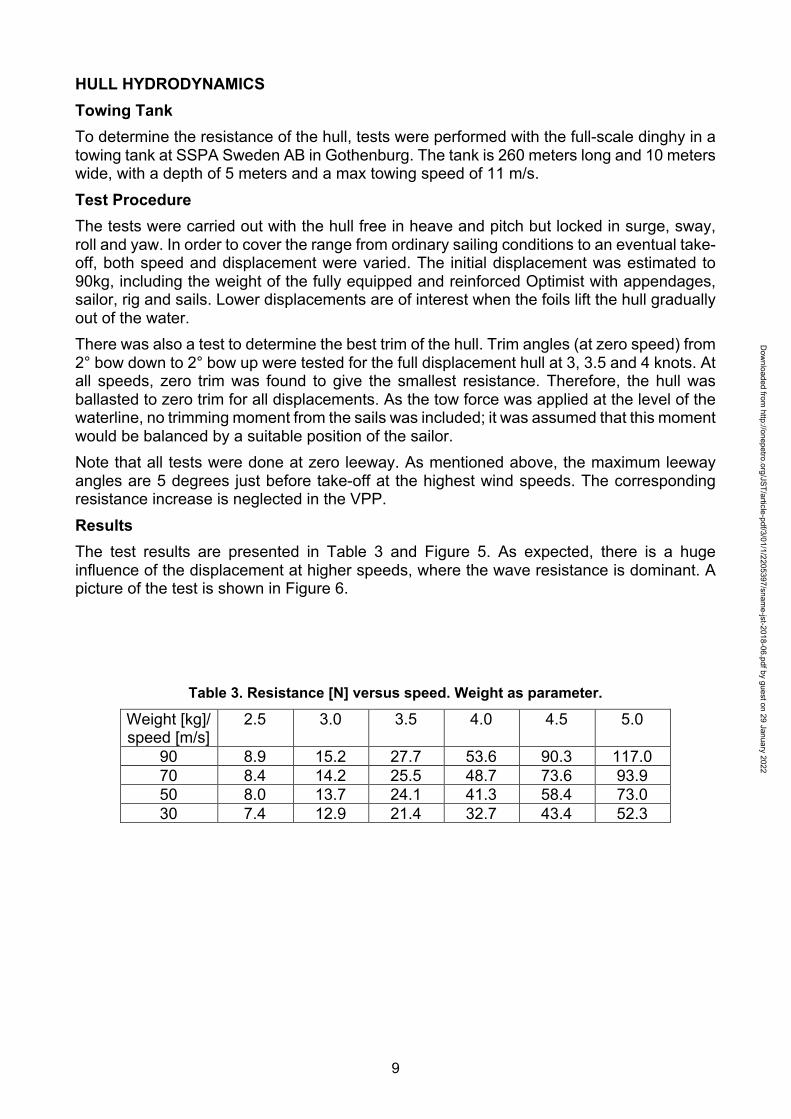
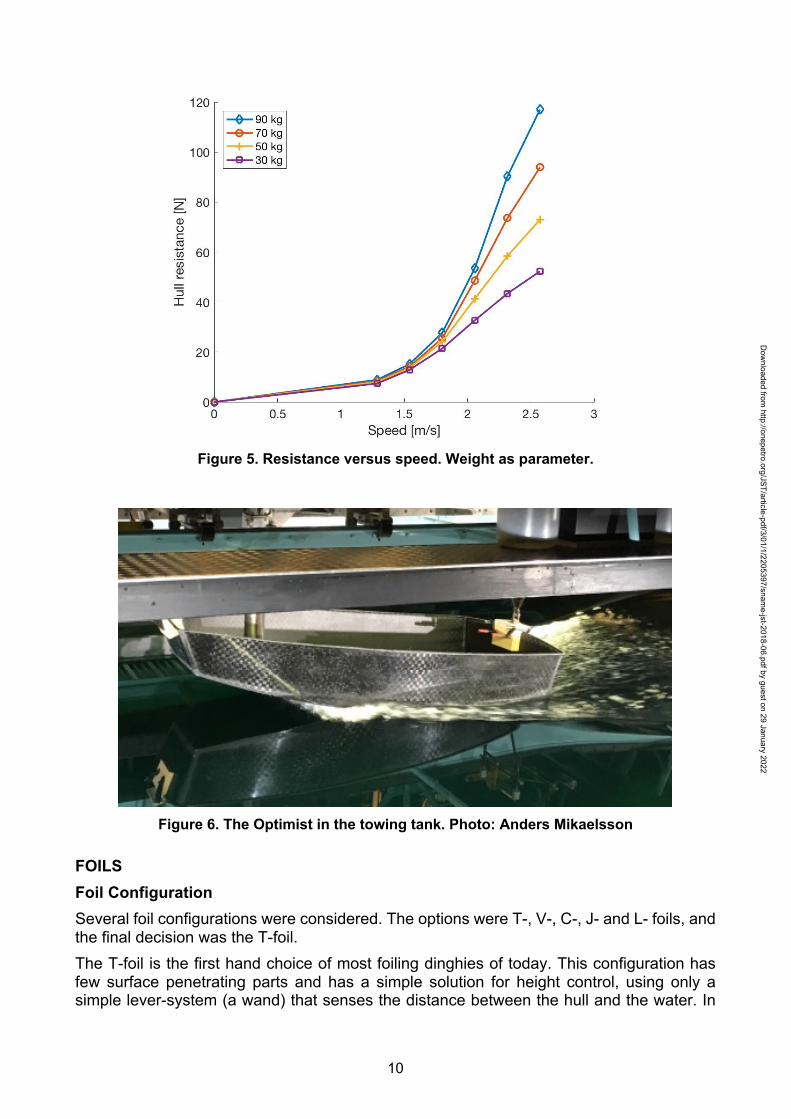
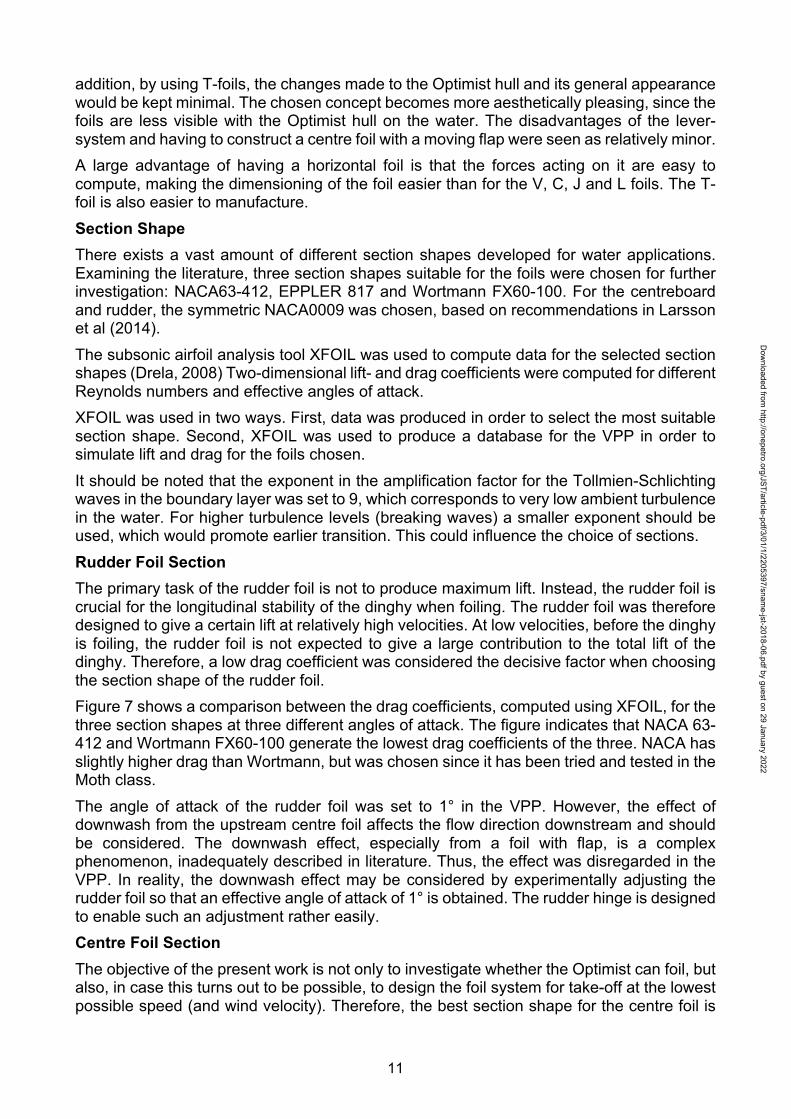
HULL HYDRODYNAMICS Towing Tank To determine the resistance of the hull, tests were performed with the full-scale dinghy in a towing tank at SSPA Sweden AB in Gothenburg. The tank is 260 meters long and 10 meters wide, with a depth of 5 meters and a max towing speed of 11 m/s. Test Procedure The tests were carried out with the hull free in heave and pitch but locked in surge, sway, roll and yaw. In order to cover the range from ordinary sailing conditions to an eventual take-off, both speed and displacement were varied. The initial displacement was estimated to 90kg, including the weight of the fully equipped and reinforced Optimist with appendages, sailor, rig and sails. Lower displacements are of interest when the foils lift the hull gradually out of the water. There was also a test to determine the best trim of the hull. Trim angles (at zero speed) from 2° bow down to 2° bow up were tested for the full displacement hull at 3, 3.5 and 4 knots. At all speeds, zero trim was found to give the smallest resistance. Therefore, the hull was ballasted to zero trim for all displacements. As the tow force was applied at the level of the waterline, no trimming moment from the sails was included; it was assumed that this moment would be balanced by a suitable position of the sailor. Note that all tests were done at zero leeway. As mentioned above, the maximum leeway angles are 5 degrees just before take-off at the highest wind speeds. The corresponding resistance increase is neglected in the VPP. Results The test results are presented in Table 3 and Figure 5. As expected, there is a huge influence of the displacement at higher speeds, where the wave resistance is dominant. A picture of the test is shown in Figure 6.
Table 3. Resistance [N] versus speed. Weight as parameter.
Weight [kg]/ speed [m/s]
2.5
3.0
3.5 4.0 4.5 5.0
90 8.9 15.2 27.7 53.6 90.3 117.0 70 8.4 14.2 25.5 48.7 73.6 93.9 50 8.0 13.7 24.1 41.3 58.4 73.0 30 7.4 12.9 21.4 32.7 43.4 52.3
Dow
nloaded from http://onepetro.org/JST/article-pdf/3/01/1/2205397/snam
e-jst-2018-06.pdf by guest on 29 January 2022
10
Figure 5. Resistance versus speed. Weight as parameter.
Figure 6. The Optimist in the towing tank. Photo: Anders Mikaelsson
FOILS Foil Configuration Several foil configurations were considered. The options were T-, V-, C-, J- and L- foils, and the final decision was the T-foil. The T-foil is the first hand choice of most foiling dinghies of today. This configuration has few surface penetrating parts and has a simple solution for height control, using only a simple lever-system (a wand) that senses the distance between the hull and the water. In
Dow
nloaded from http://onepetro.org/JST/article-pdf/3/01/1/2205397/snam
e-jst-2018-06.pdf by guest on 29 January 2022
11
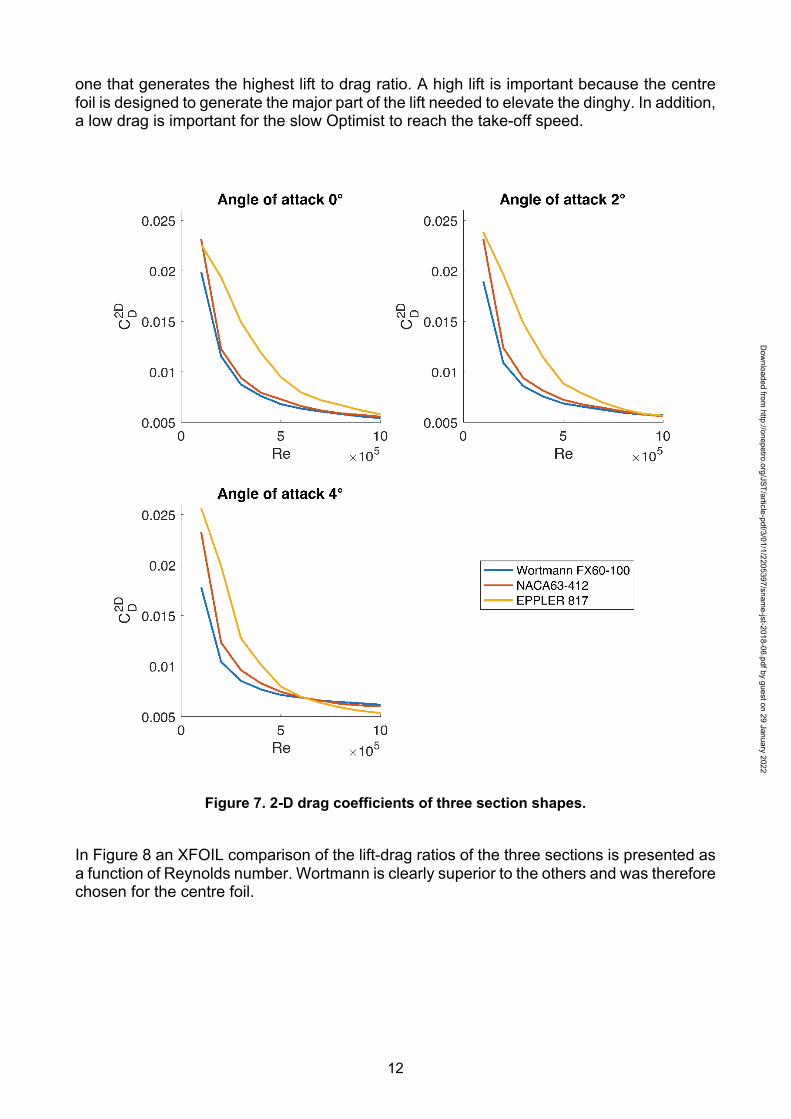
addition, by using T-foils, the changes made to the Optimist hull and its general appearance would be kept minimal. The chosen concept becomes more aesthetically pleasing, since the foils are less visible with the Optimist hull on the water. The disadvantages of the lever-system and having to construct a centre foil with a moving flap were seen as relatively minor. A large advantage of having a horizontal foil is that the forces acting on it are easy to compute, making the dimensioning of the foil easier than for the V, C, J and L foils. The T-foil is also easier to manufacture. Section Shape There exists a vast amount of different section shapes developed for water applications. Examining the literature, three section shapes suitable for the foils were chosen for further investigation: NACA63-412, EPPLER 817 and Wortmann FX60-100. For the centreboard and rudder, the symmetric NACA0009 was chosen, based on recommendations in Larsson et al (2014). The subsonic airfoil analysis tool XFOIL was used to compute data for the selected section shapes (Drela, 2008) Two-dimensional lift- and drag coefficients were computed for different Reynolds numbers and effective angles of attack. XFOIL was used in two ways. First, data was produced in order to select the most suitable section shape. Second, XFOIL was used to produce a database for the VPP in order to simulate lift and drag for the foils chosen. It should be noted that the exponent in the amplification factor for the Tollmien-Schlichting waves in the boundary layer was set to 9, which corresponds to very low ambient turbulence in the water. For higher turbulence levels (breaking waves) a smaller exponent should be used, which would promote earlier transition. This could influence the choice of sections. Rudder Foil Section The primary task of the rudder foil is not to produce maximum lift. Instead, the rudder foil is crucial for the longitudinal stability of the dinghy when foiling. The rudder foil was therefore designed to give a certain lift at relatively high velocities. At low velocities, before the dinghy is foiling, the rudder foil is not expected to give a large contribution to the total lift of the dinghy. Therefore, a low drag coefficient was considered the decisive factor when choosing the section shape of the rudder foil. Figure 7 shows a comparison between the drag coefficients, computed using XFOIL, for the three section shapes at three different angles of attack. The figure indicates that NACA 63-412 and Wortmann FX60-100 generate the lowest drag coefficients of the three. NACA has slightly higher drag than Wortmann, but was chosen since it has been tried and tested in the Moth class. The angle of attack of the rudder foil was set to 1° in the VPP. However, the effect of downwash from the upstream centre foil affects the flow direction downstream and should be considered. The downwash effect, especially from a foil with flap, is a complex phenomenon, inadequately described in literature. Thus, the effect was disregarded in the VPP. In reality, the downwash effect may be considered by experimentally adjusting the rudder foil so that an effective angle of attack of 1° is obtained. The rudder hinge is designed to enable such an adjustment rather easily. Centre Foil Section The objective of the present work is not only to investigate whether the Optimist can foil, but also, in case this turns out to be possible, to design the foil system for take-off at the lowest possible speed (and wind velocity). Therefore, the best section shape for the centre foil is
Dow
nloaded from http://onepetro.org/JST/article-pdf/3/01/1/2205397/snam
e-jst-2018-06.pdf by guest on 29 January 2022
12
one that generates the highest lift to drag ratio. A high lift is important because the centre foil is designed to generate the major part of the lift needed to elevate the dinghy. In addition, a low drag is important for the slow Optimist to reach the take-off speed.
Figure 7. 2-D drag coefficients of three section shapes.
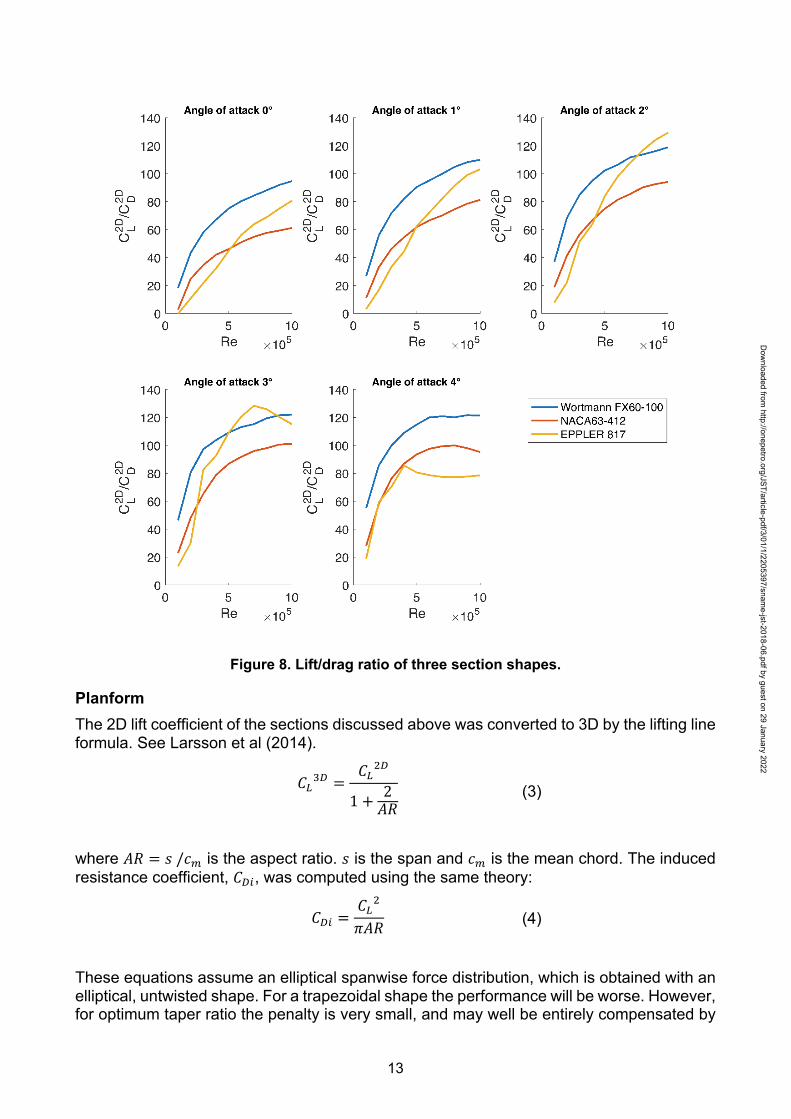
In Figure 8 an XFOIL comparison of the lift-drag ratios of the three sections is presented as a function of Reynolds number. Wortmann is clearly superior to the others and was therefore chosen for the centre foil.
Dow
nloaded from http://onepetro.org/JST/article-pdf/3/01/1/2205397/snam
e-jst-2018-06.pdf by guest on 29 January 2022
13
Figure 8. Lift/drag ratio of three section shapes.
Planform The 2D lift coefficient of the sections discussed above was converted to 3D by the lifting line formula. See Larsson et al (2014).
𝐶,:' =𝐶,8'
1 + 2𝐴𝑅
(3)
where 𝐴𝑅 = 𝑠/𝑐- is the aspect ratio. 𝑠 is the span and 𝑐- is the mean chord. The induced resistance coefficient, 𝐶'@, was computed using the same theory:
𝐶'@ =𝐶,8
𝜋𝐴𝑅 (4)
These equations assume an elliptical spanwise force distribution, which is obtained with an elliptical, untwisted shape. For a trapezoidal shape the performance will be worse. However, for optimum taper ratio the penalty is very small, and may well be entirely compensated by
Dow
nloaded from http://onepetro.org/JST/article-pdf/3/01/1/2205397/snam
e-jst-2018-06.pdf by guest on 29 January 2022
14
local flow effects around the square tip, as explained in Larsson et al (2014). Therefore, equations (3) and (4) are used without modification for the trapezoidal shapes selected. Rudder Foil Planform When deciding on the planform of the rudder foil the objective was to give the sailor the possibility to control the pitch of the dinghy by moving his or her centre of gravity longitudinally. Altering the pitch affects the angle of attack of the rudder foil and consequently the lift generated. Different sailing conditions and velocities were analysed and corresponding moment equilibriums indicated a desired lift from the rudder foil of around 25% of the total lift when foiling. This was achieved with a span of 0.45 m and a mean chord of 0.10 m. To obtain as closely as possible an elliptic lift distribution, a taper ratio of 0.43 was selected (Larsson et al, 2014). This optimum assumes zero sweep angle. In reality, there is a small sweep, but that was neglected in the design. Centre Foil Planform Different planforms of the centre foil were analysed with a maximum wingspan constraint set by the hull beam. A limitation of 1.10 m was set throughout the optimization using the VPP. To determine the optimum angle of attack of the centre foil the influence of the flap angle on the lift to drag ratio was studied for varying angles of attack. The result is seen in Figure 9. The data shown was computed using XFOIL for the Wortmann FX60-100 section shape with a 30% flap. From the figure, it can be seen that Wortmann FX60-100 has the highest ratio of lift to drag for an angle of attack between 5° to 10° for negative flap angles. For positive flap angles the highest ratio is found somewhere between 0° and 5°. When the dinghy is still in non-foiling mode, the flap angle will be in the higher positive range in order to generate maximum lift. Since the aim of the project is to achieve foiling for the lowest wind speed, the positive flap angle range was chosen as the more critical one of the two. A fixed 4° angle of attack was selected because it is in the optimum range for positive flap angles and it provides some room for the sailor to alter the dinghy’s pitch angle without the risk of acquiring a negative angle of attack of the centre foil. Once the angle of attack for the centre foil had been determined, the optimal planform area was analysed using the VPP. For the maximum span of 1.10 m the mean chord was varied from 0.10 m to 0.40 m with 0.10 m increments. The lowest true wind speed resulting in the Optimist dinghy foiling was computed for each configuration. It turned out that for 0.1 and 0.2 m chord the take-off wind speed at the most favourable direction was 6.0 m/s. For the 0.3 and 0.4 m chords, this speed was 6.2 and 6.5 m respectively. A mean chord length of 0.2 m was finally selected and the taper ratio was set to 0.43, like for the rudder foil.
Dow
nloaded from http://onepetro.org/JST/article-pdf/3/01/1/2205397/snam
e-jst-2018-06.pdf by guest on 29 January 2022

15
Figure 9. Centre foil lift to drag ratio vs angle of attack and flap angle.
Centreboard and Rudder Planforms When determining the planform of the rudder and centreboard the span was the decisive factor to which the mean chord had to be adapted. The span is important because it restricts the foiling height of dinghy. Both the rudder and centreboard was given a wingspan of 0.80 m measured from the bottom of the hull to the top of each foil. This span was selected to give the dinghy a foiling height of approximately 0.40 m above the surface. This ride height will give a sufficient operating range for the wand and it will allow smaller waves to pass below the hull. The mean chords of the rudder and centreboard were determined to avoid large drift angles. Different mean chord lengths for both the rudder and centreboard were evaluated using the VPP, and the lengths adopted were 0.15 m for the rudder and a 0.30 m for the centreboard. This yields a maximum drift angle of 5° for a true wind of 10 m/s sailing with a true wind direction of 30°. Since the foils prevent leakage across the tip, both appendages were designed with a rectangular planform. A summary of the different foil dimensions is presented in Table 4. These dimensions were obtained through extensive use of the VPP, as presented above. For all wings, i.e. the foils and the centreboard and rudder, the forces were obtained using XFOIL and aerodynamic
Dow
nloaded from http://onepetro.org/JST/article-pdf/3/01/1/2205397/snam
e-jst-2018-06.pdf by guest on 29 January 2022
16
theory. However, there are some additional resistance components of the wings when used in a hydrofoil configuration. These components, which are described below, may be considered as corrections, and were not included in the VPP used for the wing optimization. However, they are included in the validation tests and in the final polar plot.
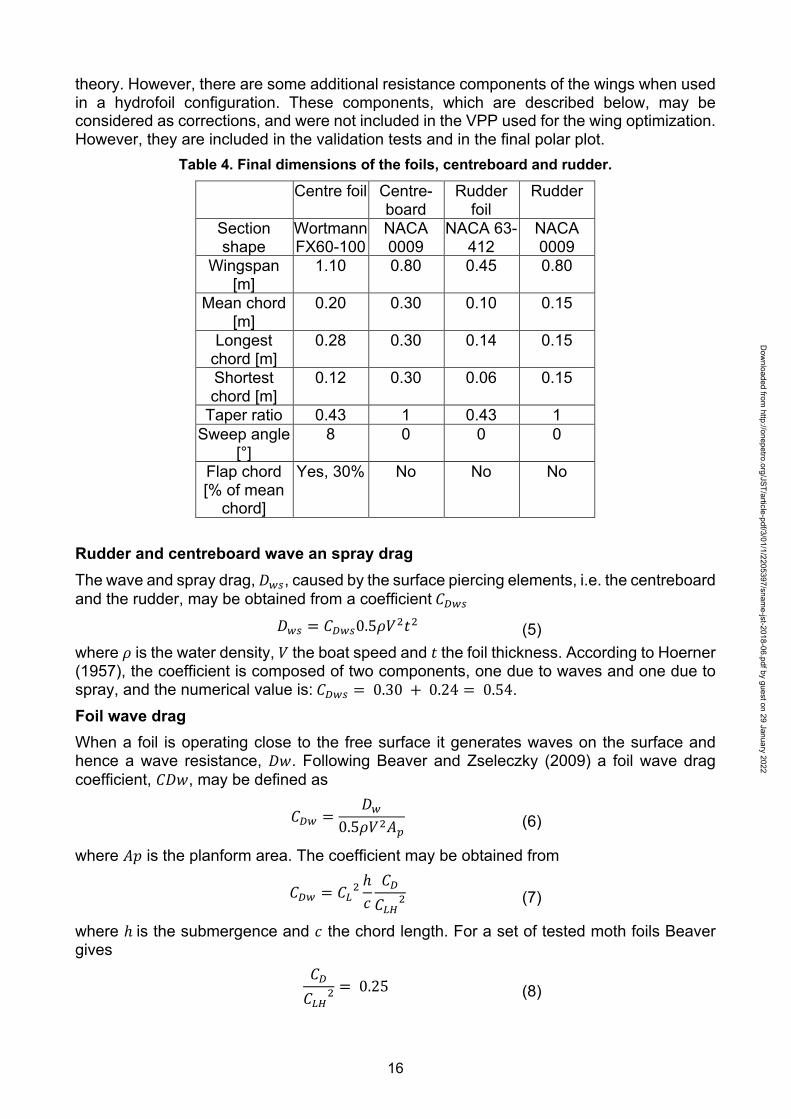
Table 4. Final dimensions of the foils, centreboard and rudder.
Centre foil Centre-board
Rudder foil
Rudder
Section shape
Wortmann FX60-100
NACA 0009
NACA 63-412
NACA 0009
Wingspan [m]
1.10 0.80 0.45 0.80
Mean chord [m]
0.20 0.30 0.10 0.15
Longest chord [m]
0.28 0.30 0.14 0.15
Shortest chord [m]
0.12 0.30 0.06 0.15
Taper ratio 0.43 1 0.43 1 Sweep angle
[°] 8 0 0 0
Flap chord [% of mean
chord]
Yes, 30% No No No
Rudder and centreboard wave an spray drag The wave and spray drag, 𝐷*+, caused by the surface piercing elements, i.e. the centreboard and the rudder, may be obtained from a coefficient𝐶'*+
𝐷*+ = 𝐶'*+0.5𝜌𝑉8𝑡8 (5) where 𝜌 is the water density, 𝑉the boat speed and 𝑡the foil thickness. According to Hoerner (1957), the coefficient is composed of two components, one due to waves and one due to spray, and the numerical value is:𝐶'*+ = 0.30 + 0.24 = 0.54. Foil wave drag When a foil is operating close to the free surface it generates waves on the surface and hence a wave resistance, 𝐷𝑤. Following Beaver and Zseleczky (2009) a foil wave drag coefficient, 𝐶𝐷𝑤, may be defined as
𝐶'* =𝐷*
0.5𝜌𝑉8𝐴# (6)
where 𝐴𝑝 is the planform area. The coefficient may be obtained from
𝐶'* = 𝐶,8ℎ𝑐𝐶'𝐶,G8
(7)
where ℎis the submergence and 𝑐 the chord length. For a set of tested moth foils Beaver gives
𝐶'𝐶,G8
= 0.25 (8)
Dow
nloaded from http://onepetro.org/JST/article-pdf/3/01/1/2205397/snam
e-jst-2018-06.pdf by guest on 29 January 2022

17
Thus, 𝐷* = 𝐶'*0.5𝜌𝑉8 ∙ 𝐴# (9)
Junction Drag When two foils intersect, the shear stresses of the two boundary layers will generate vortices in the corners. These vortices contain energy and give rise to a drag component: the junction drag, 𝐷). According to Hoerner (1957) this can be obtained from a coefficient 𝐶')
𝐶') =𝐷)
0.5𝜌𝑉8𝑡-8 (10)
where 𝑡-is the mean thickness of the two intersecting foils. The coefficient may be computed from
𝐶') = 17 J𝑡-𝑐 K
8− 0.05 (11)
This yields 𝐷) = 𝐶')0.5𝜌𝑉8𝑡-8 (12)
The force applied on the wand by the water is transferred to the foil flap, which adjusts the flap angle such that the hinge moment is balanced by the lifting force on the flap. Since the lift is substantial, a substantial force is required on the wand. The longitudinal component of this force is a drag, which was measured separately in the towing tank with a special device attached to the carriage. It turned out that the drag increased very little between 3 and 7 m/s, since the wand got less submerged at the higher speed. At 3 m/s the measured force was 15 N and at 7 m/s it was 18 N. In the VPP, a linear interpolation between these values was used. The drag of a fully submerged wand was also measured with the wand direction corresponding to its uppermost position close to the hull. At 3 m/s the drag was 6 N. This force was scaled with velocity squared to all non-foiling speeds. Note that the flat triangular surface at the end of the wand is larger than for the Moth. This turned out to be necessary in the validation tests described below. With the original triangle, the wand was pushed through the surface due to the large lifting force on the flap, and the flap angle became too small. In the final design, the triangular surface had an area of approximately 60 cm2.
WINDAGE At high foiling speeds, the windage may be important. To account for this, the approximation by Hazen (1980), used in many VPPs, was adopted. The drag, 𝐷(, is computed in the direction of the apparent wind as follows
𝐷( = 𝐶'(0.5𝜌(𝑉(8𝐴" (14) where 𝜌( is the air density, 𝑉( the apparent wind velocity and 𝐴" the frontal area. 𝐶'( is a drag coefficient set to 1.13 like in Hazen’s method. In the present computations 𝐴" was set equal to the frontal area of the hull (0.34 m2) plus the area of the sailor (0.1 m2). In practise, the windage is added to the sail drag in the aerodynamic computations.
POLAR PLOT A polar plot of the Optimist is presented in Figure 10. In this plot, obtained from the complete VPP, the total weight is slightly increased to 95 kg, which corresponds better to the weight
Dow
nloaded from http://onepetro.org/JST/article-pdf/3/01/1/2205397/snam
e-jst-2018-06.pdf by guest on 29 January 2022
18
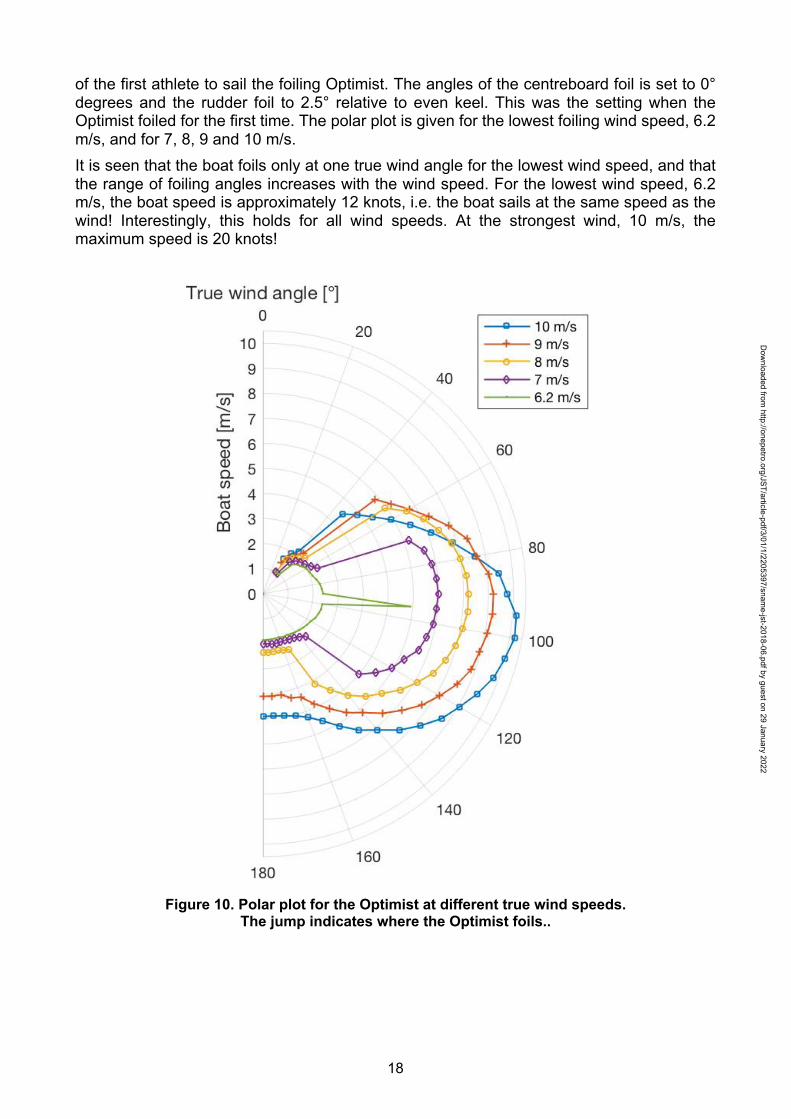
of the first athlete to sail the foiling Optimist. The angles of the centreboard foil is set to 0° degrees and the rudder foil to 2.5° relative to even keel. This was the setting when the Optimist foiled for the first time. The polar plot is given for the lowest foiling wind speed, 6.2 m/s, and for 7, 8, 9 and 10 m/s. It is seen that the boat foils only at one true wind angle for the lowest wind speed, and that the range of foiling angles increases with the wind speed. For the lowest wind speed, 6.2 m/s, the boat speed is approximately 12 knots, i.e. the boat sails at the same speed as the wind! Interestingly, this holds for all wind speeds. At the strongest wind, 10 m/s, the maximum speed is 20 knots!
Figure 10. Polar plot for the Optimist at different true wind speeds.
The jump indicates where the Optimist foils..
Dow
nloaded from http://onepetro.org/JST/article-pdf/3/01/1/2205397/snam
e-jst-2018-06.pdf by guest on 29 January 2022
19
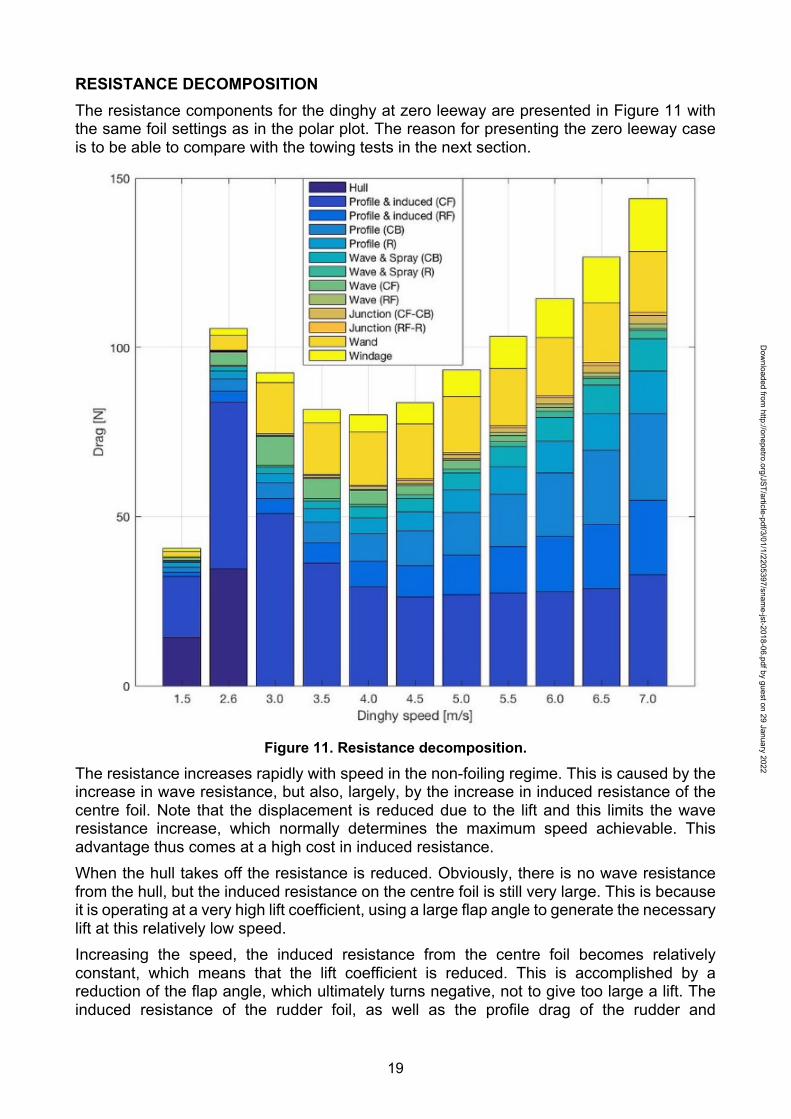
RESISTANCE DECOMPOSITION The resistance components for the dinghy at zero leeway are presented in Figure 11 with the same foil settings as in the polar plot. The reason for presenting the zero leeway case is to be able to compare with the towing tests in the next section.
Figure 11. Resistance decomposition.
The resistance increases rapidly with speed in the non-foiling regime. This is caused by the increase in wave resistance, but also, largely, by the increase in induced resistance of the centre foil. Note that the displacement is reduced due to the lift and this limits the wave resistance increase, which normally determines the maximum speed achievable. This advantage thus comes at a high cost in induced resistance. When the hull takes off the resistance is reduced. Obviously, there is no wave resistance from the hull, but the induced resistance on the centre foil is still very large. This is because it is operating at a very high lift coefficient, using a large flap angle to generate the necessary lift at this relatively low speed. Increasing the speed, the induced resistance from the centre foil becomes relatively constant, which means that the lift coefficient is reduced. This is accomplished by a reduction of the flap angle, which ultimately turns negative, not to give too large a lift. The induced resistance of the rudder foil, as well as the profile drag of the rudder and
Dow
nloaded from http://onepetro.org/JST/article-pdf/3/01/1/2205397/snam
e-jst-2018-06.pdf by guest on 29 January 2022
20
centreboard now grow steadily. So does the wave and spray drag from these elements. The only component that is reduced with speed is the wave drag of the two foils, which is highly dependent of the lift coefficients. The only other resistance component of importance is the wand drag, which is substantial at all foiling speeds.
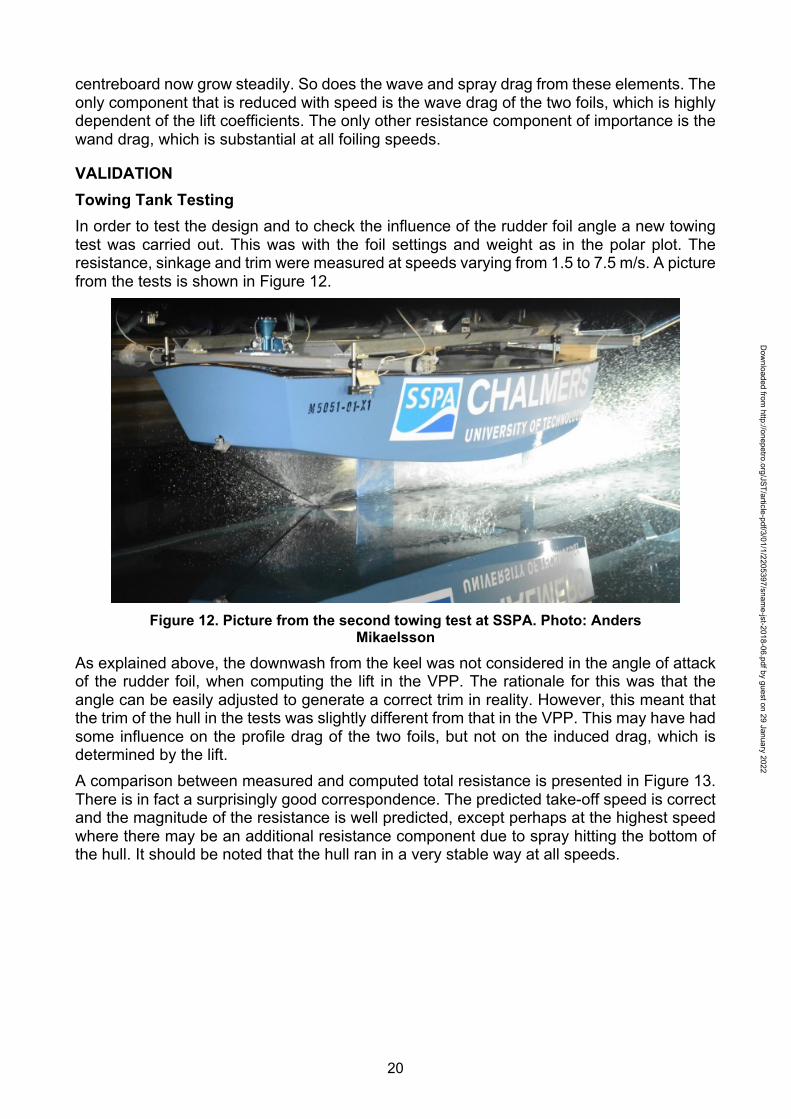
VALIDATION Towing Tank Testing In order to test the design and to check the influence of the rudder foil angle a new towing test was carried out. This was with the foil settings and weight as in the polar plot. The resistance, sinkage and trim were measured at speeds varying from 1.5 to 7.5 m/s. A picture from the tests is shown in Figure 12.
Figure 12. Picture from the second towing test at SSPA. Photo: Anders
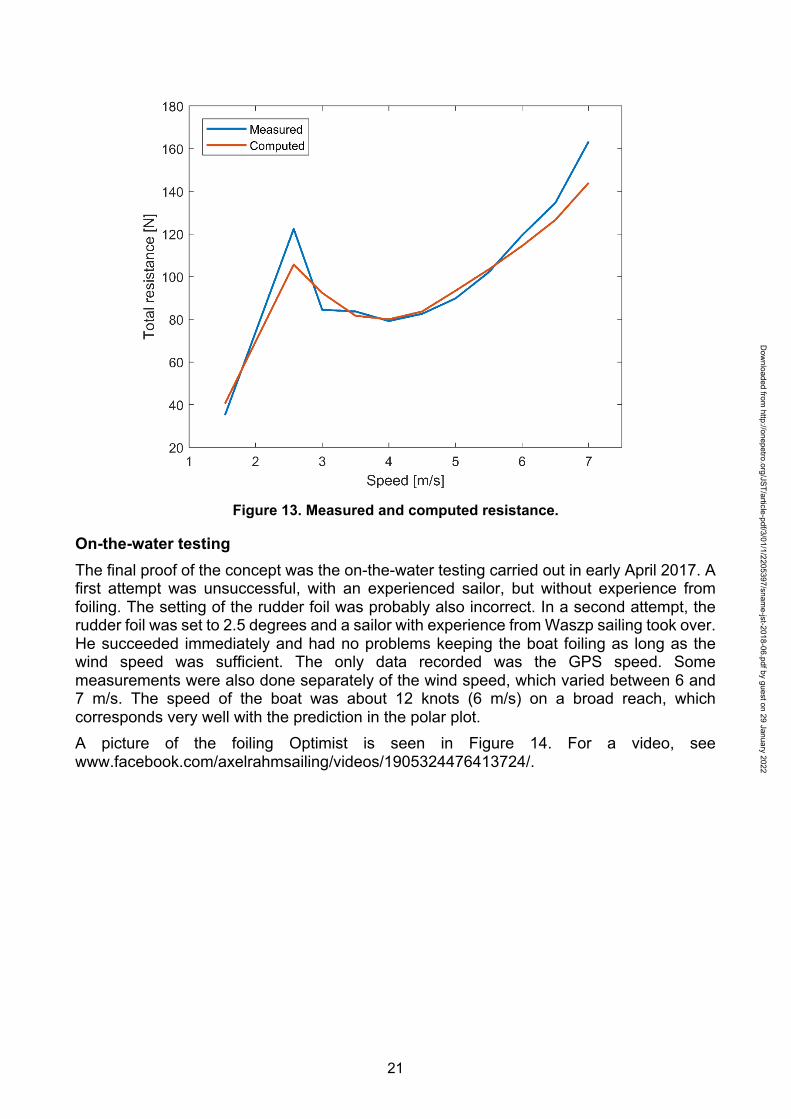
Mikaelsson As explained above, the downwash from the keel was not considered in the angle of attack of the rudder foil, when computing the lift in the VPP. The rationale for this was that the angle can be easily adjusted to generate a correct trim in reality. However, this meant that the trim of the hull in the tests was slightly different from that in the VPP. This may have had some influence on the profile drag of the two foils, but not on the induced drag, which is determined by the lift. A comparison between measured and computed total resistance is presented in Figure 13. There is in fact a surprisingly good correspondence. The predicted take-off speed is correct and the magnitude of the resistance is well predicted, except perhaps at the highest speed where there may be an additional resistance component due to spray hitting the bottom of the hull. It should be noted that the hull ran in a very stable way at all speeds.
Dow
nloaded from http://onepetro.org/JST/article-pdf/3/01/1/2205397/snam
e-jst-2018-06.pdf by guest on 29 January 2022
21
Figure 13. Measured and computed resistance.
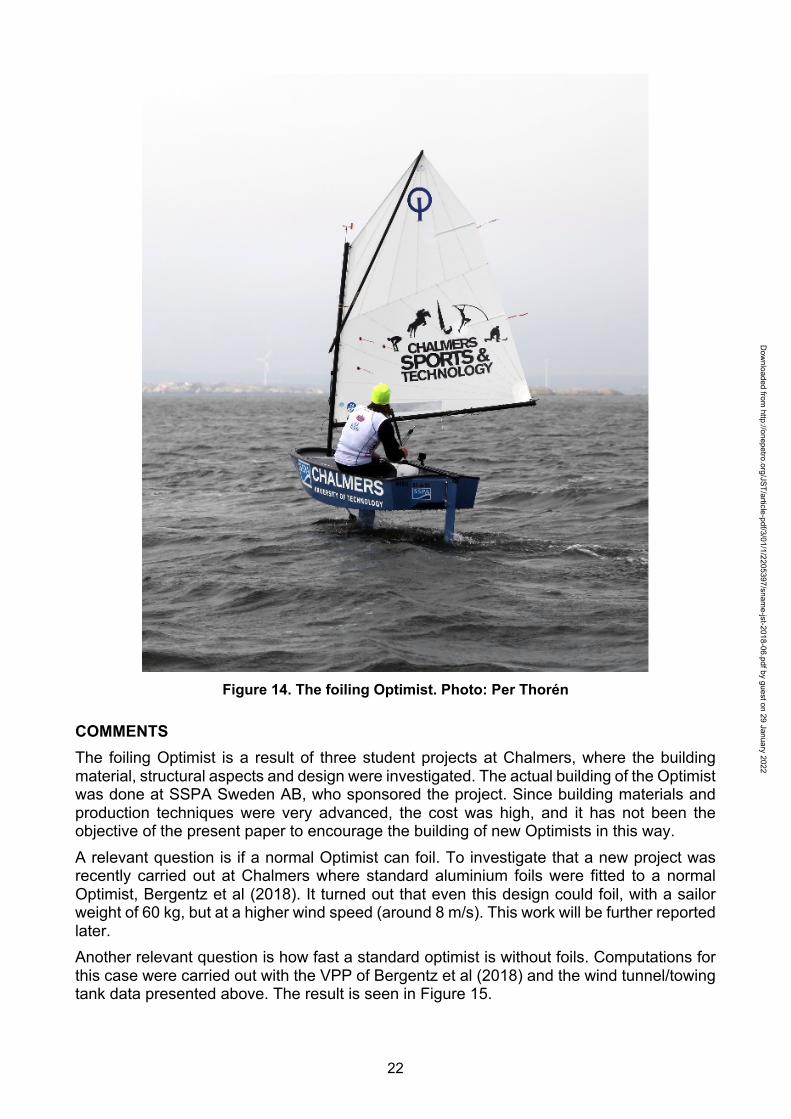
On-the-water testing The final proof of the concept was the on-the-water testing carried out in early April 2017. A first attempt was unsuccessful, with an experienced sailor, but without experience from foiling. The setting of the rudder foil was probably also incorrect. In a second attempt, the rudder foil was set to 2.5 degrees and a sailor with experience from Waszp sailing took over. He succeeded immediately and had no problems keeping the boat foiling as long as the wind speed was sufficient. The only data recorded was the GPS speed. Some measurements were also done separately of the wind speed, which varied between 6 and 7 m/s. The speed of the boat was about 12 knots (6 m/s) on a broad reach, which corresponds very well with the prediction in the polar plot. A picture of the foiling Optimist is seen in Figure 14. For a video, see www.facebook.com/axelrahmsailing/videos/1905324476413724/.
Dow
nloaded from http://onepetro.org/JST/article-pdf/3/01/1/2205397/snam
e-jst-2018-06.pdf by guest on 29 January 2022
22
Figure 14. The foiling Optimist. Photo: Per Thorén
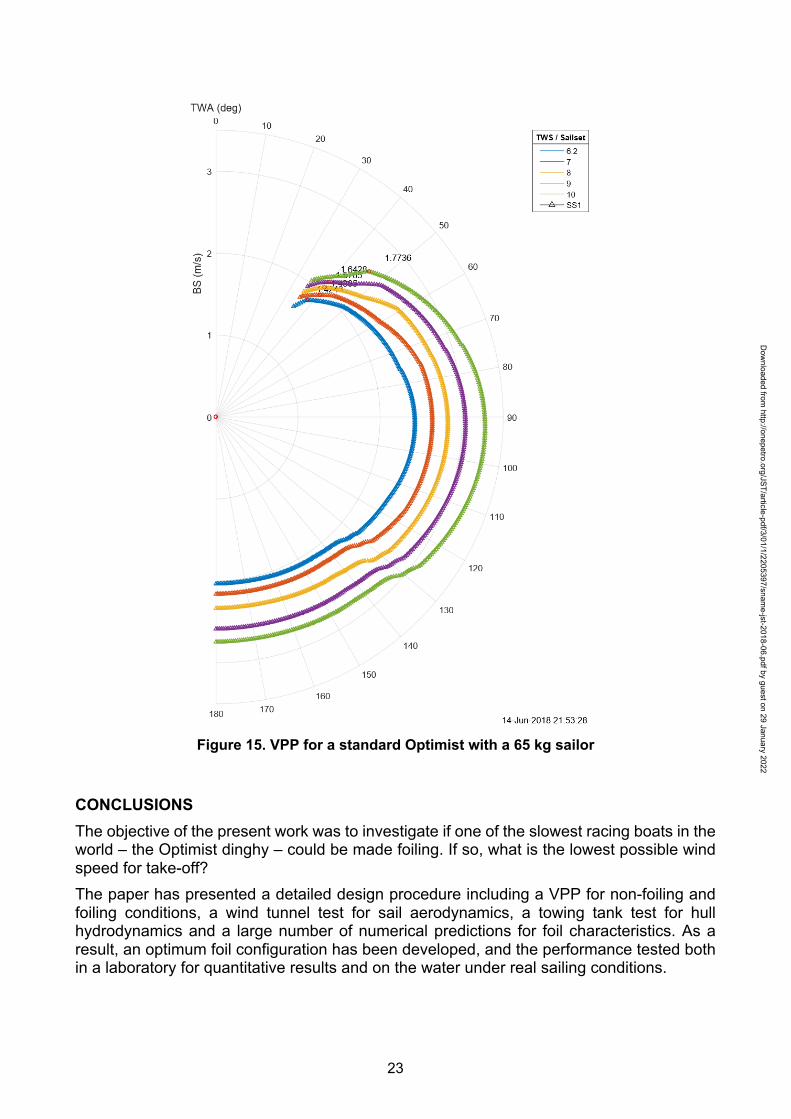
COMMENTS The foiling Optimist is a result of three student projects at Chalmers, where the building material, structural aspects and design were investigated. The actual building of the Optimist was done at SSPA Sweden AB, who sponsored the project. Since building materials and production techniques were very advanced, the cost was high, and it has not been the objective of the present paper to encourage the building of new Optimists in this way. A relevant question is if a normal Optimist can foil. To investigate that a new project was recently carried out at Chalmers where standard aluminium foils were fitted to a normal Optimist, Bergentz et al (2018). It turned out that even this design could foil, with a sailor weight of 60 kg, but at a higher wind speed (around 8 m/s). This work will be further reported later. Another relevant question is how fast a standard optimist is without foils. Computations for this case were carried out with the VPP of Bergentz et al (2018) and the wind tunnel/towing tank data presented above. The result is seen in Figure 15.
Dow
nloaded from http://onepetro.org/JST/article-pdf/3/01/1/2205397/snam
e-jst-2018-06.pdf by guest on 29 January 2022
23
Figure 15. VPP for a standard Optimist with a 65 kg sailor
CONCLUSIONS The objective of the present work was to investigate if one of the slowest racing boats in the world – the Optimist dinghy – could be made foiling. If so, what is the lowest possible wind speed for take-off? The paper has presented a detailed design procedure including a VPP for non-foiling and foiling conditions, a wind tunnel test for sail aerodynamics, a towing tank test for hull hydrodynamics and a large number of numerical predictions for foil characteristics. As a result, an optimum foil configuration has been developed, and the performance tested both in a laboratory for quantitative results and on the water under real sailing conditions.
Dow
nloaded from http://onepetro.org/JST/article-pdf/3/01/1/2205397/snam
e-jst-2018-06.pdf by guest on 29 January 2022
24
The answer to the research questions are: YES, the Optimist can foil very well, and the minimum take off wind speed with the present design is 6.2 m/s and a sailor weight of 65 kg.
ACKNOWLEDGEMENTS The authors are indebted to SSPA Sweden AB for sponsoring the first towing tank campaign, to the Department of Applied Mechanics at Chalmers for making their large wind tunnel available for the sail tests, and to Sörman’s Fund for sponsoring the second round of towing tank tests.
REFERENCES Barlow J. B., Rae W. H., Pope A. (1999). Low-Speed Wind Tunnel Testing, (3rd ed.). John Wiley & Sons, New York, USA. Beaver, B., Zseleczky, J. (2009). Full Scale Measurements on a Hydrofoil International Moth, Chesapeake Sailing Yacht Symposium, Annapolis, USA. Bergentz, A., Brask, O., Olander, G., Falkendal, S., Thörneby, K.,Wester, F. (2018). Building kit for a flying Optimist (in Swedish). BSc project, Chalmers University of Technology, Gothenburg, Sweden Blomstrand, E., Johansson, D., Karlsson, N., Oddy, C., Olofsson, N., Steen, P. (2016). The Flying Chalmers Optimist. Department of Applied Mechanics, Chalmers University of Technology, Gothenburg, Sweden. Boegle, C., Hansen, H. , Hochkirch, H. (2012). Speed vs. Stability - Design considerations and velocity prediction of a hydro-foiled international Moth. 4th High Performance Yacht Design Conference, Auckland, New Zealand. Drela M. (2008). http://web.mit.edu/drela/Public/web/xfoil/ Faltinsen, O. M. (2005). Hydrodynamics of high-speed vehicles. Cambridge University Press, Cambridge, UK. Findlay, M.W.,Turnock, S.R. (2010). Development and use of a Velocity Prediction Program to compare the effects of changes to foil arrangements on a hydro-foiling Moth dinghy. https://eprints.soton.ac.uk/52462/1/Findlay_Turnock_Foil_VPP.p Hazen, G. S. (1980). A model of sail aerodynamics for diverse rig types. New England Sailing Yacht Symposium, New London, USA. Hoerner, S. (1957). Fluid Dynamic Drag. Hoerner Fluid Dynamics, Albuquerque, USA. International Optimist Dinghy Association. (2017). International Optimist class rules. Lindstrand Levin, R., Larsson, L. (2017). Sailing yacht performance prediction based on coupled CFD and rigid body dynamics in 6 degrees of freedom. Ocean Engineering, Vol. 144, pp.362-373 Larsson L., Eliasson R. E., Orych M. (2014). Principles of Yacht Design (4th Ed.). Adlard Coles, London, UK. Oddy, C., Blomstrand, E., Johansson, D., Karlsson, N., Olofsson, N., Steen. P., Fagerström, M., Asp, L.E., McVeagh, J., Brown, M., Finnsgård, C. (2018). Composite design for a foiling Optimist dinghy. 12th Conference of the International Sports Engineering Association (ISEA), Brisbane, Australia
Dow
nloaded from http://onepetro.org/JST/article-pdf/3/01/1/2205397/snam
e-jst-2018-06.pdf by guest on 29 January 2022