
Design, Manufacture and Performance Test of the ... - MDPI
16
inventions Article Design, Manufacture and Performance Test of the Thermoelectric Generator System for Waste Heat Recovery of Engine Exhaust Tzer-Ming Jeng † , Sheng-Chung Tzeng * ,† , Bo-Jun Yang and Yi-Chun Li Received: 26 November 2015; Accepted: 5 January 2016; Published: 11 January 2016 Academic Editor: Chien-Hung Liu Department of Mechanical Engineering, Chienkuo Technology University, Changhua City 500, Taiwan; [email protected] (T.-M.J.); [email protected] (B.-J.Y.); [email protected] (Y.-C.L.) * Correspondence: [email protected]; Tel.: +886-4-711-1111 (ext. 3190); Fax: +886-4-713-5677 † These authors contributed equally to this work. Abstract: This study integrated the techniques of the high-performance heat transfer and thermoelectric conversion to build a thermoelectric generator system installed at the exhaust pipe of a real single-cylinder and four-stroke engine of 35.8 c.c. displacement. This system was made of the heat absorber, thermoelectric generator modules and the external heat sink. The pin-fin array was inserted into the circuitous duct to form the heat absorber, which could increase the heat-exchange surface area and the heat-exchange time to reach the object of absorbing heat and increasing thermoelectric conversion effectively. Keywords: heat recovery; thermoelectric generator system; heat absorber of pin-fin array 1. Introduction Thermoelectric conversion was discovered towards the end of the 19th century. Electrons are capable of carrying heat, as well as electricity. When a temperature difference exists between the two end faces of a thermoelectric material, many electrons will travel from the hot end face to the cold one. This phenomenon is known as the Seebeck effect and forms the basis on which the thermoelectric generation module was developed. As we are all aware, the global energy crisis is becoming worse and much emphasis is being placed on environment protection and the recovery of energy resources. These include waste heat from cooling water, exhaust gas, and steam power plants, amongst others. TEG modules are light and silent, have no moving parts and can convert recycled heat directly into electricity. Champier et al. [1] pointed out that developing countries are currently using massive bio-fuel furnaces to mitigate global warming. The efficiency of these bio-fuel furnaces has been significantly improved in laboratory prototypes which give better combustion efficiency and produce less pollution. TEGs have been installed in them and the electricity generated can be used for lighting or to power circulation fans to improve the fuel-air ratio which, in turn, results in more complete combustion. Experiments were first carried out to verify the thermoelectric conversion ratio of a Bi 2 Te 3 TEG module and then the feasibility of combining the TEG module with a bio-fuel furnace and determination of the optimal position for installation was studied. Finally it was demonstrated that 6 W could be generated by thermoelectric conversion. Karri et al. [2] studied the efficiency of waste heat electricity generation using thermoelectric conversion in two practical cases: a sport utility vehicle (SUV) and a compressed natural gas (CNG)-fueled generator engine. Two different thermoelectric modules (available on the market) were used: (1) bismuth telluride (Bi 2 Te 3 ), and (2) quantum-well (QW) device. Tests of the CNG engine and the SUV under the same conditions and the same generated AC output, showed the Inventions 2016, 1, 2; doi:10.3390/inventions1010002 www.mdpi.com/journal/inventions
-
Upload
khangminh22 -
Category
Documents
-
view
0 -
download
0
Transcript of Design, Manufacture and Performance Test of the ... - MDPI

inventions
Article
Design, Manufacture and Performance Test of theThermoelectric Generator System for Waste HeatRecovery of Engine Exhaust
Tzer-Ming Jeng †, Sheng-Chung Tzeng *,†, Bo-Jun Yang and Yi-Chun Li
Received: 26 November 2015; Accepted: 5 January 2016; Published: 11 January 2016Academic Editor: Chien-Hung Liu
Department of Mechanical Engineering, Chienkuo Technology University, Changhua City 500, Taiwan;[email protected] (T.-M.J.); [email protected] (B.-J.Y.); [email protected] (Y.-C.L.)* Correspondence: [email protected]; Tel.: +886-4-711-1111 (ext. 3190); Fax: +886-4-713-5677† These authors contributed equally to this work.
Abstract: This study integrated the techniques of the high-performance heat transfer andthermoelectric conversion to build a thermoelectric generator system installed at the exhaust pipe of areal single-cylinder and four-stroke engine of 35.8 c.c. displacement. This system was made of the heatabsorber, thermoelectric generator modules and the external heat sink. The pin-fin array was insertedinto the circuitous duct to form the heat absorber, which could increase the heat-exchange surfacearea and the heat-exchange time to reach the object of absorbing heat and increasing thermoelectricconversion effectively.
Keywords: heat recovery; thermoelectric generator system; heat absorber of pin-fin array
1. Introduction
Thermoelectric conversion was discovered towards the end of the 19th century. Electrons arecapable of carrying heat, as well as electricity. When a temperature difference exists between the twoend faces of a thermoelectric material, many electrons will travel from the hot end face to the coldone. This phenomenon is known as the Seebeck effect and forms the basis on which the thermoelectricgeneration module was developed. As we are all aware, the global energy crisis is becoming worseand much emphasis is being placed on environment protection and the recovery of energy resources.These include waste heat from cooling water, exhaust gas, and steam power plants, amongst others.TEG modules are light and silent, have no moving parts and can convert recycled heat directlyinto electricity.
Champier et al. [1] pointed out that developing countries are currently using massive bio-fuelfurnaces to mitigate global warming. The efficiency of these bio-fuel furnaces has been significantlyimproved in laboratory prototypes which give better combustion efficiency and produce less pollution.TEGs have been installed in them and the electricity generated can be used for lighting or to powercirculation fans to improve the fuel-air ratio which, in turn, results in more complete combustion.Experiments were first carried out to verify the thermoelectric conversion ratio of a Bi2Te3 TEG moduleand then the feasibility of combining the TEG module with a bio-fuel furnace and determination of theoptimal position for installation was studied. Finally it was demonstrated that 6 W could be generatedby thermoelectric conversion. Karri et al. [2] studied the efficiency of waste heat electricity generationusing thermoelectric conversion in two practical cases: a sport utility vehicle (SUV) and a compressednatural gas (CNG)-fueled generator engine. Two different thermoelectric modules (available on themarket) were used: (1) bismuth telluride (Bi2Te3), and (2) quantum-well (QW) device. Tests of theCNG engine and the SUV under the same conditions and the same generated AC output, showed the
Inventions 2016, 1, 2; doi:10.3390/inventions1010002 www.mdpi.com/journal/inventions

Inventions 2016, 1, 2 2 of 16
QW device to be more efficient than the Bi2Te3 TEG. In other words, more electricity was generatedfrom the same amount of heat and more fuel was saved. Zhou et al. [3] pointed out that becausewater is a good heat conductor, combining commercial water heaters with thermoelectric modulesin a thermoelectric conversion generator system was a good idea. They employed Carnot efficiencyand the Coupled Physical Energy Balance Method that combines Joule heating, with the Seebeck,Peltier, and Thomson effects to predict the efficiency of a thermoelectric conversion generator system.Thirty different configurations involving a number of parameters were investigated, these included:the water flow model, hot water inlet temperature, pressure drop, cross-sectional area of the duct, ductlength, the number of ducts, and so on. Systematic analysis showed that the upper modules wouldrival the upstream module in heat absorption, resulting in a lower temperature difference between thetwo faces of the thermoelectric module. They also pointed out that reducing coverage by modulesin the downstream of an exhaust duct might result in its wall temperature being higher than thetemperature of the hot-face of the upstream modules, which offers an opportunity to maximize overallpower generation. Wang and Huang [4] investigated the conversion of vehicle engine exhaust heat toelectrical power using thermoelectric generator modules. They employed numerical simulation toanalyze multiple thermoelectric modules attached to heat exchanger surfaces in a series arrangement.They found that using more modules did not necessarily generate more power, and that the averagegeneration ratio of each module actually decreased as the number of modules rose. The reasonfor this was that the temperature of the exhaust duct wall decreased rapidly along the direction offlow and this resulted in poor performance by the downstream TEGs. Jang and Tsai [5] consideredattaching multiple TEG modules on stacked wall faces and found the amount of unit area generationwas strongly affected by the spacing of the modules. Their thermoelectric generator configurationconsisted of thermal plates (a stack wall), heat distribution plates, TEG modules, and water-cooledcooling plates. They used limited element analysis to simulate the overall thermoelectric conversionof the modules with different spacing and also with different thickness of heat distribution plates.The variable operation parameters included the temperature difference between the hot exhaust gasand the cooling water (∆T = 200–800 K) and heat conductance coefficient of the heat distribution plate(h = 20–80 W/m2/K). The aim of the simulation was determination of the optimal spacing betweenmodules and the ideal thickness of heat distribution plates that gave the maximum generation perunit area. It has become clear that as the conversion efficiency of TEG material has increased so hasthe attention being paid to studies and applications involving combinations of TEG modules andwaste heat sources from both domestic and industrial activity. These include heat from vehicle engineexhausts, cooling water circulation systems in vehicle engines, generators using internal combustionengines, waste heat gas stacks, bio-fuel furnaces, ground heat from hot springs, etc. These many heatsources can provide suitable environments for thermoelectric modules that generate power usingdifferential temperatures. With proper cooling, the temperature difference between the cold and hotsides of TEG modules can be raised to achieve ideal power generation.
Many current studies have addressed waste heat recovery from engines using TEG devices andmany have claimed patents. Most studies on thermoelectric generation by the recovery of enginewaste heat emphasize integrated thermo-electric conversion devices and performance simulationsinvolving vehicle systems. A patent filed by Cumming [6] claimed that power can be generated andsaved in batteries using a thermoelectric semi-conductor installed on the outside of an engine exhaustpipe used for driving a hybrid vehicle. A patent filed by Handa and Nagoya [7] involved the adding ofan insulator on both the heated and cooled faces of a TEG module to widen the temperature differencebetween the faces and give better generation efficiency. Shinohara et al. [8] invented an electronicpower supply control system that utilizes a thermoelectric device to generate electric power fromexhaust gas as a secondary system generator. After a summary of applications, Rowe [9] pointed outthat thermoelectric conversion systems using temperatures above 140 ˝C are commercially competitive.Hendricks and Lustbader [10] analyzed systems using waste heat thermoelectric conversion systemson medium and high power vehicles and found that they were capable of generating 5–6 kW power.

Inventions 2016, 1, 2 3 of 16
However, there are three technical impediments to the achievement of a high-performance system:the thermoelectric conversion system itself, optimal integration with the vehicle, and design of thethermoelectric interface. A study team at the Ohio State University accomplished waste heat recoveryusing a thallium-doped lead telluride thermoelectric module [11], which characterizes a thermoelectriceffect. Heating up one end of the material will cause the electrons to move to the colder end, thereforegenerating electrical current. If used on vehicles, waste heat from the vehicle can be converted intoelectricity and fed back to the vehicle for re-use. Jeng et al. [12] investigated the performance of aheat absorber made of packed brass beads in a thermoelectric conversion system. This packed beadheat absorber was installed in a square channel and various flow orientations, both straight and jet,were investigated as well as the ratio of channel width to bead diameter. Their studies showed thelocal and average heat transfer characteristics for several parameters and can be used as a basis for thedesign of a novel porous heat absorber for thermoelectric conversion systems.
This study establishes an initial performance test platform for thermoelectric modules, examinesthe relationships between the external load resistance and the output voltage/current of the TEGand investigates the influence of temperature difference between the hot and cold faces and theiraverage against maximum power generation. Using high-temperature exhaust gas from an actual35.8 c.c. engine as the heat source and a patent applied for by the authors [13] as the blueprint,a complete thermoelectric conversion system (including heat absorber, thermoelectric generationmodule and heat sink) was constructed. The experiments were conducted under controlled laboratoryconditions and careful measurements of the displacement of the engine, operation speed, temperature,and composition of the high temperature exhaust gas were made. The effects of the installation positionof the thermoelectric conversion system and the corresponding external cooling airflow were studiedand the results may be used as important references for the future design of vehicle thermoelectricconversion systems.
2. Experimental Method
2.1. Design of Waste Heat Recovery Thermoelectric Conversion System
A thermoelectric conversion system normally consists of heat absorbers, TEG modules, and heatsinks, where heat absorbers function as heat collectors to heat up the TEG, and the heat sink functionsto dissipate heat from the cold end of the TEG module as rapidly and efficiently as possible to widenthe temperature difference between the hot and cold faces, to enhance performance of the TEG module.The thermoelectric conversion heat recovery device constructed for this study is illustrated in Figure 1.The pin-fin heat absorber is situated inside the duct and the exhaust gases are guided along a circuitouspath from the inlet across them as can be seen in Figure 1. The absorbed heat is conducted to the hotface of the TEG modules which are bolted to the surface of the heat absorbers. The exhaust gasesare forced past the pin-finned heat absorbers and the resulting turbulence enhances heat exchangebetween the hot exhaust gases and the extensive surface of the heat exchangers. The device alsoacts as a silencer and reduces the noise of the engine. The parts are anodized to protect them fromcorrosion and this also improves their aesthetic appearance. The fin pins are all the same length andmake contact with the baffle box in the center of the chamber. This arrangement guides the flow sothat it is impossible for the exhaust gasses to get to the outlet without the development of turbulenceand close contact with the large heat exchange surfaces on all four sides of the chamber, see Figure 1.The bases of the finned heat exchange units are fastened to the body of the device with machine screws.The TEG modules are clamped between the top of the heat exchangers and the cooling heat sinks,also with machine screws. This arrangement effectively stays the hot waste gas and achieves massiveheat exchange. Figure 1 also shows an assembled heat exchange device with one heat exchanger block,TEG and cooling fin assembly removed for clarity. In use, the outer housing has four heat exchangeblocks bolted to it and the ends of the heater exchange pins make contact with the central baffle boxwhich acts to guide the hot gasses on the proper path across all the heat exchange surfaces to the outlet.

Inventions 2016, 1, 2 4 of 16
All the components, the heat absorbers, heat sinks, aluminum housing, and central baffle, are made ofaluminum alloy and have been anodized.Inventions 2016, 1, 2 4 of 16
(a) (b)
Figure 1. The thermoelectric conversion device used herein. (a) Cross-sectional view; (b) Photo of prototype.
2.2. Generation Performance Test of a Single-Chip TEG Module
The experimental setup for generation performance test of a single chip TEG module was shown in Figure 2. The setup includes (1) an air supply system, (2) a TEG module, (3) a test section (heating and cooling devices, and (4) the data acquisition equipment. The air supply for cooling the cold side of the TEG module was provided by an air compressor. The compressed air was stored in an 800 L tank to ensure a steady and pulse-free supply. The air flow was passed through a dryer and filter to remove water and impurities and an electronic controller (SIN-DP) was used to regulate the air flow which was guided to the cooling device of the test section. Air flow rates of 350–450 L/min were used for cooling the heat sink of cooling device, and then the temperature differences between the hot and cold faces of the TEG module were controlled to be 80, 100 and 120 °C.
Figure 2. Experimental setup for the single-chip thermoelectric module experiment.
As shown in Figure 3, the TEG used in this experiment was manufactured by Russian Kryotherm (Model: TGM-287-1.0-1.5; dimensions: 40 mm × 40 mm × 3.8 mm). Figure 4 shows the present test section. In this experiment, the hot side of the TEG module was fastened to the heater using thermal grease. The heater was made of Bakelite (85 mm × 85 mm × 65 mm) with a stainless steel heating element (40 mm × 40 mm) and was powered by a DC power supply. The cold side of the TEG module was fastened by thermal grease to an aluminum alloy heat sink with an array of round pin fins (see Figure 5). The heat sink, with an acrylic duct and cool air source, formed the cooling device used for the cold side of the TEG module.
Figure 1. The thermoelectric conversion device used herein. (a) Cross-sectional view; (b) Photoof prototype.
2.2. Generation Performance Test of a Single-Chip TEG Module
The experimental setup for generation performance test of a single chip TEG module was shownin Figure 2. The setup includes (1) an air supply system; (2) a TEG module; (3) a test section (heatingand cooling devices); and (4) the data acquisition equipment. The air supply for cooling the cold sideof the TEG module was provided by an air compressor. The compressed air was stored in an 800 Ltank to ensure a steady and pulse-free supply. The air flow was passed through a dryer and filter toremove water and impurities and an electronic controller (SIN-DP) was used to regulate the air flowwhich was guided to the cooling device of the test section. Air flow rates of 350–450 L/min were usedfor cooling the heat sink of cooling device, and then the temperature differences between the hot andcold faces of the TEG module were controlled to be 80, 100 and 120 ˝C.
Inventions 2016, 1, 2 4 of 16
(a) (b)
Figure 1. The thermoelectric conversion device used herein. (a) Cross-sectional view; (b) Photo of prototype.
2.2. Generation Performance Test of a Single-Chip TEG Module
The experimental setup for generation performance test of a single chip TEG module was shown in Figure 2. The setup includes (1) an air supply system, (2) a TEG module, (3) a test section (heating and cooling devices, and (4) the data acquisition equipment. The air supply for cooling the cold side of the TEG module was provided by an air compressor. The compressed air was stored in an 800 L tank to ensure a steady and pulse-free supply. The air flow was passed through a dryer and filter to remove water and impurities and an electronic controller (SIN-DP) was used to regulate the air flow which was guided to the cooling device of the test section. Air flow rates of 350–450 L/min were used for cooling the heat sink of cooling device, and then the temperature differences between the hot and cold faces of the TEG module were controlled to be 80, 100 and 120 °C.
Figure 2. Experimental setup for the single-chip thermoelectric module experiment.
As shown in Figure 3, the TEG used in this experiment was manufactured by Russian Kryotherm (Model: TGM-287-1.0-1.5; dimensions: 40 mm × 40 mm × 3.8 mm). Figure 4 shows the present test section. In this experiment, the hot side of the TEG module was fastened to the heater using thermal grease. The heater was made of Bakelite (85 mm × 85 mm × 65 mm) with a stainless steel heating element (40 mm × 40 mm) and was powered by a DC power supply. The cold side of the TEG module was fastened by thermal grease to an aluminum alloy heat sink with an array of round pin fins (see Figure 5). The heat sink, with an acrylic duct and cool air source, formed the cooling device used for the cold side of the TEG module.
Figure 2. Experimental setup for the single-chip thermoelectric module experiment.
As shown in Figure 3, the TEG used in this experiment was manufactured by Russian Kryotherm(Model: TGM-287-1.0-1.5; dimensions: 40 mm ˆ 40 mm ˆ 3.8 mm). Figure 4 shows the presenttest section. In this experiment, the hot side of the TEG module was fastened to the heater usingthermal grease. The heater was made of Bakelite (85 mm ˆ 85 mm ˆ 65 mm) with a stainless steelheating element (40 mm ˆ 40 mm) and was powered by a DC power supply. The cold side of the TEGmodule was fastened by thermal grease to an aluminum alloy heat sink with an array of round pin

Inventions 2016, 1, 2 5 of 16
fins (see Figure 5). The heat sink, with an acrylic duct and cool air source, formed the cooling deviceused for the cold side of the TEG module.Inventions 2016, 1, 2 5 of 16
Figure 3. Photo of TEG module. (Russian Kryotherm: TGM-287-1.0-1.5).
Figure 4. Exploded view of test section.
Figure 5. Configuration and dimensions of heat sink for cooling device. (Unit: mm).
Figure 3. Photo of TEG module. (Russian Kryotherm: TGM-287-1.0-1.5).
Inventions 2016, 1, 2 5 of 16
Figure 3. Photo of TEG module. (Russian Kryotherm: TGM-287-1.0-1.5).
Figure 4. Exploded view of test section.
Figure 5. Configuration and dimensions of heat sink for cooling device. (Unit: mm).
Figure 4. Exploded view of test section.
Inventions 2016, 1, 2 5 of 16
Figure 3. Photo of TEG module. (Russian Kryotherm: TGM-287-1.0-1.5).
Figure 4. Exploded view of test section.
Figure 5. Configuration and dimensions of heat sink for cooling device. (Unit: mm). Figure 5. Configuration and dimensions of heat sink for cooling device. (Unit: mm).
Inventions 2016, 1, 2 6 of 16
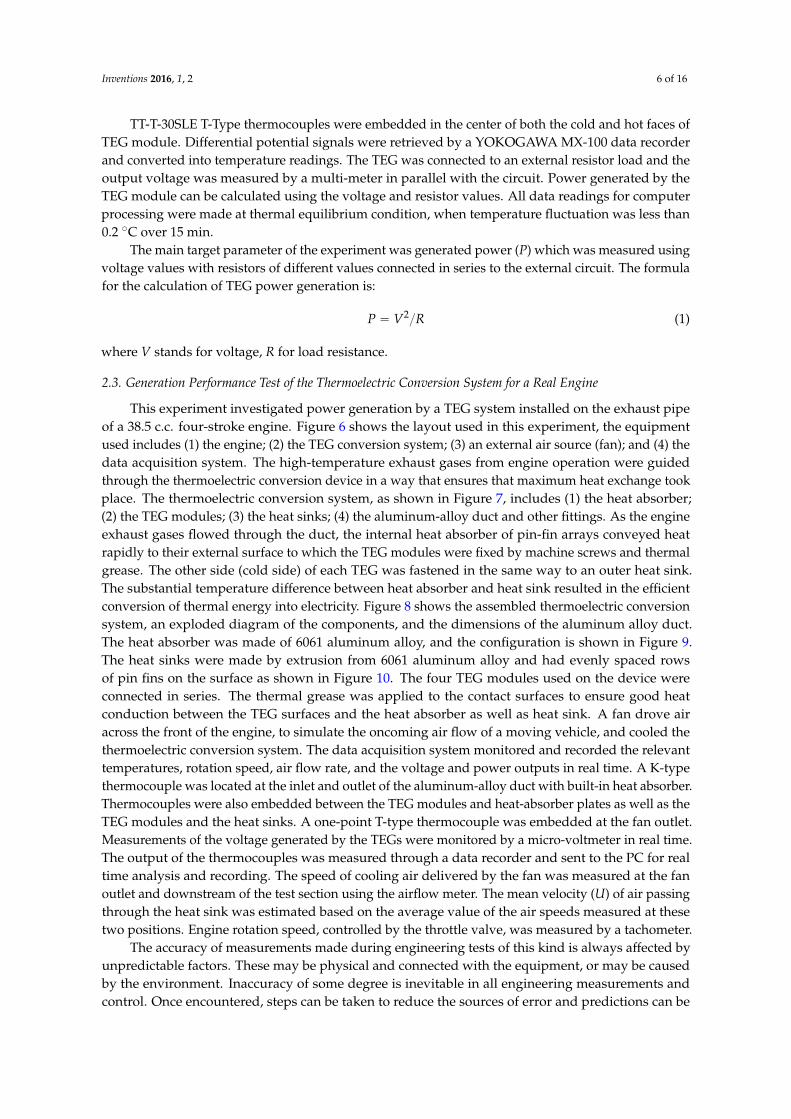
TT-T-30SLE T-Type thermocouples were embedded in the center of both the cold and hot faces ofTEG module. Differential potential signals were retrieved by a YOKOGAWA MX-100 data recorderand converted into temperature readings. The TEG was connected to an external resistor load and theoutput voltage was measured by a multi-meter in parallel with the circuit. Power generated by theTEG module can be calculated using the voltage and resistor values. All data readings for computerprocessing were made at thermal equilibrium condition, when temperature fluctuation was less than0.2 ˝C over 15 min.
The main target parameter of the experiment was generated power (P) which was measured usingvoltage values with resistors of different values connected in series to the external circuit. The formulafor the calculation of TEG power generation is:
P “ V2R (1)
where V stands for voltage, R for load resistance.
2.3. Generation Performance Test of the Thermoelectric Conversion System for a Real Engine
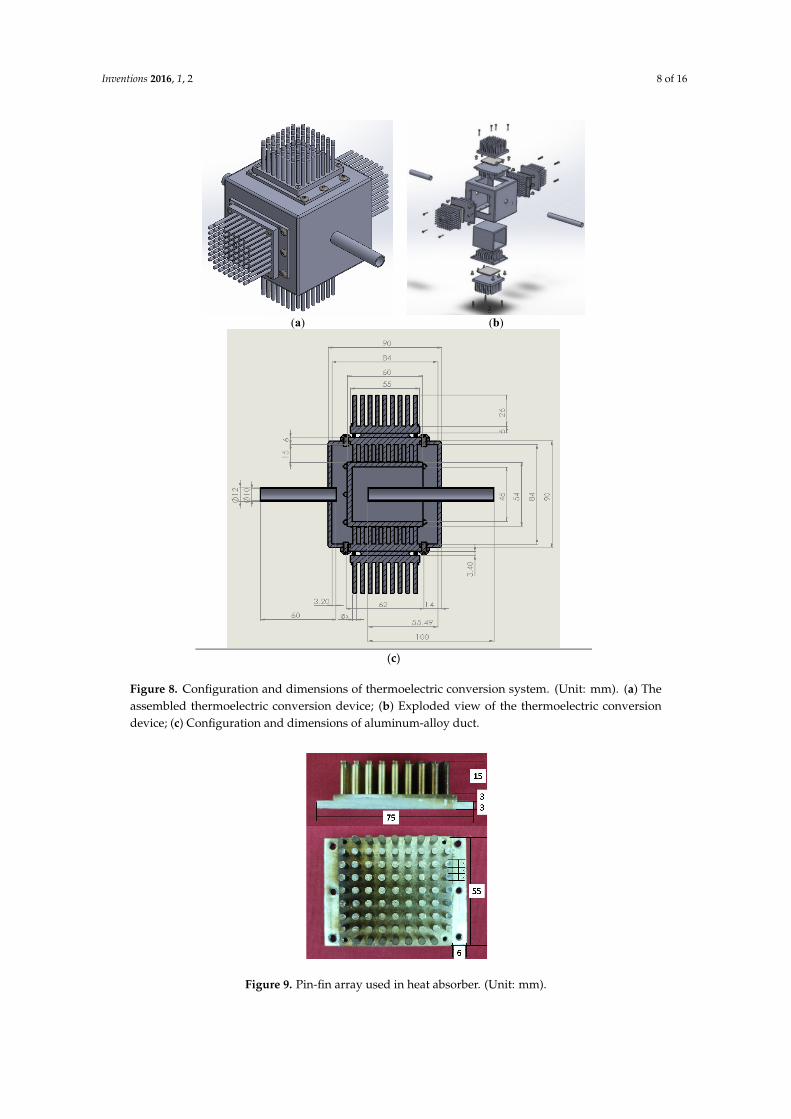
This experiment investigated power generation by a TEG system installed on the exhaust pipeof a 38.5 c.c. four-stroke engine. Figure 6 shows the layout used in this experiment, the equipmentused includes (1) the engine; (2) the TEG conversion system; (3) an external air source (fan); and (4) thedata acquisition system. The high-temperature exhaust gases from engine operation were guidedthrough the thermoelectric conversion device in a way that ensures that maximum heat exchange tookplace. The thermoelectric conversion system, as shown in Figure 7, includes (1) the heat absorber;(2) the TEG modules; (3) the heat sinks; (4) the aluminum-alloy duct and other fittings. As the engineexhaust gases flowed through the duct, the internal heat absorber of pin-fin arrays conveyed heatrapidly to their external surface to which the TEG modules were fixed by machine screws and thermalgrease. The other side (cold side) of each TEG was fastened in the same way to an outer heat sink.The substantial temperature difference between heat absorber and heat sink resulted in the efficientconversion of thermal energy into electricity. Figure 8 shows the assembled thermoelectric conversionsystem, an exploded diagram of the components, and the dimensions of the aluminum alloy duct.The heat absorber was made of 6061 aluminum alloy, and the configuration is shown in Figure 9.The heat sinks were made by extrusion from 6061 aluminum alloy and had evenly spaced rowsof pin fins on the surface as shown in Figure 10. The four TEG modules used on the device wereconnected in series. The thermal grease was applied to the contact surfaces to ensure good heatconduction between the TEG surfaces and the heat absorber as well as heat sink. A fan drove airacross the front of the engine, to simulate the oncoming air flow of a moving vehicle, and cooled thethermoelectric conversion system. The data acquisition system monitored and recorded the relevanttemperatures, rotation speed, air flow rate, and the voltage and power outputs in real time. A K-typethermocouple was located at the inlet and outlet of the aluminum-alloy duct with built-in heat absorber.Thermocouples were also embedded between the TEG modules and heat-absorber plates as well as theTEG modules and the heat sinks. A one-point T-type thermocouple was embedded at the fan outlet.Measurements of the voltage generated by the TEGs were monitored by a micro-voltmeter in real time.The output of the thermocouples was measured through a data recorder and sent to the PC for realtime analysis and recording. The speed of cooling air delivered by the fan was measured at the fanoutlet and downstream of the test section using the airflow meter. The mean velocity (U) of air passingthrough the heat sink was estimated based on the average value of the air speeds measured at thesetwo positions. Engine rotation speed, controlled by the throttle valve, was measured by a tachometer.
The accuracy of measurements made during engineering tests of this kind is always affected byunpredictable factors. These may be physical and connected with the equipment, or may be causedby the environment. Inaccuracy of some degree is inevitable in all engineering measurements andcontrol. Once encountered, steps can be taken to reduce the sources of error and predictions can be

Inventions 2016, 1, 2 7 of 16
made of the likelihood of future occurrence. Measures can be taken to reduce and control inaccuracyof measurements during test procedures to eliminate the source, or at least reduce the degree of error.The effects of inaccuracy in measurement should be estimated in advance, before the collection of data,and modifications can be made to the experimental conditions to reduce or eliminate the problem.The likely errors to be found in test results include both measurement and calculation parameters.The uncertainty of measurement parameter can be attributed to the instrument system itself and/orhuman error, and the uncertainty of calculation parameters results from both parameters. We usedMoffat’s [14] uncertainty analysis to assess our experiment and the uncertainty of power generation(P) was determined to be ˘2.1%.
Inventions 2016, 1, 2 7 of 16
error. The effects of inaccuracy in measurement should be estimated in advance, before the collection of data, and modifications can be made to the experimental conditions to reduce or eliminate the problem. The likely errors to be found in test results include both measurement and calculation parameters. The uncertainty of measurement parameter can be attributed to the instrument system itself and/or human error, and the uncertainty of calculation parameters results from both parameters. We used Moffat’s [14] uncertainty analysis to assess our experiment and the uncertainty of power generation (P) was determined to be ±2.1%.
(a)
(b)
Figure 6. The experimental setup of thermoelectric conversion system installed at a real engine. (a) Layout of the experimental equipment; and (b) The 4-stroke engine and the waste heat recovery device.
Figure 7. Diagram of the thermoelectric conversion system.
Figure 6. The experimental setup of thermoelectric conversion system installed at a real engine.(a) Layout of the experimental equipment; and (b) The 4-stroke engine and the waste heatrecovery device.
Inventions 2016, 1, 2 7 of 16
error. The effects of inaccuracy in measurement should be estimated in advance, before the collection of data, and modifications can be made to the experimental conditions to reduce or eliminate the problem. The likely errors to be found in test results include both measurement and calculation parameters. The uncertainty of measurement parameter can be attributed to the instrument system itself and/or human error, and the uncertainty of calculation parameters results from both parameters. We used Moffat’s [14] uncertainty analysis to assess our experiment and the uncertainty of power generation (P) was determined to be ±2.1%.
(a)
(b)
Figure 6. The experimental setup of thermoelectric conversion system installed at a real engine. (a) Layout of the experimental equipment; and (b) The 4-stroke engine and the waste heat recovery device.
Figure 7. Diagram of the thermoelectric conversion system. Figure 7. Diagram of the thermoelectric conversion system.
Inventions 2016, 1, 2 8 of 16
Inventions 2016, 1, 2 8 of 16
(a) (b)
(c)
Figure 8. Configuration and dimensions of thermoelectric conversion system. (Unit: mm). (a) The assembled thermoelectric conversion device; (b) Exploded view of the thermoelectric conversion device; (c) Configuration and dimensions of aluminum-alloy duct.
Figure 9. Pin-fin array used in heat absorber. (Unit: mm).
Figure 8. Configuration and dimensions of thermoelectric conversion system. (Unit: mm). (a) Theassembled thermoelectric conversion device; (b) Exploded view of the thermoelectric conversiondevice; (c) Configuration and dimensions of aluminum-alloy duct.
Inventions 2016, 1, 2 8 of 16
(a) (b)
(c)
Figure 8. Configuration and dimensions of thermoelectric conversion system. (Unit: mm). (a) The assembled thermoelectric conversion device; (b) Exploded view of the thermoelectric conversion device; (c) Configuration and dimensions of aluminum-alloy duct.
Figure 9. Pin-fin array used in heat absorber. (Unit: mm). Figure 9. Pin-fin array used in heat absorber. (Unit: mm).
Inventions 2016, 1, 2 9 of 16Inventions 2016, 1, 2 9 of 16
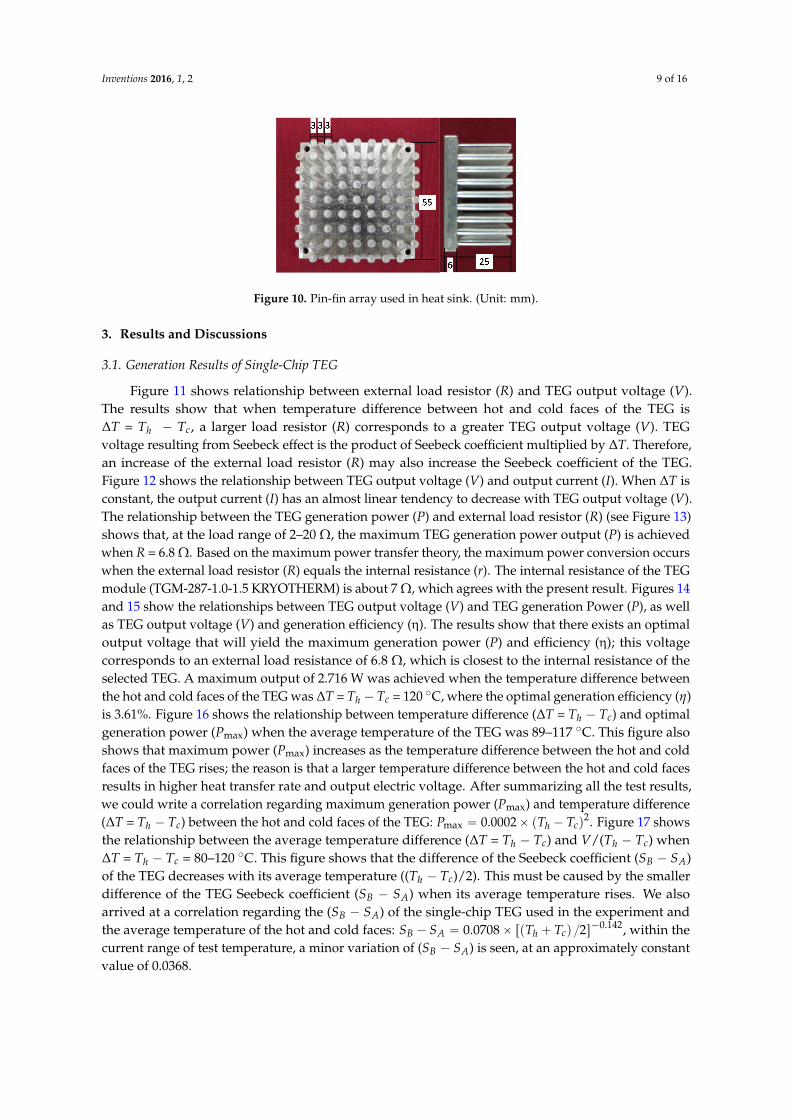
Figure 10. Pin-fin array used in heat sink. (Unit: mm).
3. Results and Discussions
3.1. Generation Results of Single-Chip TEG
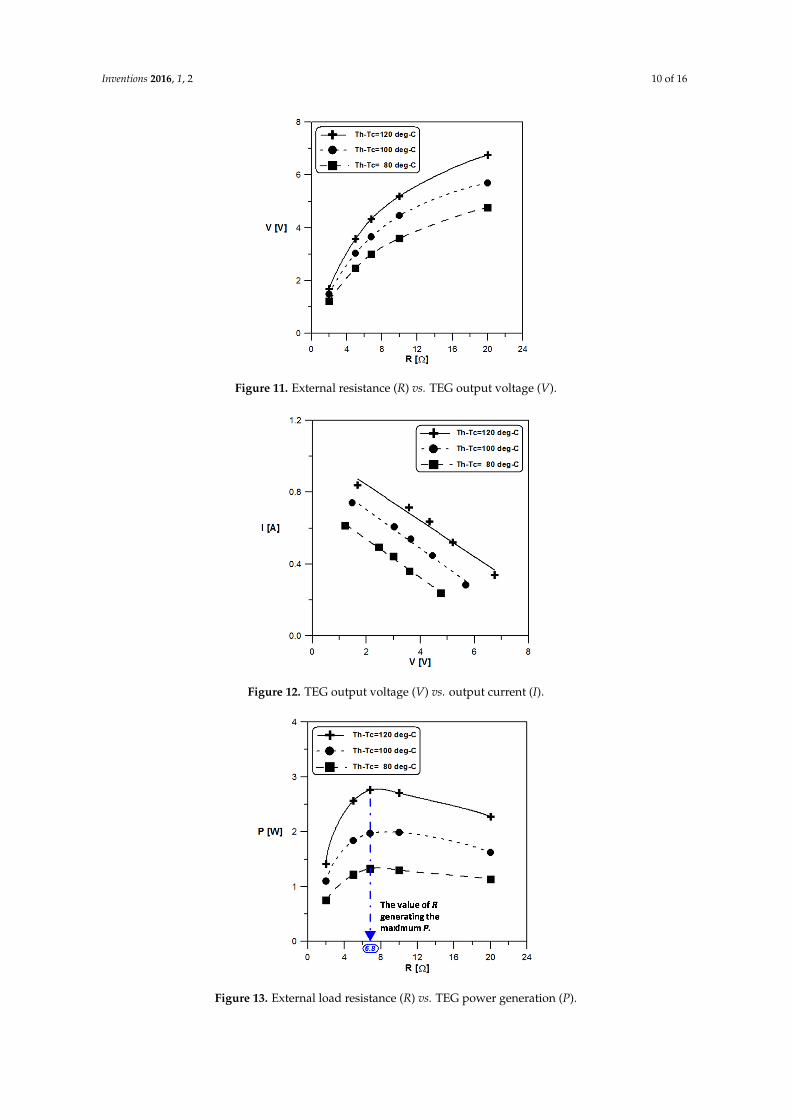
Figure 11 shows relationship between external load resistor (R) and TEG output voltage (V). The results show that when temperature difference between hot and cold faces of the TEG is ΔT = Th − Tc, a larger load resistor (R) corresponds to a greater TEG output voltage (V). TEG voltage resulting from Seebeck effect is the product of Seebeck coefficient multiplied by ΔT. Therefore, an increase of the external load resistor (R) may also increase the Seebeck coefficient of the TEG. Figure 12 shows the relationship between TEG output voltage (V) and output current (I). When ΔT is constant, the output current (I) has an almost linear tendency to decrease with TEG output voltage (V). The relationship between the TEG generation power (P) and external load resistor (R) (see Figure 13) shows that, at the load range of 2–20 Ω, the maximum TEG generation power output (P) is achieved when R = 6.8 Ω. Based on the maximum power transfer theory, the maximum power conversion occurs when the external load resistor (R) equals the internal resistance (r). The internal resistance of the TEG module (TGM-287-1.0-1.5 KRYOTHERM) is about 7 Ω, which agrees with the present result. Figures 14 and 15 show the relationships between TEG output voltage (V) and TEG generation Power (P), as well as TEG output voltage (V) and generation efficiency (η). The results show that there exists an optimal output voltage that will yield the maximum generation power (P) and efficiency (η); this voltage corresponds to an external load resistance of 6.8 Ω, which is closest to the internal resistance of the selected TEG. A maximum output of 2.716 W was achieved when the temperature difference between the hot and cold faces of the TEG was ΔT = Th − Tc = 120 °C, where the optimal generation efficiency (η) is 3.61%. Figure 16 shows the relationship between temperature difference (ΔT = Th − Tc) and optimal generation power (Pmax) when the average temperature of the TEG was 89–117 °C. This figure also shows that maximum power (Pmax) increases as the temperature difference between the hot and cold faces of the TEG rises; the reason is that a larger temperature difference between the hot and cold faces results in higher heat transfer rate and output electric voltage. After summarizing all the test results, we could write a correlation regarding maximum generation power (Pmax) and temperature difference (ΔT = Th − Tc) between the hot and cold faces of the TEG: ( ) 2
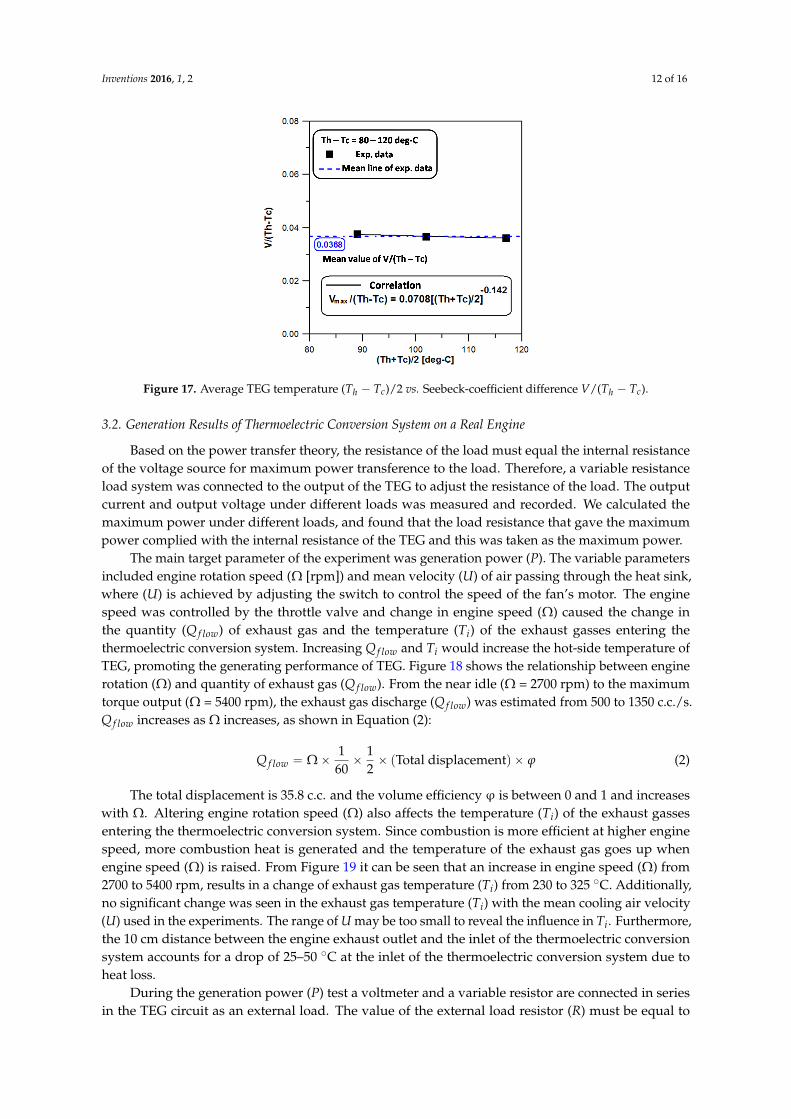
max 00020 ch TT.P −×= . Figure 17 shows the relationship between the average temperature difference (ΔT = Th − Tc) and V/(Th − Tc) when ΔT = Th − Tc = 80–120 °C. This figure shows that the difference of the Seebeck coefficient (SB − SA) of the TEG decreases with its average temperature ((Th − Tc)/2). This must be caused by the smaller difference of the TEG Seebeck coefficient (SB − SA) when its average temperature rises. We also arrived at a correlation regarding the (SB − SA) of the single-chip TEG used in the experiment and the average temperature of the hot and cold faces: ( ) 0.1420.0708 2B A h cS S T T / −− = × + , within the current range of test temperature, a
minor variation of (SB − SA) is seen, at an approximately constant value of 0.0368.
Figure 10. Pin-fin array used in heat sink. (Unit: mm).
3. Results and Discussions
3.1. Generation Results of Single-Chip TEG
Figure 11 shows relationship between external load resistor (R) and TEG output voltage (V).The results show that when temperature difference between hot and cold faces of the TEG is∆T = Th ´ Tc, a larger load resistor (R) corresponds to a greater TEG output voltage (V). TEGvoltage resulting from Seebeck effect is the product of Seebeck coefficient multiplied by ∆T. Therefore,an increase of the external load resistor (R) may also increase the Seebeck coefficient of the TEG.Figure 12 shows the relationship between TEG output voltage (V) and output current (I). When ∆T isconstant, the output current (I) has an almost linear tendency to decrease with TEG output voltage (V).The relationship between the TEG generation power (P) and external load resistor (R) (see Figure 13)shows that, at the load range of 2–20 Ω, the maximum TEG generation power output (P) is achievedwhen R = 6.8 Ω. Based on the maximum power transfer theory, the maximum power conversion occurswhen the external load resistor (R) equals the internal resistance (r). The internal resistance of the TEGmodule (TGM-287-1.0-1.5 KRYOTHERM) is about 7 Ω, which agrees with the present result. Figures 14and 15 show the relationships between TEG output voltage (V) and TEG generation Power (P), as wellas TEG output voltage (V) and generation efficiency (η). The results show that there exists an optimaloutput voltage that will yield the maximum generation power (P) and efficiency (η); this voltagecorresponds to an external load resistance of 6.8 Ω, which is closest to the internal resistance of theselected TEG. A maximum output of 2.716 W was achieved when the temperature difference betweenthe hot and cold faces of the TEG was ∆T = Th ´ Tc = 120 ˝C, where the optimal generation efficiency (η)is 3.61%. Figure 16 shows the relationship between temperature difference (∆T = Th ´ Tc) and optimalgeneration power (Pmax) when the average temperature of the TEG was 89–117 ˝C. This figure alsoshows that maximum power (Pmax) increases as the temperature difference between the hot and coldfaces of the TEG rises; the reason is that a larger temperature difference between the hot and cold facesresults in higher heat transfer rate and output electric voltage. After summarizing all the test results,we could write a correlation regarding maximum generation power (Pmax) and temperature difference(∆T = Th ´ Tc) between the hot and cold faces of the TEG: Pmax “ 0.0002ˆ pTh ´ Tcq
2. Figure 17 showsthe relationship between the average temperature difference (∆T = Th ´ Tc) and V/(Th ´ Tc) when∆T = Th ´ Tc = 80–120 ˝C. This figure shows that the difference of the Seebeck coefficient (SB ´ SA)of the TEG decreases with its average temperature ((Th ´ Tc)/2). This must be caused by the smallerdifference of the TEG Seebeck coefficient (SB ´ SA) when its average temperature rises. We alsoarrived at a correlation regarding the (SB ´ SA) of the single-chip TEG used in the experiment andthe average temperature of the hot and cold faces: SB ´ SA “ 0.0708ˆ rpTh ` Tcq 2s´0.142, within thecurrent range of test temperature, a minor variation of (SB ´ SA) is seen, at an approximately constantvalue of 0.0368.
Inventions 2016, 1, 2 10 of 16
Inventions 2016, 1, 2 10 of 16
Figure 11. External resistance (R) vs. TEG output voltage (V).
Figure 12. TEG output voltage (V) vs output current (I).
Figure 13. External load resistance (R) vs. TEG power generation (P).
Figure 11. External resistance (R) vs. TEG output voltage (V).
Inventions 2016, 1, 2 10 of 16
Figure 11. External resistance (R) vs. TEG output voltage (V).
Figure 12. TEG output voltage (V) vs output current (I).
Figure 13. External load resistance (R) vs. TEG power generation (P).
Figure 12. TEG output voltage (V) vs. output current (I).
Inventions 2016, 1, 2 10 of 16
Figure 11. External resistance (R) vs. TEG output voltage (V).
Figure 12. TEG output voltage (V) vs output current (I).
Figure 13. External load resistance (R) vs. TEG power generation (P). Figure 13. External load resistance (R) vs. TEG power generation (P).

Inventions 2016, 1, 2 11 of 16Inventions 2016, 1, 2 11 of 16
Figure 14. TEG output voltage (V) vs. generation power (P).
Figure 15. TEG output voltage (V) vs. generation efficiency (η).
Figure 16. Temperature difference between TEG hot/cold faces (Th − Tc) vs. maximum generation power (Pmax).
Figure 14. TEG output voltage (V) vs. generation power (P).
Inventions 2016, 1, 2 11 of 16
Figure 14. TEG output voltage (V) vs. generation power (P).
Figure 15. TEG output voltage (V) vs. generation efficiency (η).
Figure 16. Temperature difference between TEG hot/cold faces (Th − Tc) vs. maximum generation power (Pmax).
Figure 15. TEG output voltage (V) vs. generation efficiency (η).
Inventions 2016, 1, 2 11 of 16
Figure 14. TEG output voltage (V) vs. generation power (P).
Figure 15. TEG output voltage (V) vs. generation efficiency (η).
Figure 16. Temperature difference between TEG hot/cold faces (Th − Tc) vs. maximum generation power (Pmax). Figure 16. Temperature difference between TEG hot/cold faces (Th ´ Tc) vs. maximum generationpower (Pmax).
Inventions 2016, 1, 2 12 of 16Inventions 2016, 1, 2 12 of 16
Figure 17. Average TEG temperature (Th − Tc)/2 vs. Seebeck-coefficient difference V/(Th − Tc).
3.2. Generation Results of Thermoelectric Conversion System on a Real Engine
Based on the power transfer theory, the resistance of the load must equal the internal resistance of the voltage source for maximum power transference to the load. Therefore, a variable resistance load system was connected to the output of the TEG to adjust the resistance of the load. The output current and output voltage under different loads was measured and recorded. We calculated the maximum power under different loads, and found that the load resistance that gave the maximum power complied with the internal resistance of the TEG and this was taken as the maximum power.
The main target parameter of the experiment was generation power (P). The variable parameters included engine rotation speed (Ω [rpm]) and mean velocity (U) of air passing through the heat sink, where (U) is achieved by adjusting the switch to control the speed of the fan’s motor. The engine speed was controlled by the throttle valve and change in engine speed (Ω) caused the change in the quantity (Qflow) of exhaust gas and the temperature (Ti) of the exhaust gasses entering the thermoelectric conversion system. Increasing Qflow and Ti would increase the hot-side temperature of TEG, promoting the generating performance of TEG. Figure 18 shows the relationship between engine rotation (Ω) and quantity of exhaust gas (Qflow). From the near idle (Ω = 2700 rpm) to the maximum torque output (Ω = 5400 rpm), the exhaust gas discharge (Qflow) was estimated from 500 to 1350 c.c./s. Qflow increases as Ω increases, as shown in Equation (2):
1 1(Total displacement)
60 2flowQ ϕ= Ω× × × × (2)
The total displacement is 35.8 c.c. and the volume efficiency φ is between 0 and 1 and increases with Ω. Altering engine rotation speed (Ω) also affects the temperature (Ti) of the exhaust gasses entering the thermoelectric conversion system. Since combustion is more efficient at higher engine speed, more combustion heat is generated and the temperature of the exhaust gas goes up when engine speed (Ω) is raised. From Figure 19 it can be seen that an increase in engine speed (Ω) from 2700 to 5400 rpm, results in a change of exhaust gas temperature (Ti) from 230 to 325 °C. Additionally, no significant change was seen in the exhaust gas temperature (Ti) with the mean cooling air velocity (U) used in the experiments. The range of U may be too small to reveal the influence in Ti. Furthermore, the 10 cm distance between the engine exhaust outlet and the inlet of the thermoelectric conversion system accounts for a drop of 25–50 °C at the inlet of the thermoelectric conversion system due to heat loss.
During the generation power (P) test a voltmeter and a variable resistor are connected in series in the TEG circuit as an external load. The value of the external load resistor (R) must be equal to the internal resistance of the TEG to give the maximum output power. The equation for calculating generation power (P) is the same as Equation (1) in Section 2.2.
Figure 17. Average TEG temperature (Th ´ Tc)/2 vs. Seebeck-coefficient difference V/(Th ´ Tc).
3.2. Generation Results of Thermoelectric Conversion System on a Real Engine
Based on the power transfer theory, the resistance of the load must equal the internal resistanceof the voltage source for maximum power transference to the load. Therefore, a variable resistanceload system was connected to the output of the TEG to adjust the resistance of the load. The outputcurrent and output voltage under different loads was measured and recorded. We calculated themaximum power under different loads, and found that the load resistance that gave the maximumpower complied with the internal resistance of the TEG and this was taken as the maximum power.
The main target parameter of the experiment was generation power (P). The variable parametersincluded engine rotation speed (Ω [rpm]) and mean velocity (U) of air passing through the heat sink,where (U) is achieved by adjusting the switch to control the speed of the fan’s motor. The enginespeed was controlled by the throttle valve and change in engine speed (Ω) caused the change inthe quantity (Q f low) of exhaust gas and the temperature (Ti) of the exhaust gasses entering thethermoelectric conversion system. Increasing Q f low and Ti would increase the hot-side temperature ofTEG, promoting the generating performance of TEG. Figure 18 shows the relationship between enginerotation (Ω) and quantity of exhaust gas (Q f low). From the near idle (Ω = 2700 rpm) to the maximumtorque output (Ω = 5400 rpm), the exhaust gas discharge (Q f low) was estimated from 500 to 1350 c.c./s.Q f low increases as Ω increases, as shown in Equation (2):
Q f low “ Ωˆ1
60ˆ
12ˆ pTotal displacementq ˆ ϕ (2)
The total displacement is 35.8 c.c. and the volume efficiency ϕ is between 0 and 1 and increaseswith Ω. Altering engine rotation speed (Ω) also affects the temperature (Ti) of the exhaust gassesentering the thermoelectric conversion system. Since combustion is more efficient at higher enginespeed, more combustion heat is generated and the temperature of the exhaust gas goes up whenengine speed (Ω) is raised. From Figure 19 it can be seen that an increase in engine speed (Ω) from2700 to 5400 rpm, results in a change of exhaust gas temperature (Ti) from 230 to 325 ˝C. Additionally,no significant change was seen in the exhaust gas temperature (Ti) with the mean cooling air velocity(U) used in the experiments. The range of U may be too small to reveal the influence in Ti. Furthermore,the 10 cm distance between the engine exhaust outlet and the inlet of the thermoelectric conversionsystem accounts for a drop of 25–50 ˝C at the inlet of the thermoelectric conversion system due toheat loss.
During the generation power (P) test a voltmeter and a variable resistor are connected in seriesin the TEG circuit as an external load. The value of the external load resistor (R) must be equal to

Inventions 2016, 1, 2 13 of 16
the internal resistance of the TEG to give the maximum output power. The equation for calculatinggeneration power (P) is the same as Equation (1) in Section 2.2.Inventions 2016, 1, 2 13 of 16
Figure 18. Engine rotation speed (Ω) vs. exhaust gas discharge (Qflow).
Figure 19. Mean air velocity vs. exhaust temperature.
In this study we used an actual engine to investigate waste heat recovery and the test results are from a specially designed thermoelectric conversion system installed on the exhaust. The variables discussed include the mean velocity (U) of air driven by an external fan, the temperature difference (ΔT) between hot/cold faces of the TEGs, the engine rotation speed (Ω) and the quantity (Qflow) of exhaust Gas. Figure 20 shows the relationship between the mean air velocity (U) and the mean temperature of the TEGs and it can be seen that the mean temperature of the TEGs goes up with an increase in engine rotation speed (Ω). However, no significant change was seen in the mean temperature of the TEGs with the mean air velocity (U) used in the experiments. This means that the mean air velocity (U) may have been set too low and cooling was insufficient. Furthermore, since the operation temperature of the TEG cannot exceed 200 °C, the engine rotation speed (Ω) in the current study could not cause overheating of the TEGs. Further studies with higher engine rotation speed (Ω) can be conducted in the future. Figure 21 shows the relationship between the mean air velocity (U) and the temperature difference (ΔT) of TEGs. Within the current range of the mean velocity (U) of air driven by an external fan, the trend was towards a significant connection between ΔT of TEGs and engine rotation speed (Ω). When engine rotation speed (Ω) was increased from 2700 to 5400 rpm, ΔT of TEGs increased from 20 to 58 °C.
0 2000 4000 6000 8000 10000
0
500
1000
1500
2000
2500
3000
Qflo
w [c
.c./s
]
Ω [rpm]
Figure 18. Engine rotation speed (Ω) vs. exhaust gas discharge (Q f low).
Inventions 2016, 1, 2 13 of 16
Figure 18. Engine rotation speed (Ω) vs. exhaust gas discharge (Qflow).
Figure 19. Mean air velocity vs. exhaust temperature.
In this study we used an actual engine to investigate waste heat recovery and the test results are from a specially designed thermoelectric conversion system installed on the exhaust. The variables discussed include the mean velocity (U) of air driven by an external fan, the temperature difference (ΔT) between hot/cold faces of the TEGs, the engine rotation speed (Ω) and the quantity (Qflow) of exhaust Gas. Figure 20 shows the relationship between the mean air velocity (U) and the mean temperature of the TEGs and it can be seen that the mean temperature of the TEGs goes up with an increase in engine rotation speed (Ω). However, no significant change was seen in the mean temperature of the TEGs with the mean air velocity (U) used in the experiments. This means that the mean air velocity (U) may have been set too low and cooling was insufficient. Furthermore, since the operation temperature of the TEG cannot exceed 200 °C, the engine rotation speed (Ω) in the current study could not cause overheating of the TEGs. Further studies with higher engine rotation speed (Ω) can be conducted in the future. Figure 21 shows the relationship between the mean air velocity (U) and the temperature difference (ΔT) of TEGs. Within the current range of the mean velocity (U) of air driven by an external fan, the trend was towards a significant connection between ΔT of TEGs and engine rotation speed (Ω). When engine rotation speed (Ω) was increased from 2700 to 5400 rpm, ΔT of TEGs increased from 20 to 58 °C.
0 2000 4000 6000 8000 10000
0
500
1000
1500
2000
2500
3000
Qflo
w [c
.c./s
]
Ω [rpm]
Figure 19. Mean air velocity vs. exhaust temperature.
In this study we used an actual engine to investigate waste heat recovery and the test results arefrom a specially designed thermoelectric conversion system installed on the exhaust. The variablesdiscussed include the mean velocity (U) of air driven by an external fan, the temperature difference (∆T)between hot/cold faces of the TEGs, the engine rotation speed (Ω) and the quantity (Q f low) of exhaustGas. Figure 20 shows the relationship between the mean air velocity (U) and the mean temperatureof the TEGs and it can be seen that the mean temperature of the TEGs goes up with an increase inengine rotation speed (Ω). However, no significant change was seen in the mean temperature of theTEGs with the mean air velocity (U) used in the experiments. This means that the mean air velocity (U)may have been set too low and cooling was insufficient. Furthermore, since the operation temperatureof the TEG cannot exceed 200 ˝C, the engine rotation speed (Ω) in the current study could not causeoverheating of the TEGs. Further studies with higher engine rotation speed (Ω) can be conducted inthe future. Figure 21 shows the relationship between the mean air velocity (U) and the temperaturedifference (∆T) of TEGs. Within the current range of the mean velocity (U) of air driven by an external

Inventions 2016, 1, 2 14 of 16
fan, the trend was towards a significant connection between ∆T of TEGs and engine rotation speed(Ω). When engine rotation speed (Ω) was increased from 2700 to 5400 rpm, ∆T of TEGs increased from20 to 58 ˝C.Inventions 2016, 1, 2 14 of 16
Figure 20. Mean air velocity vs. mean TEG temperature.
Figure 21. Mean air velocity (U) vs. ΔT of the TEGs.
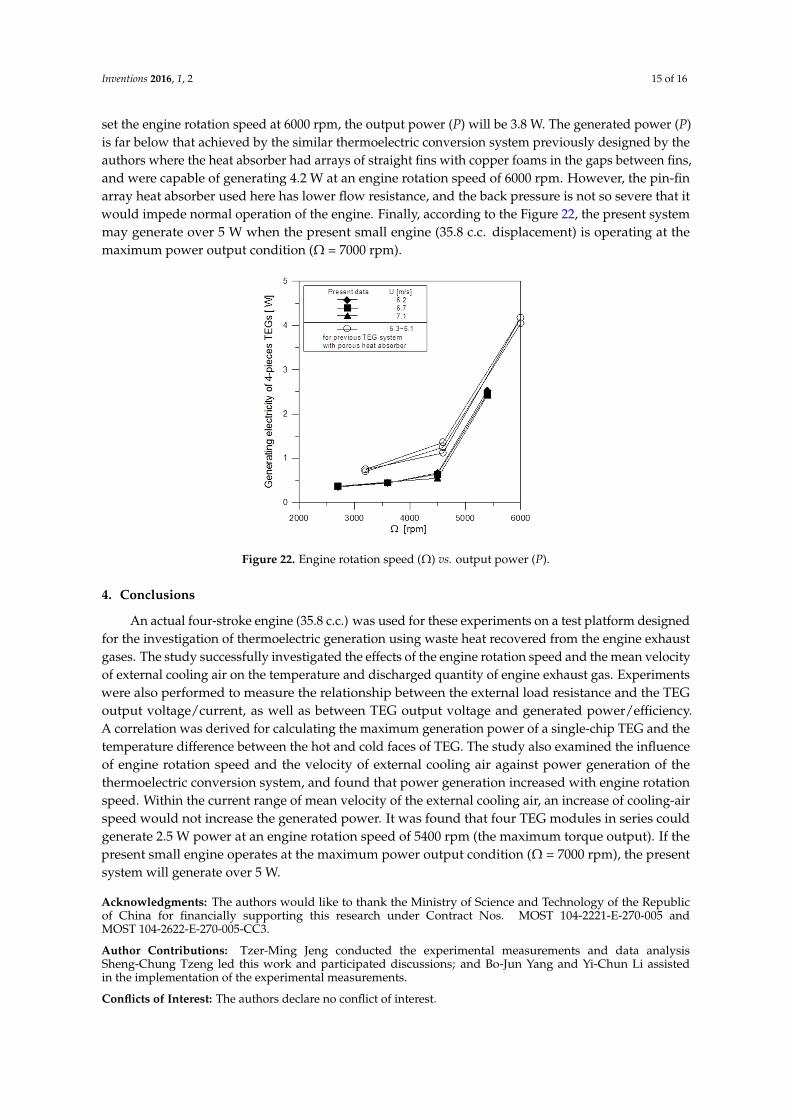
From Figure 22 it can be seen that engine rotation speed (Ω) has a significant effect on power generation (P) which goes up with an increase of engine rotation speed (Ω). Within the current range of mean air velocity (U) used in our experiments, an increase of mean air velocity (U) did not increase generated power (P). At an engine rotation speed (Ω) of 5400 rpm, the output power (P) was 2.5 W. Based on Seebeck thermoelectric generation theory, the TEG output voltage (V) satisfies Equation (3):
V S T= Δ ⋅ Δ (3)
where ΔS is the difference value of the Seebeck coefficient of the semiconductor material used in the TEGs. The value of ΔS is not a constant, it varies with temperature of TEGs. However this temperature range is limited as is variation of ΔS. A mean value may be used and the generated power (P) will equal the square of the produced voltage (V) divided by the external resistance (R). Our experimental results comply with this assumption. Furthermore, it is predicted that by extending the experimental data to set the engine rotation speed at 6000 rpm, the output power (P) will be 3.8 W. The generated power (P) is far below that achieved by the similar thermoelectric conversion system previously designed by the authors where the heat absorber had arrays of straight fins with copper foams in the gaps between fins, and were capable of generating 4.2 W at an engine rotation speed of
Figure 20. Mean air velocity vs. mean TEG temperature.
Inventions 2016, 1, 2 14 of 16
Figure 20. Mean air velocity vs. mean TEG temperature.
Figure 21. Mean air velocity (U) vs. ΔT of the TEGs.
From Figure 22 it can be seen that engine rotation speed (Ω) has a significant effect on power generation (P) which goes up with an increase of engine rotation speed (Ω). Within the current range of mean air velocity (U) used in our experiments, an increase of mean air velocity (U) did not increase generated power (P). At an engine rotation speed (Ω) of 5400 rpm, the output power (P) was 2.5 W. Based on Seebeck thermoelectric generation theory, the TEG output voltage (V) satisfies Equation (3):
V S T= Δ ⋅ Δ (3)
where ΔS is the difference value of the Seebeck coefficient of the semiconductor material used in the TEGs. The value of ΔS is not a constant, it varies with temperature of TEGs. However this temperature range is limited as is variation of ΔS. A mean value may be used and the generated power (P) will equal the square of the produced voltage (V) divided by the external resistance (R). Our experimental results comply with this assumption. Furthermore, it is predicted that by extending the experimental data to set the engine rotation speed at 6000 rpm, the output power (P) will be 3.8 W. The generated power (P) is far below that achieved by the similar thermoelectric conversion system previously designed by the authors where the heat absorber had arrays of straight fins with copper foams in the gaps between fins, and were capable of generating 4.2 W at an engine rotation speed of
Figure 21. Mean air velocity (U) vs. ∆T of the TEGs.
From Figure 22 it can be seen that engine rotation speed (Ω) has a significant effect on powergeneration (P) which goes up with an increase of engine rotation speed (Ω). Within the current rangeof mean air velocity (U) used in our experiments, an increase of mean air velocity (U) did not increasegenerated power (P). At an engine rotation speed (Ω) of 5400 rpm, the output power (P) was 2.5 W.Based on Seebeck thermoelectric generation theory, the TEG output voltage (V) satisfies Equation (3):
V “ ∆S ¨ ∆T (3)
where ∆S is the difference value of the Seebeck coefficient of the semiconductor material used in theTEGs. The value of ∆S is not a constant, it varies with temperature of TEGs. However this temperaturerange is limited as is variation of ∆S. A mean value may be used and the generated power (P) will equalthe square of the produced voltage (V) divided by the external resistance (R). Our experimental resultscomply with this assumption. Furthermore, it is predicted that by extending the experimental data to
Inventions 2016, 1, 2 15 of 16
set the engine rotation speed at 6000 rpm, the output power (P) will be 3.8 W. The generated power (P)is far below that achieved by the similar thermoelectric conversion system previously designed by theauthors where the heat absorber had arrays of straight fins with copper foams in the gaps between fins,and were capable of generating 4.2 W at an engine rotation speed of 6000 rpm. However, the pin-finarray heat absorber used here has lower flow resistance, and the back pressure is not so severe that itwould impede normal operation of the engine. Finally, according to the Figure 22, the present systemmay generate over 5 W when the present small engine (35.8 c.c. displacement) is operating at themaximum power output condition (Ω = 7000 rpm).
Inventions 2016, 1, 2 15 of 16
6000 rpm. However, the pin-fin array heat absorber used here has lower flow resistance, and the back pressure is not so severe that it would impede normal operation of the engine. Finally, according to the Figure 22, the present system may generate over 5 W when the present small engine (35.8 c.c. displacement) is operating at the maximum power output condition (Ω = 7000 rpm).
Figure 22. Engine rotation speed (Ω) vs. output power (P).
4. Conclusions
An actual four-stroke engine (35.8 c.c.) was used for these experiments on a test platform designed for the investigation of thermoelectric generation using waste heat recovered from the engine exhaust gases. The study successfully investigated the effects of the engine rotation speed and the mean velocity of external cooling air on the temperature and discharged quantity of engine exhaust gas. Experiments were also performed to measure the relationship between the external load resistance and the TEG output voltage/current, as well as between TEG output voltage and generated power/efficiency. A correlation was derived for calculating the maximum generation power of a single-chip TEG and the temperature difference between the hot and cold faces of TEG. The study also examined the influence of engine rotation speed and the velocity of external cooling air against power generation of the thermoelectric conversion system, and found that power generation increased with engine rotation speed. Within the current range of mean velocity of the external cooling air, an increase of cooling-air speed would not increase the generated power. It was found that four TEG modules in series could generate 2.5 W power at an engine rotation speed of 5400 rpm (the maximum torque output). If the present small engine operates at the maximum power output condition (Ω = 7000 rpm), the present system will generate over 5 W.
Acknowledgment: The authors would like to thank the Ministry of Science and Technology of the Republic of China for financially supporting this research under Contract Nos. MOST 104-2221-E-270-005 and MOST 104-2622-E-270-005-CC3.
Author Contributions: Tzer-Ming Jeng conducted the experimental measurements and data analysis Sheng-Chung Tzeng led this work and participated discussions; and Bo-Jun Yang and Yi-Chun Li assisted in the implementation of the experimental measurements.
Conflicts of Interest: The authors declare no conflict of interest.
References
1. Champier, D.; Bedecarrats, J.P.; Rivaletto, M.; Strub, F. Thermoelectric power generation from biomass cook stoves. Energy 2010, 35, 935–942.
Figure 22. Engine rotation speed (Ω) vs. output power (P).
4. Conclusions
An actual four-stroke engine (35.8 c.c.) was used for these experiments on a test platform designedfor the investigation of thermoelectric generation using waste heat recovered from the engine exhaustgases. The study successfully investigated the effects of the engine rotation speed and the mean velocityof external cooling air on the temperature and discharged quantity of engine exhaust gas. Experimentswere also performed to measure the relationship between the external load resistance and the TEGoutput voltage/current, as well as between TEG output voltage and generated power/efficiency.A correlation was derived for calculating the maximum generation power of a single-chip TEG and thetemperature difference between the hot and cold faces of TEG. The study also examined the influenceof engine rotation speed and the velocity of external cooling air against power generation of thethermoelectric conversion system, and found that power generation increased with engine rotationspeed. Within the current range of mean velocity of the external cooling air, an increase of cooling-airspeed would not increase the generated power. It was found that four TEG modules in series couldgenerate 2.5 W power at an engine rotation speed of 5400 rpm (the maximum torque output). If thepresent small engine operates at the maximum power output condition (Ω = 7000 rpm), the presentsystem will generate over 5 W.
Acknowledgments: The authors would like to thank the Ministry of Science and Technology of the Republicof China for financially supporting this research under Contract Nos. MOST 104-2221-E-270-005 andMOST 104-2622-E-270-005-CC3.
Author Contributions: Tzer-Ming Jeng conducted the experimental measurements and data analysisSheng-Chung Tzeng led this work and participated discussions; and Bo-Jun Yang and Yi-Chun Li assistedin the implementation of the experimental measurements.
Conflicts of Interest: The authors declare no conflict of interest.
Inventions 2016, 1, 2 16 of 16
References
1. Champier, D.; Bedecarrats, J.P.; Rivaletto, M.; Strub, F. Thermoelectric power generation from biomass cookstoves. Energy 2010, 35, 935–942. [CrossRef]
2. Karri, M.A.; Thacher, E.F.; Helenbrook, B.T. Clarkson Exhaust energy conversion by thermoelectric generator:Two case studies. Energy Convers. Manag. 2011, 52, 1596–1611. [CrossRef]
3. Zhou, S.; Sammakia, B.; White, B.; Borgesen, P. Multiscale modeling of thermoelectric generators for theoptimized conversion performance. Int. J. Heat Mass Transf. 2013, 62, 435–444. [CrossRef]
4. Weng, C.C.; Huang, M.J. A simulation study of automotive waste heat recovery using a thermoelectricpower generator. Int. J. Therm. Sci. 2013, 71, 302–309. [CrossRef]
5. Jang, J.Y.; Tsai, Y.C. Optimization of thermoelectric generator module spacing and spreader thickness usedin a waste heat recovery system. Appl. Therm. Eng. 2013, 51, 677–689. [CrossRef]
6. Cummings, T.A. Internal Combustion Electric Power Hybrid Power Plant. U.S. Patent 4,148,192,23 November 1977.
7. Yoshida, S.; Aoki, K. Thermoelectric Converter for Heat-Exchanger. U.S. Patent 5,959,240, 2 December 1997.8. Shinohara, K.; Kobayashi, M.; Furuya, K.; Kushibiki, K. Electric Energy Supply System for Vehicle. U.S. Patent
6,172,427, 12 February 1998.9. Rowe, D.M. Thermoelectrics, an enviromentally-friendly source of electrical power. Renew. Energy 1999, 16,
1251–1256. [CrossRef]10. Hendricks, T.J.; Lustbader, J.A. Advanced thermoelectric power system investigations for light-duty and
heavy-duty applications. In Proceedings of the 21st International Conference on Thermoelectrics, Long Beach,CA, USA, 25–29 August 2002.
11. Lombardi, C. Researchers Squeeze More Electricity from Heat. Available online: http://news.cnet.com/8301-17912_3-9999450-72.html (accessed on 25 July 2008).
12. Jeng, T.M.; Tzeng, S.C.; Chou, H.C. Experimental study of heat energy absorber with porous medium forthermoelectric conversion system. Smart Sci. 2013, 1, 1–5.
13. Tzeng, S.C.; Jeng, T.M.; Ma, W.P.; Wang, J.R.; Chou, B.; Lin, J.B.; Xiao, Y.D.; Wu, M.Z.; Tang, F.Z. Exhaust Pipewith Noise-reducing and Heat Recovery Functions. Taiwan, R.O.C. Patent I,350,878, 21 October 2011.
14. Moffat, R.J. Contributions to the theory of single-sample uncertainty analysis. ASME J. Fluids Eng. 1982, 104,250–258. [CrossRef]
© 2016 by the authors; licensee MDPI, Basel, Switzerland. This article is an open accessarticle distributed under the terms and conditions of the Creative Commons by Attribution(CC-BY) license (http://creativecommons.org/licenses/by/4.0/).